Clarkson Wastewater Treatment Plant Annual Report
32
Clarkson Wastewater Treatment Plant Annual Report 2020
Transcript of Clarkson Wastewater Treatment Plant Annual Report

DRAFT 2019
Clarkson Wastewater Treatment Plant Annual Report
2020
Clarkson WWTP Annual Report | 2020
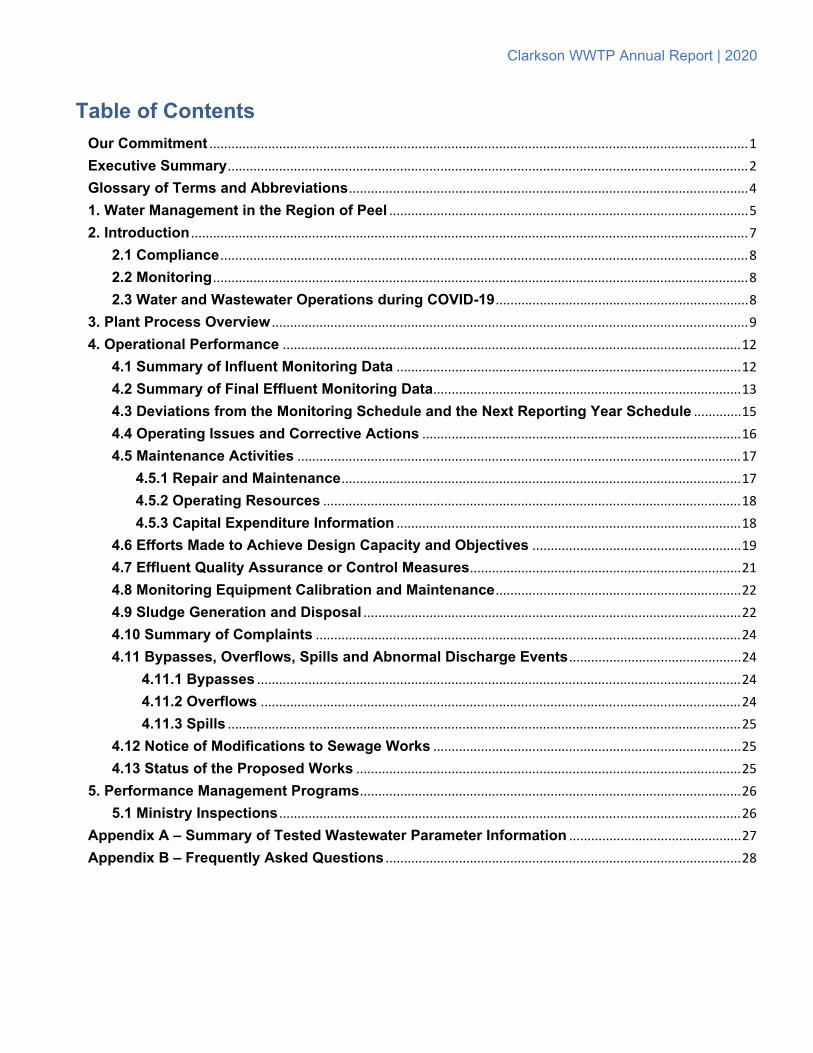
Table of Contents Our Commitment ................................................................................................................................................... 1 Executive Summary .............................................................................................................................................. 2 Glossary of Terms and Abbreviations ............................................................................................................. 4 1. Water Management in the Region of Peel .................................................................................................. 5 2. Introduction ........................................................................................................................................................ 7
2.1 Compliance ................................................................................................................................................ 8 2.2 Monitoring .................................................................................................................................................. 8 2.3 Water and Wastewater Operations during COVID-19 ..................................................................... 8
3. Plant Process Overview .................................................................................................................................. 9 4. Operational Performance ............................................................................................................................. 12
4.1 Summary of Influent Monitoring Data .............................................................................................. 12 4.2 Summary of Final Effluent Monitoring Data .................................................................................... 13 4.3 Deviations from the Monitoring Schedule and the Next Reporting Year Schedule ............. 15 4.4 Operating Issues and Corrective Actions ....................................................................................... 16 4.5 Maintenance Activities ......................................................................................................................... 17
4.5.1 Repair and Maintenance ............................................................................................................. 17 4.5.2 Operating Resources .................................................................................................................. 18 4.5.3 Capital Expenditure Information .............................................................................................. 18
4.6 Efforts Made to Achieve Design Capacity and Objectives ......................................................... 19 4.7 Effluent Quality Assurance or Control Measures .......................................................................... 21 4.8 Monitoring Equipment Calibration and Maintenance ................................................................... 22 4.9 Sludge Generation and Disposal ....................................................................................................... 22 4.10 Summary of Complaints .................................................................................................................... 24 4.11 Bypasses, Overflows, Spills and Abnormal Discharge Events ............................................... 24
4.11.1 Bypasses .................................................................................................................................... 24 4.11.2 Overflows ................................................................................................................................... 24 4.11.3 Spills ............................................................................................................................................ 25
4.12 Notice of Modifications to Sewage Works .................................................................................... 25 4.13 Status of the Proposed Works ......................................................................................................... 25
5. Performance Management Programs ........................................................................................................ 26 5.1 Ministry Inspections .............................................................................................................................. 26
Appendix A – Summary of Tested Wastewater Parameter Information ............................................... 27 Appendix B – Frequently Asked Questions ................................................................................................. 28

Clarkson WWTP Annual Report | 2020
1 | P a g e
The Regional Municipality of Peel (the Region) is committed to providing a high level of service in the collection, treatment and management of wastewater. The Region diligently monitors its sewer network and operates its treatment processes effectively to meet or surpass discharge quality requirements, in order to protect the environment now and into the future.
Our Commitment: • Protecting and preserving the environment, including the prevention of pollution,
through effective operation and management of the Wastewater Systems that incorporates quality assurance and control practices
• Acting promptly and responsibly in addressing incidents or conditions that pose a risk to the public or environment
• Complying with applicable legislation and regulatory requirements
• Collaborating with internal and external stakeholders to ensure our services consider their environmental and quality concerns
If you have any questions about this report, please contact the Wastewater Compliance team at 905-791-7800 ext. 4685 or by Email.

Clarkson WWTP Annual Report | 2020
2 | P a g e
Executive Summary
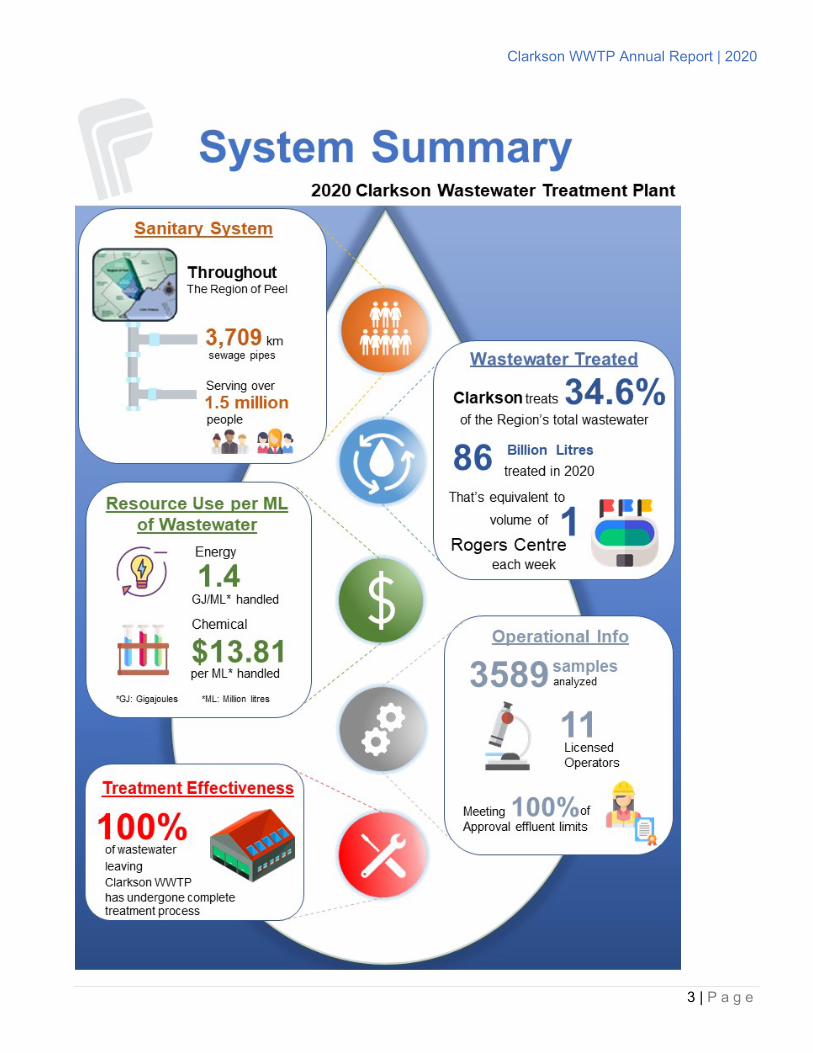
The Clarkson Wastewater Treatment Plant (WWTP) is located at 2307 Lakeshore Road West in Mississauga, on the shore of Lake Ontario. The plant is designed to treat an average flow of 350 million liters per day. The Clarkson WWTP is classified as a Class IV wastewater treatment facility under Ontario Regulation 129/04. This WWTP is operated under Environmental Compliance Approval (Approval) # 0729-9KBNNY.
This report summarizes the monitoring results for the Clarkson WWTP required by the Approval and describes the operational performance to ensure production of quality effluent.
In 2020, the Region met all the capacity and effluent limits prescribed in the Approval. The annual average daily flow to the plant was 236 million liters which is 67% of the rated capacity specified in the Approval.
In 2020, the Clarkson WWTP met the effluent concentration limits for Total Suspended Solids (TSS), Carbonaceous Biochemical Oxygen Demand (CBOD5), Total Phosphorous (TP), Total Ammonia Nitrogen (TAN), and E. coli, and maintained pH within the range of 6.0 – 9.5, as prescribed in the Approval. The requirements and results are detailed in Section 4.2 of this report.
There were no bypass or overflow events at the Clarkson WWTP during the reporting period. There was one spill of sewage from headworks, described in Section 4.11.3.
In 2020, the Clarkson WWTP generated 8,531 dry tonnes of sludge cake; 8,102 dry tonnes were sent to nearby G.E. Booth WWTP for incineration and 430 dry tonnes were sent for alternate disposal.
Clarkson WWTP Annual Report | 2020
3 | P a g e

Clarkson WWTP Annual Report | 2020
4 | P a g e
Glossary of Terms and Abbreviations
Activated Sludge: Sludge containing aerobic microorganism that help to break down organic compounds
Final Effluent: The treated wastewater that has undergone all treatment steps, including disinfection, when prescribed
Influent: The untreated wastewater or raw sewage coming into the sewage treatment plant from the collection system
Limit: Value prescribed in Approval for key parameters that the plant must meet in order to stay in compliance. Limits are generally higher than objectives
MLD: megaliters (ML) per day. 1 ML = 1 million liters. 1 MLD is 1000 m3
Objective: Value prescribed in Approval for key parameters that the plant is designed to meet. Consistently not meeting objectives means that the plant is not being effective and long-term remedial actions are needed. Sampling results that are over objective but under limit are considered in compliance
Parameter: Chemical substances (such as phosphorus or oxygen), microbiological indicators (such as E. coli) or physical characteristics (such as pH or temperature) that are measured or sampled and analyzed in order to assess the performance of a plant. Some parameters have limits in the Approval
Rated Capacity: Average annual daily influent flow that the plant is designed to handle
Residual: Remaining amount of a substance after treatment processes are completed
Twinning: Constructing a parallel pipe to provide additional capacity and to allow for condition assessment and rehabilitation of the existing pipe to extend its useful life
Wastewater: Water that has been used and discharged by homes, businesses and industries. Everything we flush down a toilet or pour down a drain, collectively
WWTP: Wastewater Treatment Plant
Clarkson WWTP Annual Report | 2020
5 | P a g e
1. Water Management in the Region of Peel
The Region owns and operates the water and wastewater systems that serve its population. This includes water treatment, storage and distribution, and wastewater collection, pumping and treatment. Figure 1, on the next page shows how these systems interact.
The Region has two drinking water sources: Lake Ontario and groundwater wells in Caledon. The Region employs the Ontario Clean Water Agency (OCWA) under a contract to operate, maintain and manage the lake-based drinking water treatment facilities and its water storage and pumping system. The Region operates the groundwater-based water treatment systems and distribution watermain networks. Similarly, on the wastewater side, OCWA is contracted to operate the large wastewater treatment plants on the shore of Lake Ontario, while the Region operates the wastewater collection system, pumping stations, and the treatment facility in the community of Inglewood, in the Town of Caledon.
This water cycle starts when source water is pumped into our water treatment plants and undergoes treatment to meet the Ontario Drinking Water Standards. Treated drinking water is distributed through a network of pipes, storage facilities and pumping stations to homes and businesses. Used water goes down the drains into the wastewater collection system, where a series of pipes collect and convey wastewater to the treatment plants. Although a predominantly gravity-based network, pumping stations are needed to move wastewater from low lying areas. Wastewater undergoes multi-stage treatment to comply with the strict provincial and federal standards before release to the environment. The Region is committed to high standards of treated wastewater quality since it gets discharged into Lake Ontario, which is the source of drinking water for the Region and many neighboring municipalities.
More information about the water treatment process can be found within the Water Annual Performance Reports, which are available online.

Clarkson WWTP Annual Report | 2020
6 | P a g e
Figure 1 – Water and Wastewater Cycle

Clarkson WWTP Annual Report | 2020
7 | P a g e
2. Introduction
Wastewater systems in Ontario are governed by the Ministry of the Environment, Conservation and Parks (the Ministry) and are also subject to federal legislation.
The purpose of a wastewater treatment system is to remove solids and nutrients to minimize impact from the effluent on the receiving waterbody. The Environmental Compliance Approval (Approval), issued under the Environmental Protection Act, is a system-specific document through which the Ministry sets discharge quality limits for that facility based on the sensitivity of the receiving waters. To comply with the Approval, the Region of Peel (the Region) prepares an annual report covering the operation and overall performance of the wastewater system.
This report provides a performance summary for the period from January 1 to December 31, 2020 for the Clarkson Wastewater Treatment Plant (WWTP), to fulfill the annual performance reporting requirements set out in the Approval # 0729-9KBNNY.
The Clarkson WWTP, a Class IV wastewater treatment facility under Ontario Regulation 129/04, is located at 2307 Lakeshore Road West in Mississauga and operated on behalf of the Region by the Ontario Clean Water Agency (OCWA). Today, along with the G.E. Booth WWTP, Clarkson WWTP provides wastewater treatment for a population base of over 1.5 million customers. The Clarkson WWTP consists of conventional and biosolids treatment processes and is designed to treat (referred to as rated capacity) an average flow of 350 MLD (million liters per day).
Clarkson WWTP Annual Report | 2020
8 | P a g e
2.1 Compliance
The Approval is a facility-specific document and it is the legal instrument that sets requirements for municipal system owners and operating agencies with regards to operation and management, level of treatment, monitoring and recording, routine and event reporting, and effluent quality notification. In accordance with the Approval, major changes to treatment process or equipment are communicated to the Ministry.
The Region ensures that the final effluent produced, and activities associated with wastewater treatment comply with the Approval and related legislation. The Region follows best practices in resource planning, process documentation and emergency preparedness.
The Ministry performs periodic inspections on all wastewater systems, comprised of facility visits and review of information and data for the inspection period. Inspection scope generally covers procedural documentation review, staff competency, process operation and monitoring, and corrective actions to operational events. The Region is committed to ensuring environmental protection and compliance with legislative requirements at all times. We maintain transparency with all findings of potential non-compliance incidents and outcomes of internal assessment being reported to the Ministry District (local) office.
2.2 Monitoring
The Region monitors the effluent quality to ensure it meets limits prescribed in the Approval. The Region has an extensive sampling and monitoring program to assess the influent wastewater, ensure effective treatment processes, and assess the quality of treated wastewater being discharged to protect Lake Ontario. Sampling for various microbiological, chemical and physical parameters is performed by Ministry-licensed wastewater operators at various sampling sites throughout the process and submitted to an accredited laboratory for analysis.
Clarkson WWTP is controlled through a computerized Supervisory Control and Data Acquisition (SCADA) system that is monitored 24 hours per day, 7 days a week. Online analyzers continuously monitor the wastewater quality prior to release. Any significant process upset generates an alarm so staff can investigate and take appropriate actions to restore normal operational conditions. The plant is equipped with stand-by power generators to ensure critical equipment can continue to operate in the event of a power failure.
2.3 Water and Wastewater Operations during COVID-19
In 2020, the world experienced unprecedented challenges as a result of the COVID-19 pandemic. The Region had to identify risks, adapt to rapid changes, and apply safe work practices to protect the health of employees and the public, while ensuring the continued safe provision of drinking water and handling of wastewater.
On March 24th, 2020, the Ministry imposed a temporary emergency order under the Emergency Management and Civil Protection Act, which provided opportunities for regulatory relief for water and wastewater system owners and operating authorities. Under the order, extensions were provided to
Clarkson WWTP Annual Report | 2020
9 | P a g e
expiration dates for operator certifications/licences and continuing education and in-classroom training programs were cancelled. The temporary emergency order allowed the Region to continue to focus on operating safely with certified personnel, ensuring no interruption to water and wastewater services.
To guard the health of our operators and members of the public by limiting their interaction, the Region implemented protocols and obtained regulatory relief from activities that require our staff to enter private premises. Examples include the private plumbing (tap water) sampling portion of the Community Lead Testing Program and other sampling activities on non-municipal pipes (on private property). The Region continued the monitoring and testing of water in the distribution system to assure quality water supply to the communities. Other control measures included adjusting practices to limit the number of Region staff at a job site. The Region provided monthly updates to the Ministry on the impact of COVID-19 on our water and wastewater operations.
In an effort to understand COVID-19 virus prevalence in our communities, the Region has been participating in a national research study that tests the levels of COVID-19 in wastewater at the G.E. Booth and Clarkson Wastewater Treatment Plants. Sampling has detected genetic material of COVID-19 in wastewater. The trend in virus detected in wastewater is similar to the trend of reported COVID-19 cases in Peel. At this time, it is not yet possible to predict the number of infected individuals in Peel based on wastewater testing.
More information on how Ontario water utilities responded to the COVID-19 pandemic is available in the Ministry Chief Drinking Water Inspector Report at https://www.ontario.ca/page/2019-2020-chief-drinking-water-inspector-annual-report.
3. Plant Process Overview
Wastewater is collected from homes and industry through a system of underground sewer pipes known as the collection system. The vast majority of wastewater collected in the Region flows by gravity to one of the two WWTPs on the shore of Lake Ontario, Clarkson and G.E. Booth WWTPs. The Clarkson WWTP also receives hauled liquid sewage, which is discharged into the inlet chamber upstream of the raw sewage screens.
When untreated wastewater (influent) enters the treatment process, it goes through preliminary treatment, where screens remove large objects like wipes and personal hygiene products and a vortex removes small grit particles. Figure 2 illustrates the wastewater treatment process.
The wastewater then enters primary treatment tanks (clarifiers), where it flows slowly, allowing heavier suspended solid particles to settle at the bottom and lighter material (such as grease and scum) to float to the top. Treatment aids such as phosphorus removal chemical may be added at this stage. The floating material and settled sludge are skimmed by large moving collectors and then pumped to the digesters for treatment. The remaining water flows to aeration tanks for secondary treatment.
Secondary treatment occurs in two stages to convert organic solids that remain floating to settleable material. The first stage happens in large aeration tanks where air is bubbled up via diffusers to provide oxygen so that the microorganisms in the wastewater will break down the nutrients and organic matter. The second stage happens in secondary clarifiers, where the microorganisms settle to the bottom. The
Clarkson WWTP Annual Report | 2020
10 | P a g e
sludge from the bottom is collected and pumped to the solids handling process and a portion of the sludge is returned to the aeration tanks to supplement the microorganism population.
Treated wastewater (effluent) is disinfected seasonally (from June 1 to September 30) using liquid chlorine (sodium hypochlorite) to reduce bacteria content to acceptable levels. Chlorine needs time to exert its disinfection action. This contact time occurs while the effluent travels through the 2.2 km long outfall pipe. Any trace chlorine remaining in the effluent is removed using a dechlorination agent (sodium bisulphite) added near the end of the outfall pipe, prior to release of the final effluent (disinfected effluent) to Lake Ontario. Final effluent quality is tested to confirm compliance with the limits set out in the Approval.
Sludge collected from the secondary treatment process is sent to the solids handling process where it is thickened, digested (together with sludge from the primary treatment process) and dewatered. To aid in thickening and dewatering, a chemical compound called polymer is added. Stabilization occurs through anaerobic (in the absence of oxygen) digestion, followed by dewatering. Digestion reduces the total solids, destroys pathogens, and makes the sludge easier to dewater. Gas generated from the anaerobic sludge digestion process is collected and used as a fuel for the hot water boilers and co-generation unit to generate power for use within the Clarkson WWTP.
Once stabilized, the sludge material (called sludge cake) generated at the Clarkson WWTP is trucked to nearby G.E. Booth WWTP for incineration. When G.E. Booth cannot accept additional cake for incineration due to capacity issues, cake may be hauled for alternate disposal either at a landfill or for reuse applications, such as land application.

Clarkson WWTP Annual Report | 2020
11 | P a g e
Figure 2 – Clarkson Wastewater Treatment Process

Clarkson WWTP Annual Report | 2020
12 | P a g e
4. Operational Performance
4.1 Summary of Influent Monitoring Data
This section summarizes the influent characteristics for Clarkson WWTP. Table 1 summarizes monthly influent volumes and monthly average concentrations of analytical parameters for 2020. Figure 3 illustrates historical flow trends for 2016 to 2020. For a description of what each test parameter means, see Appendix A.
Table 1 – Influent Flow and Sampling Results
Month
RAW SEWAGE FLOW AVERAGE CONCENTRATION
Daily Average
(MLD)
Maximum Daily Flow*
(MLD) BOD5 (mg/L)
CBOD5 (mg/L)
TKN (mg/L)
TP (mg/L)
TSS (mg/L)
January 268.77 625.24 168 165 27 4.3 261 February 226.49 437.43 188 179 31 4.5 252
March 246.21 426.94 188 186 30 4.4 235 April 236.56 454.21 239 226 30 4.6 232 May 228.63 416.17 213 202 34 4.9 233 June 212.54 380.11 231 210 33 4.9 232 July 230.32 400.89 228 198 35 5 242
August 252.9 436.72 204 193 33 4.7 233 September 237.38 449.86 236 216 36 5.3 248
October 226.89 585.42 221 205 35 5.1 245 November 226.14 457.78 259 216 35 5.2 249 December 235.82 398.97 247 219 33 5.1 236
Annual Average 235.72 455.81 218 201 33 4.8 242
* Highest daily average of the month

Clarkson WWTP Annual Report | 2020
13 | P a g e
0
50
100
150
200
250
300
350
400
2016 2017 2018 2019 2020
Annu
al D
aily
Ave
rage
(MLD
)
Rated Capacity
In 2020, the annual average flow was 236 MLD, representing 67% of the annual rated capacity. Over the past 5 years, average daily flow rate to the plant increased by 17%.
Figure 3 – Annual Average Flow 2016 to 2020
4.2 Summary of Final Effluent Monitoring Data
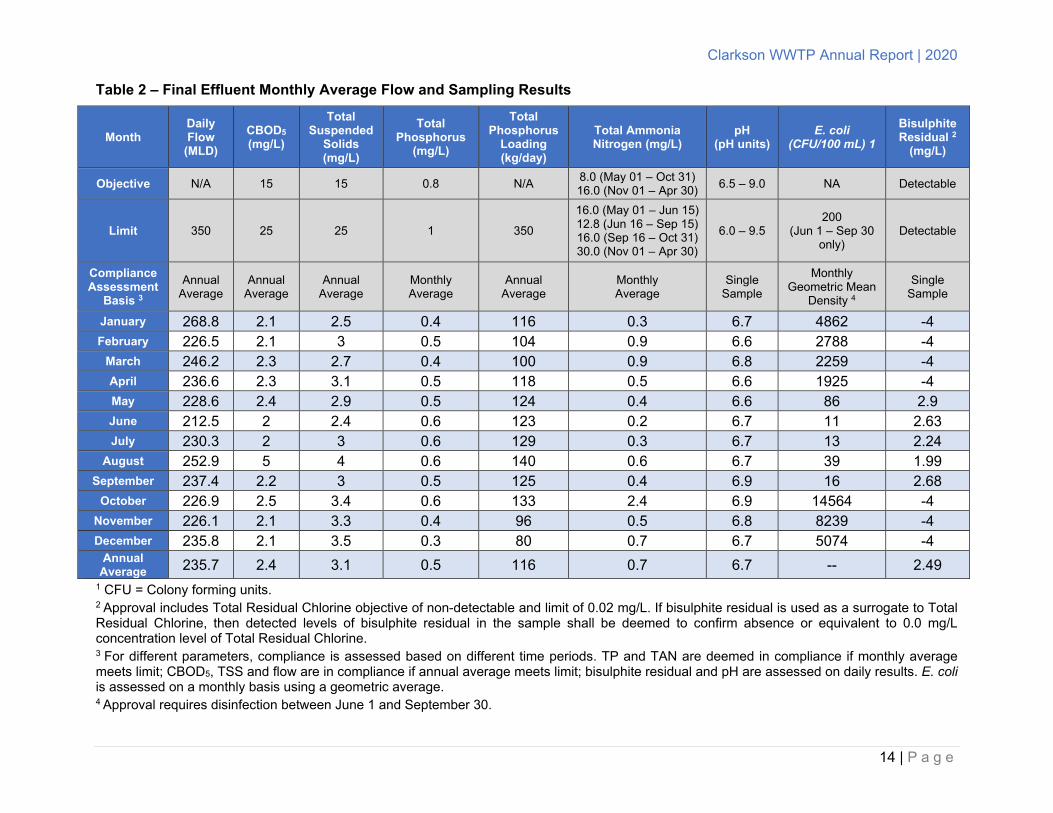
During the 2020 year, the final effluent met all the Approval limits (either monthly or annual, as prescribed.) A summary of final effluent test results for 2020 and the Approval objectives (targets) and limits (requirements) are shown in Table 2 and Figures 4 to 7. For a description of test parameters, see Appendix A.
The Approval requires disinfection from June 1 to September 30. During that time, chlorine residual and bisulphite residual are tested at sampling points representative of final effluent.
Clarkson WWTP Annual Report | 2020
14 | P a g e
Table 2 – Final Effluent Monthly Average Flow and Sampling Results
Month Daily Flow
(MLD) CBOD5 (mg/L)
Total Suspended
Solids (mg/L)
Total Phosphorus
(mg/L)
Total Phosphorus
Loading (kg/day)
Total Ammonia Nitrogen (mg/L)
pH (pH units)
E. coli (CFU/100 mL) 1
Bisulphite Residual 2
(mg/L)
Objective N/A 15 15 0.8 N/A 8.0 (May 01 – Oct 31) 16.0 (Nov 01 – Apr 30) 6.5 – 9.0 NA Detectable
Limit 350 25 25 1 350
16.0 (May 01 – Jun 15) 12.8 (Jun 16 – Sep 15) 16.0 (Sep 16 – Oct 31) 30.0 (Nov 01 – Apr 30)
6.0 – 9.5 200
(Jun 1 – Sep 30 only)
Detectable
Compliance Assessment
Basis 3 Annual
Average Annual
Average Annual
Average Monthly Average
Annual Average
Monthly Average
Single Sample
Monthly Geometric Mean
Density 4
Single Sample
January 268.8 2.1 2.5 0.4 116 0.3 6.7 4862 -4 February 226.5 2.1 3 0.5 104 0.9 6.6 2788 -4
March 246.2 2.3 2.7 0.4 100 0.9 6.8 2259 -4 April 236.6 2.3 3.1 0.5 118 0.5 6.6 1925 -4 May 228.6 2.4 2.9 0.5 124 0.4 6.6 86 2.9 June 212.5 2 2.4 0.6 123 0.2 6.7 11 2.63 July 230.3 2 3 0.6 129 0.3 6.7 13 2.24
August 252.9 5 4 0.6 140 0.6 6.7 39 1.99 September 237.4 2.2 3 0.5 125 0.4 6.9 16 2.68
October 226.9 2.5 3.4 0.6 133 2.4 6.9 14564 -4 November 226.1 2.1 3.3 0.4 96 0.5 6.8 8239 -4 December 235.8 2.1 3.5 0.3 80 0.7 6.7 5074 -4
Annual Average 235.7 2.4 3.1 0.5 116 0.7 6.7 -- 2.49
1 CFU = Colony forming units. 2 Approval includes Total Residual Chlorine objective of non-detectable and limit of 0.02 mg/L. If bisulphite residual is used as a surrogate to Total Residual Chlorine, then detected levels of bisulphite residual in the sample shall be deemed to confirm absence or equivalent to 0.0 mg/L concentration level of Total Residual Chlorine. 3 For different parameters, compliance is assessed based on different time periods. TP and TAN are deemed in compliance if monthly average meets limit; CBOD5, TSS and flow are in compliance if annual average meets limit; bisulphite residual and pH are assessed on daily results. E. coli is assessed on a monthly basis using a geometric average. 4 Approval requires disinfection between June 1 and September 30.

Clarkson WWTP Annual Report | 2020
15 | P a g e
4.3 Deviations from the Monitoring Schedule and the Next Reporting Year Schedule
The wastewater influent and effluent must be sampled and tested in accordance with the requirements of the Approval. Each year, a sampling schedule is prepared to ensure all requirements are met. The sampling schedule remains unchanged for 2021. Table 3 shows the sampling schedules for 2020 and 2021.
Table 3 – Sampling Schedules for 2020 and 2021
Influ
ent
Required Monitoring Program Scheduled Sampling
Program 2020 & 2021
Parameters Sample Type Minimum Frequency Frequency
BOD5 24-hour composite Weekly Twice Per Week TSS 24-hour composite Weekly Daily
Total Phosphorus 24-hour composite Weekly Daily TKN 24-hour composite Weekly Daily
Fina
l Effl
uent
CBOD5 24-hour composite Weekly Daily TSS 24-hour composite Weekly Daily
Total Phosphorus 24-hour composite Weekly Daily TAN 24-hour composite Weekly Twice Per Week TKN 24-hour composite Weekly Twice Per Week
Nitrate as Nitrogen 24-hour composite Weekly Twice Per Week Nitrite as Nitrogen 24-hour composite Weekly Twice Per Week
E. coli Grab Weekly Twice Per Week Total Residual
Chlorine/ Grab/Analyzer Daily Daily Bisulphite Residual
pH1 Grab/Probe/Analyzer Weekly Daily Temperature1 Grab/Probe/Analyzer Weekly Daily
Unionized Ammonia2 As Calculated Weekly Twice Per Week
1 pH and temperature of the final effluent shall be determined in the field at the time of sampling for Total Ammonia Nitrogen. 2 The concentration of un-ionized ammonia is calculated using the total ammonia concentration, pH and temperature

Clarkson WWTP Annual Report | 2020
16 | P a g e
4.4 Operating Issues and Corrective Actions
The Clarkson WWTP operates year-round, 24 hours a day. Occasional operating issues are encountered. Table 4 summarizes operating issues in 2020 that temporarily affected the process or effluent quality and lists the corrective actions taken. This information is reported to the Ministry Inspector monthly.
Table 4 – Summary of Operating Issues and Actions Taken
Issue Date Cause(s) Corrective Action(s)
Daily plant flow exceeded rated capacity
Jan 11, 12, 25 Heavy precipitation and/or snow thaw
No adverse impact. Plant processes were monitored to ensure effective treatment. ECA annual daily average rated capacity limit was met.
pH outside objective
range
Apr 24 - 25 The use of two centrifuges increased the side stream of centrate (high in ammonia) entering the process. Associated increase in ammonia reduced available alkalinity and buffering capacity.
Adjusted phosphorus removal chemical dosing rate to balance the effluent TP and pH.
May 1, 7, 8, 13
Continued to closely monitor effluent alkalinity, and research on permanent solutions to increase alkalinity in treatment processes. The ECA limit for pH was met on all days.
TP above objective
Feb 1 Jun 3, 6 Jul 29 - Aug 3 Sep 17 - 18 Oct 17 - 20
Insufficient dosage of phosphorus removal chemical due to influent with higher TP concentration; received lower concentration phosphorus removal chemical
Adjusted phosphorus removal chemical dosing rate. ECA annual average limit was met.
CBOD5 above objective Aug 14 Slightly elevated influent
loading
Closely monitored Dissolved Oxygen and Mixed Liquor Suspended Solids. ECA annual average limit was met.

Clarkson WWTP Annual Report | 2020
17 | P a g e
4.5 Maintenance Activities
4.5.1 Repair and Maintenance
In order to keep the Clarkson WWTP in good operating order, major plant components must be inspected and maintained on a regular basis. Table 5 provides a summary of planned and emergency repairs and maintenance activities carried out in 2020.
Table 5 – Summary of Repairs and Maintenance Activities
Plant Process Maintenance Activity
Preliminary Treatment
Replaced rotating brush, gear box, spiral shaft, scraper and nozzles for fine screen and grinder Overhauled grit vortex, classifier, conveyor and scrubber at headworks Replaced grit pump and tank system components
Primary Treatment
Replaced high pressure effluent water pump and motor, including the screen elements on the automatic rotating strainer Rebuilt channel blower, compressor and motor Replaced the chain and flight system in primary tank Replaced valves for scum hopper
Secondary Treatment
Rebuilt entire sodium bisulphite/chemical skid system Overhauled aeration blower and Return Activated Sludge (RAS) pump Installed valve, rebuilt RAS pump and Wasted Activated Sludge (WAS) pump for final tank Replaced mixer for aeration and biosolids treatment processes Redesigned and upgraded RAS pipeline
Solids Handling
Replaced pump motor drive and control cabinet for digester transfer pump Replaced grinder and Variable Frequency Drive panels for centrifuge feed pump Overhauled cake pump, centrifuge, rotary drum thickening and biosolids scrubber Overhauled mixer and digester system, cleaned out, replaced valve and gas boosters, rebuilt recirculation pump
Other Works
Repaired heat exchanges, associated pump and piping for boilers Overhauled pump at the pumping station and repaired electrical and mechanical equipment Performed electrical maintenance on the starters and switchgears for aeration blowers Inspected chemical and in-ground tanks

Clarkson WWTP Annual Report | 2020
18 | P a g e
4.5.2 Operating Resources
The Approval requires the Region to ensure that the plant and all equipment used to achieve compliance are properly operated and maintained. This includes providing adequate funding. The Region funds operational activities and process chemicals to maintain daily operation, as well as capital activities to ensure future system performance.
In 2020, $1.2 million was spent on process chemicals at Clarkson WWTP, such as sodium hypochlorite, polymer, bisulphite and phosphorus removal chemical (see Introduction and Appendix A for description of use of each of these), with an average cost of $13.81 per million liters of wastewater treated.
Water and wastewater treatment are among the highest energy users in the Region. Utilizing the Region’s Energy Dashboard electricity numbers and volumes of wastewater treated, it is possible to calculate how much energy is required to treat wastewater. For Clarkson WWTP in 2020, 1.40 gigajoules of energy were used per million liters treated. Over the past five years, the average was 1.49 gigajoules per million liters.
An overall reduction in energy consumption indicates movement towards the goal of reducing greenhouse gas production and protecting the environment.
To reduce the greenhouse gas footprint, two energy generating systems are used at Clarkson WWTP. A micro-hydro turbine is installed in the effluent outfall shaft that is powered by effluent flow. In 2020, 233 MWh of electricity was generated by the turbine. A cogeneration unit generates electricity for plant processes and heating the facility from biogas generated from the plant’s anaerobic digesters. In 2020, a total of 8,537 MWh was generated from the cogeneration unit. Together, 29% of the electricity used at the plant in 2020 was generated on site.
Energy usage and performance of energy intensive equipment is monitored, and the Region continues to research ways to optimize and reduce energy usage, such as identifying energy-saving opportunities during design of capital improvement and construction projects.
4.5.3 Capital Expenditure Information
Peel staff determine capital spending priorities to eliminate unnecessary expenditures while maintaining infrastructure. Table 6 shows a summary of the major capital expenditures at Clarkson WWTP during the 2020 year.
Table 6 – Summary of Capital Costs
Activity 2020 Expenditure Condition Assessment and Studies $286,223 Repair & Replacement at Wastewater Plant $1,024,937 Total $1,311,159

Clarkson WWTP Annual Report | 2020
19 | P a g e
4.6 Efforts Made to Achieve Design Capacity and Objectives
The flows to Clarkson WWTP are consistently well below rated capacity (as demonstrated in Section 4.1); therefore, no additional measures are required to achieve design capacity.
Throughout 2020, the effluent consistently met the Approval objectives (targets) for CBOD5, TSS, TP, and TAN. For a description of test parameters, see Appendix A. The only parameter for which the objective was not met at times was pH. There were six days in 2020 when the pH was outside the objective (target) range of 6.5-9.0 pH units. On those days, the pH limit (requirement) was still met. The causes and how the process was managed are detailed in Section 4.4. Figures 4 to 7 illustrate all parameters with objectives and compare their monthly values to those objectives.
Section 4.7 describes the many programs and measures in place to ensure that objectives are consistently achieved, and environmental impacts are minimized.
Figure 4 – Monthly Average Values for CBOD5 and TSS Compared to the Approval Objectives
Figure 5 – Proportion of Time pH Did Not Meet Daily Approval Objective Range
0
2
4
6
8
10
12
14
16
Jan
Feb
Mar Ap
r
May Jun Jul
Aug
Sep
Oct
Nov De
c
Mon
thly
Ave
rage
Val
ues (
mg/
L)
CBOD5 TSS Objective for CBOD, TSS
360d or 98%
6d or 2%
Number of days daily pH objective is not met
Number of days daily pH limit is met but outsideobjective range

Clarkson WWTP Annual Report | 2020
20 | P a g e
Figure 6 – Average Monthly Values for TP Compared to the Approval Objective
Figure 7 – Average Monthly Values for TAN Compared to the Approval Objective
The Region has undertaken proactive long-term actions in the collection system to meet future needs. A twinning project is underway to build a parallel sewer trunk that provides additional capacity and allows for rehabilitation of the existing West Trunk sewer. The new trunk is planned to be in service by 2022.
Several significant wastewater condition assessment and rehabilitation initiatives were continued or initiated in 2020, including condition assessments of the Orr-Clarkson Trunk Sewer, the Queensway and Confederation Trunk Sewers, the construction phase of the Fletcher’s Creek Trunk Sewer Rehabilitation, and multiple maintenance hole rehabilitation projects. The goal of these projects is to assess and restore aging sanitary infrastructure to meet target levels of service, which in turn indirectly improves system resiliency and longevity, and also reduces site-specific infiltration such as leaking joints.
Another initiative to note is the real-time controls study that aims to implement a “smart” sanitary infrastructure network that is able to transfer and/or store flows as required to alleviate stress on WWTPs during wet weather events. The Region is also proposing additional collection system initiatives to facilitate diversion and storage to alleviate extraneous flows related to inflow and infiltration. More details can be found in the Sanitary Sewage Collection System Annual Performance Report at https://www.peelregion.ca/wastewater/#reports.
00.10.20.30.40.50.60.70.80.9
Jan
Feb
Mar Ap
r
May Jun Jul
Aug
Sep
Oct
Nov De
cAver
age
Mon
thly
Val
ues (
mg/
L)
TP TP Objective
02468
1012141618
Jan
Feb
Mar Ap
r
May Jun Jul
Aug
Sep
Oct
Nov De
cMon
thly
Ave
rage
Val
ues (
mg/
L)
TAN TAN Objective

Clarkson WWTP Annual Report | 2020
21 | P a g e
4.7 Effluent Quality Assurance or Control Measures
Clarkson WWTP Annual Report | 2020
22 | P a g e
4.8 Monitoring Equipment Calibration and Maintenance
Equipment used to monitor wastewater influent and effluent flows must be checked and maintained to ensure it is reading accurately. This is achieved through annual calibration and maintenance of flow meters, completed by a third-party vendor. For 2020, all flow meters were found to be within acceptable limits.
4.9 Sludge Generation and Disposal
The treatment process removes solids from the wastewater stream in the form of sludge, which is processed on site, as described in Section 3. Table 7 shows the total monthly and annual sludge volumes generated at the Clarkson WWTP.
In 2020, an annual total of 8,531 dry tonnes of sludge cake was generated, which included 8,102 dry tonnes incinerated at G.E. Booth WWTP and 430 dry tonnes shipped for alternate disposal (with 13% going to landfill and 87% being converted into soil amendment products. This represents a 14% increase in sludge production compared to 2019.
Total sludge production for the next annual reporting period (2021) is projected to increase by approximately 15% of current reporting year’s total. Annual projections are based on population increase forecast and average increase in flow and sludge production for the last five years.

Clarkson WWTP Annual Report | 2020
23 | P a g e
Table 7 – Summary of Sludge Volume Generated in Different Processes and its Disposal
Month Primary Sludge
(m3)
Waste Activated
Sludge (m3)
Total Sludge Processed
(Dewatering) (m3)
Sludge Cake Production
(dry tonnes) 1
Sludge Cake Transported for
Alternate Disposal (dry tonnes)
Sludge Cake Transported to
G.E. Booth (dry tonnes)
January 32,233 115,311 39,790 779 0 779 February 28,737 96,573 34,655 789 0 789
March 28,578 105,122 38,896 768 0 768 April 31,234 109,459 38,674 666 0 666 May 39,031 111,255 42,620 952 0 952 June 33,203 92,632 37,507 633 0 633 July 36,853 125,285 27,506 455 0 455
August 43,815 133,578 40,106 712 0 712 September 29,660 109,665 30,036 547 270 276
October 39,781 174,791 38,909 747 54 692 November 29,106 119,408 47,284 738 88 651 December 31,450 128,156 43,962 746 18 729
Annual Daily
Average 1,103 3,883 1,257 23 1 22
Annual Total 403,681 1,421,236 459,945 8,531 430 8,102
1 Mass as determined based on volume of wet sludge pumped
Clarkson WWTP Annual Report | 2020
24 | P a g e
4.10 Summary of Complaints
The Approval requires that the Region log, investigate and resolve all resident complaints. The Region makes every effort to contact customers and satisfactorily address their concerns and enquiries. A database is used to record details including information collected from the customer on the nature of the enquiry and action taken by the Region. There were no complaints received in 2020 related to the Clarkson WWTP.
4.11 Bypasses, Overflows, Spills and Abnormal Discharge Events
Occasional weather events such as heavy rainfall and spring snow melt can result in flow rates that are higher than those for which the plant was designed and burden the treatment process. These challenges, as well as the need for planned maintenance and construction activities, may result in a discharge to the environment of a portion of wastewater that has not undergone all treatment processes, outside of normal operating conditions, in what is referred to as a bypass event.
4.11.1 Bypasses
A bypass is an intentional diversion of excess wastewater around one or more wastewater treatment process(es). The bypassed portion of wastewater undergoes part of the treatment process followed by disinfection and gets re-combined with the fully treated flow prior to release into Lake Ontario at the approved discharge location and sampling point. Final effluent is sampled and tested during bypass events to assess its quality.
Occasionally, a planned bypass is necessary in order to repair an essential part of the treatment process or during construction. In those cases, Peel submits a request to the federal and provincial governments to perform the bypass, including a plan to minimize its impact.
While not desirable, emergency bypasses may be necessary during high flow events to prevent spills and flooding at the WWTP and backups within the sewer system that can cause basement flooding and spills to the environment. Bypasses are also essential to protect the plant core biological treatment process (microorganisms that treat the sewage) from being washed out, which would prevent the plant from functioning properly and potentially causing long-term treatment impacts until the biological community is re-established.
Most bypasses in Peel are secondary bypasses, whereby the diverted wastewater receives primary treatment, bypasses secondary treatment, and receives a high degree of disinfection.
There were no bypasses in 2020.
4.11.2 Overflows
An overflow is a controlled discharge of wastewater to the environment from a designed location at the plant other than the approved final effluent outfall. There were no overflow events during the reporting period.
Clarkson WWTP Annual Report | 2020
25 | P a g e
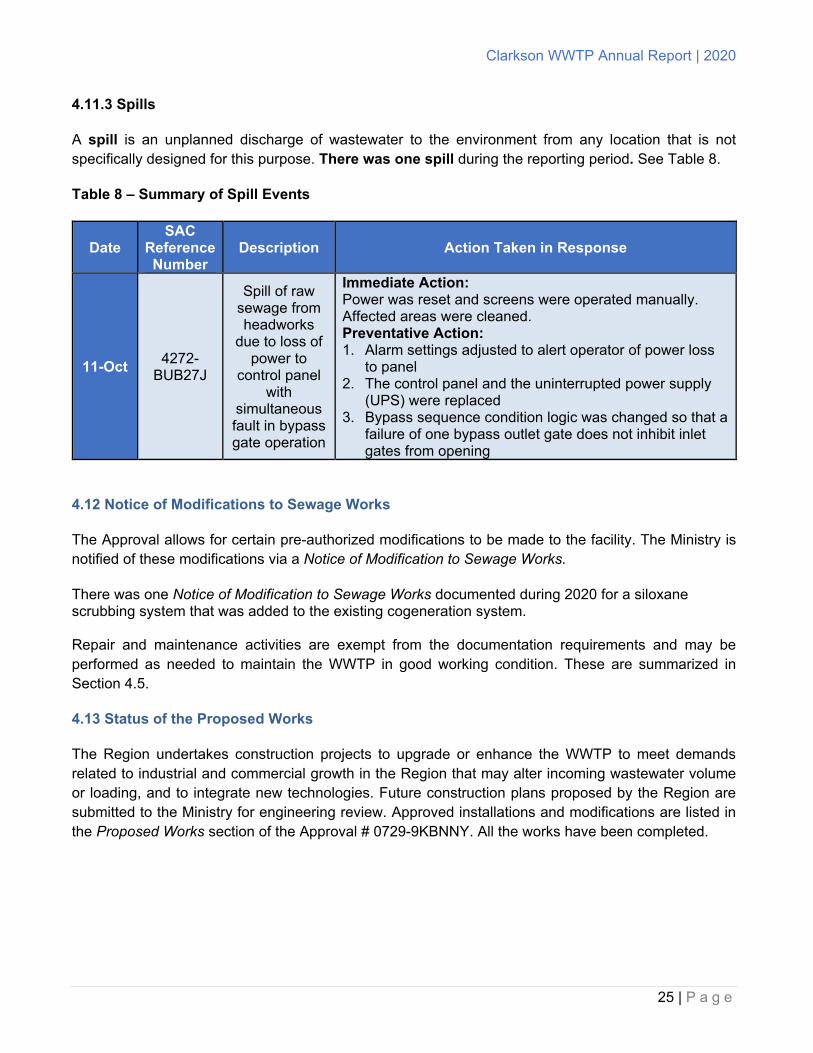
4.11.3 Spills
A spill is an unplanned discharge of wastewater to the environment from any location that is not specifically designed for this purpose. There was one spill during the reporting period. See Table 8.
Table 8 – Summary of Spill Events
Date SAC
Reference Number
Description Action Taken in Response
11-Oct 4272-BUB27J
Spill of raw sewage from headworks
due to loss of power to
control panel with
simultaneous fault in bypass gate operation
Immediate Action: Power was reset and screens were operated manually. Affected areas were cleaned. Preventative Action: 1. Alarm settings adjusted to alert operator of power loss
to panel 2. The control panel and the uninterrupted power supply
(UPS) were replaced 3. Bypass sequence condition logic was changed so that a
failure of one bypass outlet gate does not inhibit inlet gates from opening
4.12 Notice of Modifications to Sewage Works
The Approval allows for certain pre-authorized modifications to be made to the facility. The Ministry is notified of these modifications via a Notice of Modification to Sewage Works.
There was one Notice of Modification to Sewage Works documented during 2020 for a siloxane scrubbing system that was added to the existing cogeneration system. Repair and maintenance activities are exempt from the documentation requirements and may be performed as needed to maintain the WWTP in good working condition. These are summarized in Section 4.5.
4.13 Status of the Proposed Works
The Region undertakes construction projects to upgrade or enhance the WWTP to meet demands related to industrial and commercial growth in the Region that may alter incoming wastewater volume or loading, and to integrate new technologies. Future construction plans proposed by the Region are submitted to the Ministry for engineering review. Approved installations and modifications are listed in the Proposed Works section of the Approval # 0729-9KBNNY. All the works have been completed.
Clarkson WWTP Annual Report | 2020
26 | P a g e
5. Performance Management Programs
5.1 Ministry Inspections
Wastewater System inspections are performed periodically by the Ministry to ensure systems are operating as required and complying with the terms and conditions of their Approvals. Performance data is reviewed against the compliance objectives and limits. The inspections also verify that the Region meets sampling, testing and treatment standards and staff competency requirements. Additional inspections can be triggered through a variety of factors such as frequency of events or inconsistent system performance (e.g. increased number of spills or reportable incidents), in response to a complaint or concern, or as part of a follow-up from prior violations.
There was no Ministry inspection at the Clarkson WWTP in 2020.

Clarkson WWTP Annual Report | 2020
27 | P a g e
Appendix A – Summary of Tested Wastewater Parameter Information
Parameter Parameter Information
Dissolved Oxygen (DO)
Amount of oxygen dissolved in water. It is essential for the survival of aquatic plants and animals. In the wastewater treatment process, DO is required by the bacteria to break down the organic material present. A lower DO value suggests a greater amount of organic matter present in the sample.
Total Biochemical Oxygen Demand
(BOD5)
Amount of DO used by microorganisms to break down organic material present in water sample, measured as DO decrease over a 5-day period. A higher BOD value means greater amount of organic matter present in the sample, which can cause deplete DO in receiving waters.
Carbonaceous Biochemical Oxygen
Demand (CBOD5)
Amount of DO needed by microorganisms to break down carbonaceous (carbon rich) organic material present in a water sample over a 5-day period.
Chemical Oxygen Demand (COD)
Amount of oxygen needed to oxidize (combine with oxygen) all the organics in a wastewater sample. COD is used as a measure of organic pollution.
Alkalinity Water’s resistance to the effect of acids added to water.
Total Phosphorous (TP)
An essential nutrient used by microorganisms for growth. TP comes from a variety of sources including fertilizers, detergents, domestic wastewater, and wastewater from industrial processes. Excess phosphorus in waterbodies can promote algae blooms.
Total Suspended Solids (TSS)
Suspended particles (organic and inorganic material) present in the water sample. TSS can include sediment, sand, silt, plankton and algae. High concentration of TSS can interfere with the disinfection process and can also lower the quality of the receiving waterbody.
Total Kjeldahl Nitrogen (TKN)
Sum of ammonia nitrogen and the amount of nitrogen present in organic form. High TKN can be toxic to aquatic life.
Total Ammonia Nitrogen (TAN)
The amount of ammonia in wastewater. Sources of ammonia include domestic, industrial or agricultural pollution, primarily from fertilizers and animal and plant decomposition and animal waste.
Nitrite, Nitrate An intermediate nitrogen species in the cycle of nitrogen removal from wastewater.
pH A measure of the alkalinity or acidity in wastewater, which can indicate chemical or industrial pollution.
Temperature Temperature of the wastewater sample measured at the time of collection. Higher wastewater temperatures allow for more efficient treatment at biological treatment plants.
Sodium Hypochlorite Liquid chlorine used for disinfection of treated wastewater. To minimize chlorine effects on the receiving waters, the effluent is dechlorinated before being released into Lake Ontario.
Sodium Bisulphite Used to neutralize the chlorine present in final effluent after disinfection. This is done to minimize chlorine effects on the receiving waters.
E. coli An indicator of fecal contamination in effluent. Most species of this bacteria are harmless to humans; however, some strains can be pathogenic (cause disease).

Clarkson WWTP Annual Report | 2020
28 | P a g e
Appendix B – Frequently Asked Questions
1. Where does water go after it is used? After you use water to wash dishes and clothes, brush your teeth, shower or flush the toilet, the used water (wastewater) that goes down your drains flows through a series of underground sewer pipes to the wastewater treatment plants.
The wastewater is treated to remove contaminants and kill disease-causing microorganisms before being discharged into the environment. The Region of Peel operates three wastewater treatment plants (WWTP): G.E. Booth WWTP and Clarkson WWTP, both discharging into Lake Ontario, and the Inglewood WWTP, discharging into the Credit River. These three plants serve the cities of Mississauga and Brampton and the Town of Caledon.
Click here for more information on how wastewater is treated.
2. Why am I experiencing a sewage odour outside my house?
The sewage odor outside your house could be from a variety of sources. It could be that the sewer is backed up close to your property. If your property is located close to a lake, algal blooms also cause odours. Other sources of odour might include scheduled treatment plant maintenance coupled with prevailing winds, nearby farming activities, or odours from waste management facilities or industries.
If you are noticing odours near your property, please call the Region of Peel at 905-791-7800.
3. Why am I experiencing a sewage odour inside my house?
If you notice an odour of sewage coming from a drain in your house, it is recommended to pour a capful of bleach into the drain, let it sit for 10-15 minutes and then rinse it down with plenty of water. If this does not resolve the odour problem, please call the Region of Peel at 905-791-7800 for further investigation.
4. What is the difference between a storm sewer and sanitary sewer?
Wastewater that goes down drains inside homes and buildings enters the sanitary sewer system, which sends it to a wastewater treatment facility for treatment before it is released to the environment. Sanitary sewer systems in Mississauga, Brampton and Caledon are maintained by the Region of Peel.
Rainwater and melting snow is called storm water. Stormwater enters storm grates on the road and enters the storm sewer pipes that run beneath the roadways. These pipes discharge the storm water to local waterways, like streams, creeks and lakes. The majority of storm sewer is maintained by the local municipality – the cities of Brampton and Mississauga and the town of Caledon. The Region of Peel maintains storm sewers on Regional roads.
Click here for more information about wastewater and storm water.

Clarkson WWTP Annual Report | 2020
29 | P a g e
5. What happens to industrial wastewater?
Some companies treat their own wastewater and release it directly into the environment or into to Region of Peel sanitary sewer (wastewater collection system). Wastewater released into the sanitary sewer joins all other wastewater collected (from households and building drains) and flows to one of the wastewater treatment plants. Industrial wastewater can be hazardous or contain substances that may damage sewer infrastructure or upset the treatment process. Therefore, all wastewater released and all businesses that release it into Region of Peel sewers must comply with the Region of Peel’s Sewer Use Bylaw (Wastewater Bylaw). To ensure compliance, industrial facilities are examined by inspectors from the Region’s Environmental Control department. Approximately 6,000 inspections are completed each year.
6. What must not be disposed down the toilet or poured down the drain?
It is important to understand that what goes down the drain or the toilet may have negative impacts on the wastewater system and the environment. Fats, oils and grease should never be poured down the drain because these materials are known to cling to pipe walls. Over time their accumulation can build up to such high levels that the sewer can become blocked. Another reason to avoid disposing fats, oils, and grease into the toilet is that it is not effectively broken down during the wastewater treatment process. Instead, the Region of Peel recommends that edible household fats, oils and grease should be collected and properly disposed of at the Community Recycling Centre. Click here to learn more about Peel’s Community Recycling Centres.
It is also important not to dispose items down the toilet that could get stuck in or damage the sewer systems. Sticks, rags, paper towels, personal hygiene products, diapers, disposable wipes, household hazardous waste and pharmaceuticals should not be disposed by simply flushing down the toilet. Any unused or expired pharmaceuticals can be returned to your local pharmacy.
Click here for more information on how to properly dispose of items that damage the wastewater system
7. What causes a sanitary sewer backup?
Most sewer backups occur when sewer pipes get blocked. Sewer pipes can become clogged with excess fats, oils, and greases, food wastes, coffee grounds, hair, toilet paper, soap residue and inappropriate materials being flushed down the toilet or drain. This includes sanitary wipes which are labelled “flushable”, but in fact clog pipes, sewers and screens at the treatment plants. To help reduce sanitary sewer blockages and prevent backups, it is recommended to properly dispose of these items and other materials that can harden or settle within the sewer pipes.
Sanitary sewer backups can also occur when tree roots grow into or through sewer lines. These roots may be from trees that are outside your property boundaries. The only solution to this problem is to cut away the roots and then replace the pipeline.
Clarkson WWTP Annual Report | 2020
30 | P a g e
If you notice a sewer backup in your home, call the Region of Peel at 905-791-7800 ext. 4409, or 1-888-919-7800 for residents in Caledon. If the problem area is determined to be on private property, there is a flat fee for the service call. Click here for more information.
8. How safe is the treated wastewater that is released into Lake Ontario?
To meet environmental compliance criteria in Ontario, all wastewater must be treated before being returned to the environment. The Region of Peel operates and maintains three wastewater treatment facilities, G.E. Booth, Clarkson and Inglewood, under strict regulations and the effluent discharged into the environment must meet location-specific, provincial and federal standards.
9. Which pipes are mine and which are the Region’s responsibility?
Click here for more information about homeowner and Regional responsibilities of wastewater infrastructure.
10. What is optional water/sewer line insurance program?
The pipes on the private side of the property line belong to the property owner. Sometimes these pipes may get damaged or blocked, which can result in costly plumbing bills. The Region of Peel endorses a voluntary pipe insurance program. Read more here:
Click here for more information on the water/sewer line insurance program.
Other sources from which you can get more information about wastewater and related issues:
Wastewater-related questions:
Region of Peel 10 Peel Centre Drive Brampton ON L6T 4B9 Phone: 905-791-7800 Ext. 4685 Website: https://peelregion.ca/wastewater/ E-mail: [email protected]
Water and Sanitary Sewer/Septic Protection Plans: https://www.peelregion.ca/pw/water/SLWCfaqs.htm Peel Wastewater Bylaw: https://www.peelregion.ca/council/bylaws/2010s/2010/by-53-2010.htm