Clarkson 2017 Interim Results Presentation 2017 Interim Results... · Results Presentation 14TH A U...
27
Results Presentation 1 4 T H A U G U S T 2 0 1 7
Transcript of Clarkson 2017 Interim Results Presentation 2017 Interim Results... · Results Presentation 14TH A U...

Results Presentation
1 4 T H A U G U S T 2 0 1 7

Agenda
Financial Results
Markets
Outlook
Andi Case
CEO
Jeff Woyda
COO/CFO
14th August 2017 2017 Interim Results 2

Results summary
June 2017
£m
June 2016
£m
Increase
%
Revenue 156.8 147.2 +6.5%
Underlying Profit before taxation(Before acquisition related costs) 24.5 21.8 +12.4%
Acquisition related costs (2.6) (4.3)
Profit before taxation(After acquisition related costs) 21.9 17.5 +25.1%
Underlying Earnings per share(Before acquisition related costs) 57.5p 52.9p +8.7%
Earnings per share(After acquisition related costs) 50.8p 41.7p +22.0%
14th August 2017 2017 Interim Results 3

Summary of first half 2017 results
Successes• Broking transaction volumes up again
• Average ClarkSea index H1 17 vs H1 16 up 2%
• Increased revenue from new transactions in 2017
• Increased Financial deal flow and revenues (+US$5.8m or 24%)
14th August 2017 2017 Interim Results
GBP/USD H1 2017 H1 2016
Average 1.27 1.42
Closing 1.30 1.34
£118.0M
£115.5M
£23.2M£16.7M
£8.3M
£8.3M
£7.3M
£6.7M
£147.2m
£156.8m
Broking
Financial
Support
Research
20162017
Headwinds• Lower revenue brought forward from FOB
• Weakness in North Sea projects continues to impact port services
Other• Increased HO costs includes technology not capitalised
• Weaker sterling environment following Brexit decision June 2016
4

Segmental margin
14th August 2017 2017 Interim Results
Revenue
2017
Profit
2017
Margin
2017
Revenue
2016
Profit
2016
Margin
2016
£m £m £m £m
Broking 118.0 21.0 17.8% 115.5 19.3 16.7%
Financial 23.2 5.0 21.5% 16.7 2.4 14.4%
Support 8.3 0.7 8.4% 8.3 0.8 9.6%
Research 7.3 2.4 32.9% 6.7 2.3 34.3%
5

ClarkSea Index
-
5.0
10.0
15.0
20.0
25.0
30.0
35.0
1997 1998 1999 2000 2001 2002 2003 2004 2005 2006 2007 2008 2009 2010 2011 2012 2013 2014 2015 2016 2017
Average Minimum
Average 13,424 11,336 9,840 16,848 15,431 10,626 18,953 30,753 27,785 24,661 32,969 32,954 11,711 15,721 12,947 9,586 10,442 11,793 14,164 9,441 10,040
Minimum 11,980 9,850 8,650 11,340 8,920 8,870 15,690 23,420 19,230 18,860 25,280 13,740 7,730 13,060 10,980 7,523 7,574 9,175 12,364 7,073 8,465
14th August 2017 2017 Interim ResultsData source: Clarksons Research
2004 to 2010
Average = 25,222
2011 to 2017
Average = 11,2021997 to 2003
Average = 13,780
1st Half 2017
Average = 10,040
Uplift to Average 1997 to 2003 +37%
6

Acquisition related costs
Acquisition related costs* June 2017
£m
June 2016
£m
Cash & share-based payment charges 0.5 0.5
Loan note interest 0.3 0.6
Amortisation: Platou 1.8 3.2
2.6 4.3
14th August 2017 2017 Interim Results
*Assuming no further acquisitions, this should amount to a further £2.2m in 2017 and £2.5m in 2018
7

Balance sheet
Dec 2012
£m
Dec 2013
£m
Dec 2014
£m
Dec 2015
£m
Dec 2016
£m
Jun 2017
£m
Tangible fixed assets 8.8 9.4 8.4 33.1 33.0 31.9
Investments 1.9 1.8 1.9 1.9 4.1 4.3
10.7 11.2 10.3 35.0 37.1 36.2
Working capital (2.8) 3.1 (1.8) (7.1) (15.1) (3.3)
Net funds 75.2 75.0 115.7 91.6 98.4 71.4
72.4 78.1 113.9 84.5 83.3 68.1
Pensions (9.4) (1.8) (10.3) (4.1) 2.3 5.5
Deferred tax 12.5 10.0 13.0 8.4 7.1 4.9
75.5 86.3 116.6 88.8 92.7 78.5
Net assets before loan notes & intangibles 86.2 97.5 126.9 123.8 129.8 114.7
Loan notes - - - (46.1) (23.6) -
Net assets before intangibles 86.2 97.5 126.9 77.7 106.2 114.7
Intangibles 39.8 40.2 40.4 263.2 300.5 293.7
Net assets 126.0 137.7 167.3 340.9 406.7 408.4
14th August 2017 2017 Interim Results
June billings
& Hedge
IAS19
Surplus
Repaid June
2017
Currency
revaluation
8

Net available funds
Jun 2017
£m
Dec 2016
£m
Cash and cash equivalents 117.4 154.0
Current investment deposits 5.4 29.4
Net cash equivalents 122.8 183.4
Reserved for bonus (full cost) (51.4) (85.0)
Net available funds 71.4 98.4
Loan notes outstanding - (23.6)
Net available funds after loan notes 71.4 74.8
14th August 2017 2017 Interim Results 9

Movement in net funds (after bonus & loan notes)
1.3 (13.1)
(3.3)(1.6)
74.8
24.1
(5.3)
71.4
Net FundsDec 16
Operating Profit Other Dividends Working capital FX loss on cashheld
Taxation Capex Net FundsJun 17
(5.6)
14th August 2017 2017 Interim Results 10

Dividend history
6 7 9 10 12 14 16 16 17 18 18 19 21 22 22 23911
1622
2426
26 2730
32 3337
39 40 43
0
10
20
30
40
50
60
70
2002 2003 2004 2005 2006 2007 2008 2009 2010 2011 2012 2013 2014 2015 2016 2017
Interim Final
14th August 2017 2017 Interim Results 11

O S L O
Strategy & the markets

ClarkSea Index
-
5.0
10.0
15.0
20.0
25.0
30.0
35.0
40.0
45.0
50.0
55.0
1997 1998 1999 2000 2001 2002 2003 2004 2005 2006 2007 2008 2009 2010 2011 2012 2013 2014 2015 2016 2017
Average Maximum Minimum
Average 13,424 11,336 9,840 16,848 15,431 10,626 18,953 30,753 27,785 24,661 32,969 32,954 11,711 15,721 12,947 9,586 10,442 11,793 14,164 9,441 10,040
Minimum 11,980 9,850 8,650 11,340 8,920 8,870 15,690 23,420 19,230 18,860 25,280 13,740 7,730 13,060 10,980 7,523 7,574 9,175 12,364 7,073 8,465
Maximum 15,907 12,250 11,148 23,161 24,343 16,719 28,382 44,132 33,901 29,319 50,702 50,682 15,784 20,172 14,993 12,485 17,141 16,684 17,524 13,876 11,842
14th August 2017 2017 Interim Results Data source: Clarksons Research 13

World Seaborne Trade
14
0
1
2
3
4
5
6
7
8
9
10
11
12
0
1
2
3
4
5
6
7
8
9
10
11
12
199
0
199
1
199
2
199
3
199
4
199
5
199
6
199
7
199
8
199
9
200
0
200
1
200
2
200
3
200
4
200
5
200
6
200
7
200
8
200
9
201
0
201
1
201
2
201
3
201
4
201
5
201
6
Po
pu
lati
on
(b
illi
on
pe
op
le)
Se
ab
orn
e T
rad
e (
bil
lio
n t
on
ne
s)
major dry bulk minor dry bulk crude oil oil products chemicals liquefied gas containers other dry cargo World Population
Data Source: Clarksons / US Census Bureau14th August 2017 2017 Interim Results

Shipping Fleet Development: 1989-20181
14th August 2017 2017 Interim Results
Note: data prior to 1996 does not include retrospective changes and certain estimates.1Fleet forecast based on provisional estimates.
15Data source: Clarksons Research
Data as of 1st August 2017
0%
1%
2%
3%
4%
5%
6%
7%
8%
9%
10%
0
500
1,000
1,500
2,000
2,500
1989
1990
1991
1992
1993
1994
1995
1996
1997
1998
1999
2000
2001
2002
2003
2004
2005
2006
2007
2008
2009
2010
2011
2012
2013
2014
2015
2016
2017(f
)
2018(f
)
millio
n d
wt
Bulkers Tankers Containers Gas Carriers Other Growth
Year-on-year fleet growth (RHS)
Fleet as at end year.
2017-18: projection.
Comprises world merchant fleet >100
GT, including ship-shaped offshore
units
10 Year CAGR (end 1989-99)
1.8%
8 Year CAGR (end 2008-16)
5.6%
Fleet 1st August 2017:
1,897m dwt
Fleet at end 2008:
1,204m dwtFleet at end 1990:
681m dwt

All Types* Fleet Deliveries & Projections
14th August 2017 2017 Interim Results
0
500
1,000
1,500
2,000
2,500
3,000
3,500
1996 1997 1998 1999 2000 2001 2002 2003 2004 2005 2006 2007 2008 2009 2010 2011 2012 2013 2014 2015 2016 2017 2018 2019 2020
No.
of ve
sse
ls
Tanker Bulk Carrier Container Ship Gas Carrier Other Ship Types (>2,000 Dwt/GT)
Projected deliveries
Data Source: Clarksons Research Shipbuilding Forecast Club. *Not including Fishing Vessels, vessels below 2000 DWT/GT excluded
16

Global Vessel Contracting and Demolition
14th August 2017 2017 Interim Results
480 545 411 547795
546 667
1,378 1,197 1,140
2,255
2,905
1,874
580
1,833
1,043707
2,047
1,3371,107
217 267-206 -196 -344 -340 -272 -340 -368 -315
-137 -89 -123 -109
-233-562 -371 -548
-850 -697 -507 -537 -638-266
-1,500
-1,000
-500
0
500
1,000
1,500
2,000
2,500
3,000
3,500
199
6
199
7
199
8
199
9
200
0
200
1
200
2
200
3
200
4
200
5
200
6
200
7
200
8
200
9
201
0
201
1
201
2
201
3
201
4
201
5
201
6
201
7ytd
No.
of ve
sse
ls
Contracting Demolition
Includes vessels of 20,000+ DWT only
Source: Clarksons
17

Regional Shipbuilding Shares (1990-2017ytd)
14th August 2017 2017 Interim Results
0.0
10.0
20.0
30.0
40.0
50.0
60.0
70.0
80.0
90.0
100.0
19
90
19
91
19
92
19
93
19
94
19
95
19
96
19
97
19
98
19
99
20
00
20
01
20
02
20
03
20
04
20
05
20
06
20
07
20
08
20
09
20
10
20
11
20
12
20
13
20
14
20
15
20
16
20
17
ytd
% t
ota
l sh
ips d
eliv
ere
d (
GT
)
Other
USA
Taiwan
China
S. Korea
Japan
Europe
Data source: Clarksons Research
Data as of 1st August 201718

Global Newbuilding Orders at Historic Low…
14th August 2017 2017 Interim Results
480 545 411
547
795
546 667
1,378 1,197 1,140
2,255
2,905
1,874
580
1,833
1,043
707
2,047
1,337
1,107
217 267
0
500
1,000
1,500
2,000
2,500
3,000
3,500
No
. Sh
ips
Orders representative of vessels over 20,000 dwt
Data source: Clarksons Research
Data as of 1st August 201719

…Reflected in Number of Yards with an Orderbook of at least
one Vessel > 20,000 dwt
14th August 2017 2017 Interim Results
47 49 50 53 5969 70 70 76
8499
149
205
234 231 238221
178
156146 140
13111865 61 63 58 47
45 49 47 4850
55
64
70
7162 54
49
37
3429 32
3230
0
50
100
150
200
250
300
350
Nu
mb
er
of
Yar
ds
China - Japan - Korea Rest of World
August 2017: 148 Yards
2009: 305 Yards
Data source: Clarksons Research
Data as of 1st August 2017
1996-2017: Yards with at least 1 ship on order at year start/latest month
20

Fewer Yards Winning Orders…
14th August 2017 2017 Interim Results
*Peak varies by sector: Bulkers = 2010, Tankers = 2015, Containerships = 2015, LNG carriers = 2013, LPG Carriers = 2015
Includes yards in China, South
Korea and Japan only
Data source: Clarksons Research
Data as of 1st August 201721

Shipping Lending Overview (By Bank)
14th August 2017 2017 Interim Results
Total Reported Portfolios (by year)
2010: $418.4bn 2011: $400.3bn 2012: $388.5bn 2013: $379.1bn 2014: $391.5bn 2015: $343.8bn 2016: $315.0bn
21
18.1 17.7 17 16.8 16.8 16.2 15.9 15.2 15.1 14.6 14.1 13.9
10.3 10.28.9
86.3 6.2 5.9 5.8 5.7 5.5 5.1 4.6
2010 2011 2012 2013 2014 2015 2016
0.0
50.0
100.0
150.0
200.0
250.0
300.0
350.0
400.0
450.0
500.0
0
5
10
15
20
25
To
p 2
5 B
an
k P
ort
folio
s
(US
$ b
n)*
Geographical Breakdown of Lenders
EUROPE 83.1% 79.3% 75.1% 72.9% 70.5% 63.9% 62.2%
USA 2.1% 1.7% 2.8% 2.7% 2.6% 3.9% 4.8%
ASIA-PAC 14.8% 19.0% 22.0% 24.4% 26.8% 32.2% 33.0%
22
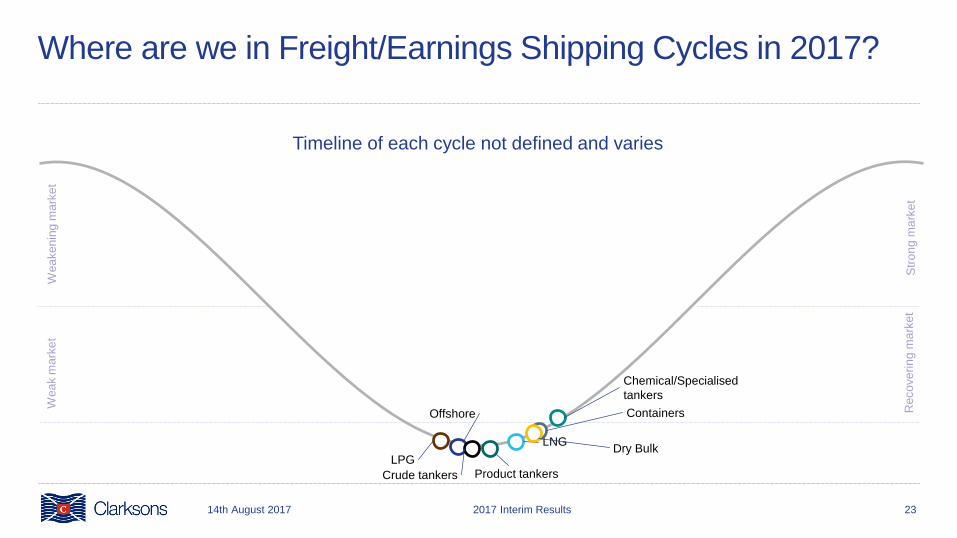
Where are we in Freight/Earnings Shipping Cycles in 2017?
23
Offshore
LNG
Product tankersCrude tankers
Str
on
g m
ark
et
Reco
ve
rin
g m
ark
et
Wea
ken
ing
ma
rke
tW
ea
k m
ark
et
Timeline of each cycle not defined and varies
Containers
Chemical/Specialised
tankers
Dry BulkLPG
14th August 2017 2017 Interim Results

Securities - an encouraging start to 2017...
14th August 2017 2017 Interim Results 24

Creating value at the heart of world tradeUnderpinned by our values, our integrated business model provides the platform for an unrivalled level of service and information that
enables trade and creates long-term value.
14th August 2017 2017 Interim Results 25

Corporate Outlook
14th August 2017 2017 Interim Results
Proven Strategy
Integrated business model
Breadth & Depth
Flow & placing power
Investment in technology solutions
Strong Balance Sheet
Cash generative
Progressive dividend policy
26