CLARK COUNTY, WASHINGTON...CLARK COUNTY, WASHINGTON AND INCORPORATED AREAS 1.0 1.1 Purpose of Study...
106
VOLUME 1 OF 2 CLARK COUNTY, WASHINGTON AND INCORPORATED AREAS COMMUNITY NAME COMMUNITY NUMBER BATTLE GROUND, CITY OF 530025 CAMAS, CITY OF 530026 CLARK COUNTY (UNINCORPORATED AREAS) 530024 LA CENTER, CITY OF 530248 RIDGEFIELD, CITY OF 530298 VANCOUVER, CITY OF 530027 WASHOUGAL, CITY OF 530028 YACOLT, TOWN OF 530269 FLOOD INSURANCE STUDY NUMBER 53011CV001A CLARK COUNTY EFFECTIVE DATE: SEPTEMBER 5, 2012
Transcript of CLARK COUNTY, WASHINGTON...CLARK COUNTY, WASHINGTON AND INCORPORATED AREAS 1.0 1.1 Purpose of Study...

VOLUME 1 OF 2
CLARK COUNTY, WASHINGTON AND INCORPORATED AREAS
COMMUNITY NAME COMMUNITY NUMBER
BATTLE GROUND, CITY OF 530025 CAMAS, CITY OF 530026 CLARK COUNTY
(UNINCORPORATED AREAS) 530024 LA CENTER, CITY OF 530248 RIDGEFIELD, CITY OF 530298 VANCOUVER, CITY OF 530027 WASHOUGAL, CITY OF 530028 YACOLT, TOWN OF 530269
FLOOD INSURANCE STUDY NUMBER 53011CV001A
CLARK COUNTY
EFFECTIVE DATE: SEPTEMBER 5, 2012

NOTICE TO
FLOOD INSURANCE STUDY USERS
Communities participating in the National Flood Insurance Program have established repositories
of flood hazard data for floodplain management and flood insurance purposes. This Flood
Insurance Study (FIS) report may not contain all data available within the Community Map
Repository. Please contact the Community Map Repository for any additional data.
Selected Flood Insurance Rate Map (FIRM) panels for this community contain information that
was previously shown separately on the corresponding Flood Boundary and Floodway Map
(FBFM) panels (e.g., floodways, cross sections). In addition, former flood hazard zone
designations have been changed as follows:
Old Zone(s) New Zone
Al through A30 AE
Vl through V30 VE
B X
C X
Part or all of this Flood Insurance Study may be revised and republished at any time. In addition,
part of this Flood Insurance Study may be revised by the Letter of Map Revision process, which
does not involve republication or redistribution of the Flood Insurance Study. It is, therefore, the
responsibility of the user to consult with community officials and to check the community
repository to obtain the most current Flood Insurance Study components.
FIS Effective Date: September 5, 2012
i
TABLE OF CONTENTS
1.0 INTRODUCTION.............................................................................................. 1
1.1 Purpose of Study ...................................................................................... 1
1.2 Authority and Acknowledgments ............................................................ 1
1.3 Coordination ............................................................................................ 2
2.0 AREA STUDIED ............................................................................................... 2
2.1 Scope of Study ......................................................................................... 2
2.2 Community Description ........................................................................... 4
2.3 Principal Flood Problems ......................................................................... 5
2.4 Flood Protection Measures ...................................................................... 6
3.0 ENGINEERING METHODS ........................................................................... 7
3.1 Hydrologic Analyses ................................................................................ 8
3.2 Hydraulic Analyses ................................................................................ 13
3.3 Vertical Datum ....................................................................................... 16
4.0 FLOODPLAIN MANAGEMENT APPLICATIONS .................................. 16
4.1 Floodplain Boundaries ........................................................................... 17
4.2 Floodways .............................................................................................. 17
5.0 INSURANCE APPLICATIONS..................................................................... 55
6.0 FLOOD INSURANCE RATE MAP .............................................................. 55
7.0 OTHER STUDIES ........................................................................................... 58
8.0 LOCATION OF DATA ................................................................................... 58
9.0 BIBLIOGRAPHY AND REFERENCES ...................................................... 58
ii
TABLE OF CONTENTS
FIGURES
Figure 1 – Floodway Schematic ................................................................................................ 18
TABLES
Table 1 – Initial and Final CCO Meeting Dates .......................................................................... 2Table 2 – Letters of Map Change (LOMCs) ................................................................................ 3Table 3 – Comparison of Major Columbia River Floods ............................................................ 6Table 4 – Summary of Discharges ............................................................................................. 10Table 5 – Manning’s “n” Values ............................................................................................... 15Table 6 – Floodway Data ........................................................................................................... 19Table 7 – Community Map History ........................................................................................... 57
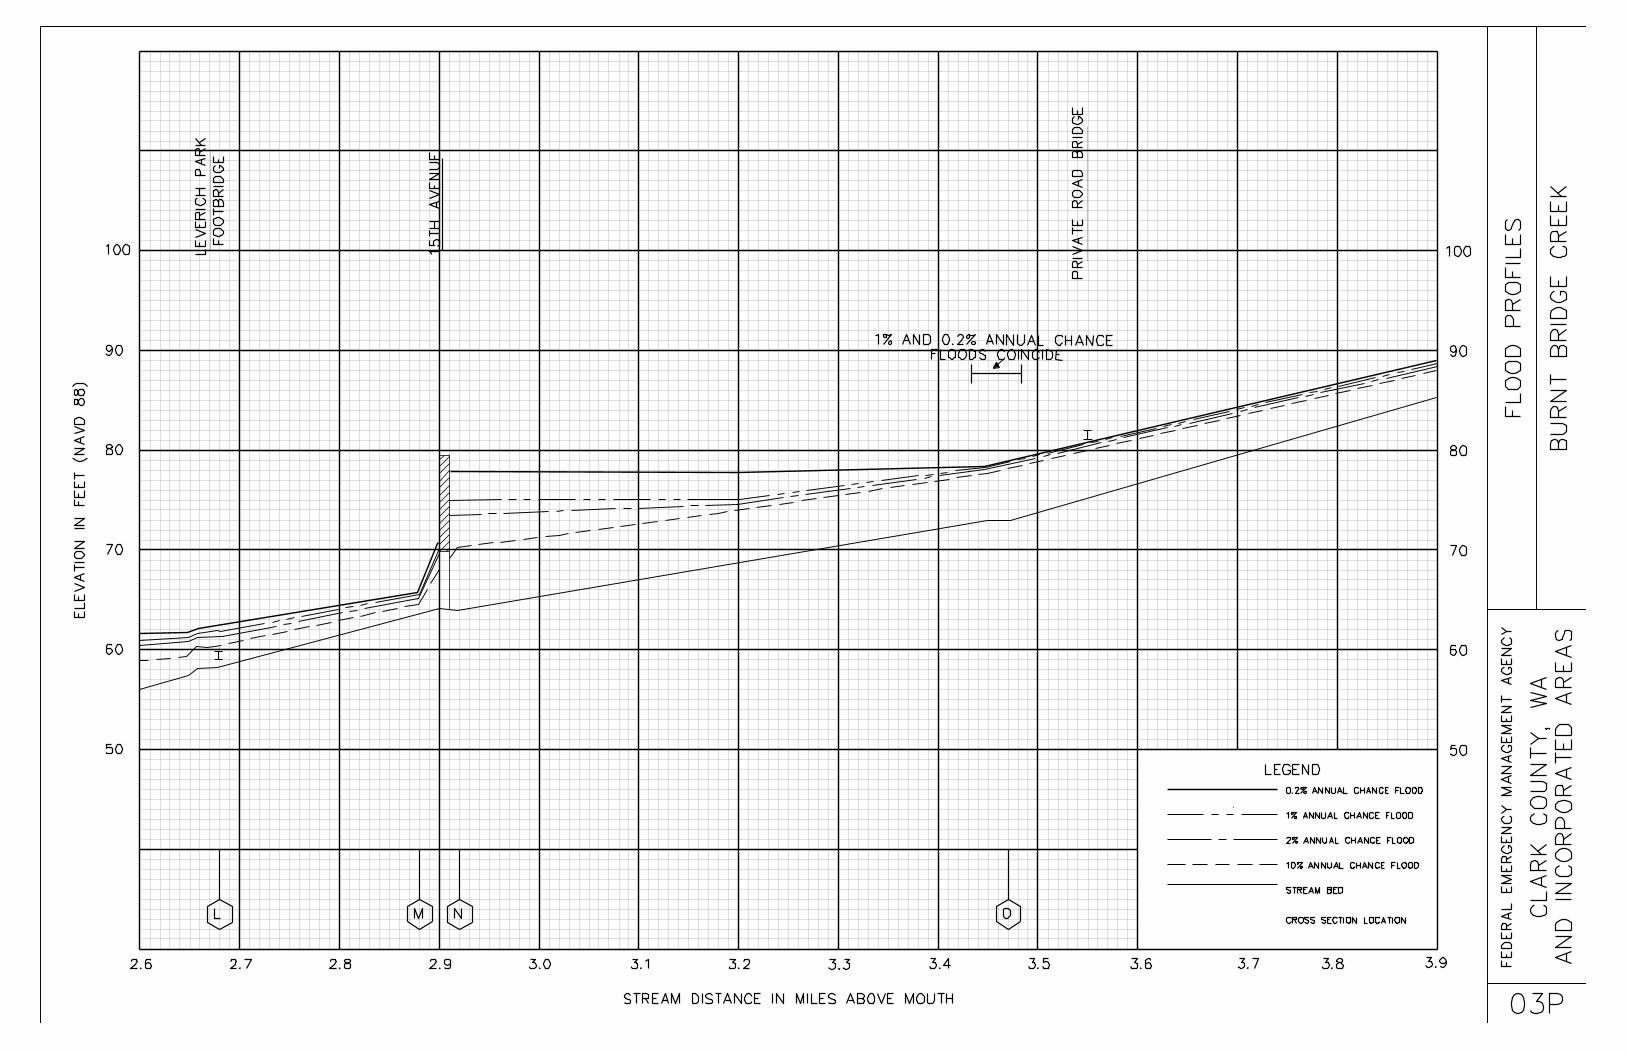
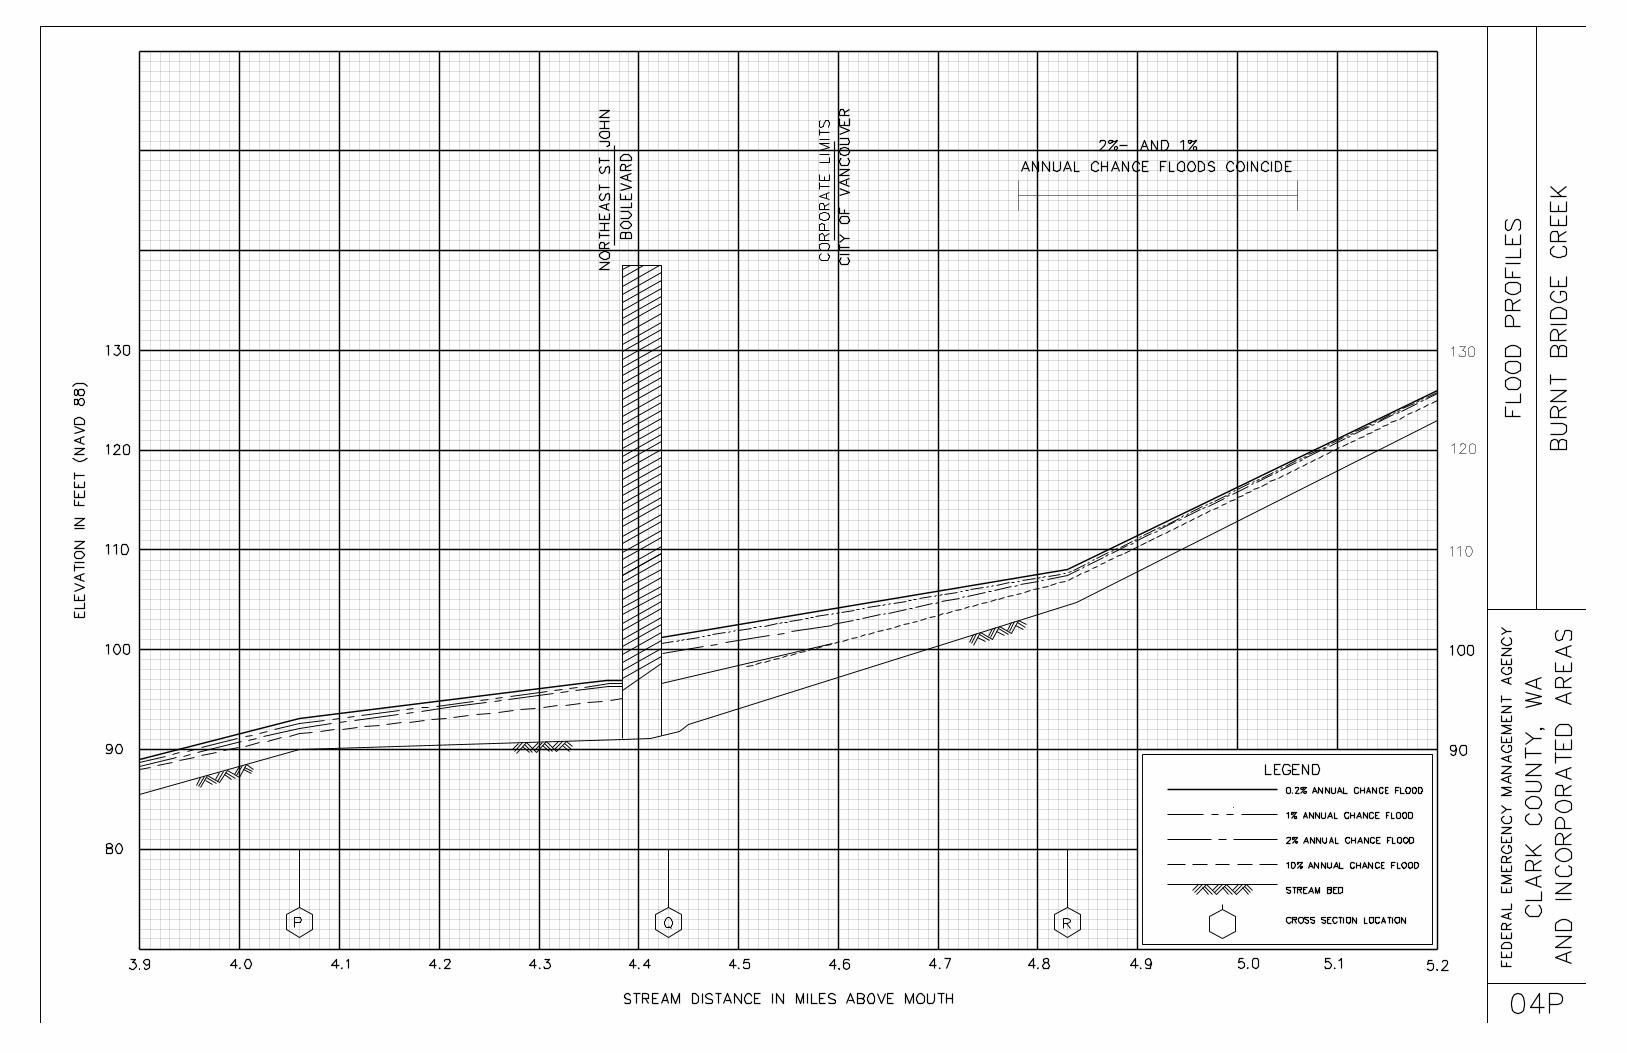
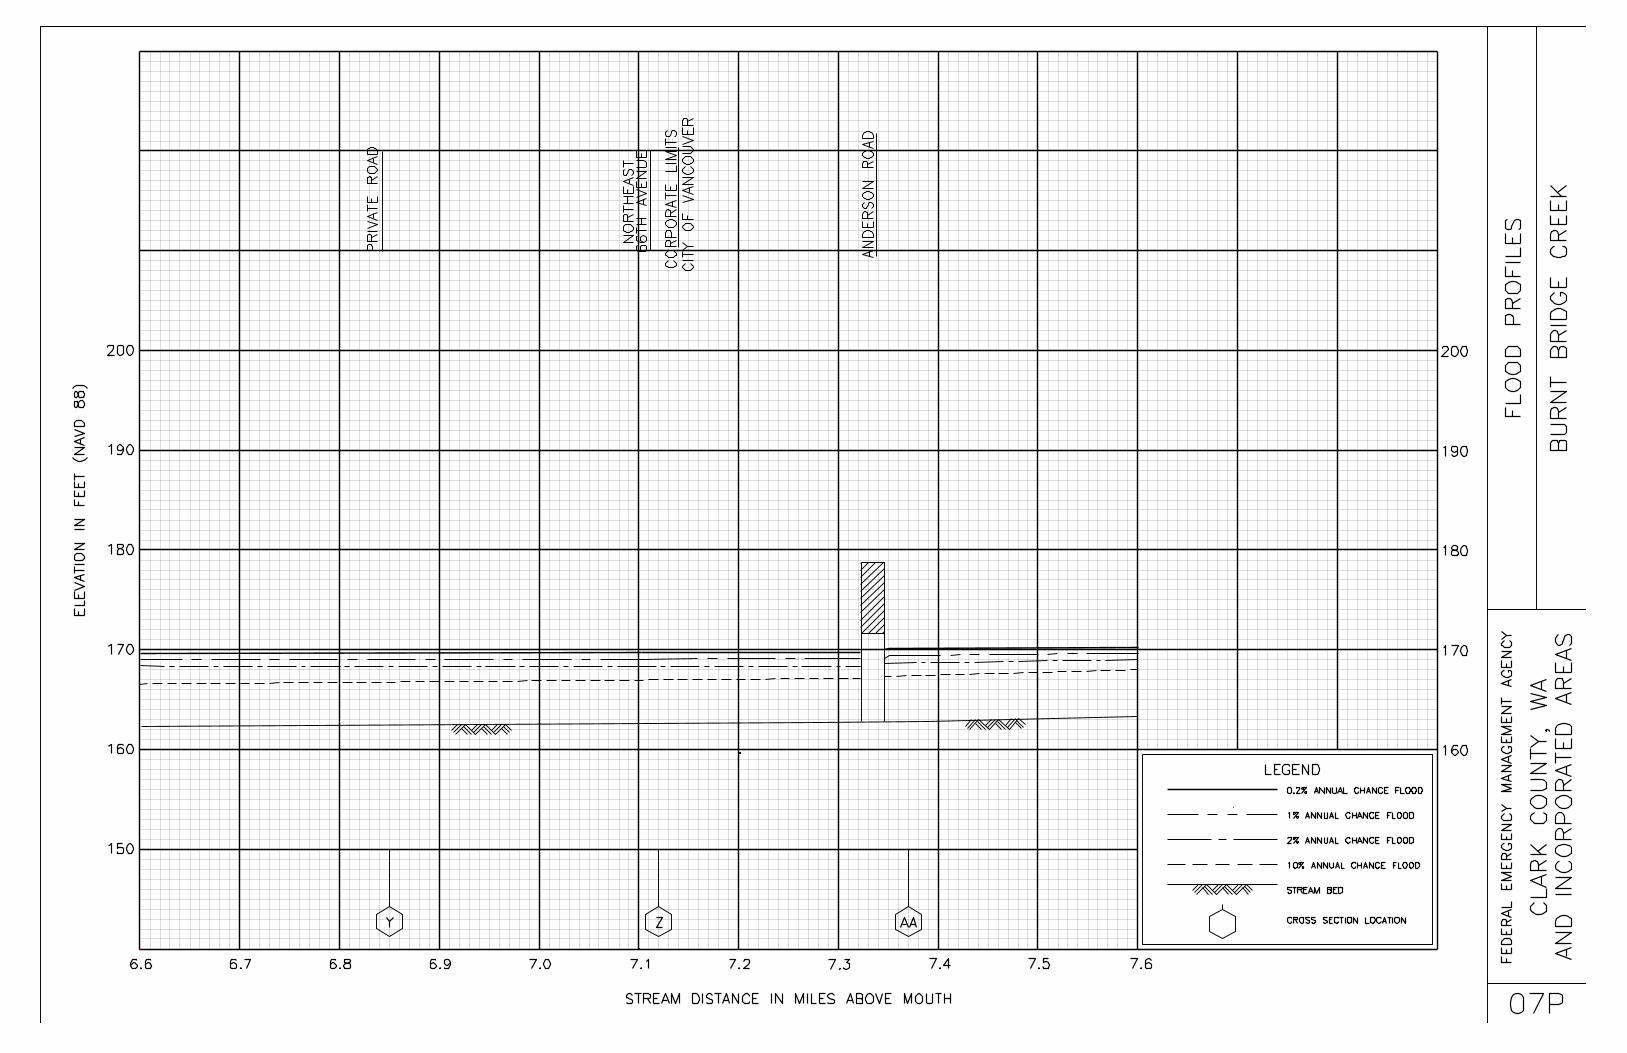
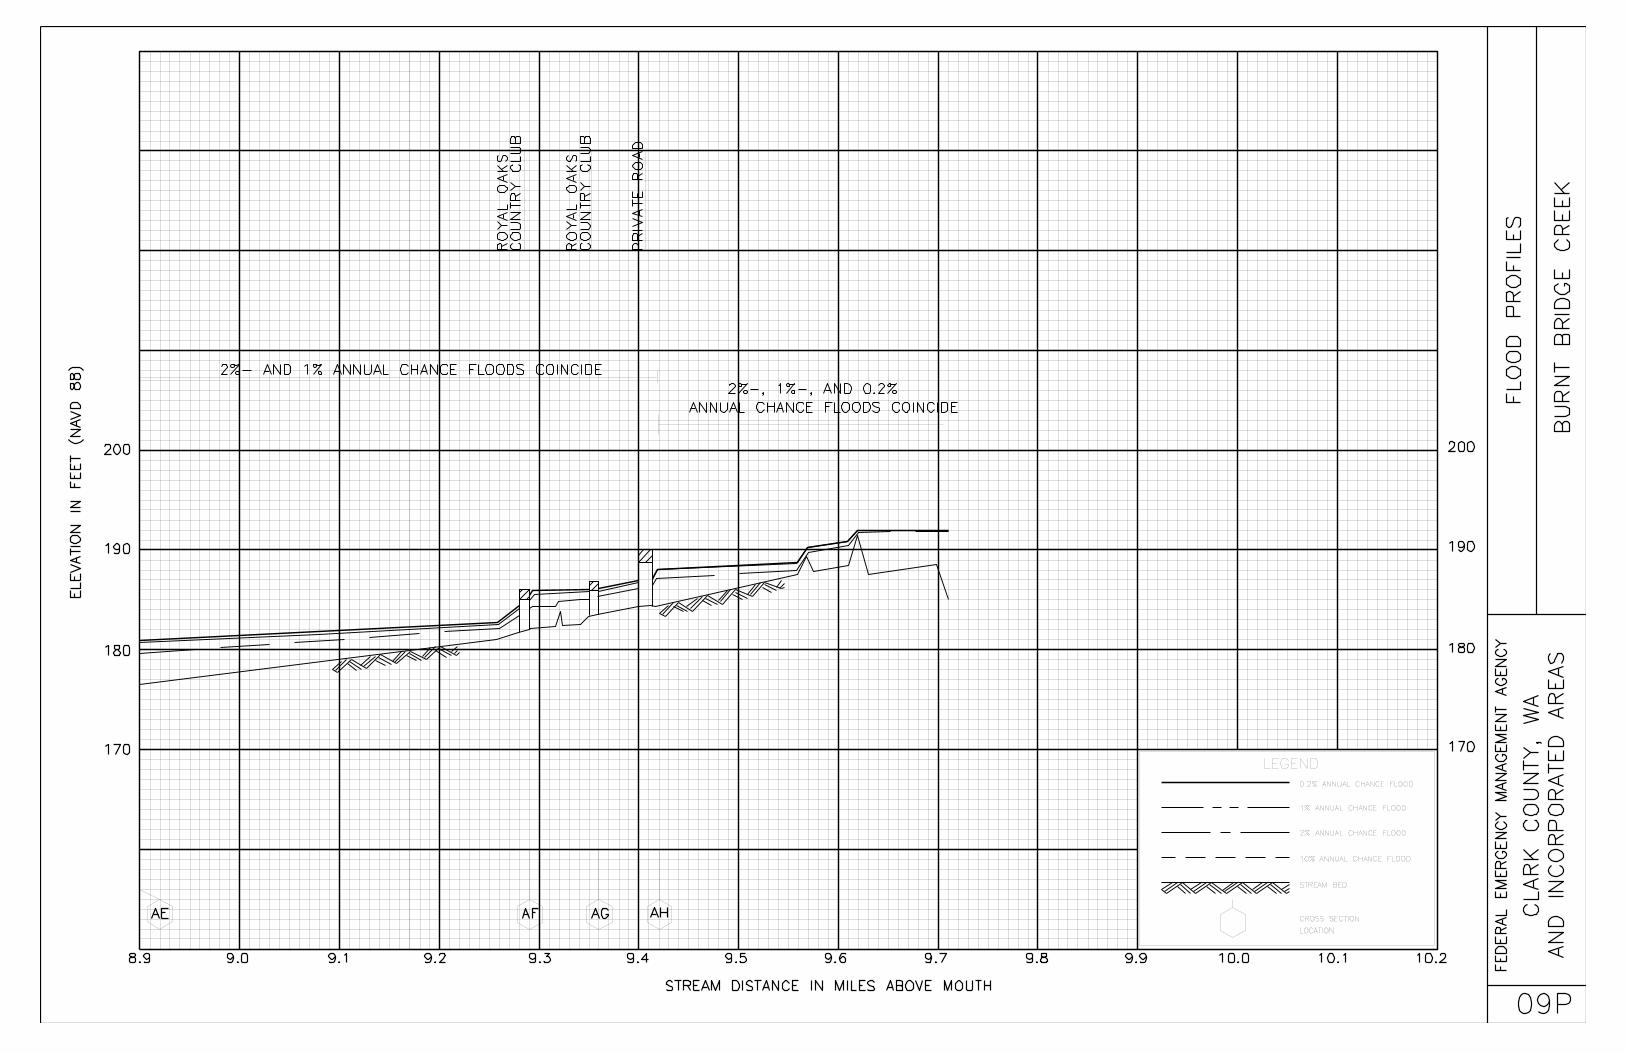
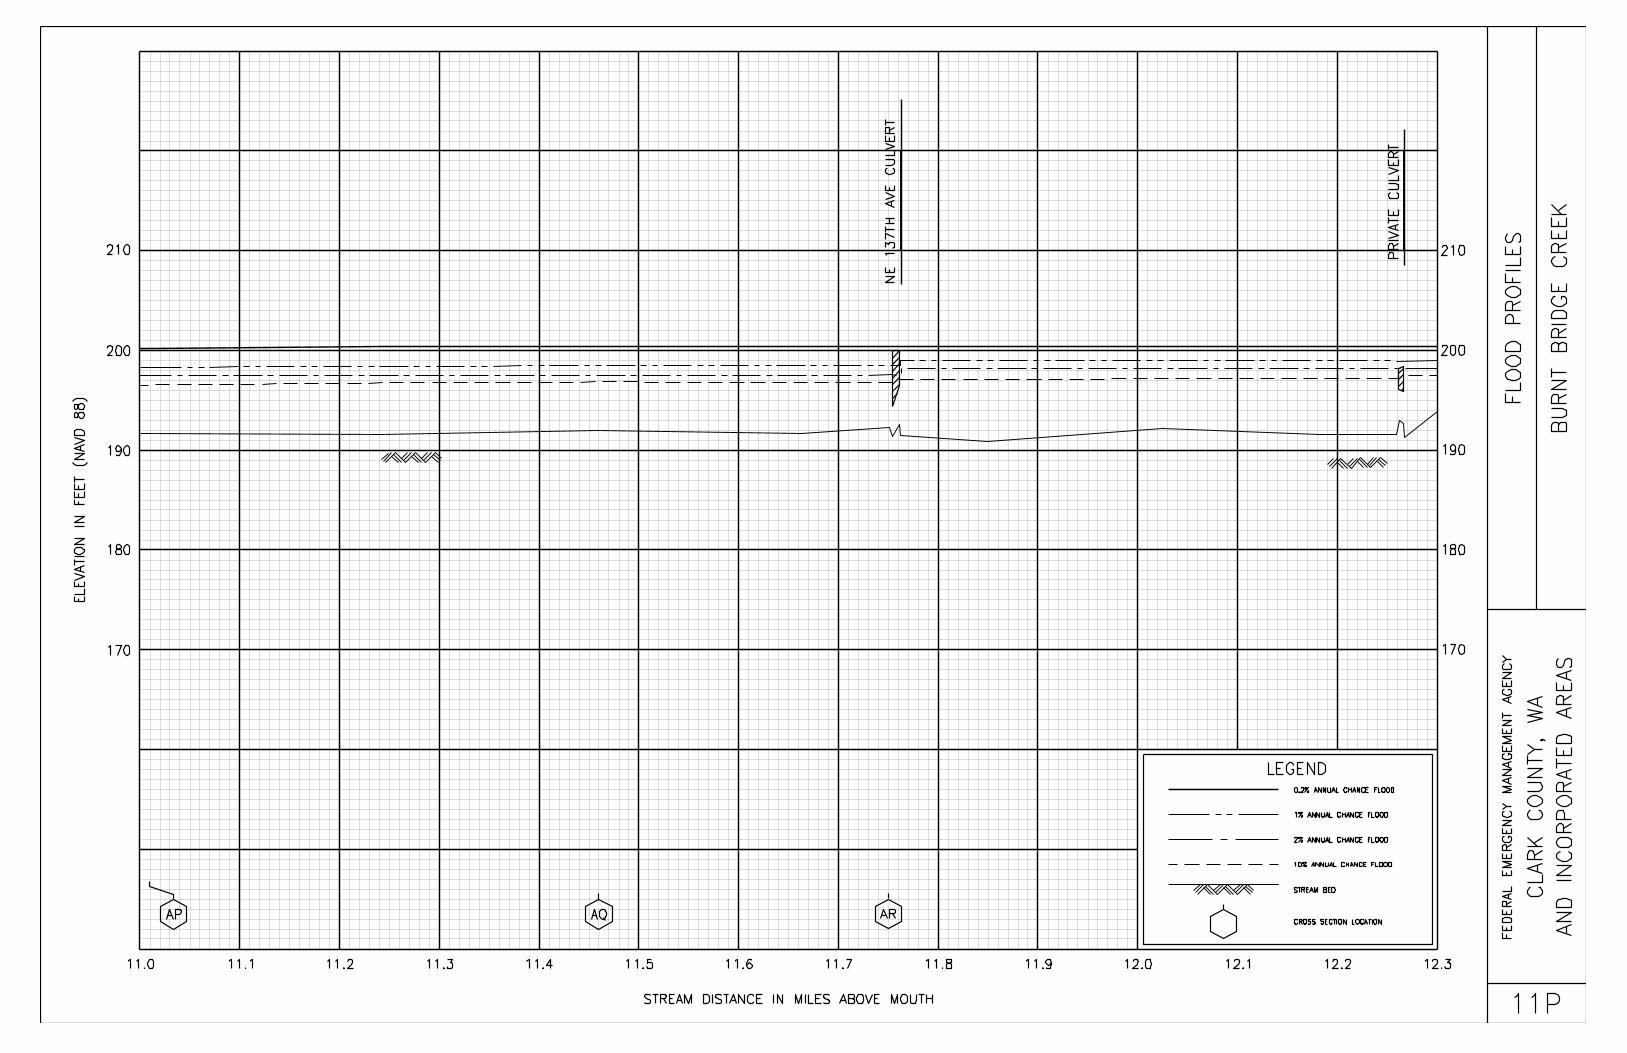
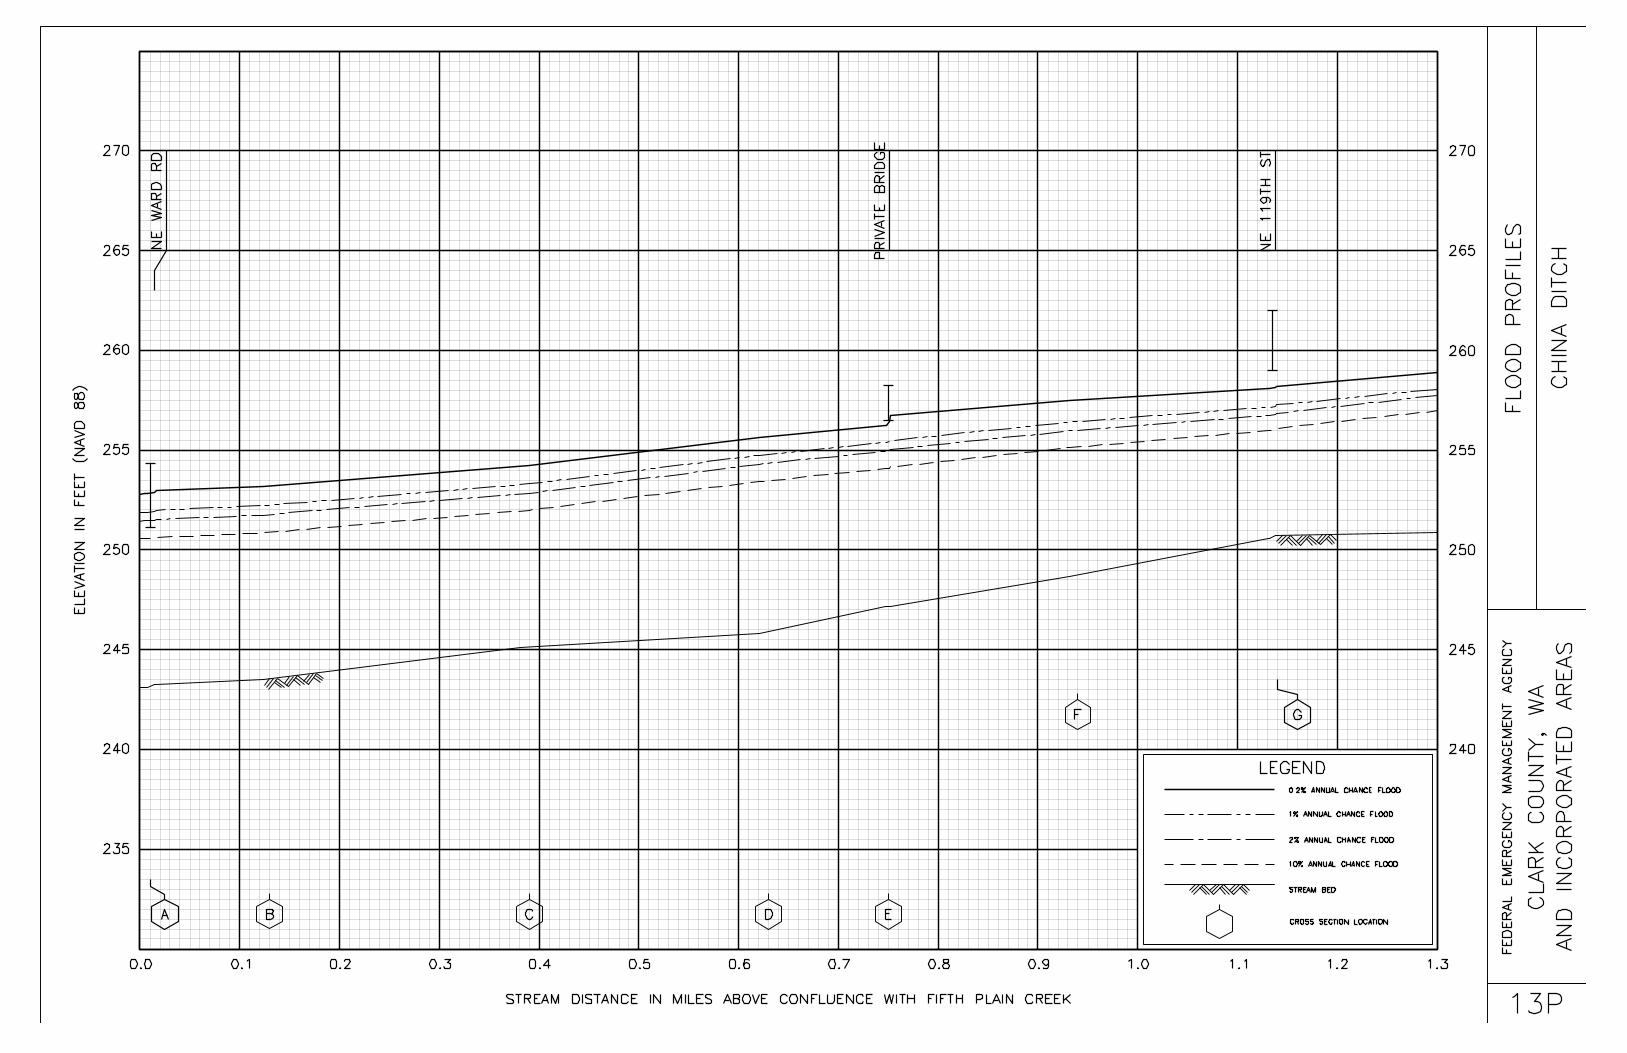
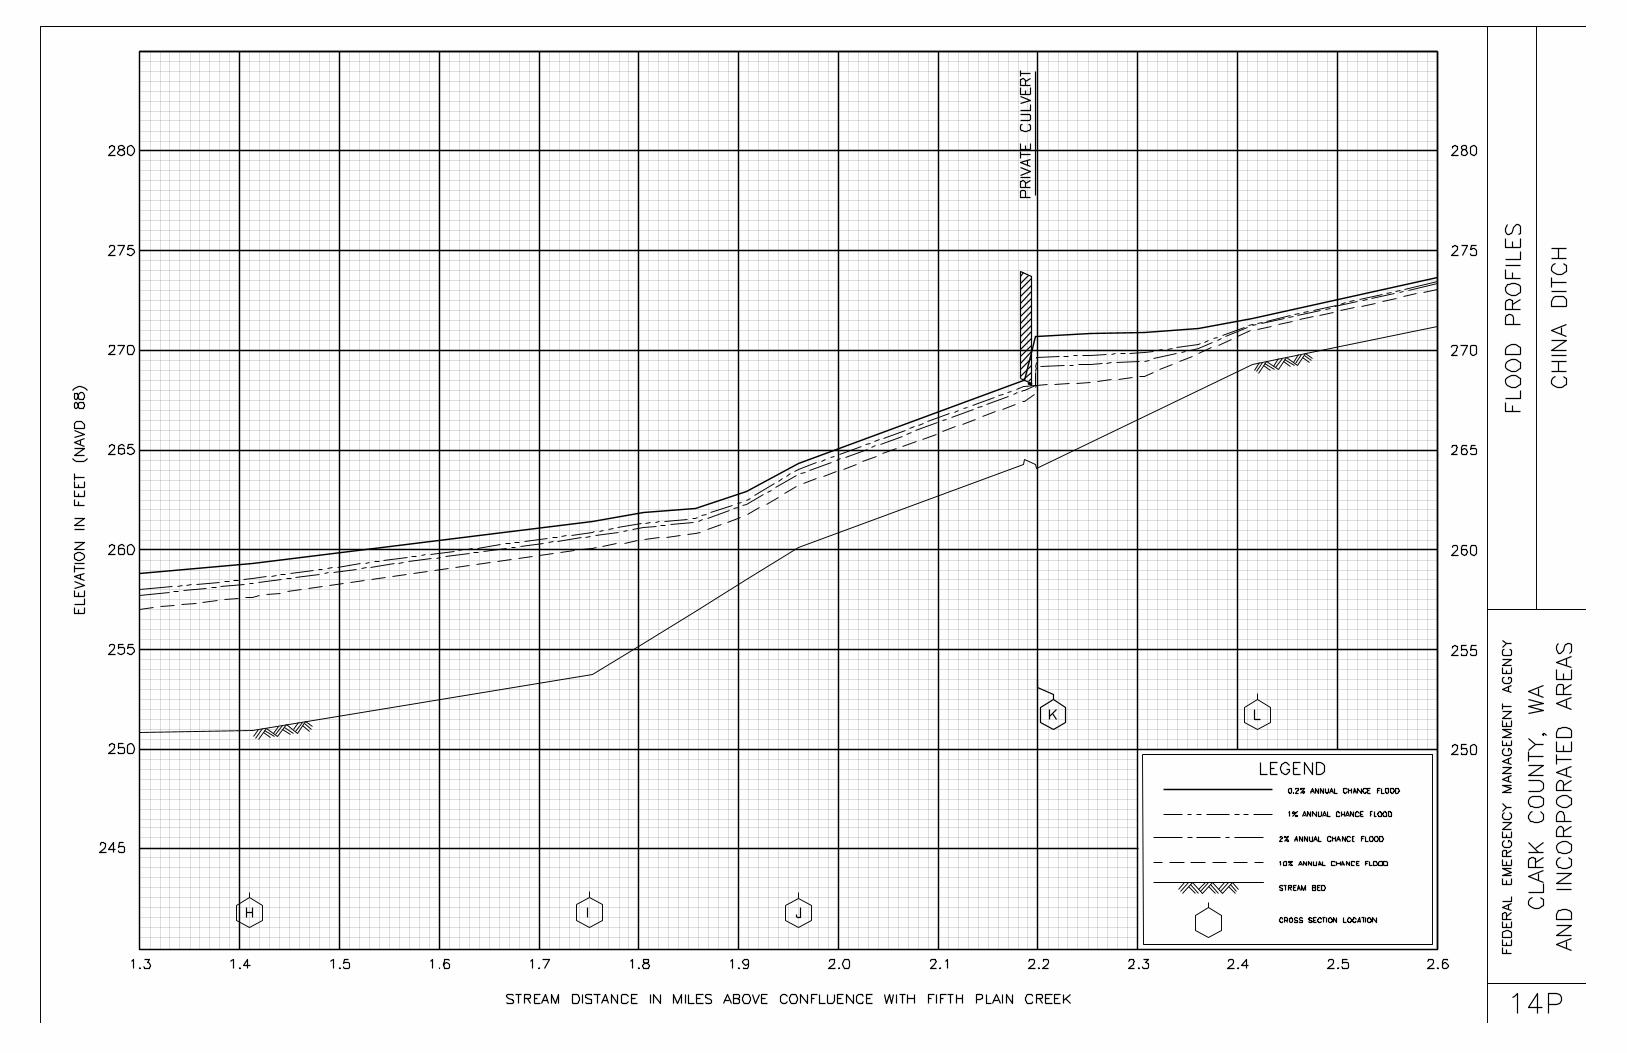
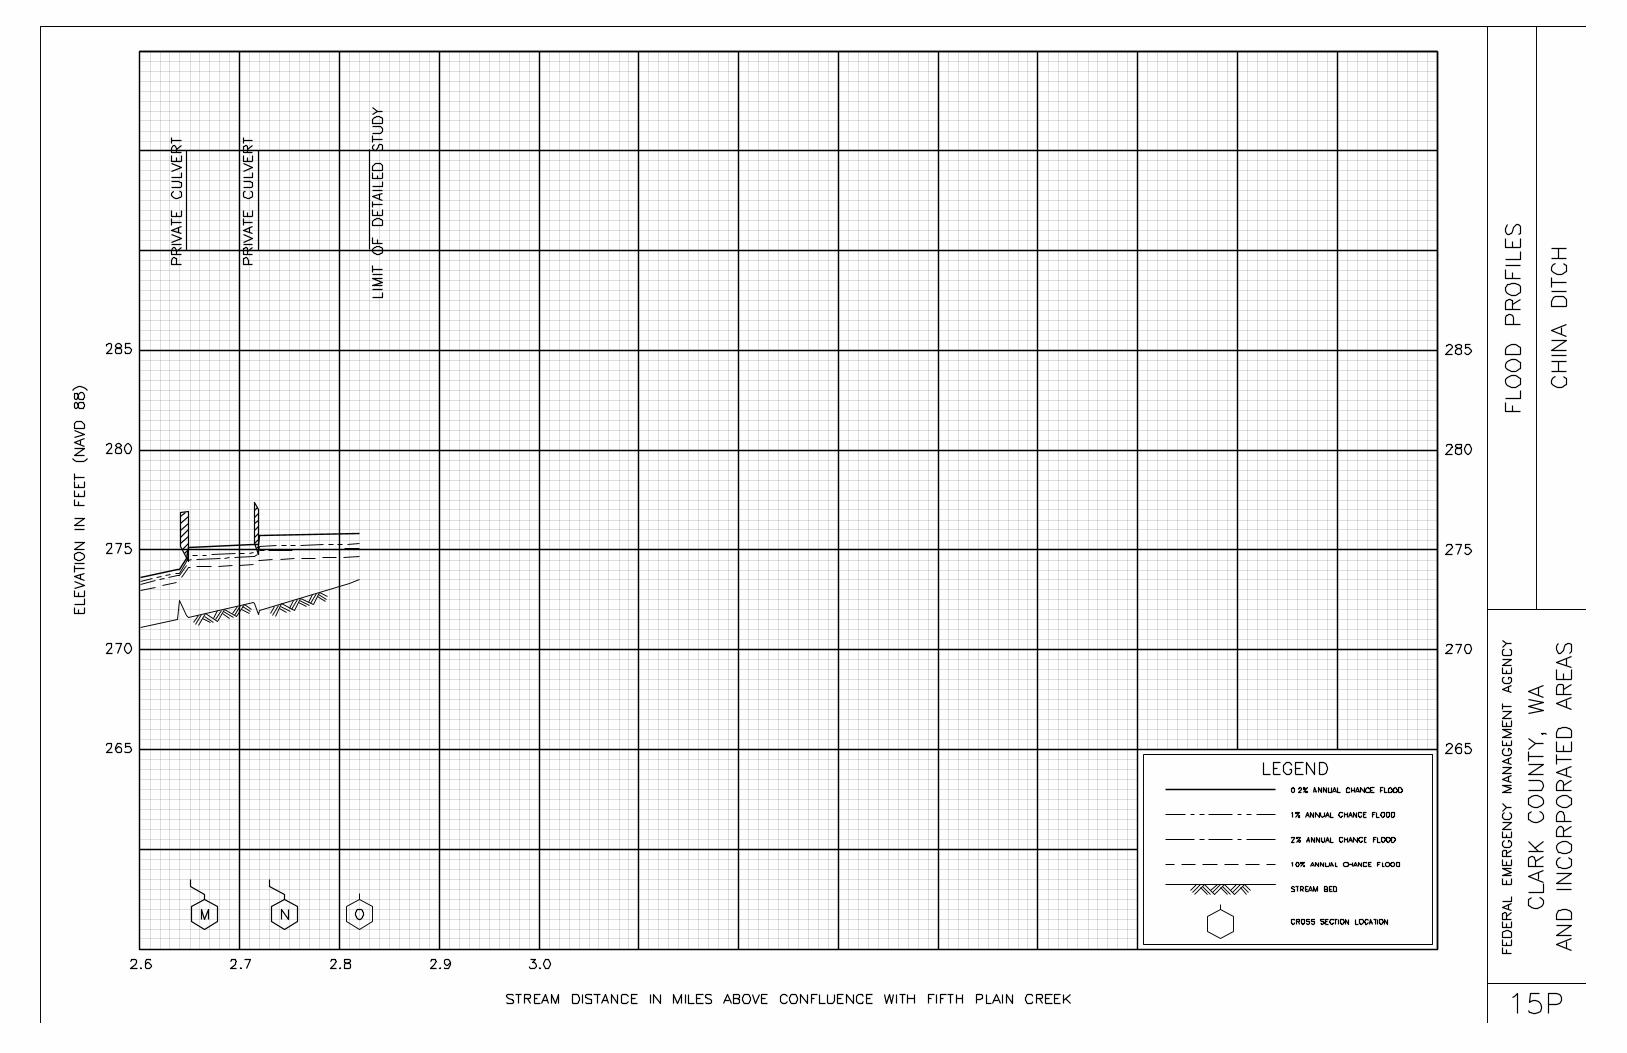
Exhibit 1 - Flood Profiles
EXHIBITS
Burnt Bridge Creek Panels 01P-12P China Ditch Panels 13P-15P Columbia River Panels 16P-24P Curtin Creek Panels 25P-28P East Fork Lewis River Panels 29P-40P
VOLUME 2
EXHIBITS
East Fork Lewis River Lower Split Panels 41P East Fork Lewis River Path 2 Panels 42P East Fork Lewis River Path 3 Panels 43P Fifth Plain Creek Panels 44P-47P Gee Creek Panels 48P-55P Lacamas Creek Panels 56P-65P Lewis River Panels 66P-80P Mill Creek Panels 81P-86P Packard Creek Panels 87P-92P Padden Creek Panel 93P Salmon Creek Panels 94P-111P Spring Branch Creek Panel 112P Unnamed Tributary to Gee Creek Panel 113P Washougal River Panels 114P-118P Weaver Creek Panels 119P-123P Whipple Creek Panels 124P-130P
ii
PUBLISHED SEPARATELY: Exhibit 2 - Flood Insurance Rate Map Index Flood Insurance Rate Map
1
FLOOD INSURANCE STUDY CLARK COUNTY, WASHINGTON AND INCORPORATED AREAS
1.0
1.1 Purpose of Study
INTRODUCTION
This Flood Insurance Study (FIS) revises and updates information on the existence and severity of flood hazards in the geographic area of Clark County, including the Cities of Battle Ground, Camas, La Center, Ridgefield, Vancouver, and Washougal; and the Town of Yacolt; and the unincorporated areas of Clark County (referred to collectively herein as Clark County), and aids in the administration of the National Flood Insurance Act of 1968 and the Flood Disaster Protection Act of 1973. This study has developed flood risk data for various areas of the community that will be used to establish actuarial flood insurance rates and to assist the community in its efforts to promote sound floodplain management. Minimum floodplain management requirements for participation in the National Flood Insurance Program (NFIP) are set forth in the Code of Federal Regulations at 44 CFR, 60.3. Please note that the City of Woodland is geographically located in Cowlitz and Clark Counties. The City of Woodland is not included in this FIS report. In some States or communities, floodplain management criteria or regulations may exist that are more restrictive or comprehensive than the minimum Federal requirements. In such cases, the more restrictive criteria take precedence, and the State (or other jurisdictional agency) will be able to explain them.
1.2 Authority and Acknowledgments
The sources of authority for this FIS report are the National Flood Insurance Act of 1968 and the Flood Disaster Protection Act of 1973. The original hydrologic and hydraulic analyses for Burnt Bridge Creek, the Columbia River, the East Fork Lewis River, Gee Creek, Lacamas Creek, the Lewis River, Mill Creek, Salmon Creek, an Unnamed Tributary to Gee Creek, the Washougal River, and Weaver Creek were performed by the U.S. Army Corps of Engineers (USACE), Portland District, for the Federal Emergency Management Agency (FEMA), under Interagency Agreement No. IAA-H-l0-77, Project Order No. 15; Interagency Agreement No. IAA-H-7-76, Project Order No. 1; Interagency Agreement No. IAA-H-16-75, Project Order No. 10, 16, and 19; Interagency Agreement No. IAA-H-20-74, Project Order No. 17. This work was completed in November 1979. The hydrologic and hydraulic analyses for this study were performed by WEST Consultants Inc., for FEMA, under Contract No. EMS-2001-CO-0068. This study was completed in August 2005. Gee Creek, Lacamas Creek, Mill Creek, Salmon Creek, and Weaver Creek were restudied entirely. A Portion of Burnt Bridge Creek was restudied. China Ditch, Curtin Creek, Fifth Plain Creek, Packard Creek, Padden Creek, Spring Branch Creek, and Whipple Creek were studied by detailed methods. Little Matney Creek, Matney Creek, Morgan Creek, Mud Creek, and Shanghai Creek were studied by approximate methods.
2
1.3 Coordination
The initial Consultation Coordination Officer (CCO) meetings were held with representatives from FEMA, the communities, and the study contractors, to explain the nature and purpose of an FIS, and to identify the streams to be studied or restudied. All affected communities were requested to provide any data pertinent to the study. The final CCO meetings were held with representatives from FEMA, the communities, and the study contractor to review the results of the study. The initial and final meeting dates for previous FIS reports for Clark County and its communities are listed on Table 1, “Initial and Final CCO Meeting Dates”.
For this countywide study, the final CCO meeting held on September 15, 2010, and attended by representatives of FEMA, Michael Baker Jr. Inc., the WA Department of Ecology, the Port of Camas-Washougal, and the local communities of the Cities of Camas, Ridgefield, Vancouver, and Washougal; and Clark County. All problems raised at that meeting have been addressed.
2.0
2.1 Scope of Study
AREA STUDIED
This FIS report covers the geographic area of Clark County, Washington, including the incorporated communities listed in Section 1.1. For this countywide FIS, the FIS report and FIRM were converted to countywide format, and the flooding information for the entire county, including both incorporated and unincorporated areas, is shown. Also, the vertical datum was converted from the National Geodetic Vertical Datum of 1929 (NGVD29) to the North American Vertical Datum of 1988 (NAVD88). In addition, the Transverse Mercator, State Plane coordinates, previously referenced to the North American Datum of 1927 (NAD27), are now referenced to the North American Datum of 1983 (NAD83).
Table 1 – Initial and Final CCO Meeting Dates
Community Initial CCO Date
Final CCO Date
Battle Ground, City of November 16, 1976 March 4, 1980 Camas, City of * March 5, 1980 Clark County * September 1, 1981 (Unincorporated Areas)
La Center, City of * September 26, 1986 Ridgefield, City of November 16, 1976 June 10, 1980 Vancouver, City of May 22, 1975 June 10, 1980 Washougal, City of March 30, 1979 November 18, 1979 Yacolt, Town of * *
* Data not available

3
The areas studied by detailed methods were selected with priority given to all known flood hazards and areas of projected development. The November 1979 study performed by USACE provided a detailed study along Burnt Bridge Creek from City of Vancouver corporate limits to approximately 0.22 mile upstream of Northeast 152nd Avenue. The Columbia River was studied by detailed method from Clark-Cowlitz County boundary to Clark-Skamania County boundary. The East Fork Lewis River was studied by detailed method from its confluence with the Lewis River to upstream of Boy Scout Camp. The Lewis River was studied by detailed method from its confluence with the Columbia River to approximately 500 feet downstream of Merwin Dam. Unnamed Tributary to Gee Creek was studied by detailed method from its confluence with Gee Creek to approximately 500 feet upstream of Northwest 54th Avenue. The Washougal River was studied by detailed method from its confluence with the Columbia River to approximately 0.86 miles upstream of City of Washougal corporate limits. In addition, approximate methods were used to continue the East Fork Lewis River and Lewis River studies to Big Tree Creek and the Clark-Skamania County boundary, respectively. Cedar Creek, Chelatchie Creek, and Unnamed Tributary to Chelatchie Creek were studied by approximate method. The August 2005 study performed by West Consultants Inc provided new detailed information for Burnt Bridge Creek from the downstream face of the Interstate 205 culvert to approximately 1 mile upstream of Northeast 137th Avenue. Gee Creek, Lacamas Creek, Mill Creek, Salmon Creek, and Weaver Creek were restudied entirely. China Ditch, Curtin Creek, Fifth Plain Creek, Packard Creek, Padden Creek, Spring Branch Creek, and Whipple Creek were studied entirely by detail method. The study also provided approximate study for Little Matney Creek, Matney Creek, Morgan Creek, Mud Creek, and Shanghai Creek. Approximate analyses were used to study those areas having a low development potential or minimal flood hazards. The scope and methods of study were proposed to, and agreed upon, by FEMA and Clark County. This countywide FIS incorporates the determinations of Letter of Map Revisions (LOMRs) issued by FEMA, for the projects listed by community in Table 2, “Letters of Map Change (LOMCs)”.
Table 2 – Letters of Map Change (LOMCs)
Community Case Number Stream(s) / Project Identifier Clark County
(Unincorporated Areas)
Date Issued 94-10-039P The 1-percent-annual-chance flood for
Unnamed Tributary to Curtin Creek is contained in a channel and culvert west of Northeast Meadows Drive
June 21, 1994
Clark County (Unincorporated Areas)
04-10-0710P Cold Creek from approximately 750 feet downstream to approximately 600 feet upstream of Northeast 58th Avenue
June 6, 2005

4
2.2 Community Description
Clark County is in southwestern Washington. Adjacent counties are Cowlitz on the north; Skamania on the east; and Multnomah and Columbia Counties, Oregon, on the south and west, respectively. Vancouver, the County seat, is in the southwestern corner of Clark County, and is linked to Portland, Oregon, by the Interstate Highway 5 Bridge over the Columbia River. Clark County occupies an area of 627 square miles between the Pacific Coast Range on the west and the Cascade Range on the east. The western and southern areas are primarily agricultural lands. The eastern and northern areas of the county are steep, forested foothills and mountains of the Cascade Range. The soils of the northern and eastern areas are well drained, while those of the western and southern areas are poorly to moderately drained (Reference l). Most of the development in the county is along the Columbia River. However, there are small areas of development throughout the County. The population of the unincorporated areas of Clark County rose from 238,053 in 1990 to 345,238 in 2000 (Reference 2). Vancouver, a fast-growing suburb of Portland, Oregon, is the largest incorporated City in Clark County, with a population of approximately 143,560 in 2000. The total population of the incorporated areas of Clark County was 178,959 in 2000 (Reference 2). Economic activity centers on industrial products, which include, in order of amount produced, lumber, pulp, paper, aluminum, carborundum, and chemicals. Agriculture is also an important industry, the major products being dairy products, livestock, poultry, vegetables, berries, and orchard fruit. In 1970, 25 percent of the Clark County work force was employed in Oregon (Reference 3). The Columbia River, which forms the southern and western boundaries of the county, is the major inland waterway in the northwestern United States. It drains an area of approximately 241,000 square miles of southwestern Canada and northwestern United States upstream of Vancouver, Washington. From its source on the northwestern slopes of Mount Adams, the Lewis River flows southwesterly along the northern boundary of Clark County. It drains 1,046 square miles of rugged, heavily timbered land before joining the Columbia River near Ridgefield. The East Fork Lewis River, with headwaters in the Gifford Pinchot National Forest of Skamania County, drains 212 square miles of mountainous timber land and flows westerly before entering the Lewis River near the City of La Center. As it flows westerly and southerly into the Columbia River at Camas, the Washougal River drains 168 square miles of steep, forested land. Salmon Creek, a tributary of the Lake River, drains 92 square miles of moderately sloping agricultural land in western Clark County. Many of the small streams of Clark County flow southerly or westerly from sources in steep timberland, pass through lower reaches of gently sloping agricultural land or residential areas, and finally enter the Columbia River. Clark County has a temperate marine climate typical of western Washington. Summers are dry with mild temperatures, and winters are rainy with occasional snow. At Vancouver, average annual temperatures range from a mean daily minimum of 33 degrees Fahrenheit
5
(°F) in January to a mean daily maximum of 80°F in July (Reference 4). Average annual precipitation varies from 39 inches at Vancouver to 75 inches at Yacolt in north central Clark County. More than 65 percent of the annual precipitation occurs from November through March (Reference 5).
2.3 Principal Flood Problems
Although many large Columbia River floods have occurred in Clark County, existing flood control storage will reduce the severity of future floods. The June 1948 and June 1956 floods were typical spring-summer floods caused by snowmelt runoff. Although less significant than the aforementioned floods, the December 1964 flood is noteworthy because it was an unusually large winter flood resulting primarily from rainfall. Peak discharges at the U.S. Geological Survey (USGS) gage at The Dalles, Oregon, for the June 1948 and June 1956 floods were 1,010,000 and 823,000 cubic feet per second (cfs), respectively. Discharges are given for The Dalles (approximately 55 miles upstream of Vancouver) rather than at Clark County because The Dalles is the first gage upstream of the mouth of the Columbia River with a reliable stage- discharge relationship. The discharge of the December 1964 flood is not comparable to the floods of 1948 and 1956 because large inflows occurred downstream of The Dalles. The estimated return periods for the 1948 and 1956 floods were 48 years and 18 years, respectively. The Columbia River floods of 1948 and 1956 caused light damage to residential areas of Clark County. Most of the damage in the unincorporated areas occurred in low lying farm and industrial areas. Emergency flood fighting measures along the Columbia River and temporary evacuation reduced damage. The largest flood of record on the Lewis River occurred in December 1933. At the USGS gage at Ariel (station no. 14220500), the discharge was 129,000 cfs. The historical patterns of flooding along Salmon Creek, the East Fork Lewis River, the Washougal River, Burnt Bridge Creek, and Mill Creek are similar. Overbank flooding has been minor on the upper reaches; however, near the confluence with a larger stream, backwater effects produce more frequent overbank flooding. A combination of intense rainfall and snowmelt caused major East Fork Lewis River floods in January 1972 and December 1977. At the gage near Heisson (River Mile (RM) 20.2), the discharge for both floods was 19,200 cfs with an approximate return interval of the 1-percent-annual-chance flood. These two floods caused minor damage in Clark County. The largest flood during the 35 years of gaging record on Salmon Creek occurred in December 1977, with a discharge of 2,600 cfs at the gage below Rock Creek at RM 22.1. January 1954 and December 1964 were also major floods on Salmon Creek, with discharges of 1,500 and 1,460 cfs, respectively. Those floods caused only minor damage. The only major floods on Burnt Bridge Creek have been caused by Columbia River backwater. Although it is not large for the size of the area drained, the highest flow observed on Burnt Bridge Creek was 176 cfs in December 1955. Minor flood damage was observed in adjacent unincorporated areas. The largest flood along the Washougal River, since a USGS stream gage was established in 1944, 6 miles upstream of the City of Washougal, occurred in December 1977. The flood was an extremely rare event, greater than a 0.2-percent-annual-chance flood at the gage site, and had an estimated peak discharge of 40,400 cfs at the gage. Because there was little overbank flooding and limited development outside of the Cities of Camas and

6
Washougal along the river, only minor damage occurred. Other large floods along the Washougal River occurred in January 1972 and December 1964, with return periods of 18 years and 9 years and peak discharges of 27,700 cfs and 25,100 cfs, respectively. Records of past floods on the remaining flooding sources in Clark County are not well documented, but past floods have caused only minor damage.
2.4 Flood Protection Measures
The Columbia River Basin includes more than 50 storage projects with a total flood control storage volume of approximately 40 million acre-feet (Reference 6). Significant reductions in flood elevations have been achieved through the use of that flood storage. Table 3 (Reference 7) compares Columbia River flood levels at Vancouver, Washington, with and without regulation, to demonstrate the effect of existing flood control storage.
Table 3 – Comparison of Major Columbia River Floods
June 1894 June 1948 June 1956
December 1964
Flood Crest Stages1
Vancouver Gage Unregulated 34.4 31.0 30.0 32.5 Regulated2 22.3 21.5 17.0 26.7 Days Duration Above Flood Stage3 Bankfull 74 51 70 9 Major Flood 38 26 12 2
1 National Weather Service Gage heights in feet (Zero of Vancouver Gage is +5.32 feet NAVD88) 2 Based on present level of irrigation and reservoir development 3 Flood or bankfull stage for Columbia River is 16 feet at the Vancouver Gage. A flood of 26 feet or higher results in extensive damage and is considered a major flood. The duration shown is based on the unregulated flood hydrograph.
The drainage districts along the Columbia River in Clark County have levees of varying flood protection capacities. Thus, safe water levels have been established by the USACE (Reference 8). The safe water level is the highest flood elevation, considering surveillance and minor remedial work, for which reasonable assurance can be given that a levee system will not fail. The determination of the levee safe water level was based on need for freeboard, structural deficiencies observed in the field, knowledge of levee and foundation materials, and flood fighting records. Although the perimeter levee of a particular drainage district may be capable of withstanding large floods, major rainstorms could cause extensive interior ponding in low areas if runoff exceeds the capacity of the dewatering-drainage pumps. In the vicinity of Vancouver, some protection from Columbia River flooding is provided by levees along the Lower River Road and at Fruit Valley. However, certain known deficiencies in their design and maintenance limit the degree of protection to below the

7
1-percent-annual-chance flood level for the Lower River Road area and below the 0.2-percent-annual-chance flood level for the Fruit Valley area. Southwest of Ridgefield at Lake River Delta and Bachelor Island are two projects that include levees, pumping stations, tide boxes, and interior drainage canals. However, certain known deficiencies in their design and maintenance limit the degree of protection to well below 1-percent-annual-chance flood levels. The criteria used to evaluate whether a levee provides protection against the 1-percent-annual-chance flood are (1) adequate design, including freeboard, (2) structural stability, and (3) proper operation and maintenance. Levees that do not protect against the 1-percent-annual-chance flood are not considered in the hydraulic analysis of the 1-percent-annual-chance floodplain. The Washougal Area Drainage District, constructed by the USACE in 1965 and 1966, extends 5.5 miles along the Columbia River from Lawton Creek west to Camas and includes levee embankment, revetment, tide box, and freshwater inlets, and a pumping plant with interior drainage canals. There are three major storage projects along the Lewis River that have an effect on flood peaks. All three projects, Swift Reservoir, Yale Reservoir, and Lake Merwin, are operated by PP&L. Under the present Federal Energy Regulatory Commission license, PP&L is not required to reserve storage space for flood protection. On August 18, 1983, FEMA and PP&L agreed to make approximately 70,000 acre-feet available for flood control storage on the Lewis River System at Merwin Dam, thus reducing the 1-percent-annual-chance discharge at Woodland from 128,000 cfs to 102,000 cfs. Clark County follows FEMA guidelines for controlling development within the floodplain. The county has established an ordinance intended to reduce future flood losses through control of buildings and other land uses within floodplains. The Flood Plain Combining Zone Ordinance establishes two new zoning classifications called the Floodway District and the Floodway Fringe District (Reference 9). Clark County requires building permits for all proposed construction and reviews those permits to assure that sites are reasonably free from flooding.
3.0
For the flooding sources studied by detailed methods in the county, standard hydrologic and hydraulic study methods were used to determine the flood hazard data required for this study. Flood events of a magnitude that are expected to be equaled or exceeded once on the average during any 10-, 50-, 100-, or 500-year period (recurrence interval) have been selected as having special significance for floodplain management and for flood insurance rates. These events, commonly termed the 10-, 50-, 100-, and 500-year floods, have a 10-, 2-, 1-, and 0.2-percent-annual-chance, respectively, of being equaled or exceeded during any year. Although the recurrence interval represents the long-term, average period between floods of a specific magnitude, rare floods could occur at short intervals or even within the same year. The risk of experiencing a rare flood increases when periods greater than 1 year are considered. For example, the risk of having a flood that equals or exceeds the 1-percent-annual-chance (100-year) flood in any 50-year period is approximately 40 percent (4 in 10); for any 90-year period, the risk increases
ENGINEERING METHODS

8
to approximately 60 percent (6 in 10). The analyses reported herein reflect flooding potentials based on conditions existing in the community at the time of completion of this study. Maps and flood elevations will be amended periodically to reflect future changes. 3.1 Hydrologic Analyses
Hydrologic analyses were carried out to establish the peak discharge frequency relationships affecting the community for each flooding source studied in detail, except the Columbia River. The stage discharge relationship on the Columbia River is influenced by ocean tides and Willamette River backwater; thus, flood frequencies are more reliably determined for river stages than for discharges. Stage-frequency curves for seven locations on the Columbia River between RM 50 and RM 123 were developed using existing data (References 10 and 11) for fall-winter, and spring-summer flood seasons. Those locations include USGS gage No. 14144700 on the Columbia River at Vancouver, Washington (Reference 12), and USGS gage No. 1421172 on Willamette River at the Morrison Street Bridge (Reference 13). Both gages were established in 1876 (References 14 and 15). The fall and winter curves and spring and summer curves at each location were combined by statistical methods to obtain combined stage-frequency curves. Those stage-frequency curves are the basis for the Columbia River flood profiles presented in this study. The discharges used in floodway computations for the Columbia River were correlated, based on data at USGS gage No. 14105700 (established in 1857) at The Dalles, Washington (Reference 16), to yield water-surface profiles similar to those prepared using the combined stage-frequency curves. The Lewis River stream gage records were statistically analyzed using the standard Log-Pearson Type III distribution, as outlined by the U.S. Water Resources Council (Reference 17). Natural and regulated discharge-frequency curves were developed for the USGS gages at Ariel and Amboy, using data from 1912 to 1978. Peak annual flows used in deriving the natural discharge-frequency curve were calculated by combining observed flows at the gage and by correlating with flow information for adjacent gaging stations in the Lewis River basin and working downstream to Merwin Dam. The regulated discharge-frequency relationship was developed by comparison of natural versus regulated discharges for six flood events in the basin. The regulated discharges for these floods were based on the PP&L plan of flood control operation, considering 70,000 acre-feet of flood control storage at Merwin Dam. The following streams and respective periods of USGS gaging records were analyzed in the same manner as the Lewis River, the Washougal River, from 1944 to 1978; and the East Fork Lewis River, from 1929 to 1974. Lake River and Vancouver Lake are submerged by the Columbia River during large floods; therefore, the hydrologic analysis of the Columbia River includes the Lake River and Vancouver Lake. Stream gage records were not available for the Gee Creek basin (Gee Creek and Unnamed Tributary to Gee Creek). Rain gage recordings were used to estimate precipitation frequencies for selected recurrence intervals used in this study. The USACE HEC-l flood hydrograph computer program (Reference 18) was then used to develop peak discharges.

9
Burnt Bridge Creek discharge-frequency data were based on records from the USGS crest stage gage at RM 2.9 and on an analysis of rainfall and runoff characteristics of Burnt Bridge Creek basin and the general region. A discharge-frequency curve was developed for Cedar Creek basin using 21 years of recorded data at the USGS gage on Cedar Creek near Ariel and discharges obtained using the regional method presented in Procedure for Determination of Maximum Annual Flood Peak and Volume Frequencies for Portland District
(Reference 29). That report utilizes multiple regression analysis to determine discharges of an ungaged basin for selected recurrence intervals using the drainage area and normal annual precipitation. Cedar Creek basin includes Cedar Creek, Chelatchie Creek, and Unnamed Tributary to Chelatchie Creek.
Flood flow frequencies for Salmon Creek, Curtin Creek, Mill Creek, Weaver Creek and Morgan Creek were based on a statistical analysis of the results of a long-term simulation using the Hydrological Simulation Program Fortran (HSPF) computer program. The HSPF program is a continuous rainfall-runoff watershed model. Continuous simulation of multiple years to several decades allows the watershed to be evaluated under a variety of flow conditions ranging from low summer base flows to periods of winter flooding. In particular, continuous modeling allows simulation of floods in response to a wide variety of individual storm characteristics and sequence of storm events. The development of the HSPF model for the Salmon Creek watershed is documented in Hydrologic Analysis of Salmon Creek Watershed using the HSPF Model
(Reference 20). The model results at various locations within the watershed were analyzed in accordance with criteria outlined in Bulletin 17B (Interagency Advisory Committee on Water Data, 1982). Discharge-frequency data were computed using the HEC-FFA computer program (HEC 1992) developed by the Hydrologic Engineering Center of the USACE, using a systematic record of 61 years.
A discharge-frequency curve was developed for Spring Branch Creek, Mud Creek, Whipple Creek, and China Ditch using the regional method presented in Magnitude and Frequency Flood in Washington
(Reference 21). That report utilizes multiple regression analyses to determine discharges of an ungaged basin for selected recurrence intervals using drainage area and normal annual precipitation data.
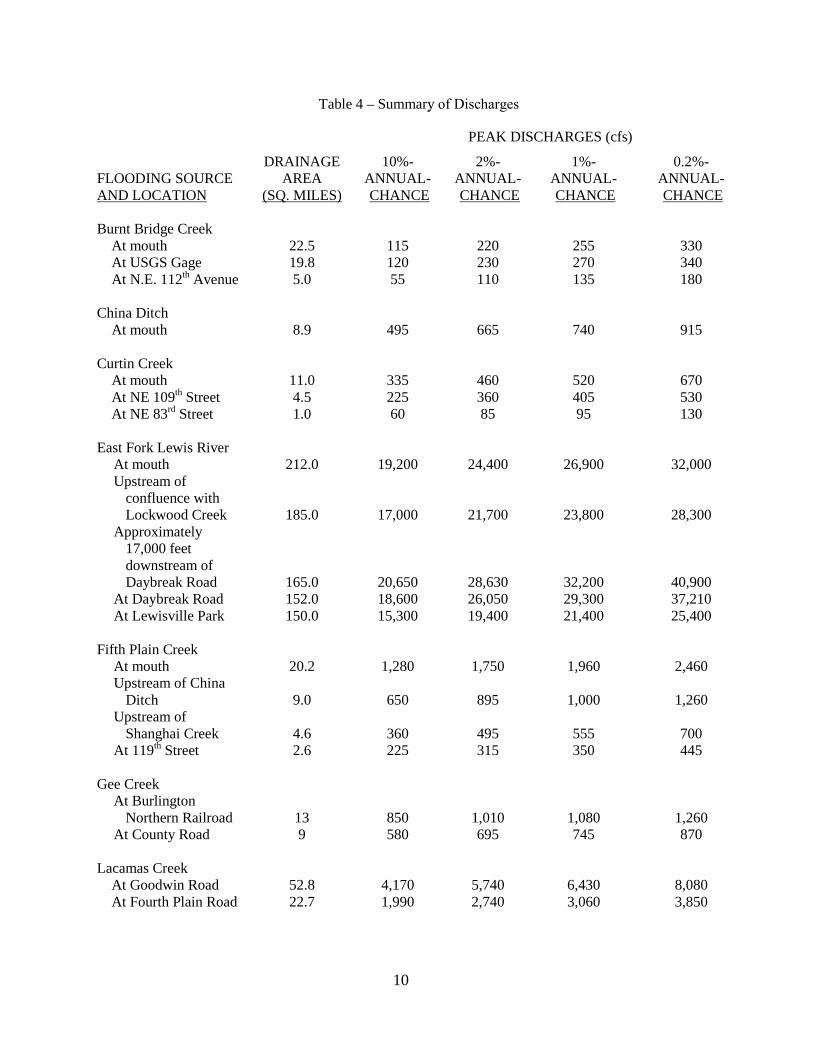
The discharge-frequency data for the Little Washougal River, Fifth Plain Creek, and Lacamas Creek and Lake were also determined using the regional method described in Reference 19. Peak discharge-drainage area relationships for the streams studied by detailed methods in Clark County are shown in Table 4, “Summary of Discharges”.
10
Table 4 – Summary of Discharges
PEAK DISCHARGES (cfs)
FLOODING SOURCE DRAINAGE
AREA AND LOCATION
10%- ANNUAL- (SQ. MILES)
2%- ANNUAL- CHANCE
1%- ANNUAL- CHANCE
0.2%- ANNUAL- CHANCE
CHANCE
Burnt Bridge Creek At mouth 22.5 115 220 255 330 At USGS Gage 19.8 120 230 270 340 At N.E. 112th Avenue 5.0 55 110 135 180 China Ditch At mouth 8.9 495 665 740 915 Curtin Creek At mouth 11.0 335 460 520 670 At NE 109th Street 4.5 225 360 405 530 At NE 83rd Street 1.0 60 85 95 130 East Fork Lewis River
At mouth 212.0 19,200 24,400 26,900 32,000 Upstream of
confluence with Lockwood Creek 185.0 17,000 21,700 23,800 28,300
Approximately 17,000 feet downstream of Daybreak Road 165.0 20,650 28,630 32,200 40,900
At Daybreak Road 152.0 18,600 26,050 29,300 37,210 At Lewisville Park 150.0 15,300 19,400 21,400 25,400
Fifth Plain Creek
At mouth 20.2 1,280 1,750 1,960 2,460 Upstream of China
Ditch 9.0 650 895 1,000 1,260 Upstream of
Shanghai Creek 4.6 360 495 555 700 At 119th Street 2.6 225 315 350 445
Gee Creek
At Burlington Northern Railroad 13 850 1,010 1,080 1,260
At County Road 9 580 695 745 870 Lacamas Creek At Goodwin Road 52.8 4,170 5,740 6,430 8,080 At Fourth Plain Road 22.7 1,990 2,740 3,060 3,850

11
Table 4 – Summary of Discharges (Continued)
PEAK DISCHARGES (cfs)
FLOODING SOURCE DRAINAGE
AREA AND LOCATION
10%- ANNUAL- (SQ. MILES)
2%- ANNUAL- CHANCE
1%- ANNUAL- CHANCE
0.2%- ANNUAL- CHANCE
CHANCE
Lewis River
At mouth 1046 75,0001 114,0001 132,7001 181,0001 At Woodland 820 54,4001 86,3001 102,0001 142,0001 At USGS Gage near
Ariel 731 49,0001 79,0001 94,0001 132,0001 Mill Creek
At mouth 11.5 670 985 1,140 1,570 Downstream of
Unnamed Tributary (RM 0.85) 11.0 595 865 1,000 1,370
Upstream of Unnamed Tributary (RM 0.85) 9.1 510 780 915 1,300
At confluence with Unnamed Tributary (RM 3.12) 6.7 285 585 685 975
At NE 199th Street 4.8 290 415 480 655 Packard Creek
At mouth 2.4 135 180 200 250 Upstream of
Unnamed Tributary (RM 1.0) 0.6 43 58 64 79
Padden Creek
At confluence with Curtin Creek 1.0 39 45 48 53
Downstream of NE 76th Street 0.8 212 212 222 222
At Interstate 205 0.7 43 57 64 79 Salmon Creek
At mouth 88.0 3,230 4,460 5,020 6,490 At County Gage
SMN020, Klineline Park 80.0 2,970 4,100 4,620 5,970
Below Mill Creek 72.0 2,710 3,730 4,210 5,430 Downstream of
Confluence with Curtin Creek 60.0 2,330 3,250 3,700 4,860
1 Regulated by Merwin Dam 2 Maximum flow passing NE 76th Street Culvert. Additional flow is diverted out of the basin by NE 76th Street

12
Table 4 – Summary of Discharges (Continued)
PEAK DISCHARGES (cfs)
FLOODING SOURCE DRAINAGE
AREA AND LOCATION
10%- ANNUAL- (SQ. MILES)
2%- ANNUAL- CHANCE
1%- ANNUAL- CHANCE
0.2%- ANNUAL- CHANCE
CHANCE
Salmon Creek
(Continued) At County Gage
SMN045, NE 156th Street 45.0 1,960 2,740 3,110 4,090
Downstream of Confluence with Morgan Creek 31.0 1,290 1,920 2,240 3,140
At County Gage S-01, Battle Ground, WA 18.0 1,130 1,770 2,110 3,120
Spring Branch Creek At mouth 1.8 105 140 155 190 Unnamed Tributary to Gee Creek At mouth 1.7 85 100 105 125 Washougal River
At mouth 168 29,800 39,000 43,000 51,900 At USGS Gage (RM
9.2) 108 21,500 28,400 31,300 38,000 Weaver Creek
At mouth 7.1 350 495 565 755 At NE 199th Street 5.9 310 440 500 665 Upstream of
Unnamed Tributary (RM 3.45) 4.4 225 330 385 535
At NE 167th Ave 1.5 85 125 150 205 Whipple Creek
At mouth 11.1 510 685 755 925 Upstream of
Unnamed Tributary (RM 1.19) 9.5 450 600 665 815
Upstream of Packard Creek (RM 2.47) 6.4 320 430 475 580
Upstream of NE 157th Ave (RM 4.53) 4.5 240 320 355 435

13
Table 4 – Summary of Discharges (Continued)
PEAK DISCHARGES (cfs)
FLOODING SOURCE DRAINAGE
AREA AND LOCATION
10%- ANNUAL- (SQ. MILES)
2%- ANNUAL- CHANCE
1%- ANNUAL- CHANCE
0.2%- ANNUAL- CHANCE
CHANCE
Whipple Creek
(Continued) Upstream of
Interstate 5 Freeway (RM 6.45) 1.9 115 150 170 210
Upstream of NE 179th Street (RM 7.74) 0.9 55 75 85 110
At mouth 168 29,800 39,000 43,000 51,900 At USGS Gage (RM
9.2) 108 21,500 28,400 31,300 38,000 Weaver Creek
At mouth 7.1 350 495 565 755 At NE 199th Street 5.9 310 440 500 665 Upstream of
Unnamed Tributary (RM 3.45) 4.4 225 330 385 535
At NE 167th Ave 1.5 85 125 150 205 Whipple Creek
At mouth 11.1 510 685 755 925 Upstream of
Unnamed Tributary (RM 1.19) 9.5 450 600 665 815
Upstream of Packard Creek (RM 2.47) 6.4 320 430 475 580
Upstream of NE 157th Ave (RM 4.53) 4.5 240 320 355 435
Upstream of Interstate 5 Freeway (RM 6.45) 1.9 115 150 170 210
Upstream of NE 179th Street (RM 7.74) 0.9 55 75 85 110
3.2 Hydraulic Analyses
Hydraulic analyses, considering storm characteristics and the shoreline and bathymetric characteristics of the flooding source studied, were carried out to provide estimates of the elevations of floods of the selected recurrence intervals along the shoreline. Users should be aware that flood elevations shown on the FIRM represent rounded whole-foot elevations and may not exactly reflect the elevations shown on the Flood Profiles or in the Floodway Data tables in the FIS report. Flood elevations shown on the FIRM are primarily intended for flood insurance rating purposes. For construction and/or floodplain management
14
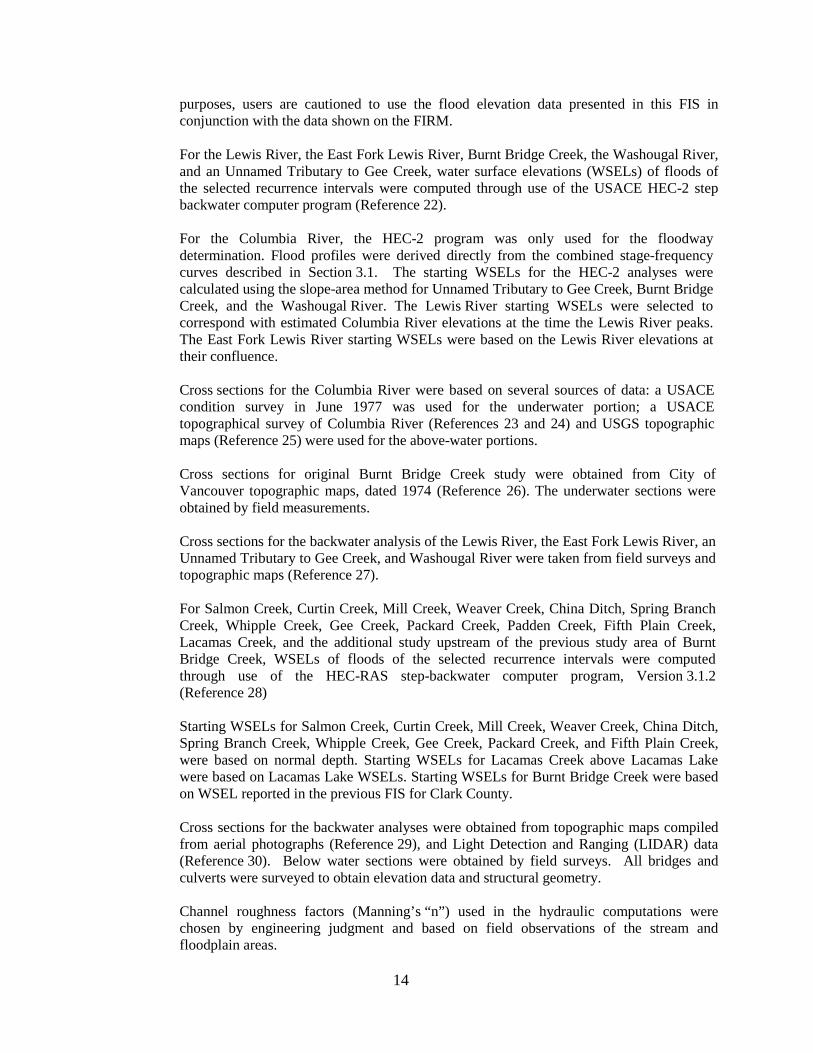
purposes, users are cautioned to use the flood elevation data presented in this FIS in conjunction with the data shown on the FIRM. For the Lewis River, the East Fork Lewis River, Burnt Bridge Creek, the Washougal River, and an Unnamed Tributary to Gee Creek, water surface elevations (WSELs) of floods of the selected recurrence intervals were computed through use of the USACE HEC-2 step backwater computer program (Reference 22). For the Columbia River, the HEC-2 program was only used for the floodway determination. Flood profiles were derived directly from the combined stage-frequency curves described in Section 3.1. The starting WSELs for the HEC-2 analyses were calculated using the slope-area method for Unnamed Tributary to Gee Creek, Burnt Bridge Creek, and the Washougal River. The Lewis River starting WSELs were selected to correspond with estimated Columbia River elevations at the time the Lewis River peaks. The East Fork Lewis River starting WSELs were based on the Lewis River elevations at their confluence. Cross sections for the Columbia River were based on several sources of data: a USACE condition survey in June 1977 was used for the underwater portion; a USACE topographical survey of Columbia River (References 23 and 24) and USGS topographic maps (Reference 25) were used for the above-water portions. Cross sections for original Burnt Bridge Creek study were obtained from City of Vancouver topographic maps, dated 1974 (Reference 26). The underwater sections were obtained by field measurements. Cross sections for the backwater analysis of the Lewis River, the East Fork Lewis River, an Unnamed Tributary to Gee Creek, and Washougal River were taken from field surveys and topographic maps (Reference 27). For Salmon Creek, Curtin Creek, Mill Creek, Weaver Creek, China Ditch, Spring Branch Creek, Whipple Creek, Gee Creek, Packard Creek, Padden Creek, Fifth Plain Creek, Lacamas Creek, and the additional study upstream of the previous study area of Burnt Bridge Creek, WSELs of floods of the selected recurrence intervals were computed through use of the HEC-RAS step-backwater computer program, Version 3.1.2 (Reference 28) Starting WSELs for Salmon Creek, Curtin Creek, Mill Creek, Weaver Creek, China Ditch, Spring Branch Creek, Whipple Creek, Gee Creek, Packard Creek, and Fifth Plain Creek, were based on normal depth. Starting WSELs for Lacamas Creek above Lacamas Lake were based on Lacamas Lake WSELs. Starting WSELs for Burnt Bridge Creek were based on WSEL reported in the previous FIS for Clark County. Cross sections for the backwater analyses were obtained from topographic maps compiled from aerial photographs (Reference 29), and Light Detection and Ranging (LIDAR) data (Reference 30). Below water sections were obtained by field surveys. All bridges and culverts were surveyed to obtain elevation data and structural geometry. Channel roughness factors (Manning’s “n”) used in the hydraulic computations were chosen by engineering judgment and based on field observations of the stream and floodplain areas.

15
Roughness factors for each stream studied in detail are listed in Table 5. Shallow flooding areas were determined using engineering judgment, aerial photographs (Reference 29), and topographic maps (Reference 25).
Table 5 – Manning’s “n” Values
STREAM CHANNEL “n” Burnt Bridge Creek
OVERBANK “n”
From City of Vancouver corporate limits to approximately 0.22 mile upstream of Northeast 152nd Avenue 0.024 to 0.07 0.045 to 0.12
From downstream face of I-205 culvert to approximately 1 mile upstream of Northeast 137th Avenue 0.04 to 0.050 0.050 to 0.120
China Ditch 0.035 to 0.040 0.030 to 0.060 Curtin Creek 0.038 to 0.065 0.040 to 0.100 East Fork Lewis River 0.032 to 0.070 0.020 to 0.107 Fifth Plain Creek 0.040 to 0.060 0.037 to 0.120 Gee Creek 0.045 to 0.080 0.050 to 0.120 Lacamas Creek 0.045 to 0.055 0.050 to 0.150 Lewis River 0.032 to 0.047 0.058 to 0.100 Mill Creek 0.040 to 0.080 0.035 to 0.100 Packard Creek 0.050 to 0.080 0.050 to 0.120 Padden Creek 0.040 to 0.060 0.040 to 0.070 Salmon Creek 0.040 to 0.070 0.055 to 0.150 Spring Branch Creek 0.045 to 0.060 0.050 to 0.100 Unnamed Tributary to Gee Creek 0.050 0.080 to 0.120 Washougal River 0.030 to 0.070 0.050 to 0.157 Weaver Creek 0.040 to 0.090 0.040 to 0.100 Whipple Creek 0.050 to 0.120 0.050 to 0.150 The Columbia River controls the flooding on Vancouver Lake. The Columbia River 1-percent-annual-chance flood elevation is 26.7 feet at Blue Rock Landing. The effect of increasing the elevation of the 1-percent-annual-chance flood on Vancouver Lake at this point is minimal due to a 0.5 foot head loss from Columbia River to Vancouver Lake. Elevations for approximate 1-percent-annual-chance flood area of Little Matney Creek, Matney Creek, Morgan Creek, Mud Creek, and Shanghai Creek were developed using HEC-RAS program and information from aerial photographs and LiDAR data. (Reference 54)
16
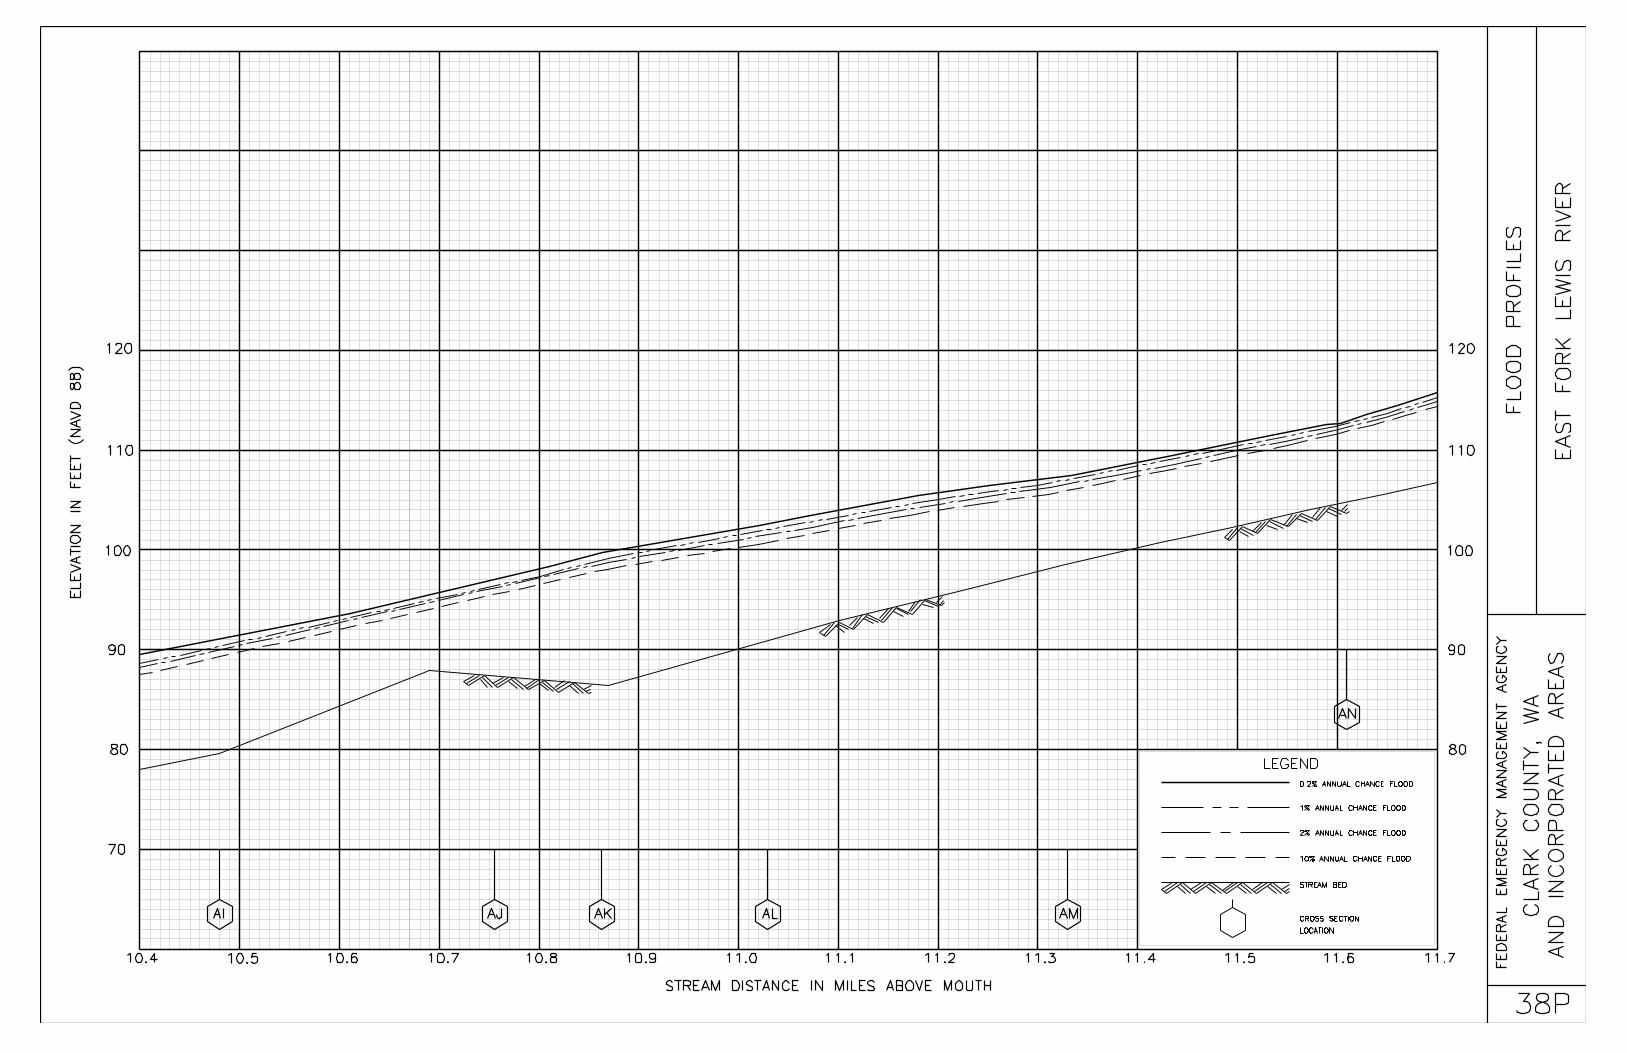
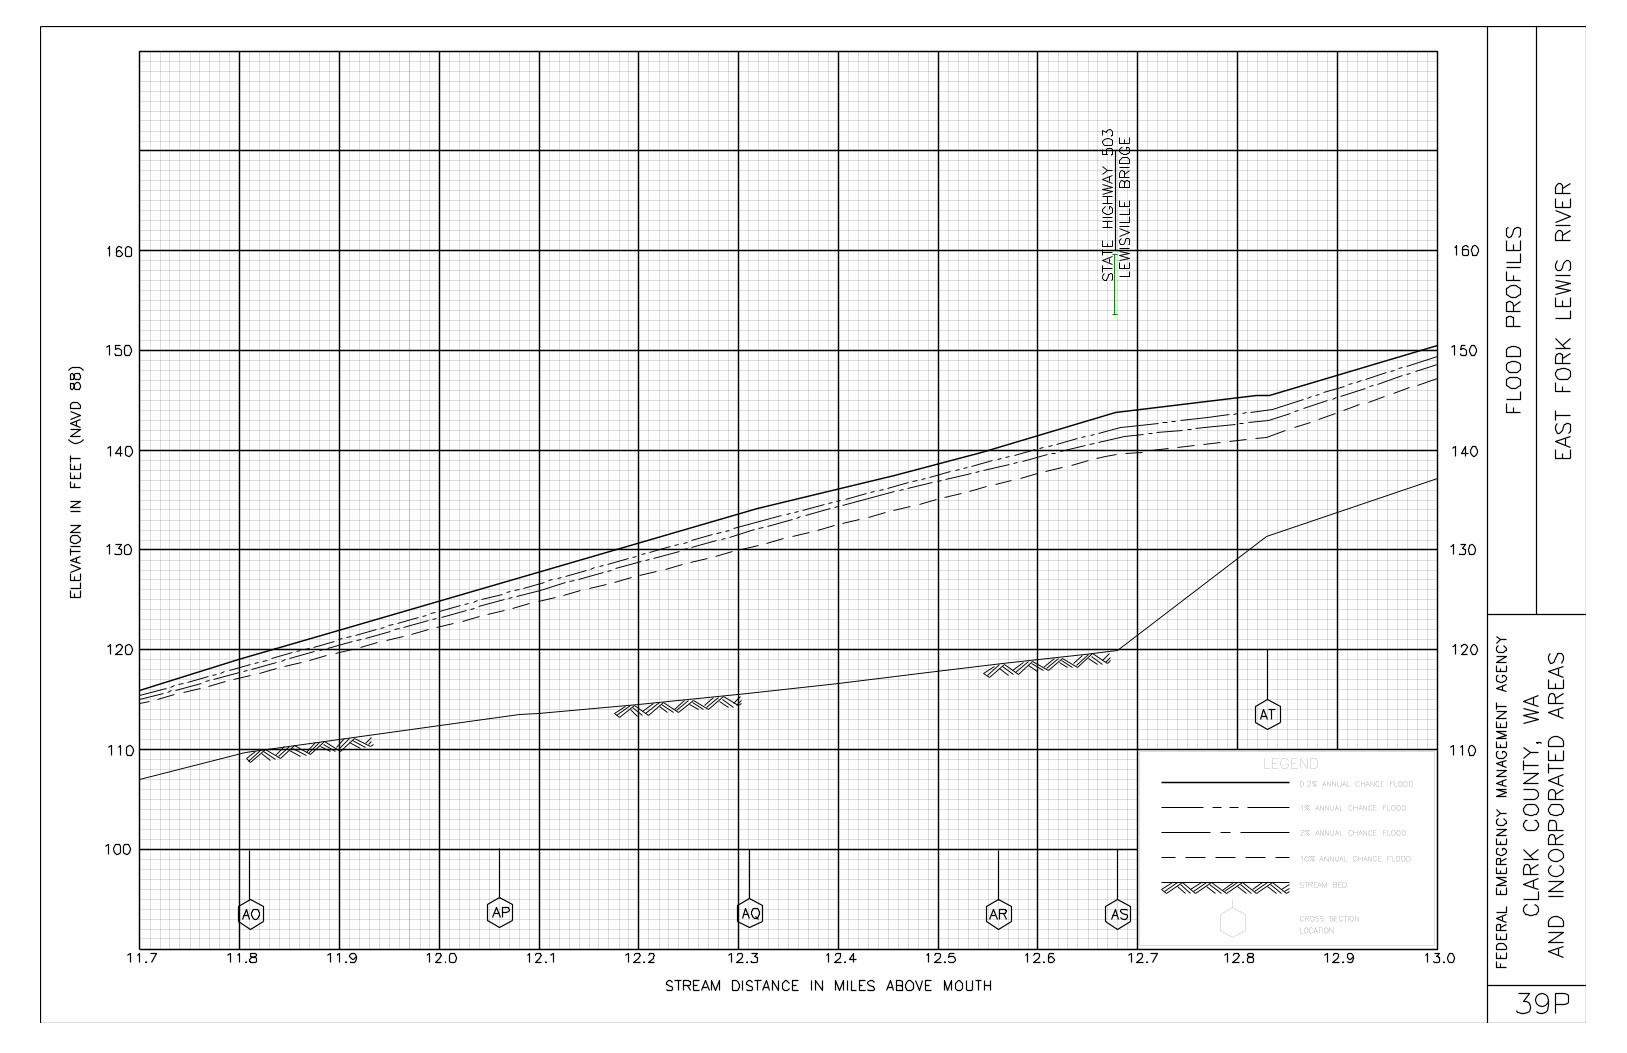
Elevations for the other approximate 1-percent-annual-chance flood areas were developed using information from local residents, county officials, using LiDAR data supplied by Clark County GIS department (Reference 54), and USGS topographic maps (Reference 25). Field surveys were conducted in critical areas. Locations of selected cross sections used in the hydraulic analyses are shown on the Flood Profiles. For stream segments for which a floodway was computed (Section 4.2), selected cross-section locations are also shown on the FIRM. The hydraulic analyses for this study were based on unobstructed flow. The flood elevations shown on the Flood Profiles are considered valid only if hydraulic structures remain unobstructed, operate properly, and do not fail.
3.3 Vertical Datum
All FIS reports and FIRMs are referenced to a specific vertical datum. The vertical datum provides a starting point against which flood, ground, and structure elevations can be referenced and compared. Until recently, the standard vertical datum used for newly created or revised FIS reports and FIRMs was the NGVD29. With the completion of the NAVD88, many FIS reports and FIRMs are now prepared using NAVD88 as the referenced vertical datum. Flood elevations shown in this FIS report and on the FIRM are referenced to the NAVD88. These flood elevations must be compared to structure and ground elevations referenced to the same vertical datum. For information regarding conversion between the NGVD29 and NAVD88, visit the National Geodetic Survey (NGS) website at www.ngs.noaa.gov, or contact the NGS at the following address:
NGS Information Services, NOAA, N/NGS12 National Geodetic Survey SSMC-3, #9202 1315 East-West Highway Silver Spring, MD 20910-3282 Fax: (301) 713-4172, or Telephone: (301) 713-3242
The conversion factor from NGVD29 to NAVD88 for all streams in this report except the Columbia River is +3.5 feet. The conversion for the detailed study areas of the Columbia River within Clark County is NGVD29 + 3.3 feet = NAVD88. Temporary vertical monuments are often established during the preparation of a flood hazard analysis for the purpose of establishing local vertical control. Although these monuments are not shown on the FIRM, they may be found in the Technical Support Data Notebook associated with the FIS report and FIRM for this community. Interested individuals may contact FEMA to access these data.
4.0
The NFIP encourages State and local governments to adopt sound floodplain management programs. Therefore, each FIS provides 1-percent-annual-chance (100-year) flood elevations and delineations of the 1- and 0.2-percent-annual-chance (500-year) floodplain boundaries and 1-
FLOODPLAIN MANAGEMENT APPLICATIONS

17
percent-annual-chance floodway to assist communities in developing floodplain management measures. This information is presented on the FIRM and in many components of the FIS report, including Flood Profiles and Floodway Data Table. Users should reference the data presented in the FIS report as well as additional information that may be available at the local map repository before making flood elevation and/or floodplain boundary determinations. 4.1 Floodplain Boundaries
To provide a national standard without regional discrimination, the 1-percent-annual-chance flood has been adopted by FEMA as the base flood for floodplain management purposes. The 0.2-percent-annual-chance flood is employed to indicate additional areas of flood risk in the community. For each stream studied by detailed methods, the 1- and 0.2-percent-annual-chance floodplain boundaries have been delineated using the flood elevations determined at each cross section. Between cross sections, the boundaries were interpolated using topographic maps with a contour interval of 2 feet (Reference 31). The 1- and 0.2-percent-annual-chance floodplain boundaries are shown on the FIRM. On this map, the 1-percent-annual-chance floodplain boundary corresponds to the boundary of the areas of special flood hazards (Zones A, AE, and AH), and the 0.2-percent-annual-chance floodplain boundary corresponds to the boundary of areas of moderate flood hazards. In cases where the 1- and 0.2-percent-annual-chance floodplain boundaries are close together, only the 1-percent-annual-chance floodplain boundary has been shown. Small areas within the floodplain boundaries may lie above the flood elevations, but cannot be shown due to limitations of the map scale and/or lack of detailed topographic data. For the streams studied by approximate methods, only the 1-percent-annual-chance floodplain boundary is shown on the FIRM. Approximate 1-percent-annual-chance floodplain boundaries in some portions of the study area were taken directly from the Flood Hazard Boundary Map for City of Camas, City of Vancouver, City of Washougal, Towns of Battle Ground, Town of La Center, Town of Ridgefield, Town of Yacolt; and Clark County (References 32-50). Base map information shown on this FIRM was provided in digital format by the USGS and dated July 15, 1990, or later. Non-revised floodplains were reviewed for accuracy in relation to this new base and re-fit where appropriate. In accordance with FEMA Memo 36, profile baselines have been put into all areas of detailed study. Profile baselines are shown in the location of the original work without regard to the redelineation or floodplain adjustment to the new base map. This is to maintain the relationship to the hydraulic models, floodway data tables, and profiles.
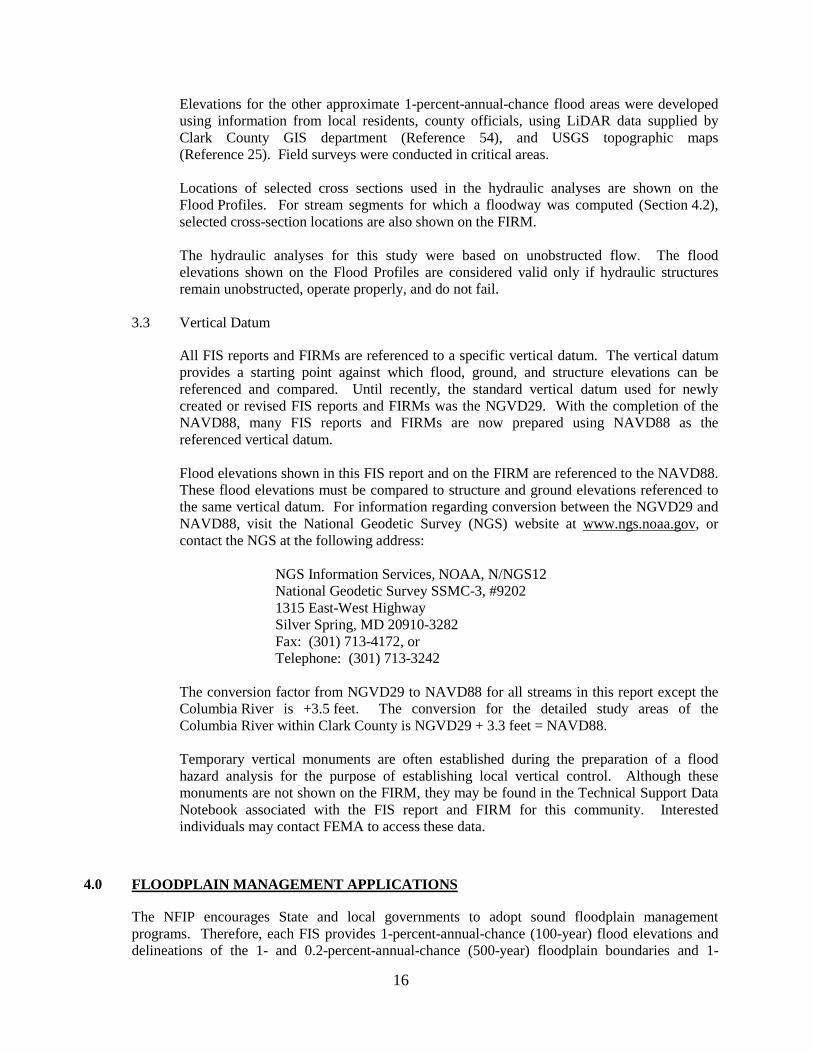
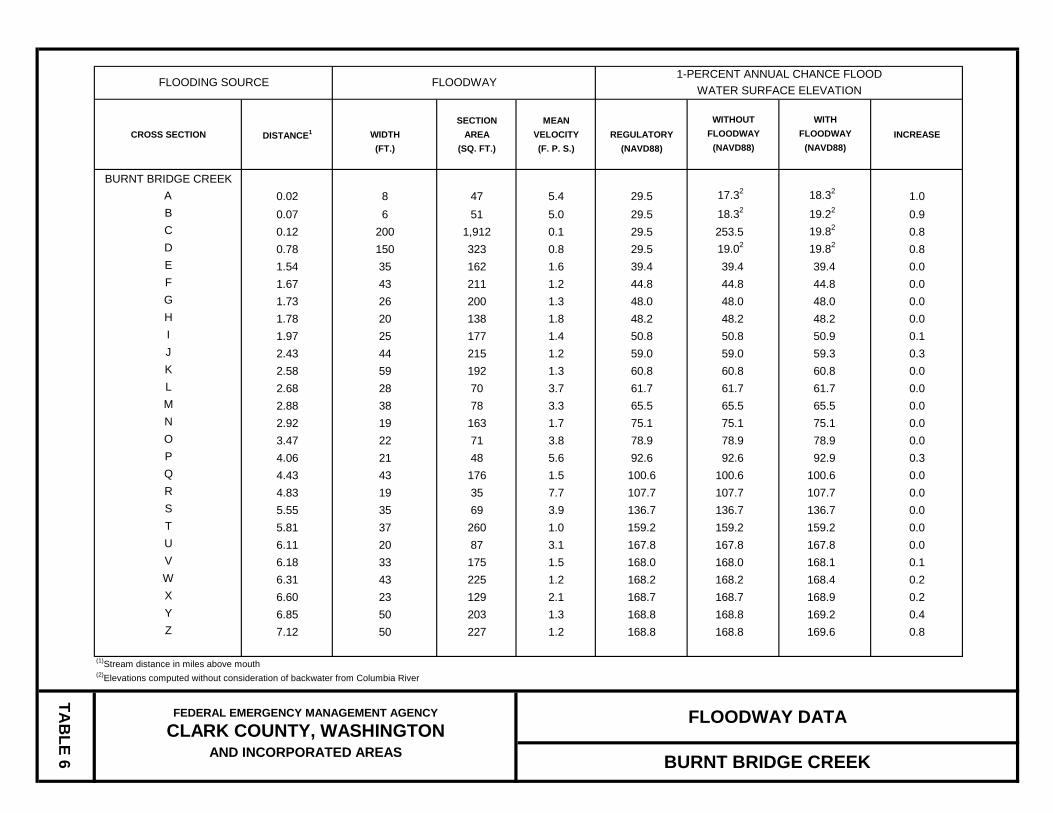
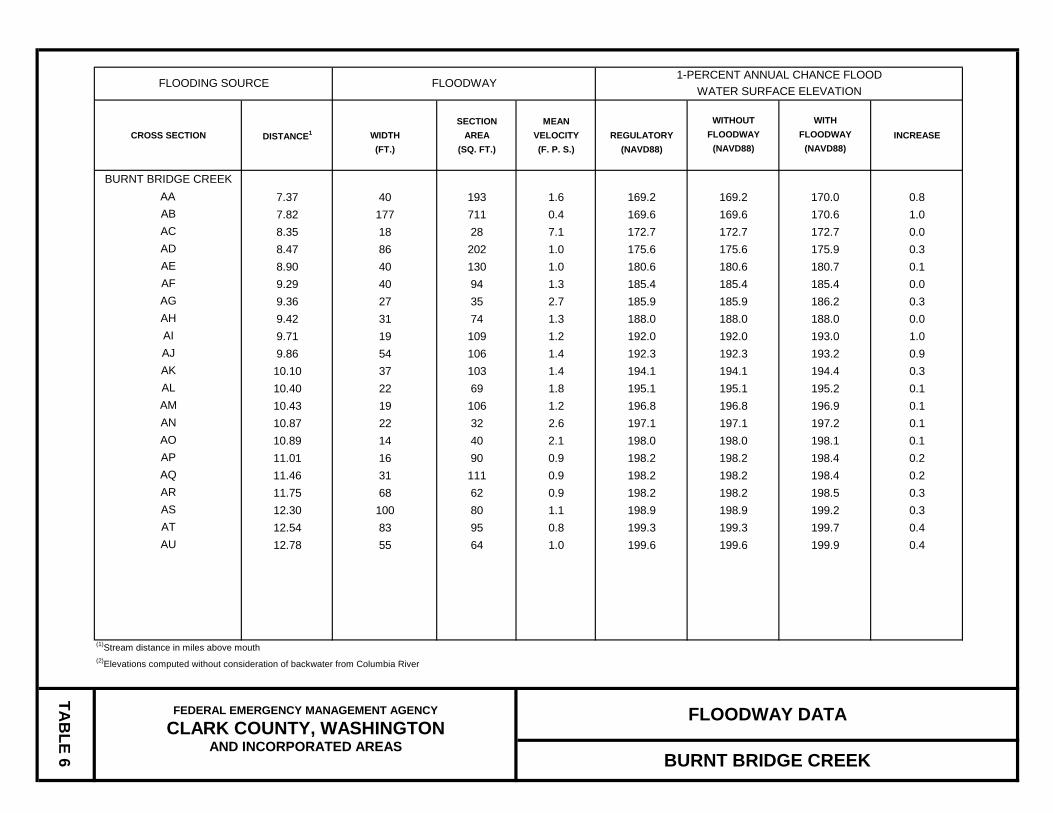
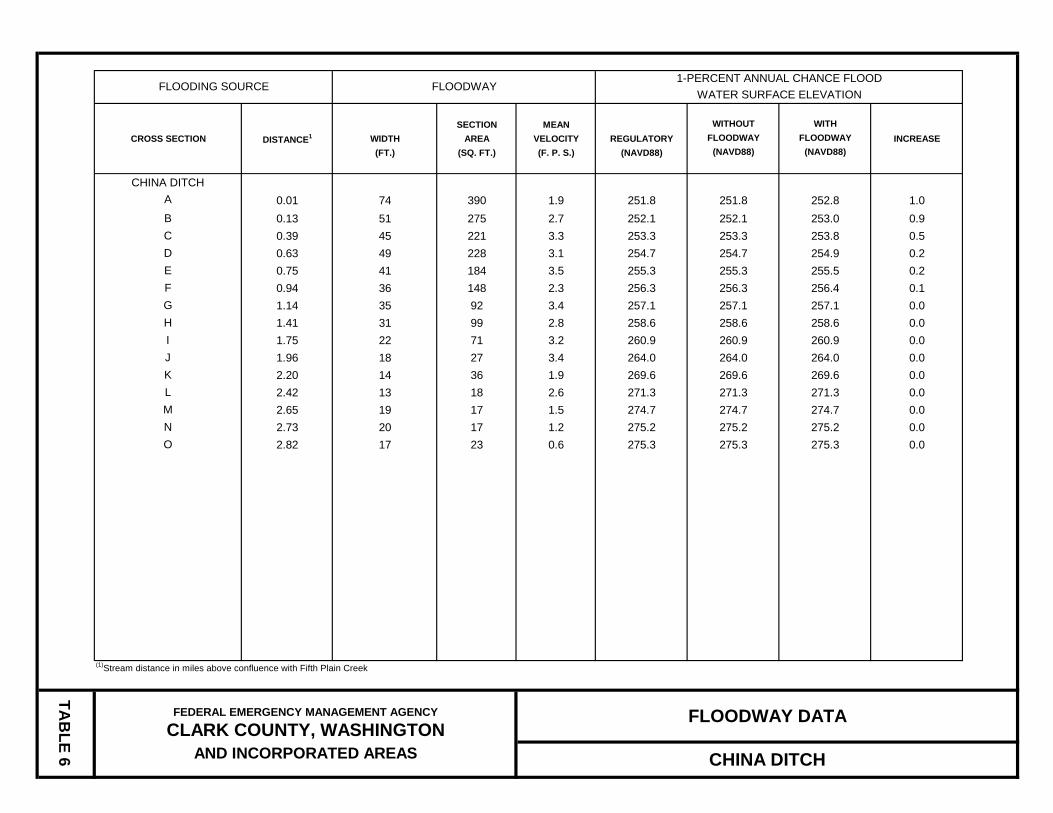
4.2 Floodways
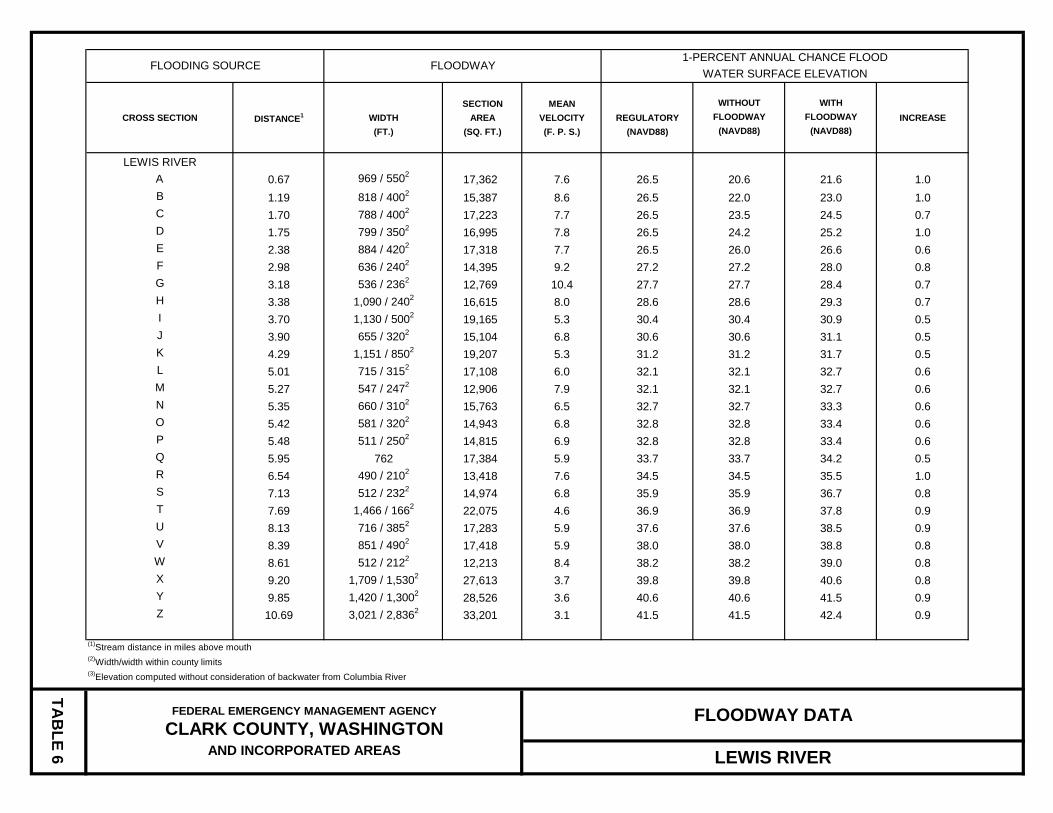
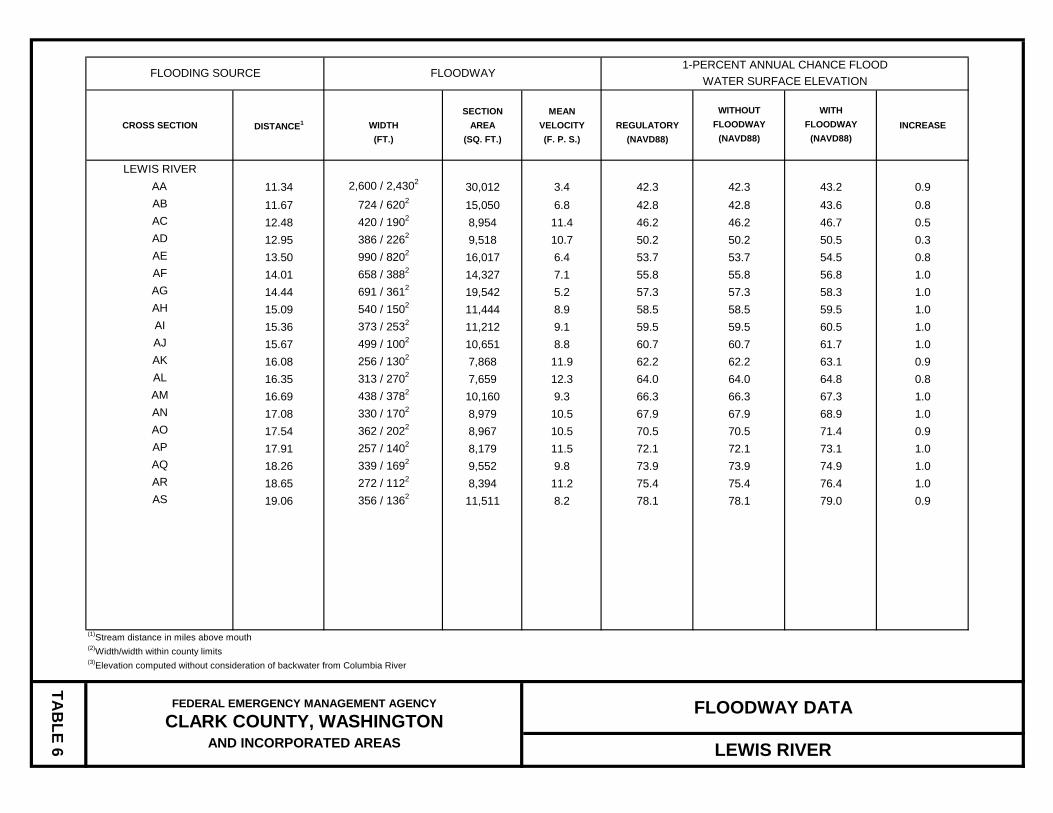
Encroachment on floodplains, such as structures and fill, reduces flood-carrying capacity, increases flood heights and velocities, and increases flood hazards in areas beyond the encroachment itself. One aspect of floodplain management involves balancing the economic gain from floodplain development against the resulting increase in flood hazard. For purposes of the NFIP, a floodway is used as a tool to assist local communities in this aspect of floodplain management. Under this concept, the area of the

18
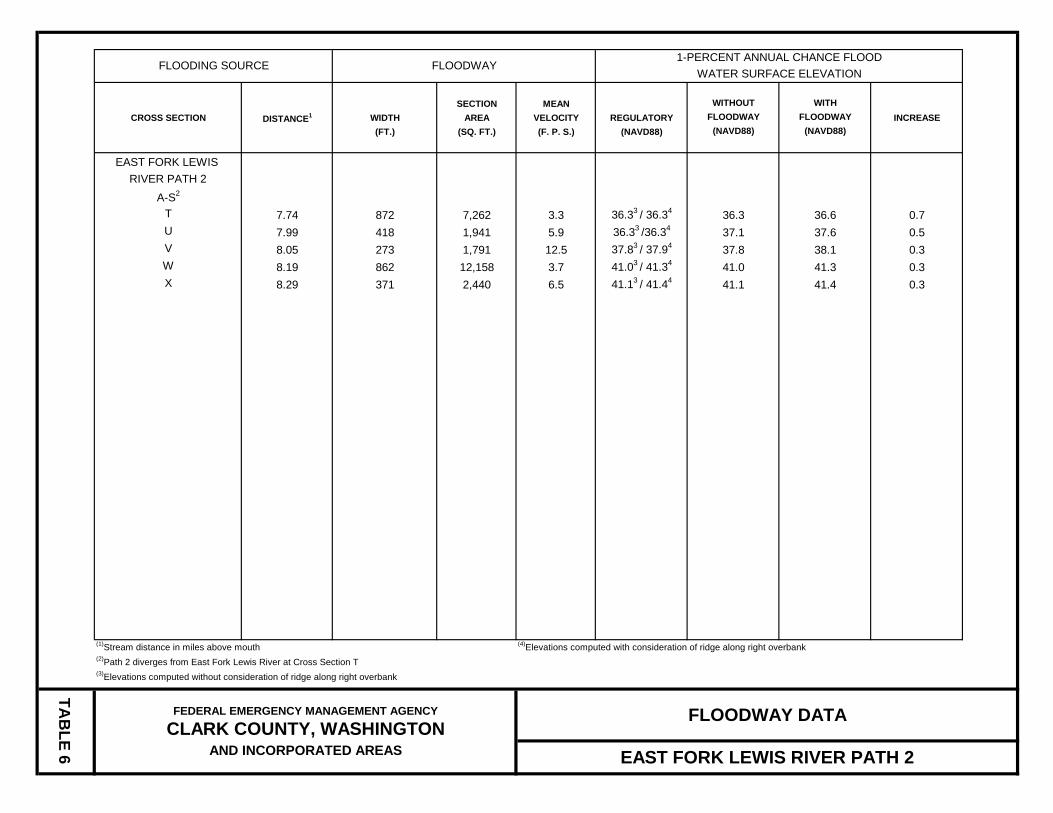
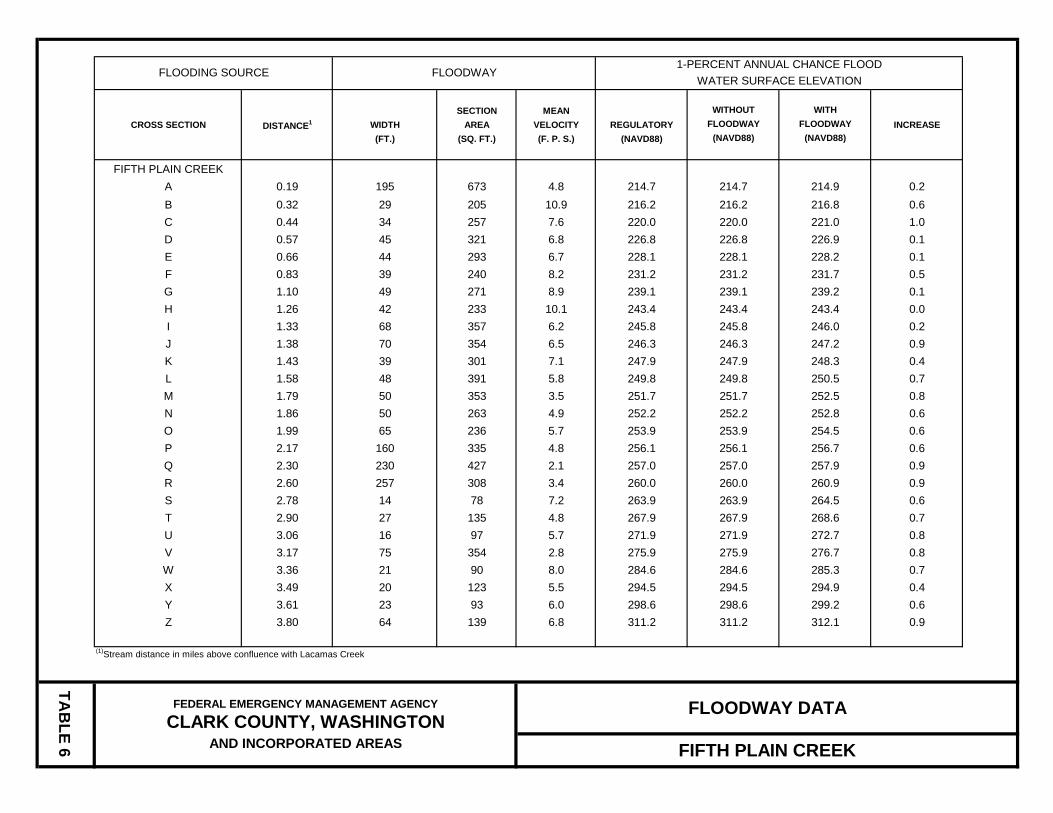
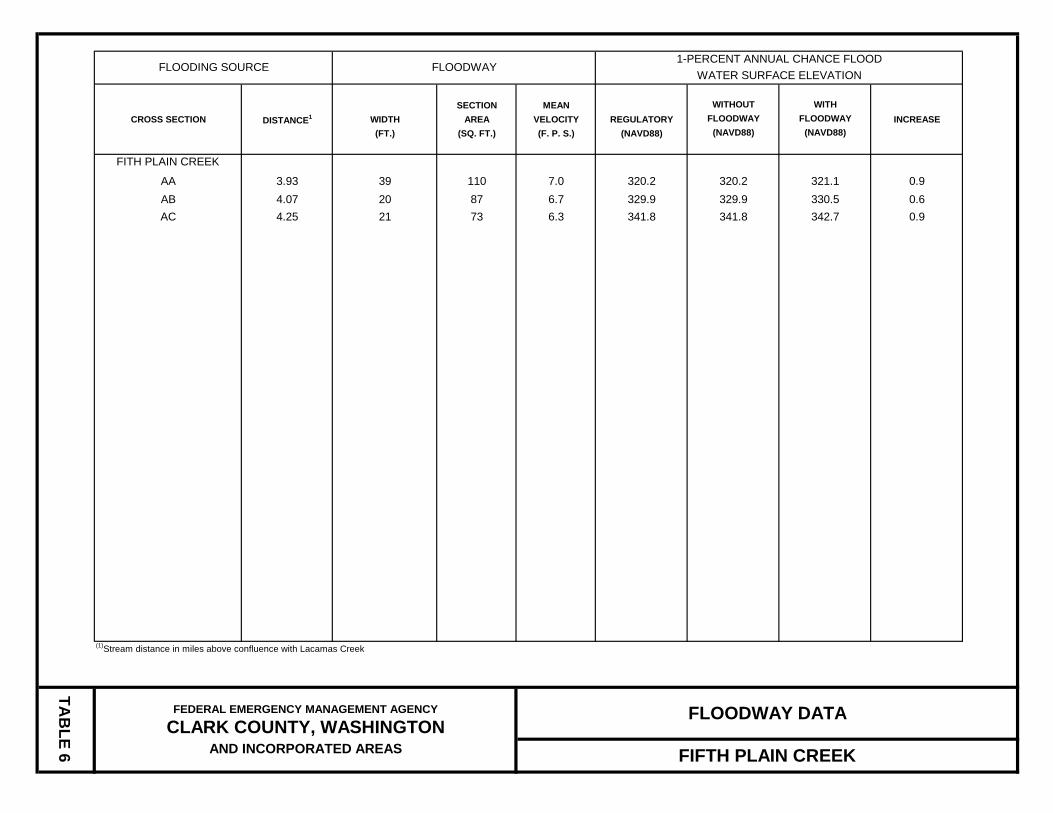
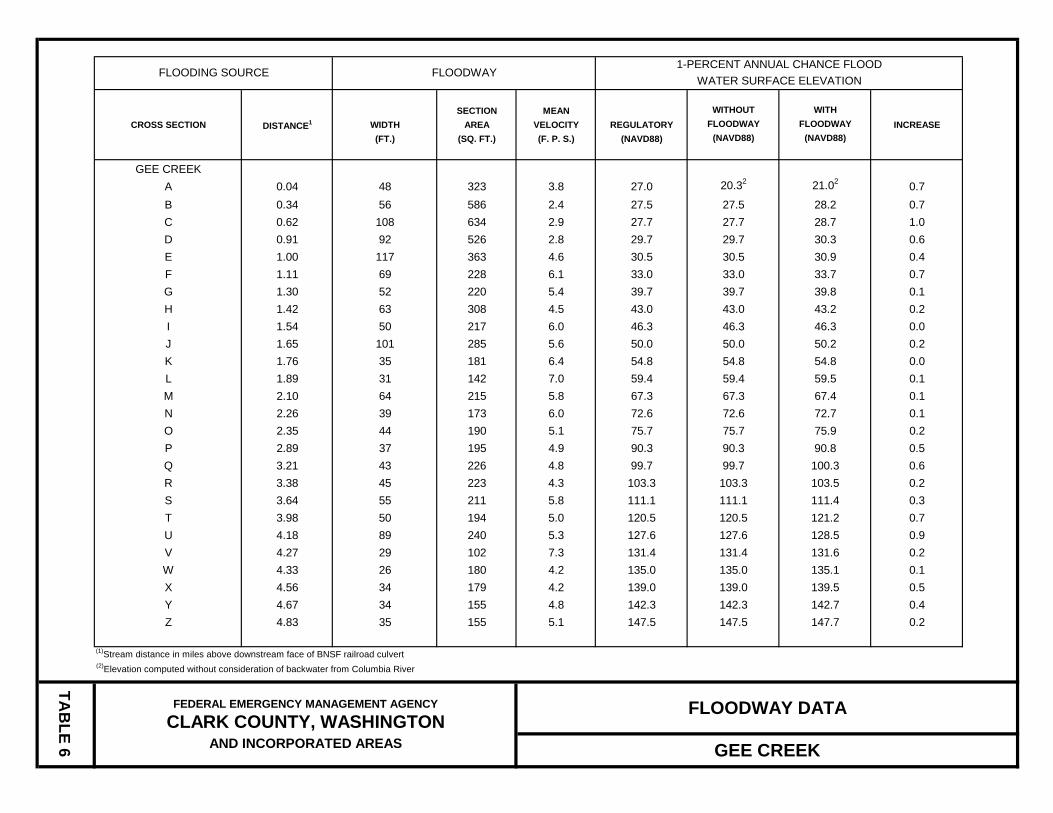
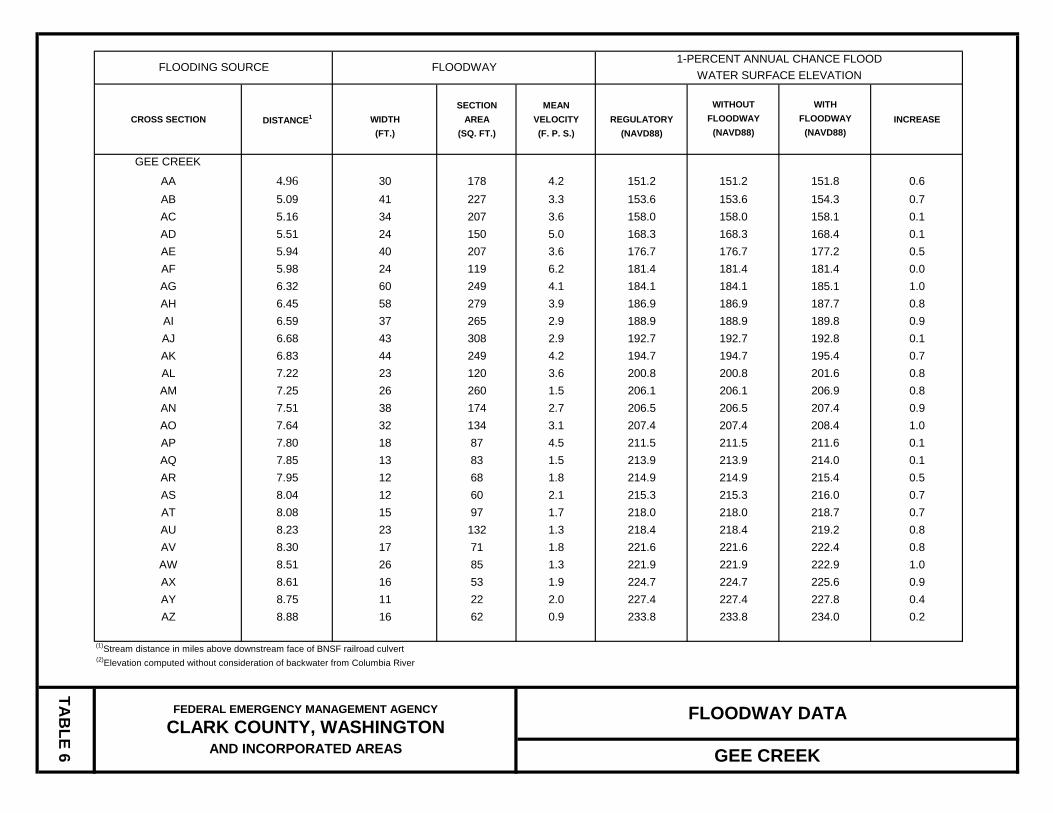
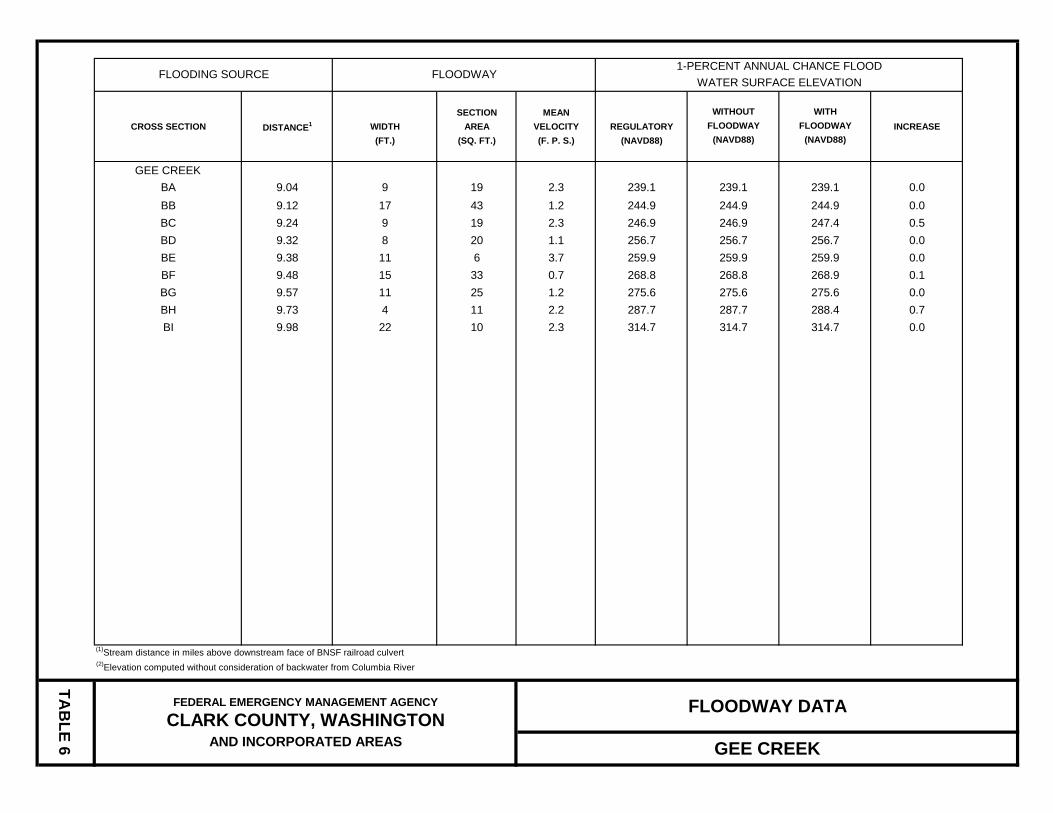
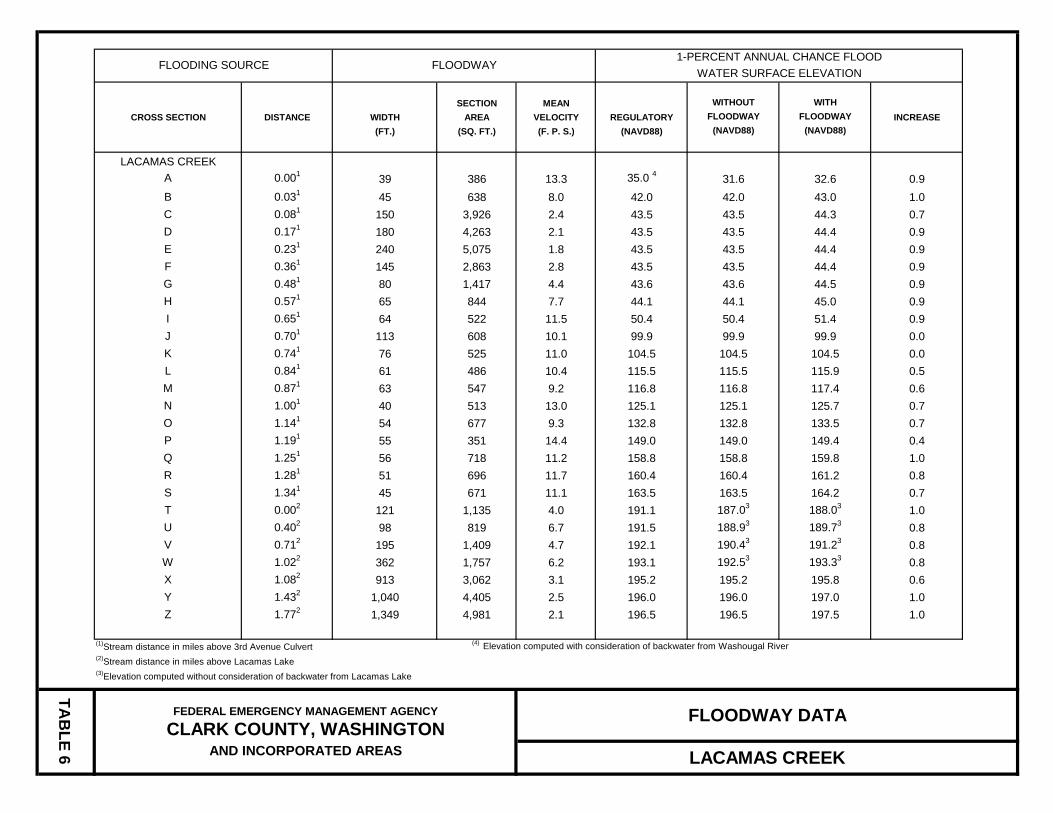
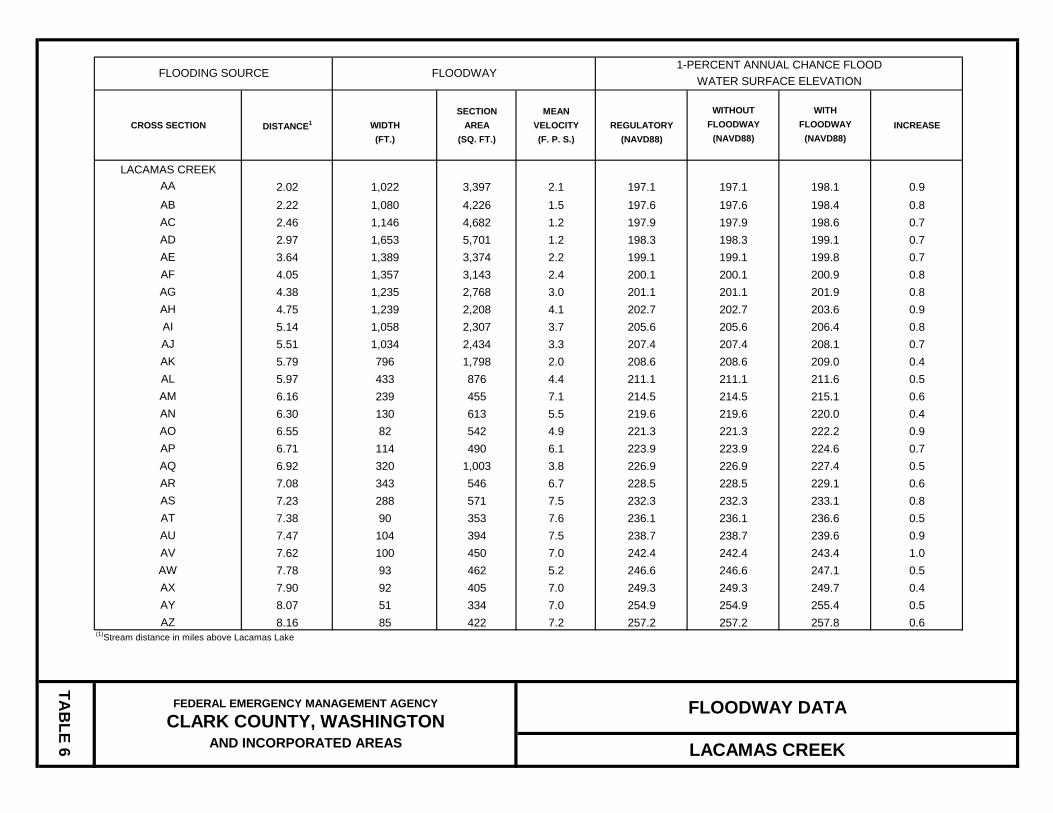
1-percent-annual-chance floodplain is divided into a floodway and a floodway fringe. The floodway is the channel of a stream, plus any adjacent floodplain areas, that must be kept free of encroachment so that the base flood can be carried without substantial increases in flood heights. Minimum Federal standards limit such increases to 1 foot, provided that hazardous velocities are not produced. The floodways in this study are presented to local agencies as minimum standards that can be adopted directly or that can be used as a basis for additional floodway studies. The floodways presented in this study were computed for certain stream segments on the basis of equal-conveyance reduction from each side of the floodplain. Floodway widths were computed at cross sections. Between cross sections, the floodway boundaries were interpolated. The results of the floodway computations are tabulated for selected cross sections (see Table 6, Floodway Data). In cases where the floodway and 1-percent-annual-chance floodplain boundaries are either close together or collinear, only the floodway boundary is shown. The area between the floodway and 1-percent-annual-chance floodplain boundaries is termed the floodway fringe. The floodway fringe encompasses the portion of the floodplain that could be completely obstructed without increasing the WSEL of the base flood more than 1 foot at any point. Typical relationships between the floodway and the floodway fringe and their significance to floodplain development are shown in Figure 1, “Floodway Schematic”.
Figure 1 – Floodway Schematic
SECTION MEAN WITHOUT WITHCROSS SECTION DISTANCE1 WIDTH AREA VELOCITY REGULATORY FLOODWAY FLOODWAY INCREASE
(FT.) (SQ. FT.) (F. P. S.) (NAVD88) (NAVD88) (NAVD88)
BURNT BRIDGE CREEKA 0.02 8 47 5.4 29.5 17.32 18.32 1.0B 0.07 6 51 5.0 29.5 18.32 19.22 0.9 C 0.12 200 1,912 0.1 29.5 253.5 19.82 0.8D 0.78 150 323 0.8 29.5 19.02 19.82 0.8E 1.54 35 162 1.6 39.4 39.4 39.4 0.0F 1.67 43 211 1.2 44.8 44.8 44.8 0.0G 1.73 26 200 1.3 48.0 48.0 48.0 0.0H 1.78 20 138 1.8 48.2 48.2 48.2 0.0I 1.97 25 177 1.4 50.8 50.8 50.9 0.1J 2.43 44 215 1.2 59.0 59.0 59.3 0.3K 2.58 59 192 1.3 60.8 60.8 60.8 0.0L 2.68 28 70 3.7 61.7 61.7 61.7 0.0M 2.88 38 78 3.3 65.5 65.5 65.5 0.0N 2.92 19 163 1.7 75.1 75.1 75.1 0.0O 3.47 22 71 3.8 78.9 78.9 78.9 0.0P 4.06 21 48 5.6 92.6 92.6 92.9 0.3Q 4.43 43 176 1.5 100.6 100.6 100.6 0.0R 4.83 19 35 7.7 107.7 107.7 107.7 0.0S 5.55 35 69 3.9 136.7 136.7 136.7 0.0T 5.81 37 260 1.0 159.2 159.2 159.2 0.0U 6.11 20 87 3.1 167.8 167.8 167.8 0.0V 6.18 33 175 1.5 168.0 168.0 168.1 0.1W 6.31 43 225 1.2 168.2 168.2 168.4 0.2X 6.60 23 129 2.1 168.7 168.7 168.9 0.2Y 6.85 50 203 1.3 168.8 168.8 169.2 0.4Z 7.12 50 227 1.2 168.8 168.8 169.6 0.8
(1)Stream distance in miles above mouth(2)Elevations computed without consideration of backwater from Columbia River
FLOODWAY DATAFEDERAL EMERGENCY MANAGEMENT AGENCY
CLARK COUNTY, WASHINGTONAND INCORPORATED AREAS BURNT BRIDGE CREEK
FLOODING SOURCE FLOODWAY1-PERCENT ANNUAL CHANCE FLOOD
WATER SURFACE ELEVATION
TAB
LE 6
SECTION MEAN WITHOUT WITHCROSS SECTION DISTANCE1 WIDTH AREA VELOCITY REGULATORY FLOODWAY FLOODWAY INCREASE
(FT.) (SQ. FT.) (F. P. S.) (NAVD88) (NAVD88) (NAVD88)
BURNT BRIDGE CREEKAA 7.37 40 193 1.6 169.2 169.2 170.0 0.8AB 7.82 177 711 0.4 169.6 169.6 170.6 1.0 AC 8.35 18 28 7.1 172.7 172.7 172.7 0.0AD 8.47 86 202 1.0 175.6 175.6 175.9 0.3AE 8.90 40 130 1.0 180.6 180.6 180.7 0.1AF 9.29 40 94 1.3 185.4 185.4 185.4 0.0AG 9.36 27 35 2.7 185.9 185.9 186.2 0.3AH 9.42 31 74 1.3 188.0 188.0 188.0 0.0AI 9.71 19 109 1.2 192.0 192.0 193.0 1.0AJ 9.86 54 106 1.4 192.3 192.3 193.2 0.9AK 10.10 37 103 1.4 194.1 194.1 194.4 0.3AL 10.40 22 69 1.8 195.1 195.1 195.2 0.1AM 10.43 19 106 1.2 196.8 196.8 196.9 0.1AN 10.87 22 32 2.6 197.1 197.1 197.2 0.1AO 10.89 14 40 2.1 198.0 198.0 198.1 0.1AP 11.01 16 90 0.9 198.2 198.2 198.4 0.2AQ 11.46 31 111 0.9 198.2 198.2 198.4 0.2AR 11.75 68 62 0.9 198.2 198.2 198.5 0.3AS 12.30 100 80 1.1 198.9 198.9 199.2 0.3AT 12.54 83 95 0.8 199.3 199.3 199.7 0.4AU 12.78 55 64 1.0 199.6 199.6 199.9 0.4
(1)Stream distance in miles above mouth(2)Elevations computed without consideration of backwater from Columbia River
FLOODWAY DATAFEDERAL EMERGENCY MANAGEMENT AGENCY
CLARK COUNTY, WASHINGTONAND INCORPORATED AREAS
BURNT BRIDGE CREEK
TAB
LE 6
FLOODING SOURCE FLOODWAY1-PERCENT ANNUAL CHANCE FLOOD
WATER SURFACE ELEVATION
SECTION MEAN WITHOUT WITHCROSS SECTION DISTANCE1 WIDTH AREA VELOCITY REGULATORY FLOODWAY FLOODWAY INCREASE
(FT.) (SQ. FT.) (F. P. S.) (NAVD88) (NAVD88) (NAVD88)
CHINA DITCHA 0.01 74 390 1.9 251.8 251.8 252.8 1.0B 0.13 51 275 2.7 252.1 252.1 253.0 0.9 C 0.39 45 221 3.3 253.3 253.3 253.8 0.5D 0.63 49 228 3.1 254.7 254.7 254.9 0.2E 0.75 41 184 3.5 255.3 255.3 255.5 0.2F 0.94 36 148 2.3 256.3 256.3 256.4 0.1G 1.14 35 92 3.4 257.1 257.1 257.1 0.0H 1.41 31 99 2.8 258.6 258.6 258.6 0.0I 1.75 22 71 3.2 260.9 260.9 260.9 0.0J 1.96 18 27 3.4 264.0 264.0 264.0 0.0K 2.20 14 36 1.9 269.6 269.6 269.6 0.0L 2.42 13 18 2.6 271.3 271.3 271.3 0.0M 2.65 19 17 1.5 274.7 274.7 274.7 0.0N 2.73 20 17 1.2 275.2 275.2 275.2 0.0O 2.82 17 23 0.6 275.3 275.3 275.3 0.0
(1)Stream distance in miles above confluence with Fifth Plain Creek
FLOODING SOURCE FLOODWAY1-PERCENT ANNUAL CHANCE FLOOD
WATER SURFACE ELEVATION
TAB
LE 6
FLOODWAY DATAFEDERAL EMERGENCY MANAGEMENT AGENCY
CLARK COUNTY, WASHINGTONAND INCORPORATED AREAS CHINA DITCH

SECTION MEAN WITHOUT WITHCROSS SECTION DISTANCE1 WIDTH AREA VELOCITY REGULATORY FLOODWAY FLOODWAY INCREASE
(FT.) (SQ. FT.) (F. P. S.) (NAVD88) (NAVD88) (NAVD88)
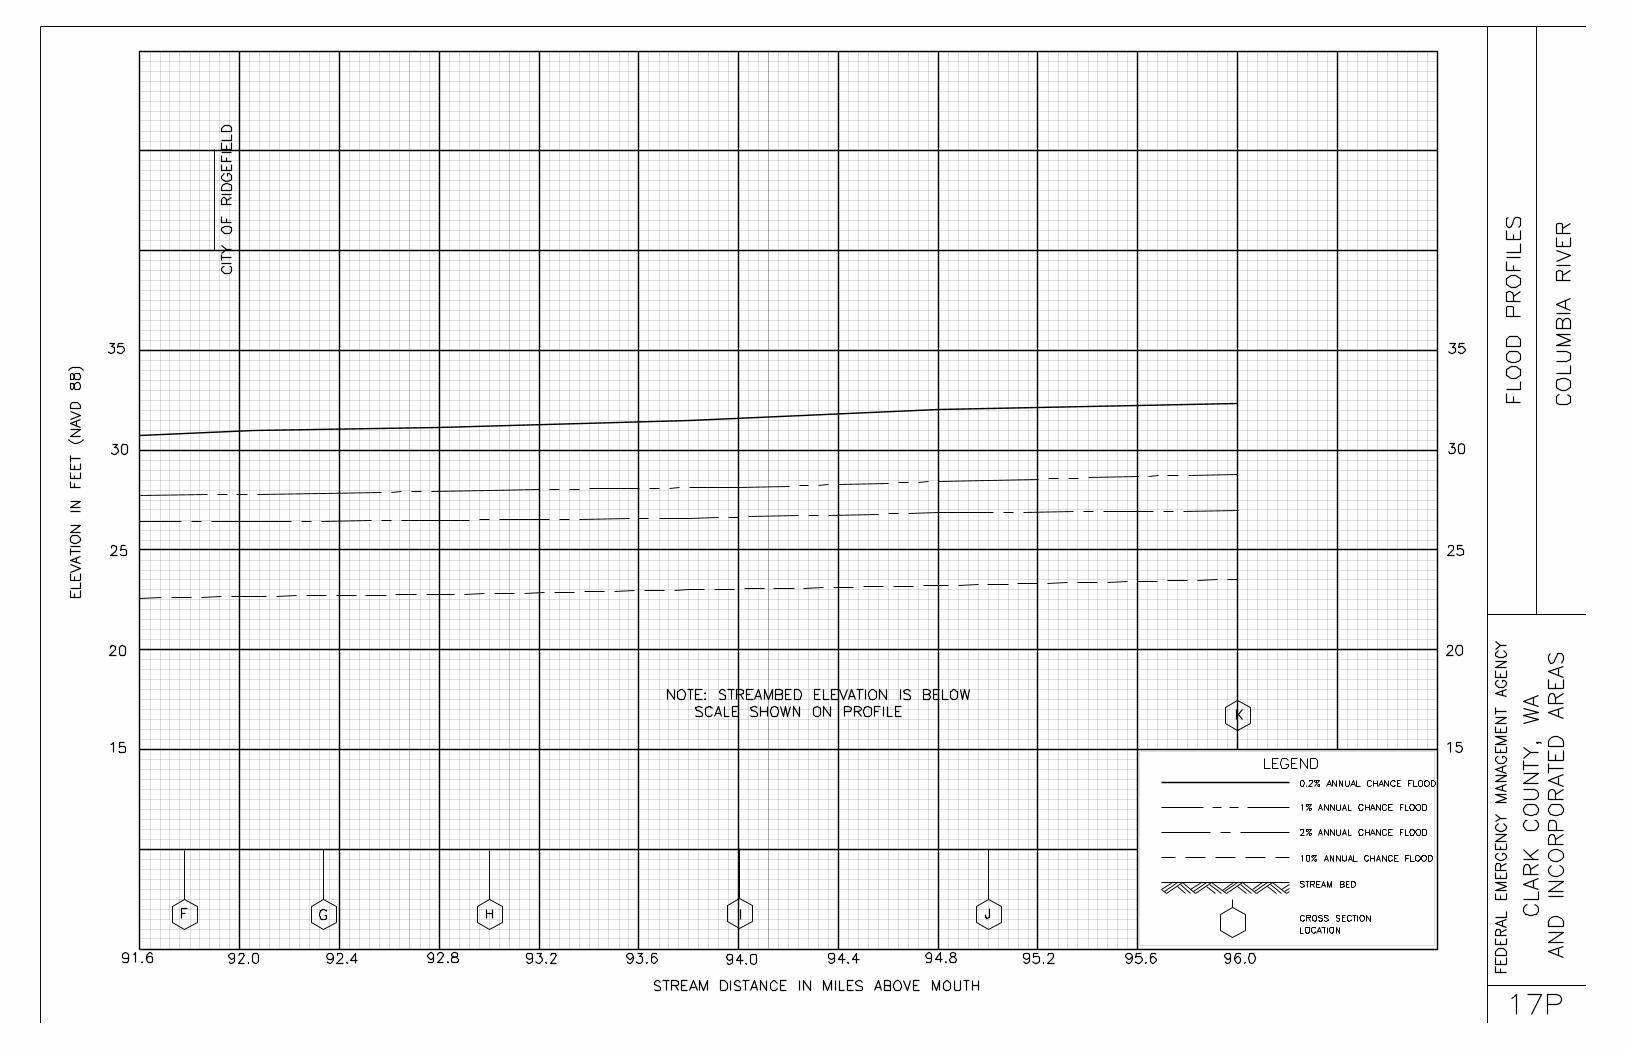
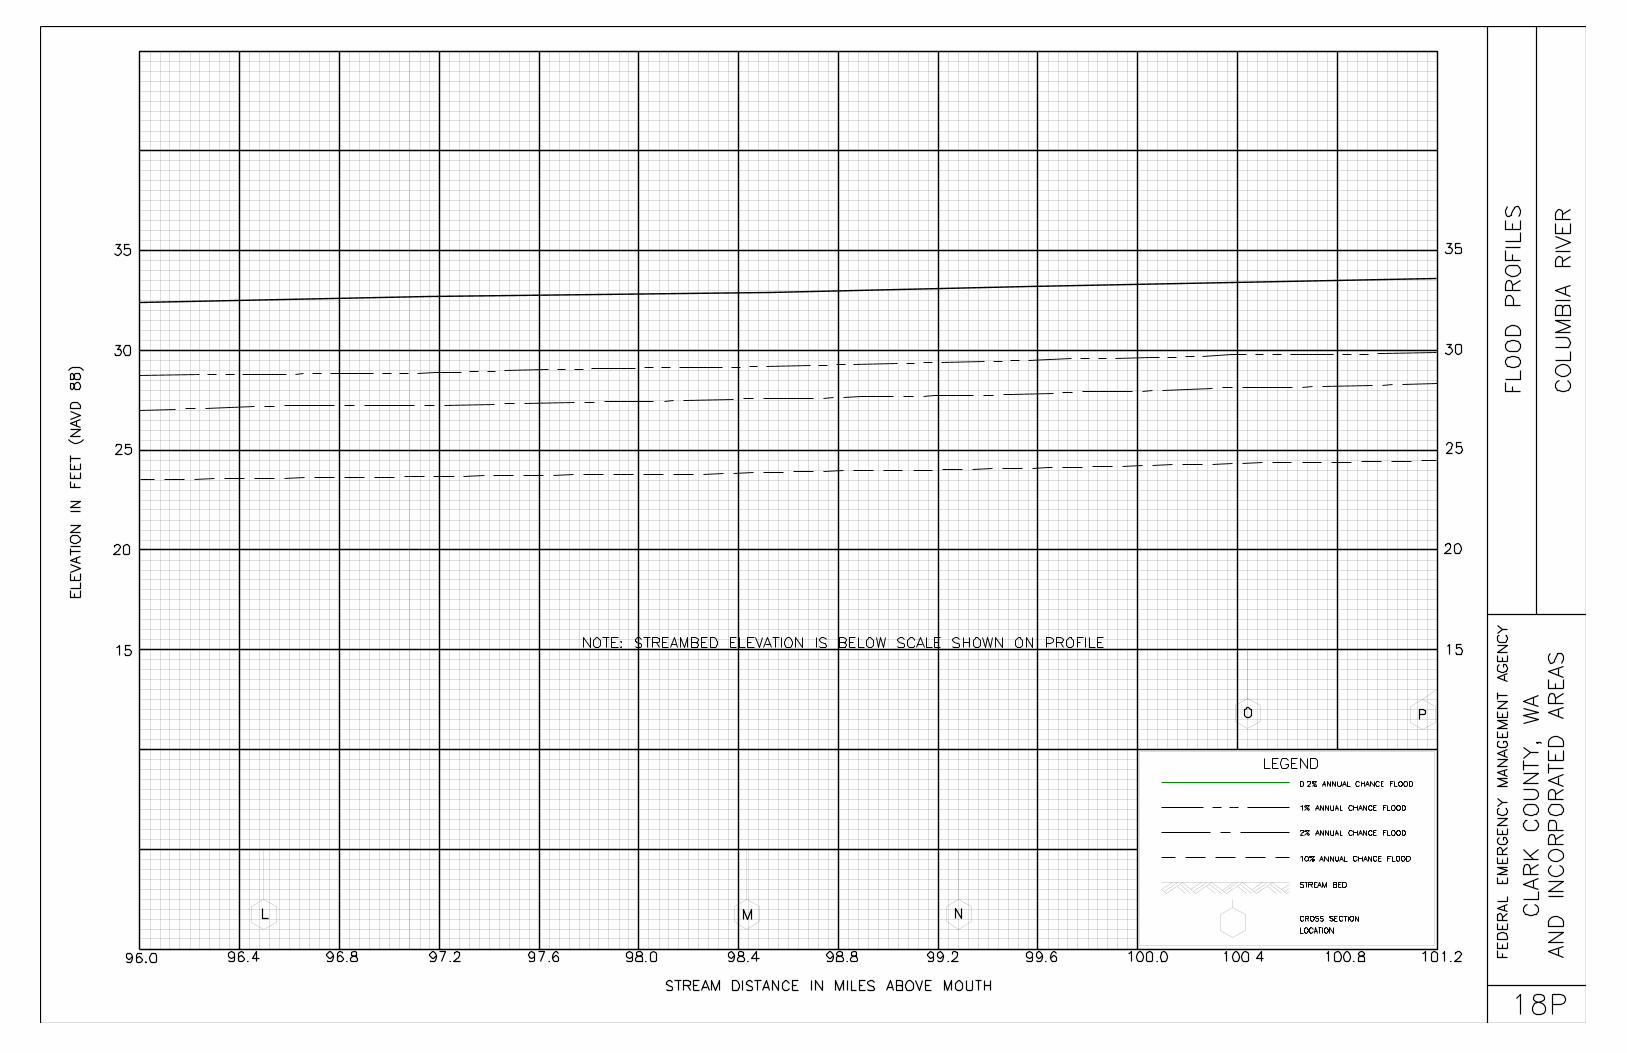
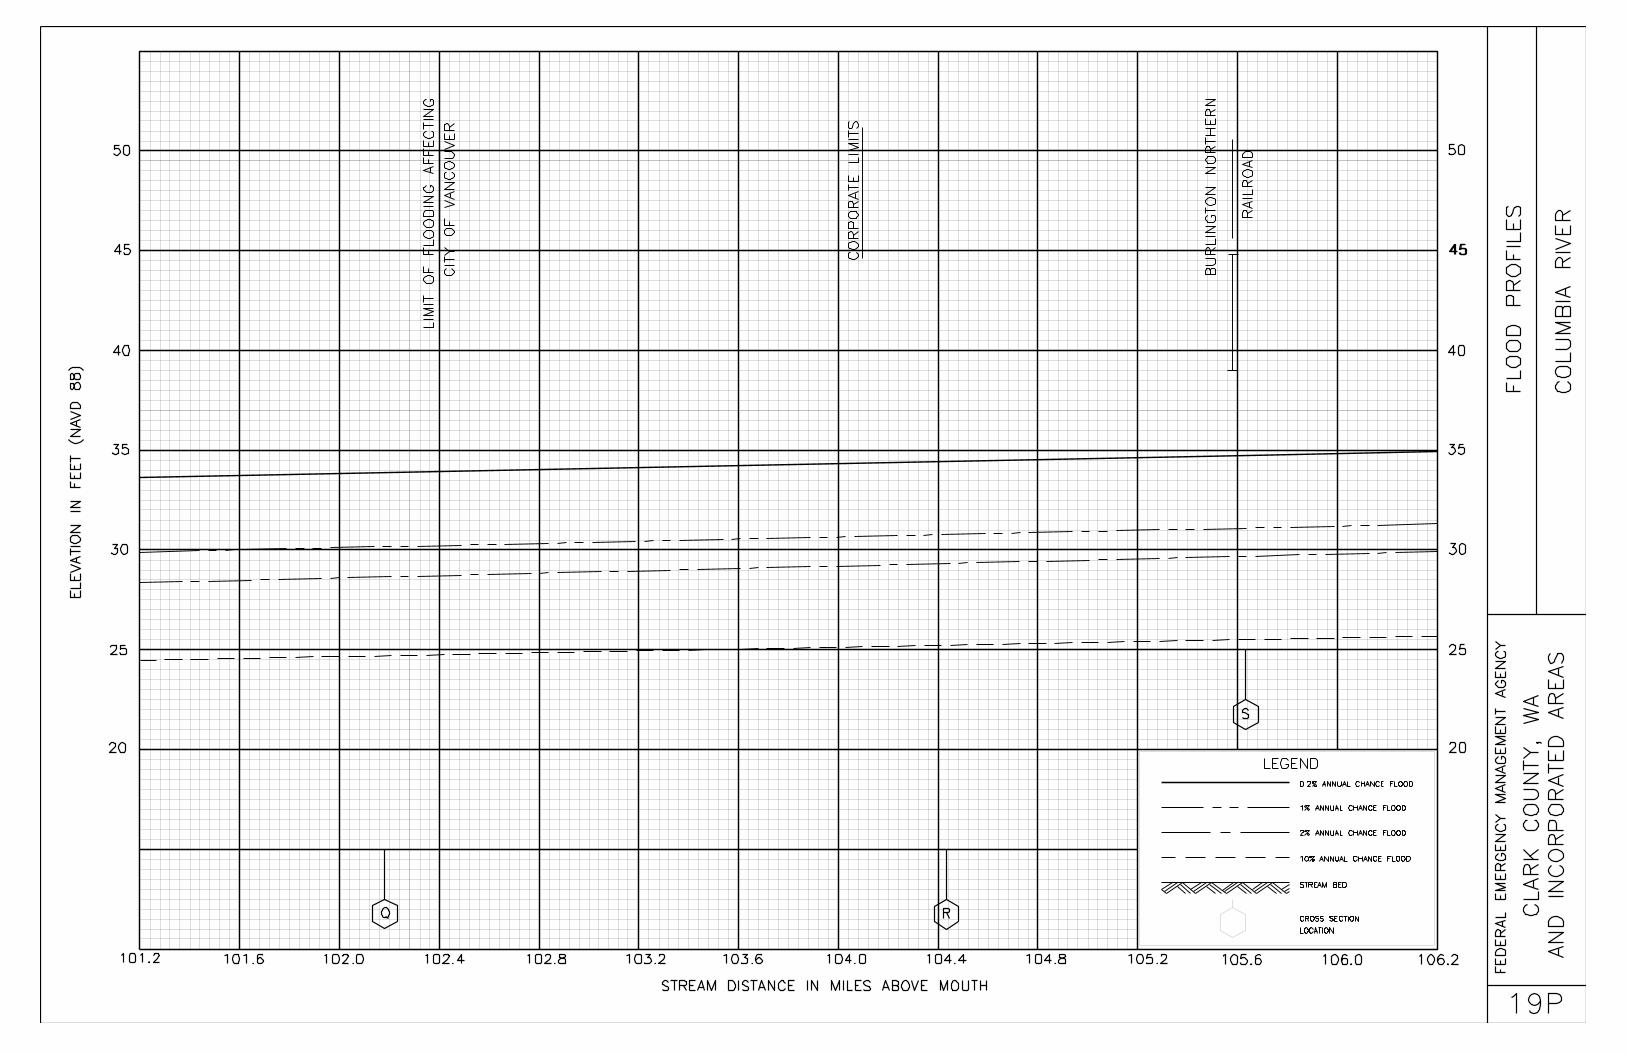
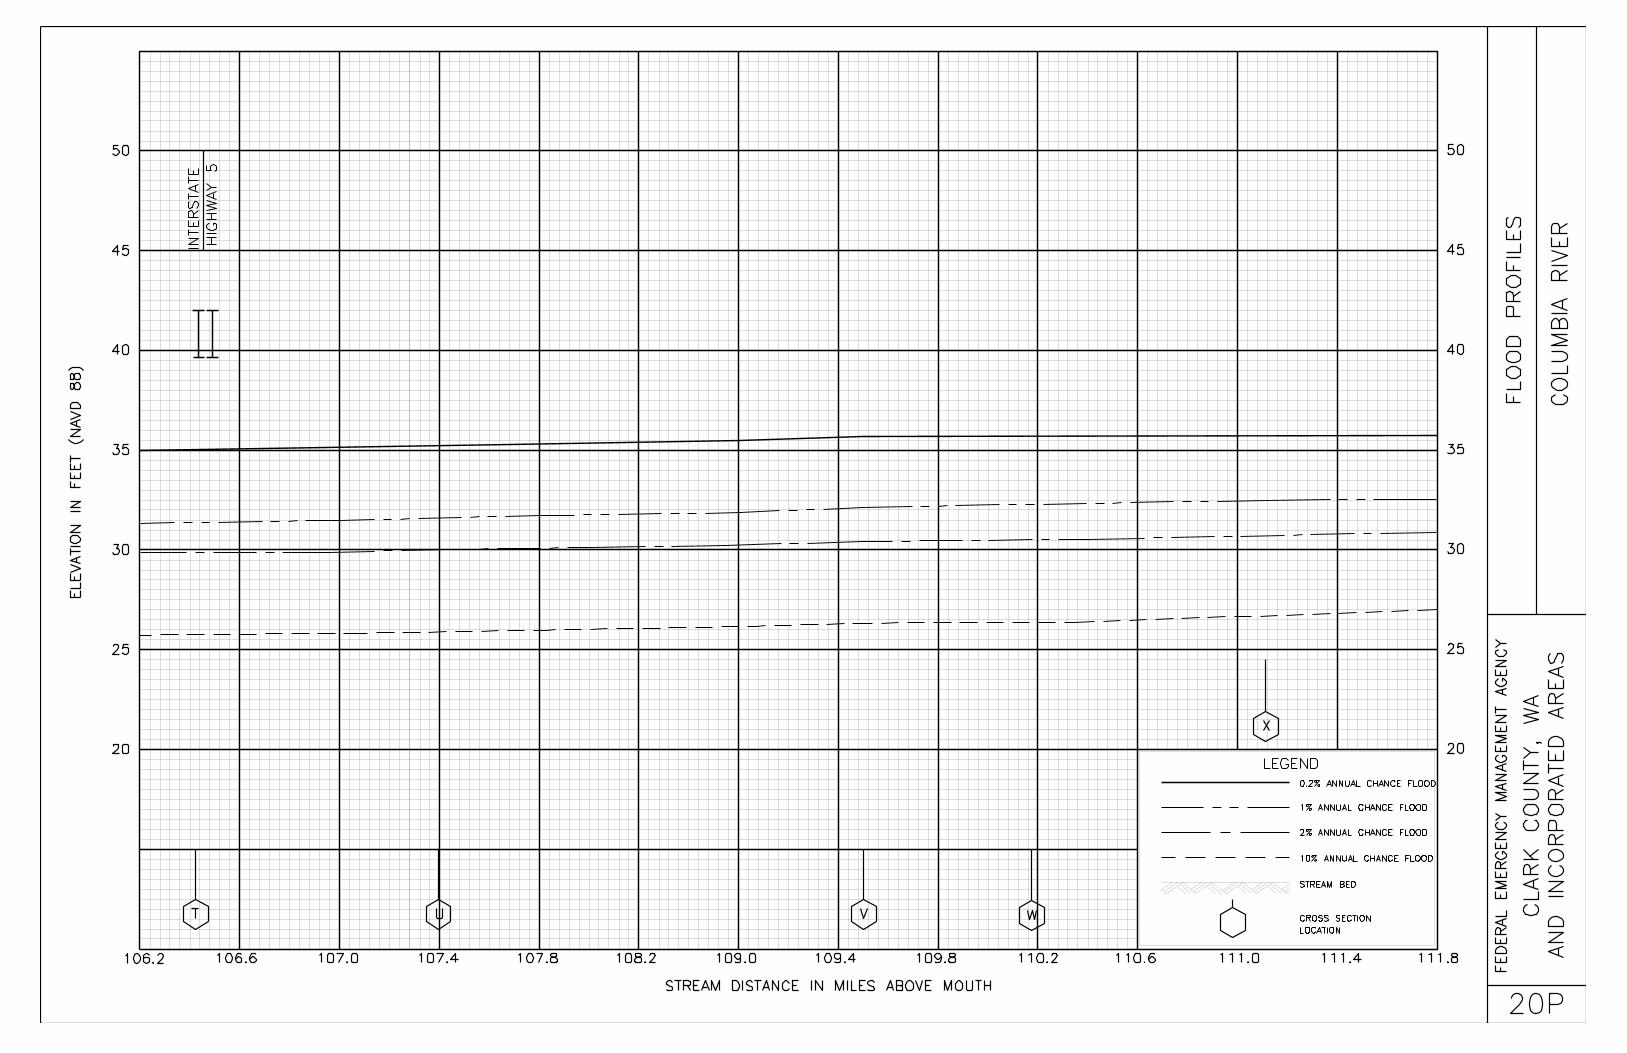
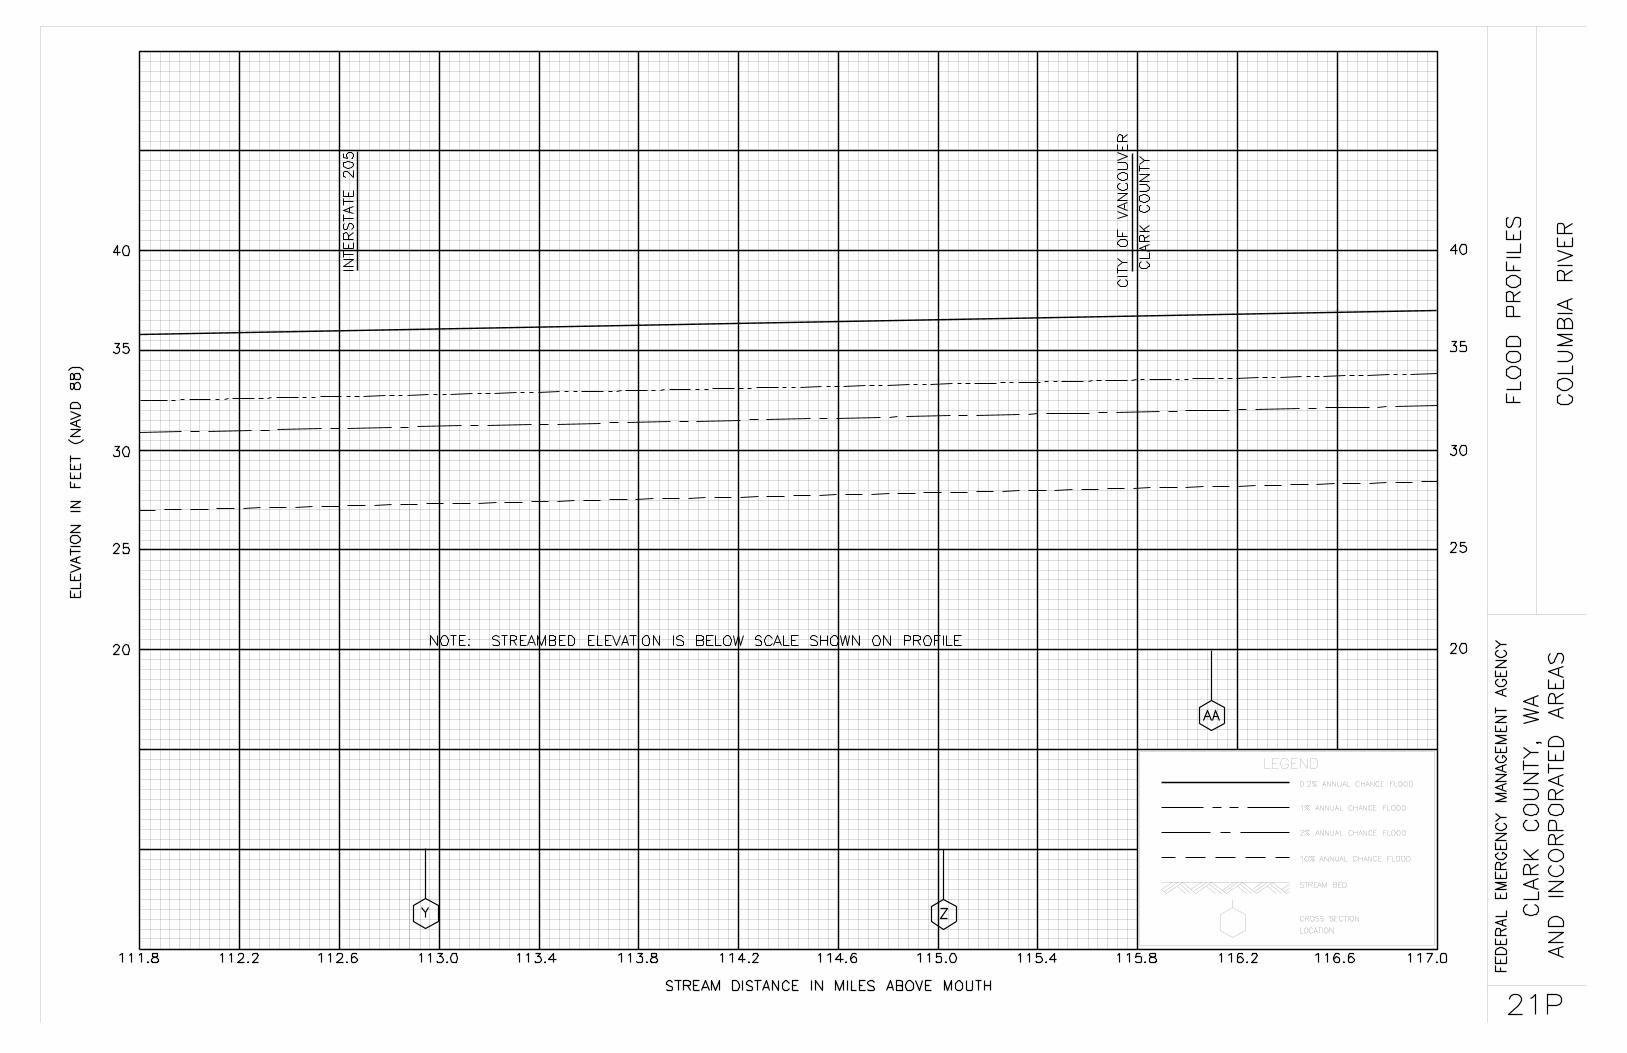
COLUMBIA RIVERA 87.29 4,700 / 2,3922 158,438 4.7 26.4 26.4 27.4 1.0B 88.75 3,800 / 2,2542 148,987 5.0 26.9 26.9 27.9 1.0 C 89.43 3,500 / 2,4802 159,074 4.7 27.1 27.1 28.1 1.0D 90.23 3,930 / 3,0322 167,183 4.4 27.3 27.3 28.3 1.0E 91.01 4,800 / 2,6612 169,233 4.4 27.5 27.5 28.5 1.0F 91.77 4,570 / 2,5802 177,151 4.2 27.8 27.8 28.8 1.0G 92.34 3,089 /1,6332 155,478 4.8 27.8 27.8 28.8 1.0H 93.00 2,880 / 1,5982 159,220 4.7 28.0 28.0 29.0 1.0I 94.00 3,050 / 8762 141,666 5.3 28.1 28.1 29.1 1.0J 95.00 2,650 / 8692 141,851 5.3 28.5 28.5 29.5 1.0K 96.00 3,300 / 1,9662 157,503 4.8 28.8 28.8 29.8 1.0L 96.49 3,550 / 2,2702 165,476 4.6 28.8 28.9 29.8 0.9M 98.43 3,950 / 2,8152 159,986 4.8 29.3 29.5 30.3 0.8N 99.28 2,959 / 1,8602 140,334 5.4 29.6 29.8 30.5 0.7O 100.43 3,521 / 2,0812 168,626 4.5 29.8 30.3 31.0 0.7P 101.20 3,363 / 2,2252 195,911 3.9 30.0 30.6 31.2 0.6Q 102.18 3,233 / 5262 222,371 2.5 30.2 30.9 31.5 0.6R 104.43 3,360 / 2,520 / /8713 184,160 3.1 30.8 31.1 31.8 0.7S 105.63 3,423 / 2,320 / 1,0603 164,080 3.4 31.2 31.3 32.3 1.0T 106.42 3,285 / 2,680 / 1,1393 147,140 3.8 31.4 31.4 32.4 1.0U 107.39 4,594 / 3,840 / 1,1283 189,800 3.0 31.7 31.7 32.7 1.0V 109.49 4,960 /1,3212 204,990 2.8 32.1 31.9 32.9 1.0W 110.17 4,000 / 1,1292 161,600 3.5 32.2 32.0 32.9 0.9X 111.15 4,619 / 1,2892 185,625 3.0 32.5 32.2 33.1 0.9Y 112.93 7,245 / 7382 191,008 3.0 32.8 32.5 33.4 0.9Z 115.02 4,292 / 6022 161,790 3.5 33.4 33.0 33.9 0.9
(1)Stream distance in miles above mouth(2)Width/width within county limits(3)Width excluding island/right channel width looking downstream/width of right channel within corporate limits
FLOODING SOURCE FLOODWAY1-PERCENT ANNUAL CHANCE FLOOD
WATER SURFACE ELEVATION
TAB
LE 6
FLOODWAY DATAFEDERAL EMERGENCY MANAGEMENT AGENCY
CLARK COUNTY, WASHINGTONAND INCORPORATED AREAS COLUMBIA RIVER

SECTION MEAN WITHOUT WITHCROSS SECTION DISTANCE1 WIDTH AREA VELOCITY REGULATORY FLOODWAY FLOODWAY INCREASE
(FT.) (SQ. FT.) (F. P. S.) (NAVD88) (NAVD88) (NAVD88)
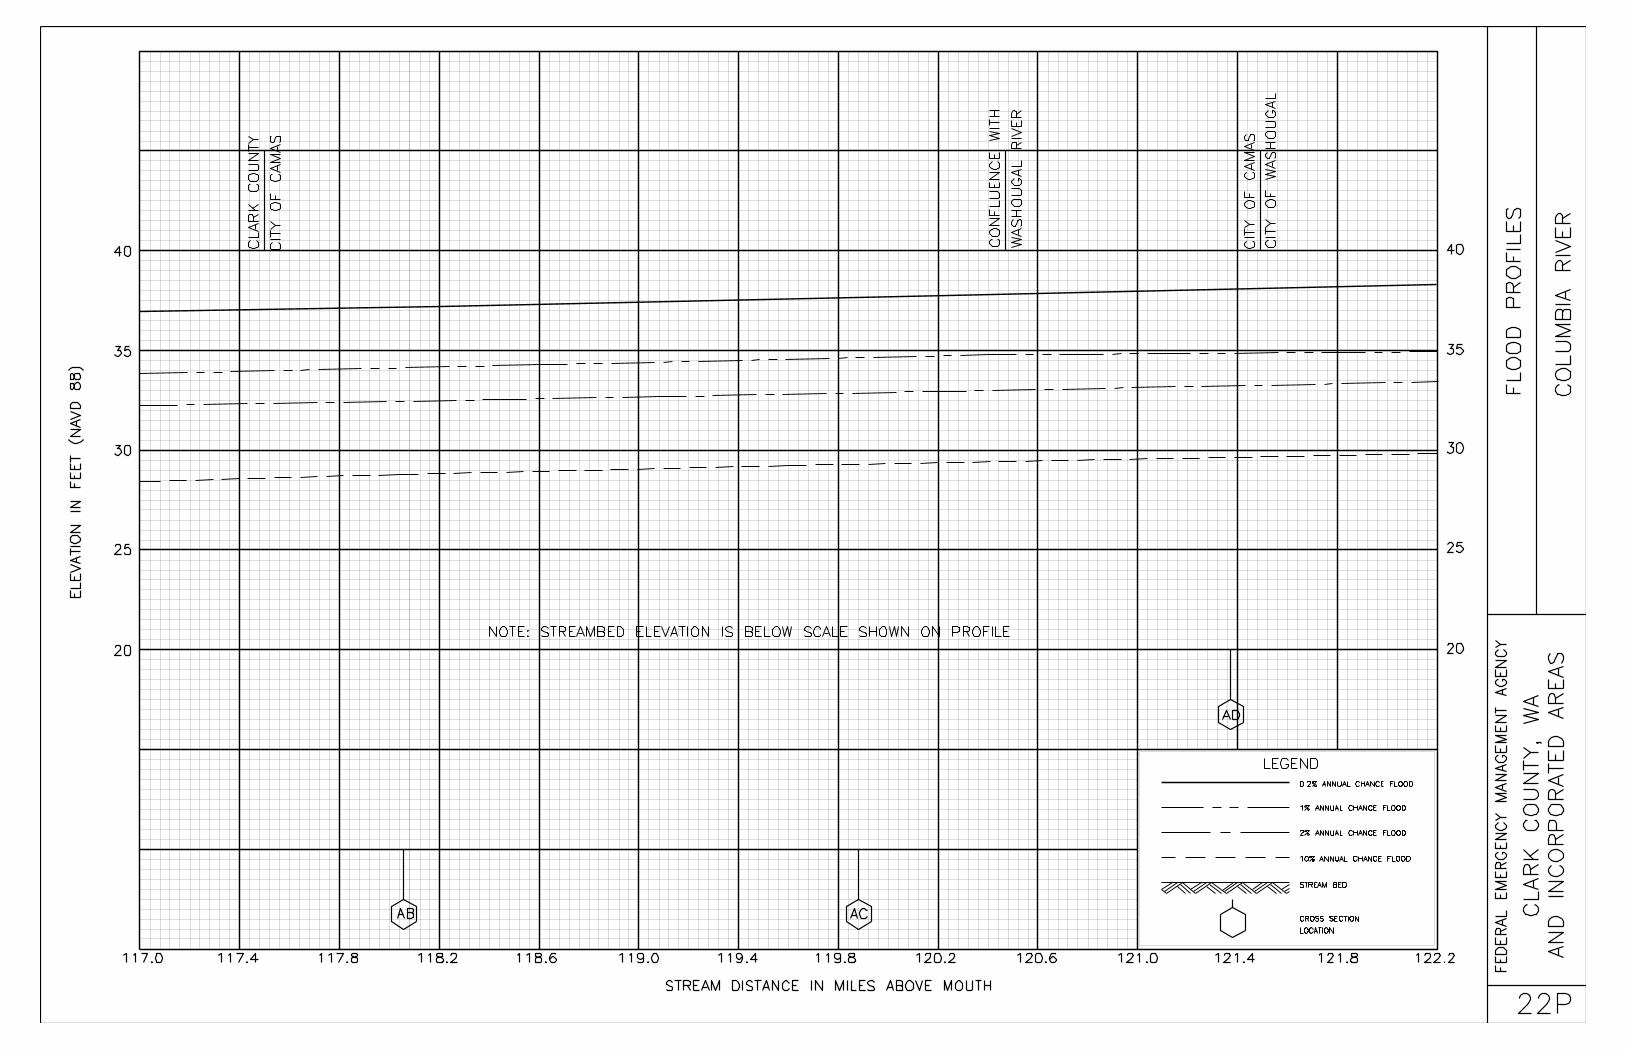
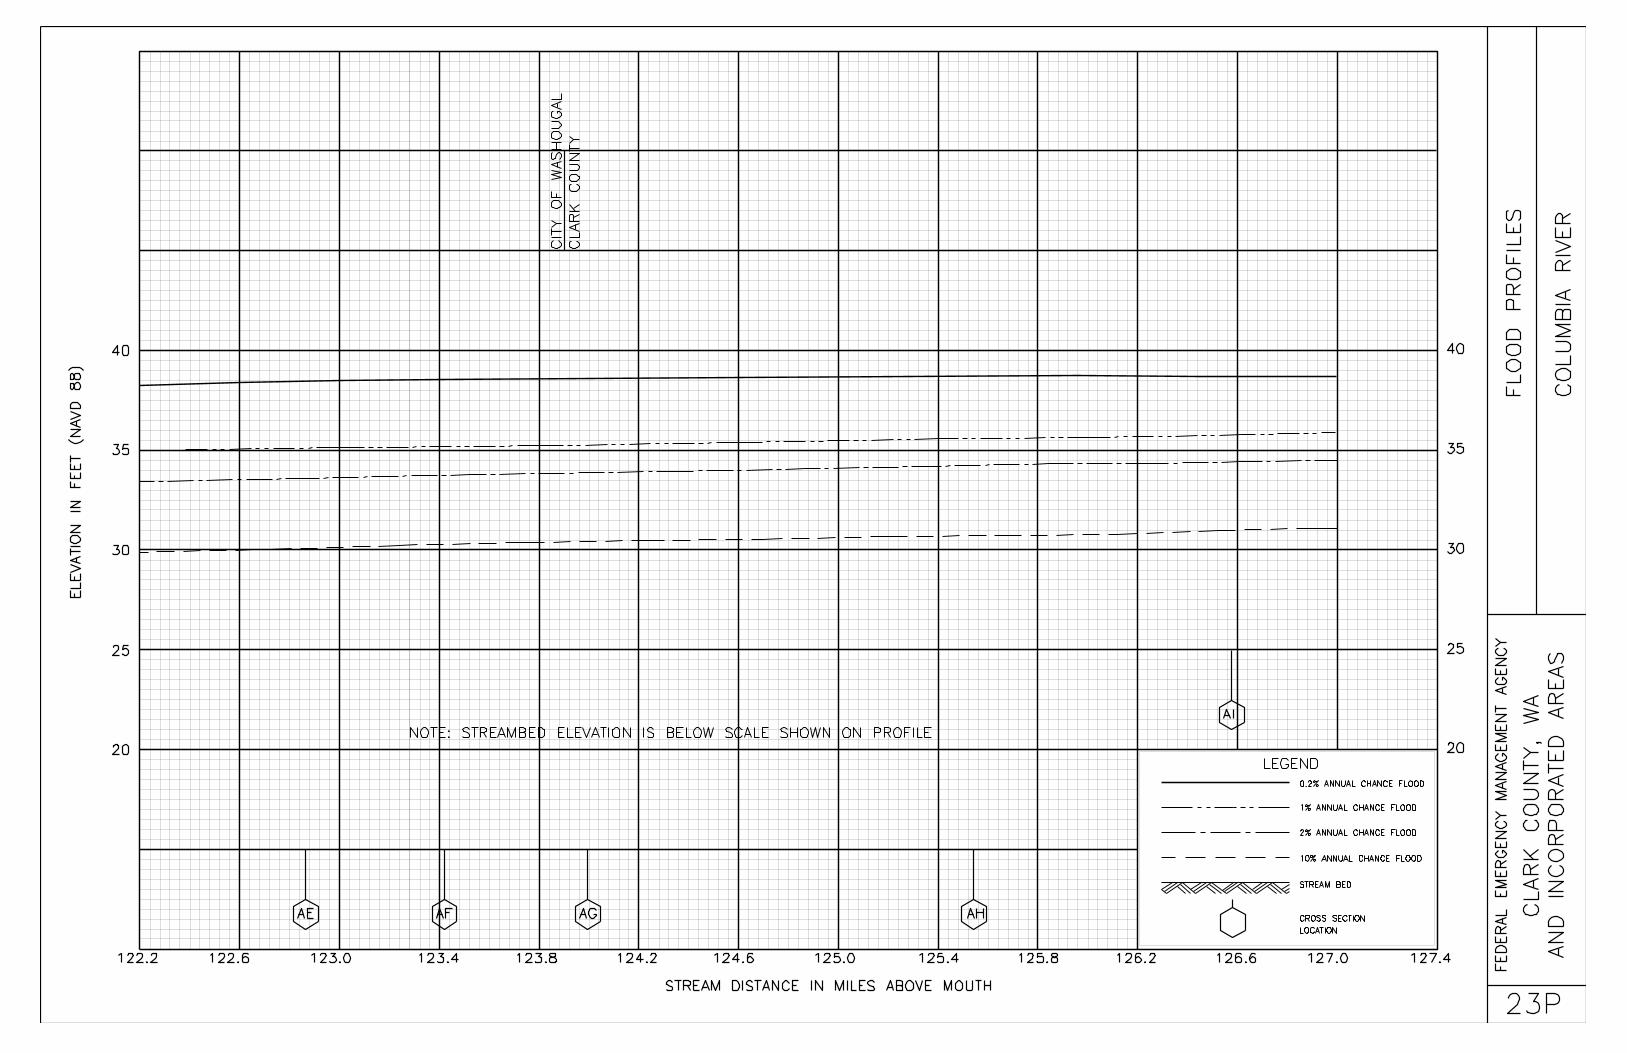
COLUMBIA RIVERAA 116.10 4,773 / 1,2062 178,406 3.2 33.7 33.2 34.1 0.9AB 118.06 6,731 / 3,7452 210,779 2.7 34.2 33.6 34.4 0.8 AC 119.88 2,280 / 1,3672 127,035 4.4 34.6 33.9 35.0 0.9AD 121.37 4,250 / 1,1012 157,277 3.6 34.9 34.3 35.1 0.8AE 122.86 5,500 / 1,8562 189,310 2.9 35.1 34.7 35.5 0.8AF 123.43 5,700 / 2,0392 197,499 2.8 35.3 34.8 35.7 0.9AG 123.98 5,800 / 2,4752 206,916 2.7 35.4 34.8 35.7 0.9AH 125.53 6,950 / 4,7282 198,505 2.8 35.6 35.1 36.0 0.9AI 126.58 5,900 / 5,4982 173,646 3.2 35.8 35.2 36.1 0.9
(1)Stream distance in miles above mouth (4)Width/width within county limits(2)Elevations computed without consideration of backwater from Columbia River (5)Width excluding island/right channel width looking downstream/width of right channel within corporate limits(3)Elevations based on HEC-2 hydraulic model
FLOODING SOURCE FLOODWAY
TAB
LE 6
FLOODWAY DATAFEDERAL EMERGENCY MANAGEMENT AGENCY
CLARK COUNTY, WASHINGTONAND INCORPORATED AREAS COLUMBIA RIVER
1-PERCENT ANNUAL CHANCE FLOODWATER SURFACE ELEVATION

SECTION MEAN WITHOUT WITHCROSS SECTION DISTANCE1 WIDTH AREA VELOCITY REGULATORY FLOODWAY FLOODWAY INCREASE
(FT.) (SQ. FT.) (F. P. S.) (NAVD88) (NAVD88) (NAVD88)
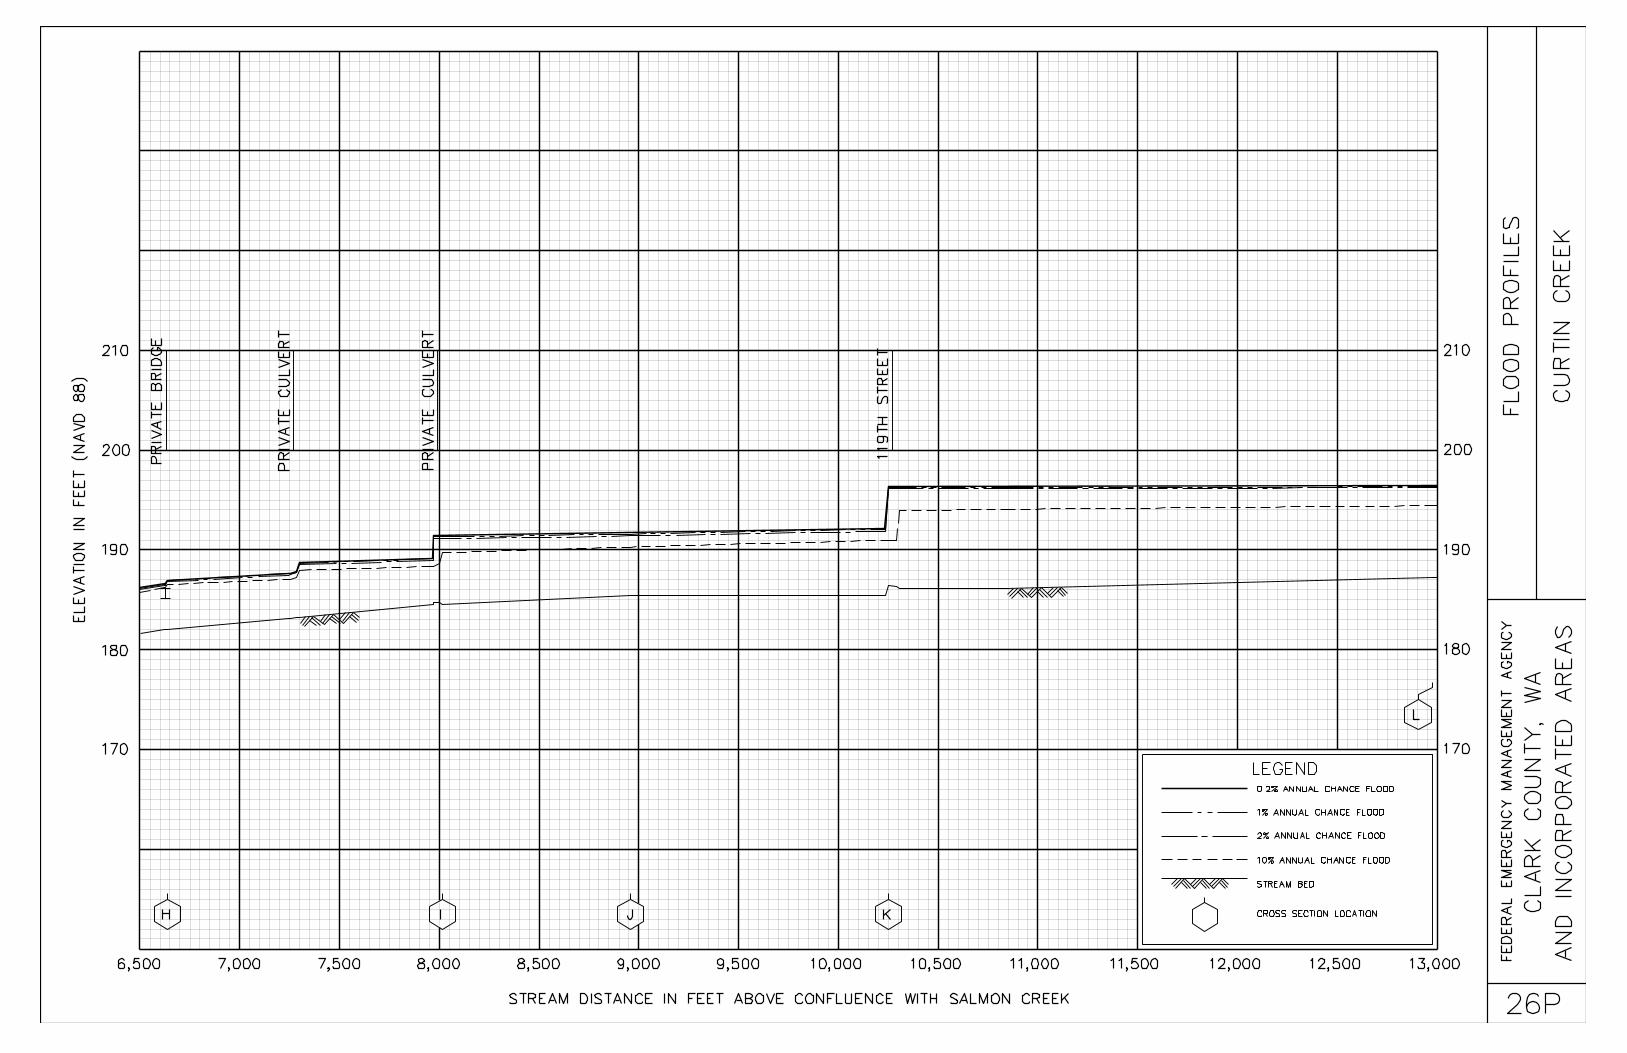
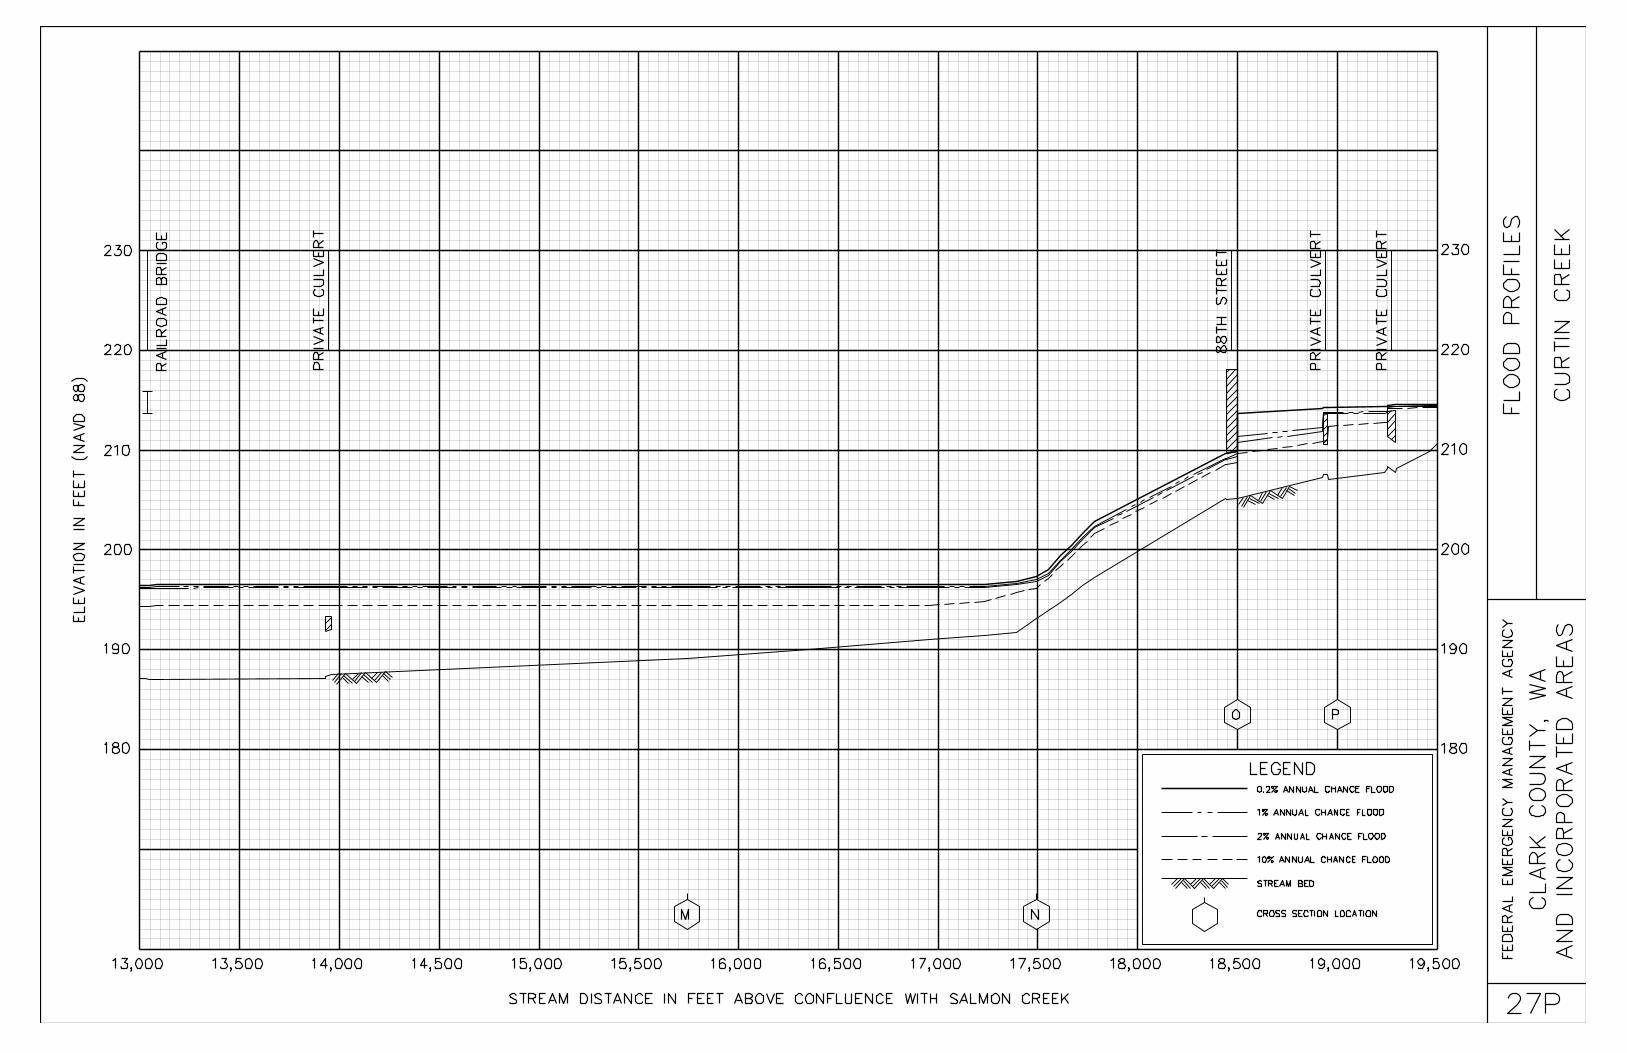
CURTIN CREEKA 515 57 375 1.6 174.3 174.2 175.1 0.9B 1,419 114 516 1.7 174.5 174.5 175.4 0.9 C 1,867 79 272 3.2 174.7 174.7 175.5 1.0D 2,380 41 173 4.5 175.6 175.6 176.5 0.8E 3,031 26 147 4.6 178.7 178.6 179.0 0.3F 3,790 58 296 2.0 180.0 180.0 181.0 1.0G 4,980 58 208 2.5 181.3 181.3 182.1 0.8H 6,639 45 151 4.6 186.7 186.7 187.6 0.9I 8,010 44 230 1.7 191.3 191.3 191.7 0.4J 8,960 40 184 2.1 191.6 191.6 192.0 0.4K 10,306 40 250 1.7 196.2 196.2 196.8 0.6L 12,979 79 428 1.1 196.3 196.3 197.2 0.9M 15,741 138 750 0.5 196.5 196.5 197.4 0.9N 17,494 29 60 3.9 197.0 197.0 197.7 0.6O 18,499 51 64 3.5 211.5 211.5 211.5 0.0P 18,954 24 116 2.1 213.9 213.9 214.5 0.6Q 19,655 21 37 2.1 221.1 221.1 221.1 0.0R 20,249 13 32 2.5 233.6 233.6 233.6 0.0S 21,124 23 53 1.5 236.2 236.2 236.2 0.0T 21,781 23 32 2.5 247.4 247.4 247.4 0.0U 22,408 23 78 1.0 252.9 252.9 253.3 0.4V 22,880 16 26 2.7 253.9 253.9 254.1 0.2W 23,571 25 51 1.4 254.9 254.9 255.3 0.4X 23,996 71 363 0.2 258.3 258.3 259.4 1.1Y 24,691 131 433 0.3 258.3 258.3 259.4 1.1Z 24,891 130 591 0.2 259.8 259.8 260.8 1.0
AA 25,481 122 518 0.1 259.8 259.8 260.8 1.0(1)Stream distance in feet above confluence with Salmon Creek
FLOODING SOURCE FLOODWAY1-PERCENT ANNUAL CHANCE FLOOD
WATER SURFACE ELEVATION
TAB
LE 6
FLOODWAY DATAFEDERAL EMERGENCY MANAGEMENT AGENCY
CLARK COUNTY, WASHINGTONAND INCORPORATED AREAS CURTIN CREEK

SECTION MEAN WITHOUT WITHCROSS SECTION DISTANCE1 WIDTH AREA VELOCITY REGULATORY FLOODWAY FLOODWAY INCREASE
(FT.) (SQ. FT.) (F. P. S.) (NAVD88) (NAVD88) (NAVD88)
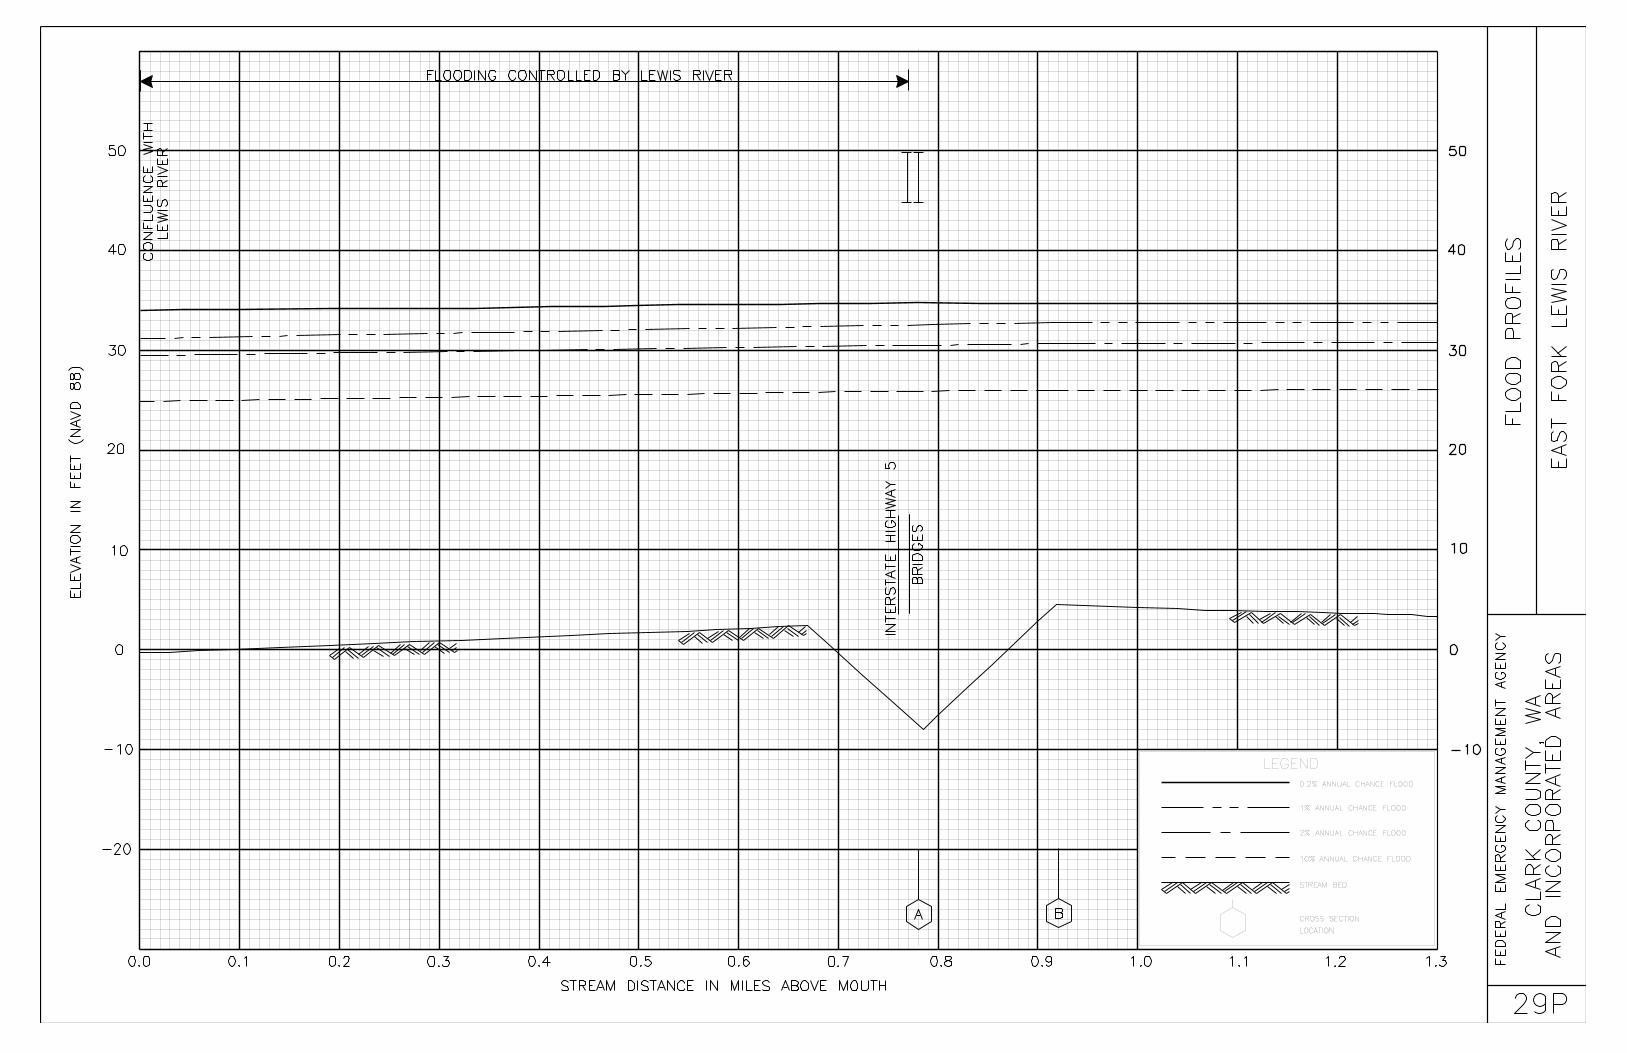
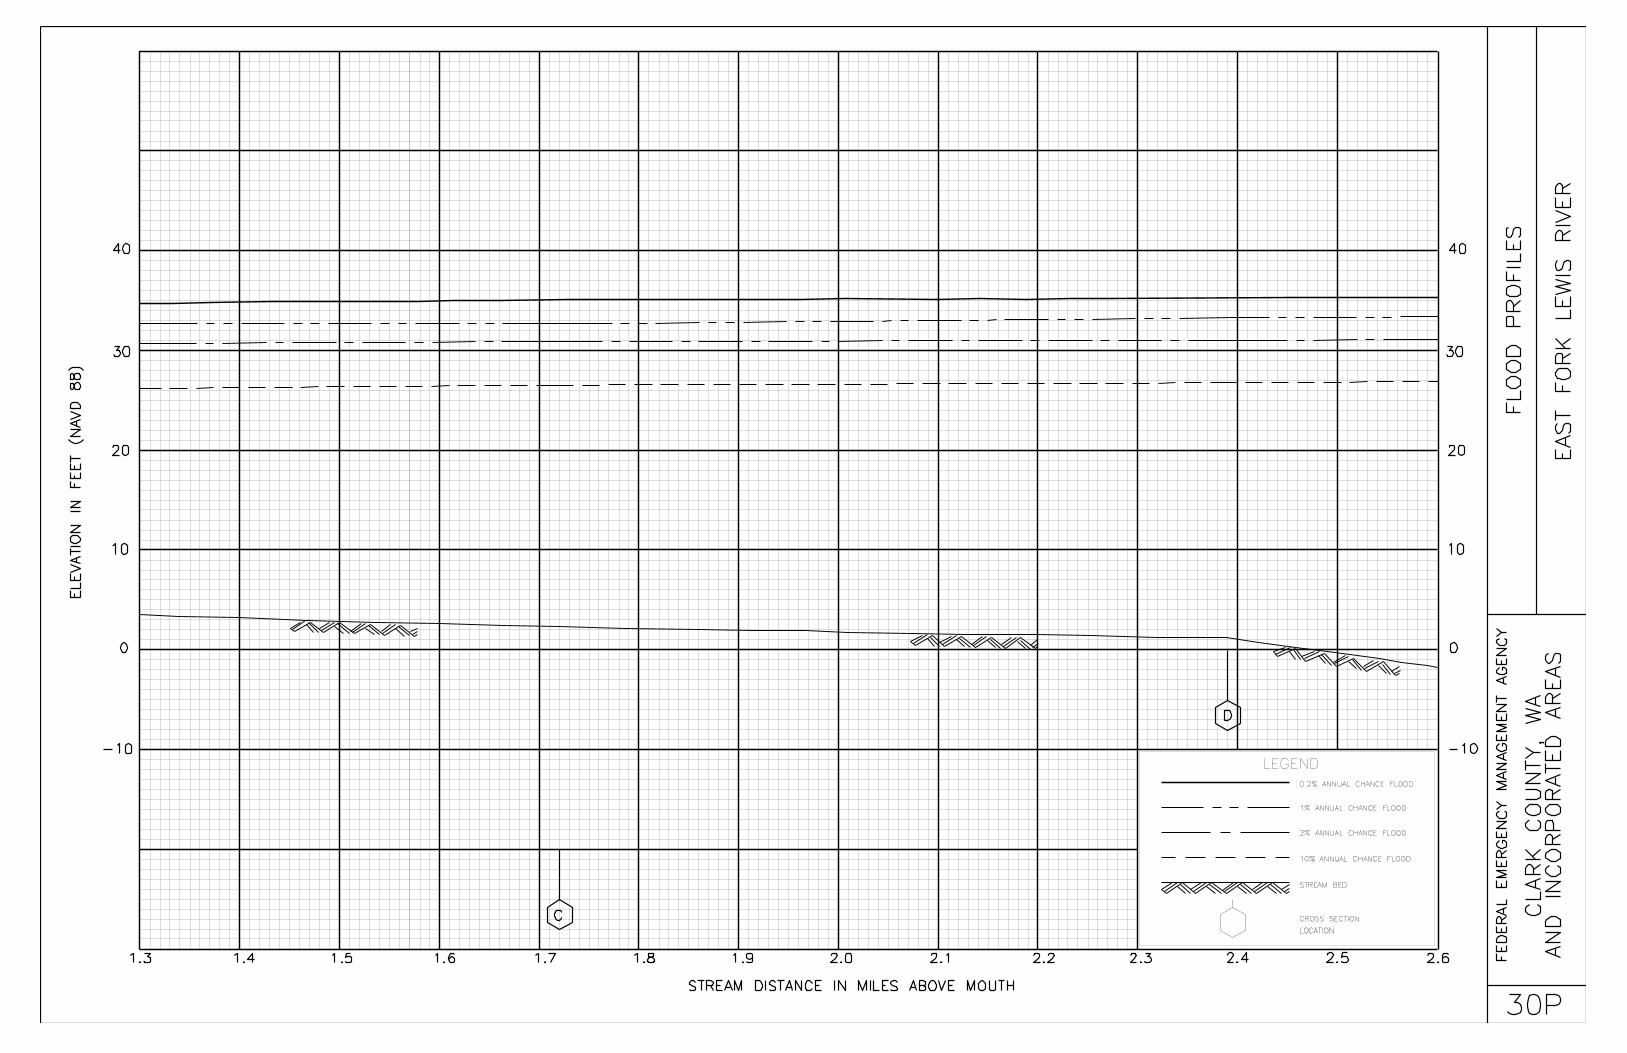
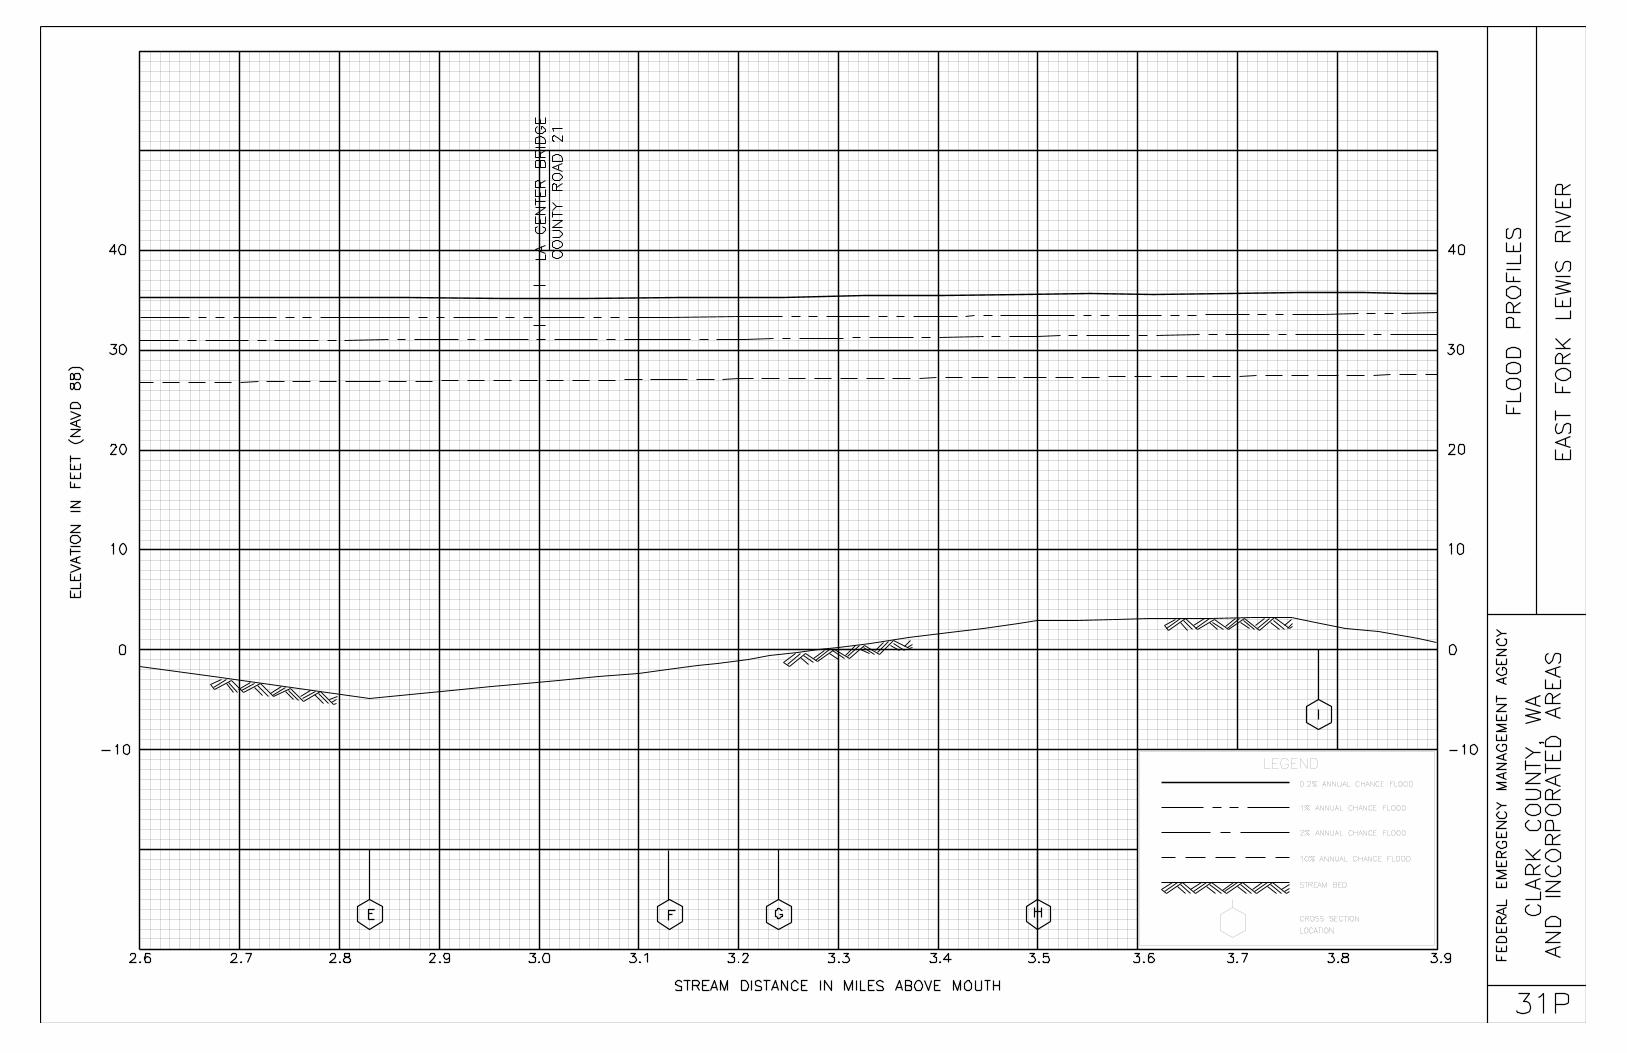
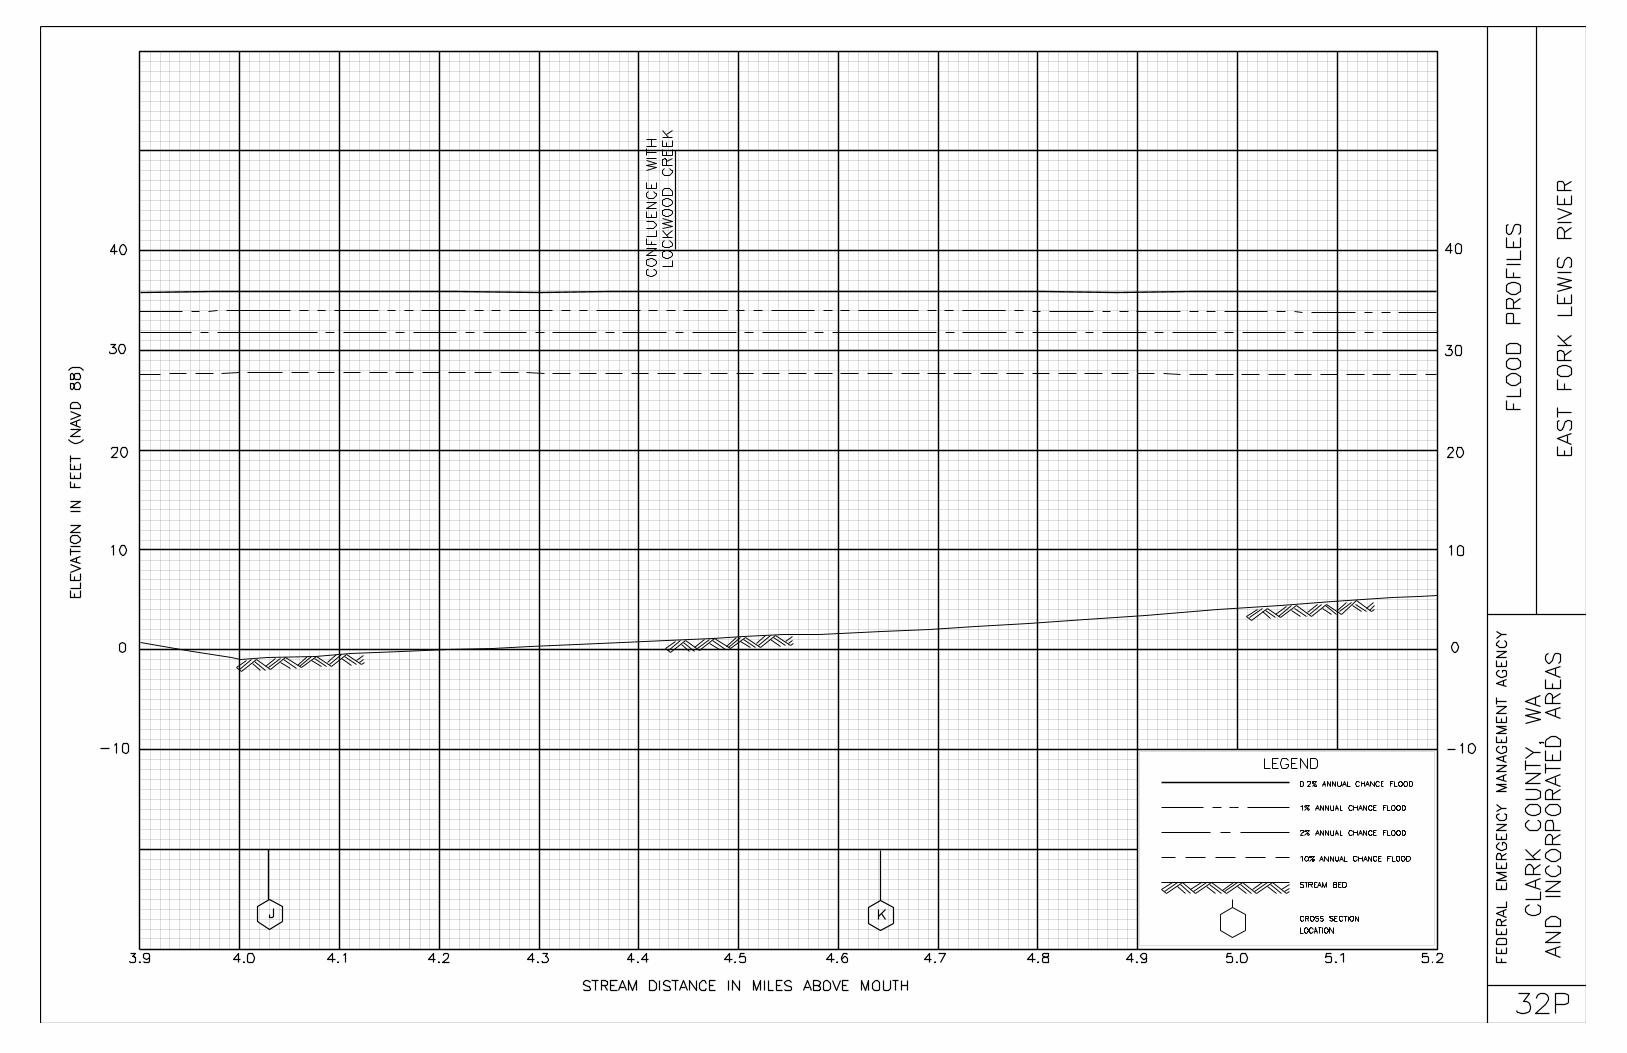
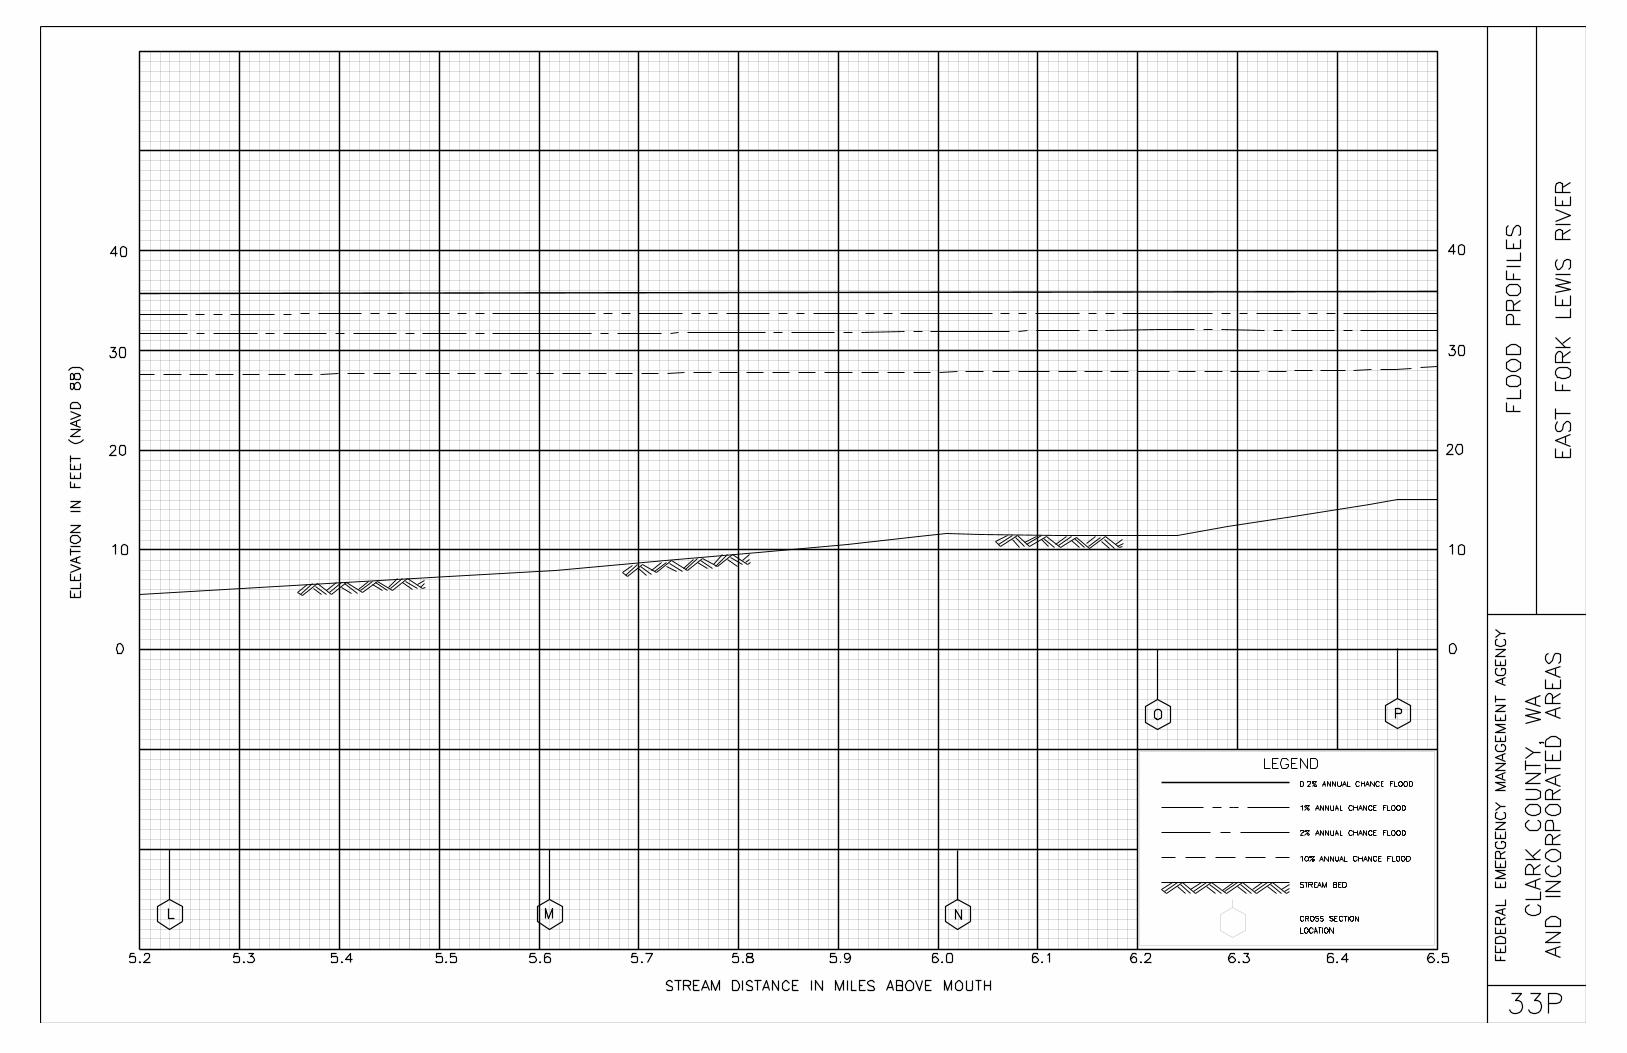
EAST FORK LEWIS RIVER
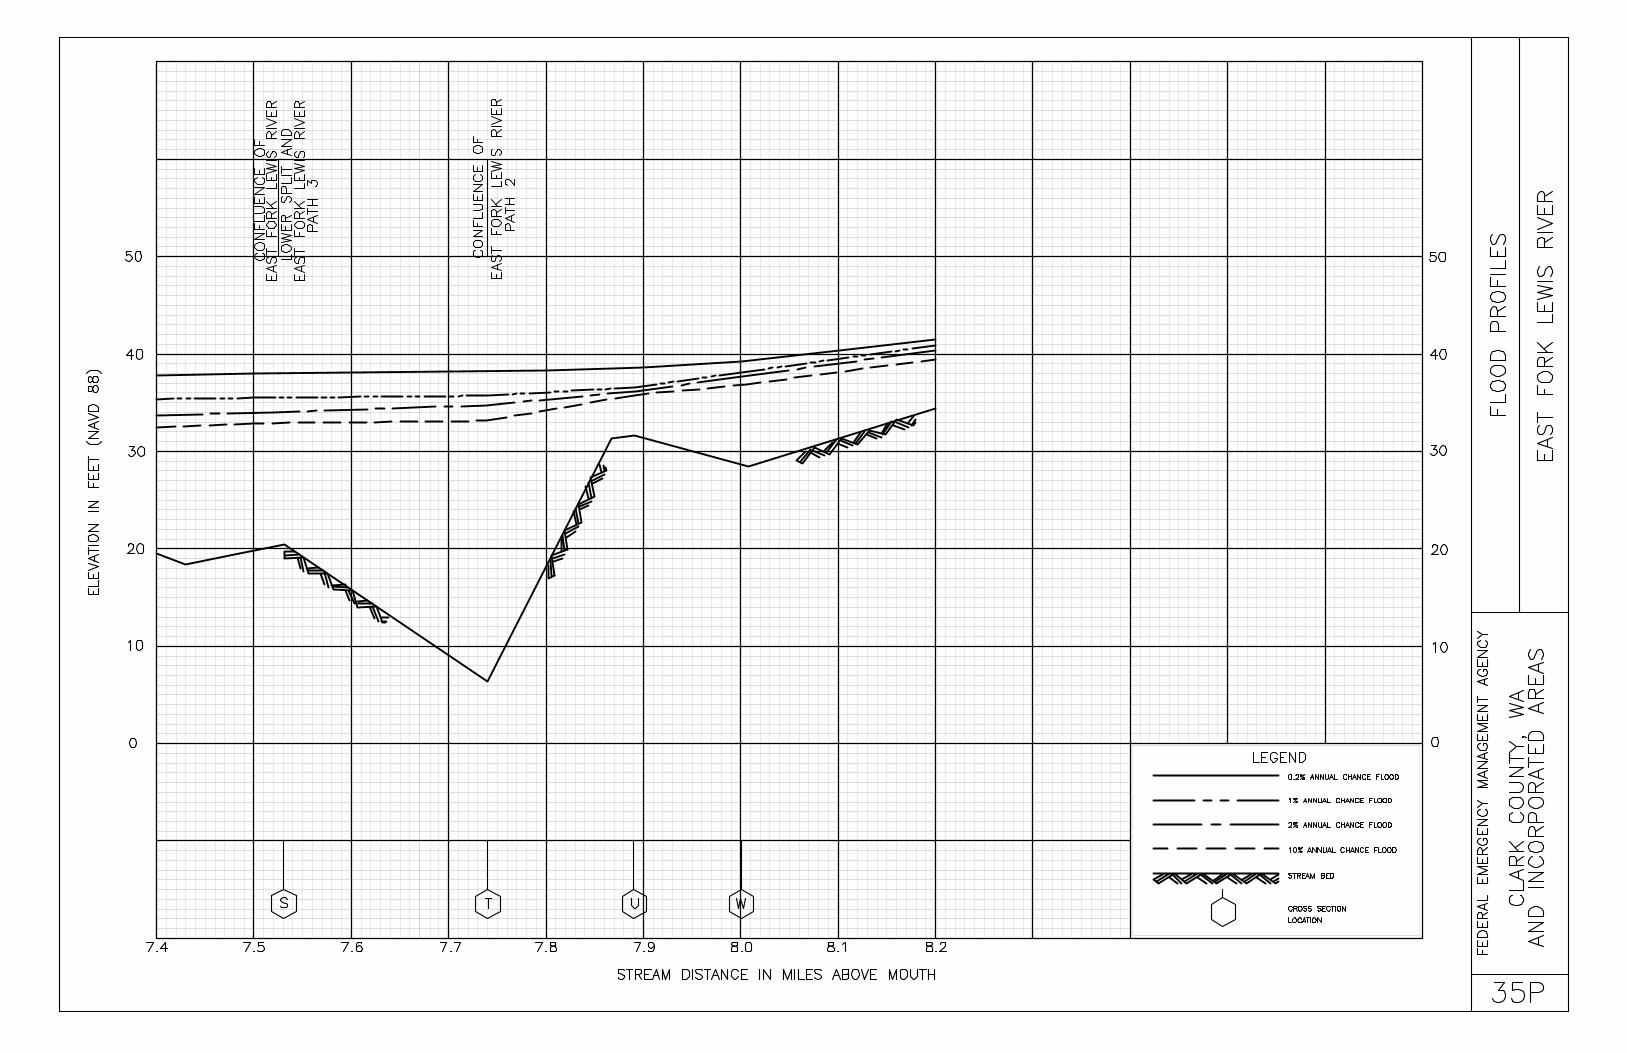
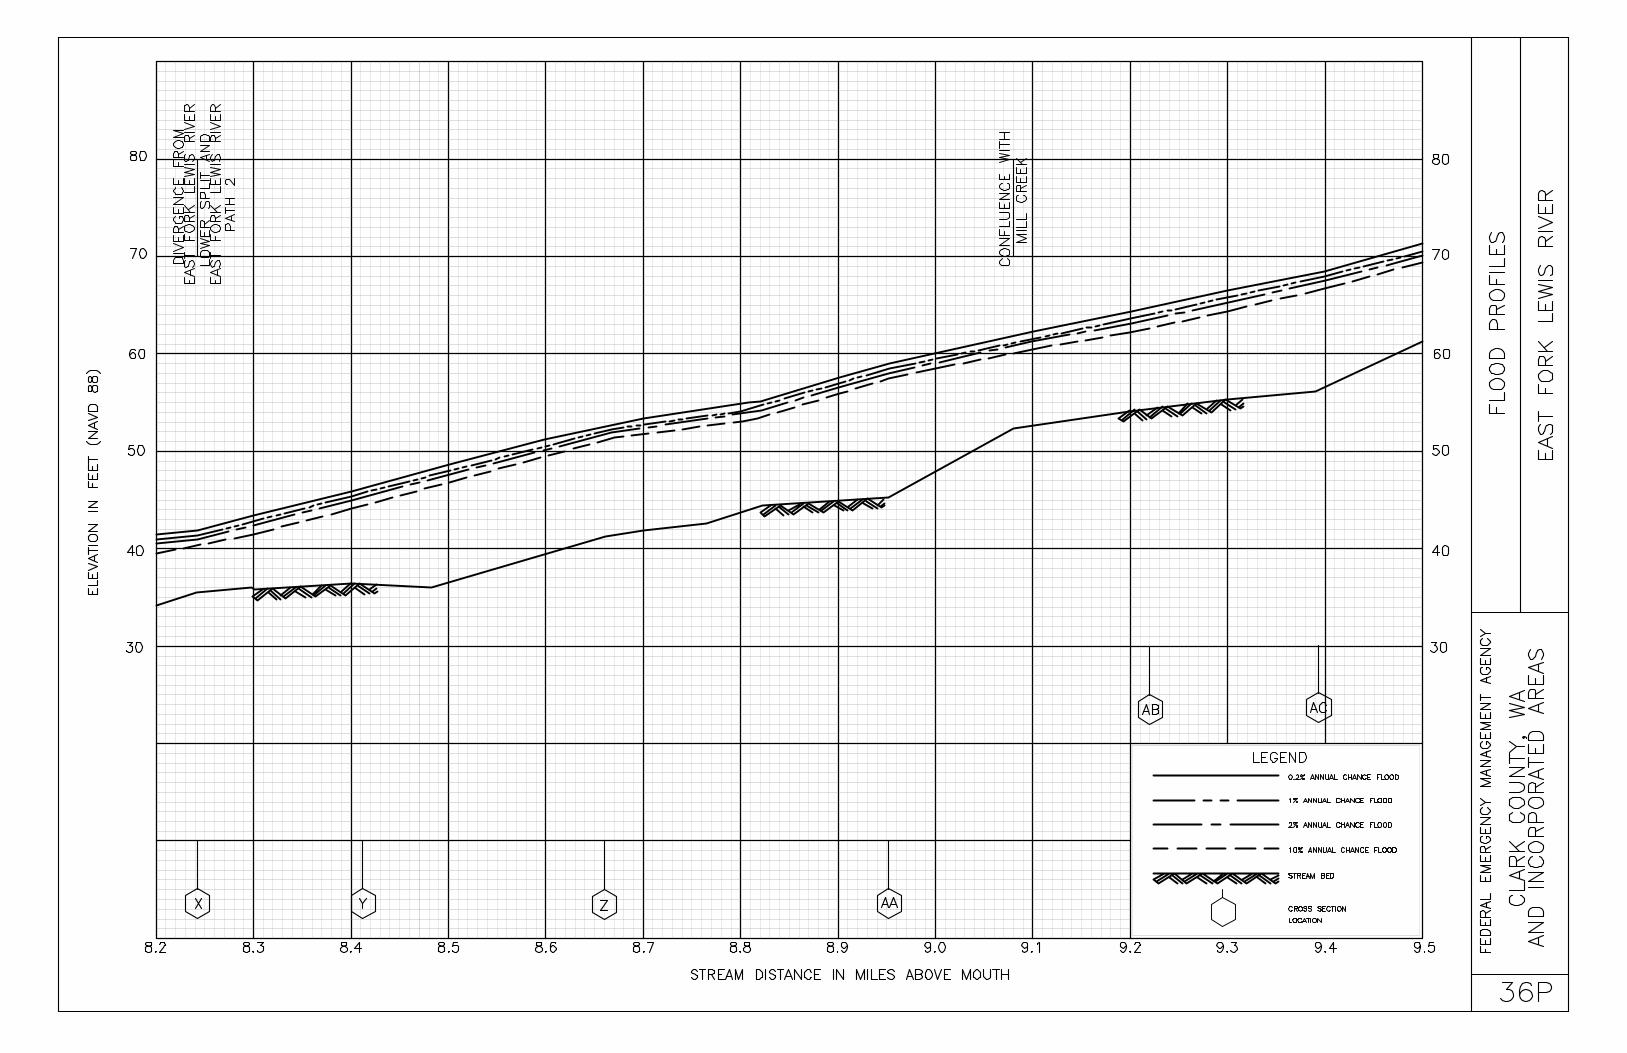
A 0.78 539 10,656 2.5 32.6 32.6 33.0 0.4 B 0.92 370 7,995 3.4 32.6 32.6 33.0 0.4C 1.72 355 7,898 3.4 33.0 253.5 33.5 0.5D 2.39 1,020 21,460 1.3 33.2 33.2 33.7 0.5E 2.83 1,535 31,767 0.8 33.3 33.3 33.8 0.5F 3.13 433 11,443 2.4 33.3 33.3 33.8 0.5G 3.24 760 11,527 2.3 33.3 33.3 33.8 0.5H 3.50 1,230 21,782 1.2 33.5 33.5 34.1 0.6I 3.75 1,300 25,095 1.1 33.5 33.5 34.1 0.6J 4.03 1,400 24,901 1.1 33.5 33.5 34.1 0.6K 4.64 1,400 24,960 0.1 33.6 33.6 34.3 0.7L 5.23 2,120 33,838 0.7 33.6 33.6 34.4 0.8M 5.61 2,000 25,892 0.9 33.6 33.6 34.4 0.8N 6.02 3,450 49,595 0.6 33.7 33.7 34.5 0.8O 6.24 2,650 29,227 0.6 33.7 33.7 34.5 0.8P 6.46 2,650 20,849 1.1 33.7 33.7 34.5 0.8Q 6.78 3,500 25,699 1.3 35.0 35.0 35.7 0.7R 7.28 3,702 27,036 1.2 35.3 35.3 36.0 0.7S 7.53 3,162 18,332 1.6 35.52 / 35.63 35.5 36.2 0.7T 7.744 872 10,277 3.3 35.82 / 35.93 35.9 36.6 0.7U 7.894 825 3,086 4.4 36.72 / 36.83 36.7 37.3 0.6V5
W 8.004 606 3,550 3.8 38.12 / 38.33 38.1 38.6 0.5X 8.244 1,318 4,073 3.3 41.32 / 41.63 41.3 41.7 0.4Y 8.41 2,000 8,206 3.6 45.42 / 45.73 45.4 45.7 0.3Z 8.66 1,541 6,739 4.4 52.12 / 52.23 52.1 52.3 0.2
(1)Stream distance in miles above mouth (4)Measured along profile baseline of East Fork Lewis River Path 1(2)Elevations calculated without consideration of ridge along right overbank (5)Cross section does not cross East Fork Lewis River Path 1(3)Elevations computed with consideration of ridge along right overbank
FLOODING SOURCE FLOODWAY1-PERCENT ANNUAL CHANCE FLOOD
WATER SURFACE ELEVATION
TAB
LE 6
FLOODWAY DATAFEDERAL EMERGENCY MANAGEMENT AGENCY
CLARK COUNTY, WASHINGTONAND INCORPORATED AREAS EAST FORK LEWIS RIVER

SECTION MEAN WITHOUT WITHCROSS SECTION DISTANCE1 WIDTH AREA VELOCITY REGULATORY FLOODWAY FLOODWAY INCREASE
(FT.) (SQ. FT.) (F. P. S.) (NAVD88) (NAVD88) (NAVD88)
EAST FORK LEWIS RIVER
AA 8.95 1,226 5,120 5.7 58.52 / 58.63 58.5 58.7 0.2 AB 9.22 789 4,496 6.5 64.02 / 64.03 64.0 64.1 0.1AC 9.39 732 3,401 8.6 67.72 / 67.83 67.8 67.8 0.0AD 9.83 387 3,027 9.7 77.22 / 77.23 77.2 77.6 0.4AE 9.96 175 2,378 12.3 79.22 / 79.23 79.2 80.0 0.8AF 9.98 228 2,431 9.0 80.9 80.9 81.4 0.5AG 10.08 495 4,124 5.3 82.7 82.7 83.0 0.3AH 10.20 680 3,084 7.1 85.0 85.0 85.2 0.2AI 10.48 1,020 4,123 5.3 90.1 90.1 90.6 0.5AJ 10.67 714 3,082 7.1 94.5 94.5 94.8 0.3AK 10.86 550 3,202 6.8 99.1 99.1 99.6 0.5AL 11.03 600 3,533 6.2 102.0 102.0 102.7 0.7AM 11.33 2,030 6,035 3.6 107.1 107.1 107.1 0.0AN 11.61 1,028 4,590 4.8 112.6 112.6 112.7 0.1AO 11.81 860 3,530 6.2 118.7 118.7 118.7 0.0AP 12.06 252 2,276 9.6 125.6 125.6 125.9 0.3AQ 12.31 456 3,191 6.9 133.2 133.2 133.3 0.1AR 12.56 162 1,927 11.4 139.0 139.0 139.1 0.1AS 12.68 212 3,163 6.9 142.2 142.2 142.3 0.1AT 12.83 510 2,008 10.7 144.1 144.1 144.1 0.0AU 13.25 389 3,061 7.0 157.1 157.1 157.7 0.6AV 13.51 662 3,480 6.1 163.3 163.3 163.5 0.2AW 13.85 204 1,962 10.9 172.3 172.3 172.9 0.6AX 14.15 513 3,604 5.9 180.0 180.0 180.2 0.2
(1)Stream distance in miles above mouth (4)Measured along profile baseline of East Fork Lewis River Path 1(2)Elevations calculated without consideration of ridge along right overbank (5)Cross section does not cross East Fork Lewis River Path 1(3)Elevations computed with consideration of ridge along right overbank
FLOODING SOURCE FLOODWAY
TAB
LE 6
FLOODWAY DATAFEDERAL EMERGENCY MANAGEMENT AGENCY
CLARK COUNTY, WASHINGTONAND INCORPORATED AREAS EAST FORK LEWIS RIVER
1-PERCENT ANNUAL CHANCE FLOODWATER SURFACE ELEVATION
SECTION MEAN WITHOUT WITHCROSS SECTION DISTANCE1 WIDTH AREA VELOCITY REGULATORY FLOODWAY FLOODWAY INCREASE
(FT.) (SQ. FT.) (F. P. S.) (NAVD88) (NAVD88) (NAVD88)
EAST FORK LEWIS RIVER PATH 2
A-S2 T 7.74 872 7,262 3.3 36.33 / 36.34 36.3 36.6 0.7U 7.99 418 1,941 5.9 36.33 /36.34 37.1 37.6 0.5V 8.05 273 1,791 12.5 37.83 / 37.94 37.8 38.1 0.3W 8.19 862 12,158 3.7 41.03 / 41.34 41.0 41.3 0.3X 8.29 371 2,440 6.5 41.13 / 41.44 41.1 41.4 0.3
(1)Stream distance in miles above mouth (4)Elevations computed with consideration of ridge along right overbank(2)Path 2 diverges from East Fork Lewis River at Cross Section T(3)Elevations computed without consideration of ridge along right overbank
FLOODING SOURCE FLOODWAY1-PERCENT ANNUAL CHANCE FLOOD
WATER SURFACE ELEVATION
TAB
LE 6
FLOODWAY DATAFEDERAL EMERGENCY MANAGEMENT AGENCY
CLARK COUNTY, WASHINGTONAND INCORPORATED AREAS EAST FORK LEWIS RIVER PATH 2

SECTION MEAN WITHOUT WITHCROSS SECTION DISTANCE1 WIDTH AREA VELOCITY REGULATORY FLOODWAY FLOODWAY INCREASE
(FT.) (SQ. FT.) (F. P. S.) (NAVD88) (NAVD88) (NAVD88)
EAST FORK LEWIS RIVER PATH 3
A-R2 S 7.53 3,162 18,334 1.6 35.53 / 35.64 35.5 36.2 0.7T 7.62 1,067 4,548 1.1 35.73 / 35.74 35.7 36.4 0.7U 7.75 868 2,234 2.3 37.13 / 37.24 37.1 37.4 0.3V 7.97 272 1,667 3.1 40.03 / 40.24 40.0 40.2 0.2
(1)Stream distance in miles above mouth (4)Elevations computed with consideration of ridge along right overbank(2)Path 2 diverges from East Fork Lewis River at Cross Section T(3)Elevations computed without consideration of ridge along right overbank
FLOODING SOURCE FLOODWAY
TAB
LE 6
FLOODWAY DATAFEDERAL EMERGENCY MANAGEMENT AGENCY
CLARK COUNTY, WASHINGTONAND INCORPORATED AREAS EAST FOR LEWIS RIVER PATH 3
1-PERCENT ANNUAL CHANCE FLOODWATER SURFACE ELEVATION
SECTION MEAN WITHOUT WITHCROSS SECTION DISTANCE1 WIDTH AREA VELOCITY REGULATORY FLOODWAY FLOODWAY INCREASE
(FT.) (SQ. FT.) (F. P. S.) (NAVD88) (NAVD88) (NAVD88)
FIFTH PLAIN CREEKA 0.19 195 673 4.8 214.7 214.7 214.9 0.2B 0.32 29 205 10.9 216.2 216.2 216.8 0.6 C 0.44 34 257 7.6 220.0 220.0 221.0 1.0D 0.57 45 321 6.8 226.8 226.8 226.9 0.1E 0.66 44 293 6.7 228.1 228.1 228.2 0.1F 0.83 39 240 8.2 231.2 231.2 231.7 0.5G 1.10 49 271 8.9 239.1 239.1 239.2 0.1H 1.26 42 233 10.1 243.4 243.4 243.4 0.0I 1.33 68 357 6.2 245.8 245.8 246.0 0.2J 1.38 70 354 6.5 246.3 246.3 247.2 0.9K 1.43 39 301 7.1 247.9 247.9 248.3 0.4L 1.58 48 391 5.8 249.8 249.8 250.5 0.7M 1.79 50 353 3.5 251.7 251.7 252.5 0.8N 1.86 50 263 4.9 252.2 252.2 252.8 0.6O 1.99 65 236 5.7 253.9 253.9 254.5 0.6P 2.17 160 335 4.8 256.1 256.1 256.7 0.6Q 2.30 230 427 2.1 257.0 257.0 257.9 0.9R 2.60 257 308 3.4 260.0 260.0 260.9 0.9S 2.78 14 78 7.2 263.9 263.9 264.5 0.6T 2.90 27 135 4.8 267.9 267.9 268.6 0.7U 3.06 16 97 5.7 271.9 271.9 272.7 0.8V 3.17 75 354 2.8 275.9 275.9 276.7 0.8W 3.36 21 90 8.0 284.6 284.6 285.3 0.7X 3.49 20 123 5.5 294.5 294.5 294.9 0.4Y 3.61 23 93 6.0 298.6 298.6 299.2 0.6Z 3.80 64 139 6.8 311.2 311.2 312.1 0.9
(1)Stream distance in miles above confluence with Lacamas Creek
FIFTH PLAIN CREEKAND INCORPORATED AREAS
TAB
LE 6
FLOODWAY DATA
FLOODING SOURCE FLOODWAY1-PERCENT ANNUAL CHANCE FLOOD
WATER SURFACE ELEVATION
FEDERAL EMERGENCY MANAGEMENT AGENCY
CLARK COUNTY, WASHINGTON
SECTION MEAN WITHOUT WITHCROSS SECTION DISTANCE1 WIDTH AREA VELOCITY REGULATORY FLOODWAY FLOODWAY INCREASE
(FT.) (SQ. FT.) (F. P. S.) (NAVD88) (NAVD88) (NAVD88)
FITH PLAIN CREEK
AA 3.93 39 110 7.0 320.2 320.2 321.1 0.9AB 4.07 20 87 6.7 329.9 329.9 330.5 0.6 AC 4.25 21 73 6.3 341.8 341.8 342.7 0.9
(1)Stream distance in miles above confluence with Lacamas Creek
FIFTH PLAIN CREEKAND INCORPORATED AREAS
TAB
LE 6
FLOODWAY DATAFEDERAL EMERGENCY MANAGEMENT AGENCY
CLARK COUNTY, WASHINGTON
FLOODING SOURCE FLOODWAY1-PERCENT ANNUAL CHANCE FLOOD
WATER SURFACE ELEVATION
SECTION MEAN WITHOUT WITHCROSS SECTION DISTANCE1 WIDTH AREA VELOCITY REGULATORY FLOODWAY FLOODWAY INCREASE
(FT.) (SQ. FT.) (F. P. S.) (NAVD88) (NAVD88) (NAVD88)
GEE CREEKA 0.04 48 323 3.8 27.0 20.32 21.02 0.7B 0.34 56 586 2.4 27.5 27.5 28.2 0.7 C 0.62 108 634 2.9 27.7 27.7 28.7 1.0D 0.91 92 526 2.8 29.7 29.7 30.3 0.6E 1.00 117 363 4.6 30.5 30.5 30.9 0.4F 1.11 69 228 6.1 33.0 33.0 33.7 0.7G 1.30 52 220 5.4 39.7 39.7 39.8 0.1H 1.42 63 308 4.5 43.0 43.0 43.2 0.2I 1.54 50 217 6.0 46.3 46.3 46.3 0.0J 1.65 101 285 5.6 50.0 50.0 50.2 0.2K 1.76 35 181 6.4 54.8 54.8 54.8 0.0L 1.89 31 142 7.0 59.4 59.4 59.5 0.1M 2.10 64 215 5.8 67.3 67.3 67.4 0.1N 2.26 39 173 6.0 72.6 72.6 72.7 0.1O 2.35 44 190 5.1 75.7 75.7 75.9 0.2P 2.89 37 195 4.9 90.3 90.3 90.8 0.5Q 3.21 43 226 4.8 99.7 99.7 100.3 0.6R 3.38 45 223 4.3 103.3 103.3 103.5 0.2S 3.64 55 211 5.8 111.1 111.1 111.4 0.3T 3.98 50 194 5.0 120.5 120.5 121.2 0.7U 4.18 89 240 5.3 127.6 127.6 128.5 0.9V 4.27 29 102 7.3 131.4 131.4 131.6 0.2W 4.33 26 180 4.2 135.0 135.0 135.1 0.1X 4.56 34 179 4.2 139.0 139.0 139.5 0.5Y 4.67 34 155 4.8 142.3 142.3 142.7 0.4Z 4.83 35 155 5.1 147.5 147.5 147.7 0.2
(1)Stream distance in miles above downstream face of BNSF railroad culvert(2)Elevation computed without consideration of backwater from Columbia River
FLOODING SOURCE FLOODWAY1-PERCENT ANNUAL CHANCE FLOOD
WATER SURFACE ELEVATION
TAB
LE 6
FLOODWAY DATAFEDERAL EMERGENCY MANAGEMENT AGENCY
CLARK COUNTY, WASHINGTONAND INCORPORATED AREAS GEE CREEK
SECTION MEAN WITHOUT WITHCROSS SECTION DISTANCE1 WIDTH AREA VELOCITY REGULATORY FLOODWAY FLOODWAY INCREASE
(FT.) (SQ. FT.) (F. P. S.) (NAVD88) (NAVD88) (NAVD88)
GEE CREEK
AA 4.96 30 178 4.2 151.2 151.2 151.8 0.6AB 5.09 41 227 3.3 153.6 153.6 154.3 0.7 AC 5.16 34 207 3.6 158.0 158.0 158.1 0.1AD 5.51 24 150 5.0 168.3 168.3 168.4 0.1AE 5.94 40 207 3.6 176.7 176.7 177.2 0.5AF 5.98 24 119 6.2 181.4 181.4 181.4 0.0AG 6.32 60 249 4.1 184.1 184.1 185.1 1.0AH 6.45 58 279 3.9 186.9 186.9 187.7 0.8AI 6.59 37 265 2.9 188.9 188.9 189.8 0.9AJ 6.68 43 308 2.9 192.7 192.7 192.8 0.1AK 6.83 44 249 4.2 194.7 194.7 195.4 0.7AL 7.22 23 120 3.6 200.8 200.8 201.6 0.8AM 7.25 26 260 1.5 206.1 206.1 206.9 0.8AN 7.51 38 174 2.7 206.5 206.5 207.4 0.9AO 7.64 32 134 3.1 207.4 207.4 208.4 1.0AP 7.80 18 87 4.5 211.5 211.5 211.6 0.1AQ 7.85 13 83 1.5 213.9 213.9 214.0 0.1AR 7.95 12 68 1.8 214.9 214.9 215.4 0.5AS 8.04 12 60 2.1 215.3 215.3 216.0 0.7AT 8.08 15 97 1.7 218.0 218.0 218.7 0.7AU 8.23 23 132 1.3 218.4 218.4 219.2 0.8AV 8.30 17 71 1.8 221.6 221.6 222.4 0.8AW 8.51 26 85 1.3 221.9 221.9 222.9 1.0AX 8.61 16 53 1.9 224.7 224.7 225.6 0.9AY 8.75 11 22 2.0 227.4 227.4 227.8 0.4AZ 8.88 16 62 0.9 233.8 233.8 234.0 0.2
(1)Stream distance in miles above downstream face of BNSF railroad culvert(2)Elevation computed without consideration of backwater from Columbia River
FLOODING SOURCE FLOODWAY1-PERCENT ANNUAL CHANCE FLOOD
WATER SURFACE ELEVATION
TAB
LE 6
FLOODWAY DATAFEDERAL EMERGENCY MANAGEMENT AGENCY
CLARK COUNTY, WASHINGTONAND INCORPORATED AREAS GEE CREEK
SECTION MEAN WITHOUT WITHCROSS SECTION DISTANCE1 WIDTH AREA VELOCITY REGULATORY FLOODWAY FLOODWAY INCREASE
(FT.) (SQ. FT.) (F. P. S.) (NAVD88) (NAVD88) (NAVD88)
GEE CREEKBA 9.04 9 19 2.3 239.1 239.1 239.1 0.0BB 9.12 17 43 1.2 244.9 244.9 244.9 0.0 BC 9.24 9 19 2.3 246.9 246.9 247.4 0.5BD 9.32 8 20 1.1 256.7 256.7 256.7 0.0BE 9.38 11 6 3.7 259.9 259.9 259.9 0.0BF 9.48 15 33 0.7 268.8 268.8 268.9 0.1BG 9.57 11 25 1.2 275.6 275.6 275.6 0.0BH 9.73 4 11 2.2 287.7 287.7 288.4 0.7BI 9.98 22 10 2.3 314.7 314.7 314.7 0.0
(1)Stream distance in miles above downstream face of BNSF railroad culvert(2)Elevation computed without consideration of backwater from Columbia River
FLOODING SOURCE FLOODWAY1-PERCENT ANNUAL CHANCE FLOOD
WATER SURFACE ELEVATION
TAB
LE 6
FLOODWAY DATAFEDERAL EMERGENCY MANAGEMENT AGENCY
CLARK COUNTY, WASHINGTONAND INCORPORATED AREAS GEE CREEK
SECTION MEAN WITHOUT WITHCROSS SECTION DISTANCE WIDTH AREA VELOCITY REGULATORY FLOODWAY FLOODWAY INCREASE
(FT.) (SQ. FT.) (F. P. S.) (NAVD88) (NAVD88) (NAVD88)
LACAMAS CREEKA 0.001 39 386 13.3 35.0 4 31.6 32.6 0.9B 0.031 45 638 8.0 42.0 42.0 43.0 1.0 C 0.081 150 3,926 2.4 43.5 43.5 44.3 0.7D 0.171 180 4,263 2.1 43.5 43.5 44.4 0.9E 0.231 240 5,075 1.8 43.5 43.5 44.4 0.9F 0.361 145 2,863 2.8 43.5 43.5 44.4 0.9G 0.481 80 1,417 4.4 43.6 43.6 44.5 0.9H 0.571 65 844 7.7 44.1 44.1 45.0 0.9I 0.651 64 522 11.5 50.4 50.4 51.4 0.9J 0.701 113 608 10.1 99.9 99.9 99.9 0.0K 0.741 76 525 11.0 104.5 104.5 104.5 0.0L 0.841 61 486 10.4 115.5 115.5 115.9 0.5M 0.871 63 547 9.2 116.8 116.8 117.4 0.6N 1.001 40 513 13.0 125.1 125.1 125.7 0.7O 1.141 54 677 9.3 132.8 132.8 133.5 0.7P 1.191 55 351 14.4 149.0 149.0 149.4 0.4Q 1.251 56 718 11.2 158.8 158.8 159.8 1.0R 1.281 51 696 11.7 160.4 160.4 161.2 0.8S 1.341 45 671 11.1 163.5 163.5 164.2 0.7T 0.002 121 1,135 4.0 191.1 187.03 188.03 1.0U 0.402 98 819 6.7 191.5 188.93 189.73 0.8V 0.712 195 1,409 4.7 192.1 190.43 191.23 0.8W 1.022 362 1,757 6.2 193.1 192.53 193.33 0.8X 1.082 913 3,062 3.1 195.2 195.2 195.8 0.6Y 1.432 1,040 4,405 2.5 196.0 196.0 197.0 1.0Z 1.772 1,349 4,981 2.1 196.5 196.5 197.5 1.0
(1)Stream distance in miles above 3rd Avenue Culvert (4) Elevation computed with consideration of backwater from Washougal River(2)Stream distance in miles above Lacamas Lake(3)Elevation computed without consideration of backwater from Lacamas Lake
FLOODING SOURCE FLOODWAY1-PERCENT ANNUAL CHANCE FLOOD
WATER SURFACE ELEVATION
TAB
LE 6
FLOODWAY DATAFEDERAL EMERGENCY MANAGEMENT AGENCY
CLARK COUNTY, WASHINGTONAND INCORPORATED AREAS LACAMAS CREEK
SECTION MEAN WITHOUT WITHCROSS SECTION DISTANCE1 WIDTH AREA VELOCITY REGULATORY FLOODWAY FLOODWAY INCREASE
(FT.) (SQ. FT.) (F. P. S.) (NAVD88) (NAVD88) (NAVD88)
LACAMAS CREEKAA 2.02 1,022 3,397 2.1 197.1 197.1 198.1 0.9AB 2.22 1,080 4,226 1.5 197.6 197.6 198.4 0.8 AC 2.46 1,146 4,682 1.2 197.9 197.9 198.6 0.7AD 2.97 1,653 5,701 1.2 198.3 198.3 199.1 0.7AE 3.64 1,389 3,374 2.2 199.1 199.1 199.8 0.7AF 4.05 1,357 3,143 2.4 200.1 200.1 200.9 0.8AG 4.38 1,235 2,768 3.0 201.1 201.1 201.9 0.8AH 4.75 1,239 2,208 4.1 202.7 202.7 203.6 0.9AI 5.14 1,058 2,307 3.7 205.6 205.6 206.4 0.8AJ 5.51 1,034 2,434 3.3 207.4 207.4 208.1 0.7AK 5.79 796 1,798 2.0 208.6 208.6 209.0 0.4AL 5.97 433 876 4.4 211.1 211.1 211.6 0.5AM 6.16 239 455 7.1 214.5 214.5 215.1 0.6AN 6.30 130 613 5.5 219.6 219.6 220.0 0.4AO 6.55 82 542 4.9 221.3 221.3 222.2 0.9AP 6.71 114 490 6.1 223.9 223.9 224.6 0.7AQ 6.92 320 1,003 3.8 226.9 226.9 227.4 0.5AR 7.08 343 546 6.7 228.5 228.5 229.1 0.6AS 7.23 288 571 7.5 232.3 232.3 233.1 0.8AT 7.38 90 353 7.6 236.1 236.1 236.6 0.5AU 7.47 104 394 7.5 238.7 238.7 239.6 0.9AV 7.62 100 450 7.0 242.4 242.4 243.4 1.0AW 7.78 93 462 5.2 246.6 246.6 247.1 0.5AX 7.90 92 405 7.0 249.3 249.3 249.7 0.4AY 8.07 51 334 7.0 254.9 254.9 255.4 0.5AZ 8.16 85 422 7.2 257.2 257.2 257.8 0.6
(1)Stream distance in miles above Lacamas Lake
FLOODING SOURCE FLOODWAY1-PERCENT ANNUAL CHANCE FLOOD
TAB
LE 6
FLOODWAY DATAFEDERAL EMERGENCY MANAGEMENT AGENCY
CLARK COUNTY, WASHINGTONAND INCORPORATED AREAS LACAMAS CREEK
WATER SURFACE ELEVATION

SECTION MEAN WITHOUT WITHCROSS SECTION DISTANCE1 WIDTH AREA VELOCITY REGULATORY FLOODWAY FLOODWAY INCREASE
(FT.) (SQ. FT.) (F. P. S.) (NAVD88) (NAVD88) (NAVD88)
LACAMAS CREEKBA 8.27 157 561 6.8 261.0 261.0 261.5 0.6BB 8.44 55 313 8.1 265.4 265.4 266.2 0.8 BC 8.59 79 450 5.2 271.3 271.3 272.2 0.9BD 8.81 67 406 5.8 277.3 277.3 278.1 0.8BE 8.94 51 397 5.9 281.6 281.6 282.4 0.8
(1)Stream distance in miles above Lacamas Lake
FLOODING SOURCE FLOODWAY1-PERCENT ANNUAL CHANCE FLOOD
WATER SURFACE ELEVATION
TAB
LE 6
FLOODWAY DATAFEDERAL EMERGENCY MANAGEMENT AGENCY
CLARK COUNTY, WASHINGTONAND INCORPORATED AREAS LACAMAS CREEK
SECTION MEAN WITHOUT WITHCROSS SECTION DISTANCE1 WIDTH AREA VELOCITY REGULATORY FLOODWAY FLOODWAY INCREASE
(FT.) (SQ. FT.) (F. P. S.) (NAVD88) (NAVD88) (NAVD88)
LEWIS RIVERA 0.67 969 / 5502 17,362 7.6 26.5 20.6 21.6 1.0B 1.19 818 / 4002 15,387 8.6 26.5 22.0 23.0 1.0 C 1.70 788 / 4002 17,223 7.7 26.5 23.5 24.5 0.7D 1.75 799 / 3502 16,995 7.8 26.5 24.2 25.2 1.0E 2.38 884 / 4202 17,318 7.7 26.5 26.0 26.6 0.6F 2.98 636 / 2402 14,395 9.2 27.2 27.2 28.0 0.8G 3.18 536 / 2362 12,769 10.4 27.7 27.7 28.4 0.7H 3.38 1,090 / 2402 16,615 8.0 28.6 28.6 29.3 0.7I 3.70 1,130 / 5002 19,165 5.3 30.4 30.4 30.9 0.5J 3.90 655 / 3202 15,104 6.8 30.6 30.6 31.1 0.5K 4.29 1,151 / 8502 19,207 5.3 31.2 31.2 31.7 0.5L 5.01 715 / 3152 17,108 6.0 32.1 32.1 32.7 0.6M 5.27 547 / 2472 12,906 7.9 32.1 32.1 32.7 0.6N 5.35 660 / 3102 15,763 6.5 32.7 32.7 33.3 0.6O 5.42 581 / 3202 14,943 6.8 32.8 32.8 33.4 0.6P 5.48 511 / 2502 14,815 6.9 32.8 32.8 33.4 0.6Q 5.95 762 17,384 5.9 33.7 33.7 34.2 0.5R 6.54 490 / 2102 13,418 7.6 34.5 34.5 35.5 1.0S 7.13 512 / 2322 14,974 6.8 35.9 35.9 36.7 0.8T 7.69 1,466 / 1662 22,075 4.6 36.9 36.9 37.8 0.9U 8.13 716 / 3852 17,283 5.9 37.6 37.6 38.5 0.9V 8.39 851 / 4902 17,418 5.9 38.0 38.0 38.8 0.8W 8.61 512 / 2122 12,213 8.4 38.2 38.2 39.0 0.8X 9.20 1,709 / 1,5302 27,613 3.7 39.8 39.8 40.6 0.8Y 9.85 1,420 / 1,3002 28,526 3.6 40.6 40.6 41.5 0.9Z 10.69 3,021 / 2,8362 33,201 3.1 41.5 41.5 42.4 0.9
(1)Stream distance in miles above mouth(2)Width/width within county limits(3)Elevation computed without consideration of backwater from Columbia River
FLOODING SOURCE FLOODWAY1-PERCENT ANNUAL CHANCE FLOOD
WATER SURFACE ELEVATION
TAB
LE 6
FLOODWAY DATAFEDERAL EMERGENCY MANAGEMENT AGENCY
CLARK COUNTY, WASHINGTONAND INCORPORATED AREAS LEWIS RIVER
SECTION MEAN WITHOUT WITHCROSS SECTION DISTANCE1 WIDTH AREA VELOCITY REGULATORY FLOODWAY FLOODWAY INCREASE
(FT.) (SQ. FT.) (F. P. S.) (NAVD88) (NAVD88) (NAVD88)
LEWIS RIVERAA 11.34 2,600 / 2,4302 30,012 3.4 42.3 42.3 43.2 0.9AB 11.67 724 / 6202 15,050 6.8 42.8 42.8 43.6 0.8 AC 12.48 420 / 1902 8,954 11.4 46.2 46.2 46.7 0.5AD 12.95 386 / 2262 9,518 10.7 50.2 50.2 50.5 0.3AE 13.50 990 / 8202 16,017 6.4 53.7 53.7 54.5 0.8AF 14.01 658 / 3882 14,327 7.1 55.8 55.8 56.8 1.0AG 14.44 691 / 3612 19,542 5.2 57.3 57.3 58.3 1.0AH 15.09 540 / 1502 11,444 8.9 58.5 58.5 59.5 1.0AI 15.36 373 / 2532 11,212 9.1 59.5 59.5 60.5 1.0AJ 15.67 499 / 1002 10,651 8.8 60.7 60.7 61.7 1.0AK 16.08 256 / 1302 7,868 11.9 62.2 62.2 63.1 0.9AL 16.35 313 / 2702 7,659 12.3 64.0 64.0 64.8 0.8AM 16.69 438 / 3782 10,160 9.3 66.3 66.3 67.3 1.0AN 17.08 330 / 1702 8,979 10.5 67.9 67.9 68.9 1.0AO 17.54 362 / 2022 8,967 10.5 70.5 70.5 71.4 0.9AP 17.91 257 / 1402 8,179 11.5 72.1 72.1 73.1 1.0AQ 18.26 339 / 1692 9,552 9.8 73.9 73.9 74.9 1.0AR 18.65 272 / 1122 8,394 11.2 75.4 75.4 76.4 1.0AS 19.06 356 / 1362 11,511 8.2 78.1 78.1 79.0 0.9
(1)Stream distance in miles above mouth(2)Width/width within county limits(3)Elevation computed without consideration of backwater from Columbia River
FLOODING SOURCE FLOODWAY1-PERCENT ANNUAL CHANCE FLOOD
TAB
LE 6
FLOODWAY DATAFEDERAL EMERGENCY MANAGEMENT AGENCY
CLARK COUNTY, WASHINGTONAND INCORPORATED AREAS LEWIS RIVER
WATER SURFACE ELEVATION

SECTION MEAN WITHOUT WITHCROSS SECTION DISTANCE1 WIDTH AREA VELOCITY REGULATORY FLOODWAY FLOODWAY INCREASE
(FT.) (SQ. FT.) (F. P. S.) (NAVD88) (NAVD88) (NAVD88)
MILL CREEKA 0.05 97 517 2.3 141.9 141.9 142.3 0.4B 0.26 60 203 5.6 149.7 149.7 149.7 0.0 C 0.44 51 158 6.3 159.1 159.1 159.1 0.7D 0.52 24 124 9.1 162.3 162.3 162.3 0.1E 0.53 26 170 5.9 164.7 164.7 164.7 0.0F 0.67 29 175 5.7 166.6 166.6 166.8 0.2G 0.89 104 346 4.4 169.3 169.3 169.9 0.0H 1.20 30 187 4.4 172.5 172.5 172.9 0.4I 1.50 46 204 4.5 175.9 175.9 176.6 0.6J 1.63 59 70 11.9 179.4 179.4 179.4 0.0K 1.64 121 145 5.7 183.7 183.7 183.7 0.0L 2.11 30 137 6.4 184.7 184.7 184.8 0.1M 2.13 34 276 4.0 192.5 192.5 192.5 0.0N 2.52 60 485 2.0 192.8 192.8 193.2 0.4O 2.88 86 408 2.2 193.1 193.1 194.0 0.9P 3.00 45 187 4.1 193.7 193.7 194.5 0.8Q 3.10 90 217 3.7 195.6 195.6 195.7 0.2R 3.20 26 116 4.1 196.6 196.6 196.9 0.3S 3.34 83 359 1.7 197.3 197.3 197.7 0.4T 3.43 146 562 1.0 199.0 199.0 199.3 0.3U 3.84 153 525 0.8 199.1 199.1 199.6 0.4V 4.27 168 183 2.6 199.1 199.1 199.8 0.7W 4.37 28 85 4.3 202.6 202.6 202.7 0.0X 4.51 24 75 4.9 207.2 207.2 207.2 0.0Y 4.64 29 85 4.3 212.6 212.6 212.6 0.0Z 4.77 31 106 2.8 217.1 217.1 217.1 0.0
(1)Stream distance in miles above confluence with Salmon Creek
TAB
LE 6
FLOODWAY DATACLARK COUNTY, WASHINGTON
MILL CREEKAND INCORPORATED AREAS
FEDERAL EMERGENCY MANAGEMENT AGENCY
FLOODING SOURCE FLOODWAY1-PERCENT ANNUAL CHANCE FLOOD
WATER SURFACE ELEVATION
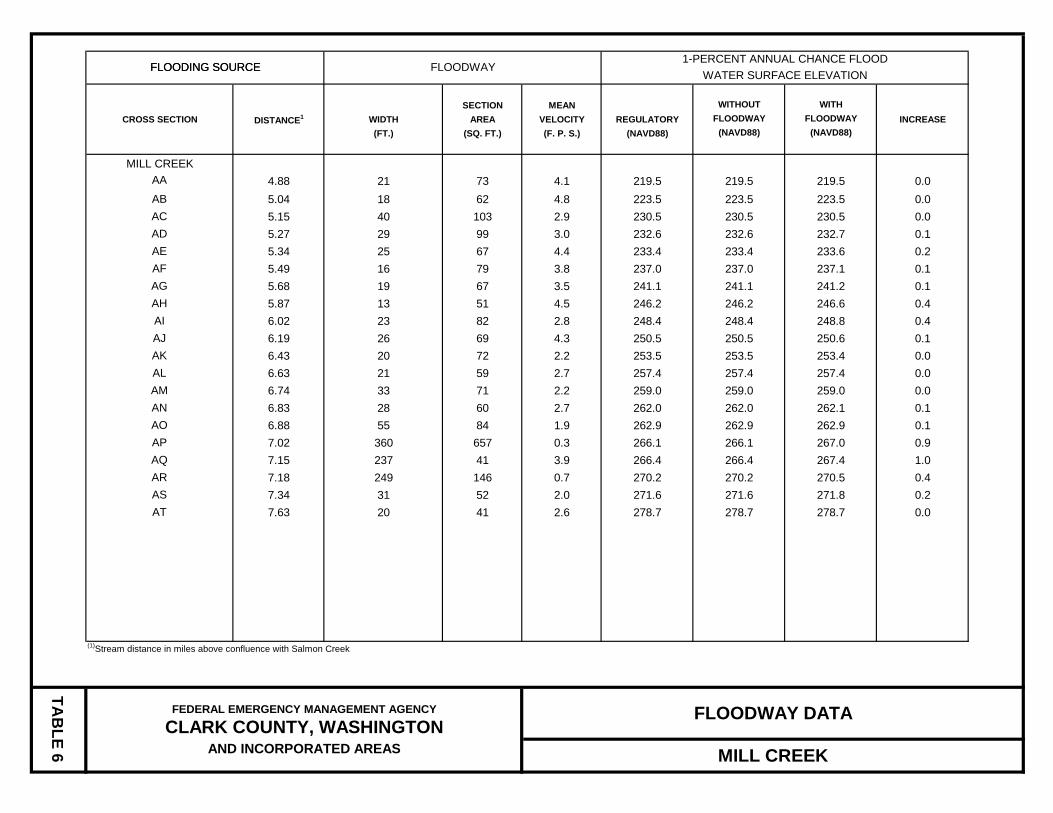
SECTION MEAN WITHOUT WITHCROSS SECTION DISTANCE1 WIDTH AREA VELOCITY REGULATORY FLOODWAY FLOODWAY INCREASE
(FT.) (SQ. FT.) (F. P. S.) (NAVD88) (NAVD88) (NAVD88)
MILL CREEKAA 4.88 21 73 4.1 219.5 219.5 219.5 0.0AB 5.04 18 62 4.8 223.5 223.5 223.5 0.0 AC 5.15 40 103 2.9 230.5 230.5 230.5 0.0AD 5.27 29 99 3.0 232.6 232.6 232.7 0.1AE 5.34 25 67 4.4 233.4 233.4 233.6 0.2AF 5.49 16 79 3.8 237.0 237.0 237.1 0.1AG 5.68 19 67 3.5 241.1 241.1 241.2 0.1AH 5.87 13 51 4.5 246.2 246.2 246.6 0.4AI 6.02 23 82 2.8 248.4 248.4 248.8 0.4AJ 6.19 26 69 4.3 250.5 250.5 250.6 0.1AK 6.43 20 72 2.2 253.5 253.5 253.4 0.0AL 6.63 21 59 2.7 257.4 257.4 257.4 0.0AM 6.74 33 71 2.2 259.0 259.0 259.0 0.0AN 6.83 28 60 2.7 262.0 262.0 262.1 0.1AO 6.88 55 84 1.9 262.9 262.9 262.9 0.1AP 7.02 360 657 0.3 266.1 266.1 267.0 0.9AQ 7.15 237 41 3.9 266.4 266.4 267.4 1.0AR 7.18 249 146 0.7 270.2 270.2 270.5 0.4AS 7.34 31 52 2.0 271.6 271.6 271.8 0.2AT 7.63 20 41 2.6 278.7 278.7 278.7 0.0
(1)Stream distance in miles above confluence with Salmon Creek
TAB
LE 6
FLOODWAY DATAFEDERAL EMERGENCY MANAGEMENT AGENCY
CLARK COUNTY, WASHINGTON
FLOODING SOURCE1-PERCENT ANNUAL CHANCE FLOOD
AND INCORPORATED AREAS
FLOODING SOURCEWATER SURFACE ELEVATION
MILL CREEK
FLOODWAY

SECTION MEAN WITHOUT WITHCROSS SECTION DISTANCE1 WIDTH AREA VELOCITY REGULATORY FLOODWAY FLOODWAY INCREASE
(FT.) (SQ. FT.) (F. P. S.) (NAVD88) (NAVD88) (NAVD88)
PACKARD CREEKA 386 13 75 2.7 65.7 65.52 65.52 0.0B 771 15 55 3.7 66.9 66.9 67.4 0.5 C 2,204 11 48 4.2 77.0 77.0 77.9 0.9D 3,123 15 48 4.2 84.8 84.8 85.5 0.7E 3,358 10 46 4.4 87.1 87.1 87.7 0.6F 3,746 12 80 2.5 93.0 93.0 93.3 0.4G 3,955 36 79 3.9 94.1 94.1 95.1 1.0H 4,085 9 56 3.6 94.8 94.8 95.7 0.9I 4,472 11 47 4.3 97.3 97.3 98.2 0.9J 5,729 11 55 3.6 109.4 109.4 110.2 0.8K 6,128 11 45 4.4 113.9 113.9 114.7 0.8L 6,813 6 21 3.0 122.1 122.1 122.8 0.6M 7,680 5 16 4.1 133.0 133.0 133.9 0.9N 7,846 8 24 2.6 135.7 135.7 136.3 0.6O 9,238 7 19 3.5 160.0 160.0 160.6 0.6P 10,186 5 14 4.6 183.7 183.7 184.5 0.8Q 10,595 6 18 3.6 195.0 195.0 195.6 0.6R 11,347 6 14 4.5 221.2 221.2 221.5 0.3S 11,646 10 14 4.9 233.9 233.9 234.0 0.1T 11,825 9 31 2.4 244.0 244.0 244.0 0.0U 11,930 7 13 4.8 244.5 244.5 244.6 0.0V 12,465 23 129 0.7 271.3 271.3 272.0 0.7W 12,975 45 19 3.3 278.4 278.4 278.4 0.0X 13,500 44 26 2.5 290.2 290.2 290.3 0.1
(1)Stream distance in feet above confluence with Whipple Creek(2)Elevation computed without consideration of backwater from Whipple Creek
FLOODING SOURCE FLOODWAY1-PERCENT ANNUAL CHANCE FLOOD
WATER SURFACE ELEVATION
TAB
LE 6
FLOODWAY DATAFEDERAL EMERGENCY MANAGEMENT AGENCY
CLARK COUNTY, WASHINGTONAND INCORPORATED AREAS PACKARD CREEK
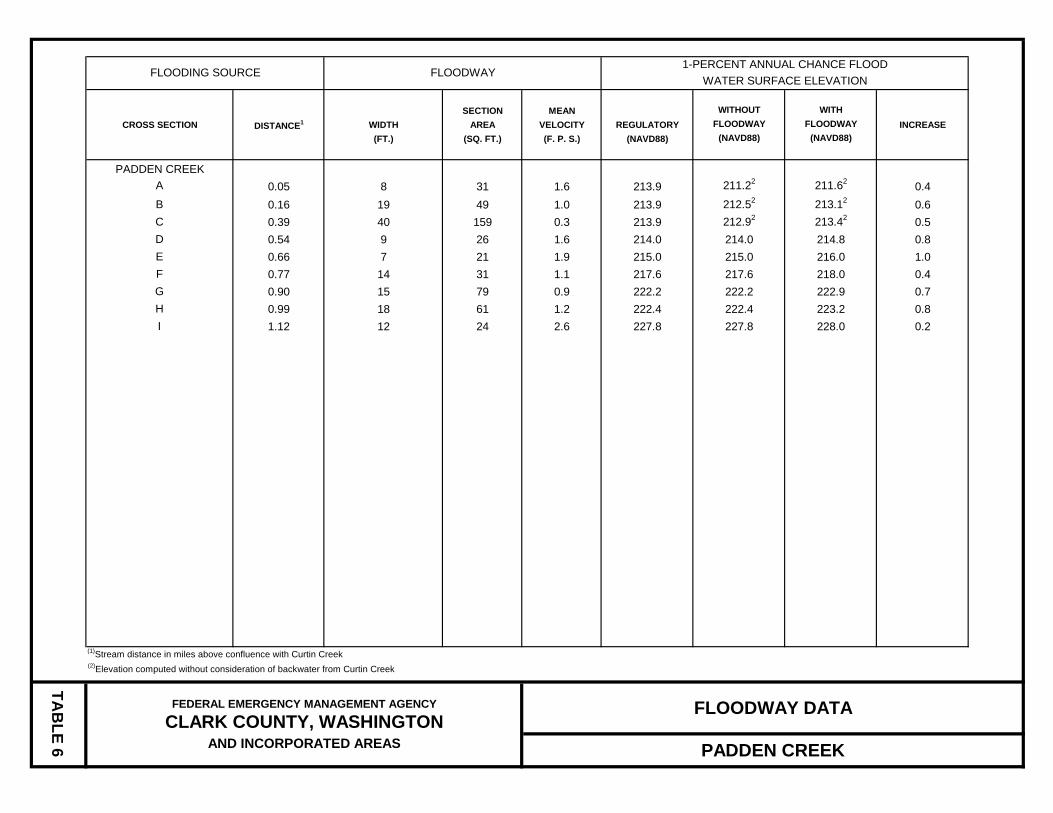
SECTION MEAN WITHOUT WITHCROSS SECTION DISTANCE1 WIDTH AREA VELOCITY REGULATORY FLOODWAY FLOODWAY INCREASE
(FT.) (SQ. FT.) (F. P. S.) (NAVD88) (NAVD88) (NAVD88)
PADDEN CREEKA 0.05 8 31 1.6 213.9 211.22 211.62 0.4B 0.16 19 49 1.0 213.9 212.52 213.12 0.6 C 0.39 40 159 0.3 213.9 212.92 213.42 0.5D 0.54 9 26 1.6 214.0 214.0 214.8 0.8E 0.66 7 21 1.9 215.0 215.0 216.0 1.0F 0.77 14 31 1.1 217.6 217.6 218.0 0.4G 0.90 15 79 0.9 222.2 222.2 222.9 0.7H 0.99 18 61 1.2 222.4 222.4 223.2 0.8I 1.12 12 24 2.6 227.8 227.8 228.0 0.2
(1)Stream distance in miles above confluence with Curtin Creek(2)Elevation computed without consideration of backwater from Curtin Creek
FLOODING SOURCE FLOODWAY1-PERCENT ANNUAL CHANCE FLOOD
WATER SURFACE ELEVATION
TAB
LE 6
FLOODWAY DATAFEDERAL EMERGENCY MANAGEMENT AGENCY
CLARK COUNTY, WASHINGTONAND INCORPORATED AREAS PADDEN CREEK

SECTION MEAN WITHOUT WITHCROSS SECTION DISTANCE1 WIDTH AREA VELOCITY REGULATORY FLOODWAY FLOODWAY INCREASE
(FT.) (SQ. FT.) (F. P. S.) (NAVD88) (NAVD88) (NAVD88)
SALMON CREEKA 0.61 121 1,626 3.1 29.0 27.12 28.12 1.0B 1.43 941 16,632 0.6 29.2 27.32 28.32 1.0 C 1.90 790 13,181 0.8 29.2 27.32 28.32 0.9D 2.46 363 6,023 1.6 29.3 27.62 28.52 0.9E 3.13 1,208 20,356 0.4 29.4 27.62 28.62 1.0F 3.86 1,076 15,628 0.6 29.4 27.62 28.62 1.0G 4.27 1,009 11,756 0.8 29.4 27.62 28.62 1.0H 4.83 986 5,350 2.4 29.4 27.72 28.72 1.0I 5.09 594 2,150 5.1 29.7 28.62 29.22 0.6J 5.33 487 1,540 5.6 34.3 34.3 34.3 0.0K 5.60 448 955 6.5 39.6 39.6 39.6 0.0L 5.73 294 1,722 4.7 41.4 41.4 41.4 0.0M 5.90 364 1,231 5.5 46.4 46.4 46.4 0.0N 6.01 57 454 10.2 49.4 49.4 49.4 0.0O 6.20 86 568 7.9 54.0 54.0 54.0 0.0P 6.42 49 312 14.4 56.7 56.7 56.7 0.0Q 6.52 131 664 7.3 63.2 63.2 63.2 0.0R 6.63 81 668 6.7 74.5 74.5 74.5 0.0S 6.82 205 1,166 6.4 78.4 78.4 78.5 0.1T 6.92 84 398 12.0 79.5 79.5 79.9 0.5U 7.01 141 662 7.0 84.7 84.7 84.7 0.0V 7.19 121 607 8.7 88.8 88.8 88.8 0.0W 7.40 75 496 9.0 96.0 96.0 96.0 0.0X 7.49 272 1,201 5.6 98.7 98.7 98.8 0.1Y 7.64 136 855 7.0 100.8 100.8 101.4 0.5Z 7.83 73 666 6.3 106.3 106.3 107.0 0.7
(1)Stream distance in miles above confluence with Columbia River(2)Elevation computed without consideration of backwater from Columbia River
FLOODING SOURCE FLOODWAY1-PERCENT ANNUAL CHANCE FLOOD
WATER SURFACE ELEVATION
TAB
LE 6
FLOODWAY DATAFEDERAL EMERGENCY MANAGEMENT AGENCY
CLARK COUNTY, WASHINGTONAND INCORPORATED AREAS SALMON CREEK

SECTION MEAN WITHOUT WITHCROSS SECTION DISTANCE1 WIDTH AREA VELOCITY REGULATORY FLOODWAY FLOODWAY INCREASE
(FT.) (SQ. FT.) (F. P. S.) (NAVD88) (NAVD88) (NAVD88)
SALMON CREEKAA 7.90 161 977 4.7 108.0 108.0 108.4 0.4AB 7.97 146 707 8.3 108.8 108.8 109.1 0.2 AC 8.05 214 983 6.3 111.0 111.0 111.1 0.1AD 8.22 196 718 8.0 114.4 114.4 114.6 0.2AE 8.30 474 1,630 5.7 116.2 116.2 116.7 0.5AF 8.43 310 1,040 6.0 118.5 118.5 119.0 0.5AG 8.57 240 891 7.0 122.4 122.4 123.1 0.7AH 8.72 114 784 6.2 127.0 127.0 127.0 0.0AI 8.88 84 592 7.1 128.9 128.9 129.5 0.6AJ 9.03 282 1,185 5.8 134.0 134.0 134.5 0.5AK 9.19 377 997 7.4 137.4 137.4 137.4 0.0AL 9.30 395 1,445 5.8 140.1 140.1 140.6 0.6AM 9.41 148 762 5.7 142.8 142.8 142.9 0.1AN 9.48 131 730 5.1 144.0 144.0 144.3 0.3AO 9.67 101 665 5.6 147.0 147.0 147.6 0.7AP 9.81 124 748 5.0 150.7 150.7 150.8 0.2AQ 9.91 189 1,010 5.3 152.4 152.4 152.5 0.1AR 10.10 84 621 6.0 155.1 155.1 155.4 0.3AS 10.30 111 656 6.5 158.5 158.5 158.7 0.1AT 10.40 145 721 6.9 160.4 160.4 160.5 0.0AU 10.52 150 909 5.3 162.5 162.5 162.4 0.0AV 10.75 142 802 5.5 164.5 164.5 165.0 0.6AW 10.93 201 897 5.7 166.5 166.5 167.1 0.6AX 11.17 377 1,579 4.5 168.5 168.5 169.4 0.9AY 11.31 305 1,218 4.5 169.4 169.4 170.0 0.7AZ 11.43 94 636 6.2 171.3 171.3 171.6 0.3
(1)Stream distance in miles above confluence with Columbia River(2)Elevation computed without consideration of backwater from Columbia River
FLOODING SOURCE FLOODWAY1-PERCENT ANNUAL CHANCE FLOOD
WATER SURFACE ELEVATION
TAB
LE 6
FLOODWAY DATAFEDERAL EMERGENCY MANAGEMENT AGENCY
CLARK COUNTY, WASHINGTONAND INCORPORATED AREAS SALMON CREEK

SECTION MEAN WITHOUT WITHCROSS SECTION DISTANCE1 WIDTH AREA VELOCITY REGULATORY FLOODWAY FLOODWAY INCREASE
(FT.) (SQ. FT.) (F. P. S.) (NAVD88) (NAVD88) (NAVD88)
SALMON CREEKBA 11.51 175 804 6.2 172.2 172.2 172.5 0.3BB 11.70 166 814 4.6 174.5 174.5 174.7 0.2 BC 11.84 271 817 4.4 175.6 175.6 175.8 0.2BD 11.96 91 572 6.3 176.4 176.4 176.6 0.2BE 12.16 202 904 5.7 178.0 178.0 178.5 0.5BF 12.33 284 827 6.0 179.7 179.7 180.1 0.4BG 12.51 256 1,119 4.1 181.7 181.7 181.8 0.1BH 12.71 200 1,067 4.9 182.4 182.4 182.5 0.1BI 13.01 372 1,054 6.5 183.3 183.3 183.5 0.2BJ 13.39 179 793 4.7 186.5 186.5 186.5 0.0BK 13.56 281 1,109 5.8 187.6 187.6 187.7 0.1BL 13.70 421 1,232 5.3 188.7 188.7 188.9 0.2BM 13.86 179 604 6.9 189.8 189.8 190.2 0.3BN 13.93 264 1,531 2.5 193.3 193.3 193.8 0.5BO 14.03 460 1,883 2.9 193.5 193.5 194.0 0.5BP 14.47 498 1,351 4.4 195.4 195.4 195.7 0.3BQ 14.78 42 320 8.4 199.8 199.8 199.8 0.0BR 14.82 256 1,343 4.0 201.3 201.3 201.8 0.5BS 15.08 298 923 5.2 203.2 203.2 203.7 0.5BT 15.22 97 542 5.0 205.6 205.6 205.7 0.1BU 15.38 124 479 5.6 209.0 209.0 209.1 0.1BV 15.56 196 958 6.0 212.6 212.6 212.6 0.1BW 15.76 128 560 5.2 214.9 214.9 215.1 0.2BX 15.93 62 392 7.3 217.6 217.6 218.2 0.6BY 16.16 93 546 5.5 221.9 221.9 222.8 0.9BZ 16.32 191 823 4.5 223.9 223.9 224.9 1.0
(1)Stream distance in miles above confluence with Columbia River(2)Elevation computed without consideration of backwater from Columbia River
FLOODING SOURCE FLOODWAY1-PERCENT ANNUAL CHANCE FLOOD
WATER SURFACE ELEVATION
TAB
LE 6
FLOODWAY DATAFEDERAL EMERGENCY MANAGEMENT AGENCY
CLARK COUNTY, WASHINGTONAND INCORPORATED AREAS SALMON CREEK

SECTION MEAN WITHOUT WITHCROSS SECTION DISTANCE1 WIDTH AREA VELOCITY REGULATORY FLOODWAY FLOODWAY INCREASE
(FT.) (SQ. FT.) (F. P. S.) (NAVD88) (NAVD88) (NAVD88)
SALMON CREEKCA 16.51 108 594 4.7 226.1 226.1 227.1 1.0CB 16.73 105 681 4.4 229.3 229.3 230.3 1.0 CC 16.88 63 455 5.4 230.9 230.9 231.8 0.9CD 17.03 87 544 5.0 234.2 234.2 234.9 0.7CE 17.19 284 763 4.6 235.6 235.6 236.7 1.0CF 17.27 88 669 3.6 236.8 236.8 237.4 0.6CG 17.38 66 513 4.8 237.3 237.3 238.1 0.7CH 17.48 48 394 6.2 238.9 238.9 239.6 0.7CI 17.58 52 419 5.9 240.9 240.9 241.4 0.5CJ 17.70 52 407 6.0 242.5 242.5 243.4 1.0CK 17.81 69 658 4.1 244.6 244.6 245.2 0.6CL 17.90 91 480 5.3 245.1 245.1 246.1 1.0CM 18.06 188 915 3.8 246.9 246.9 247.8 0.8CN 18.18 104 749 4.5 247.6 247.6 248.5 0.8CO 18.36 79 512 4.6 248.8 248.8 249.8 1.0CP 18.48 80 527 5.4 250.2 250.2 251.1 0.9CQ 18.63 160 634 4.4 252.1 252.1 252.9 0.8CR 18.80 207 845 4.5 254.1 254.1 254.7 0.6CS 18.92 140 516 6.1 255.6 255.6 256.4 0.7CT 19.02 80 500 5.2 258.7 258.7 259.1 0.4CU 19.20 330 1,407 2.7 262.9 262.9 263.8 0.9CV 19.60 159 473 5.9 266.0 266.0 266.7 0.7CW 19.83 93 582 4.6 269.4 269.4 270.3 0.9CX 20.00 125 642 4.8 272.2 272.2 273.1 0.8CY 20.14 142 643 4.2 274.2 274.2 275.2 1.0CZ 20.39 140 747 2.8 277.1 277.1 277.7 0.6
(1)Stream distance in miles above confluence with Columbia River(2)Elevation computed without consideration of backwater from Columbia River
FLOODING SOURCE FLOODWAY1-PERCENT ANNUAL CHANCE FLOOD
WATER SURFACE ELEVATION
TAB
LE 6
FLOODWAY DATAFEDERAL EMERGENCY MANAGEMENT AGENCY
CLARK COUNTY, WASHINGTONAND INCORPORATED AREAS SALMON CREEK
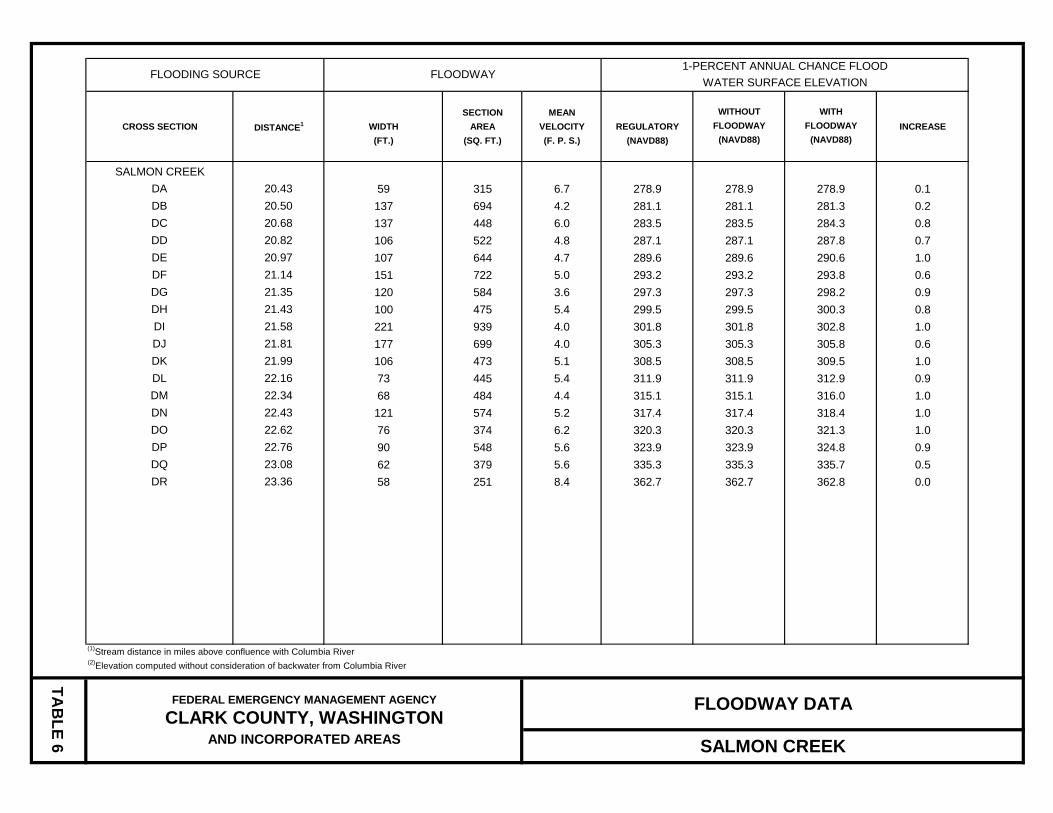
SECTION MEAN WITHOUT WITHCROSS SECTION DISTANCE1 WIDTH AREA VELOCITY REGULATORY FLOODWAY FLOODWAY INCREASE
(FT.) (SQ. FT.) (F. P. S.) (NAVD88) (NAVD88) (NAVD88)
SALMON CREEKDA 20.43 59 315 6.7 278.9 278.9 278.9 0.1DB 20.50 137 694 4.2 281.1 281.1 281.3 0.2 DC 20.68 137 448 6.0 283.5 283.5 284.3 0.8DD 20.82 106 522 4.8 287.1 287.1 287.8 0.7DE 20.97 107 644 4.7 289.6 289.6 290.6 1.0DF 21.14 151 722 5.0 293.2 293.2 293.8 0.6DG 21.35 120 584 3.6 297.3 297.3 298.2 0.9DH 21.43 100 475 5.4 299.5 299.5 300.3 0.8DI 21.58 221 939 4.0 301.8 301.8 302.8 1.0DJ 21.81 177 699 4.0 305.3 305.3 305.8 0.6DK 21.99 106 473 5.1 308.5 308.5 309.5 1.0DL 22.16 73 445 5.4 311.9 311.9 312.9 0.9DM 22.34 68 484 4.4 315.1 315.1 316.0 1.0DN 22.43 121 574 5.2 317.4 317.4 318.4 1.0DO 22.62 76 374 6.2 320.3 320.3 321.3 1.0DP 22.76 90 548 5.6 323.9 323.9 324.8 0.9DQ 23.08 62 379 5.6 335.3 335.3 335.7 0.5DR 23.36 58 251 8.4 362.7 362.7 362.8 0.0
(1)Stream distance in miles above confluence with Columbia River(2)Elevation computed without consideration of backwater from Columbia River
FLOODING SOURCE FLOODWAY1-PERCENT ANNUAL CHANCE FLOOD
WATER SURFACE ELEVATION
TAB
LE 6
FLOODWAY DATAFEDERAL EMERGENCY MANAGEMENT AGENCY
CLARK COUNTY, WASHINGTONAND INCORPORATED AREAS SALMON CREEK

SECTION MEAN WITHOUT WITHCROSS SECTION DISTANCE1 WIDTH AREA VELOCITY REGULATORY FLOODWAY FLOODWAY INCREASE
(FT.) (SQ. FT.) (F. P. S.) (NAVD88) (NAVD88) (NAVD88)
SPRING BRANCH CREEKA 0.26 38 42 1.7 198.4 196.12 196.92 0.8B 0.39 37 100 0.6 198.7 196.22 197.22 1.0 C 0.49 30 84 0.7 198.8 196.22 197.22 0.9D 0.68 32 90 0.3 199.2 196.42 197.32 0.9E 0.90 19 57 0.4 199.5 196.52 197.42 0.9F 1.13 23 28 0.8 199.9 197.32 197.62 0.3G 1.30 31 19 1.2 200.2 200.02 200.02 0.0
(1)Stream distance in miles above confluence with Lacamas Creek(2)Elevation computed without consideration of influence from Lacamas Creek
FLOODING SOURCE FLOODWAY1-PERCENT ANNUAL CHANCE FLOOD
WATER SURFACE ELEVATION
TAB
LE 6
FLOODWAY DATAFEDERAL EMERGENCY MANAGEMENT AGENCY
CLARK COUNTY, WASHINGTONAND INCORPORATED AREAS SPRING BRANCH CREEK

SECTION MEAN WITHOUT WITHCROSS SECTION DISTANCE1 WIDTH AREA VELOCITY REGULATORY FLOODWAY FLOODWAY INCREASE
(FT.) (SQ. FT.) (F. P. S.) (NAVD88) (NAVD88) (NAVD88)
UNNAMED TRIBUTARY TO GEE CREEK
A 0.02 12 17 6.6 63.8 63.8 63.8 0.0 B 0.18 14 23 4.7 86.4 86.4 86.6 0.2C 0.28 7 16 6.9 99.2 99.2 99.6 0.4D 0.38 9 40 2.8 111.7 111.7 112.5 0.8
(1)Stream distance in miles above confluence with Gee Creek
FLOODING SOURCE FLOODWAY1-PERCENT ANNUAL CHANCE FLOOD
WATER SURFACE ELEVATION
TAB
LE 6
FLOODWAY DATAFEDERAL EMERGENCY MANAGEMENT AGENCY
CLARK COUNTY, WASHINGTONAND INCORPORATED AREAS UNNAMED TRIBUTARY TO GEE CREEK
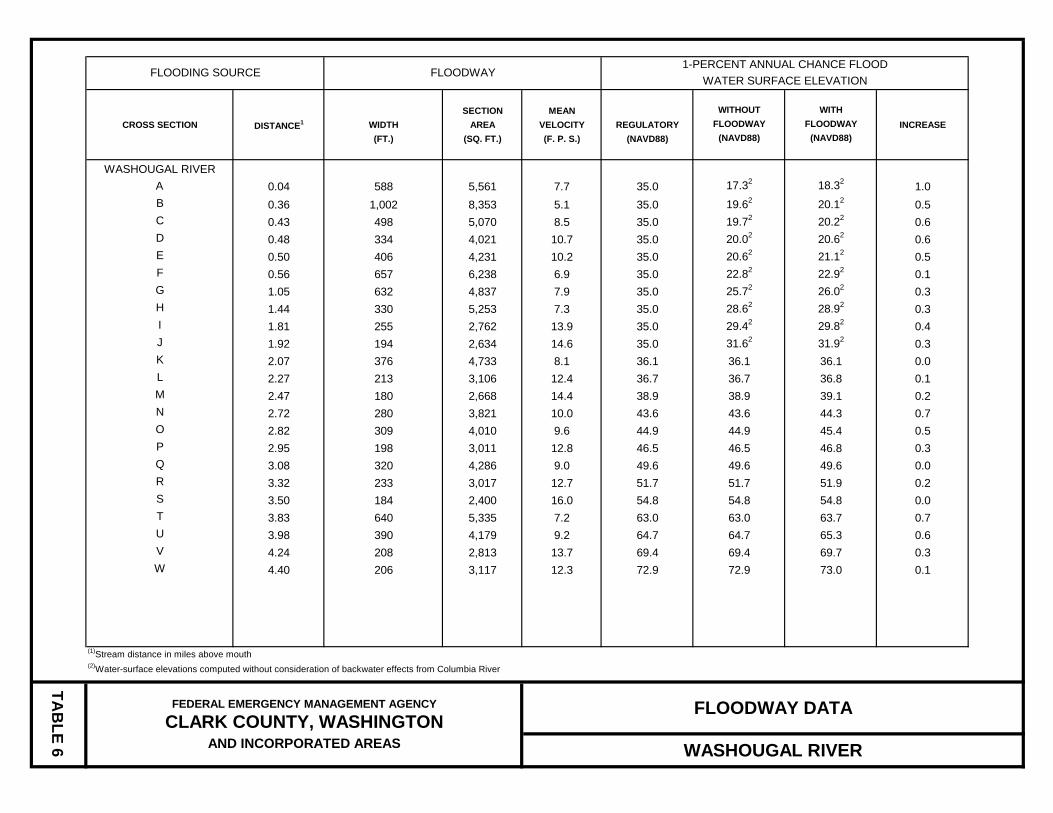
SECTION MEAN WITHOUT WITHCROSS SECTION DISTANCE1 WIDTH AREA VELOCITY REGULATORY FLOODWAY FLOODWAY INCREASE
(FT.) (SQ. FT.) (F. P. S.) (NAVD88) (NAVD88) (NAVD88)
WASHOUGAL RIVERA 0.04 588 5,561 7.7 35.0 17.32 18.32 1.0B 0.36 1,002 8,353 5.1 35.0 19.62 20.12 0.5 C 0.43 498 5,070 8.5 35.0 19.72 20.22 0.6D 0.48 334 4,021 10.7 35.0 20.02 20.62 0.6E 0.50 406 4,231 10.2 35.0 20.62 21.12 0.5F 0.56 657 6,238 6.9 35.0 22.82 22.92 0.1G 1.05 632 4,837 7.9 35.0 25.72 26.02 0.3H 1.44 330 5,253 7.3 35.0 28.62 28.92 0.3I 1.81 255 2,762 13.9 35.0 29.42 29.82 0.4J 1.92 194 2,634 14.6 35.0 31.62 31.92 0.3K 2.07 376 4,733 8.1 36.1 36.1 36.1 0.0L 2.27 213 3,106 12.4 36.7 36.7 36.8 0.1M 2.47 180 2,668 14.4 38.9 38.9 39.1 0.2N 2.72 280 3,821 10.0 43.6 43.6 44.3 0.7O 2.82 309 4,010 9.6 44.9 44.9 45.4 0.5P 2.95 198 3,011 12.8 46.5 46.5 46.8 0.3Q 3.08 320 4,286 9.0 49.6 49.6 49.6 0.0R 3.32 233 3,017 12.7 51.7 51.7 51.9 0.2S 3.50 184 2,400 16.0 54.8 54.8 54.8 0.0T 3.83 640 5,335 7.2 63.0 63.0 63.7 0.7U 3.98 390 4,179 9.2 64.7 64.7 65.3 0.6V 4.24 208 2,813 13.7 69.4 69.4 69.7 0.3W 4.40 206 3,117 12.3 72.9 72.9 73.0 0.1
(1)Stream distance in miles above mouth(2)Water-surface elevations computed without consideration of backwater effects from Columbia River
FLOODING SOURCE FLOODWAY1-PERCENT ANNUAL CHANCE FLOOD
WATER SURFACE ELEVATION
TAB
LE 6
FLOODWAY DATAFEDERAL EMERGENCY MANAGEMENT AGENCY
CLARK COUNTY, WASHINGTONAND INCORPORATED AREAS WASHOUGAL RIVER

SECTION MEAN WITHOUT WITHCROSS SECTION DISTANCE1 WIDTH AREA VELOCITY REGULATORY FLOODWAY FLOODWAY INCREASE
(FT.) (SQ. FT.) (F. P. S.) (NAVD88) (NAVD88) (NAVD88)
WEAVER CREEKA 0.04 80 280 3.6 210.6 210.02 211.02 1.0B 0.08 40 226 3.2 212.4 212.3 212.5 0.3 C 0.22 64 201 3.4 212.9 212.8 213.2 0.4D 0.38 60 162 5.2 216.2 216.2 216.9 0.7E 0.61 40 119 5.9 222.8 222.8 222.8 0.0F 1.02 33 115 5.7 234.0 234.0 235.0 1.0G 1.12 18 96 5.5 236.7 236.7 237.5 0.8H 1.14 28 155 4.2 239.2 239.2 239.3 0.0I 1.32 22 120 4.6 240.7 240.7 241.1 0.4J 1.39 18 77 7.2 241.6 241.6 242.5 0.9K 1.56 19 111 4.7 246.6 246.6 247.6 0.9L 1.59 23 174 3.7 249.5 249.5 250.0 0.6M 1.82 31 170 3.5 255.3 255.3 256.3 0.9N 2.01 26 121 4.5 257.1 257.1 257.9 0.9O 2.20 26 130 3.9 259.6 259.6 260.4 0.9P 2.23 26 150 3.4 261.5 261.5 261.8 0.3Q 2.44 28 107 4.7 265.2 265.2 266.0 0.8R 2.50 22 111 4.2 266.4 266.4 267.4 1.0S 2.61 27 112 4.5 269.1 269.1 269.8 0.8T 2.83 26 109 4.6 273.7 273.7 274.7 1.0U 2.94 25 121 3.5 276.4 276.4 276.8 0.3V 3.17 34 112 3.8 280.0 280.0 281.0 1.0W 3.26 43 154 3.0 281.3 281.3 282.0 0.7X 3.51 40 126 3.5 284.2 284.2 284.5 0.4Y 3.60 21 81 5.1 285.6 285.6 285.8 0.2Z 3.66 30 255 1.8 292.0 292.0 293.0 1.0
(1)Stream distance in miles above confluence with Salmon Creek(2)Elevation computed without consideration of backwater from Salmon Creek
WEAVER CREEKAND INCORPORATED AREAS
TAB
LE 6
FLOODWAY DATA
FLOODING SOURCE FLOODWAY1-PERCENT ANNUAL CHANCE FLOOD
WATER SURFACE ELEVATION
FEDERAL EMERGENCY MANAGEMENT AGENCY
CLARK COUNTY, WASHINGTON

SECTION MEAN WITHOUT WITHCROSS SECTION DISTANCE1 WIDTH AREA VELOCITY REGULATORY FLOODWAY FLOODWAY INCREASE
(FT.) (SQ. FT.) (F. P. S.) (NAVD88) (NAVD88) (NAVD88)
WEAVER CREEKAA 3.77 48 387 1.0 293.8 293.8 294.7 0.9AB 4.04 27 175 2.0 293.9 293.9 294.8 0.9 AC 4.16 14 122 2.4 298.7 298.7 299.3 0.7AD 4.28 17 169 1.7 301.7 301.7 302.3 0.6AE 4.69 23 99 3.2 302.0 302.0 302.9 0.9AF 4.86 36 274 0.9 308.6 308.6 308.8 0.2AG 5.08 28 52 3.7 309.4 309.4 309.8 0.4AH 5.16 32 59 3.3 312.5 312.5 312.6 0.1AI 5.28 21 76 2.6 318.4 318.4 319.2 0.9AJ 5.40 26 71 3.8 321.6 321.6 321.9 0.4AK 5.48 28 59 2.6 323.5 323.5 324.0 0.5AL 5.73 21 24 6.2 333.6 333.6 333.6 0.0AM 5.80 85 141 1.4 339.2 339.2 339.3 0.1AN 5.85 26 74 2.0 341.9 341.9 341.9 0.0AO 5.90 28 51 2.9 345.0 345.0 345.1 0.1
(1)Stream distance in miles above confluence with Salmon Creek
WEAVER CREEKAND INCORPORATED AREAS
TAB
LE 6
FLOODWAY DATAFEDERAL EMERGENCY MANAGEMENT AGENCY
CLARK COUNTY, WASHINGTON
FLOODING SOURCE FLOODWAY1-PERCENT ANNUAL CHANCE FLOOD
WATER SURFACE ELEVATION

SECTION MEAN WITHOUT WITHCROSS SECTION DISTANCE1 WIDTH AREA VELOCITY REGULATORY FLOODWAY FLOODWAY INCREASE
(FT.) (SQ. FT.) (F. P. S.) (NAVD88) (NAVD88) (NAVD88)
WHIPPLE CREEKA 0.77 36 309 2.7 28.5 19.12 19.52 0.4B 0.78 42 334 2.5 28.5 19.52 19.82 0.3 C 0.86 80 422 2.5 28.5 19.72 20.02 0.3D 0.97 140 566 2.3 28.5 19.72 20.32 0.6E 1.11 222 760 1.6 28.5 19.72 20.62 0.9F 1.29 180 330 4.0 28.5 20.32 21.22 0.9G 1.44 198 390 3.4 28.5 22.22 23.12 0.9H 1.61 197 423 3.4 28.5 24.12 24.52 0.4I 1.87 220 257 4.9 28.5 27.02 27.02 0.0J 2.04 159 347 3.3 28.5 28.5 29.1 0.7K 2.12 12 92 7.3 29.9 29.9 30.9 1.0L 2.30 24 128 5.2 34.5 34.5 35.0 0.5M 2.42 26 124 5.4 37.9 37.9 38.7 0.7N 2.52 31 129 5.1 42.0 42.0 42.7 0.7O 2.92 23 145 4.6 58.1 58.1 58.8 0.7P 3.03 21 143 4.7 62.1 62.1 63.0 0.9Q 3.04 26 153 4.8 62.7 62.7 63.3 0.6R 3.08 25 191 3.5 63.7 63.7 64.4 0.7S 3.13 26 202 3.3 64.3 64.3 65.1 0.8T 3.15 30 299 2.2 65.4 65.4 66.2 0.8U 3.20 26 208 3.2 65.7 65.7 66.6 0.9V 3.25 22 175 2.7 66.2 66.2 67.1 0.9W 3.64 20 144 3.3 71.4 71.4 72.4 1.0X 4.18 19 114 4.2 81.3 81.3 81.8 0.4Y 4.62 18 133 3.6 87.1 87.1 87.8 0.6Z 5.01 29 220 2.7 95.0 95.0 95.9 0.9
(1)Stream distance in miles above confluence with Columbia River(2)Elevation computed without consideration of backwater from Columbia River
WHIPPLE CREEKAND INCORPORATED AREAS
TAB
LE 6
FLOODWAY DATA
FLOODING SOURCE FLOODWAY1-PERCENT ANNUAL CHANCE FLOOD
WATER SURFACE ELEVATION
FEDERAL EMERGENCY MANAGEMENT AGENCY
CLARK COUNTY, WASHINGTON

SECTION MEAN WITHOUT WITHCROSS SECTION DISTANCE1 WIDTH AREA VELOCITY REGULATORY FLOODWAY FLOODWAY INCREASE
(FT.) (SQ. FT.) (F. P. S.) (NAVD88) (NAVD88) (NAVD88)
WHIPPLE CREEKAA 5.03 24 204 2.9 95.2 95.2 96.2 1.0AB 5.26 22 165 2.2 96.4 96.4 97.3 0.9 AC 5.27 25 173 2.5 98.3 98.3 98.8 0.5AD 5.63 14 93 3.8 103.2 103.2 104.1 0.9AE 5.87 12 73 4.9 109.7 109.7 110.6 0.9AF 5.88 20 133 2.7 112.3 112.3 112.7 0.5AG 6.09 66 173 3.0 116.2 116.2 116.6 0.4AH 6.20 67 164 3.4 117.9 117.9 118.9 1.0AI 6.50 28 111 3.9 125.8 125.8 126.6 0.8AJ 6.60 14 98 3.6 127.6 127.6 128.5 0.9AK 6.61 20 165 2.3 131.6 131.6 132.1 0.5AL 6.87 23 99 4.8 135.6 135.6 136.6 1.0AM 7.18 10 50 3.5 147.7 147.7 148.3 0.6AN 7.25 23 98 2.1 154.5 154.5 154.5 0.0AO 7.37 17 36 4.8 160.3 160.3 160.4 0.2AP 7.39 29 153 1.2 166.6 166.6 166.6 0.0AQ 7.61 10 40 4.2 181.9 181.9 182.7 0.7AR 7.77 11 48 3.5 194.7 194.7 195.5 0.8AS 8.02 23 61 3.0 205.8 205.8 206.7 0.9AT 8.35 22 72 2.7 215.5 215.5 216.5 1.0AU 8.54 17 29 3.0 220.5 220.5 221.1 0.6AV 8.55 16 60 1.4 222.3 222.3 222.4 0.1AW 8.75 13 36 2.3 229.5 229.5 230.2 0.7AX 9.10 35 77 1.2 238.6 238.6 239.6 0.9AY 9.37 83 99 0.9 241.0 241.0 241.4 0.4
(1)Stream distance in miles above confluence with Columbia River
WHIPPLE CREEKAND INCORPORATED AREAS
TAB
LE 6
FLOODWAY DATAFEDERAL EMERGENCY MANAGEMENT AGENCY
CLARK COUNTY, WASHINGTON
FLOODING SOURCE FLOODWAY1-PERCENT ANNUAL CHANCE FLOOD
WATER SURFACE ELEVATION

55
5.0
For flood insurance rating purposes, flood insurance zone designations are assigned to a community based on the results of the engineering analyses. These zones are as follows:
INSURANCE APPLICATIONS
Zone A Zone A is the flood insurance rate zone that corresponds to the 1-percent-annual-chance floodplains that are determined in the FIS report by approximate methods. Because detailed hydraulic analyses are not performed for such areas, no base (1-percent-annual-chance) flood elevations (BFEs) or depths are shown within this zone. Zone AE Zone AE is the flood insurance rate zone that corresponds to the 1-percent-annual-chance floodplains that are determined in the FIS report by detailed methods. Whole foot BFEs derived from the detailed hydraulic analyses are shown at selected intervals within this zone. Zone AH Zone AH is the flood insurance rate zone that corresponds to areas of 1-percent-annual-chance shallow flooding (usually areas of ponding) where average depths are between 1 foot and 3 feet. Whole foot BFEs derived from the detailed hydraulic analyses are shown at selected intervals within this zone. Zone X Zone X is the flood insurance rate zone that corresponds to areas outside the 0.2-percent-annual-chance floodplain, areas within the 0.2-percent-annual-chance floodplain, areas of 1-percent-annual-chance flooding where average depths are less than 1 foot, areas of 1-percent-annual-chance flooding where the contributing drainage area is less than 1 square mile, and areas protected from the base flood by levees. No BFEs or depths are shown within this zone. Zone D Zone D is the flood insurance rate zone that corresponds to unstudied areas where flood hazards are undetermined, but possible.
6.0
The FIRM is designed for flood insurance and floodplain management applications.
FLOOD INSURANCE RATE MAP
For flood insurance applications, the map designates flood insurance rate zones as described in Section 5.0 and, in the 1-percent-annual-chance floodplains that were studied by detailed methods, shows selected whole foot BFEs or average depths. Insurance agents use zones and BFEs in conjunction with information on structures and their contents to assign premium rates for flood insurance policies.

56
For floodplain management applications, the map shows by tints, screens, and symbols, the 1- and 0.2-percent-annual-chance floodplains, floodways, and the locations of selected cross sections used in the hydraulic analyses and floodway computations. The countywide FIRM presents flooding information for the entire geographic area of Clark County. Previously, FIRMs were prepared for each incorporated community and the unincorporated areas of the County identified as flood-prone. This countywide FIRM also includes flood-hazard information that was presented separately on Flood Boundary and Floodway Maps, where applicable. Historical data relating to the maps prepared for each community are presented in Table 7, “Community Map History”.
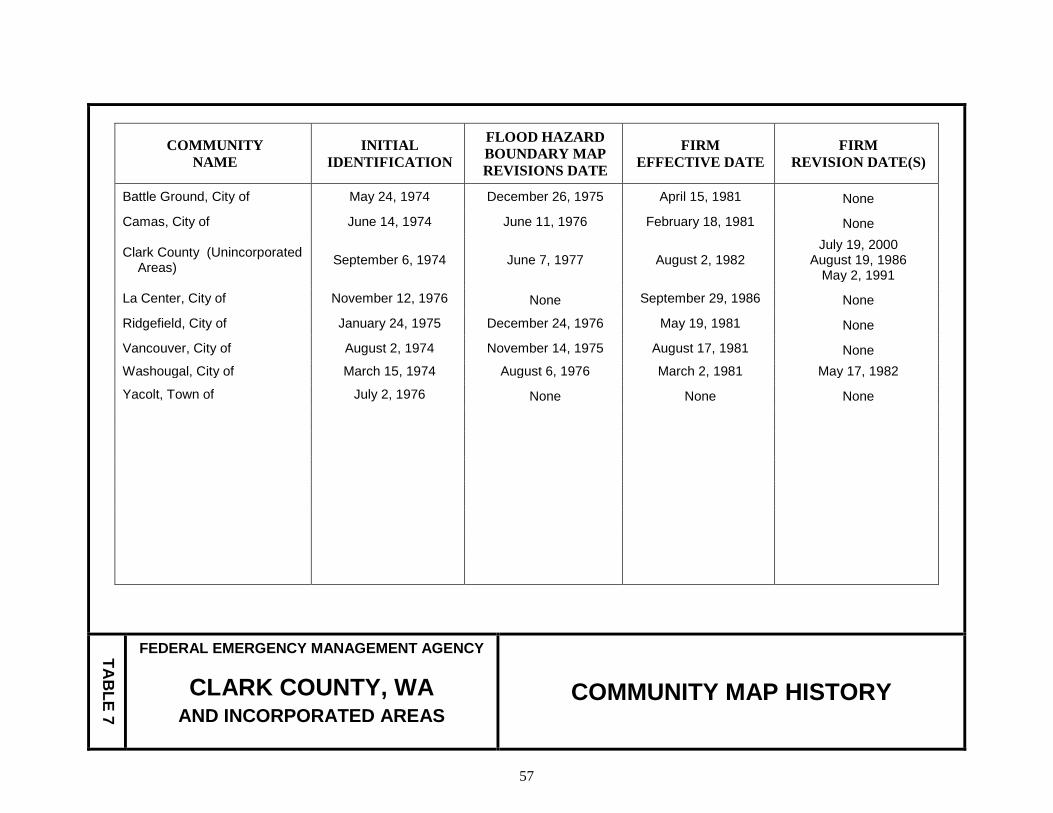
57
Table 7 – Community Map History
COMMUNITY NAME
INITIAL IDENTIFICATION
FLOOD HAZARD BOUNDARY MAP REVISIONS DATE
FIRM EFFECTIVE DATE
FIRM REVISION DATE(S)
Battle Ground, City of May 24, 1974 December 26, 1975 April 15, 1981 None
Camas, City of June 14, 1974 June 11, 1976 February 18, 1981 None
Clark County (Unincorporated Areas) September 6, 1974 June 7, 1977 August 2, 1982
July 19, 2000 August 19, 1986
May 2, 1991
La Center, City of November 12, 1976 None September 29, 1986 None
Ridgefield, City of January 24, 1975 December 24, 1976 May 19, 1981 None
Vancouver, City of August 2, 1974 November 14, 1975 August 17, 1981 None Washougal, City of March 15, 1974 August 6, 1976 March 2, 1981 May 17, 1982
Yacolt, Town of July 2, 1976 None None None
TAB
LE 7
FEDERAL EMERGENCY MANAGEMENT AGENCY
CLARK COUNTY, WA AND INCORPORATED AREAS
COMMUNITY MAP HISTORY
58
7.0
This FIS report either supersedes or is compatible with all previous studies published on streams studied in this report and should be considered authoritative for the purposes of the NFIP.
OTHER STUDIES
8.0
Information concerning the pertinent data used in the preparation of this study can be obtained by contacting Federal Insurance and Mitigation Division, FEMA Region X, Federal Regional Center, 130 228th Street, SW, Bothell, Washington 98021-9796.
LOCATION OF DATA
9.0
1. City of Vancouver,
BIBLIOGRAPHY AND REFERENCES
Topographic Maps
, Scale 1:1,200 and 1:4,800, Coutour Interval 2 feet: Vancouver, Washington (1974)
2. Clark County Department of Assessment and GIS, 2005 Population and Economic Handbook
, 2005
3. Clark County Planning Commission, Flood Plain Combining Zone Ordinance
, January 1977
4. Columbia River Economic Development Council, The Economic Development Strategic Plan for Clark County
, May 2002
5. Federal Emergency Management Agency, Flood Insurance Rate Map, City of Camas, Washington
, February 18, 1981
6. Federal Emergency Management Agency, Flood Insurance Rate Map, City of Vancouver, Washington
, August 17, 1981
7. Federal Emergency Management Agency, Flood Insurance Rate Map, City of Washougal, Washington
, May 17, 1982
8. Federal Emergency Management Agency, Flood Insurance Rate Map, City of Woodland, Washington
, September 4, 1985
9. Federal Emergency Management Agency, Flood Insurance Rate Map, Town of Battle Ground, Washington
, April 15, 1981
10. Federal Emergency Management Agency, Flood Insurance Rate Map, Town of La Center, Washington
, September 29, 1986
11. Federal Emergency Management Agency, Flood Insurance Rate Map, Town of Ridgefield, Washington
, May 19, 1981
12. Federal Emergency Management Agency, Flood Insurance Rate Map, Town of Yacolt, Washington, July 2, 1976

59
13. Federal Emergency Management Agency, Flood Insurance Rate Map, Clark County,
Washington (Unincorporated Areas), July 19, 2000
14. Federal Emergency Management Agency, Flood Insurance Study, Clark County, Washington (Unincorporated Areas), July 19, 2000
15. Federal Emergency Management Agency, Flood Insurance Study, City of Camas, Washington, August 18, 1980
16. Federal Emergency Management Agency, Flood Insurance Study, Cowlitz County, Washington (Unincorporated Areas), December 20, 2001
17. Federal Emergency Management Agency, Flood Insurance Study, City of Vancourver, Washington
, February 17, 1981
18. Federal Emergency Management Agency, Flood Insurance Study, City of Washougal, Washington, September 2, 1980
19. Federal Emergency Management Agency, Flood Insurance Study, City of Woodland, Washington, September 4, 1985
20. Federal Emergency Management Agency, Flood Insurance Study, Multnomah County, Oregon (Unincorporated Areas), March 18, 1986
21. Federal Emergency Management Agency, Flood Insurance Study, Town of Battle Ground, Washington, October 15, 1980
22. Federal Emergency Management Agency, Flood Insurance Study, Town of LA Center, Washington, September 29, 1986
23. Federal Emergency Management Agency, Flood Insurance Study, Town of Ridgefield, Washington, November 19, 1980
24. Harper Houf Peterson Righellis Inc., Floodplain Delineation Map, Port of Camas/Washougal, City of Washougal, Washington.
25. Lark County GIS Department, LiDAR data, 2009
26. Merrick, Inc., Light Detention and Ranging Data, June 2002
27. MGS Engineering Consultants, Inc., Hydrologic Analysis of Salmon Creek Watershed using the HSPF Model, October 2002
28. Olson Engineering Inc., Drawing of “Existing Conditions Survey for Boise Waterfront”, August 2008.
29. Pacific Northwest River Basins Commission, Climatological Handbook, Temperatures, Volume 1, Part A, 1969
30. Pacific Northwest River Basins Commission, Columbia-North Pacific Region
60
Comprehensive Framework Study, June 1971
31. U.S. Army Corps of Engineers, Hydrologic Engineering Center, Computer Program 723-X6-L202A, HEC-2 water Surface profiles, Davis, California, November 1976, updated August 1977
32. U.S. Army Corps of Engineers, Hydrologic Engineering Center, HEC-RAS River Analysis System, Version 3.1.2, Davis, California, April 2004
33. U.S. Department of Agriculture, Soil Conservation Service, Soil Survey of Clark County, Washington, November 1972
34. U.S. Department of the Army Corps of Engineers, Hydrologic Engineering Center, HEC-1, Flood Hydrograph Package, Davis, California, January 1973
35. U.S. Department of the Army Corps of Engineers, Portland District, Columbia River Flood Frequency Profiles (Fall and Winter Freshets), December 1976
36. U.S. Department of the Army Corps of Engineers, Portland District, Columbia River
Flood Frequency Profiles (Spring and Summer Freshets), December 1971
37. U.S. Department of the Army Corps of Engineers, Portland District, Columbia River, River Mile 106.5 Cumulative Frequency Curve-Maximum Annual Stage, October 19 1976
38. U.S. Department of the Army Corps of Engineers, Portland District, Drainage District Condition Survey on Safe Water Surface Levels, 1978
39. U.S. Department of the Army Corps of Engineers, Portland District, Flood Plain Information, Milwaukie-Oak Grove-Lake Oswego, Oregon, May 1970
40. U.S. Department of the Army Corps of Engineers, Portland District, Report No. Two, Procedure for Determination of Maximum Annual Flood Peak and Volume Frequencies for Portland District, February 1969
41. U.S. Department of the Army Corps of Engineers, Portland District, Rivergate-North Portland Area, Flood Control study, Feasibility Report, January 1976
42. U.S. Department of the Army Corps of Engineers, Portland District, Special Flood Hazard Information, Columbia River in Vicinity of Portland, Oregon, June 1975
43. U.S. Department of the Army Corps of Engineers, Portland District, Topographic maps, Columbia and Lower Willamette Rivers below Vancouver, Washington and Portland, Oregon, Scale 1:5,000, Contour Interval 5 feet, from Aerial Photography dated July 26, 1963
44. U.S. Department of the Army Corps of Engineers, Portland District, Topographic Survey, Columbia River Near Portland, Scale 1:12,000, Contour Interval 5 feet, 1978
45. U.S. Department of the Army, Corps of Engineers, Portland District, Topographic Survey, Scale 1:4,800, Contour Interval 5, feet: Lewis River (1973); East Fork Lewis

61
River (1973); Gee Creek and Lake River at Ridgefield (1977); Salmon Creek (1976); Washougal River Area (1976 and 1977)
46. U.S. Department of the Army Corps of Engineers, Portland District, Willamette River, Morrison Street Bridge, Cumulative Frequency Curve-Maximum Annual Stage, December 3, 1976
47. U.S. Department of Commerce, National Oceanic and Atmospheric Administration, Climatological Handbook, precipitation, Volume 2, 1969
48. U.S. Department of Interior, Geological Survey, Magnitude and Frequency Flood in Washington, USGS Water-Resources Investigations Report 97-4277, 1997
49. U.S. Department of Interior, Geological Survey, Water Resources data for Oregon, 1978
50. U.S. Department of the Interior, Geological Survey, 7.5-Minute Series Topographic Maps, Scales 1:24,000 and 1:62,500, Contour Intervals 10, 20, 40, and 80 feet; Washougal, Washington-Oregon (1961); Woodland, Washington, (1971); Arie1, Washington (1971); Yaco1t, Washington (1971); Amboy, Washington (1971); Camas, Washington-Oregon (1961); Mt. Tabor, Oregon-Washington (1961); Portland, Oregon-Washington (1961); Orchards, Washington (1961); Vancouver, Washington-Oregon (1961); Lacamas Creek, Washington (1954); Sauvie Island, Oregon-Washington (1961); St. Helens, Oregon-Washington (1954); Battle Ground, Washington (1954); Ridgefield, Washington (1954); Camas, Washington-Oregon (1954); La Center, Washington (1954); Cougar, Washington (1958); Mount St. Helens, Washington (1958)
51. U.S. Water Resources Council, Guidelines for Determining Flood Flow Frequency, Bulletin 17A, June 1977
52. WEST Consultants, Inc., Clark County, Washington, Preliminary Flood Insurance Study Workmaps, 2-Foot Contour Topography by Merrick, Inc., June 2002
53. WEST Consultants, Inc., Clark County, Washington, Preliminary Flood Insurance Study: Various submissions: 2003-2005
54. WEST Consultants, topographical data, 2 foot contour, Columbia River, Vancouver Lake, Burnt Bridge Creek, March 2004