Clarity on Performance of Swiss Private Banks - unibas.ch · overview of performance 06 Key...
52
Clarity on August 2015 14 Diverging paths Banks' performances grow even further apart with many continuing to struggle 20 Hitting pause A lack of strategic clarity causes M&A to stall in 2015 25 Performance and trends Analysis of Swiss private banks' financial performances in 2014 Performance of Swiss Private Banks The widening gap
-
Upload
nguyenthuan -
Category
Documents
-
view
217 -
download
3
Transcript of Clarity on Performance of Swiss Private Banks - unibas.ch · overview of performance 06 Key...
Clarity on August 2015
14Diverging paths
Banks' performances grow even further apart with many continuing to struggle
20Hitting pause
A lack of strategic clarity causes M&A to stall in 2015
25Performance and trends
Analysis of Swiss private banks' financial performances in 2014
Performance of Swiss Private Banks
The widening gap
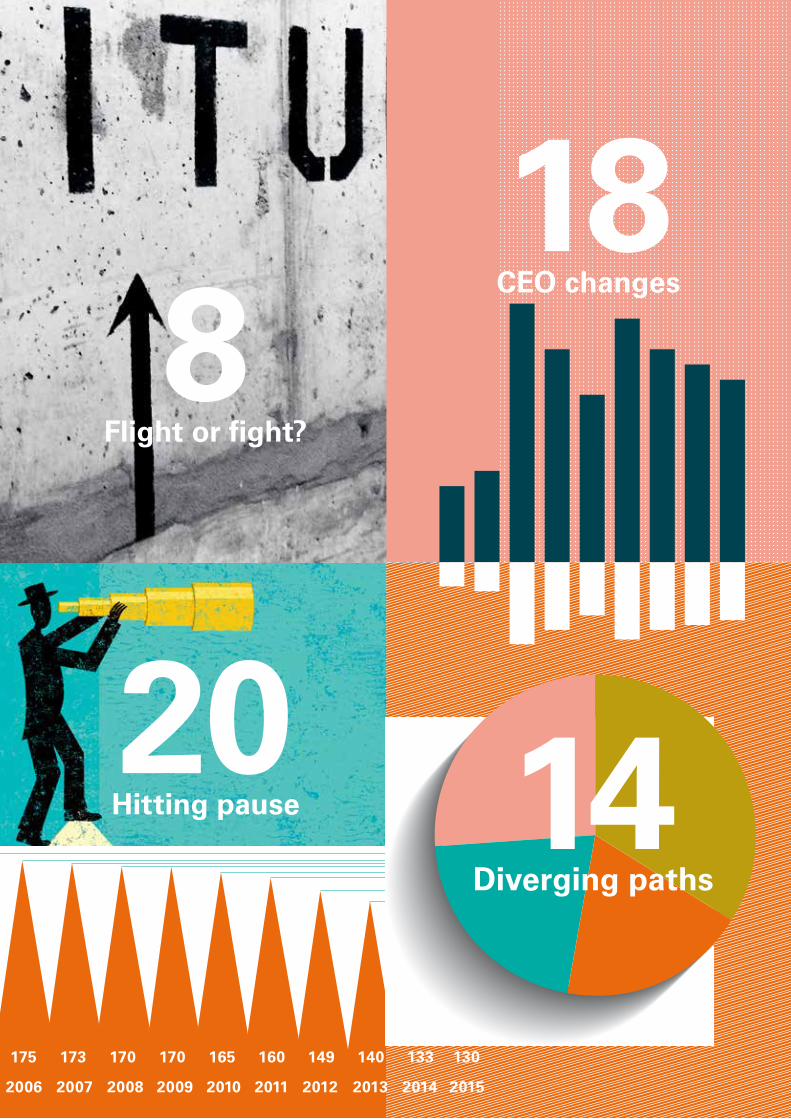
20Hitting pause
181 175 173 170 170 165 160 149 140 133 130
2005 2006 2007 2008 2009 2010 2011 2012 2013 2014 2015
8Flight or fight?
14Diverging paths
18CEO changes
3
Clarity on Performance of Swiss Private Banks
e d ito r i A l
05 the growing gap between Swiss private banks
c h A p t e r i
overview of performance
06 Key findings
14 diverging paths: Bank performances become even more polarized
c h A p t e r i i
Macro-developments
18 ceo changes: No guarantee of improved future performance
20 hitting pause: M&A stalls in 2015 while banks exit the market or fail to commit to strategic change
The widening gap
c o N t e N t
c h A p t e r i i i
Analysis of performance and trends
26 profitability
30 Assets under Management
34 revenue development
38 cost development
44 Balance sheet and regulatory capital
48 Methodology and basis
51 c o N tAc t S / i M p r i N t
A study by KPMG AG Switzerland in cooperation with the institute of Management
at the University of St. Gallen. -
Core team:KpMG Switzerland
dr. christian hintermann, partnerAlain christe, Manager
-University of St. Gallen (hSG)prof. dr. dr. tomi laamanen
181 175 173 170 170 165 160 149 140 133 130
2005 2006 2007 2008 2009 2010 2011 2012 2013 2014 2015
14Diverging paths
18CEO changes

4
5
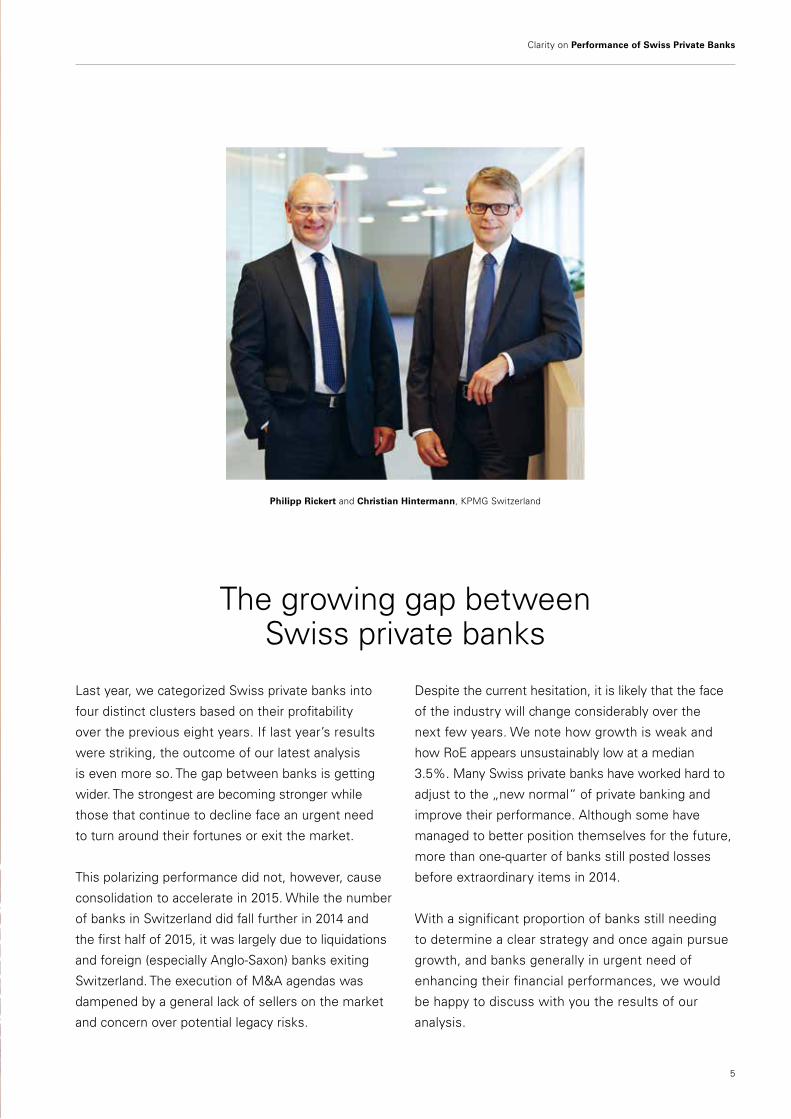
Clarity on Performance of Swiss Private Banks
Philipp Rickert and Christian Hintermann, KpMG Switzerland
the growing gap between Swiss private banks
last year, we categorized Swiss private banks into
four distinct clusters based on their profitability
over the previous eight years. if last year’s results
were striking, the outcome of our latest analysis
is even more so. the gap between banks is getting
wider. the strongest are becoming stronger while
those that continue to decline face an urgent need
to turn around their fortunes or exit the market.
this polarizing performance did not, however, cause
consolidation to accelerate in 2015. While the number
of banks in Switzerland did fall further in 2014 and
the first half of 2015, it was largely due to liquidations
and foreign (especially Anglo-Saxon) banks exiting
Switzerland. the execution of M&A agendas was
dampened by a general lack of sellers on the market
and concern over potential legacy risks.
despite the current hesitation, it is likely that the face
of the industry will change considerably over the
next few years. We note how growth is weak and
how roe appears unsustainably low at a median
3.5%. Many Swiss private banks have worked hard to
adjust to the „new normal“ of private banking and
improve their performance. Although some have
managed to better position themselves for the future,
more than one-quarter of banks still posted losses
before extraordinary items in 2014.
With a significant proportion of banks still needing
to determine a clear strategy and once again pursue
growth, and banks generally in urgent need of
enhancing their financial performances, we would
be happy to discuss with you the results of our
analysis.
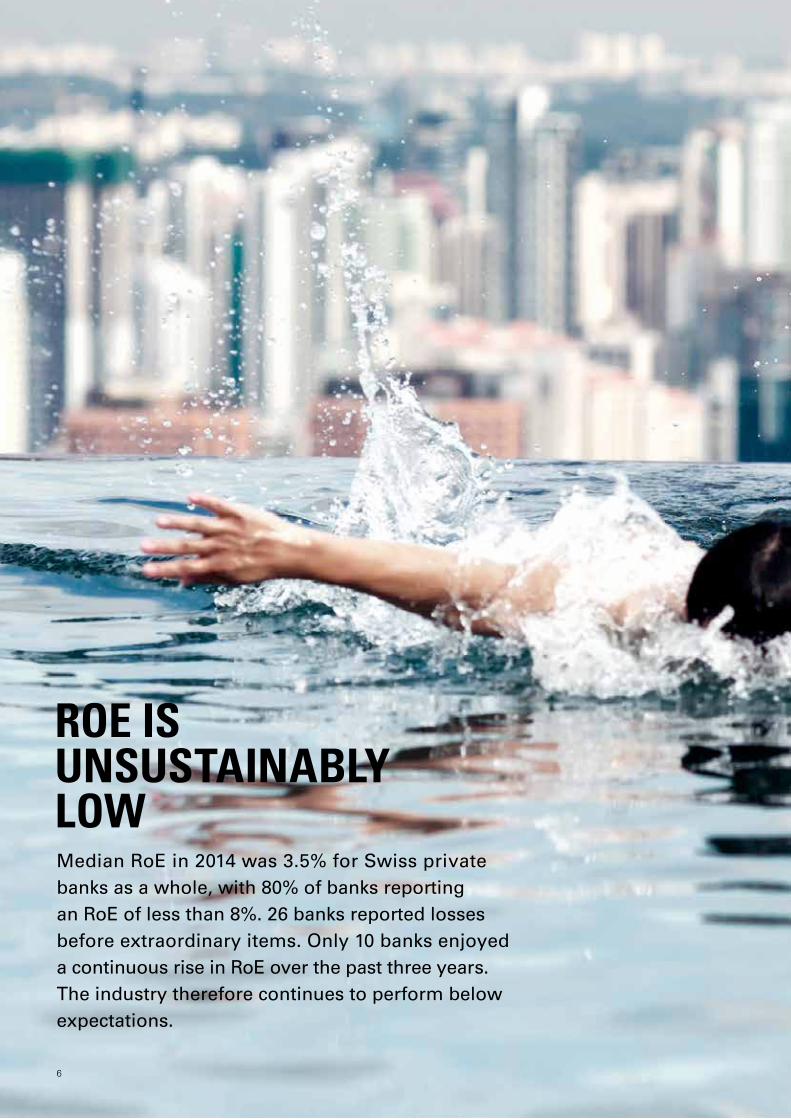
RoE is unsustainably lowMedian RoE in 2014 was 3.5% for Swiss private banks as a whole, with 80% of banks reporting an RoE of less than 8%. 26 banks reported losses before extraordinary items. Only 10 banks enjoyed a continuous rise in RoE over the past three years. The industry therefore continues to perform below expectations.
6

RoE is unsustainably low
Strong PerformerS continue
to Pull ahead
The 9.1% RoE of Strong Performers compares to losses for most banks in Continuing Decline.
Small banks face the biggest challenges, as 41% of them are in Continuing Decline and only
14% are classed as Strong Performers.
7

Flight or Fight? banks must decidePressures are intensifying in 2015 on small banks in particular. Many must take a clear decision to either exit the market or stay and change their business and operating models. Time is running out for the necessary changes to be implemented.
8
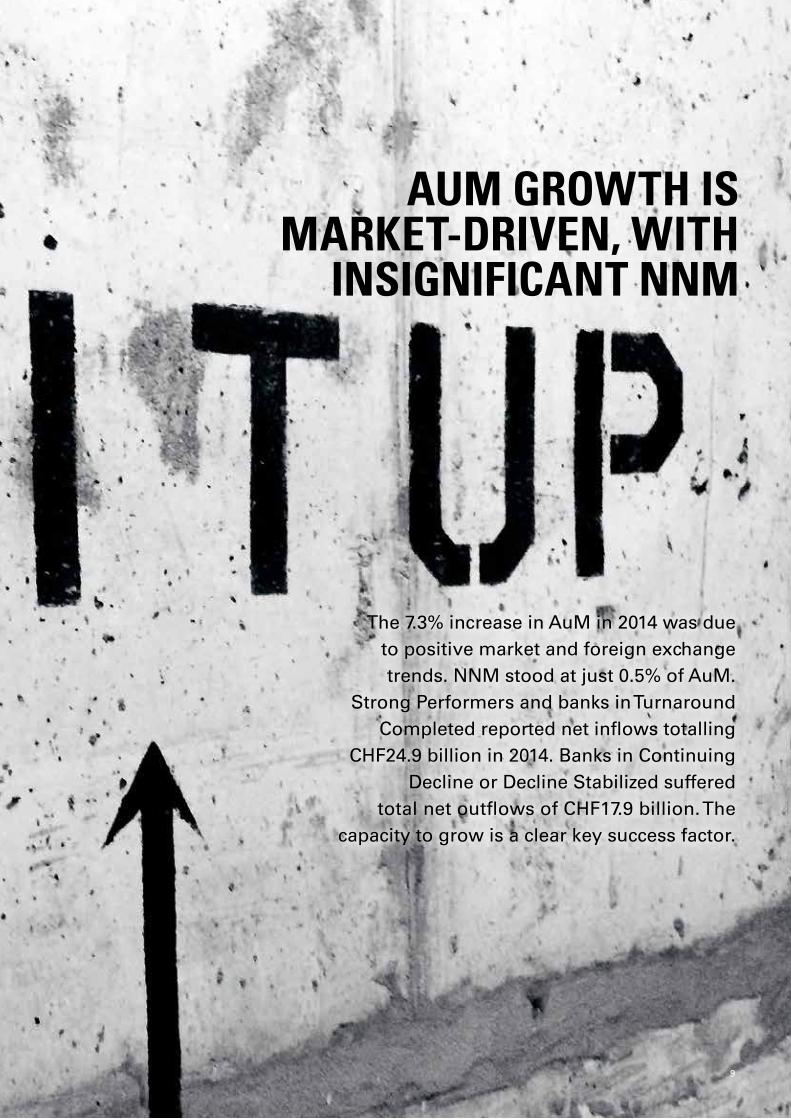
AuM growth is MArket-driven, with
insignificAnt nnM
The 7.3% increase in AuM in 2014 was due to positive market and foreign exchange trends. NNM stood at just 0.5% of AuM.
Strong Performers and banks in Turnaround Completed reported net inflows totalling
CHF24.9 billion in 2014. Banks in Continuing Decline or Decline Stabilized suffered
total net outflows of CHF17.9 billion. The capacity to grow is a clear key success factor.
Flight or Fight? banks must decide
9
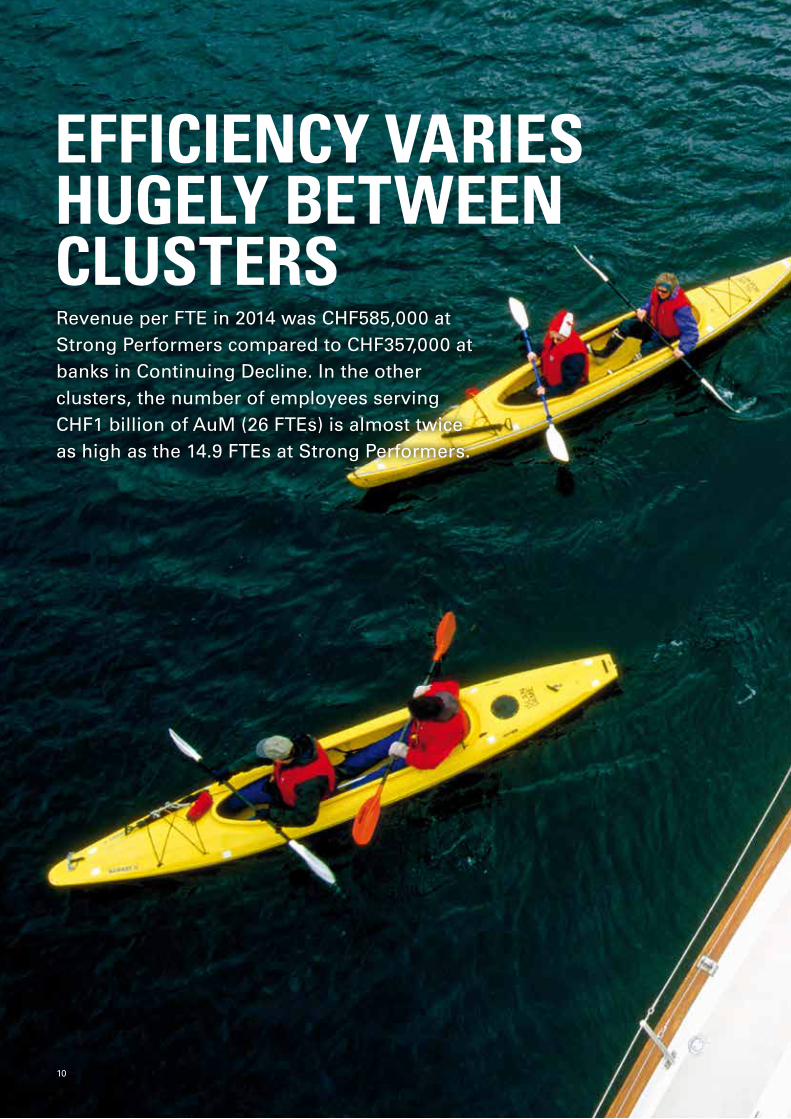
EfficiEncy variEs hugEly bEtwEEn clustErsRevenue per FTE in 2014 was CHF585,000 at Strong Performers compared to CHF357,000 at banks in Continuing Decline. In the other clusters, the number of employees serving CHF1 billion of AuM (26 FTEs) is almost twice as high as the 14.9 FTEs at Strong Performers.
10

Significant acquiSitionS yield benefitS for
acquirerSBanks that added scale through a significant
acquisition saw their net revenue per FTE rise by a median 5.1% and their median RoE
rise by 1.4 percentage points in the following one to two years.
EfficiEncy variEs hugEly bEtwEEn clustErs
11

M&A pauses in 2015 but underlying drivers remain strong
Following a busy 2014, caution over legacy risks and an absence of sellers dampened M&A in the first half of 2015. With many banks in Continuing Decline lacking a clear strategy, and exiting Switzerland, however, we expect a further 30% of Swiss private banks to disappear over the coming few years as a result of M&A or liquidations.
12

34% changed CEO twice or more, but returns are far from
guaranteed
There is little evidence that changing a private bank's CEO will improve financial performance. Almost half of banks in Continuing Decline changed CEO at least
twice in the past nine years, compared to 12% of Strong Performers. Of a total 193 CEOs during 2006 to
2014, only eight were women.
13
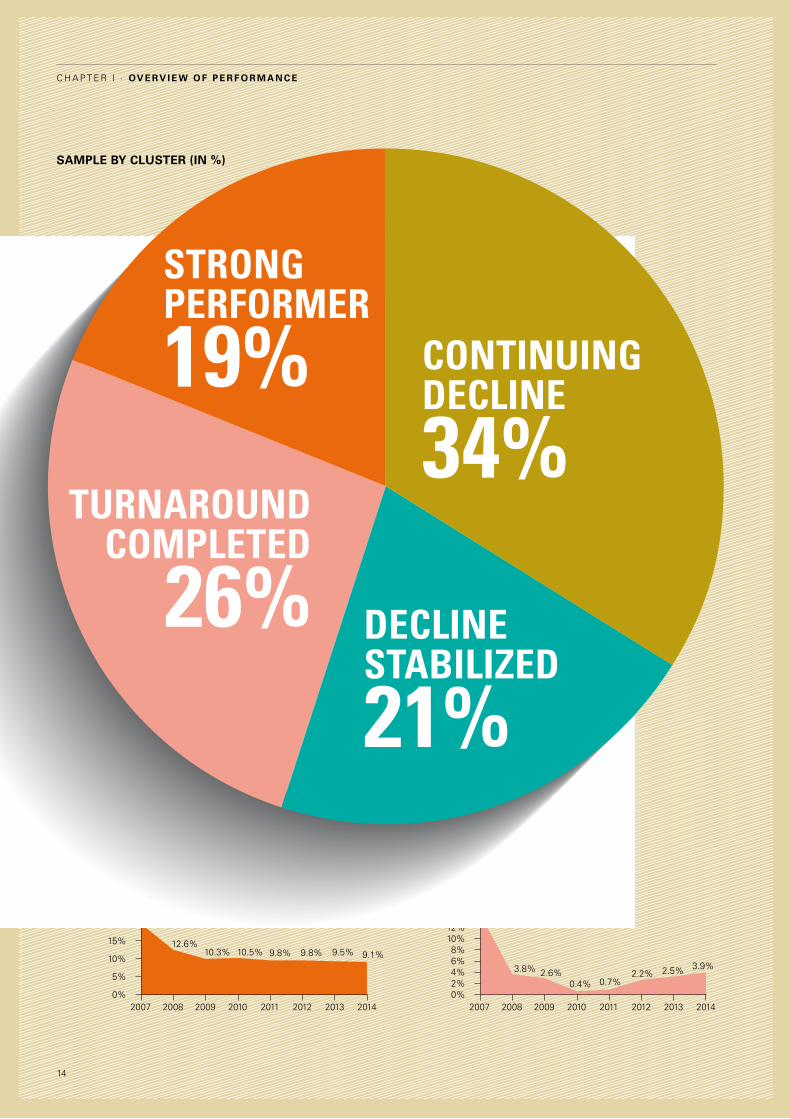
Sample by cluSter (in %)
20070%
5%
10%
15%
20%
25%
2008 2009 2010 2011 2012 2013 2014
19.7%
12.6%10.3% 10.5% 9.8% 9.8% 9.5% 9.1%
RoE - Strong Performer
20070%
4%6%
10%
14%16%
2008 2009 2010 2011 2012 2013 2014
RoE - Turnaround Completed
2%
8%
12%
14.3%
3.8% 2.6%0.4% 0.7%
2.2% 2.5% 3.9%
DEclinEstabilizED
21%
continuingDEclinE
34%turnarounD
complEtED
26%
strongpErformEr
19%
14
C h a p t e r I · Ov e rv i e w O f p e r f O r m a n c e
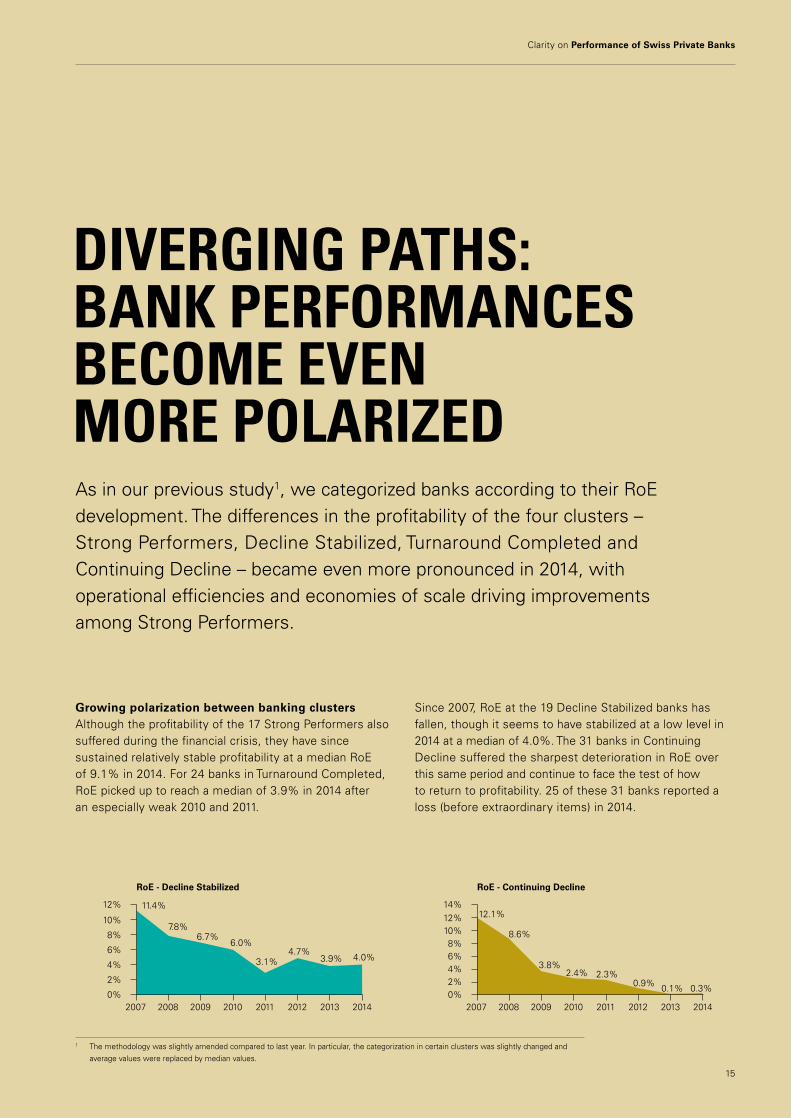
Diverging paths: Bank performances Become even more polarizeDAs in our previous study1, we categorized banks according to their RoE development. The differences in the profitability of the four clusters – Strong Performers, Decline Stabilized, Turnaround Completed and Continuing Decline – became even more pronounced in 2014, with operational efficiencies and economies of scale driving improvements among Strong Performers.
Growing polarization between banking clustersAlthough the profitability of the 17 Strong Performers also suffered during the financial crisis, they have since sustained relatively stable profitability at a median RoE of 9.1% in 2014. For 24 banks in Turnaround Completed, RoE picked up to reach a median of 3.9% in 2014 after an especially weak 2010 and 2011.
Since 2007, RoE at the 19 Decline Stabilized banks has fallen, though it seems to have stabilized at a low level in 2014 at a median of 4.0%. The 31 banks in Continuing Decline suffered the sharpest deterioration in RoE over this same period and continue to face the test of how to return to profitability. 25 of these 31 banks reported a loss (before extraordinary items) in 2014.
1 The methodology was slightly amended compared to last year. In particular, the categorization in certain clusters was slightly changed and average values were replaced by median values.
20070%
4%6%
10%
14%
2008 2009 2010 2011 2012 2013 2014
RoE - Continuing Decline
2%
8%
12% 12.1%
8.6%
3.8%2.4% 2.3%
0.9% 0.1% 0.3%
20070%
2%
4%
6%
10%
12%
2008 2009 2010 2011 2012 2013 2014
RoE - Decline Stabilized
8%
11.4%
7.8%6.7%
6.0%
3.1%4.7%
3.9% 4.0%
15
Clarity on Performance of Swiss Private Banks
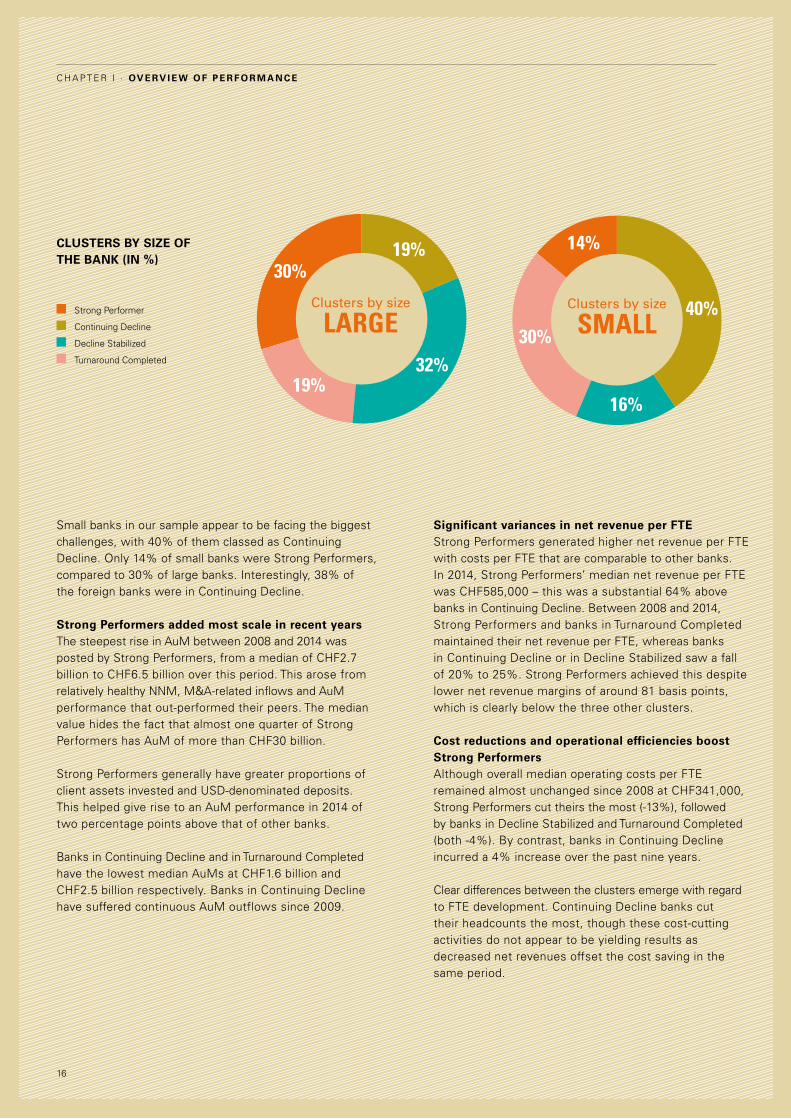
Small banks in our sample appear to be facing the biggest challenges, with 40% of them classed as Continuing Decline. Only 14% of small banks were Strong Performers, compared to 30% of large banks. Interestingly, 38% of the foreign banks were in Continuing Decline.
19%
19%
30%
32%
Clusters by size largE
40%
14%
16%
30%
Clusters by size small
Strong Performer
Continuing Decline
Decline Stabilized
Turnaround Completed
Clusters by size of the bank (in %)
Strong Performers added most scale in recent years The steepest rise in AuM between 2008 and 2014 was posted by Strong Performers, from a median of CHF2.7 billion to CHF6.5 billion over this period. This arose from relatively healthy NNM, M&A-related inflows and AuM performance that out-performed their peers. The median value hides the fact that almost one quarter of Strong Performers has AuM of more than CHF30 billion.
Strong Performers generally have greater proportions of client assets invested and USD-denominated deposits. This helped give rise to an AuM performance in 2014 of two percentage points above that of other banks.
Banks in Continuing Decline and in Turnaround Completed have the lowest median AuMs at CHF1.6 billion and CHF2.5 billion respectively. Banks in Continuing Decline have suffered continuous AuM outflows since 2009.
Significant variances in net revenue per FTE Strong Performers generated higher net revenue per FTE with costs per FTE that are comparable to other banks. In 2014, Strong Performers’ median net revenue per FTE was CHF585,000 – this was a substantial 64% above banks in Continuing Decline. Between 2008 and 2014, Strong Performers and banks in Turnaround Completed maintained their net revenue per FTE, whereas banks in Continuing Decline or in Decline Stabilized saw a fall of 20% to 25%. Strong Performers achieved this despite lower net revenue margins of around 81 basis points, which is clearly below the three other clusters.
Cost reductions and operational efficiencies boost Strong PerformersAlthough overall median operating costs per FTE remained almost unchanged since 2008 at CHF341,000, Strong Performers cut theirs the most (-13%), followed by banks in Decline Stabilized and Turnaround Completed (both -4%). By contrast, banks in Continuing Decline incurred a 4% increase over the past nine years.
Clear differences between the clusters emerge with regard to FTE development. Continuing Decline banks cut their headcounts the most, though these cost-cutting activities do not appear to be yielding results as decreased net revenues offset the cost saving in the same period.
16
C h a p t e r I · Ov e rv i e w O f p e r f O r m a n c e
Operating costs per AuM is another area with a clear gap. While operating costs to serve AuM of CHF1 million were CHF5,444 at Strong Performers, it was approximately 50% higher at other clusters. In addition it is striking that the number of employees needed by a bank to service these volumes is around 40% lower at Strong Performers (14.9 FTEs in 2014) compared to other clusters (around 26 FTEs). This reflects the operational efficiency and economies of scale Strong Performers have managed to achieve.
Key findings
1. Strong Performers reported higher net revenue per FTE than other clusters. This is due to greater operational efficiencies and economies of scale and is a key contributor to their higher profitability. Their operational efficiency is also reflected in the operating costs to service CHF1 million AuM, which are approximately 50% higher at other clusters.
2. Overall, Strong Performers increased their median AuM by 146% since 2008, driven by higher NNM, M&A-related inflows and AuM performance.
3. The relative success of Strong Performers appears to be based on a more specific focus on core markets, operational efficiencies including outsourcing, and organic and inorganic growth initiatives.
4. While there remain some banks, including some Strong Performers, that still depend on the „Old World“ business model this approach will not survive the changes of the next few years.
5. Despite efforts across clusters to transform business models, improved profitability is most visible at Strong Performers and those in Turnaround Completed. This may be due to them starting the transformation process earlier as well as the size of the original gap between where they were and where they need to be to be successful in the new private banking world.
17
Clarity on Performance of Swiss Private Banks
CEO ChangEs: nO guarantEE Of imprOvEd futurE pErfOrmanCEWhen times are bad, the CEO is often expected to step – or be moved – aside. There appears no evidence to suggest that this has any positive effect on the performance of a Swiss private bank. Despite CEO changes, worse performing banks appeared unable to improve their performance.
Key findings
1. Two thirds of banks in our sample changed their CEO at least once in the past nine years. 48% of banks in Continuing Decline changed their CEO at least twice in this period, compared to 12% of Strong Performers.
2. Banks that did not change their CEO - or changed it only once - within the nine years reported higher RoEs than banks who did so twice or more.
3. A CEO change does not necessarily result in staff reductions in the two years following the change.
4. Out of a total 193 CEOs over the period, only eight were women. There are five female CEOs in office at the time of writing.
18
C h a p t e r I I · M ac r o - D e v e lo p M e n t s
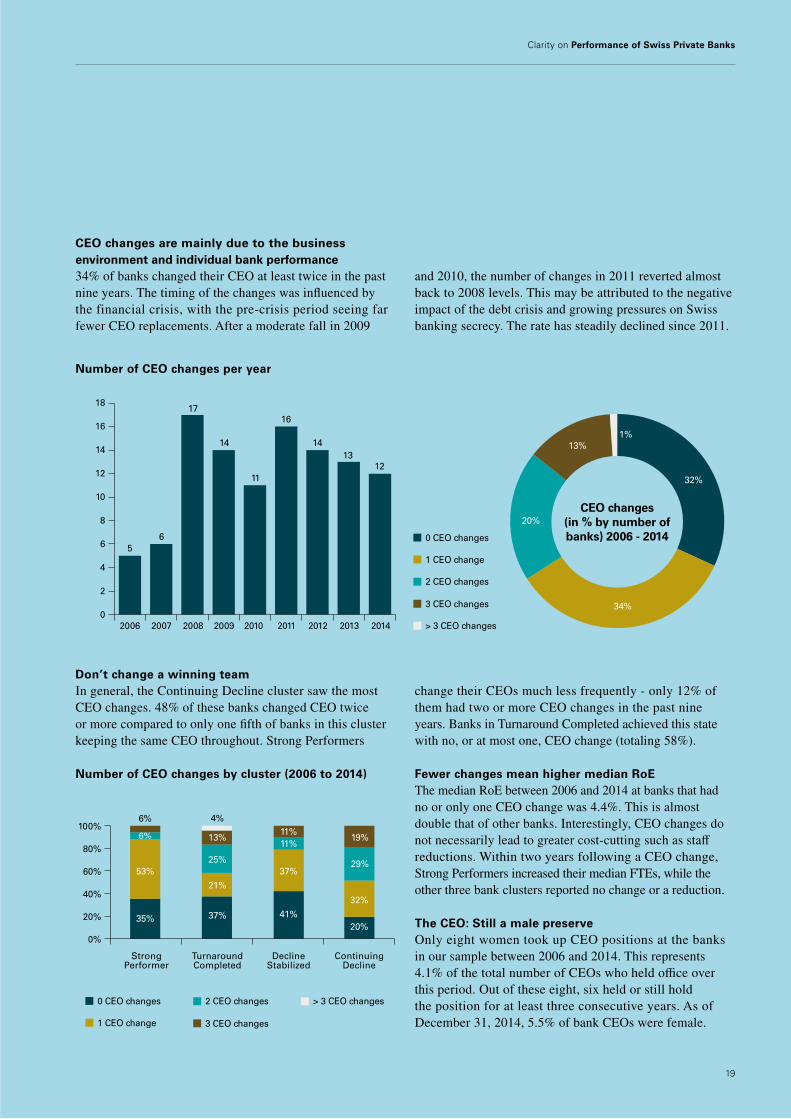
CEO changes are mainly due to the business environment and individual bank performance34% of banks changed their CEO at least twice in the past nine years. The timing of the changes was influenced by the financial crisis, with the pre-crisis period seeing far fewer CEO replacements. After a moderate fall in 2009
and 2010, the number of changes in 2011 reverted almost back to 2008 levels. This may be attributed to the negative impact of the debt crisis and growing pressures on Swiss banking secrecy. The rate has steadily declined since 2011.
Don’t change a winning teamIn general, the Continuing Decline cluster saw the most CEO changes. 48% of these banks changed CEO twice or more compared to only one fifth of banks in this cluster keeping the same CEO throughout. Strong Performers
Number of CEO changes per year
Number of CEO changes by cluster (2006 to 2014)
2006
56
17
14
11
16
1413
12
2007 2008 2009 2010 2011 2012 2013 2014
CEO changes (in % by number of banks) 2006 - 2014
20%
13%
32%
34%
1%
0 CEO changes
1 CEO change
2 CEO changes
3 CEO changes
> 3 CEO changes
change their CEOs much less frequently - only 12% of them had two or more CEO changes in the past nine years. Banks in Turnaround Completed achieved this state with no, or at most one, CEO change (totaling 58%).
Fewer changes mean higher median RoE The median RoE between 2006 and 2014 at banks that had no or only one CEO change was 4.4%. This is almost double that of other banks. Interestingly, CEO changes do not necessarily lead to greater cost-cutting such as staff reductions. Within two years following a CEO change, Strong Performers increased their median FTEs, while the other three bank clusters reported no change or a reduction.
The CEO: Still a male preserveOnly eight women took up CEO positions at the banks in our sample between 2006 and 2014. This represents 4.1% of the total number of CEOs who held office over this period. Out of these eight, six held or still hold the position for at least three consecutive years. As of December 31, 2014, 5.5% of bank CEOs were female.
100%
80%
60%
40%
20%
0%
Strong Performer
Turnaround Completed
Decline Stabilized
Continuing Decline
35%
53%
6%
6% 4%
21%
25%
13%
29%
19%
37%
11% 11%
32%
37% 41% 20%
0 CEO changes
1 CEO change
2 CEO changes
3 CEO changes
> 3 CEO changes
18
16
14
12
10
8
6
4
2
0
19
Clarity on Performance of Swiss Private Banks
20
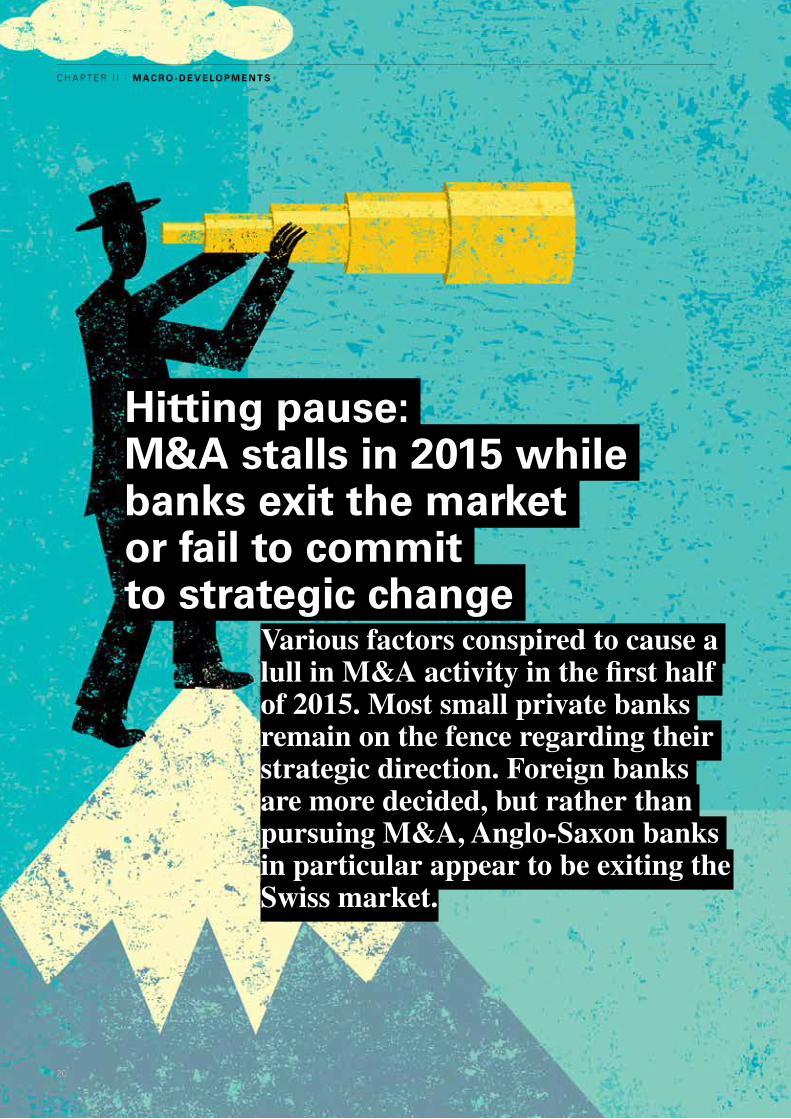
Hitting pause: M&A stalls in 2015 while banks exit the market or fail to commit to strategic change
Various factors conspired to cause a lull in M&A activity in the first half of 2015. Most small private banks remain on the fence regarding their strategic direction. Foreign banks are more decided, but rather than pursuing M&A, Anglo-Saxon banks in particular appear to be exiting the Swiss market.
20
c h A p t e r i i · M AC R O - D E v E lO P M E n T S
21
Clarity on Performance of Swiss Private Banks
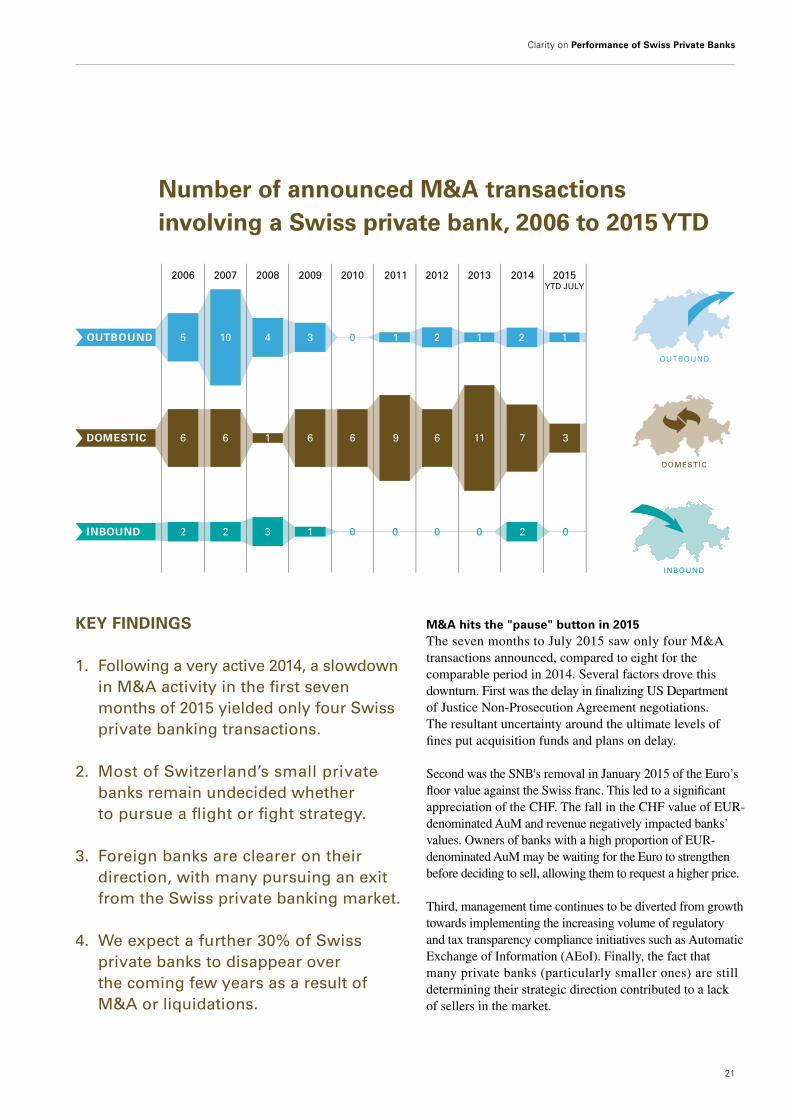
M&A hits the "pause" button in 2015The seven months to July 2015 saw only four M&A transactions announced, compared to eight for the comparable period in 2014. Several factors drove this downturn. First was the delay in finalizing US Department of Justice Non-Prosecution Agreement negotiations. The resultant uncertainty around the ultimate levels of fines put acquisition funds and plans on delay.
Second was the SNB's removal in January 2015 of the Euro’s floor value against the Swiss franc. This led to a significant appreciation of the CHF. The fall in the CHF value of EUR-denominated AuM and revenue negatively impacted banks’ values. Owners of banks with a high proportion of EUR-denominated AuM may be waiting for the Euro to strengthen before deciding to sell, allowing them to request a higher price.
Third, management time continues to be diverted from growth towards implementing the increasing volume of regulatory and tax transparency compliance initiatives such as Automatic Exchange of Information (AEoI). Finally, the fact that many private banks (particularly smaller ones) are still determining their strategic direction contributed to a lack of sellers in the market.
KEy FinDinGS
1. Following a very active 2014, a slowdown in M&A activity in the first seven months of 2015 yielded only four Swiss private banking transactions.
2. Most of Switzerland’s small private banks remain undecided whether to pursue a flight or fight strategy.
3. Foreign banks are clearer on their direction, with many pursuing an exit from the Swiss private banking market.
4. We expect a further 30% of Swiss private banks to disappear over the coming few years as a result of M&A or liquidations.
Number of announced M&A transactions involving a Swiss private bank, 2006 to 2015 YTD
36 1 66 6 69 11 7
5 4 310 0 2 21 1
INBOUND
2 3 12 0 0 0 2
2006 2008 20092007 2010 20122011 2013 2014
2015YTD JULY
DOMESTIC
0 0
OUTBOUND
OUTBOUND
INBOUND
DOMESTIC
1
22
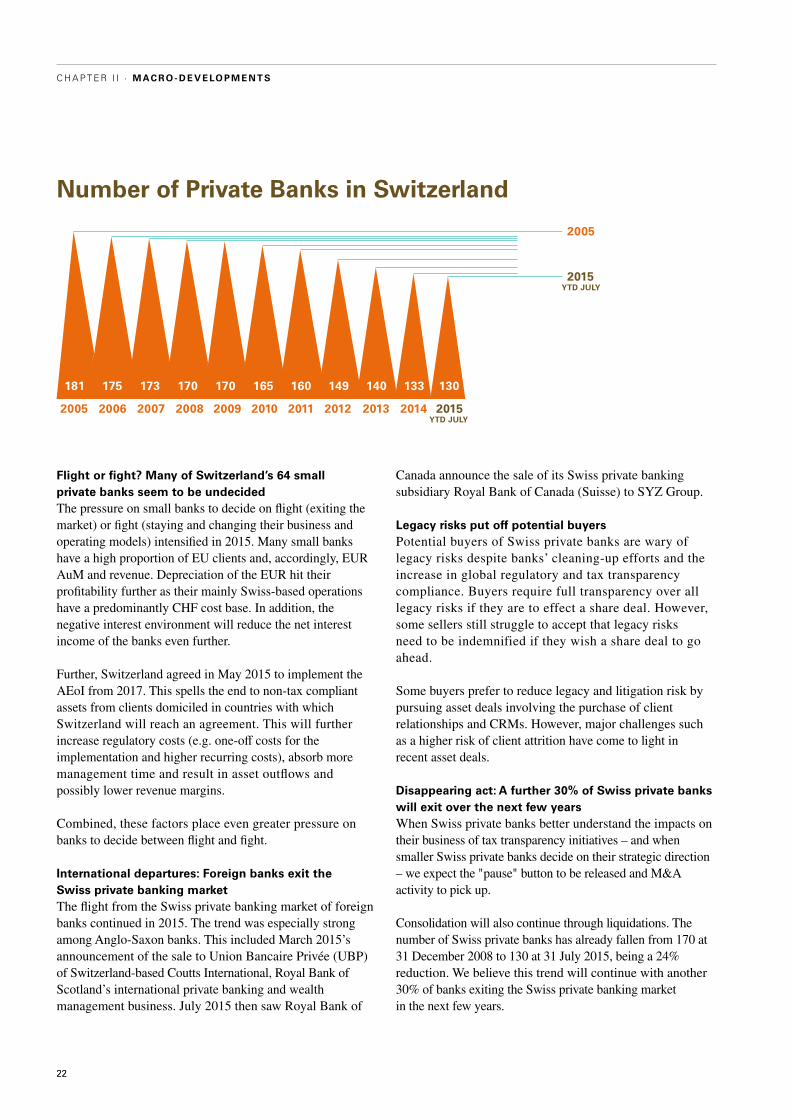
Flight or fight? Many of Switzerland’s 64 small private banks seem to be undecidedThe pressure on small banks to decide on flight (exiting the market) or fight (staying and changing their business and operating models) intensified in 2015. Many small banks have a high proportion of EU clients and, accordingly, EUR AuM and revenue. Depreciation of the EUR hit their profitability further as their mainly Swiss-based operations have a predominantly CHF cost base. In addition, the negative interest environment will reduce the net interest income of the banks even further.
Further, Switzerland agreed in May 2015 to implement the AEoI from 2017. This spells the end to non-tax compliant assets from clients domiciled in countries with which Switzerland will reach an agreement. This will further increase regulatory costs (e.g. one-off costs for the implementation and higher recurring costs), absorb more management time and result in asset outflows and possibly lower revenue margins.
Combined, these factors place even greater pressure on banks to decide between flight and fight.
international departures: Foreign banks exit the Swiss private banking marketThe flight from the Swiss private banking market of foreign banks continued in 2015. The trend was especially strong among Anglo-Saxon banks. This included March 2015’s announcement of the sale to Union Bancaire Privée (UBP) of Switzerland-based Coutts International, Royal Bank of Scotland’s international private banking and wealth management business. July 2015 then saw Royal Bank of
Canada announce the sale of its Swiss private banking subsidiary Royal Bank of Canada (Suisse) to SYZ Group.
legacy risks put off potential buyersPotential buyers of Swiss private banks are wary of legacy risks despite banks’ cleaning-up efforts and the increase in global regulatory and tax transparency compliance. Buyers require full transparency over all legacy risks if they are to effect a share deal. However, some sellers still struggle to accept that legacy risks need to be indemnified if they wish a share deal to go ahead.
Some buyers prefer to reduce legacy and litigation risk by pursuing asset deals involving the purchase of client relationships and CRMs. However, major challenges such as a higher risk of client attrition have come to light in recent asset deals.
Disappearing act: A further 30% of Swiss private banks will exit over the next few yearsWhen Swiss private banks better understand the impacts on their business of tax transparency initiatives – and when smaller Swiss private banks decide on their strategic direction – we expect the "pause" button to be released and M&A activity to pick up.
Consolidation will also continue through liquidations. The number of Swiss private banks has already fallen from 170 at 31 December 2008 to 130 at 31 July 2015, being a 24% reduction. We believe this trend will continue with another 30% of banks exiting the Swiss private banking market in the next few years.
Number of Private Banks in Switzerland
22
C h a p t e r I I · M ac r o - D e v e lo p M e n t s
2005
2015
yTD July
yTD July
181 175 173 170 170 165 160 149 140 133 130
2005 2006 2007 2008 2009 2010 2011 2012 2013 2014 2015
23
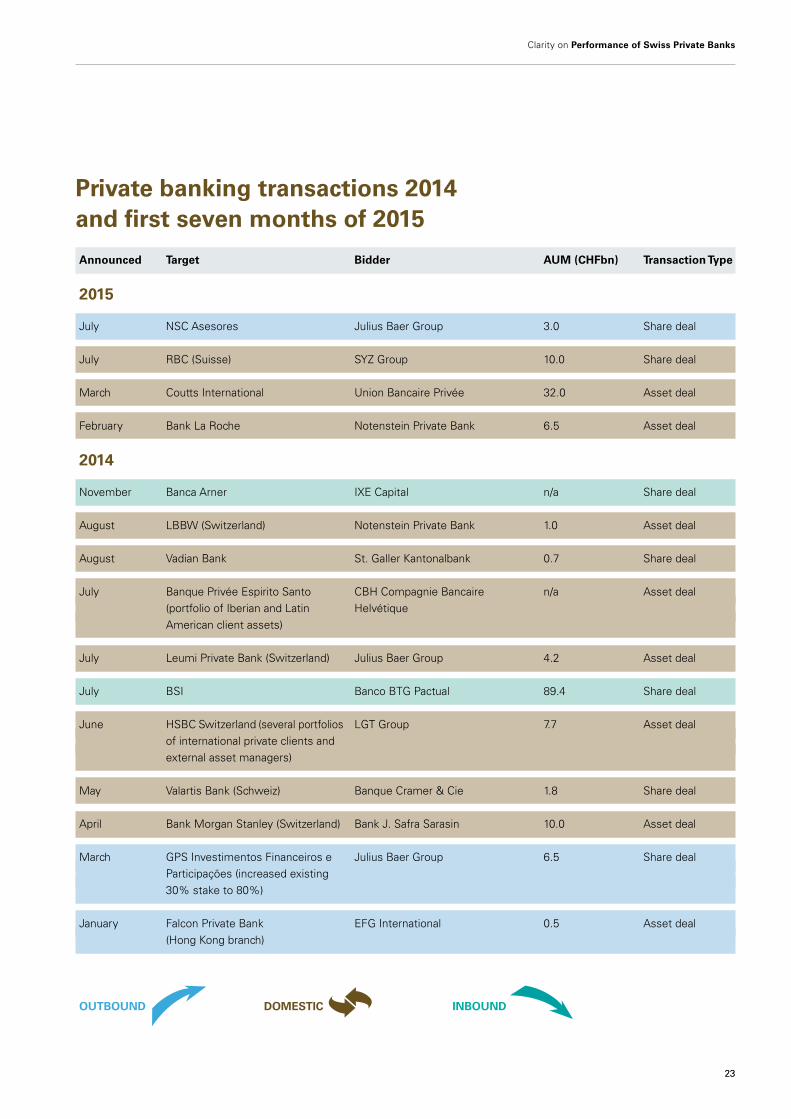
Clarity on Performance of Swiss Private Banks
Announced Target Bidder AuM (CHFbn) Transaction Type
2015
July NSc Asesores Julius Baer Group 3.0 Share deal
July rBc (Suisse) SYZ Group 10.0 Share deal
March coutts international Union Bancaire privée 32.0 Asset deal
February Bank la roche Notenstein private Bank 6.5 Asset deal
2014
November Banca Arner iXe capital n/a Share deal
August lBBW (Switzerland) Notenstein private Bank 1.0 Asset deal
August Vadian Bank St. Galler Kantonalbank 0.7 Share deal
July Banque privée espirito Santo cBh compagnie Bancaire n/a Asset deal (portfolio of iberian and latin helvétique American client assets)
July leumi private Bank (Switzerland) Julius Baer Group 4.2 Asset deal
July BSi Banco BtG pactual 89.4 Share deal
June hSBc Switzerland (several portfolios lGt Group 7.7 Asset deal of international private clients and external asset managers)
May Valartis Bank (Schweiz) Banque cramer & cie 1.8 Share deal
April Bank Morgan Stanley (Switzerland) Bank J. Safra Sarasin 10.0 Asset deal
March GpS investimentos Financeiros e Julius Baer Group 6.5 Share deal participações (increased existing 30% stake to 80%)
January Falcon private Bank eFG international 0.5 Asset deal (hong Kong branch)
OuTBOunD DOMESTiC inBOunD
Private banking transactions 2014 and first seven months of 2015
23

24
clarity on Performance of Swiss Private Banks
25
Analysis of performance and trends
26
C h a p t e r I I I · A n A lys i s o f p e r f o r m A n c e A n d t r e n d s
Profitability
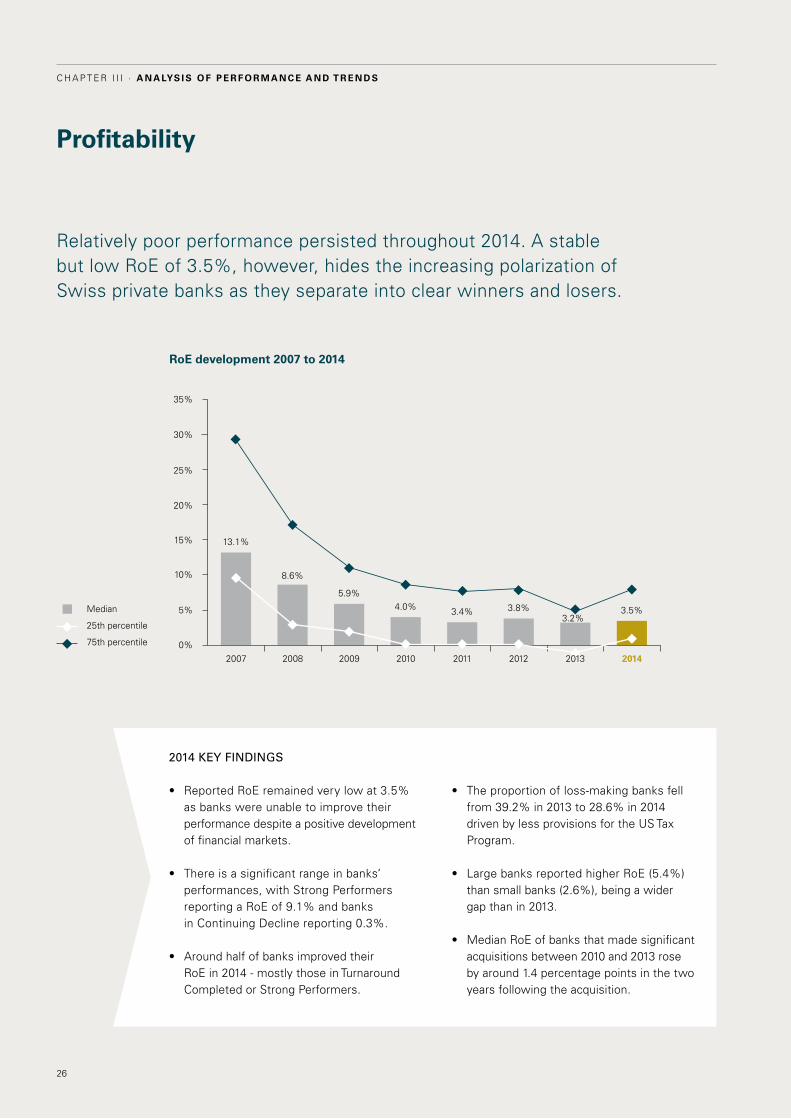
relatively poor performance persisted throughout 2014. A stable but low roe of 3.5%, however, hides the increasing polarization of Swiss private banks as they separate into clear winners and losers.
• Theproportionofloss-makingbanksfellfrom 39.2% in 2013 to 28.6% in 2014 driven by less provisions for the US tax program.
• LargebanksreportedhigherRoE(5.4%)than small banks (2.6%), being a wider gap than in 2013.
• MedianRoEofbanksthatmadesignificantacquisitions between 2010 and 2013 rose by around 1.4 percentage points in the two years following the acquisition.
• ReportedRoEremainedverylowat3.5% as banks were unable to improve their performance despite a positive development of financial markets.
• Thereisasignificantrangeinbanks’performances, with Strong performers reporting a roe of 9.1% and banks in continuing decline reporting 0.3%.
• Aroundhalfofbanksimprovedtheir roe in 2014 - mostly those in turnaround completed or Strong performers.
2014 kEy FINDINgS
RoE development 2007 to 2014
Median
25th percentile
75th percentile
2007 2008 2009 2010 2011 2012 2014
10%
20%
30%
0%
35%
5%
15%
25%
13.1%
8.6%
5.9%4.0% 3.4% 3.8% 3.5%
3.2%
2013
27
Clarity on Performance of Swiss Private Banks
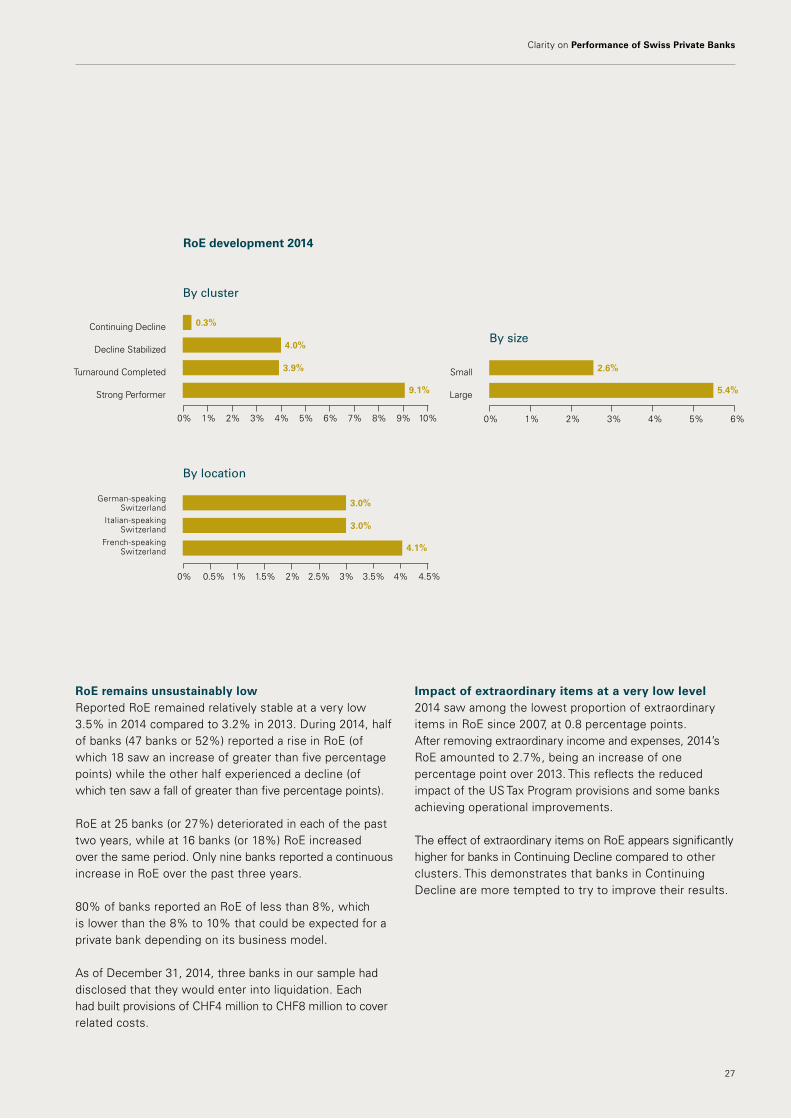
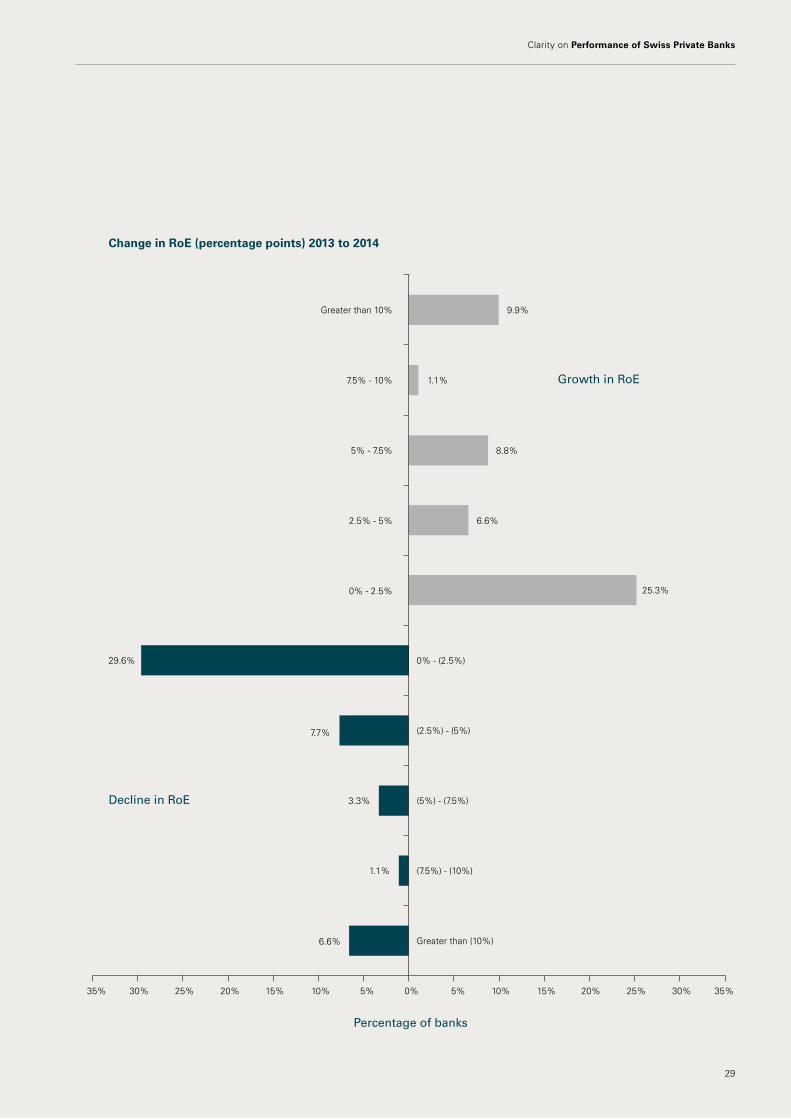
RoE remains unsustainably lowreported roe remained relatively stable at a very low 3.5% in 2014 compared to 3.2% in 2013. during 2014, half of banks (47 banks or 52%) reported a rise in roe (of which 18 saw an increase of greater than five percentage points) while the other half experienced a decline (of which ten saw a fall of greater than five percentage points).
roe at 25 banks (or 27%) deteriorated in each of the past two years, while at 16 banks (or 18%) roe increased over the same period. only nine banks reported a continuous increase in roe over the past three years.
80% of banks reported an roe of less than 8%, which is lower than the 8% to 10% that could be expected for a private bank depending on its business model.
As of december 31, 2014, three banks in our sample had disclosed that they would enter into liquidation. each had built provisions of chF4 million to chF8 million to cover related costs.
impact of extraordinary items at a very low level2014 saw among the lowest proportion of extraordinary items in roe since 2007, at 0.8 percentage points. After removing extraordinary income and expenses, 2014’s roe amounted to 2.7%, being an increase of one percentage point over 2013. this reflects the reduced impact of the US tax program provisions and some banks achieving operational improvements.
the effect of extraordinary items on roe appears significantly higher for banks in continuing decline compared to other clusters. this demonstrates that banks in continuing decline are more tempted to try to improve their results.
By size
large
0%
Small
1% 2% 3% 4% 5% 6%
2.6%
5.4%Strong performer
0%
turnaround completed
decline Stabilized
continuing decline
By cluster
10%
0.3%
4.0%
3.9%
9.1%
1% 2% 3% 4% 5% 6% 7% 8% 9%
0%
French-speakingSwitzerland
italian-speakingSwitzerland
German-speaking Switzerland
By location
4.5%
3.0%
3.0%
4.1%
0.5% 1% 1.5% 2% 2.5% 3% 3.5% 4%
RoE development 2014
28
C h a p t e r I I I · A n A lys i s o f p e r f o r m A n c e A n d t r e n d s
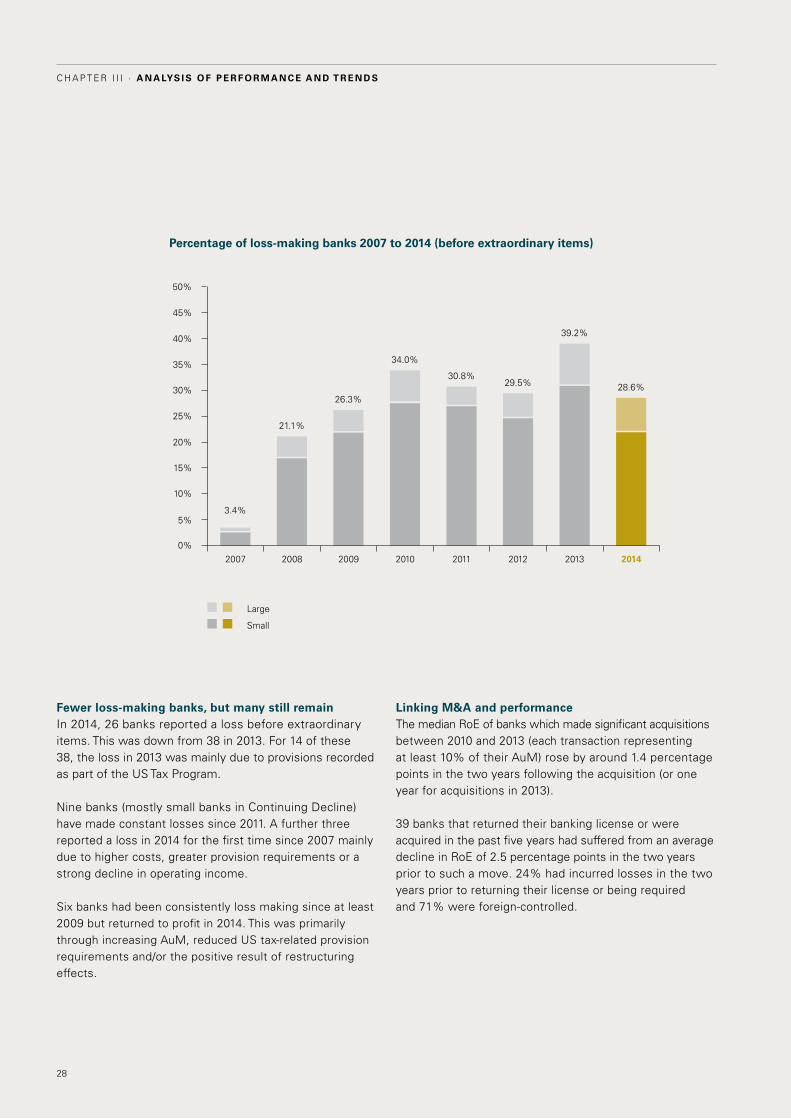
Percentage of loss-making banks 2007 to 2014 (before extraordinary items)
2007 2008 2009 2010 2011 2012 2013 2014
10%
20%
30%
0%
35%
5%
15%
25%
40%
45%
50%
3.4%
21.1%
26.3%
34.0%
30.8% 29.5%
39.2%
28.6%
large
Small
Fewer loss-making banks, but many still remainin 2014, 26 banks reported a loss before extraordinary items. this was down from 38 in 2013. For 14 of these 38, the loss in 2013 was mainly due to provisions recorded as part of the US tax program.
Nine banks (mostly small banks in continuing decline) have made constant losses since 2011. A further three reported a loss in 2014 for the first time since 2007 mainly due to higher costs, greater provision requirements or a strong decline in operating income.
Six banks had been consistently loss making since at least 2009 but returned to profit in 2014. this was primarily through increasing AuM, reduced US tax-related provision requirements and/or the positive result of restructuring effects.
linking M&A and performancethe median roe of banks which made significant acquisitions between 2010 and 2013 (each transaction representing at least 10% of their AuM) rose by around 1.4 percentage points in the two years following the acquisition (or one year for acquisitions in 2013).
39 banks that returned their banking license or were acquired in the past five years had suffered from an average decline in roe of 2.5 percentage points in the two years prior to such a move. 24% had incurred losses in the two years prior to returning their license or being required and 71% were foreign-controlled.
29
Clarity on Performance of Swiss Private Banks
Change in RoE (percentage points) 2013 to 2014
Greater than (10%)
(7.5%) - (10%)
(5%) - (7.5%)
(2.5%) - (5%)
0% - (2.5%)
0% - 2.5%
2.5% - 5%
5% - 7.5%
7.5% - 10%
Greater than 10%
0% 5%5% 10%10% 15%15% 20%20% 25%25% 35%35% 30%30%
6.6%
1.1%
3.3%
7.7%
29.6%
25.3%
6.6%
8.8%
1.1%
9.9%
Decline in RoE
Percentage of banks
growth in RoE
30
C h a p t e r I I I · A n A lys i s o f p e r f o r m A n c e A n d t r e n d s
Assets under Management
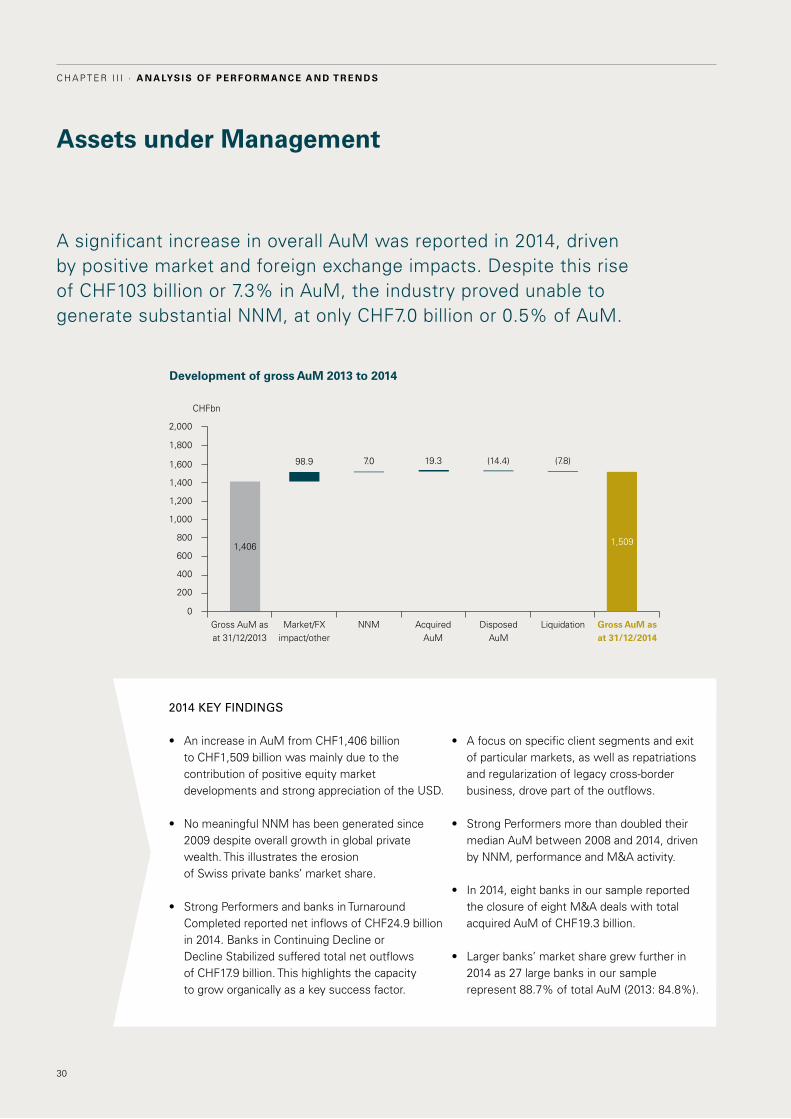
A significant increase in overall AuM was reported in 2014, driven by positive market and foreign exchange impacts. despite this rise of chF103 billion or 7.3% in AuM, the industry proved unable to generate substantial NNM, at only chF7.0 billion or 0.5% of AuM.
• Afocusonspecificclientsegmentsandexitof particular markets, as well as repatriations and regularization of legacy cross-border business, drove part of the outflows.
• StrongPerformersmorethandoubledtheirmedian AuM between 2008 and 2014, driven by NNM, performance and M&A activity.
• In2014,eightbanksinoursamplereportedthe closure of eight M&A deals with total acquired AuM of chF19.3 billion.
• Largerbanks’marketsharegrewfurtherin2014 as 27 large banks in our sample represent 88.7% of total AuM (2013: 84.8%).
• AnincreaseinAuMfromCHF1,406billion to chF1,509 billion was mainly due to the contribution of positive equity market developments and strong appreciation of the USd.
• No meaningful NNM has been generated since 2009 despite overall growth in global private wealth. this illustrates the erosion of Swiss private banks’ market share.
• StrongPerformersandbanksinTurnaroundcompleted reported net inflows of chF24.9 billion in 2014. Banks in continuing decline or decline Stabilized suffered total net outflows of chF17.9 billion. this highlights the capacity to grow organically as a key success factor.
2014 kEy FINDINgS
Development of gross AuM 2013 to 2014
Gross AuM as at 31/12/2013
Market/FXimpact/other
NNM Acquired AuM
disposed AuM
liquidation Gross AuM as at 31/12/2014
0
1,600
1,800
2,000
1,400
1,200
1,000
800
600
400
200
chFbn
1,406
98.9 19.3 (14.4) (7.8)7.0
1,509
31
Clarity on Performance of Swiss Private Banks
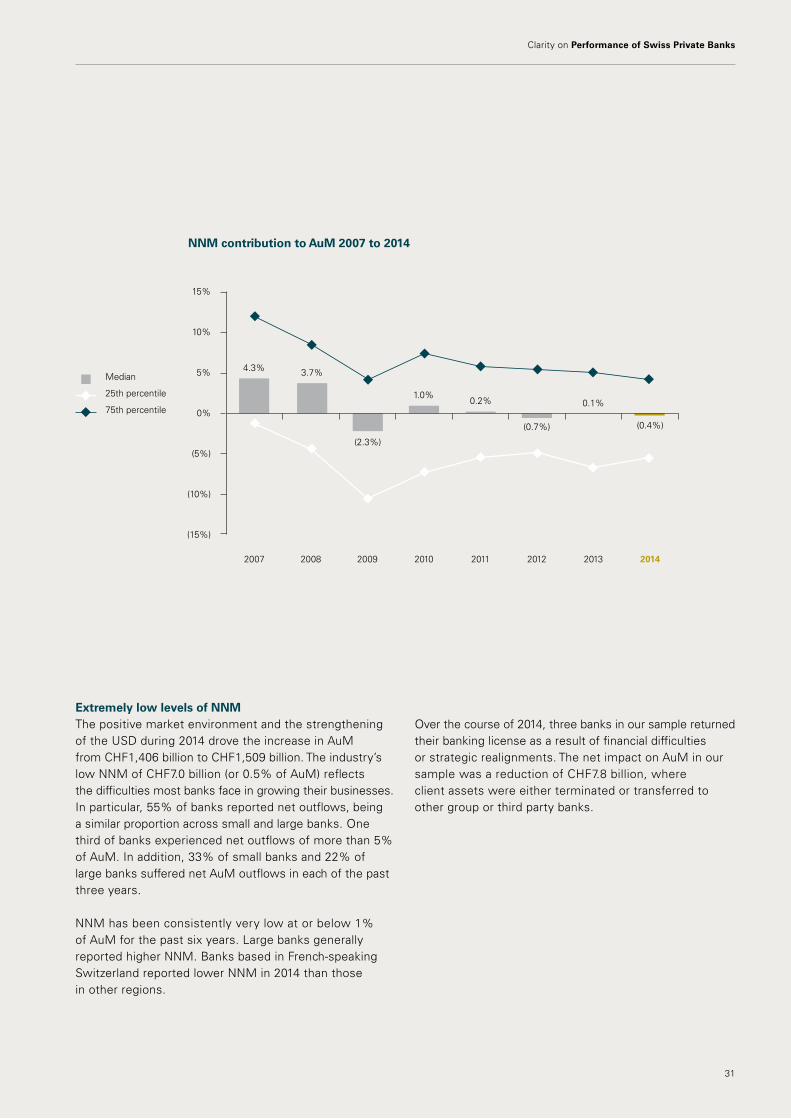
Extremely low levels of nnMthe positive market environment and the strengthening of the USd during 2014 drove the increase in AuM from chF1,406 billion to chF1,509 billion. the industry’s low NNM of chF7.0 billion (or 0.5% of AuM) reflects the difficulties most banks face in growing their businesses. in particular, 55% of banks reported net outflows, being a similar proportion across small and large banks. one third of banks experienced net outflows of more than 5% of AuM. in addition, 33% of small banks and 22% of large banks suffered net AuM outflows in each of the past three years.
NNM has been consistently very low at or below 1% of AuM for the past six years. large banks generally reported higher NNM. Banks based in French-speaking Switzerland reported lower NNM in 2014 than those in other regions.
over the course of 2014, three banks in our sample returned their banking license as a result of financial difficulties or strategic realignments. the net impact on AuM in our sample was a reduction of chF7.8 billion, where client assets were either terminated or transferred to other group or third party banks.
nnM contribution to AuM 2007 to 2014
2007 2008 2010 2011 2012 2013 2014
0%
5%
10%
15%
(5%)
(10%)
(15%)
2009
4.3%
1.0%0.2%
3.7%
(2.3%)
(0.7%) (0.4%)
0.1%
Median
25th percentile
75th percentile
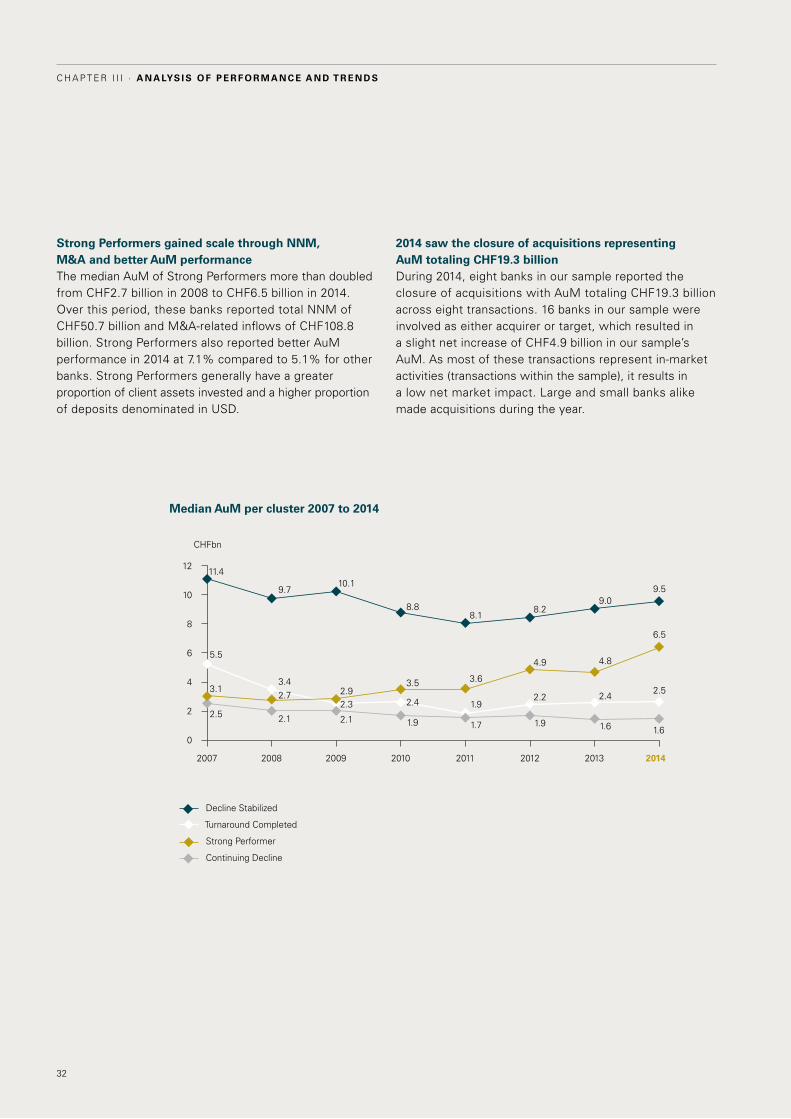
Strong Performers gained scale through nnM, M&A and better AuM performancethe median AuM of Strong performers more than doubled from chF2.7 billion in 2008 to chF6.5 billion in 2014. over this period, these banks reported total NNM of chF50.7 billion and M&A-related inflows of chF108.8 billion. Strong performers also reported better AuM performance in 2014 at 7.1% compared to 5.1% for other banks. Strong performers generally have a greater proportion of client assets invested and a higher proportion of deposits denominated in USd.
2014 saw the closure of acquisitions representing AuM totaling CHF19.3 billionduring 2014, eight banks in our sample reported the closure of acquisitions with AuM totaling chF19.3 billion across eight transactions. 16 banks in our sample were involved as either acquirer or target, which resulted in a slight net increase of chF4.9 billion in our sample’s AuM. As most of these transactions represent in-market activities (transactions within the sample), it results in a low net market impact. large and small banks alike made acquisitions during the year.
Median AuM per cluster 2007 to 2014
decline Stabilized
turnaround completed
2008 2009 2010 2011 2012 2013 20142007
0
2
4
6
8
10
12 11.4
9.710.1
8.88.1
8.29.0
9.5
5.5
3.4
2.3 2.4 1.92.2 2.4
2.53.12.7 2.9
3.5 3.6
4.9 4.8
6.5
2.5 2.1 2.1 1.9 1.7 1.9 1.6 1.6
Strong performer
continuing decline
chFbn
32
C h a p t e r I I I · A n A lys i s o f p e r f o r m A n c e A n d t r e n d s
Performance contribution to AuM 2007 to 2014
Median
25th percentile
75th percentile 0%
5%
(5%)
(10%)
(15%)
10%
15%
(20%)
(25%)
(30%)
2.4%
5.9%
(5.8%)
(23.0%)
3.6%
7.9%
(6.1%)
4.8%
2007 2012 2013 20142010 20112008 2009
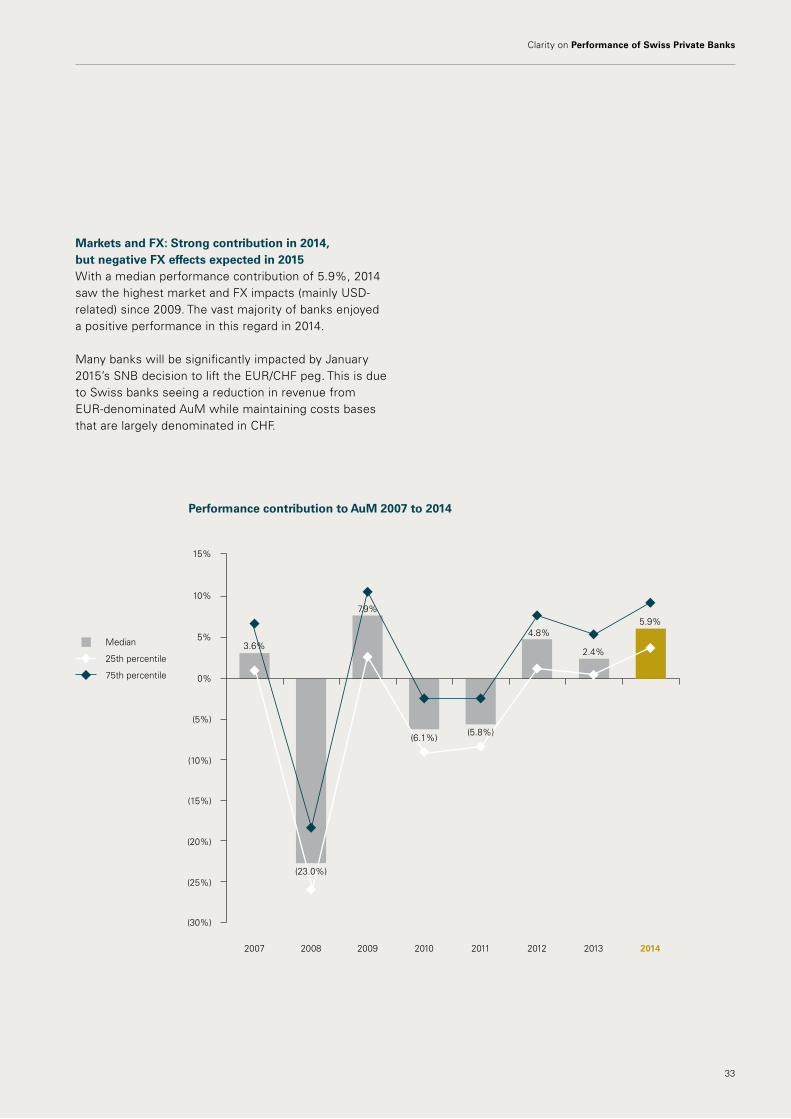
Markets and FX: Strong contribution in 2014, but negative FX effects expected in 2015With a median performance contribution of 5.9%, 2014 saw the highest market and FX impacts (mainly USd-related) since 2009. the vast majority of banks enjoyed a positive performance in this regard in 2014.
Many banks will be significantly impacted by January 2015’s SNB decision to lift the eUr/chF peg. this is due to Swiss banks seeing a reduction in revenue from eUr-denominated AuM while maintaining costs bases that are largely denominated in chF.
33
Clarity on Performance of Swiss Private Banks
34
C h a p t e r I I I · A n A lys i s o f p e r f o r m A n c e A n d t r e n d s
Revenue development
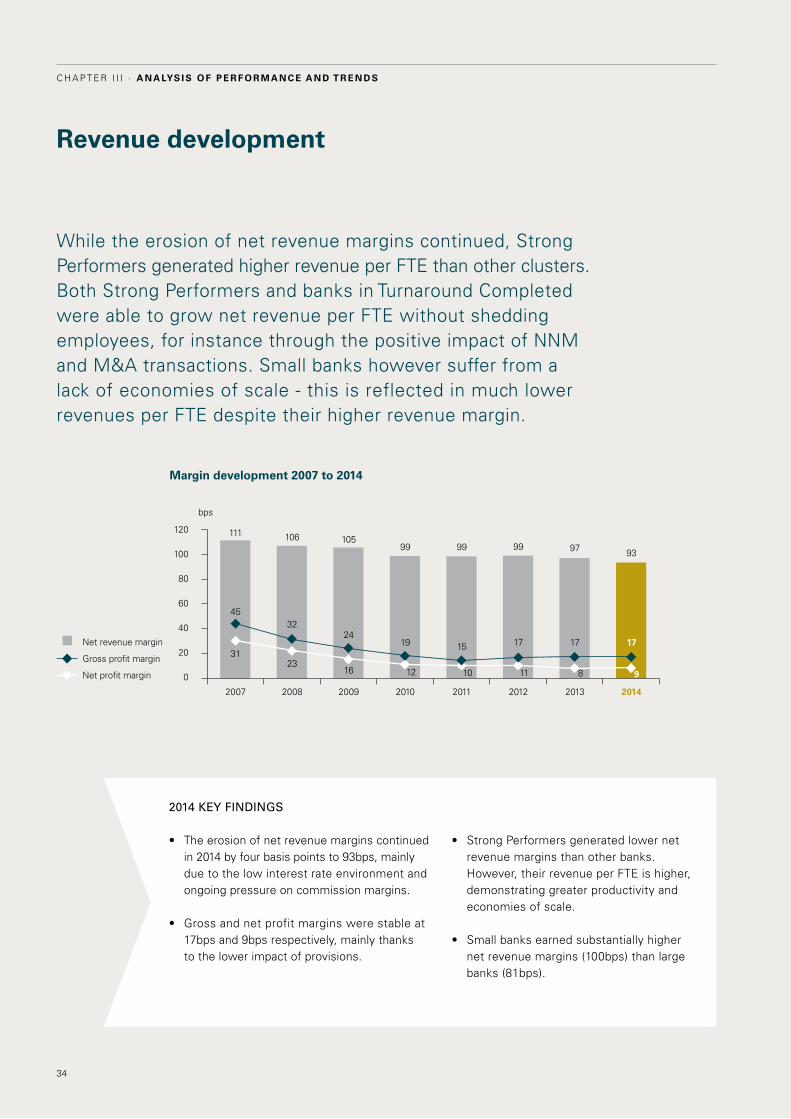
While the erosion of net revenue margins continued, Strong performers generated higher revenue per Fte than other clusters. Both Strong performers and banks in turnaround completed were able to grow net revenue per Fte without shedding employees, for instance through the positive impact of NNM and M&A transactions. Small banks however suffer from a lack of economies of scale - this is reflected in much lower revenues per Fte despite their higher revenue margin.
• StrongPerformersgeneratedlowernetrevenue margins than other banks. however, their revenue per Fte is higher, demonstrating greater productivity and economies of scale.
• Smallbanksearnedsubstantiallyhighernet revenue margins (100bps) than large banks (81bps).
• Theerosionofnetrevenuemarginscontinuedin 2014 by four basis points to 93bps, mainly due to the low interest rate environment and ongoing pressure on commission margins.
• Grossandnetprofitmarginswerestableat17bps and 9bps respectively, mainly thanks to the lower impact of provisions.
2014 kEy FINDINgS
Margin development 2007 to 2014
2007
111
45
31
2008
106
32
23
2009
105
24
16
2010
99
19
12
2011
99
15
10 11 8 9
2012
99
17
2013
17
2014
93
17
120
100
80
60
40
20
0
Net revenue margin
Gross profit margin
Net profit margin
97
bps
35
Clarity on Performance of Swiss Private Banks
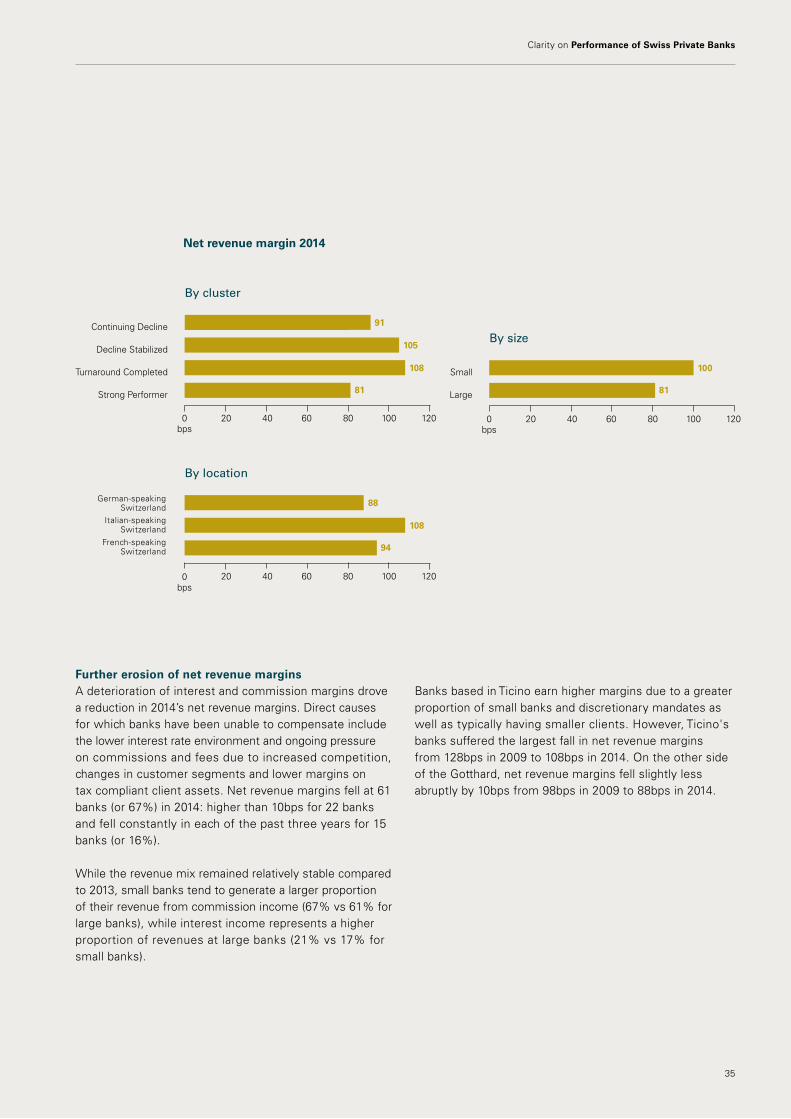
Further erosion of net revenue marginsA deterioration of interest and commission margins drove a reduction in 2014’s net revenue margins. direct causes for which banks have been unable to compensate include the lower interest rate environment and ongoing pressure on commissions and fees due to increased competition, changes in customer segments and lower margins on tax compliant client assets. Net revenue margins fell at 61 banks (or 67%) in 2014: higher than 10bps for 22 banks and fell constantly in each of the past three years for 15 banks (or 16%).
While the revenue mix remained relatively stable compared to 2013, small banks tend to generate a larger proportion of their revenue from commission income (67% vs 61% for large banks), while interest income represents a higher proportion of revenues at large banks (21% vs 17% for small banks).
Strong performer
0bps
turnaround completed
decline Stabilized
continuing decline
By cluster
20 40 60 80 100 120
91
105
108
81
By size
large
0bps
Small
20 40 60 80 100 120
100
81
Banks based in ticino earn higher margins due to a greater proportion of small banks and discretionary mandates as well as typically having smaller clients. however, ticino's banks suffered the largest fall in net revenue margins from 128bps in 2009 to 108bps in 2014. on the other side of the Gotthard, net revenue margins fell slightly less abruptly by 10bps from 98bps in 2009 to 88bps in 2014.
French-speakingSwitzerland
italian-speakingSwitzerland
German-speaking Switzerland
0bps
By location
20 40 60 80 100 120
88
108
94
net revenue margin 2014
36
C h a p t e r I I I · A n A lys i s o f p e r f o r m A n c e A n d t r e n d s
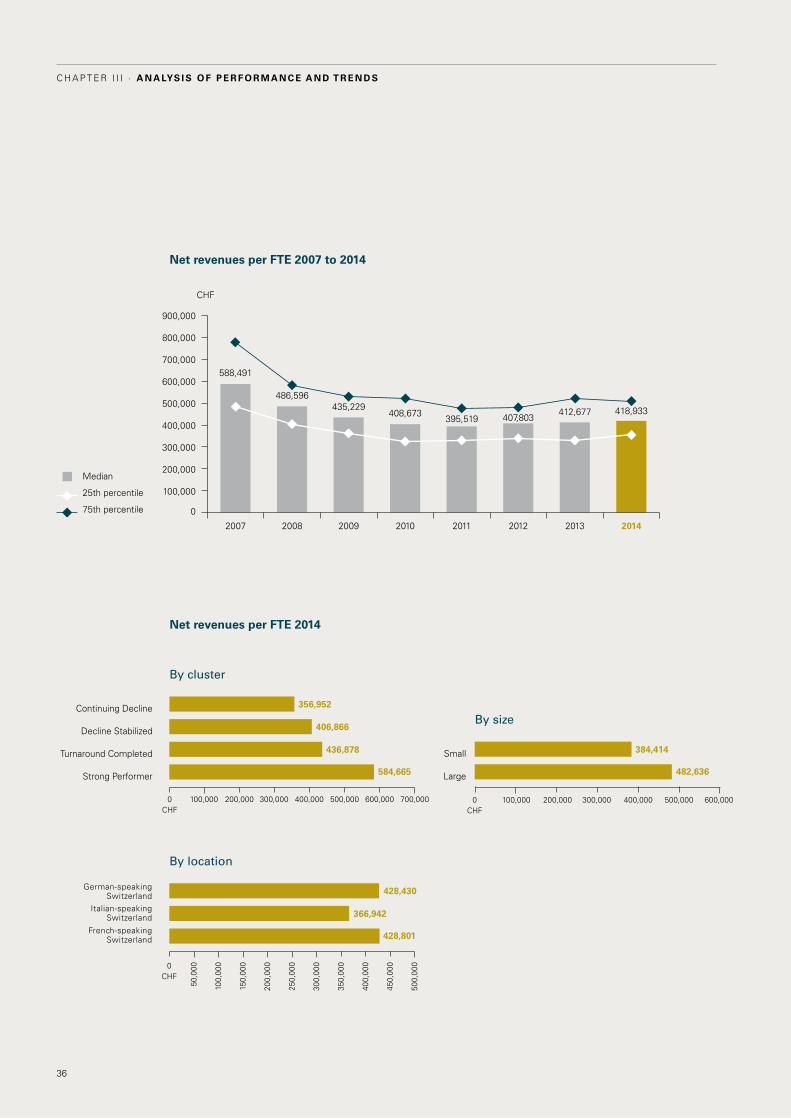
net revenues per FTE 2007 to 2014
Median
25th percentile
75th percentile
2007
588,491
486,596435,229
408,673395,519 407,803
412,677 418,933
2008 2009 2010 2011 2012 2013 2014
900,000
800,000
700,000
600,000
500,000
400,000
300,000
200,000
100,000
0
chF
Strong performer
0chF
turnaround completed
decline Stabilized
continuing decline
By cluster
By size
100,000 200,000 300,000 400,000 500,000 600,000 700,000
356,952
406,866
436,878
584,665
0chF
By location
428,430
366,942
428,801
large
0chF
Small
100,000
50,0
00
100,
000
150,
000
200,
000
250,
000
300,
000
350,
000
400,
000
450,
000
500,
000
200,000 300,000 400,000 500,000 600,000
384,414
482,636
French-speakingSwitzerland
italian-speakingSwitzerland
German-speaking Switzerland
net revenues per FTE 2014
37
Clarity on Performance of Swiss Private Banks
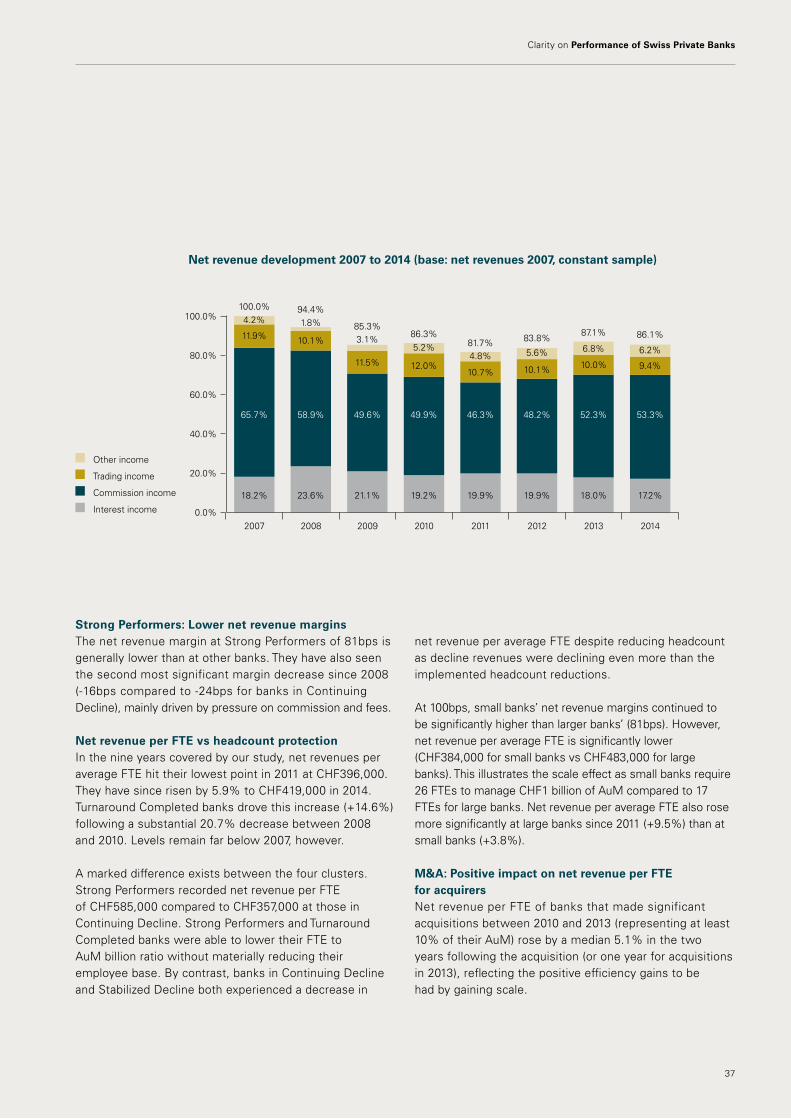
net revenue development 2007 to 2014 (base: net revenues 2007, constant sample)
other income
trading income
commission income
interest income
2007
4.2%100.0%
1.8%94.4%
3.1%85.3%
5.2%86.3%
4.8%81.7%
5.6%
83.8%6.8%
87.1%
6.2%
86.1%
2008 2009 2010 2011 2012 2013 2014
100.0%
80.0%
60.0%
40.0%
20.0%
0.0%
11.9%
18.2%
65.7%
10.1%
23.6%
58.9%
11.5%
21.1%
49.6%
12.0%
19.2%
49.9%
10.7%
19.9%
46.3%
10.1%
48.2%
10.0%
18.0%
52.3%
9.4%
17.2%
53.3%
19.9%
Strong Performers: lower net revenue margins the net revenue margin at Strong performers of 81bps is generally lower than at other banks. they have also seen the second most significant margin decrease since 2008 (-16bps compared to -24bps for banks in continuing decline), mainly driven by pressure on commission and fees.
net revenue per FTE vs headcount protectionin the nine years covered by our study, net revenues per average Fte hit their lowest point in 2011 at chF396,000. they have since risen by 5.9% to chF419,000 in 2014. turnaround completed banks drove this increase (+14.6%) following a substantial 20.7% decrease between 2008 and 2010. levels remain far below 2007, however.
A marked difference exists between the four clusters. Strong performers recorded net revenue per Fte of chF585,000 compared to chF357,000 at those in continuing decline. Strong performers and turnaround completed banks were able to lower their Fte to AuM billion ratio without materially reducing their employee base. By contrast, banks in continuing decline and Stabilized decline both experienced a decrease in
net revenue per average Fte despite reducing headcount as decline revenues were declining even more than the implemented headcount reductions.
At 100bps, small banks’ net revenue margins continued to be significantly higher than larger banks’ (81bps). however, net revenue per average Fte is significantly lower (chF384,000 for small banks vs chF483,000 for large banks). this illustrates the scale effect as small banks require 26 Ftes to manage chF1 billion of AuM compared to 17 Ftes for large banks. Net revenue per average Fte also rose more significantly at large banks since 2011 (+9.5%) than at small banks (+3.8%).
M&A: Positive impact on net revenue per FTE for acquirersNet revenue per Fte of banks that made significant acquisitions between 2010 and 2013 (representing at least 10% of their AuM) rose by a median 5.1% in the two years following the acquisition (or one year for acquisitions in 2013), reflecting the positive efficiency gains to be had by gaining scale.
38
C h a p t e r I I I · A n A lys i s o f p e r f o r m A n c e A n d t r e n d s
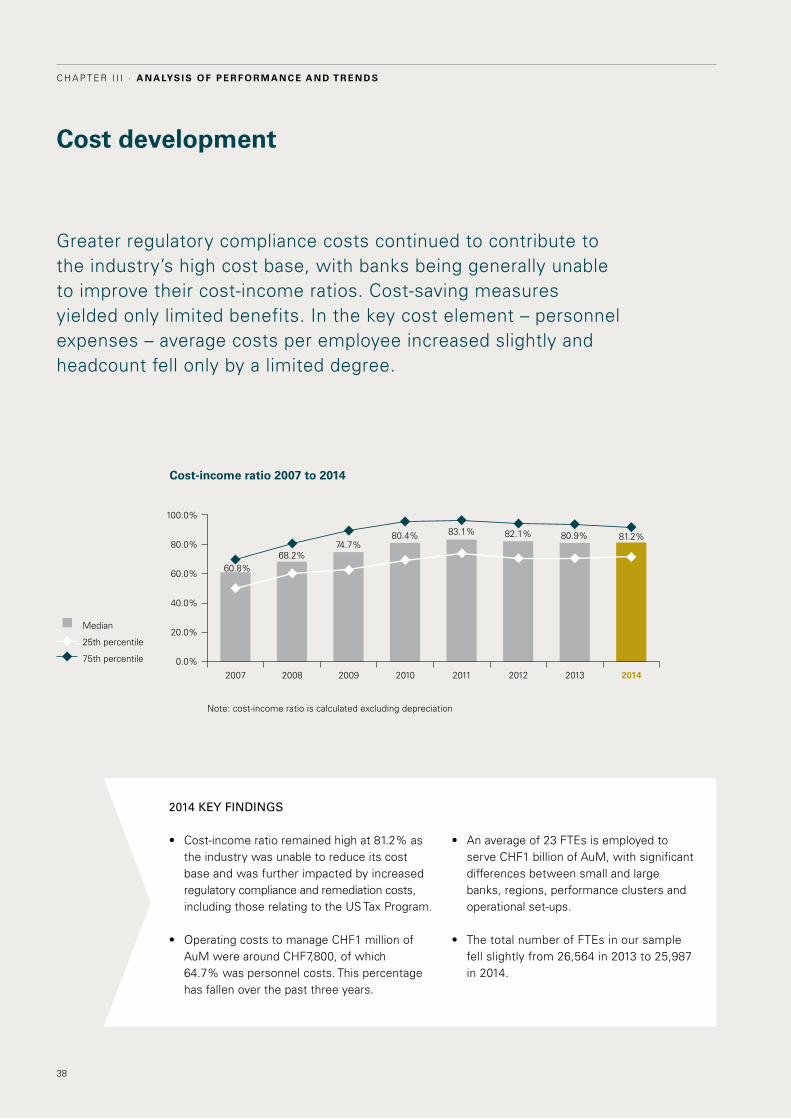
Cost development
Greater regulatory compliance costs continued to contribute to the industry’s high cost base, with banks being generally unable to improve their cost-income ratios. cost-saving measures yielded only limited benefits. in the key cost element – personnel expenses – average costs per employee increased slightly and headcount fell only by a limited degree.
Cost-income ratio 2007 to 2014
Note: cost-income ratio is calculated excluding depreciation
100.0%
80.0%
60.0%
40.0%
20.0%
0.0%2007 2008 2009 2010 2011 2012 2013 2014
Median
25th percentile
75th percentile
60.8%68.2%
74.7%80.4% 83.1% 82.1% 80.9% 81.2%
• Cost-incomeratioremainedhighat81.2%asthe industry was unable to reduce its cost base and was further impacted by increased regulatory compliance and remediation costs, including those relating to the US tax program.
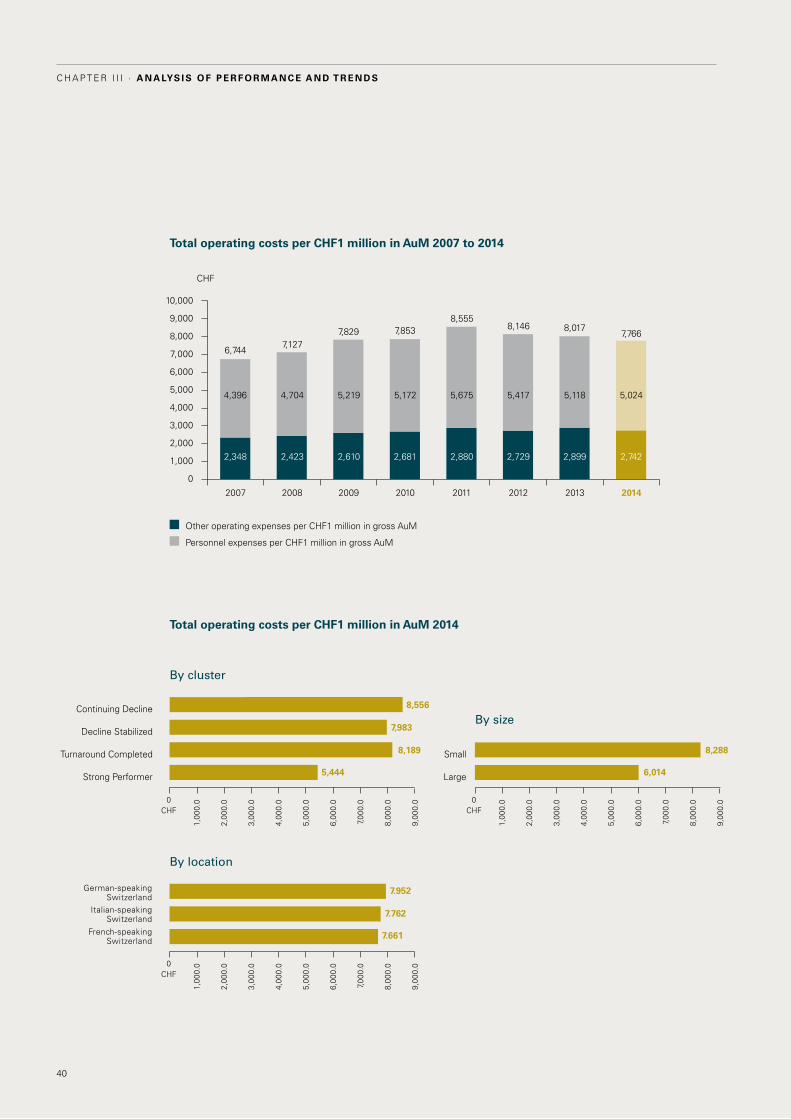
• OperatingcoststomanageCHF1millionofAuM were around chF7,800, of which 64.7% was personnel costs. this percentage has fallen over the past three years.
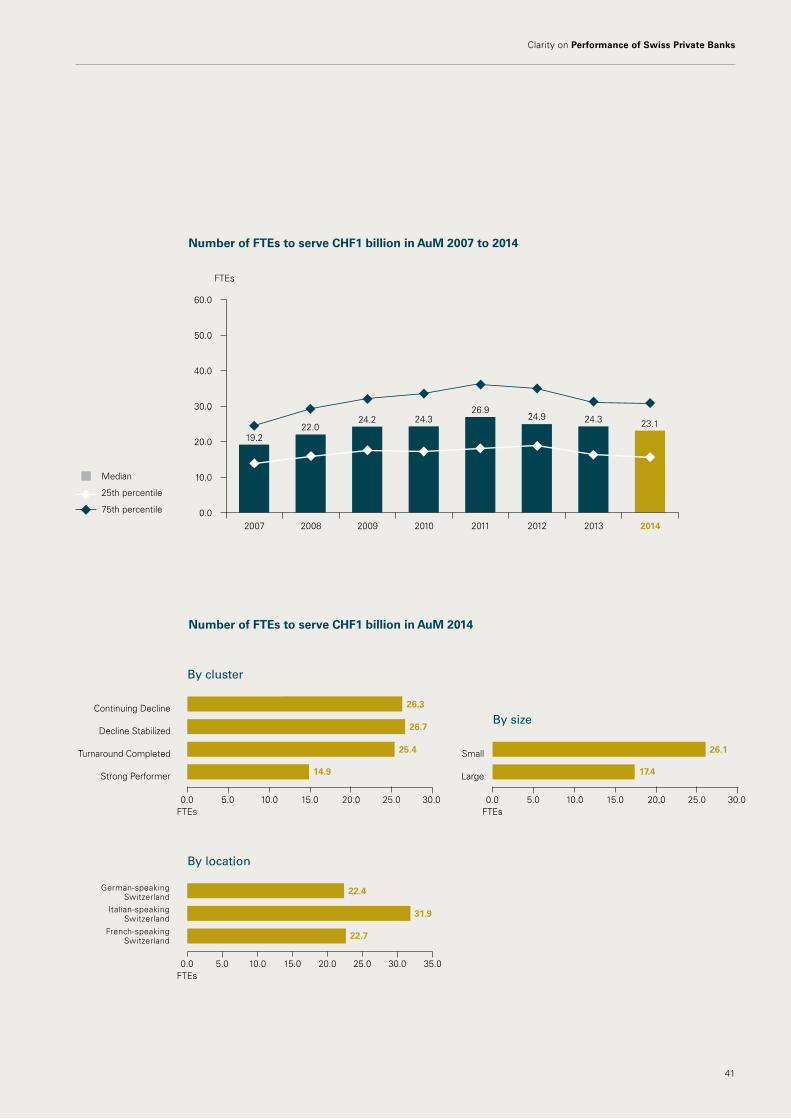
2014 kEy FINDINgS
• Anaverageof23FTEsisemployedto serve chF1 billion of AuM, with significant differences between small and large banks, regions, performance clusters and operational set-ups.
• ThetotalnumberofFTEsinoursample fell slightly from 26,564 in 2013 to 25,987 in 2014.
39
Clarity on Performance of Swiss Private Banks
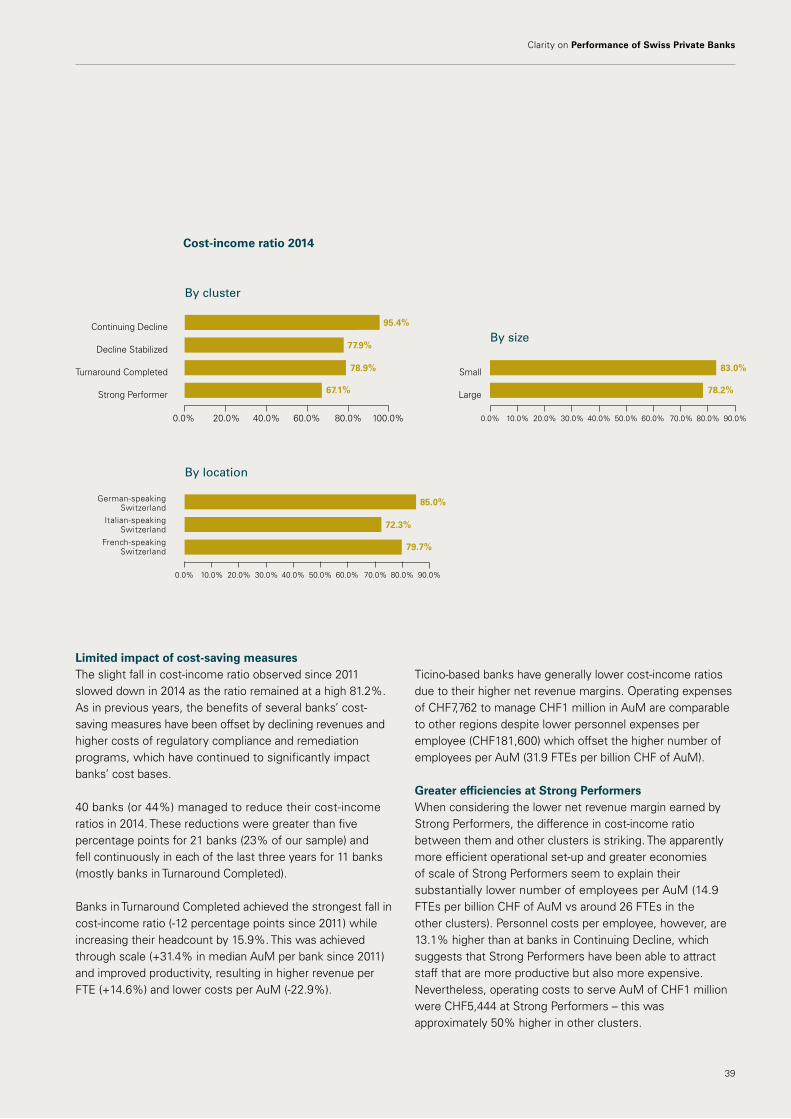
limited impact of cost-saving measuresthe slight fall in cost-income ratio observed since 2011 slowed down in 2014 as the ratio remained at a high 81.2%. As in previous years, the benefits of several banks’ cost-saving measures have been offset by declining revenues and higher costs of regulatory compliance and remediation programs, which have continued to significantly impact banks’ cost bases.
40 banks (or 44%) managed to reduce their cost-income ratios in 2014. these reductions were greater than five percentage points for 21 banks (23% of our sample) and fell continuously in each of the last three years for 11 banks (mostly banks in turnaround completed).
Banks in turnaround completed achieved the strongest fall in cost-income ratio (-12 percentage points since 2011) while increasing their headcount by 15.9%. this was achieved through scale (+31.4% in median AuM per bank since 2011) and improved productivity, resulting in higher revenue per Fte (+14.6%) and lower costs per AuM (-22.9%).
ticino-based banks have generally lower cost-income ratios due to their higher net revenue margins. operating expenses of chF7,762 to manage chF1 million in AuM are comparable to other regions despite lower personnel expenses per employee (chF181,600) which offset the higher number of employees per AuM (31.9 Ftes per billion chF of AuM).
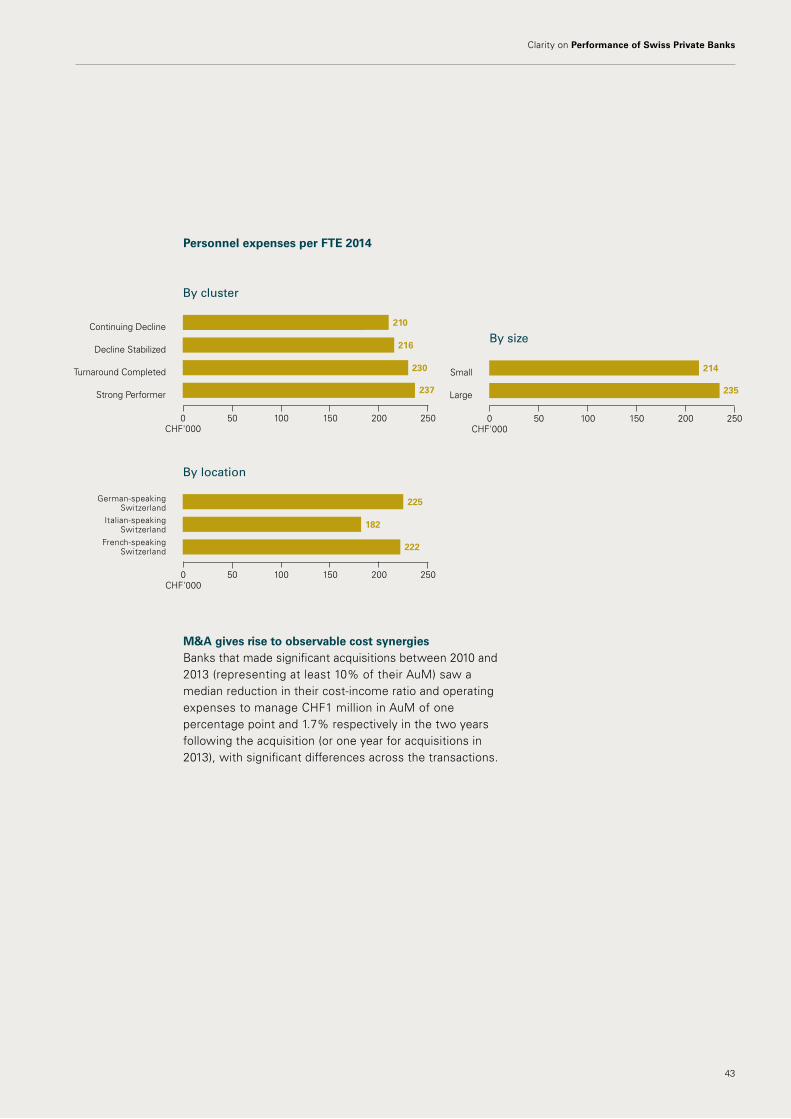
Greater efficiencies at Strong Performers When considering the lower net revenue margin earned by Strong performers, the difference in cost-income ratio between them and other clusters is striking. the apparently more efficient operational set-up and greater economies of scale of Strong performers seem to explain their substantially lower number of employees per AuM (14.9 Ftes per billion chF of AuM vs around 26 Ftes in the other clusters). personnel costs per employee, however, are 13.1% higher than at banks in continuing decline, which suggests that Strong performers have been able to attract staff that are more productive but also more expensive. Nevertheless, operating costs to serve AuM of chF1 million were chF5,444 at Strong performers – this was approximately 50% higher in other clusters.
Strong performer
0.0%
turnaround completed
decline Stabilized
continuing decline
By cluster
20.0% 40.0% 60.0% 80.0% 100.0%
95.4%
77.9%
78.9%
67.1%
By size
90.0%80.0%70.0%60.0%50.0%40.0%30.0%20.0%10.0%0.0%
large
Small 83.0%
78.2%
By location
85.0%
72.3%
79.7%
90.0%80.0%70.0%60.0%50.0%40.0%30.0%20.0%10.0%0.0%
French-speakingSwitzerland
italian-speakingSwitzerland
German-speaking Switzerland
Cost-income ratio 2014
40
C h a p t e r I I I · A n A lys i s o f p e r f o r m A n c e A n d t r e n d s
Total operating costs per CHF1 million in AuM 2007 to 2014
2007 2008 2009 2010 2011 2012 2013 2014
10,000
9,000
8,000
7,000
6,000
5,000
4,000
3,000
2,000
1,000
0
chF
6,7447,127
7,829 7,8538,555
8,146 8,0177,766
other operating expenses per chF1 million in gross AuM
personnel expenses per chF1 million in gross AuM
4,396 4,704 5,219 5,172 5,675 5,417 5,118 5,024
2,348 2,423 2,610 2,681 2,880 2,729 2,899 2,742
Strong performer
0chF
0chF
turnaround completed
decline Stabilized
continuing decline
By cluster
By size8,556
7,983
8,189
5,444
By location
7.952
7.762
7.661
large
Small 8,288
6,014
1,00
0.0
1,00
0.0
2,00
0.0
2,00
0.0
3,00
0.0
3,00
0.0
4,00
0.0
4,00
0.0
5,00
0.0
5,00
0.0
6,00
0.0
6,00
0.0
7,00
0.0
7,00
0.0
8,00
0.0
8,00
0.0
9,00
0.0
9,00
0.0
0chF
1,00
0.0
2,00
0.0
3,00
0.0
4,00
0.0
5,00
0.0
6,00
0.0
7,00
0.0
8,00
0.0
9,00
0.0
French-speakingSwitzerland
italian-speakingSwitzerland
German-speaking Switzerland
Total operating costs per CHF1 million in AuM 2014
41
Clarity on Performance of Swiss Private Banks
number of FTEs to serve CHF1 billion in AuM 2007 to 2014
2007 2008 2009 2010 2011 2012 2013 2014
60.0
50.0
40.0
30.0
20.0
10.0
0.0
Ftes
Median
25th percentile
75th percentile
19.222.0
24.2 24.326.9
24.9 24.3 23.1
Strong performer
0.0Ftes
turnaround completed
decline Stabilized
continuing decline
By cluster
By size
25.020.015.010.05.0 30.0
26.3
26.7
25.4
14.9
By location
22.4
31.9
22.7
large
Small 26.1
17.4
0.0Ftes
25.020.015.010.05.0 30.0
0.0Ftes
25.020.015.010.05.0 30.0 35.0
French-speakingSwitzerland
italian-speakingSwitzerland
German-speaking Switzerland
number of FTEs to serve CHF1 billion in AuM 2014
42
C h a p t e r I I I · A n A lys i s o f p e r f o r m A n c e A n d t r e n d s
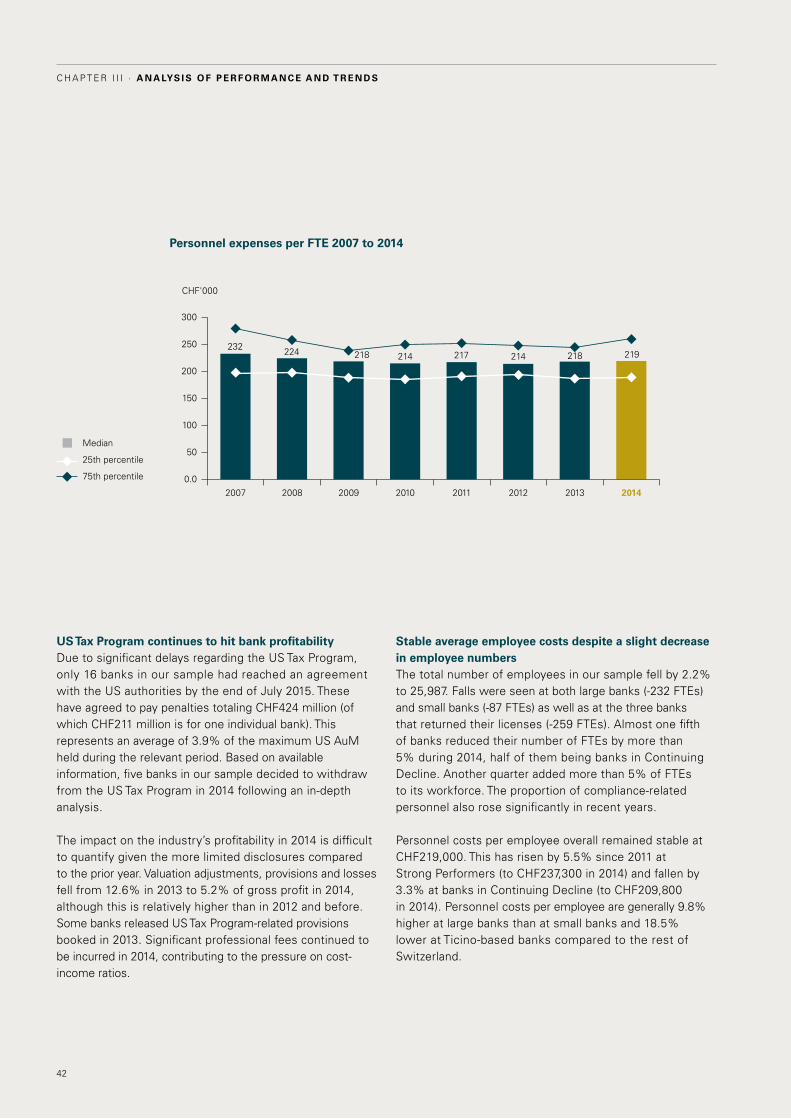
uS Tax Program continues to hit bank profitabilitydue to significant delays regarding the US tax program, only 16 banks in our sample had reached an agreement with the US authorities by the end of July 2015. these have agreed to pay penalties totaling chF424 million (of which chF211 million is for one individual bank). this represents an average of 3.9% of the maximum US AuM held during the relevant period. Based on available information, five banks in our sample decided to withdraw from the US tax program in 2014 following an in-depth analysis.
the impact on the industry’s profitability in 2014 is difficult to quantify given the more limited disclosures compared to the prior year. Valuation adjustments, provisions and losses fell from 12.6% in 2013 to 5.2% of gross profit in 2014, although this is relatively higher than in 2012 and before. Some banks released US tax program-related provisions booked in 2013. Significant professional fees continued to be incurred in 2014, contributing to the pressure on cost-income ratios.
Stable average employee costs despite a slight decrease in employee numbersthe total number of employees in our sample fell by 2.2% to 25,987. Falls were seen at both large banks (-232 Ftes) and small banks (-87 Ftes) as well as at the three banks that returned their licenses (-259 Ftes). Almost one fifth of banks reduced their number of Ftes by more than 5% during 2014, half of them being banks in continuing decline. Another quarter added more than 5% of Ftes to its workforce. the proportion of compliance-related personnel also rose significantly in recent years.
personnel costs per employee overall remained stable at chF219,000. this has risen by 5.5% since 2011 at Strong performers (to chF237,300 in 2014) and fallen by 3.3% at banks in continuing decline (to chF209,800 in 2014). personnel costs per employee are generally 9.8% higher at large banks than at small banks and 18.5% lower at ticino-based banks compared to the rest of Switzerland.
Personnel expenses per FTE 2007 to 2014
chF'000
2007 2008 2009 2010 2011 2012 2013 2014
300
250
200
150
100
50
0.0
232 224 218 214 217 214 218 219
Median
25th percentile
75th percentile
43
Clarity on Performance of Swiss Private Banks
Strong performer
0chF'000
turnaround completed
decline Stabilized
continuing decline
By cluster
50 100 150 200 250
210
216
230
237
By size
large
Small 214
235
0chF'000
50 100 150 200 250
By location
225
182
222
0chF'000
50 100 150 200 250
French-speakingSwitzerland
italian-speakingSwitzerland
German-speaking Switzerland
M&A gives rise to observable cost synergies Banks that made significant acquisitions between 2010 and 2013 (representing at least 10% of their AuM) saw a median reduction in their cost-income ratio and operating expenses to manage chF1 million in AuM of one percentage point and 1.7% respectively in the two years following the acquisition (or one year for acquisitions in 2013), with significant differences across the transactions.
Personnel expenses per FTE 2014
Balance sheet and regulatory capital
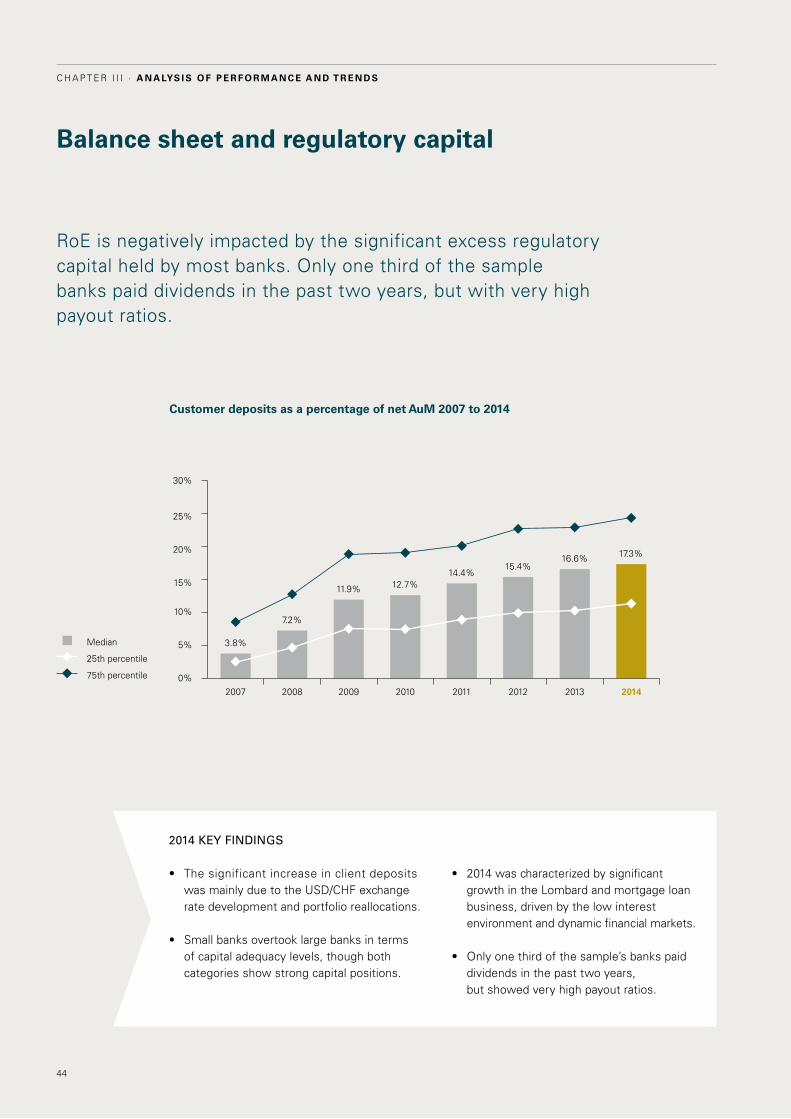
roe is negatively impacted by the significant excess regulatory capital held by most banks. only one third of the sample banks paid dividends in the past two years, but with very high payout ratios.
Customer deposits as a percentage of net AuM 2007 to 2014
Median
25th percentile
75th percentile
2007 2008 2009 2010 2011 2012 2013 20140%
5%
10%
15%
20%
25%
30%
3.8%
7.2%
11.9% 12.7%14.4%
15.4%16.6% 17.3%
• 2014wascharacterizedbysignificant growth in the lombard and mortgage loan business, driven by the low interest environment and dynamic financial markets.
• Onlyonethirdofthesample’sbankspaiddividends in the past two years, but showed very high payout ratios.
• Thesignificantincreaseinclientdeposits was mainly due to the USd/chF exchange rate development and portfolio reallocations.
• Smallbanksovertooklargebanksinterms of capital adequacy levels, though both categories show strong capital positions.
2014 kEy FINDINgS
44
C h a p t e r I I I · A n A lys i s o f p e r f o r m A n c e A n d t r e n d s
increasing customer deposits driven by uSD/CHF exchange rateAmounts due to customers (presented in chF) increased in 2014 largely due to the USd/chF exchange rate development and increased customer deposits in eUr as a result of portfolio reallocations. deposits have grown relative to net AuM since 2007 from 3.8% to 17.3% in 2014, indicating that customers still have a strong risk awareness. the high cash proportion reduces banks' ability to achieve revenues.
2011 2012 2013 20140%
5%
10%
15%
20%
25%
30%
35%
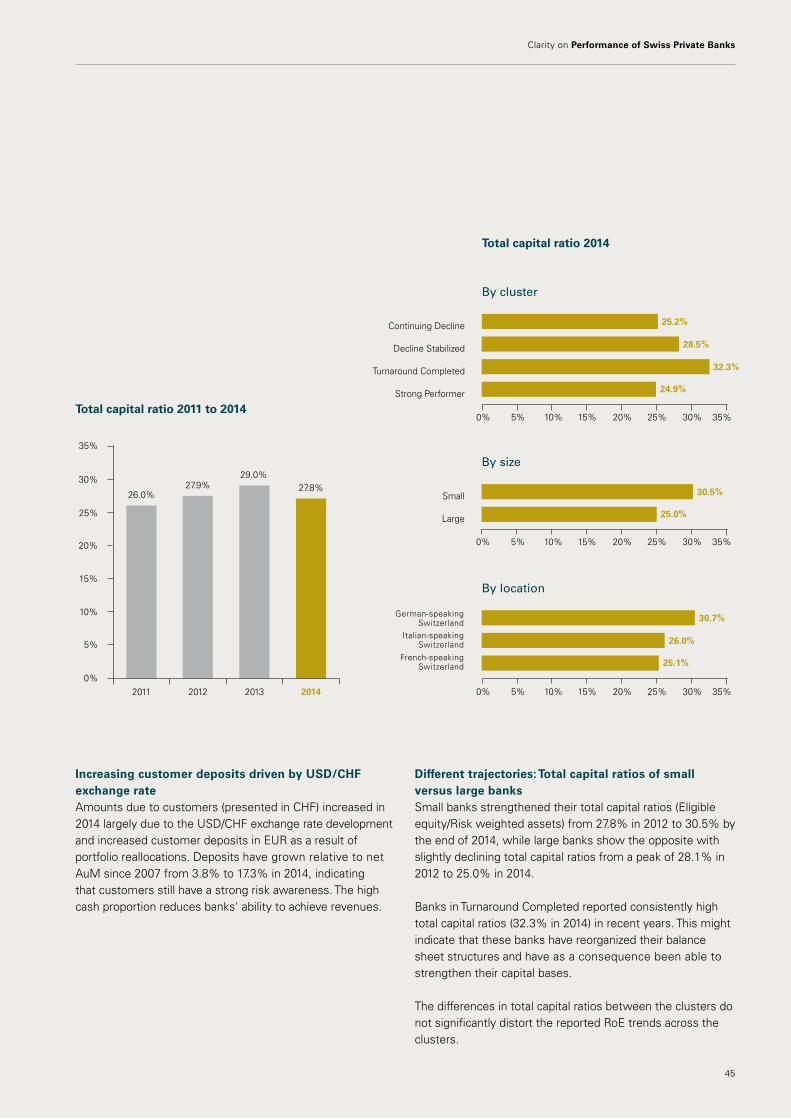
26.0%27.9%
29.0%27.8%
Different trajectories: Total capital ratios of small versus large banksSmall banks strengthened their total capital ratios (eligible equity/risk weighted assets) from 27.8% in 2012 to 30.5% by the end of 2014, while large banks show the opposite with slightly declining total capital ratios from a peak of 28.1% in 2012 to 25.0% in 2014.
Banks in turnaround completed reported consistently high total capital ratios (32.3% in 2014) in recent years. this might indicate that these banks have reorganized their balance sheet structures and have as a consequence been able to strengthen their capital bases.
the differences in total capital ratios between the clusters do not significantly distort the reported roe trends across the clusters.
Strong performer
turnaround completed
decline Stabilized
continuing decline
By cluster
25.2%
28.5%
32.3%
24.9%
0% 35%5% 10% 15% 20% 25% 30%Total capital ratio 2011 to 2014
By size
large
Small 30.5%
25.0%
0% 35%5% 10% 15% 20% 25% 30%
By location
30.7%
26.0%
25.1%
0% 35%5% 10% 15% 20% 25% 30%
French-speakingSwitzerland
italian-speakingSwitzerland
German-speaking Switzerland
45
Clarity on Performance of Swiss Private Banks
Total capital ratio 2014
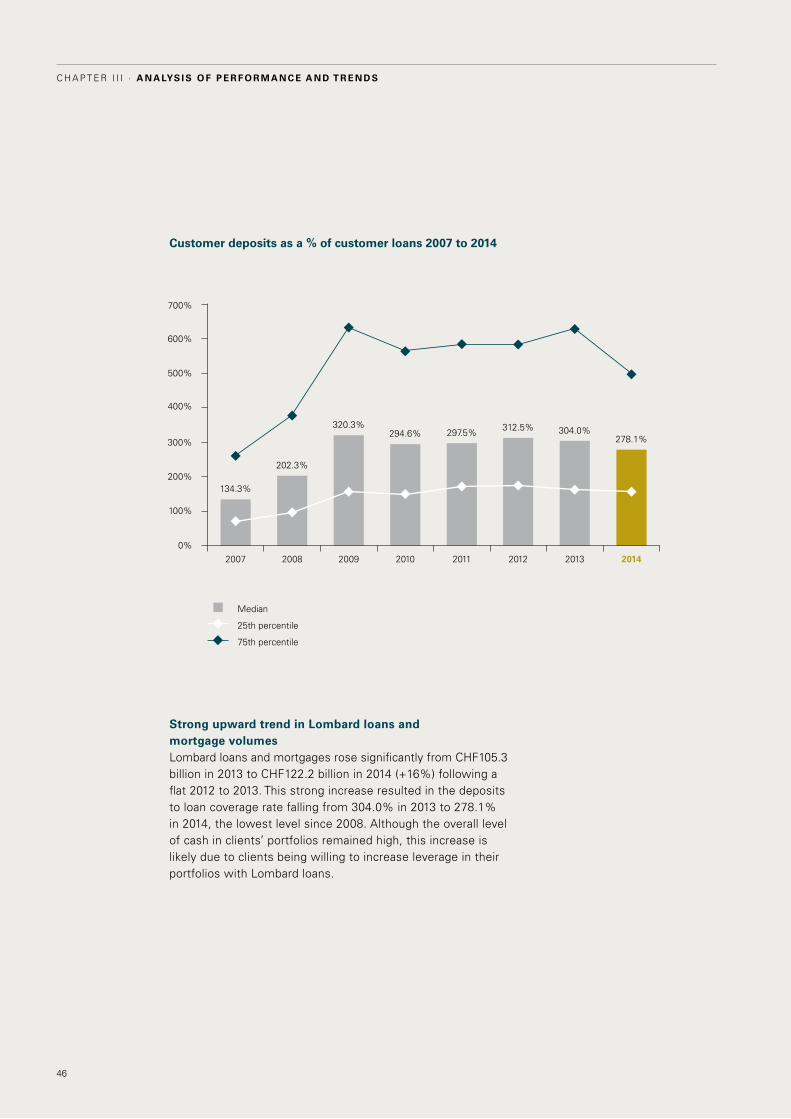
Customer deposits as a % of customer loans 2007 to 2014
Median
25th percentile
75th percentile
2007 2008 2009 2010 2011 2012 2013 2014
200%
400%
600%
0%
700%
100%
300%
500%
134.3%
202.3%
320.3%294.6% 297.5% 312.5% 304.0%
278.1%
46
C h a p t e r I I I · A n A lys i s o f p e r f o r m A n c e A n d t r e n d s
Strong upward trend in lombard loans and mortgage volumeslombard loans and mortgages rose significantly from chF105.3 billion in 2013 to chF122.2 billion in 2014 (+16%) following a flat 2012 to 2013. this strong increase resulted in the deposits to loan coverage rate falling from 304.0% in 2013 to 278.1% in 2014, the lowest level since 2008. Although the overall level of cash in clients’ portfolios remained high, this increase is likely due to clients being willing to increase leverage in their portfolios with lombard loans.
Normalized roe
reported roe
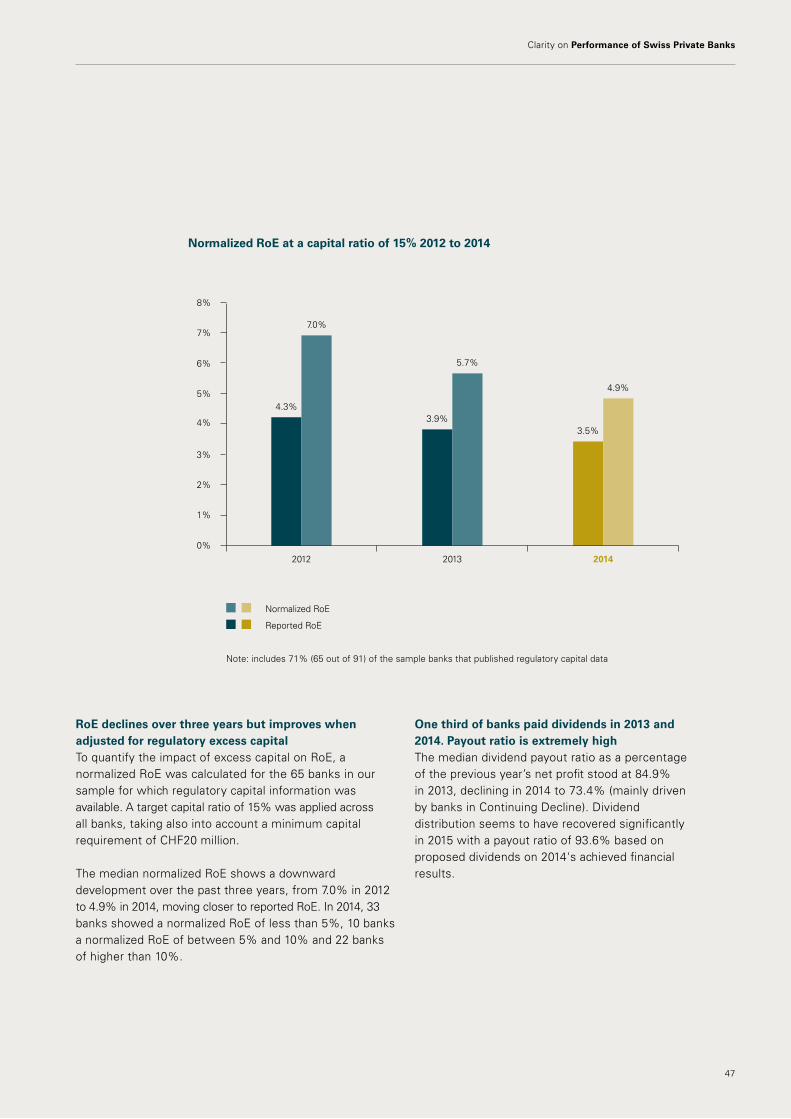
normalized RoE at a capital ratio of 15% 2012 to 2014
4.3%
7.0%
3.9%
5.7%
3.5%
4.9%
2012 2013 2014
2%
4%
6%
0%
8%
1%
3%
5%
7%
RoE declines over three years but improves when adjusted for regulatory excess capitalto quantify the impact of excess capital on roe, a normalized roe was calculated for the 65 banks in our sample for which regulatory capital information was available. A target capital ratio of 15% was applied across all banks, taking also into account a minimum capital requirement of chF20 million.
the median normalized roe shows a downward development over the past three years, from 7.0% in 2012 to 4.9% in 2014, moving closer to reported roe. in 2014, 33 banks showed a normalized roe of less than 5%, 10 banks a normalized roe of between 5% and 10% and 22 banks of higher than 10%.
One third of banks paid dividends in 2013 and 2014. Payout ratio is extremely highthe median dividend payout ratio as a percentage of the previous year’s net profit stood at 84.9% in 2013, declining in 2014 to 73.4% (mainly driven by banks in continuing decline). dividend distribution seems to have recovered significantly in 2015 with a payout ratio of 93.6% based on proposed dividends on 2014's achieved financial results.
47
Clarity on Performance of Swiss Private Banks
Note: includes 71% (65 out of 91) of the sample banks that published regulatory capital data
48
C h a p t e r I I I · A n A lys i s o f p e r f o r m A n c e A n d t r e n d s
Methodology and basis
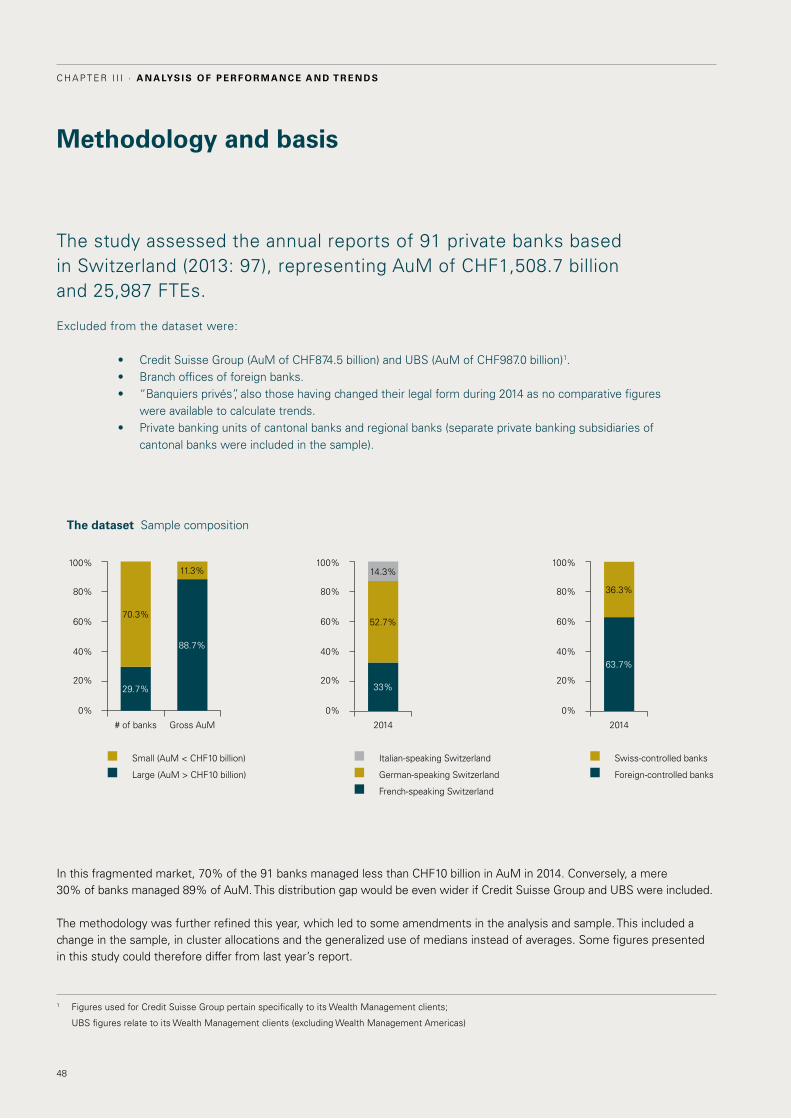
the study assessed the annual reports of 91 private banks based in Switzerland (2013: 97), representing AuM of chF1,508.7 billion and 25,987 Ftes.
excluded from the dataset were:
• CreditSuisseGroup(AuMofCHF874.5billion)andUBS(AuMofCHF987.0billion)1. • Branchofficesofforeignbanks.• “Banquiersprivés”,alsothosehavingchangedtheirlegalformduring2014asnocomparativefigures
were available to calculate trends.• Privatebankingunitsofcantonalbanksandregionalbanks(separateprivatebankingsubsidiariesof
cantonal banks were included in the sample).
in this fragmented market, 70% of the 91 banks managed less than chF10 billion in AuM in 2014. conversely, a mere 30% of banks managed 89% of AuM. this distribution gap would be even wider if credit Suisse Group and UBS were included.
the methodology was further refined this year, which led to some amendments in the analysis and sample. this included a change in the sample, in cluster allocations and the generalized use of medians instead of averages. Some figures presented in this study could therefore differ from last year’s report.
The dataset Sample composition
# of banks Gross AuM
40%
80%
0%
20%
60%
100%
70.3%
29.7%
88.7%
11.3%
Small (AuM < chF10 billion)
large (AuM > chF10 billion) German-speaking Switzerland
French-speaking Switzerland
italian-speaking Switzerland Swiss-controlled banks
Foreign-controlled banks
2014
63.7%
36.3%
40%
80%
0%
20%
60%
100%
2014
52.7%
33%
14.3%
40%
80%
0%
20%
60%
100%
1 Figures used for credit Suisse Group pertain specifically to its Wealth Management clients;
UBS figures relate to its Wealth Management clients (excluding Wealth Management Americas)
49
Clarity on Performance of Swiss Private Banks
FX Foreign exchange
M&A Mergers & Acquisitions
NNM Net New Money (excluding
M&A-related inflows and outflows)
roe return on equity
SNB Swiss National Bank
USd US dollars
vs Versus
Ytd Year to date
Aeoi Automatic exchange of information
AuM Assets under Management
bn Billion
bps Basis points
ceo chief executive officer
chF Swiss francs
crM client relationship manager
eUr euros
Fte Full time equivalents
gloSSARy
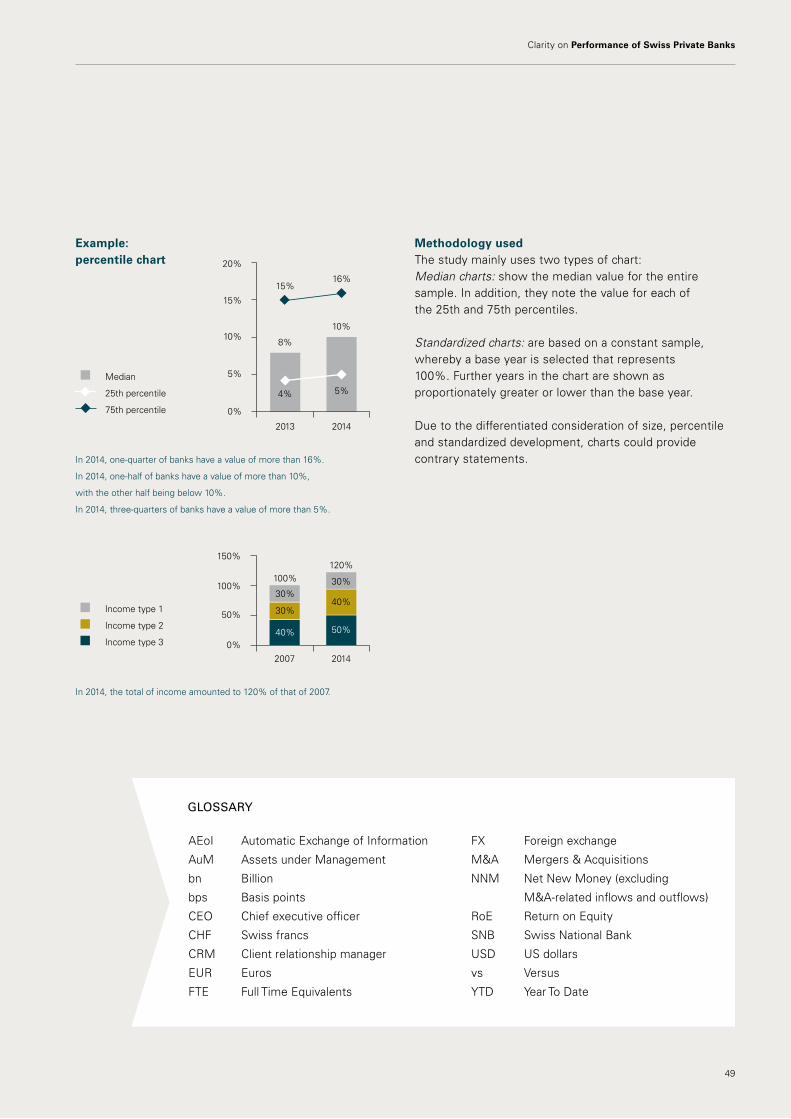
Methodology usedthe study mainly uses two types of chart:Median charts: show the median value for the entire sample. in addition, they note the value for each of the 25th and 75th percentiles.
Standardized charts: are based on a constant sample, whereby a base year is selected that represents 100%. Further years in the chart are shown as proportionately greater or lower than the base year.
due to the differentiated consideration of size, percentile and standardized development, charts could provide contrary statements.
in 2014, the total of income amounted to 120% of that of 2007.
in 2014, one-quarter of banks have a value of more than 16%.
in 2014, one-half of banks have a value of more than 10%,
with the other half being below 10%.
in 2014, three-quarters of banks have a value of more than 5%.
Example: percentile chart
Median
25th percentile
75th percentile
2013
10%
0%
5%
20%
15%
4%
2014
5%
8%
10%
15%16%
2007 2014
100%100%
120%
0%
50%
150%
income type 1
income type 2
income type 3
30%30%
40%30%
40% 50%
The Route to
Tax Transparency
Clarity on
10InterviewStephan Matti, Head Global FIM German-speaking Switzerland, UBS AG, on the regulatory and tax challenges facing asset managers.
14AEoI in SwitzerlandIt is now virtually certain that Switzerland will introduce AEoI with effect from 1 January 2017. What does that mean for the country?
24Disclosure facility in ItalyAs of 2 January 2015, Italy has implemented a time-limited disclosure facility – facts and implications.
April 2015
AEoI in Asset Management
50
p i N B oA r d
Clarity on kpmg.ch/clarity-on
KPMG Appskpmg.ch/apps
KPMG Knowledge App Get instant access to our experts’ knowledge with our KpMG Knowledge App for ipad, iphone and Android phone.
Clarity on publicationsthis series of publications from KpMG Switzerland provides insights, analyses and studies on a range of topics. All publications are available as hard copies as well as online. For more information, please contact [email protected]
latest issues
Clarity on
clarity on Compliance
From departmentto state of mind
Clarity on
08A question of attitudeOrganizing the compliance function: The ABB experience
20The role of complianceHow to seize business opportunities in an increasingly risky world
32Effective compliance trainingChanging employees’ behaviors for the long-term
June 2015
Compliance
clarity on BusinessReporting
Clarity on Juni 2015
Business Reporting16Sicht auf die Zukunft der GeschäftsberichterstattungEin Interview mit Dr. Roland Abt und Daniel Bösiger von Georg Fischer
22Berichterstattung vor der Neuausrichtung? Der Druck zur Veränderung wächstWie sich die Nutzung der Geschäfts-berichterstattung optimieren lässt und wie man Effizienzsteigerung im Reportingprozess erreicht
38Zur Relevanz einer finanziellen Berichterstattung nach IFRSWelche Offenlegungen sind überhaupt von Relevanz für den Bilanzleser?
Bessere Geschäftsberichterstattung
INKLUSIV
GESCHÄFTS-
BERICHTELESEN UND VERSTEHEN
7. Auflage
clarity on Cyber Security clarity on Swiss Taxes
clarity on The Future of Swiss Private Banking
clarity on life insurance matters
clarity on AEoi in AssetManagement
clarity on Mergers & Acquisitions

51
Clarity on Performance of Swiss Private Banksclarity on Performance of Swiss Private Banks
Articles may only be republished by written permission of the publisher and quoting the source “KPMG’s Clarity on Performance of Swiss Private Banks”.the information contained herein is of a general nature and is not intended to address the circumstances of any particular individual or entity. Although we endeavor to provide accurate and timely information, there can be no guarantee that such information is accurate as of the date it is received or that it will continue to be accurate in the future. No one should act on such information without appropriate professional advice after a thorough examination of the particular situation.
the views and opinions expressed herein are those of the interviewees/survey respondents/authors and do not necessarily represent the views and opinions of KpMG AG.
© 2015 KpMG AG is a subsidiary of KpMG holding AG, which is a member of the KpMG network of independent firms affiliated with KpMG international cooperative (“KpMGInternational”),aSwisslegalentity.Allrightsreserved.
c o N tAc t S & i M p r i N t
For further information on Publikation, please contact:
Philipp Rickertpartner, Member of the executive committeehead of Financial Services+41 58 249 42 [email protected] Christian Hintermannpartnerhead of AdvisoryFinancial Services+41 58 249 29 [email protected] Alain ChristeManagerdeal AdvisoryFinancial Services+41 58 249 28 [email protected]
PublisherKpMG AGBadenerstrasse 172postfach 1872ch-8026 Zurich
phone +41 58 249 31 31Fax +41 58 249 44 [email protected]
Authorschristian hintermann, KpMG AGAlain christe, KpMG AGNicola Venzin, KpMG AGMatthias Gallmetzer, KpMG AGGuido rosenast, KpMG AG
prof. dr. dr. tomi laamanen, University of St. Gallen (hSG)
ConceptBettina Neresheimer, head of Marketing Financial Services, KpMG AG
Designdesignport Gmbh, Zurich
PrintGfK, hergiswil
Pictures[cover] luxx images, Getty images[editorial] daniel hager, Zurich[page 4] lynn James, Getty images[page 6-7] Jowena chua, Getty images[page 8-9] Jeff Walzer / eyeem, Getty images[page10-11] ron Watts, Getty images[page 12-13] retrorocket, iStock[page 18] Brasil2, Getty images[page 20] retrorocket, iStock[Backpage] Kristin duvall, Getty images
neutralprinted matter
No. 01-14-569853 – www.myclimate.org© myclimate – The Climate Protection Partnership
PERFORMANCE

52
C h a p t e r I I I · A n A lys i s o f p e r f o r m A n c e A n d t r e n d s
kpmg.ch kpmg.ch