Clarity From Every Angle - Investor...
92
SARIN TECHNOLOGIES LTD Annual Report 2010 Clarity From Every Angle
Transcript of Clarity From Every Angle - Investor...

Sarin TechnologieS lTd annual report 2010
Clarity From Every Angle

Contents
1 Corporate Profile
2 Our Milestones
4 Chairman’s Statement
10 Board of Directors
13 Key Management
15 Management’s Business, Operations & Financial Review
22 Group Structure
23 Corporate Information
24 Financial Highlights
25 Financial Contents

Sari
n T
ech
no
log
ies
Ltd
. | A
nn
ual
Rep
ort
201
0
1
Corporate Profile
Sari
n T
ech
no
log
ies
Ltd
. | A
nn
ual
Rep
ort
201
0
01
Our DiaMensionTM family of products, including the newest version the DiaMensionTM HD (high definition) recently adopted by the GIA, and DiaVisionTM software are used in all leading gemmological institutes for the qualification and grading of a polished diamond’s proportions, in order to derive the Cut grade. In fact, DiaVisionTM is the only proportion and Cut grading software which has been thoroughly evaluated by the GIA in an extensive testing program and has been found to be accurate in excess of 98% of the tested cases.
In 2009, we launched the revolutionary GalaxyTM 1000, followed, in 2010, by the SolarisTM 100 for small stones under 2.5 carats. Both products are based on the same revolutionary and unique technology that allows the automated, accurate and comprehensive assessment of an additional key aspect of the rough diamond – Clarity, so as to optimise the value of the derived polished diamond. There is still no other product or technology available which does what the GalaxyTM and SolarisTM do.
Our products currently provide the diamond industry with technological solutions for five main areas:
(a) Planning the optimal utilisation of the rough stones in order to cut them so as to achieve the maximum yield and value, based on three (Carat weight, Cut quality and Clarity grade) of the four parameters (Colour, Cut, Clarity and Carat) by which a polished diamond’s value is determined, using the GalaxyTM 1000 and SolarisTM 100 inclusion mapping systems, the DiaExpertTM family of platforms (DiaExpertTM, DiaExpert NanoTM, DiaExpert-EyeTM and DiaMarkTM) and the AdvisorTM software;
(b) Cutting and shaping rough stones using our QuazerTM green-laser technology and the StrategistTM setup station;
(c) Optimising the polishing of the rough diamond into the best possible polished diamond by real-time analysis of deviations from and possible corrections to the optimal polishing solution, including unique asymmetrical solutions to optimise weight (Carat) vs. proportion (Cut) tradeoffs using our InstructorTM software;
(d) Measurement of two (Colour and Cut) of the four parameters of the final polished diamond in order to help determine the value of the diamond, based on the quality grades of its colour (using the ColibriTM) and cut (using the DiaMensionTM family of products as noted above); and
(e) Inscribing on polished diamonds with distinct marks like text, numerals and symbols using the DiaScribeTM
system
In December 2010 we acquired the Light Performance Technology (LPT), a system that enables the automatic, independent and accurate measurement of a polished diamond’s appearance:
• brilliance-howmuchlightisreflectedbackthroughits crown;
• fire-howmuchlightisbrokenintocoloredsplashes;• scintillation/sparkle-howpronouncedthediamond
sparkles; and• symmetry-howsymmetricistheplayoflightreturned
from the diamond.
As the demand for ever prettier diamonds is a fundamental trend affecting the industry, light performance parameters are becoming more and more accepted as simple-to-understand consumer-oriented criteria, and we intend to launch products and services related to these during 2011.
Sarin Technologies Ltd. develops, manufactures, markets and sells precision technology products for the processing of diamonds and gems. Our products provide smart solutions for every stage and aspect of diamond design and manufacturing, from determining the optimal yield from a rough stone, through laser cutting of rough stones, measuring and analysing polished diamonds, inscription on polished diamonds to technology that assists sales in jewellery stores and online jewellerywebsites.

Our Milestones
Sari
n T
ech
no
log
ies
Ltd
. | A
nn
ual
Rep
ort
201
0
02
2010Gemological Institute of America (GIA) concludes an in-depth comparison evaluation, between their internal methods to determine the Cut grade of a round brilliant diamond and Sarin’s new implementation of the Facetware® database in Sarin’s measuring systems, which shows highly compatible results between the two methods. In continuation to this achievement GIA also concluded an initial evaluation of the DiaMensionTM HD system and found it generates a high fidelity 3D model with improved precision for the measurement of polished diamonds. They thus commenced the phased upgrading of their existing DiaMensionTM systems to the newer HD product.
Sarin launches the DiaExpertTM Nano 6.5 for the super fast processing (one minute total for modelling, planning and marking!) of small rough diamonds from 0.15 to 0.70 carats in weight. The previously introduced (2007) DiaExpert™ Nano processed smaller stones between 0.01 and 0.30 carats in weight. In response to market demand, Sarin launched an enhanced model, the Nano 6.5, which allows manufacturers to enjoy the proven benefits of the Nano - cost effective, high accuracy and very high productivity - on a much broader range of stones than previously possible.
Sarin launches the Solaris™ 100 inclusion mapping system especially designed for smaller rough diamonds, based on the same technology utilised in the Galaxy™ 1000 system, to offer customers, manufacturers and traders alike, who specialise in smaller sized rough diamonds, the same benefits, with higher resolution (better than VS1), of the GalaxyTM system.
Sarin launches the Strategist™ saw-plane planning system, providing the manufacturers with an accurate computerised planning tool, which utilises the rough stone’s three dimensional structure and the planned locations of the polished stones generated by the Advisor™, along with Galaxy™ or SolarisTM derived inclusion mapping data, to generate a safer and higher yield laser cutting plan. This tool integrates the rough planning, and, specifically, its saw-plane planning process, and the actual Quazer™ sawing process into a computer controlled and coordinated process, to help avoid sawing perils such as cracks, fissures, bubbles, etc.
Sarin acquires Light Performance Technology (LPT), a proven light performance system previously marketed by Overseas Diamonds Technology, to enable the automatic, independent and accurate measurement of a polished diamond’s appearance by assessing its light performance characteristics–brilliance,fire,scintillation/sparkleandsymmetry.
2009Sarin launches the GalaxyTM 1000 and 2000 systems for the automated inclusion (Clarity) charting of rough diamonds, furthering our support of the need for considering inclusions in the planning and production of diamonds (as offered by the DiaMark™ Z Eye, launched in 2007), and opens service centres in India and Israel, in
which the technology is offered for use at a low carat-based fee. Initial system delivered to launch customer towards year’s end.
Sarin launches the Instructor™, a new software package that runs on our polished diamond measuring equipment (DiaMension™, DiaMension™ Lab Edition, DiaMension™ HD and DiaScan™ S+), for improving the yield and assuring the quality that manufacturers can attain while polishing diamonds.
Sarin launches the DiaMensionTM HD, an advanced high precision system, offering even more accurate 3D modelling for the measurement of polished and semi-polished diamonds. The precise 3D model allows users to evaluate not only the diamond’s proportions, but also the stone’s symmetry – including “naturals”, facet misalignments, facet junctures, extra facets, and other fine cut and symmetry parameters.
IDEX Online S.A., a company in which Sarin Technologies has a minority holding (“IDEX”), links with E-bay and GemStar King to launch a B2B2C web portal to sell diamonds and diamond rings directly toconsumers – ebay’s Diamond Ring Designer – http://diamonds.ebay.com. IDEX introduces a new Diamond Retail Benchmark – a retail price index for polished diamonds.
2008Sarin acquires 100% of the issued share capital of Galatea Ltd., which then becomes a wholly-owned subsidiary of the Company. At the time of the acquisition, Galatea was in the final testing stages of an automatic inclusion (Clarity) mapping system for rough diamonds.
Sarin acquires 23% of IDEX Online SA, an operator of a B2B polished diamond traders’ network, a web portal for news, analyses and polished diamond price indices and publisher of a leading trade magazine. Shortly after the acquisition, IDEX Online launches the first ever polished diamond spot market.
2007Sarin introduces DiaMark™-Z Eye for semi-automated inclusion (Clarity) charting of rough diamonds, supporting the need for considering inclusions in the planning and production of diamonds. Additionally, after evaluating the important market niche of small stone manufacturers, DiaExpert™ Nano, a unique product for the planning and marking of small stones, is launched.
2006Sarin introduces Colibri™ and OrchiDia™. Colibri™ is a state-of-the-art colour grading product for polished diamonds. Colibri™ calculates and grades the colour of thediamondaswellasitsfluorescence.
The Group’s subsidiaries, GCI and Romedix, are renamed Sarin Color Technologies Ltd. and Sarin Polishing Technologies Ltd., respectively. New subsidiaries, Sarin Hong Kong Ltd. and SUSNY LLC, are established.
Our Milestones
Sari
n T
ech
no
log
ies
Ltd
. | A
nn
ual
Rep
ort
201
0
03
2005Sarin launches the Quazer™ advanced green-laser system for sawing, cutting and shaping diamonds, establishing a new product line and climbing another rung on the ladder towards being a one-stop shop for the diamond manufacturing industry. We also introduce Facetware™, a software upgrade product for the Company’s DiaMension™, and DiaExpert™ product lines (and installed base), for the analysis of a polished stone’s cut grade based on light performance parameters, in cooperation with the Gemological Institute of America (GIA).
8 APRIL 2005Sarin Technologies Ltd. is listed on the Mainboard of the Singapore Exchange.
2004Sarin Polishing Technologies Ltd. (formerly known as Romedix) purchases from a third party know-how and technology used in the development and manufacture of disposable polishing discs for diamonds and gemstones.
Sarin India is incorporated as a wholly owned subsidiary in India. Sarin India deals in the provision of presale, post-sale and technical support services to our Group’s customers in India, Sri Lanka, and neighbouring countries.
2001Sarin acquires the entire share capital of Gran Computer Industries (subsequently renamed to Sarin Colour Technologies Ltd.), a private company incorporated in Israel. The company develops, manufactures and markets devices for the identification and classification of a diamond’s colour.
2000Sarin introduces the DiaMark™. This product allows the DiaExpert™ product to automatically inscribe, using laser markings on the rough stone’s surface, the optimal sawing plane that was suggested by the DiaExpert™ and accepted by the user.
1996Sarin introduces the use of laser scanning in order to create three-dimensional concave modelling of rough stones. The ability to accurately complement our modelling with the rough stone’s concavities provides the user with a complete and accurate model of the rough stone. This feature is complementary to, and increases the effectiveness of, the DiaExpert™.
1995Sarin develops the DiaExpert™, an automatedcomputerised planning system for the maximumutilisation of rough stones. The introduction of this
new technology in the DiaExpert™ revolutionises thediamond manufacturing industry by introducing computer-based technology to substitute person-based expertise, and thus contributes to the geographic shiftof the diamond industry to new centres of manufacture such as India, PRC and Russia.
1994The Group is renamed Sarin Technologies Ltd.
1992The DiaMension™, a pioneering grading product for assessing the cut (proportion and symmetry) of polished diamonds, is introduced. The product is an automated computerised product for assessing a diamond’s proportion and symmetry, key parameters in the grading of a diamond’s cut. A significant advancement for the diamond industry, the DiaMension™ has changed the way polished diamonds are bought and sold by providing accurate means of measuring the proportion and symmetry, thereby deriving the Cut grade.
1989Our Company changes its name to Sarin Research, Development and Manufacture (1988) Limited.
1988Our first product, the Robogem™, an automated production system for producing polished gemstones from rough gemstones, is launched. Robogem™ was sold in limited numbers to semi-precious gemstone manufacturers in Israel, Europe and the Far East (India and Myanmar).
8 NOVEMBER 1988Our Company is incorporated in Israel as a private company limited by shares under the Companies Ordinance (New Version) 1983 of Israel, under the name of Borimer Limited.

Chairman’s Statement
Sari
n T
ech
no
log
ies
Ltd
. | A
nn
ual
Rep
ort
201
0
04
Dear Fellow Shareholders,
Last year, in my message to you, I wrote that we expect 2010 to be an exciting year. I am very happy to be able to report to you that this past year has, indeed, been not only exciting, as I will elaborate upon below, but a record year, and has demonstrated, that the strategic changes implemented since 2009 have begun bearing fruit.
Significant eventsThere are two very significant events in 2010, which I wish to dwell upon in my message. The first, which will continue to have even more impact on Group revenues beyond FY2010, is the continued rollout and refinement of the GalaxyTM 1000 system and the introduction, in the fourth quarter of the year, of the Solaris™ 100 system. The second is our acquisition, in December, of the Light Performance Technology (LPT).
During FY2010, our focus has been on the continued rollout and refinement of the Galatea-acquired technology. In Q1 we opened our third service centre in Antwerp, Belgium, in addition to our existing service centres in India and Israel. As our actual experience with the system increased, we diligently improved it, adding to its resolution, accuracy (the newly launched SolarisTM 100 system already sees most VVS inclusions), speed, software security and overall performance. We also improved the interface between the output imagery from the inclusion mapping systems and the AdvisorTM planning software for rough stones. Still, the refinement of the GalaxyTM product
will be an ongoing effort, with work laid out for all of 2011 on even further refinement and enhancement of the system’s capabilities, to maintain our technological lead over any future competition, though none meaningful has, as yet, materialised.
We expect to further roll out GalaxyTM service and product offerings during 2011. We are to be shipping systems to the fourth, fifth and sixth service centres in Russia, Namibia and South Africa shortly with the seventh service centre in Botswana to follow as soon as arrangements are finalised. Additional service centres in other diamond trading and manufacturing centres, most likely in the USA and China, will possibly follow later. Sale of the product to customers for use on an in-house basis, against an initial up-front payment and an ongoing usage fee based on actual utilisation (with a minimum monthly commitment), is expected to continue to accelerate throughout 2011. We expect to more than double our installed base by the end of 2011, in comparison to year-end 2010.
The demand for ever prettier diamonds is a fundamental trend affecting the industry, especially in the Far East rapidly expanding markets. Light performance parameters are becoming more and more accepted as simple-to-understand consumer-oriented criteria:• brilliance -howmuchlightisreflectedbackthrough
the diamond’s crown;• fire - how much light is broken into colored splashes;• scintillation / sparkle - how pronounced the diamond
sparkles; and• symmetry - how symmetric is the play of light returned
from the diamond.
Indeed, these parameters truly address how a diamond looks, and less its rarity, as the traditional four C’s primarily do.
It is our intent to leverage the newly acquired LPT in a number of ways, not all of which will be attained in 2011:• Launching a sales tool that will enhance the buying
experience for the consumer by utilising striking visual means designed to view, compare and evaluate the diamonds being considered.
• Generating“appearance”reports toanewstandardthat needs to be developed in cooperation with a strategic partner/s in the industry. These reports willnot replace the traditional 4C reports, but will expand upon them in a manner more readily comprehended by the average consumer.
• Certifying specific proprietary lines of diamondjewelleryofferedbyretailchainsand/orwholesalers/manufacturers, who wish to offer consumers a branded product line. Such a line of diamonds will come with appearance reports that will allow the retailer to

Chairman’s Statement
Sari
n T
ech
no
log
ies
Ltd
. | A
nn
ual
Rep
ort
201
0
05
present to the consumer the unique benefits of the offered jewellery. It will thus allow the manufacturer and/or the wholesaler to be the sole suppliers of aproprietary product.
• Offering manufacturers systems for quality controlin the various manufacturing phases, so that they will know how to finish diamonds for optimal light performance certification. Ultimately, these systems will be fully integrated with our existing line of planning and quality control products for manufacturers (e.g., the AdvisorTM and InstructorTM), to allow, during the initial planning and subsequent polishing stages, to make the proper value tradeoffs, so that light appearance will also be one of the factors taken into consideration before a decision is made as to how to manufacture the diamond.
The introduction of the GalaxyTM 1000/2000andSolarisTM 100 systems for rough diamonds, the development of the inclusion mapping system for polished diamonds (in late 2011 or early 2012), and the launch of the LPT system later in 2011 are important catalysts to future growth because they expand Sarin’s potential markets to the mining and retail segments of the industry, broadening the Group’s revenue base and increasing the recurrent portion of the Group’s revenue stream. We also had other important developments in 2010. First, the Gemological Institute of America (GIA) concluded an in-depth comparison evaluation, between their internal methods to determine the Cut grade of a round brilliant diamond and Sarin’s new implementation of the Facetware® database in our measuring systems, which shows highly compatible (in excess of 98% accuracy) results between the two methods. In continuation to this achievement the GIA also concluded an initial evaluation of the DiaMensionTM HD system and found it generates a high fidelity 3D model with improved precision for the measurement of polished diamonds. They thus commenced the phased upgrading of their existing DiaMensionTM systems to the newer HD product.
Sarin also launched the DiaExpertTM Nano 6.5 for the super fast processing (one minute total for modelling, planning and marking!) of small rough diamonds from 0.15 to 0.70 carats in weight. The previously introduced (2007) DiaExpertTM Nano processed smaller stones between 0.01 and 0.30 carats in weight. In response to market demand, Sarin launched an enhanced model, the Nano 6.5, which allows manufacturers to enjoy the proven benefits of the cost effective Nano – high accuracy and very high productivity – on a much broader range of stones than previously possible.
And, lastly, Sarin launched the StrategistTM saw-plane planning system, providing manufacturers, for the first time ever, with an accurate computerised planning tool. The StrategistTM utilises the rough stone’s three dimensional structure and the planned locations of the polished stones generated by the AdvisorTM, along with GalaxyTM or SolarisTM derived inclusion mapping data, to generate a safer and higher yield laser cutting plan. This tool integrates the rough planning, and, specifically, its saw-plane planning process, and the actual QuazerTM
sawing process into a computer controlled and coordinated process, to help avoid sawing perils such as cracks, fissures, bubbles, etc.
However, as always, not all news is good. We have at this time reached the conclusion, that, though the underlying business proposition is sound, uncertainties related to the execution of IDEX’s business plan have dictated that the Group record a charge erasing in its entirety the balance (US$ 0.3 million) of our investment in IDEX in the financials for FY2010.
Overall, we expect 2011 to be an even more exciting year than 2010. Our main goals are to aggressively deploy our GalaxyTM and SolarisTM systems, with significantly more sales and recurring revenue anticipated than in 2010, while also developing and launching our Light Performance Technology products and services.
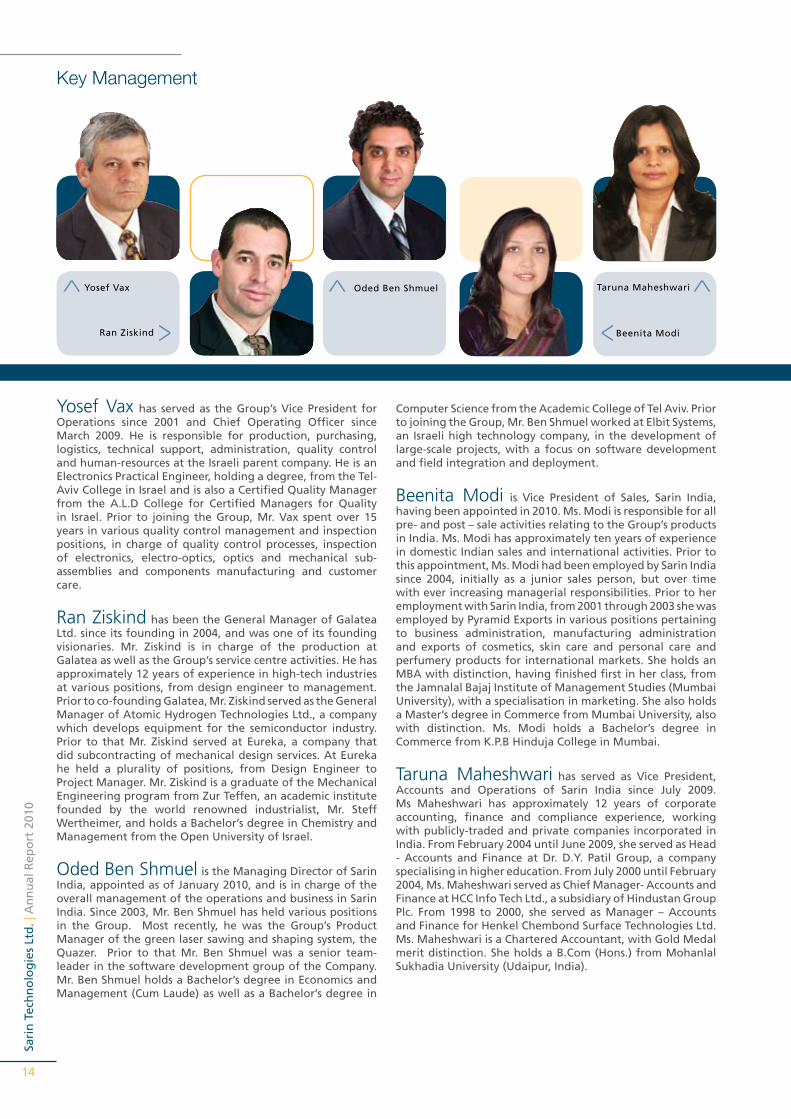
group Performance – Year in reviewFor the year ended December 31, 2010 the Group recorded a dramatic increase of 114% in revenues in comparisonto the year ended December 31, 2009, to US$ 45.7 million from US$ 21.4 million. This is a record sales figure, surpassing our previous record year of 2007,US$ 37.1 million, by US$ 8.6 million, or 23%. These revenues were attained without impairing our historic gross margin levels. Overall, the Group’s net profit for the year ended December 31, 2010 surged by 627% to US$ 11.1 million, from US$ 1.5 million in 2009.
“Our main goals are to aggressively deploy our GalaxyTM and SolarisTM systems, with significantly more sales and recurring revenue anticipated than in 2010, while also developing and launching our Light Performance Technology products and services.”
Sarin’s New LPT D-Light

Sari
n T
ech
no
log
ies
Ltd
. | A
nn
ual
Rep
ort
201
0
6
Chairman’s Statement
Sari
n T
ech
no
log
ies
Ltd
. | A
nn
ual
Rep
ort
201
0
06
These increases are mostly attributed to the significant rebound in demand for all our products, notably in the initial six months of the year, as a result of the diamond industry recovering from the global financial and economic crises in 2008 and 2009. The accelerated spending on capital equipment in the first half of FY2010 reflected, in part, pent up demand. Indeed,the first half of the year saw a dramatic surge in our revenues, by nearly 500%, as the diamond industry and trade continued its recovery, a trend which had already become apparent in the last quarter of FY2009. However, various market uncertainties relating to global economic conditions, the increases in the cost of rough diamonds which were not matched by similar increases in prices of polished diamonds and issues pertaining to the timing, quantity and quality of Zimbabwean rough diamonds to be released into the market, surfaced in Q3 2010. These caused softer business sentiments in the diamond industry, consequently somewhat slowing capital expenditures in the second half of the year. Service centre revenues, per-use fees and the deliveries of half a dozen GalaxyTM 1000 and SolarisTM 100 systems, though the latter product was only launched in October 2010, contributed just over 20% of revenues in the fourth quarter of FY2010. Indeed, the recurring revenue component of our GalaxyTM technology business model, is growing significantly, and already constitutes approximately 10% of our revenues for the year. We expect it to continue to contribute to the growth and stability of our revenue going forward, as the installed base grows. As mentioned, the aggressive deployment of these systems is a key goal for the coming year.
dividendThe Board of Directors has recommended that a final dividend be distributed for FY2010, from retained earnings from this and previous years, totalling US cent 0.75 per ordinary share (approximately US$ 2.0 million in total).
The Board of Directors has recommended to adopt a new dividend policy going forward, whereby a fixed dividend of US cent 1.0 per share will be paid every six months, subject to semi-annual Board approval, the Annual General Meeting’s approval and subject to business conditions, financial results, other pre-empting uses of funds, statutory and tax issues, etc.
looking ahead to 2011We expect the following industry trends to continue influencingourbusiness:
The diamond jewellery business in the United States, still the largest single market, which had overall been demonstrating an ongoing moderate recovery for most of 2010, had a much better than expected holiday sales season, with an average increase of 7-8%, significantly besting the forecasted improvement of 2-3% year over year and making it the best U.S. holiday season in several years. Online sales increases doubled that. On the heels of the better than expected season, many economists are forecasting genuine recovery this year, with growth in the 3-4% range – the best performance in seven years.
The growth in the markets in Asia, China and India in particular, remain strongest, with some data indicating the Asia-Pacific area (ex-Japan) has overtaken the
Americas as the leading region for jewellery and watch retailing. Tiffany, for example, reported a 23% jump in holiday season sales in this region compared with a 9% overall increase in the Americas. In India, domestic diamond jewellery sales have quadrupled over the past four years and are expected to continue growing at a rate in excess of 20% through 2015.
The current overall market conditions, as they became apparent in the second half of the fourth quarter, primarily after the Diwali holiday in India, have resulted in a more optimistic business sentiment, as was manifested in the fourth quarter’s results. In general, the coming year is expected to again be better than the preceding year.
Prices of rough diamonds continue to be a negative factor as the increase in polished diamond prices still lags behind rough diamond price increases. While as the polished diamond prices have shown overall single digit percentage increases from the beginning of 2010, the rough diamond prices have had double digit percentage gains. This factor may be mitigated by the introduction of the Zimbabwe rough diamonds into the market, still not resolved as expanded upon below, as has been noted in previous reports, but at this time remains a major concern.
Issues pertaining to the sales of the Zimbabwe rough diamonds have not been resolved within the framework of the Kimberly Process. We still maintain, in view of the significant potential of the Marange diamond fields, that Zimbabwe may emerge as one of the major sources of rough diamonds over the next few years. Indian diamond manufacturers are hoping to become the major beneficiary of this new rough diamond source, though an initial agreement on the supply of US$ 100 million of rough diamonds on a monthly basis from Zimbabwe to India has been frozen in light of the unresolved Kimberly Process issues. China is also vying for a significant share of this potential supply. Once a final agreement is reached regarding the disposition of diamonds originated in Zimbabwe (under the Kimberly Process), we expect this may help to expand the Indian and China manufacturing bases and drive our sales to these markets higher in the longer term.
As the demand for ever prettier and better diamonds continues to drive the industry, most significantly in the exploding markets in the Far East, the demand for the GalaxyTM and SolarisTM (for small stones) products is growing in all major industry centres, including India, Belgium, Russia and Africa. Deliveries in the fourth quarter of 2010 were as had been anticipated, and brought the overall number of installed systems to just over 20 in service centres and at customer sites. We expect deliveries to continue to accelerate throughout 2011, and hope to more than double our installed base this year, as compared to year-end 2010. Revenues from this technology continue to grow quarter over quarter and are now just over 20% of the Group’s sales (Q4 FY2010).

Sari
n T
ech
no
log
ies
Ltd
. | A
nn
ual
Rep
ort
201
0
7
QuazerTM II: The more sophisticated new green laser engine and the debut of the StrategistTM set-up station, optimally linking between GalaxyTM, AdvisorTM and the QuazerTM II, have underpinned increased orders. We expect sales to increase throughout 2011.
Polished processing products: Sales for the InstructorTM
and DiaMensionTM HD continue, for the moment, to be the main driving force of this product line, especially given the additional impetus from the Gemological Institute of America’s (GIA) adoption of the DiaMensionTM HD as its standard for proportion measuring (Cut). We expect other leading diamond grading labs, as well as industry-leading manufacturers to adopt these products, as well. The enhancement of this product pair with additional functionality, primarily for non-round fancy shapes, is the key goal for 2011. We have also introduced the DiaScribeTM SL lower-cost inscription system for polished diamonds, a currently unmatched price-performance package to diamond manufacturers, traders and retailers, which has met with positive market acceptance.
Light Performance Technology: The acquisition of this technology in late 2010 will entail development work throughout 2011. Development work will be focused on repackaging the product to optimise it for the retail market – cost, size, appearance, user interface, operating system, etc. The development schedule is very aggressive, and it is anticipated that initial sales with modest revenues will be realised this year.
Other issues which may affect the Group’s business in the next 12 months include:
Sales and marketing: Sales and marketing efforts will continue to focus on leveraging the Galatea technology in order to expand our market share in all inter-related product lines and in all markets. This will manifest itself in our aggressive marketing of our rough planning systems, where we have been gaining market share throughout 2010 as well as the new StrategistTM , which we hope, will allow similar leveraging vis-a-vis the QuazerTM II green laser sawing systems. In addition, we hope to launch our LPT-derived products and services to the retail market later in the year.
acknowledgementsTogether with my fellow directors, I would like to again thank our customers, suppliers, business partners and most of all our employees and management team for their ongoing support and dedication to the Group, without which we would not have attained the record performance of this past year. We believe that these valued relationships provide the basis by which we will continue to revolutionise the diamond manufacturing industry and trade both with our products for inclusion mapping, as well as with our other new light performance products for the retail trade, as detailed above.
Yours Truly,
Daniel Benjamin GlinertExecutive Chairman
Chairman’s Statement
Sari
n T
ech
no
log
ies
Ltd
. | A
nn
ual
Rep
ort
201
0
07
In addition, also as the demand for ever prettier diamonds is a fundamental trend affecting the industry, light performance parameters, brilliance, fire, scintillation /sparkle and symmetry, are becoming more and more accepted as simple-to-understand consumer-oriented criteria. Indeed, these parameters truly address how a diamond looks, and less its rarity, as do the traditional four C’s. We believe the acquisition of the Light Performance Technology in late 2010 is a notable development, which we expect may significantly impact our Group’s product mix going forward in the longer term. It is also expected to manifest itself, more modestly, later in 2011. Sarin expects interest in LPT from retailers, anxious to enhance the consumer’s diamond jewellery buying experience, from gem labs, seeking a more readily understandable way of classifying diamonds for the public, and from manufacturers wishing to establish unique product lines with exceptional radiance, beauty and appeal. It is expected that this product line will also add to the Group’s recurring revenues, as various aspects of the technology will be offered as per-use services.
We continue to focus our research and development initiatives on the following projects and expect our research and development expenses to increase moderately over time.
The Galatea products: GalaxyTM and SolarisTM systems deliveries should continue to accelerate throughout 2011. By allowing customers to gain hands-on experience with the GalaxyTM systems in the new service centres in South Africa, Namibia, Botswana and Russia and enjoy the actual benefits of diamond scanning, the Group expects to generate growing demand for its systems from customers in these manufacturing centres. We expect additional service centres, most likely in China and the United States, to possibly open later in the year.
The SolarisTM, launched in early Q4 2010, specifically designed to offer manufacturers of small stones (rough diamonds of less than 2.5 carats), primarily in India and China, an exceptional value, has met with very robust interest. With extremely high resolution down to VVS inclusions and an attractive acquisition and follow-on pricing scheme, the product helps diamond manufacturers achieve significant returns even on smaller-sized rough diamonds that typically yield lower margins. Five systems were already delivered in Q4 2010. We expect a significant portion of our deliveries in 2011 to be of these systems.
Ongoing development efforts will continue into 2011, as we continue to refine and enhance the systems’ functionality from various aspects, including even better resolution, accelerating overall processing speed and increasing the size of stones to be handled.
As the accuracy and automation of clarity grading continues to be of concern, we continue to strive towards a launch of a system for polished stones late in 2011 as well.
Rough planning products: This line of products continues to be our primary contributor to revenue. Our share in this market continues to expand as we benefit from the integration of the planning products with the GalaxyTM and SolarisTM products which enhance the planning process with inclusion mapping data.

Sari
n T
ech
no
log
ies
Ltd
. | A
nn
ual
Rep
ort
201
0
8
c a r a tc u t
c o l o rc l a r i t y
Four characteristics, known informally as the four Cs, are now commonly used as the basic descriptors of diamonds: these are

Sari
n T
ech
no
log
ies
Ltd
. | A
nn
ual
Rep
ort
201
0
9
b r i l l i a n c ef i r e
s p a r k l es y m m e t r y
Comparison of Light Performance of a poor diamond (left) and a perfect diamond (right)
LIGHT PERFORMANCE

Board of Directors
Uzi LevamiExecutive Director
Daniel Benjamin GlinertExecutive Director
Avraham EshedExecutive Director
Sari
n T
ech
no
log
ies
Ltd
. | A
nn
ual
Rep
ort
201
0
10
DANIEL BENJAMIN GLINERTExecutive Director and Chairman of the Board
Daniel Benjamin Glinert is our Executive Director and has been the Chairman of the Board of the Group since 1999. He is also a Director of the Group’s subsidiaries, Sarin India, Sarin Color Technologies, Sarin Polishing Technologies, Sarin Hong Kong and Galatea. Mr. Glinert holds a Bachelor’s degree in Computer Sciences (Cum Laude) from the Technion – Israel Institute of Technology. He has nearly 40 years experience in various high-technology industries (software, military, semiconductor and medical applications) in research, development and management positions in Israel and the USA. From 1972 to 1977, he served in the Israel Air Force and was honourably discharged with the rank of Major.
UZI LEVAMIExecutive Director and CEO
Uzi Levami has been CEO of the Group since February 2009 and an Executive Director since December 2008. He is also a Director of the Group’s subsidiaries, Sarin India, Sarin Color Technologies, Sarin Polishing Technologies, Sarin Hong Kong and Galatea. Mr. Levami completed his studies towards a Master’s degree in Computer Sciences from the Weitzman Institute and holds a Bachelor’s degree in Electrical Engineering, Cum Laude, from the Technion – Israel Institute of Technology. He is one of the original founders of Sarin and has a rich history of founding high-tech companies (Compulite Ltd., Shalev Computer Systems Ltd. and EquipNet Ltd., a start-up spin-
off of Interhightech (1982) Ltd.). Mr. Levami most recently held the position of Director of Business Development at MKS Instruments Inc., a publicly-traded US company supplying in excess of $700M of capital equipment to the semiconductor industry, after the most recent company he founded, EquipNet Ltd., was acquired by MKS. From 1973 to 1980, he was a Major in the Israel Defence Forces and in 1992 was awarded the prestigious Israel Defence Award by President Herzog.
AVRAHAM ESHEDExecutive Director
Avraham Eshed is an Executive Director of the Group. He has over 40 years of experience in the diamond and gemstone industries. Mr. Eshed is the founder of Gemstar Ltd. and Eshed Diam Ltd., and serves as the president of both companies. Mr. Eshed is a founding member of the International Colored Gemstone Association (ICA) where he served as a Director. He is President of the Israel Emerald Cutters Association and a Director in the Israel Diamond Manufacturers Association.

Board of Directors
Ehud HarelNon-Executive Director
Eyal MashiahExecutive Director
Hanoh StarkNon-Executive Director
Sari
n T
ech
no
log
ies
Ltd
. | A
nn
ual
Rep
ort
201
0
11
EYAL MASHIAHExecutive Director
Eyal Mashiah is an Executive Director of the Group and was appointed to the Board in 1994. He was appointed an Executive Director in December 2008. Mr. Mashiah is also a Director of the Group’s subsidiaries, Sarin India, Sarin Color Technologies, Sarin Polishing Technologies, Sarin Hong Kong and Galatea. He has nearly 30 years of experience in the diamond and gemstone industries. Mr. Mashiah is currently the Executive Director of Novel Collection Limited (formerly Biram Diamonds Limited), a leading fancy coloured diamond manufacturer and dealer. Prior to that, he was involved in the manufacturing, marketing and trading of precious gemstones at Icam-Gems Limited (1982 - 1983), at Algem Limited (1983 - 1987) and at Ramgem Limited (1987 - 2006).
EHUD HARELNon-Executive Director
Ehud Harel is a Non-Executive Director of the Group and was appointed to the Board in 2004. He has nearly 30 years experience in the gemstone industry, having dealt with the evaluation and purchase of rough stones as well as the wholesale and worldwide distribution of polished gemstones, since 1982. From 1979 to 1982, he was a mechanical engineer with the Israeli Navy.
HANOH STARKNon-Executive Director
Hanoh Stark was an Executive Director of the Group until January 2009, and has been on our Board since 1989. He studied Electrical Engineering at the Technion in Milan, Italy. Mr. Stark is a member of the Israeli Diamond & Colored Stone Bourse and also a member of ICA, the International Colored Gemstone Association. He has over 40 years of experience in the gemstone mining, manufacturing and trading industries, including in the development of technology-based aids and systems.

Sari
n T
ech
no
log
ies
Ltd
. | A
nn
ual
Rep
ort
201
0
12
Chan Kam LoonIndependent Director
Yehezkel Pinhas BlumIndependent Director
Valerie Ong Choo LinIndependent Director
Board of Directors
YEHEZKEL PINHAS BLUMIndependent Director
Yehezkel Pinhas Blum is an Independent Director of the Group and was appointed to the Board in March 2005. He holds a Bachelor’s degree in Economics and Business Administration from the Bar-Ilan University in Ramat Gan, Israel. Mr. Blum is a Member of the Board of the Israel Diamond Exchange in Ramat Gan, Israel. He has over 25 years of diamond and gemstone manufacturing and trading experience. Prior to that, from 1980 to 1983, he was an economist with the United Mizrachi Bank Ltd and was responsible for managing the bank’s economic research unit and advising the bank’s management with regard to new investments and business opportunities.
CHAN KAM LOONIndependent Director
Chan Kam Loon is an Independent Director of the Group and was appointed to the Board in March 2005. He holds a degree in Accountancy from the London School of Economics and is a qualified Chartered Accountant with the Institute of Chartered Accountants in England and Wales. Mr. Chan currently runs his own management and consulting firm, Philip Chan Consulting Pte Ltd. From July 2001 to July 2004, he headed the Listings Function of the Markets Group at the Singapore Exchange. Before that Mr. Chan spent ten years in investment banking and in private equity funding within the ASEAN region. Mr. Chan was a member of the Singapore’s Accounting Standards Committee, Singapore Zhejiang Business Council and also Singapore Shandong Business Council. He is also a Non-Executive Independent Director of several companies listed on the Singapore Exchange.
VALERIE ONG CHOO LINIndependent Director
Valerie Ong Choo Lin is an Independent Director of the Group and was appointed to the Board in March 2005. She graduated with a Bachelor of Law (Honours) from the National University of Singapore in 1987 and obtained a Masters in Law (with Distinction) from the London School of Economics in 1991. Ms. Ong heads the Corporate Finance Practice at Rodyk & Davidson. She has been a practicing lawyer since 1988, specialising in corporate finance (including initial public offerings) and mergers and acquisitions. Ms. Ong is a member of the Singapore Income Tax Board of Review and an Independent Director of Chemical Industries (Far East) Limited (a company listed on the Mainboard of the Singapore Exchange).

Sari
n T
ech
no
log
ies
Ltd
. | A
nn
ual
Rep
ort
201
0
13
Uzi Levami
David Sydney Block
William L. (“Bill”)Kessler
Abraham Meir Kerner
Akiva Caspi
Uzi Levami has been Chief Executive Officer of the Group since February 2009 and an Executive Director since December 2008. He is also a Director of the Group’s subsidiaries, Sarin India, Sarin Color Technologies, Sarin Polishing Technologies, Sarin Hong Kong and Galatea. Mr. Levami completed his studies towards a Master’s degree in Computer Sciences from the Weizmann Institute and holds a Bachelor’s degree in Electrical Engineering, Cum Laude, from the Technion - Israel Institute of Technology. He is one of the original founders of Sarin and has a rich history of founding high-tech companies (Compulite Ltd., Shalev Computer Systems Ltd. and EquipNet Ltd., a start-up spin-off of Interhightech (1982) Ltd.). Mr. Levami most recently held the position of Director of Business Development at MKS Instruments Inc., a publicly-traded US company supplying in excess of $700M of capital equipment to the semiconductor industry, after the most recent company he founded, EquipNet Ltd., was acquired by MKS. From 1973 to 1980, he was a Major in the Israel Defence Forces and in 1992 was awarded the prestigious Israel Defence Award by President Herzog.
David Sydney Block has been the Group’s Deputy CEO and VP Sales since June 2009. Mr. Block is responsible for overseeing the Group’s worldwide sales including the network of distributors and subsidiaries. Prior to this appointment Mr. Block was the Chief Executive Officer of Sarin India from January 2006 in charge of overall management of the operations and business in Sarin India, responsible for 70% of the Group’s revenues and the management of over 100 employees. Before being assigned to Sarin India, Mr. Block was the Group’s Product Manager responsible for all the products aimed at the diamond manufacturing market. Prior to joining the Group, Mr. Block worked at several major Israeli high technology companies in the management of large-scale development projects, computer programming, quality assurance and technical writing positions. Mr. Block holds a Bachelor’s degree in Computer Science from the Tel-Aviv-Jaffa Academic College in Israel.
William L. (“Bill”) Kessler has served as the Group’s Chief Financial Officer since May 2009. He has over 20 years of corporate and Wall Street experience, working with publicly-traded and private companies in Israel and the United States. From July 2006 until May 2009, Mr. Kessler served as the Principal Finance and Accounting Officer (CFO) of XTL Biopharmaceuticals Ltd. (Nasdaq: XTLB; LSE: XTL and TASE: XTL) and was previously its Director of Finance
since January 2006, having served as a financial consultant to XTL during 2005, when he spearheaded the process of listing XTL for trading on the Nasdaq. From October 2003 until December 2005, he served as a financial consultant to Keryx Biopharmaceuticals, Inc. (Nasdaq: KERX), following the relocation of its headquarters to New York, after having served as their Controller in Israel from 2001 until September 2003. From 1996-2000, Mr. Kessler served as Chief Financial Officer for Interhightech (1982) Ltd. While on Wall Street, he worked as a research analyst at Wertheim Schroder & Co., covering media and entertainment companies. Mr. Kessler holds a Bachelor’s degree, Magna Cum Laude, in Economics and Mathematics from Yeshiva University, and a Masters of Business Administration, from Columbia University.
Abraham Meir Kerner has served as the Group’s Vice President of Research and Development since March 2009 and as Chief Technological Officer since 2004. He is primarily responsible for developing our technological base and the development of new products. Mr. Kerner has been with the Group since 1995 and holds a Bachelor’s degree in Electrical Engineering from the Technion - Israel Institute of Technology. Prior to 2004, Mr. Kerner was our R&D manager for nearly a decade. Prior to joining the Group, he accumulated 15 years of engineering experience and was involved for ten of those years in the development of precision motion control systems and accurate measuring machines for diamonds.
Akiva Caspi has served as the Group’s Vice President of Marketing and New Business Development, since March 2009. Mr. Caspi is responsible for overseeing all aspects of marketing, including new product definition, product management and market communications. Prior to this, since January 2006, he was Vice President and Manager of the Manufacturing Market. Mr. Caspi holds a Bachelor’s degree in Electronic Engineering from the Technion – Israel Institute of Technology. Prior to joining Sarin, he served as Director of Research & Development at the Gemological Institute of America (GIA), where he was responsible for integrating the new GIA cut system into optical scanning devices, Director of Marketing at Dialit, an Israeli company that develops, manufactures, and sells automatic polishing equipment, and Director of Technology for the Israel Diamond Institute, where he led the introduction of new technologies, such as optical scanning devices and improved laser technologies, to the diamond cutting industry.
Key Management
Sari
n T
ech
no
log
ies
Ltd
. | A
nn
ual
Rep
ort
201
0
14
Key Management
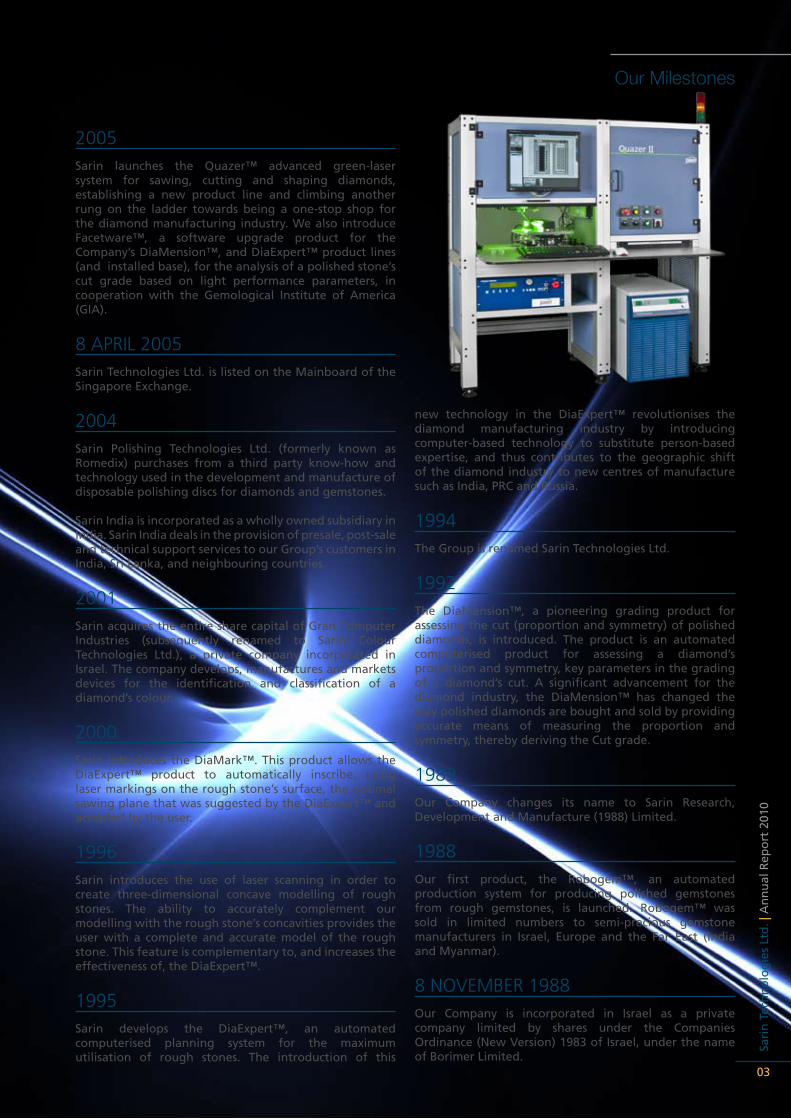
Yosef Vax Oded Ben Shmuel
Ran Ziskind
Taruna Maheshwari
Beenita Modi
Yosef Vax has served as the Group’s Vice President for Operations since 2001 and Chief Operating Officer since March 2009. He is responsible for production, purchasing, logistics, technical support, administration, quality control and human-resources at the Israeli parent company. He is an Electronics Practical Engineer, holding a degree, from the Tel-Aviv College in Israel and is also a Certified Quality Manager from the A.L.D College for Certified Managers for Quality in Israel. Prior to joining the Group, Mr. Vax spent over 15 years in various quality control management and inspection positions, in charge of quality control processes, inspection of electronics, electro-optics, optics and mechanical sub-assemblies and components manufacturing and customer care.
Ran Ziskind has been the General Manager of Galatea Ltd. since its founding in 2004, and was one of its founding visionaries. Mr. Ziskind is in charge of the production at Galatea as well as the Group’s service centre activities. He has approximately 12 years of experience in high-tech industries at various positions, from design engineer to management. Prior to co-founding Galatea, Mr. Ziskind served as the General Manager of Atomic Hydrogen Technologies Ltd., a company which develops equipment for the semiconductor industry. Prior to that Mr. Ziskind served at Eureka, a company that did subcontracting of mechanical design services. At Eureka he held a plurality of positions, from Design Engineer to Project Manager. Mr. Ziskind is a graduate of the Mechanical Engineering program from Zur Teffen, an academic institute founded by the world renowned industrialist, Mr. Steff Wertheimer, and holds a Bachelor’s degree in Chemistry and Management from the Open University of Israel.
Oded Ben Shmuel is the Managing Director of Sarin India, appointed as of January 2010, and is in charge of the overall management of the operations and business in Sarin India. Since 2003, Mr. Ben Shmuel has held various positions in the Group. Most recently, he was the Group’s Product Manager of the green laser sawing and shaping system, the Quazer. Prior to that Mr. Ben Shmuel was a senior team-leader in the software development group of the Company. Mr. Ben Shmuel holds a Bachelor’s degree in Economics and Management (Cum Laude) as well as a Bachelor’s degree in
Computer Science from the Academic College of Tel Aviv. Prior to joining the Group, Mr. Ben Shmuel worked at Elbit Systems, an Israeli high technology company, in the development of large-scale projects, with a focus on software development and field integration and deployment.
Beenita Modi is Vice President of Sales, Sarin India, having been appointed in 2010. Ms. Modi is responsible for all pre- and post – sale activities relating to the Group’s products in India. Ms. Modi has approximately ten years of experience in domestic Indian sales and international activities. Prior to this appointment, Ms. Modi had been employed by Sarin India since 2004, initially as a junior sales person, but over time with ever increasing managerial responsibilities. Prior to her employment with Sarin India, from 2001 through 2003 she was employed by Pyramid Exports in various positions pertaining to business administration, manufacturing administration and exports of cosmetics, skin care and personal care and perfumery products for international markets. She holds an MBA with distinction, having finished first in her class, from the Jamnalal Bajaj Institute of Management Studies (Mumbai University), with a specialisation in marketing. She also holds a Master’s degree in Commerce from Mumbai University, also with distinction. Ms. Modi holds a Bachelor’s degree in Commerce from K.P.B Hinduja College in Mumbai.
Taruna Maheshwari has served as Vice President, Accounts and Operations of Sarin India since July 2009. Ms Maheshwari has approximately 12 years of corporate accounting, finance and compliance experience, working with publicly-traded and private companies incorporated in India. From February 2004 until June 2009, she served as Head - Accounts and Finance at Dr. D.Y. Patil Group, a company specialising in higher education. From July 2000 until February 2004, Ms. Maheshwari served as Chief Manager- Accounts and Finance at HCC Info Tech Ltd., a subsidiary of Hindustan Group Plc. From 1998 to 2000, she served as Manager – Accounts and Finance for Henkel Chembond Surface Technologies Ltd. Ms. Maheshwari is a Chartered Accountant, with Gold Medal merit distinction. She holds a B.Com (Hons.) from Mohanlal Sukhadia University (Udaipur, India).

Sari
n T
ech
no
log
ies
Ltd
. | A
nn
ual
Rep
ort
201
0
15
Management’s Business, Operations & Financial Review
Our Business: Adding Value to Your
DiamondsThe diamond industry
diamonds have long been regarded as symbols of love, commitment and eternity. consistent advertising campaigns by the diamond industry have successfully reinforced these notions among consumers. This retail market drives an industry of mining, processing, certification and trading, on which our group capitalises.
Sari
n T
ech
no
log
ies
Ltd
. | A
nn
ual
Rep
ort
201
0
15
Rough diamonds go through a series of planning, sawing (cutting), shaping (sometimes, if round, referred to as “bruting”), polishing (faceting) and fine-polishing processes to turn them into retail-ready polished diamonds. Traditionally, the rough diamonds were processed into polished ones manually by an elite group of skilled experts, mostly within families. Historically, this led to diamond processing activity being concentrated, after World War II, in Belgium, Israel and the USA.
We believe Sarin has revolutionised the diamond manufacturing industry by introducing computer-based technology to automate many of the processes
of this highly concentrated expertise. This has, in turn, contributed to the migration of the manufacturing to lower-cost centres, primarily India, China and the southern African countries (South Africa and Botswana, primarily). The diamond cutting industry’s turnover was valued at approximately US$16 billion in 2009.
The cost of rough diamonds is extremely high. Hence even single-digit percentage yield increases or cost savings translate into a significant impact on profits. Thus, the global diamond industry has proven eager to invest in yield-increasing or cost-saving technologies that have been proven to be reliable and efficient.

Management’s Business, Operations & Financial Review
Sari
n T
ech
no
log
ies
Ltd
. | A
nn
ual
Rep
ort
201
0
16
Similarly, because of the high value of polished diamonds, adhering to the established standards of quality, as measured by a diamond’s so-called four Cs (Carat, Colour, Clarity and Cut) is important. The results typically obtained from the manual grading inspection of a diamond often vary, depending on the expert conducting the evaluation. Thus, again, technology has evolved as a major contributor to the industry’s grading standardisation.
our Markets
Traditionally, as noted above, the major diamond manufacturing and trading centres in the world have been in Israel and Belgium. Today, India is by far the leading manufacturing centre, accounting for over 90% of all stones manufactured worldwide (by count). China is now the second most important manufacturing centre globally, with plants having been set up by international players, primarily from Belgium, USA and India. The southern African countries are fast emerging as the third major manufacturing centre due to legislation enacted and government incentives to develop the domestic polishing industry in these countries.
Sarin has a market presence in both established and emerging diamond manufacturing centres. A key development for us in 2004 was the establishment of Sarin India, our wholly-owned subsidiary. With operations in the key diamond processing centres of
Mumbai and Surat, we now have full control over the business direction and marketing of our products in the key Indian market. In addition, as of the second quarter of 2009, we inaugurated a service centre in Surat, which provides our customers in India with automated internal inclusion detection and mapping services.
The emerging diamond manufacturing centres of southern Africa represent strategic markets for our products with significant growth potential. Sarin has taken and is taking steps to strengthen its market presence in these emerging markets. The appointment of an agent in South Africa in 2005 and expansion into Botswana in 2008 have bolstered our market share in these key geographies.
Over the next few years, we expect our sales and profits from the retail segment of the trade to grow, as we introduce new offerings to this market segment. The acquisition of our Light Performance Technology (LPT) and consequent launch of LPT products and services will generate fixed and recurring revenues from the retail and certification facets of the trade. Subsequently, we expect our inclusion mapping system for polished diamonds, still under development, to also generate similar recurring revenues by revolutionising the certification of the Clarity parameter, as our proportion measuring systems (DiaMensionTM) did for the Cut.
StrategistTM

Sari
n T
ech
no
log
ies
Ltd
. | A
nn
ual
Rep
ort
201
0
17
Management’s Business, Operations & Financial Review
17
Sarin Products by Use and client Type
USe clienT Sarin ProdUcTS
Assist in evaluating rough diamond value according to the 4 Cs (Carat, Cut, Colour and Clarity)
Wholesaler/Manufacturer
Galaxy TM1000/2000,SolarisTM 100, DiaExpertTM, DiaExpertTM Nano, DiaExpertTM Eye, DiaMobile-XLTM, AdvisorTM
Assist in the production & planning of unpolished diamonds into polished ones
Manufacturer
Galaxy TM 1000, SolarisTM 100 DiaExpertTM, DiaExpertTM Nano, DiaExpertTM Eye, DiaMarkTM Z, AdvisorTM
Assist in cutting unpolished diamonds Manufacturer QuazerTM II, StrategistTM
Assist in shaping unpolished diamonds
Manufacturer QuazerTM II
Assist in optimally polishing the diamondforbestCarat/Cuttradeoffs
Manufacturer DiaMensionTM HD, InstructorTM
Assist in evaluating diamond finishing
ManufacturerDiaMensionTM, DiaMensionTM HD, DiaScanTM S+, DiaVisionTM, InstructorTM
Assist in evaluating polished diamond value according to three of the 4 Cs (all but Clarity)
GemmologicalLaboratory/Wholesaler/Manufacturer
DiaMension, DiaMensionTM HD,DiaScanTM S+, DiaVisionTM, InstructorTM, ColibriTM
Assist in polished diamond customisation such as lettering orgraphics on the diamonds (e.g.,certificate numbers, company logos, personalisation)
Retailer DiaScribeTM
intellectual Property
The products we develop are proprietary in nature. Hence, our ability to remain competitive in the market is dependent, in part, on our ability to protect our proprietary intellectual property (IP) in general, and our software in particular. To facilitate the protection of these proprietary intellectual rights, we have registered several patents and trademarks in countries key to our business worldwide and several additional patent and trademark applications are in various registration phases. As is normal, several of our patents and trademarks have been disputed by other, competing, players in the industry. Subsequently to having been granted patents for our laser marking technology in India in 2008, we have initiated litigation against those of our competitors whom we believe have infringed these important patents.
objectives
The Group’s main objectives for 2011 and beyond are:• ContinuetoleveragetheGalaxyTM 1000 and SolarisTM
100 service and product launches to generate a steadily growing source of recurring income;
• FocustheGroup’sresearchanddevelopmentinitiativeson new projects related to the GalaxyTM technology, new Light Performance products for the retail market and other enhancements to our existing products for rough and polished diamond optimisation (e.g., expansion of our capabilities regarding fancy shape diamonds); and
• Enhance our key competitive advantages, so as tocontinue adding value to our shareholders by growing our business in terms of sales and profit.
Strategy
To realise these objectives, the Group plans to execute these strategies:• Incorporateproductsandservicesinourofferingsthat
will bring solutions to those facets of the industry not currently addressed by our existing offerings, such as the Light Performance products and services to be launched late in 2011;
• Incorporate products and services in our offeringsthat generate recurring income (e.g., the GalaxyTM and SolarisTM products);
• Distribute our business more evenly between therough diamond manufacturing and trading industry, which currently accounts for a predominant part of our business, and the polished diamond grading, trading and retail sales market (e.g., the Light Performance products and services to be launched in 2011); and
• Expandandstrengthenourbusinessinmaturemarketslike India, Europe, and the USA, while developing our business in emerging markets like the southern African countries, China and Russia.

Sari
n T
ech
no
log
ies
Ltd
. | A
nn
ual
Rep
ort
201
0
18
2010 Revenue by Geographic Segment
79% India
5% Africa
4% Europe
2% North America
10% Others
Management’s Business, Operations & Financial Review
Performance indicators
Non-financial IndicatorsWe use the following non-financial indicators to assess our Group’s performance year-on-year and against our competition’s performance:
INDICATOR PERFORMANCE
Estimated market share
We believe, given the synergy with the unique GalaxyTM and SolarisTM products, that we have not only managed to retain a dominating market share of the rough diamond planning and polished diamond grading products in 2010, but have significantly increased our market share in key markets, such as India. The fact that all other players in this industry are privately-held companies hampers our ability to collect and collate accurate sales data. Additionally, no well-known international analysts regularly cover our market for technological tools for the diamond industry, making accurate assessments even harder to substantiate.
Technological leadership
Our technological leadership, as measured by market acceptance of our new and enhanced products, as well as by our existing and newly registered patents worldwide, remains strong. No other company in our field holds a larger market share or broader portfolio of products (including patents and pending patents) for the diamond industry.
Brand strength
Our brand strength allows us to command premium prices for our products in a competitive market. Our brand strength also allows us to use our reputation and distribution channels to market and sell complementary products to our existing customers, as well as seek out new ones. We believe our brand continued to strengthen during the year in review and we intend to continue strengthening our brand throughout 2011.
Product & service offeringDuring the year in review we announced and released several new products and enhancements for existing products which were favourably received in the market and we have plans to continue this strategy throughout 2011 and beyond.

Sari
n T
ech
no
log
ies
Ltd
. | A
nn
ual
Rep
ort
201
0
19
Management’s Business, Operations & Financial Review
Financial indicators
We use the following financial indicators to assess our Group’s performance year-on-year:
indicaTor PerForMance
Revenues
Revenues for FY2010 increased by 114% to a record US$ 45.7 million, as compared toUS$ 21.4 million for FY2009. These increases were mostly attributed to the significant rebound in demand for the Group’s products worldwide as a result of the diamond industry recovering from the global financial and economic crises in the prior year. Accelerated spending on capitalequipmentinthefirsthalfofFY2010reflected, inpart,pentupdemand.GalaxyTM-related sales, including service centres, customer usage fees and deliveries to customers in India contributed just over 20% of revenues in Q4 2010 and just under 15% for all of FY2010. The recurring revenue component of our GalaxyTM technology business model, is growing significantly and constituted just under 10% of our full year revenues in FY2010.
Gross Profit
Gross profit for FY2010 increased by 135% to US$ 29.4 million, as compared to US$ 12.5 million for FY2009. For FY2010, the Group recorded a gross profit margin of 64% as compared to a gross profit margin of 58% for FY2009, due primarily to the significantly higher sales volume in FY2010 as compared to FY2009 and also due to the recurring revenue nature of the GalaxyTM technology business model. FY2010 included non-cash amortisation expenses related to the amortisation of the Galatea know-how and previously capitalised research and development costs of US$ 2.1 million, as compared to US$ 1.5 million in FY2009.
Profit From Operations
Profit from operations for FY2010 increased by 571% to a record US$ 14.4 million, as compared to US$ 2.2 million in FY2009. For FY2010, the Group recorded an operating margin of 32% as compared to an operating margin of 10% for FY2009. This improved profitability inFY 2010 was a direct result of our improved business results and prudent Group fiscal spending policies.
Profit for the YearFor FY2010, the Group reported a record net profit of US$ 11.1 million compared to net profit of US$ 1.5 million for FY2009. For FY2010, the Group recorded a net profit margin of 24% as compared to net profit margin of 7% for FY2009, as detailed above.
operating review
opportunities
Market-driven opportunities
• Thediamond jewellerybusiness in theUnitedStatesdemonstrated an ongoing, albeit moderate, recovery for most of 2010. At year end a much better than expected holiday sales season was realised, with an average increase of 7-8%, making it the best U.S. holiday season in several years. On the heels of the better than expected season, many economists are forecasting genuine recovery this year, with growth in the 3-4% range – the best performance in seven years.
• The growth in the markets in Asia, China and Indiain particular, remain strongest. Tiffany, for example, reported a 23% jump in holiday season sales in this region compared with a 9% overall increase in the Americas. In India, domestic diamond jewellery sales have quadrupled over the past four years and are expected to continue growing at a rate in excess of 20% through 2015.
• In light of the significant potential of the Marangediamond fields, Zimbabwe may emerge as one of the major sources of rough diamonds over the next few years. Indian diamond manufacturers are hoping to become the major beneficiary of this new rough diamond source (though an initial agreement on the supply of US$ 100 million of rough diamonds on
a monthly basis from Zimbabwe to India has been frozen in light of the unresolved Kimberly Process issues). China is also vying for a significant share of this potential supply. We expect this may help to expand the Indian and China manufacturing bases and drive our sales to these markets higher in the longer term.
• ThediamondmanufacturingindustryinIndiahasgonethrough a significant change, with more emphasis being given to production that caters to specific market demand, such as higher quality (higher Clarity and Cut grades) diamonds of medium carat weights for the market in China. Traditionally in the diamond industry, evolution is a slow process. However, since the 2008 - 2009 crises, changes in market demand occur faster and manufacturers must react faster than ever to meet these new demands. As the adoption of technology allows them to make the necessary adaptations to their production profiles more effectively than the alternative of retraining of existing manpower, this market development resulted in increased demand for our rough planning and polishing optimisation products in 2010. We expect this trend to continue into 2011.
• The African markets are emerging as major tradingand manufacturing centres, driven by incentives from and legislation by the relevant governments. We expect this trend to continue and to accelerate (e.g., in Botswana) in 2011 and beyond.

Sari
n T
ech
no
log
ies
Ltd
. | A
nn
ual
Rep
ort
201
0
20
Management’s Business, Operations & Financial Review
company-driven opportunities
• Asthedemandforeverprettierandbetterdiamondscontinues to drive the industry, most significantly in the rapidly expanding markets in the Far East, the demand for the GalaxyTM and SolarisTM inclusion mapping products is growing. By allowing customers to gain hands-on experience with these systems in the new service centres in South Africa, Namibia, Botswana and Russia and enjoy the actual benefits of diamond scanning, the Group expects to generate growing demand for its systems from customers in these manufacturing centres. We expect deliveries to continue to accelerate throughout 2011, and hope to more than double our installed base this year, as compared to yearend 2010. With the significant expansion of the installed base, we expect our recurring revenue from these products’ to increase sequentially quarter by quarter.
• Inaddition,asthedemandforeverprettierdiamondsis a fundamental trend affecting the industry, light performance parameters, brilliance, fire, scintillation / sparkle and symmetry, are becoming more andmore accepted as simple-to-understand consumer-oriented criteria. We believe the acquisition of the Light Performance Technology in late 2010 is a notable development, which we expect may significantly impact our Group’s product mix going forward in the longer term. Sarin expects interest in LPT from retailers, anxious to enhance the consumer’s diamond jewellery buying experience, from gem labs, seeking a more readily understandable way of classifying diamonds for the public, and from manufacturers wishing to establish unique product lines with exceptional radiance, beauty and appeal. It is expected that this product line will also add to the Group’s recurring revenues, as various aspects of the technology will be offered as per-use services.
• Roughplanningproducts– This line of products has historically been the Group’s primary contributor to revenue, and our share in the market continues to remain dominant. As anticipated, as we benefit from the integration of the planning products with the GalaxyTM and SolarisTM inclusion mapping products, which enhance the planning process with inclusion mapping data, our market share has increased. R&D efforts currently focus on even better integrating these products with the inclusion mapping technology, where applicable, and utilising the latter’s added value to a greater extent to optimise the planning process. We anticipate that this will significantly widen the positive gap between our products and the products of our competitors, primarily in yield optimisation.
• Polishedplanningproducts–TheGemologicalInstituteof America (GIA) has concluded an in-depth comparison evaluation, between their internal methods to determine the Cut grade of a round brilliant diamond and Sarin’s new implementation of the Facetware®
database in Sarin’s measuring systems, which shows highly compatible results between the two methods. In continuation to this achievement GIA also concluded an initial evaluation of the DiaMensionTM HD system and found it generates a high fidelity 3D model with improved precision for the measurement of polished diamonds. They thus commenced the phased upgrading of their existing DiaMensionTM systems to the newer HD product. We anticipate that this will drive adoption of the newer generation products by additional industry players worldwide.
• QuazerTM II – We believe that the QuazerTM II has emerged as a leading green laser sawing and shaping system. It has been demonstrated to offer customers high productivity and low breakage rates, at an extremely attractive pricing compared to other high-end competing systems. The more sophisticated new green laser engine and the debut of the StrategistTM set-up station, optimally linking between inclusion mapping data (GalaxyTM / SolarisTM), planning data (AdvisorTM) and the QuazerTM II, have underpinned increased orders. We expect sales to accelerate throughout 2011.
risk Factors
• Global economic uncertainties still persist and arebeing exacerbated by the civil unrest in Middle Eastern countries, in general, and oil producing ones, in particular.
• Pricesof roughdiamonds continue tobeanegativefactor as the increase in polished diamond prices still lags behind rough diamond price increases. While as the polished diamond prices have shown overall single digit percentage increases from the beginning of 2010, the rough diamond prices have had double digit percentage gains. This factor may be mitigated by the introduction of the Zimbabwe rough diamonds into the market, still not resolved as expanded upon above, but at this time remains a major concern.
• Currency exchange rate fluctuations may have anadverse effect on our business in the following ways: (a) the strengthening of the Indian Rupee against the U.S. Dollar (as was the case in early 2008) may impair our Indian customers’ profitability and purchasing power; and (b) the strengthening of the New Israeli Shekel against the U.S. Dollar (again, as was the case in early 2008 and late 2009) may impact the Group’s profitability, as some of its expenses (mostly on human resources) are paid in this currency.
• Our success and ability to compete are substantiallydependent on our proprietary technology. The steps that we have taken to protect our proprietary rights may not be adequate, and we might not be able to prevent others from using what we regard as our technology. If we have to resort to legal proceedings to enforce our proprietary rights, the proceedings could be costly, and we may not be able to recover our expenses.

Sari
n T
ech
no
log
ies
Ltd
. | A
nn
ual
Rep
ort
201
0
21
Management’s Business, Operations & Financial Review
• We may be subject to claims by others regardinginfringement of their proprietary technology: Litigation over intellectual property rights exists in the industry. In addition to our outstanding legal proceedings, we may in the future be subject to other claims.
• As part of our business plan, we intend to developnew product lines, new products in existing product lines and to expand our marketing and sales efforts in key geographical markets. There is no assurance that such expansion plans will be commercially successful. If we fail to achieve a sufficient level of revenue or if we fail to manage our production costs effectively, we will not be able to recover our costs and our future financial position and performance may be materially and adversely affected.
• The location of the Company in Israel, and theconcentration of its research and development and manufacturing activities there, remains a geopolitical risk factor.
Financial review
cash Flow
As at December 31, 2010, cash and cash equivalents and investments increased to US$ 28.3 million from theUS$ 20.9 million reported as of December 31, 2009, following the Group’s record profitability and following the payment of a US$ 2.1 million final dividend in May 2010 for the fiscal year 2009 and the payment of theUS$ 3.3 million interim dividend in September 2010.
cash Management and liquidity
Throughout 2010 the Company maintained cash reserves higher than needed for the financing of ongoing operating activities. The policy dictated by the Board
for the management of these cash surpluses is to invest them in low-risk short-term working currencies (primarily US Dollars, but also New Israeli Shekels and Indian Rupees) denominated interest-bearing instruments with high liquidity. Financial instruments held are classified as current assets. When the cash and cash-equivalent balances are analysed and compared to the annual cash requirements needed for the financing of the ongoing business activities of the Company, one finds that the Company has strong liquidity.
accounting Policies
The consolidated financial statements are prepared in accordance with the International Financial Reporting Standards – IFRS, as revised from time to time. The preparation of financial statements, in conformity with the IFRS, requires management to make judgments, estimates and assumptions that affect the application of policies and reported amounts of assets and liabilities, income and expenses. The financial statements are presented in United States Dollars, which is the Group’s functional currency, rounded to the nearest thousand. The accounting policies set out in our yearly financial reports have been applied consistently to all periods presented in these consolidated financial statements and have been applied consistently to all Group entities.
For more detailed information on our accounting policies and related explanations, please refer to our Consolidated Financial Statements.
Shareholder return
Sarin is a profitable company. During FY2010 the Company earned US$ 11.1 million, equivalent to basic earnings per share of US cents 4.19 and fully diluted earnings per share of US cents 4.12.
Through FY2010, the Group’s dividend policy provides for the distribution of at least 38% of its net earnings as a dividend to its shareholders. For 2010 the Company paid in September 2010 an interim dividend of US cent 1.25 per share, around US$ 3.3 million, and will pay (subject to approval at the Annual General Meeting in April 2011) a final dividend totalling US cent 0.75 per share, around US$ 2.0 million in total.
The Board of Directors has recommended to adopt a new dividend policy going forward, whereby a fixed dividend of US cent 1.0 per share will be paid every six months, subject to semi-annual Board approval, the General Meeting’s approval at year’s end and subject to business conditions, financial results, other pre-empting uses of funds, statutory and tax issues, etc.

Sari
n T
ech
no
log
ies
Ltd
. | A
nn
ual
Rep
ort
201
0
22
Group Structure
galatea limited1
Sarin Technologies india Private limited2
Sarin color Technologies limited3
Sarin Polishing Technologies limited4
SUSnY llc5
Sarin hong Kong limited6
ideX online Sa7
100%
100%
100%
100%
100%
100%
23%
Sari
n T
ech
no
log
ies
Ltd
. | A
nn
ual
Rep
ort
201
0
22
1 Galatea Limited – The developer of a patented and patent-pending technology, applicable to the fully automated detecting and
mapping of internal inclusions in rough and polished diamonds.
2 Sarin Technologies India Private Limited – The provision of pre- and post-sales and technical support for our Group’s products
in India and Sri Lanka and such other territories as may be agreed by our Company and Sarin India from time to time. The operation
of the service centre in India providing customers with inclusion detection and mapping and optimal planning services for rough
diamonds.
3 Sarin Color Technologies Limited – The development, manufacture and marketing of instruments for assessing the colour of
rough and polished diamonds. The development, manufacture and marketing of instruments for assessing the light performance of
polished diamonds.
4 Sarin Polishing Technologies Limited – The development of disposable polishing discs for diamonds.
5 SUSNY LLC – An entity which acts as the Group’s representative in NY State, USA.
6 Sarin Hong Kong Limited – A holding company in Asia.
7 IDEX Online SA – A publisher of a leading trade magazine, an operator of a web portal for news, analyses and polished diamond
price indexes, the operator of the first ever polished diamond online spot market, a business-to-business (B2B) polished diamond
trading e-commerce platform, as well as a business-to-consumer (B2C) polished diamond web site with a link to e-Bay.
The following chart accurately depicts the Group’s structure at the time of this report.

Corporate Information
Sari
n T
ech
no
log
ies
Ltd
. | A
nn
ual
Rep
ort
201
0
23
Board oF direcTorSDaniel Benjamin Glinert, Executive Director and Chairman of the Board Uzi Levami, Executive Director and Chief Executive Officer
Avraham Eshed, Executive Director
Eyal Mashiah, Executive Director
Ehud Harel, Non-Executive Director
Hanoh Stark, Non-Executive Director
Yehezkel Pinhas Blum, Independent Director
Chan Kam Loon, Independent Director
Valerie Ong Choo Lin, Independent Director
aUdiT coMMiTTeeChan Kam Loon - ChairpersonYehezkel Pinhas BlumValerie Ong Choo Lin
noMinaTing coMMiTTeeValerie Ong Choo Lin - ChairpersonYehezkel Pinhas BlumChan Kam LoonDaniel Benjamin GlinertEyal Mashiah
reMUneraTion coMMiTTeeYehezkel Pinhas Blum - ChairpersonChan Kam LoonValerie Ong Choo LinUzi LevamiEyal Mashiah
coMPanY SecreTarYAmir Jacob Zolty (Adv.)
regiSTered oFFiceSarin Technologies Limited7 Atir Yeda StreetKfar Saba 44643IsraelTel: 972-9-7903500Fax: 972-9-7903501www.sarin.comIsrael Registration Number: 51-133220-7
Share regiSTrarM&C Services Private Limited138 Robinson Road#17-00, The Corporate OfficeSingapore 068906
JoinT aUdiTorSSomekh ChaikinCertified Public Accountants (Isr.)Member firm of KPMG InternationalKPMG Millennium Tower17 Ha’arba’a StreetTel Aviv 64739Israel
Partner-in-charge: Lior Caspi(appointed with effect from 1 January, 2008)
Chaikin, Cohen, Rubin and Co.Certified Public Accountants (Isr.)Kiriat Atidim Building No. 4P.O. Box 58143Tel Aviv 61580Israel
Partner-in-charge: Dan Aviram(appointed with effect from 1 January, 2007)
inTernal aUdiTorDoron Cohen (CPA, CIA)Fahn Kanne Control Managemnt, Ltd.Subsidiary of Fahn Kanne and Co.Certified Public Accountants (Isr.)Member firm of Grant Thornton InternationalLevinstein Tower23 Menachem Begin RoadTel Aviv 66184Israel
PrinciPal BanKerSBank Leumi Le-Israel Limited.Bursa Business BranchPaz Towers5 Shoham StreetRamat Gan 52521Israel
Bank Igud (Union Bank of Israel)Ramat Gan Branch1 Jabotinsky StreetRamat Gan 52520Israel
Sari
n T
ech
no
log
ies
Ltd
. | A
nn
ual
Rep
ort
201
0
24
Financial Highlights
PERFORMANCE AT A GLANCEFinancial Year Ended December 31
(US$’000) FY2006 FY2007 FY2008 FY2009 FY2010
Revenues 31,327 37,123 33,149 21,382 45,663Gross Profit 20,413 24,402 21,130 12,479 29,350Net Profit 8,378 8,010 1,594 1,528 11,111Gross Profit Margin 65.2% 65.7% 63.7% 58.4% 64.3%Net Profit Margin 26.7% 21.6% 4.8% 7.1% 24.3%Cash and Investments (no debt) 23,386 25,270 12,010 20,863 28,270EPS (US cents, fully diluted) 3.20 3.11 0.62 0.58 4.12Annual Dividend (US cents) 1.30 1.65 0.80 0.80 2.00
50,000
40,000
30,000
20,000
10,000
02006 2007 2008 2009 2010
Revenues (US$’000) Gross Profit (US$’000) Net Profit (US$’000)
10,000
8,000
6,000
4,000
2,000
02006 2007 2008 2009 2010
12,000
Gross Profit Margin (%) Net Profit Margin (%) Cash and Investments (US$’000)
25,000
20,000
15,000
10,000
5,000
02006 2007 2008 2009 2010
30,000
25,000
20,000
15,000
10,000
5,000
02006 2007 2008 2009 2010
30,000
50%
40%
30%
20%
10%
02006 2007 2008 2009 2010
60%
70%
25%
20%
15%
10%
5%
02006 2007 2008 2009 2010
30%

26 Corporate Governance Statement
34 Directors’ Report
37 Statement by Directors
38 Auditors’ Report
39 Consolidated Balance Sheets
40 Consolidated Statements of Comprehensive Income
41 Consolidated Statements of Changes in Shareholders’ Equity
42 Consolidated Statements of Cash Flows
43 Notes to the Consolidated Financial Statements
81 Shareholdings Statistics
83 Notice of Annual General Meeting
Proxy Form
Financial Contents

Sari
n T
ech
no
log
ies
Ltd
. | A
nn
ual
Rep
ort
201
0
26
Corporate Governance Statement
Sarin’s shares were listed for trade in the SGX-ST in April 2005. Since Sarin’s listing Sarin has made continuous and diligent efforts to adjust its corporate governance regime (being formerly a private company, incorporated in Israel) to its status as a publicly traded company and to the Singaporean Code of Corporate Governance (initially the 2001 Code of Corporate Governance, and subsequently - the 2005 Code of Corporate Governance - the “Code”). Given the basic resemblance between the corporate laws of Singapore and Israel, the adjustments needed were rather limited in scope.
The Company’s corporate governance practices are described with specifi c reference to the Code.
BOARD OF DIRECTORS
Principle 1: Board’s Conduct of its Affairs
Our Board of Directors is entrusted with the responsibility for the overall management of our Company. The Board’s primary roles are to set the Company’s goals and policies and supervise the performance of the CEO’s duties. Among other things, the Board sets the Company’s goals and approves the Company’s action plans and budget (proposed by the Company’s management), reports to the Annual General Meeting about the state of the Company’s matters and about the Company’s business results, and discusses and resolves any matters which require the Board’s approval under any applicable law (including, without limitation, interested persons’ transactions) and/or under the guidelines set by the Board. In general any material issue concerning Sarin (e.g. material research and development milestones, material market and/or business development issues, potential material transactions issues, etc.) is brought to the attention of the Executive Directors and to the Board in its entirety.
The Board meets regularly and in any event no less frequently than four times every calendar year. The Company’s Articles of Association (the “Articles”) and the Israeli Companies law allow the convening of the Board using conference calls or any other device allowing each Director participating in such meeting to hear all the other Directors participating in such meeting.
The Directors are provided with written and oral guidance with regard to the performance of their duties as directors prior to and following their appointment as directors.
Principle 2: Board Composition and Guidance
As of the date of this report, the Board of Directors comprises nine directors, three of who are independent (two out of the three also qualify as “external directors”, under the Israeli law). The three independent directors joined the Board of Directors in March 2005, prior to the listing of the Company. On 28 April 2008 all of the directors retired from offi ce and were re-appointed by the Company’s Annual General Meeting. On 11 December 2008 Mr. Aharon Shapira retired from his offi ce as a Non-Executive Director and Mr. Uzi Levami was appointed by the Company’s Board of Directors as an Executive Director in his stead. Mr. Levami’s appointment as an Executive Director was subsequently approved by the Company’s Annual General Meeting on 27 April 2009. Mr. Hanoh Stark retired from his position as an Executive Director in January 2009, but maintained his position as a Non-Executive Director. Mr. Avraham Eshed was appointed as an Executive Director in November 2010.
The Nominating Committee reviews the independence of each director annually and applies the Code’s defi nition (as well as the defi nitions of the Israeli law) of what qualifi es as an independent director in its review. Key information about the directors is detailed in the “Board of Directors” section of the annual report.
The directors of the Company in offi ce at the date of this report are:
Executive Non-Executive IndependentMr. Daniel Benjamin GlinertMr. Uzi LevamiMr. Avraham EshedMr. Eyal Mashiah
Mr. Ehud HarelMr. Hanoh Stark
Mr. Yehezkel Pinhas BlumMr. Chan Kam LoonMs. Valerie Ong Choo Lin
There are no permanent alternate directors (alternate directors have been appointed in the past only for specifi c meetings).
The Board draws from a broad spectrum of competencies and disciplines: from the diamond and gemstones industry, the high-tech industry, capital markets, legal, and management.

Sari
n T
ech
no
log
ies
Ltd
. | A
nn
ual
Rep
ort
201
0
27
Corporate Governance Statement
Principle 3: Chairman and Chief Executive Offi cer
The Executive Chairman and the CEO of the Company are separate individuals. They are not related.
According to the resolution of the Board:
“The Company is of the view that a distinctive separation of responsibilities between the Chairman and the CEO will indeed ensure an appropriate balance of power, increased accountability and greater capacity of the Board for independent decision making.
As the most senior executive in the Company, the CEO bears executive responsibility for the Company’s day-to-day business according to the policies set by the Board and subject to the Board’s directives, and works with the Board for strategic planning, business development and generally charting the growth of the Company.
The CEO shall report to the Executive Committee of the Board (comprised of the Executive Directors) on a continuous and frequent basis, and shall fl uently consult with the Executive Committee regarding all matters of substance requiring their update, guidance and/or decision.
The Chairman bears responsibility for the proper functioning of the Board and the Board’s committees (and of the non-executive directors in particular), maintains on-going supervision over the management of the Company and over the fl ow of information from the Company’s management to the Board, and assists in promoting high standards of corporate governance and ensuring compliance with the Company’s guidelines of corporate governance.
The Chairman ensures that Board meetings are held when necessary and sets the Board meetings agenda in consultation with the CEO.
The Chairman ensures effective communication between the Board and the Company’s shareholders.”
Principle 4: Board Membership
According to the Articles, each director shall serve, unless the Annual General Meeting appointing him provides otherwise, until the third Annual General Meeting following the Annual General Meeting at which such director was appointed, or his earlier resignation or removal pursuant to the provisions of the Articles. A director who has completed his term of service or has been removed as aforesaid shall be eligible for re-election. The two directors who qualify as “external directors” may be removed from offi ce only if they no longer qualify to serve as such, and may not serve more than 9 years in the aggregate. All nine directors shall be retiring and shall stand for re-election in the Company’s upcoming Annual General Meeting.
The Nominating Committee comprises fi ve directors, a majority of who, including the Chairman, is independent. As at the date of this Report, the Nominating Committee members are:
Ms. Valerie Ong Choo Lin Mr. Chan Kam LoonMr. Yehezkel Pinhas BlumMr. Daniel Benjamin GlinertMr. Eyal Mashiah
(Chairperson and Independent Director) (Independent Director)(Independent Director)(Executive Director)(Executive Director)
Our Nominating Committee is responsible for the:
(a) re-nomination of directors (including independent directors of our Company) taking into consideration each director’s contribution and performance;
(b) determining on an annual basis whether or not a director is independent; and(c) deciding whether or not the members of the Board are able to and have been adequately carrying out their
duties as directors.
Key information about the directors is detailed in the “Board of Directors” section of the annual report.

Sari
n T
ech
no
log
ies
Ltd
. | A
nn
ual
Rep
ort
201
0
28
Principle 5: Board Performance
Our Nominating Committee decides how the Board’s performance is to be evaluated and proposes objective performance criteria, subject to the approval of the Board, which address how the Board has enhanced long-term shareholder’s value. The performance evaluation also includes consideration of our Share price performance over a fi ve-year period vis-à-vis the Straits Times Index. The Board also implemented a process to be carried out by our Nominating Committee for assessing the effectiveness of the Board as a whole and for assessing the contribution of each individual director to the effectiveness of the Board.
Throughout 2010, the Board was convened fi ve times (in addition, written resolutions were passed on two occasions).
The attendance (in person) of the directors in the Board meetings held in 2010 was as follows:
Board of Directors – 2010Name of Director No. of Meetings Held AttendanceMr. Daniel Benjamin Glinert 5 5Mr. Uzi Levami 5 5Mr. Eyal Mashiah 5 5Mr. Avraham Eshed 5 4Mr. Ehud Harel 5 4Mr. Hanoh Stark 5 5Mr. Yehezkel Pinhas Blum 5 5Mr. Chan Kam Loon 5 5Ms. Valerie Ong Choo Lin 5 5Mr. Ilan Weismann - Alternate Director1 5 1Mr. Lior Eshed - Alternate Director2 5 1
1. Mr. Ilan Weismann attended one meeting as an Alternate Director for Mr. Ehud Harel.
2. Mr. Lior Eshed attended one meeting as an Alternate Director for Mr. Avraham Eshed.
The attendance of the directors in the Audit Committee meetings held in 2010 was as follows:
Audit Committee – 2010
Name of Director No. of Meetings Held Attendance
Mr. Yehezkel Pinhas Blum 5 5Mr. Chan Kam Loon 5 5Ms. Valerie Ong Choo Lin 5 5
The attendance of the directors in the Remuneration Committee meetings held in 2010 was as follows:
Remuneration Committee – 2010No. of Meetings Held Attendance
Mr. Yehezkel Pinhas Blum 2 2Mr. Chan Kam Loon 2 2Ms. Valerie Ong Choo Lin 2 2Mr. Uzi Levami 2 1Mr. Eyal Mashiah 2 2Mr. Hanoh Stark 2 2
Corporate Governance Statement

Sari
n T
ech
no
log
ies
Ltd
. | A
nn
ual
Rep
ort
201
0
29
The attendance of the directors in the Nominating Committee meetings held in 2010 was as follows:
Nominating Committee - 2010No. of Meetings Held Attendance
Mr. Chan Kam Loon 0 0Mr. Yehezkel Pinhas Blum 0 0Ms. Valerie Ong Choo Lin 0 0Mr. Daniel Benjamin Glinert 0 0Mr. Eyal Mashiah 0 0
Principle 6: Access to Information
The management of the Company provides the Board with interim and periodical (quarterly/annual) fi nancial reports, budget control reports and additional fi nancial and operational information. The Board has separate and independent access to senior management of the Company. Requests for information from the Board are dealt with promptly. The Board, acting through its Executive Committee is informed on all material events and transactions as and when they occur. Professional advisors may be appointed to advise the Board, or (in special circumstances – as provided by Israeli law) any of its members, if the Board or any individual member thereof needs independent professional advice.
The Company Secretary (who also serves as the Company’s legal counsel) attends all Board meetings and is responsible for ensuring that Board procedures are followed and for the recording of the minutes. Together with the management staff of the Company, the Company secretary is responsible for compliance with the applicable laws, rules and regulations in this regard.
Principles 7, 8 & 9: Procedures for Developing Remuneration Policies, Level and Mix of Remuneration, and Disclosure of Remuneration
The Remuneration Committee comprises 5 directors, a majority of who, including the Chairman, is independent. As at the date of this report, the Remuneration Committee members are:
Mr. Yehezkel Pinhas BlumMr. Chan Kam LoonMs. Valerie Ong Choo LinMr. Eyal Mashiah Mr. Uzi Levami
(Chairman and Independent Director) (Independent Director)(Independent Director)(Executive Director)(Executive Director)
Our Remuneration Committee recommends to our Board of Directors a framework of remuneration for our directors and key executives, and recommends specifi c remuneration packages for each Executive Director. The recommendations of our Remuneration Committee concerning the remuneration of directors are submitted for endorsement by our Audit Committee and afterwards, by the entire Board of Directors and by the General Meeting. All aspects of directors’ remuneration, including but not limited to directors’ fees, salaries, allowances and bonuses, options and benefi ts in kind are dealt with by our Remuneration Committee. Each member of our Remuneration Committee shall abstain from voting on any resolutions in respect of his/her remuneration package. The remuneration of two of our Independent Directors, who are deemed also as “External Directors” according to the provisions of the Israeli Companies Law (Mr. Yehezkel Pinhas Blum and Ms. Valerie Ong Choo Lin), is also subject to the limitations set by Israeli law.
Our Non-Executive Directors received for their services during 2010 participation fees – based on their actual participation in the meetings of the Board of Directors, the Audit Committee, the Nominating Committee and the Remuneration Committee amounting in the aggregate (for all three Non-Executive Directors) to less than S$ 15,000. The participation fees paid to our Non-Executive Directors are equal to the fees paid to our Independent Directors per meeting (which participation fees are subject to the limitations set by Israeli law - as aforesaid). Our Independent Directors received (in the aggregate) less than S$ 140,000 for their services in 2010 (the remuneration of our Independent Directors is comprised of annual fees and participation fees). The Executive Directors, one of who was also remunerated as Chief Executive Offi cer during 2010 received (together) approximately S$ 1,150,000 for their services. The remuneration arrangements of our Executive Directors include performance based incentives (based on the Company’s results).
Corporate Governance Statement

Sari
n T
ech
no
log
ies
Ltd
. | A
nn
ual
Rep
ort
201
0
30
The remuneration (including performance based incentives) paid and accrued by us and our subsidiaries to each of our directors and our top fi ve (in terms of amount of remuneration) employees (not being directors) for services rendered to us in all capacities during 2010, were as follows:
Name Position Remuneration Breakdown between Fixed Income and Performance Based IncentivesFixed Income Performance
Based IncentivesMr. Daniel Benjamin Glinert Executive Director
and ChairmanBand 2 47% 53%
Mr. Uzi Levami Executive Director and CEO Band 3 42% 58%Mr. Eyal Mashiah Executive Director Band 1 40% 60%Mr. Philip Chan Independent Director Band 1 100% ___Ms. Valerie Ong Choo Lin Independent Director Band 1 100% ___Mr. Yehezkel Pinhas Blum Independent Director Band 1 100% ___Mr. Avraham Eshed Non- Executive Director Band 1 100% ___Mr. Ehud Harel Non- Executive Director Band 1 100% ___Mr. Hanoh Stark Non- Executive Director Band 1 100% ___Mr. Oded Ben Shmuel Managing Director,
Sarin IndiaBand 2 69% 31%
Mr. David Sydney Block Deputy CEO and VP Sales Band 2 96% 4%Mr. William L. (“Bill”) Kessler CFO Band 2 89% 11%Mr. Itzik Samish Director of Sales Band 2 42% 58%Mr. Yosef Vax VP Operations Band 2 95% 5%
Notes:
Band 1: remuneration of up to S$ 250,000 per annum.
Band 2: remuneration of between S$ 250,001 to S$ 500,000 per annum.
Band 3: remuneration of between S$ 500,001 to S$ 750,000 per annum.
Any future arrangements concerning the remuneration of our directors shall be brought to the approval of our Remuneration Committee, Audit Committee, Board of Directors and General Meeting.
Any future arrangements concerning the remuneration of our key executives shall be brought to the review of the Remuneration Committee and Board of Directors.
Since its listing on the SGX-ST, the Company has been granting share options to its employees under its 2005 Share Option Plan (the “Plan”). The Plan is described in the Company’s prospectus and a copy thereof is attached to the said prospectus. The Board of Directors has set guidelines concerning, among other things, eligibility to receive share options (based on performance and time of service with the Company), vesting periods (typically over four years from the date of grant) and the minimum and maximum amounts of share options to be granted (based on seniority and expertise). So far, all share options granted under the Plan were granted either at a 20% discount off the Market Price (as such term is defi ned in the Plan) or at the Market Price. Further details with regard to the options granted by the Company may be found in the “Directors Report” section of the annual report.
Principle 10: Accountability
The Board is accountable to the Company’s shareholders. The Board provides the shareholders with periodical, and to the extent necessary and/or required – immediate, reports with regard to the business, fi nancial and other aspects of the Company’s activities.
The management of the Company provides the Board in general, and the Executive Directors in particular, with management accounts regarding the Company’s performance. Such accounts are provided to the Executive Directors on an ongoing basis and to the Directors on a periodical basis (and where needed - as warranted by the circumstances).
Corporate Governance Statement
Sari
n T
ech
no
log
ies
Ltd
. | A
nn
ual
Rep
ort
201
0
31
Principles 11, 12 & 13: Audit Committee, Internal Controls and Internal Audits
The Audit Committee comprises three directors, all of who, including the Chairman, are independent. As at the date of this Report, the Audit Committee members are:
Mr. Chan Kam LoonMr. Yehezkel Pinhas BlumMs. Valerie Ong Choo Lin
(Chairman and Independent Director) (Independent Director)(Independent Director)
The members of our Audit Committee possess vast and diverse accounting, fi nancial and commercial expertise and experience. Mr. Chan Kam Loon has a degree in accountancy and is qualifi ed as a chartered accountant with the Institute of Chartered Accountants in England and Wales, Mr. Yehezkel Pinhas Blum has a degree in economics and business administration and Ms. Ong heads the Corporate Finance practice in the Singapore law fi rm of Rodyk and Davidson. Each of them has more than twenty years’ fi nancial/business experience. Further details with regard to expertise and experience of the members of our Audit Committee may be found in the “Board of Directors” section of the annual report.
Our Audit Committee assists our Board in discharging its responsibility to safeguard our assets, maintain adequate accounting records, and develop and maintain effective systems of internal control, with the overall objective of ensuring that our management creates and maintains an effective control environment in our Company, in consultation with the internal auditor. Under its terms of reference, our Audit Committee may seek any information it requires from any employee and all employees are directed to co-operate with any requests made by our Audit Committee. Our Audit Committee also provides a channel of communications between our Board, our management and our internal and external auditors on matters relating to audit.
The Audit Committee meets periodically and performs the following functions:
review the scope and results of the audit and its cost effectiveness, and the independence and objectivity of the (a) external auditors.
review with the internal and external auditors the audit plan, their evaluation of the system of internal accounting (b) controls, their letter to management and the management’s response;
review the quarterly and annual fi nancial statements and balance sheet and profi t and loss accounts and the (c) Appendix 7.2 report thereon before submission to our Board for approval, ensuring the integrity of the fi nancial statements of the company and any formal announcements relating to the company’s fi nancial performance, and focusing in particular on changes in accounting policies and practices, major risk areas, signifi cant adjustments resulting from the audit, compliance with accounting standards and compliance with the Listing Manual and any other relevant statutory or regulatory requirements;
review the internal control procedures and ensure co-ordination between the external auditors and our management, (d) and review the assistance given by our management to the auditors, and discuss problems and concerns, if any, arising from the interim and fi nal audits, and any matters which the auditors may wish to discuss (in the absence of our management, where necessary);
review and discuss with the external auditors any suspected fraud or irregularity, or suspected infringement of any (e) relevant laws, rules or regulations, which has or is likely to have a material impact on our Company’s operating results or fi nancial position, and our management’s response;
consider and recommend to the Board to appoint and re-appoint the internal and external auditors and matters (f) relating to the resignation or dismissal of the auditors; consider and recommend to the Board with regard to the fees of the internal and external auditors ;
review interested person transactions (if any) falling within the scope of Chapter 9 of the Listing Manual or within (g) the scope of those interested persons transactions that require the approval of the audit committee pursuant to Israeli Companies Law;
review potential confl icts of interest, if any;(h)
review the remuneration packages of employees who are related to our directors and/or substantial shareholders, (i) if any;
Corporate Governance Statement

Sari
n T
ech
no
log
ies
Ltd
. | A
nn
ual
Rep
ort
201
0
32
undertake such other reviews and projects as may be requested by our Board, and report to our Board its fi ndings (j) from time to time on matters arising and requiring the attention of our Audit Committee;
generally undertake such other functions and duties as may be required by statute or the Listing Manual, or by such (k) amendments as may be made thereto from time to time; and
Setting an arrangement by which staff of the company may, in confi dence, raise concerns about possible improprieties (l) in matters of fi nancial reporting or other matters.
Apart from the duties listed above, our Audit Committee communicates and reviews the fi ndings of internal investigation into matters where there is any suspected fraud or irregularity, or failure of internal controls or infringement of any law, rule or regulation which has or is likely to have a material impact on our Company’s operating units and/or fi nancial position.
The Group’s internal controls and systems are designed to provide reasonable assurance to the integrity and reliability of the fi nancial information.
Based on the recommendations of the Audit Committee, the Board of Directors appointed, in August 2009, Mr. Doron Cohen, CPA, CIA, of Fahn Kanne Control Management, Ltd., subsidiary of Fahn Kanne and Co., Certifi ed Public Accountants (Isr.) (Member fi rm of Grant Thornton International), as the Internal Auditor of the Company. The role of the internal auditor is to independently examine, among other things, whether our activities comply with the law and orderly business procedure. Our internal auditor submits his work plans to the prior approval of the Audit Committee and presents his fi ndings to the Audit Committee and to the Board of Directors.
The Audit Committee confi rms that it has undertaken a review of all non-audit services provided by the external auditors and is satisfi ed that such services should not, in the Audit Committee’s opinion, affect the independence of the external auditors.
Principles 14 & 15: Communication with Shareholders and Greater Shareholder Participation
The Company’s results are published through the SGXNET and news releases. The Company does not practice selective disclosure. Price sensitive information is fi rst publicly released, either before the Company meets with any group of analysts or simultaneously with such meetings. Results and annual reports are announced or issued within the mandatory period.
All shareholders of the Company are provided with the annual report and notice of the convening of the AGM. At the AGM shareholders are given the opportunity to air their views and ask directors or management questions regarding the Company.
The Articles allow a member of the Company to appoint not more than two proxies to attend and vote instead of the member.
Corporate Governance Statement

Sari
n T
ech
no
log
ies
Ltd
. | A
nn
ual
Rep
ort
201
0
33
DEALINGS IN SECURITIES
The Company has adopted the recommendations of the SGX’s Best Practices Guide on Dealing in Securities in relation to its policy on the Company (with regard to the exercise of its share buy-back mandate), directors, offi cers and employees dealing in the Company’s shares.
MATERIAL CONTRACTS
Throughout the fi nancial year under review the Company was not a party to any Material Contracts involving the Chief Executive Offi cer, directors or controlling shareholders.
INTERESTED PERSON TRANSACTIONS
All interested person transactions are considered and reviewed by the Board of Directors, and to the extent required by the Listing Manual and/or the Israeli Companies Law, also by the Audit Committee and the General Meeting
Our internal control procedures are designed to ensure that all interested person transactions, including interested person transactions involving companies related to our Company are conducted at arm’s length and on commercial terms.
Throughout the fi nancial year under review the Company was not a party to any interested party transaction the fi nancial scope of which exceeded S$ 100,000, except as noted below:
On September 3, 2009, the Company leased 224 square meters of offi ce space in the Israeli Diamond Exchange building, from a company controlled by an interested party. The lease is for a period of 24 months, with an option (at the Company’s discretion) to extend the lease period by an additional 24 month period. The monthly rent during the initial six month period is US$ 4,855 per month and thereafter US$ 7,832. The monthly rent during the option period is US$ 8,615 per month. The lessor may terminate the lease at any time on notice of fi ve months to the Company.
Corporate Governance Statement

Sari
n T
ech
no
log
ies
Ltd
. | A
nn
ual
Rep
ort
201
0
34
Directors’ Report
We are pleased to submit this annual report to the shareholders of the Company together with the audited statements for the fi nancial year ended 31 December 2010.
Directors
The Directors in offi ce at the date of this report are as follows:
Daniel Benjamin Glinert, Executive Director, Chairman of the Board Uzi Levami, Executive Director, Chief Executive Offi cer (CEO)Avraham Eshed, Executive DirectorEyal Mashiah, Executive Director
Ehud Harel, Non-Executive DirectorHanoh Stark, Non-Executive Director
Yehezkel Pinhas Blum, Independent DirectorValerie Ong Choo Lin, Independent DirectorChan Kam Loon, Independent Director
Directors’ Interests
According to the share register kept by the Company for the purposes of Sections 127 and 128 of the Israeli Companies Law, 5759-1999 (the “Law”), and according to the information provided to the Company by our directors, particulars of interests of directors who held offi ce at the end of the fi nancial year 2010 (the “Year”) in shares in the Company and in related corporations, other than wholly owned subsidiaries, are as follows:
Except as listed hereunder, none of our directors who held offi ce at the end of the Year had any direct interest in the Company’s shares – neither at the beginning of the Year, nor at the end of the Year nor as at 21 January 2011.
Shareholdings in which the director is deemed to have an interest
The Company As at 1 January 2010
As at 31 December 2010
As at 21 January 2011
Ordinary Shares of the Company of no par value each
Daniel Benjamin Glinert1 46,750,000 47,100,000 47,100,000Avraham Eshed2 - 150,000 150,000Ehud Harel3 99,830,000 99,830,000 99,830,000Uzi Levami4 46,000,000 46,350,000 46,350,000Eyal Mashiah5 - 1,200,000 1,200,000Hanoh Stark6 99,830,000 100,180,000 100,180,000
1 Daniel Benjamin Glinert is deemed a shareholder of the Company by virtue of his holdings (through D. Glinert Holdings Ltd.) of more than 20% of the issued share capital of Interhightech (1982) Ltd., by virtue of his indirect ownership of 750,000 shares held on his behalf by UOB Kay Hian Pte. and by virtue of his indirect ownership of 350,000 shares held on his behalf by Eyal Khayat, Option Plan 2005 trustee.
2 Avraham Eshed is deemed a shareholder of the Company by virtue of his indirect ownership of 150,000 shares held on his behalf by Eyal Khayat Option Plan 2005 trustee.
3 Ehud Harel is deemed a shareholder of the Company by virtue of his holdings (through Hargem Ltd.) of more than 20% of the issued share capital of Sarin Research and Development Ltd.
4 Uzi Levami is deemed a shareholder of the Company by virtue of his holdings (through U Lev Ami Holdings Ltd.) of more than 20% of the issued share capital of Interhightech (1982) Ltd and by virtue of his indirect ownership of 350,000 shares held on his behalf by Eyal Khayat, Option Plan 2005 trustee
5 Eyal Mashiah is deemed a shareholder of the Company by virtue of his indirect ownership of 500,000shares held on his behalf by Bank Leumi Ltd. and by virtue of his indirect ownership of 700,000 shares held on his behalf by Eyal Khayat Option Plan 2005 trustee.
6 Hanoh Stark is deemed a shareholder of the Company by virtue of his holdings (through Hanoh Stark Holdings Ltd.) of more than 20% of the issued share capital of Sarin Research and Development Ltd. and by virtue of his indirect ownership of 350,000 shares held on his behalf by Eyal Khayat, Option Plan 2005 trustee
Directors’ ReportFor the year ended 31 December 2010

Sari
n T
ech
no
log
ies
Ltd
. | A
nn
ual
Rep
ort
201
0
35
Shareholdings in which the director is deemed to have an interest
Related Corporations As at 1 January 2010
As at 31 December 2010
As at 21 January 2011
Sarin Research and Development Ltd. Ordinary Shares of NIS 0.01 par value each. Fully paid up
Hanoh Stark (Shares registered in the name of Hanoh Stark Holdings Ltd.)
32,689 32,689 32,689
Ehud Harel (Shares registered in the name of Hargem Ltd.) 34,051 34,051 34,051Eyal Mashiah (Shares registered in the name of Ramgem Ltd.)
19,522 20,865 20,865
Avraham Eshed (Shares registered in the name of Gemstar Ltd.)
18,160 19,503 19,503
Interhightech (1982) Ltd. Ordinary Shares of NIS 0.01 par value each. Fully paid upDaniel Benjamin Glinert (Shares registered in the name of D. Glinert Holdings Ltd.)
9,893 9,893 9,893
Uzi Levami (Shares registered in the name of U Lev Ami Holdings Ltd.)
9,893 9,893 9,893
Outstanding Options granted to directors under the Company’s 2005 Option Plan*
Name of Director Number of Options Granted
Chan Kam Loon 250,000Valerie Ong Choo Lin 250,000
* Note – Options which were granted to directors under the Company’s 2005 Option Plan and which were exercised thereafter are not included in the above table.
Except as disclosed in this report, no director who held offi ce at the end of the Year had interests in shares or debentures of the Company or of related corporations, either at the later of the beginning of the Year or the commencement of his service as a director or at the end of the Year.
Except as disclosed in this report, the Company was not a party to any arrangement whose objects are, or one of whose objects is, to enable the directors of the Company to acquire benefi ts by means of the acquisitions of shares in or debentures of the Company or any other body corporate.
Since the end of the last fi nancial year (2010), and except as disclosed in the Company’s audited fi nancial statements for the Year, no director has received or become entitled to receive a benefi t by reason of a contract made by the Company or a related corporation with the director or with a fi rm of which he is a member or with a company in which he has a substantial interest.
Share Options
In 2005 the Company adopted a share option plan (the “Plan”), and since then granted options to employees and directors at no consideration. As of 31 December 2010, a total of 13,241,148 options exercisable into 13,241,148 ordinary shares of no par value each in the capital of the Company, at an exercise price ranging between S$ 0.109 and S$ 0.66 per option (according to the date of grant) were granted under the Plan. During the Year, the Company granted a total of 260,000 options under the Plan as detailed in the Company’s audited fi nancial statements for the Year. As of 31 December 2010, there were 7,296,151 options outstanding under the Plan, and 2,986,612 options have been exercised under the Plan. The exercise period for options granted under Plan is six years from the date of grant, with a vesting period of up to four years.
Directors’ ReportFor the year ended 31 December 2010
Sari
n T
ech
no
log
ies
Ltd
. | A
nn
ual
Rep
ort
201
0
36
Audit Committee
The Audit Committee of the Company was established on 8 March 2005 by the Board of Directors and comprises three independent directors. The members of the Audit Committee are Mr. Chan Kam Loon (Chairperson), Mr. Yehezkel Pinhas Blum and Ms. Valerie Ong Choo Lin. The Audit Committee assists the Board in discharging its responsibility to safeguard the Group’s assets, maintains adequate accounting records, and develops and maintains effective systems of internal control, with the overall objective of ensuring that the management creates and maintains an effective control environment in the Group, in consultation with the internal and external auditors.
Auditors
The auditors, Somekh Chaikin, Certifi ed Public Accountants (Isr.), Member fi rm of KPMG International, and Chaikin, Cohen, Rubin & Co., Certifi ed Public Accountants (Isr.), have indicated their willingness to accept re-appointment.
On behalf of the Board of Directors
Daniel Benjamin Glinert Uzi LevamiExecutive Director, Chairman of the Board Executive Director, CEO
Avraham Eshed Eyal MashiahExecutive Director Executive Director
Israel12 April 2011
Directors’ ReportFor the year ended 31 December 2010
Sari
n T
ech
no
log
ies
Ltd
. | A
nn
ual
Rep
ort
201
0
37
Statement by Directors
In the opinion of the directors,
(a) the balance sheet of the Company and the consolidated fi nancial statements of the Group as set out on pages 39 to 80 are drawn up so as to give a true and fair view of the Company and of the Group at 31 December 2010 and of the results of the business, changes in equity and cash fl ows of the Group for the fi nancial year then ended; and
(b) as at the date of this statement, there are reasonable grounds to assume that the Company will be able to pay its debts as and when they fall due.
On behalf of the directors
Daniel Benjamin Glinert Uzi Levami Executive Director, Chairman of the Board Executive Director, CEO
Avraham Eshed Eyal MashiahExecutive Director Executive Director
12 April 2011
Sari
n T
ech
no
log
ies
Ltd
. | A
nn
ual
Rep
ort
201
0
38
Auditors’ ReportTo the Shareholders of Sarin Technologies Ltd.
We have audited the accompanying consolidated balance sheets of Sarin Technologies Ltd. and subsidiaries (hereinafter the “Company”) as at December 31, 2010 and 2009 and the consolidated statements of comprehensive income, statements of changes in shareholders’ equity and statements of cash fl ows, for each of the years ended on such dates. These fi nancial statements are the responsibility of the Company’s Board of Directors and of its Management. Our responsibility is to express an opinion on these fi nancial statements based on our audits.
We conducted our audits in accordance with generally accepted auditing standards in Israel, including standards prescribed by the Auditors Regulations (Manner of Auditor’s Performance) - 1973. Such standards require that we plan and perform the audit to obtain reasonable assurance that the consolidated fi nancial statements are free of material misstatement. An audit includes, examining, on a test basis, evidence supporting the amounts and disclosures in the fi nancial statements. An audit also includes assessing the accounting principles used and signifi cant estimates made by the Board of Directors and by Management, as well as evaluating the overall consolidated fi nancial statement presentation. We believe that our audits provide a reasonable basis for our opinion.
In our opinion, the consolidated fi nancial statements referred to above present fairly, in all material respects, the consolidated fi nancial position of the Company as at December 31, 2010 and 2009 and their results of operations, changes in its shareholders’ equity and cash fl ows, for each of the years ended on such dates, in accordance with International Financial Reporting Standards (IFRS).
Somekh Chaikin Chaikin, Cohen, Rubin and CoCertifi ed Public Accountants (Isr.) Certifi ed Public AccountantsMember fi rm of KPMG International
Tel-Aviv, Israel Tel-Aviv, IsraelMarch 27, 2011 March 27, 2011

Sari
n T
ech
no
log
ies
Ltd
. | A
nn
ual
Rep
ort
201
0
39
Consolidated Balance Sheetsas of December 31
2010 2009Note US$ thousands US$ thousands
AssetsProperty, plant and equipment 12 2,629 2,163 Intangible assets 13 9,687 11,622 Investment in equity accounted investee 14 -- 563 Deferred tax assets 15 845 769
Total non-current assets 13,161 15,117
Inventories 16 4,762 2,924 Trade receivables 17 3,140 1,326 Other receivables 18 961 1,040 Short-term investments 19 5,413 8,712 Cash and cash equivalents 20 22,857 12,151
Total current assets 37,133 26,153
Total assets 50,294 41,270
EquityShare capital* 21 -- -- Share premium and reserves 14,572 13,767 Dormant shares, at cost 21 (53) --Retained earnings 24,366 18,704
Total equity 38,885 32,471
LiabilitiesLong-term liabilities 25 968 920 Employee benefi ts 24 186 45
Total non-current liabilities 1,154 965
Trade payables 2,576 1,606 Other payables 23 5,292 5,087 Current tax payable 2,145 1,026 Warranty provision 27 242 115
Total current liabilities 10,255 7,834
Total liabilities 11,409 8,799
Total equity and liabilities 50,294 41,270
* No par value
The accompanying notes are an integral part of the consolidated fi nancial statements.

Sari
n T
ech
no
log
ies
Ltd
. | A
nn
ual
Rep
ort
201
0
40
2010 2009Note US$ thousands US$ thousands
Revenue 8 45,663 21,382 Cost of sales (16,313) (8,903)
Gross profi t 29,350 12,479
Research and development expenses (5,246) (3,422)
Sales and marketing expenses (6,369) (4,502)
General and administrative expenses (3,305) (2,404)
Profi t from operations 14,430 2,151
Finance income 317 351 Finance expense (335) (170)
Net fi nance (expense) income 10 (18) 181
Share of loss of equity accounted investee 14 (563) (728)
Profi t before income tax 13,849 1,604
Income tax expense 11 (2,738) (76)
Profi t for the year 11,111 1,528
Other comprehensive income Foreign currency translation differences for foreign operations 55 84
Total comprehensive income for the year ended 11,166 1,612
Earnings per share Basic earnings per share (US cents) 22 4.19 0.58
Diluted earnings per share (US cents) 22 4.12 0.58
The accompanying notes are an integral part of the consolidated fi nancial statements.
Consolidated Statements of Comprehensive Incomefor the Years Ended December 31

Sari
n T
ech
no
log
ies
Ltd
. | A
nn
ual
Rep
ort
201
0
41
ShareShare premium Translation Retained Dormant
capital* and reserves reserve earnings shares TotalUS$
thousandsUS$
thousandsUS$
thousandsUS$
thousandsUS$
thousandsUS$
thousands
Balance at January 1, 2009 -- 13,387 (112) 17,176 -- 30,451
Profi t for the year ended December 31, 2009 -- -- -- 1,528 -- 1,528
Other comprehensive income for the year ended December 31, 2009 -- -- 84 -- -- 84
Share-based payment expenses -- 326 -- -- -- 326
Exercise of options -- 82 -- -- -- 82
Balance at December 31, 2009 -- 13,795 (28) 18,704 -- 32,471
Profi t for the year ended December 31, 2010 -- -- -- 11,111 -- 11,111
Other comprehensive income for the year ended December 31, 2010 -- -- 55 -- -- 55
Share-based payment
expenses -- 229 -- -- -- 229
Exercise of options -- 517 -- -- -- 517
Dividend paid -- -- -- (5,445) -- (5,445)
Dormant shares, at cost (126,000 shares) -- -- -- -- (53) (53)
Balance at December 31, 2010 -- 14,541 27 24,370 (53) 38,885
* No par value
The accompanying notes are an integral part of the consolidated fi nancial statements.
Consolidated Statements ofChanges in Shareholders’ Equity

Sari
n T
ech
no
log
ies
Ltd
. | A
nn
ual
Rep
ort
201
0
42
2010 2009US$ thousands US$ thousands
Cash fl ows from operating activitiesProfi t for the year 11,111 1,528
Adjustments for:Share-based payment expenses 229 326 Income tax expense 2,738 76 Depreciation of property, plant and equipment 981 877 Share of loss of equity accounted investee 563 728 Amortisation of intangible assets 2,478 1,968 Loss on sale or disposal of property, plant and equipment 267 329 Net fi nance expense (income) 18 (181)
Changes in working capitalInventories (1,838) 1,761 Trade receivables (1,814) (753)Other receivables 79 37 Trade payables 745 492 Other payables and warranty provision 444 873 Employee benefi ts 141 (186)Income tax (paid) refunded (1,695) 1,779
Net cash from operating activities 14,447 9,654
Cash fl ows from investing activitiesAcquisition of property, plant and equipment, net (1,714) (1,241)Acquisition of intellectual property (390) -Short-terms investments, net 3,299 (6,612)Capitalisation of R&D expenses - (304)Interest received 211 345
Net cash from (used in) investing activities 1,406 (7,812)
Cash fl ows from fi nancing activitiesProceeds from exercise of share options 517 82 Purchase of Company’s shares by the Company (53) - Receipt of long-term grants 59 481 Repayment of long term grants (199) - Interest paid (131) (114)Dividends paid (5,445) -
Net cash (used in) from fi nancing activities (5,252) 449
Net increase in cash and cash equivalents 10,601 2,291 Cash and cash equivalents at beginning of year 12,151 9,910 Effect of exchange rate fl uctuations on cash and cash equivalents * 105 (50)Cash and cash equivalents at end of year 22,857 12,151
Non-cash activities:Acquisition of intellectual property on credit 225 --
* Reclassifi ed
The accompanying notes are an integral part of the consolidated fi nancial statements.
Consolidated Statements of Cash Flowsfor the Years Ended December 31

Sari
n T
ech
no
log
ies
Ltd
. | A
nn
ual
Rep
ort
201
0
43
Note 1 - General
A. Reporting Entity
Sarin Technologies Ltd. (“Sarin” or the “Company”) is a company domiciled in Israel. The address of the Company’s registered offi ce is 7 Atir Yeda Street, Kfar Saba 44643, Israel. The consolidated fi nancial statements of the Company as at and for the year ended December 31, 2010 comprise the Company and its subsidiaries (together referred to as the “Group” and individually as “Group entities”) and the Group’s interest in associates. The Company was incorporated on November 8, 1988. On April 8, 2005 the Company was admitted to the main board list of the Singapore Exchange Securities Trading Ltd.
B. Introduction
The Group is a worldwide leader in the development, manufacturing, marketing and sale of precision technology products for the planning, processing, evaluation and measurement of diamonds and gems. The Group’s systems comprise various hardware technologies, including electro-optics, electronics, precision mechanics and lasers. At the heart of these systems is the computer software that implements three-dimensional modeling and volume / value optimisation using advanced mathematical algorithms, and overall system control (motion, image capture, laser functionality, etc.).
The Company owns a 100% interest in each of Galatea Ltd. (acquired in 2008)(see Note 7), Sarin Color Technologies Ltd. and Sarin Polishing Technologies Ltd. each organised in Israel, Sarin Technologies India Private Ltd. (“Sarin India”), organised in India and Sarin Hong Kong Ltd., organised in Hong Kong.. The Company also has a registered entity in New York, USA, for sales tax purposes. The Company also owns a 23% interest in IDEX Online SA, organised in Switzerland (acquired in 2008) (see Note 14).
These fi nancial statements were authorised for issue by the directors on March 27, 2011.
C. Auditors
The statutory audited fi nancial statements of the Israeli companies in the Group as of and for the year ended December 31, 2010 and 2009 were audited jointly by Chaikin, Cohen, Rubin & Co. and Somekh Chaikin, fi rms of Israeli Certifi ed Public Accountants, whose partners are registered with the Israel Auditors’ Council. The statutory audited fi nancial statements of the Group for the relevant years have been prepared in accordance with generally accepted accounting principles in Israel. The statutory fi nancial statements of Sarin India for 2010 and 2009 were audited by KPMG Mumbai, India.
Note 2 - Basis of Preparation
A. Statement of compliance
The consolidated fi nancial statements have been prepared in accordance with International Financial Reporting Standards (IFRS).
B. Basis of measurement
The consolidated fi nancial statements have been prepared on the historical cost basis except for the following material items in the consolidated balance sheet:
• fi nancial instruments at fair-value through profi t or loss are measured at fair-value; • defi ned benefi t obligations are presented at present value (as calculated by an actuary);• investments in equity accounted affi liates; • deferred tax assets and liabilities; and • certain provisions are recognised according to the best possible estimate at the end of the reporting
period of the outfl ow required for settling the present obligation (when the value of time is material, the future cash fl ows are discounted at a pre-tax rate that refl ects current market assessments of the time value of money and the risks specifi c to the liability).
Notes to the Consolidated Financial Statements

Sari
n T
ech
no
log
ies
Ltd
. | A
nn
ual
Rep
ort
201
0
44
Note 2 - Basis of Preparation (cont’d)
C. Functional and presentation currency
These consolidated fi nancial statements are presented in US dollars, which is the Group’s functional currency. All fi nancial information presented in US dollars has been rounded to the nearest thousand.
D. Use of estimates and judgments
The preparation of fi nancial statements in conformity with IFRS statements requires management to make judgments, estimates and assumptions that affect the application of accounting policies and the reported amounts of assets and liabilities, income and expenses. Actual results may differ from these estimates.
Estimates and underlying assumptions are reviewed on an ongoing basis. Revisions to accounting estimates are recognised in the period in which the estimates are revised and in any future periods affected.
Information about signifi cant areas of estimation uncertainty and critical judgments in applying accounting policies that have the most signifi cant effect on the amounts recognised in the consolidated fi nancial statements is included in the following notes:
Note 13 – measurement of amortisation of intangible assetsNote 24 – measurement of defi ned benefi t obligationsNote 26 – measurement of share-based paymentsNotes 27 and 30 – warranty provisions and contingencies
E. Changes in accounting policies
Overview
As of January 1, 2010, the Group, in accordance with IFRS, changed its accounting policies in the following areas:
• business combinations and transactions with non-controlling interests; and • presentation of fi nancial statements.
i. Business combinations and transactions with non-controlling interests
As from January 1, 2010, the Group implemented IFRS 3 Business Combinations (2008) and IAS 27 Consolidated and Separate Financial Statements (2008) (hereinafter – IFRS 3 and IAS 27, respectively).
The Group has chosen not to early implement the following amendments to IFRS 3, which were published in the framework of Improvements to IFRSs 2010: an amendment to the transitional provision regarding a contingent consideration in a business combination that occurred before the effective date of IFRS 3 and an amendment regarding the measurement of non-controlling interests.
ii. Presentation of fi nancial statements
As from January 1, 2010, the Group implemented the revision to IAS 1, Presentation of Financial Statements, which was issued in the framework of Improvements to IFRSs 2010, pursuant to which the Group presents in the statement of changes in equity, for each component of equity, a reconciliation between the carrying amount at the beginning of the period and the carrying amount at its end, and provides separate disclosure for each change resulting from profi t or loss, other comprehensive income, and transactions with the owners in their capacity as owners. The Group provides disclosure for the said reconciliation with separate disclosure for each change resulting from each component of other comprehensive income in the Consolidated Statements of Changes in Shareholders’ Equity.
Notes to the Consolidated Financial Statements

Sari
n T
ech
no
log
ies
Ltd
. | A
nn
ual
Rep
ort
201
0
45
Note 3 - Signifi cant Accounting Policies
The accounting policies set out below have been applied consistently to all periods presented in these consolidated fi nancial statements, and have been applied consistently by Group entities, except as explained in Note 2E, which addresses changes in accounting policies.
A. Basis of consolidation
i. Subsidiaries
Subsidiaries are entities controlled by the Group. Control exists when the Group has the power to govern the fi nancial and operating policies of an entity so as to obtain benefi ts from its activities. In assessing control, potential voting rights that currently are exercisable are taken into account.
The fi nancial statements of subsidiaries are included in the consolidated fi nancial statements from the date that control commences until the date that control ceases. The accounting policies of subsidiaries have been changed when necessary to align them with the policies adopted by the Group.
ii. Equity accounted investees
Equity accounted investees are those entities in which the Group has signifi cant infl uence, but not control, over the fi nancial and operating policies. Signifi cant infl uence is presumed to exist when the Group holds between 20 and 50 percent of the voting power of another entity.
Equity accounted investees are accounted for using the equity method and are recognised initially at cost. The Group’s investment includes goodwill identifi ed on acquisition, net of any accumulated impairment losses. The consolidated fi nancial statements include the Group’s share of the income and expenses and equity movements of equity accounted investees, after adjustments to align the ac-counting policies with those of the Group, from the date that signifi cant infl uence commences until the date that signifi cant infl uence ceases. When the Group’s share of losses exceeds its interest in an equity accounted investee, the carrying amount of that interest (including any long-term investments) is reduced to nil and the recognition of further losses is discontinued except to the extent that the Group has an obligation or has made payments on behalf of the investee.
iii. Transactions eliminated on consolidation
Intra-group balances and transactions, and any unrealised income and expenses arising from intra-group transactions, are eliminated in preparing the consolidated fi nancial statements. Unrealised gains arising from transactions with equity accounted investees are eliminated against the investment to the extent of the Group’s interest in these investments. Unrealised losses are eliminated in the same way as unrealised gains, but only to the extent that there is no evidence of impairment.
B. Foreign currency transactions
Transactions in foreign currencies are translated to the respective functional currencies of Group entities at exchange rates as at the dates of the transactions. Monetary assets and liabilities denominated in foreign currencies at the reporting date are retranslated to the functional currency as at the exchange rate at that date. The foreign currency gain or loss on monetary items is the difference between amortised cost in the functional currency at the beginning of the period, adjusted for effective interest and payments during the period, and the amortised cost in foreign currency translated at the exchange rate at the end of the reporting period. Non-monetary items that are measured in terms of historical cost in a foreign currency are translated using the exchange rate at the date of the transaction.
C. Financial instruments
i. Non-derivative fi nancial assets
Initial recognition of fi nancial assets
The Group initially recognises receivables and deposits on the date that they are originated. Non-derivative fi nancial instruments comprise short-term investments, trade and other receivables and cash and cash equivalents.
Notes to the Consolidated Financial Statements

Sari
n T
ech
no
log
ies
Ltd
. | A
nn
ual
Rep
ort
201
0
46
Note 3 - Signifi cant Accounting Policies (cont’d)
C. Financial instruments (cont’d)
i. Non-derivative fi nancial assets (cont’d)
Derecognition of fi nancial assets
Financial assets are derecognised when the contractual rights of the Group to the cash fl ows from the asset expire, or the Group transfers the rights to receive the contractual cash fl ows on the fi nancial asset in a transaction in which substantially all the risks and rewards of ownership of the fi nancial asset are transferred. Any interest in transferred fi nancial assets that is created or retained by the Group is recognised as a separate asset or liability. See (ii) hereunder regarding the offset of fi nancial assets and fi nancial liabilities.
The Group classifi es its fi nancial assets according to the following categories:
Receivables
Receivables are non-derivative fi nancial assets with fi xed or determinable payments that are not quoted in an active market. Such assets are recognised initially at fair value plus any directly attributable transaction costs. Subsequent to initial recognition receivables are assessed for specifi c impairment. Receivables comprise trade and other receivables.
Cash and cash equivalents
Cash and cash equivalents comprise cash balances available for immediate use and call deposits. Cash equivalents comprise short-term highly liquid investments (with original maturities of three months or less) that are readily convertible into known amounts of cash and are exposed to insignifi cant risks of change in value.
ii. Non-derivative fi nancial liabilities
Initial recognition of fi nancial liabilities
Financial liabilities are recognised initially at fair value plus any directly attributable transaction costs.
Derecognition of fi nancial liabilities
Financial liabilities are derecognised when the obligation of the Group, as specifi ed in the agreement, expires or when it is discharged or cancelled.
The Group has the following non-derivative fi nancial liabilities: trade and other payables. Financial assets and liabilities are offset and the net amount is presented in the consolidated balance sheet when the Group currently has a legal right to offset the amounts and intends either to settle on a net basis or to realise the asset and settle the liability simultaneously.
iii. Share capital
Ordinary shares
Incremental costs directly attributable to the issue of ordinary shares and share options are recognised as a deduction from equity.
Dormant shares
When share capital recognised as equity is repurchased by the Group, the amount of the consideration paid, which includes directly attributable costs, net of any tax effects, is recognised as a deduction from equity. Repurchased shares are classifi ed as dormant shares. When dormant shares are sold or reissued subsequently, the amount received is recognised as an increase in equity, and the resulting surplus on the transaction is carried to share premium, whereas a defi cit on the transaction is deducted from retained earnings.
Notes to the Consolidated Financial Statements

Sari
n T
ech
no
log
ies
Ltd
. | A
nn
ual
Rep
ort
201
0
47
Note 3 - Signifi cant Accounting Policies (cont’d)
D. Property, plant and equipment
i. Recognition and measurement
Items of property, plant and equipment are measured at cost less accumulated depreciation and accumulated impairment losses. Cost includes expenditures that are directly attributable to the acquisition of the assets. The cost of self-constructed assets includes the cost of materials, direct labour, the initial estimate, where relevant, of the costs of dismantling and removing the items and restoring the site on which they are located, and an appropriate proportion of production overheads.
Gains and losses on disposal of an item of property, plant and equipment are determined by comparing the proceeds from disposal with the carrying amount of property, plant and equipment, and are recognised net within operating expense in profi t or loss.
ii. Subsequent costs
The cost of replacing part of an item of property, plant and equipment is recognised in the carrying amount of the item if it is probable that future economic benefi ts embodied within the part will fl ow to the Group and its cost can be measured reliably. The carrying amount of the replaced part is derecognised. The cost of the day-to-day servicing of property, plant and equipment are recognised in profi t or loss as incurred.
iii. Depreciation
Depreciation is a systematic allocation of the depreciable amount of an asset over its useful life. The depreciable amount is the cost of the asset, or other amount substituted for cost, less its residual value.
Depreciation is recognised in profi t or loss on a straight-line basis over the estimated useful lives of each part of an item of property, plant and equipment, since this most closely refl ects the expected pattern of consumption of the future economic benefi ts embodied in the asset.
The estimated useful lives for the current and comparative periods are as follows:
Machinery and offi ce equipment 6-20%Motor vehicles 15%Demonstration equipment 12%-33%Computers and computer equipment 15%-33%Leasehold improvements Lower of estimated useful lives and the lease term
Depreciation methods, useful lives and residual values are reviewed at each fi nancial year end and adjusted if appropriate.
E. Intangible assets
i. Know-how
Acquired know-how is stated at cost less accumulated amortisation and impairment losses.
Notes to the Consolidated Financial Statements

Sari
n T
ech
no
log
ies
Ltd
. | A
nn
ual
Rep
ort
201
0
48
Note 3 - Signifi cant Accounting Policies (cont’d)
E. Intangible assets (cont’d)
ii. Goodwill
Goodwill that arises upon the acquisition of subsidiaries is included in intangible assets. Goodwill represents the excess of the cost of the acquisition over the Group’s interest in the net fair value of the identifi able assets, liabilities and contingent liabilities of the acquiree. When the excess is negative (negative goodwill), it is recognised immediately in the statement of comprehensive income. Subsequently, goodwill is measured at cost less accumulated impairment losses. In respect of equity accounted investees, the carrying amount of goodwill is included in the carrying amount of the investment, and an impairment loss on such an investment is not allocated to any asset, including goodwill, that forms part of the carrying amount of the equity accounted investee.
iii. Research and development
Expenditures on research activities, undertaken with the prospect of gaining new scientifi c or technical knowledge and understanding, are recognised in profi t or loss when incurred.
Development activities involve a plan or design for the production of new or substantially improved products and processes. Development expenditures are capitalised only if development costs can be measured reliably, the product or process is technically and commercially feasible, future economic benefi ts are probable, and the Group intends to and has suffi cient resources to complete development and to use or sell the asset. An expenditure capitalised includes the cost of materials, direct labour and overhead costs that are directly attributable to preparing the asset for its intended use. Other development expenditures are recognised in profi t or loss as incurred.
Capitalised development expenditures are measured at cost less accumulated amortisation and accumulated impairment losses.
iv. Other intangible assets
Other intangible assets that are acquired by the Group and have limited useful lives are measured at cost less accumulated amortisation and impairment losses.
v. Subsequent expenditure
Subsequent expenditures are capitalised only when it increases the future economic benefi ts embodied in the specifi c asset to which it relates. All other expenditures, including expenditures on internally generated goodwill and brands, are recognised in profi t or loss as incurred.
vi. Amortisation
Amortisation is a systematic allocation of the amortisable amount of an asset over its useful life. The amortisable amount is the cost of the asset, or other amount substituted for cost, less its residual value.
Notes to the Consolidated Financial Statements

Sari
n T
ech
no
log
ies
Ltd
. | A
nn
ual
Rep
ort
201
0
49
Note 3 - Signifi cant Accounting Policies (cont’d)
E. Intangible assets (cont’d)
vi. Amortisation (cont’d)
Amortisation is recognised in profi t or loss on a straight-line basis over the estimated useful lives of intangible assets, from the date they are available for use, since this method most closely refl ects the expected pattern of consumption of the future economic benefi ts embodied in the asset. Goodwill, having indefi nite useful life, is not systematically amortised but is tested for impairment at least once a year. The estimated useful lives for the current and comparative periods are as follows:
Internally generated intangible assets are not systematically amortized until they are available for use, meaning are brought to the working condition for their intended use. Accordingly, these intangible assets, such as development costs, are tested for impairment at least once a year, until such date as they are available for use.
• Intangible assets acquired in respect of subsidiary acquisition 6 years (1)
• Capitalised development expenditure 6 years (1)
• Other intangible assets 6 years
(1) The Company started to amortise the assets from 2009, when the assets were initially available for use.
Amortisation methods, useful lives and residual values are reviewed at each fi nancial year-end and adjusted, if appropriate.
F. Inventories
Inventories are measured at the lower of cost and net realisable value. Net realisable value is the estimated selling price in the ordinary course of business, less the estimated costs of completion and selling expenses.
The cost of inventories is calculated based on the moving average costing method and includes expenditures incurred in acquiring the inventories and bringing them to their existing location and conditions. In the case of manufactured inventories and work-in-progress, cost includes an appropriate share of overhead based on normal operating capacity.
When inventories are sold, the carrying amount of those inventories is recognised as an expense in the period in which the related revenue is recognised. The amount of any allowance for write-down of inventories to net realisable value and all losses of inventories are recognised as an expense in the period the write-down or loss occurs. The amount of any reversal of any allowance for write-down of inventories, arising from an increase in net realisable value, is recognised as a reduction in the amount of inventories recognised as an expense in the period in which the reversal occurs.
G. Impairment
i. Non derivative fi nancial assets
A fi nancial asset not carried at fair value through profi t or loss is when objective evidence indicates that a loss event has occurred after the initial recognition of the asset, and that the loss event had a negative effect on the estimated future cash fl ows of that asset that can be estimated reliably.
Objective evidence that fi nancial assets are impaired can include default or delinquency by a debtor, restructuring of an amount due to the Group on terms that the Group would not consider otherwise, indications that a debtor or issuer will enter bankruptcy, the disappearance of an active market for a security. In addition, for an investment in an equity security, a signifi cant or prolonged decline in its fair value below its cost is objective evidence of impairment.
Notes to the Consolidated Financial Statements

Sari
n T
ech
no
log
ies
Ltd
. | A
nn
ual
Rep
ort
201
0
50
Note 3 - Signifi cant Accounting Policies (cont’d)
G. Impairment (cont’d)
i. Non derivative fi nancial assets (cont’d)
The Group considers evidence of impairment for receivables at a specifi c asset and collective levels. All individually signifi cant receivables are assessed for specifi c impairment. All individually signifi cant receivables found not to be specifi cally impaired are then collectively assessed for any impairment that has been incurred but not yet identifi ed. Receivables that are not individually signifi cant are collectively assessed for impairment by grouping together receivables with similar risk characteristics.
In assessing collective impairment the Group uses historical trends of the probability of default, timing of recoveries and the amount of loss incurred, adjusted for management’s judgment as to whether current economic and credit conditions are such that the actual losses are likely to be greater or less than suggested by historical trends.
An impairment loss in respect of a fi nancial asset measured at amortised cost is calculated as the difference between its carrying amount and the present value of the estimated future cash fl ows discounted at the asset’s original effective interest rate. Losses are recognised in profi t or loss and refl ected in an allowance account against receivables. Interest on the impaired asset continues to be recognised through the unwinding of the discount. When a subsequent event causes the amount of impairment loss to decrease, the decrease in impairment loss is reversed through profi t or loss.
ii. Non-fi nancial assets
The carrying amounts of the Group’s non-fi nancial assets, other than inventories and deferred tax assets are reviewed at each reporting date to determine whether there is any indication of impairment. If any such indication exists, then the assets recoverable amount is estimated. The Group estimates the recoverable amount of goodwill and other intangible assets that are not yet available for use, on an annual basis, or more frequently if circumstances warrant.
The recoverable amount of an asset or cash-generating unit is the greater of its value in use and its fair value less costs to sell. In assessing value in use, the estimated future cash fl ows are discounted to their present value using a pre-tax discount rate that refl ects current market assessments of the time value of money and the risks specifi c to the asset. For the purpose of impairment testing, assets that cannot be tested individually are grouped together into the smallest group of assets that generates cash infl ows from continuing use that are largely independent of the cash infl ows of other assets or groups of assets (the “cash-generating unit, or CGU”). Subject to an operating segment ceiling test, for the purposes of goodwill impairment testing, CGUs to which goodwill has been allocated are aggregated so that the level at which impairment is tested refl ects the lowest level at which goodwill is monitored for internal reporting purposes. The goodwill acquired in a business combination, for the purpose of impairment testing, is allocated to cash-generating units that are expected to benefi t from the synergies of the combination.
The Group’s corporate assets do not generate separate cash infl ows. If there is an indication that a corporate asset may be impaired, then the recoverable amount is determined for the CGU to which the corporate asset belongs.
An impairment loss is recognised if the carrying amount of an asset or its cash-generating unit exceeds its estimated recoverable amount. Impairment losses are recognised in profi t or loss. Impairment losses recognised in respect of CGUs are allocated fi rst to reduce the carrying amount of any goodwill allocated to the units and then to reduce the carrying amounts of other assets in the unit (group of units) on a pro rata basis. An impairment loss in respect of goodwill is not reversed.
In respect of other assets, impairment losses recognised in prior periods are assessed at each reporting date for any indications that the loss has decreased or no longer exists. An impairment loss is reversed if there has been a change in the estimates used to determine the recoverable amount. An impairment loss is reversed only to the extent that the asset’s carrying amount does not exceed the carrying amount that would have been determined, net of depreciation or amortisation, if no impairment loss had been recognised.
Notes to the Consolidated Financial Statements

Sari
n T
ech
no
log
ies
Ltd
. | A
nn
ual
Rep
ort
201
0
51
Note 3 - Signifi cant Accounting Policies (cont’d)
G. Impairment (cont’d)
iii Investments in equity accounted affi liated companies
An investment in an affi liated company is tested for impairment when objective evidence indicates there has been impairment (as described in paragraph (i) above). Goodwill that forms part of the carrying amount of an investment in an affi liate is not recognised separately, and therefore is not tested for impairment separately. If objective evidence indicates that the value of the investment may have been impaired, the Group estimates the recoverable amount of the investment, which is the greater of its value in use and its net selling price.
In assessing value in use of an investment in an affi liated company, the Group estimates its share of the present value of estimated future cash fl ows that are expected to be generated by the affi liated company, including cash fl ows from operations of the affi liated company and the consideration from the fi nal disposal of the investment, or the present value of the estimated future cash fl ows that are expected to be derived from dividends that will be received and from the fi nal disposal.
An impairment loss is recognised when the carrying amount of the investment, after applying the equity method, exceeds its recoverable amount, and it is recognised in profi t or loss. An impairment loss is not allocated to any asset, including goodwill that forms part of the carrying amount of the investment in the affi liated company.
An impairment loss is reversed only if there has been a change in the estimates used to determine the recoverable amount of the investment after the impairment loss was recognised, and only to the extent that the investment’s carrying amount, after the reversal of the impairment loss, does not exceed the carrying amount of the investment that would have been determined by the equity method if no impairment loss had been recognised.
H. Employee benefi ts
i. Defi ned contribution plans
A defi ned contribution plan is a post-employment benefi t plan under which an entity pays fi xed contributions into a separate entity and will have no legal or constructive obligation to pay further amounts. Obligations for contributions to defi ned contribution pension and savings plans are recognised as an employee benefi t expense in profi t or loss in the periods during which services are rendered by employees. Prepaid contributions are recognised as an asset to the extent that a cash refund or a reduction in future payments is available.
ii. Defi ned benefi t plans
A defi ned benefi t plan is a post-employment benefi t plan other than a defi ned contribution plan. The Group’s net obligation in respect of defi ned benefi t pension plans is calculated separately for each plan by estimating the amount of future benefi t that employees have earned in return for their service in the current and prior periods. That benefi t is discounted to determine its present value. Any unrecognised past service costs and the fair value of any plan assets are deducted. The discount rate used is based on the yield of fi xed-interest Israeli government bonds with duration equal to the duration of the gross liabilities. The calculation is performed annually by a qualifi ed actuary using the projected unit credit method. When the calculation results in a benefi t to the Group, the recognised asset is limited to the total of any unrecognised past service costs and the present value of economic benefi ts available in the form of any future refunds from the plan or reductions in future contributions to the plan. An economic benefi t is available to the Group if it is realisable during the life of the plan, or on settlement of the plan liabilities.
When the benefi ts of a plan are improved, the portion of the increased benefi t relating to past service by employees is recognised in profi t or loss on a straight-line basis over the average period until the benefi ts become vested. To the extent that the benefi ts vest immediately, the expense is recognised immediately in profi t or loss.
The Group recognises all actuarial gains and losses arising from defi ned benefi t plans directly in profi t or loss.
Notes to the Consolidated Financial Statements
Sari
n T
ech
no
log
ies
Ltd
. | A
nn
ual
Rep
ort
201
0
52
Note 3 - Signifi cant Accounting Policies (cont’d)
H. Employee benefi ts (cont’d)
iii. Short-term employee benefi ts
Short-term employee benefi t obligations are measured on an undiscounted basis and are expensed as the related service is provided. The Group recognises a liability and an expense for bonuses, which are based on agreements with employees and/or consultants and according to management decisions based on Group performance goals and on individual employee performance. The Group recognises a liability where contractually obliged or where there is a past practice that has created a constructive obligation.
iv. Share-based payment transactions
The grant date fair value of share-based payment awards granted to employees and directors are recognised as an expense, with a corresponding increase in equity, over the period that the grantee unconditionally become entitled to the awards. The amount recognised as an expense in respect of share-based payment awards that are conditional upon meeting service and non-market performance conditions is adjusted to refl ect the number of awards that are expected to vest, such that the amount ultimately recognised as an expense is based on the number of awards that do meet the related service and non-market performance conditions at the vesting date. For share-based payment awards with non-vesting conditions, the grant date fair value of the share-based payment is measured to refl ect such conditions and there is no true-up for differences between expected and actual outcomes.
I. Provisions
A provision is recognised if, as a result of past event, the Group has a legal or constructive obligation that can be estimated reliably, and it is probable that an outfl ow of economic benefi ts will be required to settle the obligation. Provisions are determined by discounting the expected future cash fl ows at a pre-tax rate that refl ects current market assessments of the time value of money and the risks specifi c to the liability. The unwinding of the discount is recognised as a fi nance expense.
i. Warranties
A provision for warranties is recognised when the underlying products or services are sold. The provision is based on historical warranty data and a weighting of all possible outcomes against their associated probabilities.
ii. Legal claims
A provision for claims is recognised if, as a result of a past event, the Group has a present legal or constructive obligation and it is more likely than not that an outfl ow of economic benefi ts will be required to settle the obligation and the amount of obligation can be estimated reliably. When the value of time is material, the provision is measured at its present value.
J. Dividends
Dividends are recognised as a liability in the period in which they are declared.
Notes to the Consolidated Financial Statements

Sari
n T
ech
no
log
ies
Ltd
. | A
nn
ual
Rep
ort
201
0
53
Note 3 - Signifi cant Accounting Policies (cont’d)
K. Revenue
i. Goods sold
Revenue from the sale of goods in the course of ordinary activities is measured at the fair value of the consideration received or receivable, net of returns and discounts. Revenue is recognised when persuasive evidence exists, usually in the form of an executed sales agreement, that the signifi cant risks and rewards of ownership have been transferred to the buyer, recovery of the consideration is probable, the associated costs and possible return of goods can be estimated reliably, there is no continuing management involvement with the goods, and the amount of revenue can be measured reliably. If it is probable that discounts will be granted and the amount can be measured reliably, then the discount is recognised as a reduction of revenue as the sales are recognised.
The timing of the transfers of risks and rewards varies depending on the individual terms of the contract of sale.
ii. Services
Revenue from services rendered is recognised in profi t or loss in proportion to the stage of completion of the transaction at the reporting date.
L. Government grants
Grants from the Israeli Offi ce of the Chief Scientist of the Ministry of Trade and Industry (“OCS”) in respect of research and development projects are accounted for as forgivable loans according to IAS 20. Grants received from the OCS are recognised as a liability according to their fair value on the date of their receipt, unless on that date it is reasonably certain that the amount received will not be refunded. The amount of the liability is reexamined each period, and any changes in the present value of the cash fl ows discounted at the original interest rate of the grant are recognised in profi t or loss. The difference between the amount received and the fair value on the date of receiving the grant is recognised as a deduction of research and development expenses.
M. Lease payments
Payments made under operating leases are recognised in profi t or loss on a straight-line basis over the term of the lease, or on another systematic basis if it is more representative of the pattern of benefi ts to the lessee over time.
N. Finance income and expenses
Finance income comprises interest income on funds invested, gains on the disposal of investments, changes in the fair value of fi nancial assets at fair value through profi t or loss. Interest income is recognised as it accrues in profi t or loss, using the effective interest method. Interest income on bank deposits is accrued on a time apportioned basis on the principal outstanding and at the rate applicable.
Finance expenses comprise interest expense on borrowings, changes in the fair value of fi nancial assets at fair value through profi t or loss and impairment losses recognised on fi nancial assets. All borrowing costs are recognised in profi t or loss using the effective interest method.
Foreign currency gains and losses are reported on a net basis as either fi nancing income or fi nancing expenses depending on whether the foreign currency movement was in a net gain or net loss position.
O. Income tax
Income tax expense comprises current and deferred tax. Income tax is recognised in profi t or loss except to the extent that it relates to items recognised directly in equity or in other comprehensive income, in which case it is recognised in equity or in other comprehensive income.
Notes to the Consolidated Financial Statements

Sari
n T
ech
no
log
ies
Ltd
. | A
nn
ual
Rep
ort
201
0
54
Note 3 - Signifi cant Accounting Policies (cont’d)
O. Income tax (cont’d)
Current tax is the expected tax payable on the taxable income for the year, using tax rates enacted or substantially enacted as at the reporting date, and any adjustment to tax payable in respect of previous years.
Deferred tax is recognised in respect of temporary differences between the carrying amounts of assets and liabilities for fi nancial reporting purposes and the amounts used for taxation purposes. The following temporary differences are not provided for: goodwill not deductible for tax purposes, the initial recognition of assets or liabilities that affect neither accounting nor taxable profi t, nor differences relating to investments in subsidiaries and affi liates to the extent they will probably not reverse in the foreseeable future. The amount of deferred tax provided is based on the expected manner of realisation or settlement of the carrying amount of assets and liabilities, using tax rates enacted or substantively enacted at the balance sheet date.
A deferred tax asset is recognised for unused tax losses, tax benefi ts and deductible temporary differences, to the extent that it is probable that future taxable profi ts will be available against which they can be utilised. Deferred tax assets are reviewed at each reporting date and are reduced to the extent that is no longer probable that the related tax benefi t will be realised.
The Group may be required to pay additional tax if a dividend is distributed by companies within the Group. This additional tax was not included in the fi nancial statements, since it is the current practice of the Group companies not to distribute a dividend which creates an additional tax liability for the recipient. In such cases that a Group subsidiary is expected to distribute a dividend from profi ts involving additional tax for the Company, the Company will create a tax provision in respect to the additional tax it may be required to pay in respect of the dividend distribution. Additional taxes that arise from the distribution of dividends by the Company are recognised in profi t or loss at the same time that the liability to pay the related dividend is recognised.
P. Earnings per share
The Group presents basic and diluted earnings per share (“EPS”) data for its ordinary shares. Basic EPS is calculated by dividing the profi t or loss attributable to ordinary shareholders of the Company by the weighted average number of ordinary shares outstanding during the period. Diluted EPS is determined by adjusting the profi t or loss attributable to ordinary shareholders and the weighted average number of ordinary shares outstanding for the effects of all potentially dilutive ordinary shares, which comprise share options granted to employees, directors or other eligible parties.
Q. Segment reporting
An operating segment is a component of the Group that engages in business activities from which it may earn revenues and incur expenses, including revenues and expenses that relate to transactions with any of the Group’s other components. Operating segments’ operating results are reviewed regularly by the Group’s chief operating decision maker to make decisions about resources to be allocated to the segment and assess its performance, and for which discrete fi nancial information is available. The Group operates in only one operating segment. See Note 6.
Notes to the Consolidated Financial Statements

Sari
n T
ech
no
log
ies
Ltd
. | A
nn
ual
Rep
ort
201
0
55
Note 3 - Signifi cant Accounting Policies (cont’d)
R. New standards and interpretations not yet adopted
Other than those standards adopted as explained in Note 2E, a number of new standards, amendments to standards and interpretations are not yet effective for the year ended December 31, 2010, and have not been applied in preparing these consolidated fi nancial statements.
1. In the framework of Improvements to IFRSs 2010, published in May 2010 the IASB approved 11 amend-ments to IFRS and to one interpretation on a wide range of accounting issues. Most of the amend-ments apply to periods beginning on or after January 1, 2011 and permit early adoption, subject to the specifi c conditions of each amendment. Presented hereunder are the amendments that may be relevant to the Group and may have an effect on the fi nancial statements:
• Amendment to IAS 34 Interim Financial Reporting – Signifi cant Events and Transactions - this amendment expanded the list of events and transactions that require disclosure in interim fi -nancial statements, such as the recognition of a loss from the impairment in value of fi nancial assets and changes in the classifi cation of assets as a result of changes in their purpose or use. In addition, the materiality threshold was removed from the minimum disclosure requirements included in the standard before its amendment. This amendment is effective for annual periods beginning on or after January 1, 2011.
• Amendment to IFRS 7 Financial Instruments: Disclosures – Clarifi cation of Disclosures – This amendment requires adding an explicit declaration that the interaction between the qualita-tive and quantitative disclosures enables the users of the fi nancial statements to better assess the Group’s exposure to risks arising from fi nancial instruments. Furthermore, the clause stating that quantitative disclosures are not required when the risk is immaterial was removed, and cer-tain disclosure requirements regarding credit risk were amended while others were removed. This amendment is effective for annual periods beginning on or after January 1, 2011. Early implementation is permitted with disclosure.
2. IFRS 9 (2010), Financial Instruments – this standard is one of the stages in a comprehensive project to replace IAS 39 Financial Instruments: Recognition and Measurement (hereinafter – IAS 39) and it re-places the requirements included in IAS 39 regarding the classifi cation and measurement of fi nancial assets and fi nancial liabilities.
• In accordance with this standard, there are two principal categories for measuring fi nancial assets: amortised cost and fair value, with the basis of classifi cation for debt instruments be-ing the entity’s business model for managing fi nancial assets and the contractual cash fl ow characteristics of the fi nancial asset. In accordance with this standard, an investment in a debt instrument will be measured at amortised cost if the objective of the entity’s business model is to hold assets in order to collect contractual cash fl ows and the contractual terms give rise, on specifi c dates, to cash fl ows that are solely payments of principal and interest. All other debt assets are measured at fair value through profi t or loss. Furthermore, embedded derivatives are no longer separated from hybrid contracts that have a fi nancial asset host. Instead, the entire hybrid contract is assessed for classifi cation using the principles above. In addition, investments in equity instruments are measured at fair value with changes in fair value being recognised in profi t or loss. Nevertheless, this standard allows an entity on the initial recognition of an equity instrument not held for trading to elect irrevocably to present fair value changes in the equity instrument in other comprehensive income where no amount so recognised is ever classifi ed to profi t or loss at a later date. Dividends on equity instruments where revaluations are measured through other comprehensive income are recognised in profi t or loss unless they clearly consti-tute a return on an initial investment.
Notes to the Consolidated Financial Statements

Sari
n T
ech
no
log
ies
Ltd
. | A
nn
ual
Rep
ort
201
0
56
Note 3 - Signifi cant Accounting Policies (cont’d)
R. New standards and interpretations not yet adopted (cont’d)
• This standard generally preserves the instructions regarding classifi cation and measurement of fi nancial liabilities that are provided in IAS 39. Nevertheless, unlike IAS 39, IFRS 9 (2010) requires as a rule that the amount of change in the fair value of fi nancial liabilities designated at fair value through profi t or loss, other than loan grant commitments and fi nancial guarantee contracts, attributable to changes in the credit risk of the liability be presented in other comprehensive income, with the remaining amount being included in profi t or loss. However, if this requirement aggravates an accounting mismatch in profi t or loss, then the whole fair value change is presented in profi t or loss. Amounts thus recognised in other comprehensive income may never be reclassifi ed to profi t or loss at a later date. This new standard also eliminates the exception that allowed measuring at cost, derivative liabilities that are linked to and must be settled by delivery of an unquoted equity instrument whose fair value cannot be reliably measured. Such derivatives are to be measured at fair value.
• This standard is effective for annual periods beginning on or after January 1, 2013 but may be applied earlier, subject to providing disclosure and at the same time adopting other IFRS amendments as specifi ed in this standard. This standard is to be applied retrospectively other than in a number of exceptions as indicated in the transitional provisions included in this standard. In particular, if an entity adopts this standard for reporting periods beginning before January 1, 2012 it is not required to restate prior periods. The Group has not yet commenced examining the effects of adopting this standard on the fi nancial statements.
3. IAS 24 (2009) Related Party Disclosures - this new standard includes changes in the defi nition of a re-lated party and changes with respect to disclosures required by entities related to government. This standard is to be applied retrospectively for annual periods beginning on or after January 1, 2011. The Group is in the process of reassessing its relationships with related parties for the purpose of examin-ing the effects of adopting this standard on its fi nancial statements.
Note 4 - Determination of Fair Values
A number of the Group’s accounting policies and disclosures require the determination of fair value, for both fi nan-cial and non-fi nancial assets and liabilities. Fair values have been determined for measurement and/or disclosure purposes based on the following methods. When applicable, further information about the assumptions made in determining fair values is disclosed in the notes specifi c to that asset or liability.
A. Property, plant and equipment
The fair value of property, plant and equipment recognised as a result of a business combination is based on market values. The market value of property is the estimated amount for which a property could be exchanged on the date of valuation between a willing buyer and a willing seller in an arm’s length transaction after proper marketing wherein the parties had each acted knowledgeably and willingly. The fair value of items of property, plant and equipment is based on the market approach and cost approaches using quoted market prices for similar items when available and replacement cost when appropriate.
B. Intangible assets
The fair value of patents and trademarks acquired in a business combination [or otherwise] is based on the discounted estimated royalty payments that have been avoided as a result of the patent or trademark being owned. The fair value of other intangible assets is based on the discounted cash fl ows expected to be derived from the use and eventual sale of the assets.
C. Trade and other receivables
The fair value of trade and other receivables is estimated as the present value of future cash fl ows, discounted at the market rate of interest at the reporting date. This fair value is determined for disclosure purposes.
Notes to the Consolidated Financial Statements

Sari
n T
ech
no
log
ies
Ltd
. | A
nn
ual
Rep
ort
201
0
57
Note 4 - Determination of Fair Values (cont’d)
D. Non-derivative fi nancial liabilities
Fair value, which is determined for disclosure purposes, is calculated based on the present value of future principal and interest cash fl ows, discounted at the market rate of interest at the reporting date.
E. Share-based payment transactions
The fair value of the options granted is measured using a lattice based valuation, taking into account the terms and conditions upon which the options were granted.
Measurement inputs include share price on measurement date, expected volatility, expected employee turnover rate, employee exercise behaviour, risk free interest rate and expected dividend.
Note 5 - Financial Risk Management
The Board of Directors has overall responsibility for the establishment and oversight of the Group’s risk management framework. The Board’s policy is to maintain a strong capital base, so as to maintain investor and market confi dence and to sustain future development of the business. The Group has exposure to the following risks from its use of fi nancial instruments:
• credit risk;• liquidity risk; and• market risk
This note presents information about the Group’s exposure to each of the above risks, the Group’s objectives, policies and processes for measuring and managing risk, and the Group’s management of capital. Further quantitative disclosures are included throughout these consolidated fi nancial statements.
The Group’s risk management policies are established to identify and analyze the risks faced by the Group, to set appropriate risk limits and controls, and to monitor risks and adherence to limits. Risk management policies and systems are reviewed regularly to refl ect changes in market conditions and the Group’s activities. The Group, through its training and management standards and procedures, aims to develop a disciplined and constructive control environment in which all employees understand their roles and obligations.
The Group’s Audit Committee oversees how management complies with the Group’s risk management policies and reviews the adequacy of the risk management framework in relation to the risks faced by the Group. The Audit Committee is assisted in its oversight role by Internal Audit. Internal Audit undertakes both regular and ad hoc reviews of risk management controls and procedures, the results of which are reported to the Audit Committee.
Credit risk
Credit risk is the risk of fi nancial loss to the Group if a customer or counterparty to a fi nancial instrument fails to meet its contractual obligations, and arises principally from the Group’s receivables from customers and investment securities.
Management has a credit policy in place and the exposure to credit risk is monitored on an ongoing basis. The Group does not require collateral in respect of fi nancial assets. The Group has established credit limits for customers and monitors their balances regularly. Cash and deposits are placed with banks and fi nancial institutions, which are regulated.
The Group’s exposure to credit risk is infl uenced mainly by the individual characteristics of each customer. However, management also considers the demographics of the Group’s customer base, including the default risk of the industry and country in which customers operate, as these factors may have an infl uence on credit risk, particularly in deteriorating economic circumstances.
Notes to the Consolidated Financial Statements

Sari
n T
ech
no
log
ies
Ltd
. | A
nn
ual
Rep
ort
201
0
58
Note 5 - Financial Risk Management (cont’d)
The Group establishes an allowance for impairment that represents its estimate of incurred losses in respect of trade and other receivables and investments. The main components of this allowance are specifi c loss component that relates to individually signifi cant exposures, and a collective loss component established for groups of similar assets in respect of losses that have been incurred but not yet identifi ed. The collective loss allowance is determined based on historical data of payment statistics for similar fi nancial assets.
At the balance sheet date, cash and cash equivalents and short-term investments were mainly held with two banks, thereby exposing the Group to signifi cant concentrations of credit risk. However, management considers that the credit rating of the banks reduces the risk to the Group to an acceptable level. The fair values of cash and cash equivalents, trade and other receivables, short-term investments, trade and other payables and short term bank loans are not materially different from their carrying amounts because of the immediate or short-term maturity of these instruments.
In addition, the Group’s policy is to provide fi nancial guarantees only to wholly-owned subsidiaries. At December 31, 2010 and 2009, no guarantees were outstanding.
Liquidity risk
Liquidity risk is the risk that the Group will encounter diffi culty in meeting the obligations associated with its fi nancial liabilities that are settled by delivering cash or another fi nancial asset. The Group’s approach to managing liquidity is to ensure, by investing in bank deposits only, that it will always have suffi cient liquidity to meet its liabilities when due, under both normal and stressed conditions, without incurring unacceptable losses or risking damage to the Group’s reputation.
Market risk
Market risk is the risk that changes in market prices, such as foreign exchange rates, interest rates and equity prices will affect the Group’s income or the value of its holdings of fi nancial instruments. The objective of market risk management is to manage and control market risk exposures within acceptable parameters, while optimizing the return. This is achieved by not investing in equities and by investing in either US dollars, New Israeli Shekel (NIS) and Indian Rupees quoted fi nancial assets only, in ratios which refl ect the exposure of the Group to these currencies.
The Group is exposed to currency risk on sales and expenses that are denominated in a currency other than the respective functional currencies of Group entities. The Group is mainly exposed to movement in exchange rates of the US dollar in relation to the NIS with regard to salaries paid in NIS.
The Group’s exposure to market risk for changes in interest rates relates primarily to cash and cash equivalents and short-term investments.
Note 6 - Operating Segments
The Group is a worldwide leader in the development, manufacturing, marketing and sale of precision technology products for the planning, processing, evaluation and measurement of diamonds and gems. India is the principal market for these products. In accordance with IFRS 8, the Group determines and presents operating segments based on the information that is provided internally to the CEO, who is the Group’s chief operating decision maker. The measurement of operating segment results is generally consistent with the presentation of the Group’s Consolidated Statements of Comprehensive Income. The Group operates in only one operating segment. Presented below are revenues broken out by geographic distribution (India, Europe, Africa, Europe, India, North America and Other). The majority of the Group’s non-current assets are located in Israel.
Notes to the Consolidated Financial Statements

Sari
n T
ech
no
log
ies
Ltd
. | A
nn
ual
Rep
ort
201
0
59
Note 6 - Operating Segments (cont’d)
India Africa EuropeNorth
America Other1 Consolidated2010 2010 2010 2010 2010 2010
US$ thousandsExternal revenues 36,037 2,394 1,588 890 4,754 45,663
Unallocated expenses 31,233
Profi t from operations 14,430 Net fi nance expense (18)Share of loss of equity accounted investees (563)Income tax expense (2,738)Profi t for the year 11,111
India Africa EuropeNorth
America Other1 Consolidated2009 2009 2009 2009 2009 2009
US$ thousandsExternal revenues 16,934 705 664 813 2,266 21,382
Unallocated expenses 19,231
Profi t from operations 2,151 Net fi nance income 181 Share of loss of equity accounted investees (728)Income tax expense (76)Profi t for the year 1,528
1 Other external revenues represent sales to the rest of the world. For the years ended December 31, 2010 and 2009, revenue in Israel was of
US$ 1,626 thousand and US$ 885 thousand, respectively, and is included in other external revenues.
Note 7 - Acquisition of Subsidiary
Business combination
In 2008 the Company acquired all of the shares in Galatea Ltd. for a total consideration of US$ 11,989 thousand. Galatea Ltd. is engaged in the development of a unique and innovative technology for the fully automated evaluation of internal features in diamonds. The consideration was satisfi ed as follows:
(a) US$ 9,640 thousand in cash;(b) by way of allotment and issue of 6,859,225 ordinary shares of no par value in the capital of Sarin, in the
amount of US$ 1,591 thousand (market price); and(c) additional contingent consideration to the shareholders of Galatea Ltd. upon achievement and fulfi lment of
certain future target and conditions (see also Note 25) .
The goodwill recognised on the acquisition is attributable mainly to the skills and technical talent of the acquired business’s work force, and the synergies expected to be achieved from integrating Galatea Ltd. into the Group’s existing business (see Note 13).
Notes to the Consolidated Financial Statements

Sari
n T
ech
no
log
ies
Ltd
. | A
nn
ual
Rep
ort
201
0
60
Note 8 - Revenue
Composition
Year ended December 312010 2009
US$ thousands US$ thousands
Revenue from sale of products 39,668 18,614 Revenue from maintenance and services 5,995 2,768
45,663 21,382
Note 9 - Profi t from Operations
Profi t from operations is after expenses detailed below:
A. Personnel expenses
Year ended December 312010 2009
US$ thousands US$ thousands
Salaries and allowances 9,737 7,402 Defi ned benefi t retirement plan expense (income) (see Note 24) 138 (130)Share-based payment transactions (see Note 26) 229 326
10,104 7,598
B. Other operating expenses include
Year ended December 312010 2009
US$ thousands US$ thousands
Amortisation of intangible assets 2,478 1,968 Depreciation of property, plant and equipment 981 877 Write-back of doubtful trade receivables (18) (248)Warranty provision 127 (120)
Note 10 - Net Finance (Expense) Income
Year ended December 31
2010 2009
US$ thousands US$ thousands
Interest income on fi nancial assets and bank deposit 211 345
Interest expenses* (334) (113)
Net foreign exchange gain (loss) 105 (51)
(18) 181
See also Note 25.
Notes to the Consolidated Financial Statements

Sari
n T
ech
no
log
ies
Ltd
. | A
nn
ual
Rep
ort
201
0
61
Note 11 - Income Tax Expense
Year ended December 312010 2009
US$ thousands US$ thousands
Current tax expense 3,149 1,531 Deferred tax credit (see Note 15) (76) (709)Prior years tax (335) (746)
Total income tax expense 2,738 76
Reconciliation of effective tax rateProfi t for the year 11,111 1,528 Income tax expense 2,738 76
Profi t before income tax expense 13,849 1,604
Income tax using Israel tax rate of 2010 – 25% (2009 - 26%) 3,462 417 Non-deductible expenses 640 494 Neutralisation of tax calculated in respect of the Company’s share in profi ts of equity accounted investees 140 189 Current year tax losses and benefi ts for which deferred taxes were not created 83 255 Different tax rate of foreign subsidiaries 144 155 Effects of lower tax rates arising from “Approved and Benefi ciary Enterprise” status (1,172) (12)Utilisation of tax losses and benefi ts from prior years for which deferred taxes were not created (274) (196)Taxes in respect of previous years (348) (746)Difference between income tax rate and deferred tax rate 214 -- Effect of exchange rate between dollars and NIS (343) 56 Write-down (reversal of write-down) of deferred tax asset -- (617)Changes in tax rates used for the computation of deferred taxes 198 -- Other differences (6) 81
2,738 76
A. Tax rates applicable to income not derived from approved enterprises
On July 25, 2005 the Israeli parliament, the Knesset passed the Law for the Amendment of the Income Tax Ordinance (No. 147 and Temporary Order) – 2005 (“Amendment 147”). Amendment 147 provides for a gradual reduction in the corporate tax rate in the following manner: in 2009 the tax rate was 26% and from 2010 onwards, the tax rate will be 25%. Furthermore, as from 2010, upon reduction of the corporate tax rate to 25%, real capital gains were subject to tax of 25%.
On July 14, 2009, the Law for Economic Effi ciency (Legislative Amendments for Implementation of the Economic Plan for the years 2009 and 2010), 2009, was passed by the Knesset, which provided, among other things, an additional gradual reduction in the corporate tax rate to 18% in 2016 and thereafter. Pursuant to the said amendments, the corporate tax rates applicable in the 2009 tax year and thereafter are as follows: in the 2009 tax year – 26%, in the 2010 tax year – 25%, in the 2011 tax year – 24%, in the 2012 tax year – 23%, in the 2013 tax year – 22%, in the 2014 tax year – 21%, in the 2015 tax year – 20% and in the 2016 tax year and thereafter the applicable corporate tax rate will be 18%.
The foreign subsidiaries are taxed according to tax rules in their jurisdictions.
Notes to the Consolidated Financial Statements

Sari
n T
ech
no
log
ies
Ltd
. | A
nn
ual
Rep
ort
201
0
62
Note 11 - Income Tax Expense (cont’d)
B. Tax benefi ts under the Law for the Encouragement of Industry (Taxes), 1969
The Company currently qualifi es as an “Industrial Company” under the above law. As such, it is entitled to certain tax benefi ts, mainly the right to deduct share issuance costs for tax purposes in the event of a public offering, and to amortise know-how acquired from third parties.
C. Tax benefi ts under the Law for the Encouragement of Capital Investments, 1959 (hereafter - “the Law”)
The Company has been granted “Approved Enterprise” status in respect of part of its property, plant and equipment under the Law, according to programs that were approved in 1994 (“fi rst program”) and 2002 (“second program”) and the status of a “Benefi ciary Enterprise” in respect of 2005 (“third program”) and 2007 (“fourth program”) (collectively the “Enterprises”). Income of the Company derived from the Enterprises is tax-exempt for a period of two years and is subject to a reduced tax rate of 25% for an additional fi ve years. The seven-year period of benefi ts commences in the year during which the Enterprise fi rst generates taxable income, provided that 14 years have not elapsed since the year in which the approval was granted, and 12 years have not elapsed since the year in which the Enterprise was put into operation.
The fi rst program was enacted in 1999, the second program was enacted in 2002, the third program was enacted in 2005 and the fourth program was enacted in 2007. Dividends distributed to Israeli shareholders from the “Approved and Benefi ciary Enterprise” income will be liable to a 15% withholding tax rate. The last year of benefi ts relating to the fi rst program was 2005, to the second program was 2008, to the third program is 2011 and to the fourth program is 2013. In the event of distribution of cash dividends from tax-exempt income attributed to the Enterprises, the reduced tax rate of 25% in respect of the amount distributed would have to be paid.
A wholly-owned subsidiary of the Company submitted a request in 2009 to be granted “Benefi ciary Enterprise” status in accordance with the Law. The operations of the subsidiary are located in Priority Area A. The Company has requested that 2009 be elected as the base year. Under the Law the subsidiary can elect either one of two tracks: i) that the income generated by the “Benefi ciary Enterprise” is exempt from income tax over a period of 10 years or ii) that the income generated by the “Benefi ciary Enterprise” is taxed at a reduced rate of 11.5% over a period of 10 years with additional tax benefi ts related to the distribution of dividends. In the event of distribution of cash dividends from tax-exempt income attributed to the “Benefi ciary Enterprise,” the reduced tax rate of 25% in respect of the amount distributed would have to be paid under track one, however, not under track two.
The wholly-owned subsidiary has determined the track in which income generated by the “Benefi ciary Enterprise” is taxed at a reduced rate of 11.5% over a period of 10 years, with additional tax benefi ts related to the distribution of dividends.
The benefi ts from the Company’s investment programs are dependent upon the Company fulfi lling the conditions stipulated by the Law and the regulations published there under, as well as the criteria set forth in the approval for the specifi c investment in the Company’s Enterprises.
If the Company does not comply with these conditions, the tax benefi ts may be cancelled, and the Company may be required to refund the amount of the cancelled benefi ts, with the addition of linkage differences and interest.
Deferred tax balances as at December 31, 2010 and 2009 are calculated in accordance with the new tax rates specifi ed in the aforementioned amendment.
Notes to the Consolidated Financial Statements
Sari
n T
ech
no
log
ies
Ltd
. | A
nn
ual
Rep
ort
201
0
63
Note 11 - Income Tax Expense (cont’d)
D. Amendment to the Law for the Encouragement of Capital Investments – 1959
On December 29, 2010 the Knesset approved the Economic Policy Law for 2011-2012, which includes an amendment to the Law for the Encouragement of Capital Investments – 1959 (hereinafter – “the Amendment to the Law”). The Amendment to the Law was published in the Offi cial Gazette on January 6, 2011. The Amendment to the Law is effective from January 1, 2011 and its provisions will apply to Preferred Income derived or accrued in 2011 and thereafter by a Preferred Enterprise, per the defi nition of these terms in the Amendment to the Law. Companies can choose to not be included in the scope of the Amendment to the Law and to stay in the scope of the law before its amendment until the end of the existing benefi ts period. The 2012 tax year is the last year companies can choose as the year of election, providing that the minimum qualifying investment began in 2010.
The Amendment to the Law provides that only companies in Development Area A will be entitled to the grants track and that they will be entitled to receive benefi ts under this track and under the tax benefi ts track at the same time. In addition, the existing tax benefi t tracks were eliminated (the tax exempt track, the “Ireland” track and the “Strategic” track) and two new tax tracks were introduced in their place, a Preferred Enterprise and a Special Preferred Enterprise, which mainly provide a uniform and reduced tax rate for all the company’s income entitled to benefi ts, such as: for a Preferred Enterprise – in the 2011-2012 tax years – a tax rate of 10% for Development Area A and of 15% for the rest of the country, in the 2013-2014 tax years – a tax rate of 7% for Development Area A and of 12.5% for the rest of the country, and as from the 2015 tax year – 6% for Development Area A and 12% for the rest of the country. Furthermore, an enterprise that meets the defi nition of a Special Preferred Enterprise is entitled to benefi ts for a period of 10 consecutive years and a reduced tax rate of 5% if it is located in Development Area A or of 8% if it is located in a different area.
The Amendment to the Law also provides that no tax will apply to a dividend distributed out of Preferred Income to a shareholder that is an Israeli company, for both the distributing company and the shareholder. A tax rate of 15% shall continue to apply to a dividend distributed out of Preferred Income to an individual shareholder or foreign resident, subject to double taxation prevention treaties, which means that there is no change from the existing law. Furthermore, the Amendment to the Law provides relief with respect to tax paid on a dividend received by an Israeli company from profi ts of an approved/alternative/benefi ciary enterprise that accrued in the benefi ts period according to the version of the law before its amendment, if the company distributing the dividend notifi es the tax authorities by June 30, 2015 that it is applying the provisions of the Amendment to the Law and the dividend is distributed after the date of the notice.
The Company and one of its wholly owned subsidiaries meet the conditions provided in the Amendment to the Law for the Encouragement of Capital Investments for inclusion in the scope of the tax benefi ts track. The Company and its subsidiary expect to implement the Amendment to the Law as from the 2011 tax year. Therefore, the deferred tax balances as at December 31, 2010 were adjusted by the amount of US$ 198 thousand.
E. Final tax assessments
The Company has received fi nal tax assessments (including assessments which are considered fi nal under the tax laws) for all tax years up to December 31, 2004. The Company’s wholly owned Israeli consolidated subsidiaries have received fi nal tax assessments (including assessments which are considered fi nal under the tax laws) for all tax years up to December 31, 2006. Sarin India received fi nal tax assessments for all fi scal tax years through March 31, 2007.
Notes to the Consolidated Financial Statements

Sari
n T
ech
no
log
ies
Ltd
. | A
nn
ual
Rep
ort
201
0
64
Note 12 - Property, Plant and Equipment
Computers andequipment
Demonstrationequipment
Motor vehicles
Machineryand offi ce
equipmentLeasehold
improvements Total
US$ thousands
US$ thousands
US$ thousands
US$ thousands
US$ thousands
US$ thousands
CostBalance at January 1, 2009 1,026 1,821 153 754 731 4,485 Additions 133 440 22 566 80 1,241 Disposals (377) (391) (89) (120) (446) (1,423)
Balance at December 31, 2009 782 1,870 86 1,200 365 4,303
Additions 437 261 102 758 156 1,714
Disposals (76) (484) (25) (102) (7) (694)
Balance at December 31, 2010 1,143 1,647 163 1,856 514 5,323
Depreciation Balance at January 1, 2009 822 737 44 268 486 2,357 Depreciation 147 482 10 173 65 877 Disposals (377) (212) (10) (71) (424) (1,094)
Balance at December 31, 2009 592 1,007 44 370 127 2,140
Depreciation 223 346 24 313 75 981
Disposals (74) (286) (25) (36) (6) (427)
Balance at December 31, 2010 741 1,067 43 647 196 2,694
Carrying amounts At January 1, 2009 204 1,084 109 486 245 2,128 At December 31, 2009 190 863 42 830 238 2,163
At January 1, 2010 190 863 42 830 238 2,163
At December 31, 2010 402 580 120 1,209 318 2,629
Notes to the Consolidated Financial Statements

Sari
n T
ech
no
log
ies
Ltd
. | A
nn
ual
Rep
ort
201
0
65
Note 13 - Intangible Assets
DevelopmentGoodwill costs Know-how Total
US$ thousands US$ thousands US$ thousands US$ thousands
CostBalance at January 1, 2009 995 1,261 12,841 15,097 Adjustment of goodwill (1) (588) -- -- (588) Other acquisitions – internally developed (2) -- 304 -- 304
Balance at December 31, 2009 407 1,565 12,841 14,813
Adjustment of goodwill (1) (72) -- -- (72)Other acquisitions (3) -- -- 615 615
Balance at December 31, 2010 335 1,565 13,456 15,356
AmortisationBalance at January 1, 2009 -- -- 1,223 1,223 Amortisation for the year -- 196 1,772 1,968
Balance at December 31, 2009 -- 196 2,995 3,191
Amortisation for the year -- 250 2,228 2,478
Balance at December 31, 2010 -- 446 5,223 5,669
Carrying amountAt January 1, 2009 995 1,261 11,618 13,874 At December 31, 2009 407 1,369 9,846 11,622
At January 1, 2010 407 1,369 9,846 11,622
At December 31, 2010 335 1,119 8,233 9,687
(1) For the purpose of impairment testing, goodwill is allocated to the Group’s operating division, which represents the lowest level within the
Group at which the goodwill is monitored for internal management purposes, which is not higher than the operating segment. See also Note
25.(2) See also Note 3E(vi)(3) On December 2, 2010, the Group acquired the Light Performance Technology (“LPT”) and some inventory from Overseas Diamonds
Technologies NV (“ODT”) and affi liates. Under the terms of the transaction, a wholly owned subsidiary of the Company paid US$ 650
thousand in cash (US$ 425 thousand in December 2010, with the remainder paid in the fi rst quarter of 2011), with additional contingent
consideration due in the form of royalties for a period of up to 14 years. US$ 615 thousand of the purchase price was allocated to intangible
assets, with the remaining US$ 35 thousand allocated to inventory.
Notes to the Consolidated Financial Statements

Sari
n T
ech
no
log
ies
Ltd
. | A
nn
ual
Rep
ort
201
0
66
Note 14 - Investment in Equity Accounted Investee
In the fi rst half of 2008, the Company acquired 23% of IDEX Online SA (“IDEX”) which was in the process of launch-ing a revolutionary internet B2B spot market trading platform for rough diamonds – Guaranteed Diamond Transac-tions, for a cash consideration of US$ 3.5 million.
For the year ended December 31, 2009, the Group reviewed its investment in IDEX. As a result of remaining uncertainties related to the execution of its business plan, the Company recorded an impairment charge in the amount of US$ 0.4 million which led to a which led to a total loss from equity accounted investee of US$ 0.7 million for the year ended December 31, 2009. For the year ended December 31, 2010, the Group further reviewed its investment in IDEX. As a result of continued uncertainties related to the execution of IDEX’s business plan and continued negative operating cash fl ow, the Group wrote-off its remaining investment of US$ 0.3 million in IDEX which led to a total loss from equity accounted investee of US$ 0.6 million for the year ended December 31, 2010.
Note 15 - Deferred Tax Assets
Recognised deferred tax assets are attributable to the following:
As at December 312010 2009
US$ thousands US$ thousands
Other payables and employee benefi ts 88 83 Allowance for doubtful receivables 31 55 Know-how (218) 85 Research and development expenses 585 506 Other 359 40
Total 845 769
As a result of the renewed visibility in the Group’s business activity as at December 31, 2009, the Company recorded income in 2009 of US$ 0.7 million due to the likelihood of recognition of deferred tax benefi ts to be realised in the future, which were previously written off in 2008 as a result of the operating losses incurred amidst the then challenging and uncertain period.
For the years ended December 31, 2010 and 2009, deferred tax assets in respect of tax losses in the amount ofUS$ 5.9 million and US$ 7.3 million, respectively, have not been recognised. Those tax losses are available for offsetting against future taxable income of the Company’s Israeli subsidiaries subject to compliance with the relevant tax regulations and agreement by the tax authorities. Deferred tax assets have not been recognised in respect of these tax losses because it is not probable that future taxable profi ts will be available against which the Group can utilise the benefi ts. The tax losses do not expire under current tax legislation.
As at December 31, 2010 a deferred tax liability for temporary differences in the amount of US$ 2.6 million (2009 - US$ 1.6 million) related to an investment in a subsidiary was not recognized because the Group controls whether the liability will be incurred and it is satisfi ed that it will not be incurred in the foreseeable future.
As at December 31, 2010 a deferred tax asset for temporary differences in the amount of US$ 9.1 million (2009 –US$ 8.2 million) related to investments in a subsidiary and in an equity accounted investee were not recognised because the Group is satisfi ed that it will not be incurred in the foreseeable future.
Notes to the Consolidated Financial Statements

Sari
n T
ech
no
log
ies
Ltd
. | A
nn
ual
Rep
ort
201
0
67
Note 16 - Inventories
As at December 31
2010 2009
US$ thousands US$ thousands
Raw materials and consumables 3,456 1,954
Work in progress 737 790
Finished goods 569 180
4,762 2,924
In 2010 the write-down of inventories to net realisable value amounted to US$ 0 thousand (2009 - US$ 190 thousand).
Note 17 - Trade Receivables
As at December 31
2010 2009
US$ thousands US$ thousands
Trade receivables 3,382 1,586
Allowance for doubtful receivables (242) (260)
3,140 1,326
The Group’s exposure to credit and currency risks related to trade receivables is disclosed in Note 28.
Note 18 - Other Receivables
As at December 31
2010 2009
US$ thousands US$ thousands
Institutions 79 245
Customs deposit 182 148
Advances to suppliers 164 177
Prepaid expenses 392 255
Other 144 215
961 1,040
The Group’s exposure to credit and currency risks losses related to other receivables is disclosed in Note 28.
Notes to the Consolidated Financial Statements

Sari
n T
ech
no
log
ies
Ltd
. | A
nn
ual
Rep
ort
201
0
68
Note 19 - Short-Term Investments
As at December 312010 2009
US$ thousands US$ thousands
Bank deposits (initial period three months or greater) 5,413 8,712
Bank deposits have weighted average interest rates of 0.79% at December 31, 2010 (December 31, 2009 – 0.5%).
Note 20 - Cash and Cash Equivalents
As at December 31
2010 2009
US$ thousands US$ thousands
Bank balances 5,565 2,332
Bank deposits 17,292 9,819
22,857 12,151
Bank deposits have weighted average interest rates of 1.68% at December 31, 2010 (December 31, 2009 – 0.8%). The Group’s exposure to interest rate risk is disclosed in Note 28.
Note 21 – Share Capital – The Company
As at December 312010 2009
Number of sharesAuthorised:Ordinary shares of no par value 2,000,000,000 2,000,000,000
Issued and fully paid:Ordinary shares of no par value 267,274,837 264,288,225
Dormant shares (out of the issued and fully paid share capital):Ordinary shares of no par value 126,000 --
On October 21, 2010, the Company’s shareholders approved a share buyback mandate of up to 10% of the Company’s then issued and fully paid up shares. Under the share buyback mandate, share buybacks may be made, at any time and from time to time, on and from October 21, 2010, up to the earliest of: (a) the date on which the next annual general meeting of the Company is held or required by law to be held; (b) the date on which the authority conferred by the share buyback mandate is revoked or varied by the Company in general meeting; or (c) the date on which share buybacks are carried out to the full extent mandated.
Notes to the Consolidated Financial Statements

Sari
n T
ech
no
log
ies
Ltd
. | A
nn
ual
Rep
ort
201
0
69
Note 21 – Share Capital – The Company (cont’d)
Through December 31, 2010, the Company purchased 126,000 shares at the cost of US$ 53 thousand. In accordance with Israeli Companies Law, Company shares that have been acquired and are held by the Company are dormant shares as long as they are held by the Company, and as such they do not bear any rights until they are transferred to a third party.
For the year ended December 31, 2010, the Company paid US$ 5.4 million amounting to US cents 2.05 per share.
For the years ended December 31, 2010 and 2009, 2,986,612 and 3,541,000 ordinary shares, respectively, were issued upon exercise of options for cash (see also Note 26.)
Note 22 - Earnings per share
Basic earnings per share
The calculation of basic earnings per share at December 31, 2010 was based on the profi t attributable to ordinary shareholders of US$ 11,111 thousand (2009 - US$ 1,528 thousand) and a weighted average number of ordinary shares outstanding of 265,475,499 (2009 - 261,796,293), calculated as follows:
2010 2009
Issued ordinary shares at January 1 264,288,225 260,747,225
Effect of share options exercised 1,187,274 1,049,068
Weighted average number of ordinary shares at December 31 265,475,499 261,796,293
Diluted earnings per share
The calculation of diluted earnings per share at December 31, 2010 was based on profi t attributable to ordinary shareholders of US$ 11,111 thousand (2009 - US$ 1,528 thousand) and a weighted average number of ordinary shares outstanding after adjustment for the effects of all dilutive potential ordinary shares of 269,996,787 (2009 - 263,921,385), calculated as follows:
2010 2009
Weighted average number of ordinary shares (basic) 265,475,499 261,796,293
Effect of share options on issue 4,521,288 2,125,092
Weighted average number of ordinary shares (diluted) at December 31 269,996,787 263,921,385
The average market value of the Company’s ordinary shares for purposes of calculating the dilutive effect of share options was based on quoted market prices for the period that the options were outstanding.
Notes to the Consolidated Financial Statements

Sari
n T
ech
no
log
ies
Ltd
. | A
nn
ual
Rep
ort
201
0
70
Note 23 - Other Payables
As at December 31
2010 2009
US$ thousands US$ thousands
Employees and related institutions 2,412 1,755
Advances from customers 1,049 1,783
Offi ce of Chief Scientist 215 272
Accrued expenses 657 556
Prepaid income 762 635
Amounts payable to related parties 197 30
Other -- 56
5,292 5,087
The Group’s exposure to currency and liquidity risk related to other payables are disclosed in Note 28.
Note 24 - Employee Benefi ts
A. Defi ned benefi t plan
Israeli labour laws and agreements require the Group to pay severance pay to dismissed or retiring employees (and those leaving their employment under certain other circumstances). The calculation of the severance pay liability was made in accordance with labour agreements in force and based on salary components, which, in management’s opinion, create entitlement to severance pay.
The Group’s severance pay liabilities to its Israeli employees are funded partially by regular deposits with recognised pension and severance pay funds in the employees’ names and by purchase of insurance policies.
Employee benefi ts consist of the following:
As at December 31
2010 2009
US$ thousands US$ thousands
Present value of the obligation 1,008 777
Fair value of assets 822 732
Recognised liability for defi ned benefi t obligation 186 45
The Group makes contributions to defi ned benefi t plans that provide pension benefi ts for employee upon retirement or post employment.
Notes to the Consolidated Financial Statements

Sari
n T
ech
no
log
ies
Ltd
. | A
nn
ual
Rep
ort
201
0
71
Note 24 - Employee Benefi ts (cont’d)
A. Defi ned benefi t plan (cont’d)
Expense recognised in the statements of comprehensive income
Year ended December 312010 2009
US$ thousands US$ thousands
Current service costs 30 28 Interest on obligation 47 98 Expected return on assets (45) (71)Asset return expense -- 24 Actuarial losses (gains) 31 (88)Change in employee classifi cation 75 (119)Other -- (2)
138 (130)
Cost of sales 30 8 Research and development expenses 40 (16)Selling and marketing expenses 47 (119)General and administrative expenses 21 (3)
138 (130)
Movement in present value of the defi ned benefi t obligation
As at December 312010 2009
US$ thousands US$ thousands
Defi ned benefi t obligation at January 1 777 1,319 Funded benefi ts paid -- (400)Unfunded benefi ts paid -- (117)Current service and interest costs 135 126 Actuarial losses (gain) 34 (32)Change in employee classifi cation 62 (119)
Defi ned benefi t obligation at December 31 1,008 777
Notes to the Consolidated Financial Statements

Sari
n T
ech
no
log
ies
Ltd
. | A
nn
ual
Rep
ort
201
0
72
Note 24 - Employee Benefi ts (cont’d)
A. Defi ned benefi t plan (cont’d)
Movement in the assets
As at December 312010 2009
US$ thousands US$ thousands
Fair value of the assets at January 1 732 1,079 Contributions paid 5 43 Assets return expense -- (24)Expected return on assets 45 71 Actuarial gains 3 56 Change in employee classifi cation (13) -- Funded benefi ts paid -- (495)Other 50 2
Fair value of the assets at December 31 822 732
Principal actuarial assumptions:
a) The calculations are based on the following demographic assumptions about the future characteristics of current employees who are eligible for benefi ts:i) Mortality rates are based on Ministry of Finance insurance circular 2007-1-3, refl ecting the latest
mortality assumptions in Israel, including expected future mortality improvements. ii) Disability rates are based upon table P.8 of the pension circular 6-3-2007 of the Ministry of
Finance. iii) Retirement age as per 2003 pension law, i.e. 67 for males and 64 for females (except for transition
birth years).iv) As of 2007, the following leave rate assumptions applied: leave rate for senior employees of
10% and non-manager leave rate of 13%. For senior employees it was assumed that they would always receive full severance compensation irrespective of the reason for leaving. For non-managers it was assumed that one third would leave as a result of termination, while two thirds leave on their own without entitlement to severance make-up pay.
b) The calculations are based on the following fi nancial assumptions:i) The discount rate used is based on the yield of fi xed-interest Israeli government bonds with
duration equal to the duration of the gross liabilities:
Valuation date Duration of liabilities Discount rate
December 31, 2010 6.37 1.38%
December 31, 2009 6.46 1.76%
Notes to the Consolidated Financial Statements

Sari
n T
ech
no
log
ies
Ltd
. | A
nn
ual
Rep
ort
201
0
73
Note 24 - Employee Benefi ts (cont’d)
A. Defi ned benefi t plan (cont’d)
ii) As of 2007, the future real salary increase is assumed to be 3.0% for all employees at all ages.iii) The rate of growth of the separate plan assets is assumed to be 3.0% p.a. This refl ects 4.0% expected
market return after the deduction of 1.0% management fees.
B. Defi ned contribution plan
The Group provides post-employment benefi ts under which it pays fi xed sums into a provident fund in respect of employee savings plans. The amounts deposited in the year ended December 31, 2010 amounted to US$ 246 thousand (2009 - US$ 204 thousand). In addition, the Group has a defi ned contribution plan for employees who are subject to Section 14 of the Severance Pay Law – 1963.
Note 25 – Long-Term Liabilities
As at December 31
2010 2009
US$ thousands US$ thousands
Offi ce of Chief Scientist 753 699
Other long term liabilities 215 221
968 920
The liabilities are derived from the subsidiary - Galatea Ltd. (see Note 7).
For the years ended December 31, 2010 and 2009, the subsidiary received US$ 59 thousand and US$ 481 thousand, respectively, from the OCS. For the years ended December 31, 2010 and 2009, the total liability of royalties to the OCS was reduced in the amount of approximately US$0.1 million and US$ 0.3 million, respectively, as a result of an updated forecast. For the year ended December 31, 2010, this reduction in liability was recorded in the Group’s consolidated statement of comprehensive income under fi nancial income. For the year ended December 31, 2009, this reduction in liability was recorded in the Group’s consolidated statement of comprehensive income under research and development expenses (see also Note 23).
For the years ended December 31, 2010 and 2009, the other long term liabilities representing contingent consideration to former shareholders of Galatea Ltd. was reduced in the amount of approximately US$0.1 million and US$ 0.6 million, respectively, as a result of an updated forecast. A business combination agreement may allow for adjustments to the cost of the combination that are contingent on one or more future events. If the future events do not occur or the estimate needs to be revised, the cost of the business combination shall be adjusted accordingly. Therefore, for the years ended December 31, 2010 and 2009, goodwill was adjusted accordingly and there was no impact on the consolidated statement of comprehensive income (see also Note 13).
Note 26 - Share-Based Payments
In November 2003, the Company adopted a share option plan to allot options to directors, and employees of the Company and its subsidiaries (the “2003 Plan”). Under the 2003 Plan, the Board of Directors was authorised to grant to its employees and managers 20,000,000 share options, each exercisable to one ordinary share of no par value, of the Company after the sub-division and reclassifi cation of the Company’s shares which took place on March 8, 2005. As at December 31, 2009, there were no remaining outstanding options under the 2003 Plan.
In March 2005 the Company adopted a new share option plan to allot options to directors, and employees of the Company and its subsidiaries (the “2005 Plan”). The aggregate number of ordinary shares which may be granted as options on any date, when added to the number of shares issued and issuable in respect of all options granted under all of the Company’s Plans then in force shall not exceed 15% of the issued share capital of the Company on the date preceding the date of the relevant grant.
Notes to the Consolidated Financial Statements

Sari
n T
ech
no
log
ies
Ltd
. | A
nn
ual
Rep
ort
201
0
74
Note 26 - Share-Based Payments (cont’d)
Ordinary shares which shall be issued by the Company pursuant to exercise of options granted under the 2005 Plan, entitle their holders with any and all rights attached to the Company’s ordinary shares, inter alia, the right to receive dividends, the right to participate in the distribution of the Company’s assets upon liquidation, voting rights in the Company’s General Meetings (provided that as long as the ordinary shares are being held by the trustee, such voting rights will be exercised by the trustee, according to instructions provided by the holders, and if no such instructions are provided – as per the trustee’s discretion).
Currently, the vesting periods of the options granted under the 2005 Plan range from one year following the date of grant (as such term is defi ned in the 2005 Plan) and up to four years following the date of grant (the said range may vary, inter alia, due to the exercise price of the options granted, which exercise price may be the Market Price (as such term is defi ned in the 2005 Plan) of the Company’s share, or a discount therefrom of up to 20% thereon). A total of 13,241,148 options have been granted under the 2005 Plan of which there are currently 7,296,151 outstanding and 2,986,612 options have been exercised to date (with the balance having been forfeited).
The said options shall expire at the end of six years commencing on the date of grant (or any earlier date, if such was mentioned in the grant instrument) or on cessation of employment, at the earlier of the two. Unexercised vested options can generally be exercised within 90 days of cessation of employment.
The Income Tax Authorities have recognised the 2005 Plan as a “share allotment through a trustee” plan according to Section 102 to the Tax Ordinance using the “capital gain track.” As a result, the benefi t to the Israeli employee from the option plan shall be either classifi ed as ordinary income or capital gain, all in accordance with the provisions of Section 102(b)(3) to the Tax Ordinance.
During the year ended December 31, 2010, the Company granted 260,000 options under the 2005 Plan to employees with vesting conditions of two to four years and a contractual life of six years. Movements in the number of share options outstanding and their related weighted average exercise prices are as follows:
As at December 312010 2009
Weighted Weighted average exercise average exercise price in US cents price in US cents
per share Options per share Options
Outstanding at January 1 18.4 10,057,763 18.6 9,827,500 Granted 38.2 260,000 9.5 6,009,148 Forfeited 36.2 (35,000) 20.8 (2,237,885)Exercised 17.1 (2,986,612) 2.3 (3,541,000)Outstanding at December 31 21.4 7,296,151 18.4 10,057,763
The number of share options vested at December 31, 2010 and 2009 was 5,143,651 and 2,137,000, respectively. The weighted average share price at the date of exercise for share options exercised in 2010 was US cents 46 (2009 - US cents 19).
The Company measured the fair value of the share options granted using a lattice based valuation model. The following assumptions under this method were used for the share options granted during the years ended December 31, 2010 and 2009: weighted average expected volatility of: 80.2% and 76.0%, respectively; weighted average risk-free interest rates (in US dollar terms) of 1.9% and 2.4%, respectively; dividend yield of 5.0% and 2.5%, respectively. The weighted average fair value of the share options granted during the years ended December 31, 2010 and 2009 using the model was US cents 26.8 and US cents 6.3 per share option, respectively.
Notes to the Consolidated Financial Statements

Sari
n T
ech
no
log
ies
Ltd
. | A
nn
ual
Rep
ort
201
0
75
Note 26 - Share-Based Payments (cont’d)
The average share price in 2010 was US cents 44 (2009 - US cents 16).
The following table summarizes information about stock options outstanding at December 31, 2010:
Options outstanding Options exercisable Weighted- Weighted- Weighted-
Range of average average averageexercise prices remaining exercise exerciseUS cents per share
Numberoutstanding
contractuallife (years)
priceUS cents
Numberexercisable
priceUS cents
8.5 - 12.7 4,076,111 4.4 10.0 2,431,111 8.516.6 - 28.0 1,224,040 2.3 24.2 1,124,040 24.534.2 - 40.0 906,000 2.9 36.3 646,000 34.846.6 - 51.3 1,090,000 1.9 48.7 942,500 49.1
7,296,151 3.5 21.4 5,143,651 22.7
The expenses derived from share-based payment transactions are as follows:
Year ended December 312010 2009
US$ thousands US$ thousands
Cost of sales 25 31 Research and development expenses 54 61 Sales and marketing expenses 60 53 General and administrative expenses 90 181
229 326
Note 27 - Warranty Provision
The provision for warranty relates mainly to product sales during the years ended December 31, 2010 and 2009. The provision is based on estimates made from historical warranty data associated with similar products and services. The Group expects to incur the liability over the next year.
The movement in the warranty provision is as follows:
As at December 312010 2009
US$ thousands US$ thousands
Balance at the beginning of the year 115 263 Provisions used during the year (165) (186)Provisions made during the year 292 38
Balance at the end of the year 242 115
Notes to the Consolidated Financial Statements

Sari
n T
ech
no
log
ies
Ltd
. | A
nn
ual
Rep
ort
201
0
76
Note 28 - Financial Instruments
Credit risk
Management has a credit policy in place and the exposure to credit risk is monitored on an ongoing basis. The Group does not require collateral in respect of fi nancial assets. The Group has established credit limits for customers and monitors their balances regularly. Cash and deposits are placed with banks and fi nancial institutions, which are regulated.
Exposure to credit risk
The carrying amount of fi nancial assets represents the maximum credit exposure. The maximum exposure to credit risk at the reporting date was:
Carrying amount2010 2009
US$ thousands US$ thousands
Short-term investments 5,413 8,712 Trade receivables 3,140 1,326 Cash and cash equivalents 22,857 12,151
31,410 22,189
The maximum exposure to credit risk for trade receivables at the reporting date by geographic region was:
Carrying amount2010 2009
US$ thousands US$ thousands
India 2,452 728 Europe 97 60 North America 41 80 Africa 52 1 Other 498 457
3,140 1,326
Impairment losses
The aging of trade receivables at the reporting date was:
Gross Impairment Gross Impairment2010 2010 2009 2009
US$ thousands US$ thousands US$ thousands US$ thousands
Not past due 2,116 -- 1,039 -- Past due 0-30 days 721 -- 152 -- Past due 31-90 days 112 -- 76 -- More than 90 days 433 (242) 319 (260)
3,382 (242) 1,586 (260)
Notes to the Consolidated Financial Statements

Sari
n T
ech
no
log
ies
Ltd
. | A
nn
ual
Rep
ort
201
0
77
Note 28 - Financial Instruments (cont’d)
Impairment losses (cont’d)
The movement in the allowance for impairment in respect of trade receivables during the year was as follows:
2010 2009US$ thousands US$ thousands
Balance at January 1 260 508 Impairment gain recognised (18) (248)
Balance at December 31 242 260
Exposure to currency risk
The Group’s exposure to foreign currency risk was as follows based on notional amounts translated into US$ thousands as at December 31, 2010 and 2009:
December 31, 2010 December 31, 2009NIS Rupee Euro NIS Rupee Euro
Cash and cash equivalents 6,318 1,419 -- 7,176 490 --Trade receivables 308 573 -- 231 282 -- Other receivables 574 234 31 674 298 -- Trade payables (1,750) (100) (20) (1,405) -- (7)Other payables (3,146) (1,433) -- (1,619) (1,070) -- Net balance sheet exposure 2,304 693 11 5,057 -- (7)
The following signifi cant exchange rates applied during the year:
Average rate As at December 312010 2009 2010 2009
Euro 1 0.754 0.719 0.749 0.694NIS 1 3.733 3.933 3.549 3.775Rupee 1 45.76 48.44 44.81 46.68
The Group is mainly exposed to movement in exchange rates of the US dollar in relation to the NIS with regards to employee compensation and other expenses paid in NIS. Management expects that the Group expenses in NIS for 2011 will be approximately US$12 million, primarily related to employee compensation. For the year ended December 31, 2010, the Group maintained its portion of cash and cash equivalents held in NIS (equivalent to US$ 6.3 million at December 31, 2010 (US$ 6.6 million in 2009)) to match its anticipated NIS linked expenses.
Notes to the Consolidated Financial Statements

Sari
n T
ech
no
log
ies
Ltd
. | A
nn
ual
Rep
ort
201
0
78
Note 28 - Financial Instruments (cont’d)
Exposure to currency risk (cont’d)
Currency riskLoss in US$ thousands
(statement of comprehensive income)
Decrease of 5% 285Decrease of 10% 570Decrease of 15% 855
Interest rate risk
The Group’s exposure to market risk for changes in interest rates relates primarily to cash and cash equivalents and short-term investments.
Cash and cash equivalents and short-term investments at December 31, 2010 amounted to US$ 28.3 million. Due to the short-term nature of these instruments and due to the low level of market interest rates, management believes that there is no material exposure to interest rate risk in 2011.
Fair values
The fair values of cash and cash equivalents, trade and other receivables, short-term investments, trade and other payables are not materially different from their carrying amounts because of the immediate or short-term maturity of these instruments.
Note 29 - Commitments
A. Operating lease commitments
The total future minimum lease payments of the Group, under non-cancellable operating leases in respect of properties and motor vehicles, are payable as follows:
As at December 312010 2009
US$ thousands US$ thousands
Payable within: 1 year 535 367 2 to 5 years 320 191
855 558
During the year ended December 31, 2010, US$ 807 thousand was recognised as an expense in the statement of comprehensive income in respect of operating leases (2009 - US$ 562 thousand).
Notes to the Consolidated Financial Statements

Sari
n T
ech
no
log
ies
Ltd
. | A
nn
ual
Rep
ort
201
0
79
Note 29 - Commitments (cont’d)
B. The Group is committed to pay royalties at the rate of 3%-3.5% to the OCS on sales proceeds from products for which it received grants up to an amount not exceeding the grants received (linked to the exchange rate of the US dollar). The total grants received, net of royalties paid to the OCS, excluding Galatea, was approximately US$ 1.1 million through December 31, 2010. As the technology related to these grants was not successful, it is probable that these royalties will not be paid and therefore no liability was recorded. The total grants received by Galatea Ltd. were approximately US$ 1.6 million through December 31, 2010. The Group has recorded a provision in the Consolidated Balance Sheets in the amount of US$ 1.0 million to refl ect the fair-value associated with the expected royalty payments (See Note 23 and Note 25).
C. A subsidiary undertook to pay royalties from the sales of diamond polishing discs to three entities (one of which is a company controlled by a related party). The aggregate percentage of such royalties ranges between 5.5% and 9% of the net sales proceeds of the subsidiary from such discs (according to the annual net sales of such products). Such royalties (if any) shall be due over varying periods ending on December 31, 2009, December 31, 2011 and December 31, 2014. As no net sales were realised as of December 31, 2010, no royalties have yet been paid.
D. On March 21, 2005, the Company signed an agreement with a third party for the design and development of a prototype product based on product intellectual property owned by the third party, including a technology license in respect of said product. The agreement contains provisions for payment of royalties, including minimum royalties during the term of the agreement, and is subject to the successful completion of the product testing. No provision for such royalties has been recorded in the consolidated fi nancial statements as the product has not reached commercial feasibility.
E. On December 2, 2010, a subsidiary of the Company acquired LPT. Under the terms of the agreement, the subsidiary may be required to pay additional contingent consideration due in the form of royalties for a period of up to 14 years based on net sales as defi ned in the agreement. See Note 13.
F. See Note 29C and 31 for contractual obligations to related parties.
Note 30 - Contingencies
The Company has submitted a claim for patent infringement, regarding laser markings, against OGI Systems Ltd. (OGI) and OGI Systems Europe BVBA in Belgium. OGI has submitted a counter-claim against the Company. The counter-claim aims primarily at having Sarin’s patent in Belgium revoked. Based on legal advice, the Group does not expect the outcome of this counter-claim to have a material effect on the Group’s fi nancial position.
Note 31 - Related Parties
There were the following signifi cant related party transactions between the Group and parties which are subject to common control or common signifi cant infl uence during the year carried out in the normal course of business on terms agreed between the parties.
Remuneration of key management personnel
Year ended December 312010 2009
US$ thousands US$ thousands
Remuneration of key management personnel and directors Fixed income-based 495 365 Share-based payments 78 138 Other performance based incentives 504 120
1,077 623
Notes to the Consolidated Financial Statements

Sari
n T
ech
no
log
ies
Ltd
. | A
nn
ual
Rep
ort
201
0
80
Note 31 - Related Parties (cont’d)
Remuneration of key management personnel (cont’d)
Pursuant to an Extraordinary General Meeting of the Company’s shareholders held on July 7, 2009, three directors (including the CEO) were granted 1,050,000 options to purchase ordinary shares of the Company, exercisable upon the payment of S$ 0.197 per share (at the then Market Price – as such term is defi ned in the 2005 Plan). The fair value of the options granted was US$ 0.073 per share at the grant date. These options were subsequently exercised during the year ended December 31, 2010.
Other related party transactions
On September 3, 2009, the Company leased 224 square meters of offi ce space in the Israeli Diamond Exchange building, from a company controlled by an interested party. The lease is for a period of 24 months, with an option (at the Company’s discretion) to extend the lease period by an additional 24 month period. The monthly rent during the initial six month period was US$ 4,855 per month and thereafter is US$ 7,832. The monthly rent during the option period is US$ 8,615 per month. The lessor may terminate the lease at any time on notice of fi ve months to the Company. For the year ended December 31, 2010, the annual rent paid was approximately US$ 85 thousand.
Note 32 - Group Entities
The following subsidiaries have been included in the consolidated fi nancial statements:
Effective equityinterest held bythe Group as at
Place of December 31Incorporation 2010 and 2009
%
Galatea Ltd. Israel 100%Sarin Color Technologies Ltd. Israel 100%Sarin Polishing Technologies Ltd. Israel 100%Sarin Technologies India Private Ltd. India 100%Sarin Hong Kong Ltd. Hong Kong 100%SUSNY LLC New York State 100%
Note 33 – Subsequent Events
The Board of Directors recommended, on February 23, 2011, a dividend of US cent 0.75 per share for the year ended December 31, 2010. Pursuant to the approval of the AGM of the Company’s shareholders in April 2011, the Company expects to pay a US$ 2.0 million dividend on May 26, 2011, with Books Closure Date on May 6, 2011.
The Board of Directors recommended, on February 23, 2011, to grant 2,250,000 options to purchase ordinary shares to certain directors of the Company. The grant of the options is subject to the approval of the AGM and EGM of the Company’s shareholders in April 2011. On March 1, 2011, the Company’s Board of Directors granted 3,020,000 options to employees to purchase ordinary shares at an exercise price of S$ 0.44.
Notes to the Consolidated Financial Statements

Sari
n T
ech
no
log
ies
Ltd
. | A
nn
ual
Rep
ort
201
0
81
Shareholdings StatisticsAs at 16 March 2011
Issued and fully paid-up - 267,800,049No. of Dormant Shares - 694,000Class of shares - ordinary shares of no par value Voting rights - on a show of hands, by written ballot or by any other means : 1 vote for each ordinary share
ANALYSIS OF SHAREHOLDINGS
No. of Shareholders No. of SharesRange of Shareholdings % %1 - 999 5 0.84 569 0.00
1,000 - 10,000 336 56.76 1,863,722 0.7010,001 - 1,000,000 234 39.53 15,733,000 5.87
1,000,001 and above 17 2.87 250,202,758 93.43592 100.00 267,800,049 100.00
Shareholdings Held in Hands of Public
Based on information available to the Company as at 16 March 2011, approximately 32.94% of the issued ordinary shares of the Company is held by the public and therefore, Rule 723 of the Listing Manual issued by Singapore Exchange Securities Trading Limited is complied with.
TOP 20 SHAREHOLDERS
No. Name of Shareholder No. of Shares %
1 Sarin Research & Development Ltd 99,830,000 37.37 2 Interhightech (1982) Ltd 46,000,000 17.22 3 HSBC (Singapore) Nominees Pte Ltd 29,628,451 11.09 4 Citibank Nominees Singapore Pte Ltd 16,309,000 6.11 5 Asdew Acquisitions Pte Ltd 12,338,000 4.62 6 DBS Nominees Pte Ltd 11,315,693 4.24 7 Eyal Avraham Khayat 6,808,494 2.55 8 Kim Eng Securities Pte. Ltd. 6,140,605 2.30 9 DBSN Services Pte Ltd 5,697,379 2.13
10 Raffl es Nominees (Pte) Ltd 4,651,000 1.74 11 CIMB Securities (S) Pte Ltd 2,677,000 1.00 12 UOB Kay Hian Pte Ltd 2,165,000 0.81 13 Teo Khiam Chong 2,000,000 0.75 14 OCBC Securities Private Ltd 1,203,136 0.45 15 Soh Cheng Lin 1,200,000 0.45 16 Yim Ah Hoe 1,200,000 0.45 17 Royal Bank Of Canada (Asia) Ltd 1,039,000 0.39 18 Chang Wei Chian Benjamin 1,000,000 0.37 19 Chua Siok Lan 853,000 0.32 20 Toh Thien Yam 380,000 0.14
252,435,758 94.50
** The percentage of issued ordinary shares is calculated based on the number of issued ordinary shares of the company as at 16 March 2011, excluding 694,000 ordinary shares held as dormant shares as at that date.

Sari
n T
ech
no
log
ies
Ltd
. | A
nn
ual
Rep
ort
201
0
82
Shareholdings StatisticsAs at 16 March 2011
Directors’ Interests in Shares of the Company
Name of Director Shareholdings in the name of the Director
Shareholdings in which the Director is deemed to have an interest
As at 1 January
2010
As at 31 December
2010
As at 21 January
2011
As at 1 January
2010
As at 31 December
2010
As at 21 January
2011Daniel Benjamin Glinert1. -- -- -- 46,750,000 47,100,000 47,100,000Avraham Eshed2. -- -- -- -- 150,000 150,000Ehud Harel3. -- -- -- 99,830,000 99,830,000 99,830,000Uzi Levami4. -- -- -- 46,000,000 46,350,000 46,350,000Eyal Mashiah5. -- -- -- -- 1,200,000 1,200,000Hanoh Stark6. -- -- -- 99,830,000 100,180,000 100,180,000
SUBSTANTIAL SHAREHOLDERS
Direct Interest Deemed InterestName No. of Shares %* No. of Shares %*
Sarin Research & Development Ltd 99,830,000 37.37 - -Interhightech (1982) Ltd 46,000,000 17.22 - -Hanoh Stark 1 - - 100,180,000 37.51Ehud Harel 2 - - 99,830,000 37.37Daniel Benjamin Glinert 3 - - 47,100,000 17.63Aharon Shapira 4 - - 46,000,000 17.22Gilad Moran 5 - - 46,000,000 17.22Uzi Levami 6 - - 46,350,000 17.35Chartered Asset Management Pte. Ltd.7 - - 15,686,000 5.87Capital Growth Investments Pte Ltd7 - - 15,686,000 5.87Colin Lee Yung-Shih7 - - 15,686,000 5.87Low Siew Kheng7 - - 15,686,000 5.87Fisher Funds Management Ltd. 8 - - 13,574,000 5.08
*The percentage of issued ordinary shares is calculated based on the number 267,800,049 of issued ordinary shares of the company as at 16 March 2011, excluding 694,000 ordinary shares held as dormant shares as at that date.
1 Hanoh Stark is deemed interested in the shares by virtue of his holdings (through Hanoh Stark Holdings Ltd.) of more than 20% of the issued share capital of Sarin Research and Development Ltd. and by virtue of his indirect ownership of 350,000 shares held on his behalf by Eyal Khayat trustee 2005 Option Plan.
2 Ehud Harel is deemed interested in the shares by virtue of his holdings (through Hargem Ltd.) of more than 20% of the issued share capital of Sarin Research and Development Ltd.
3 Daniel Benjamin Glinert is deemed interested in the shares by virtue of his holdings (through D. Glinert Holdings Ltd.) of more than 20% of the issued share capital of Interhightech (1982) Ltd., by virtue of his indirect ownership of 350,000 shares held on his behalf by Eyal Khayat trustee 2005 Option Plan. and by virtue of his indirect ownership of 750,000 shares held on his behalf by UOB Kay Hian Pte. Ltd.
4 Aharon Shapira is deemed interested in the shares by virtue of his holdings (through A. Shapira 2000 Systems Ltd.) of more than 20% of the issued share capital of Interhightech (1982) Ltd.
5 Gilad Moran is deemed interested in the shares by virtue of his holdings (through Moran Hightech Ltd.) of more than 20% of the issued share capital of Interhightech (1982) Ltd.
6 Uzi Levami is deemed interested in the shares by virtue of his holdings (through U Lev-Ami Holdings, Ltd.) of more than 20% of the issued share capital of Interhightech (1982) Ltd. and by virtue of his indirect ownership of 350,000 shares held on his behalf by Eyal Khayat trustee 2005 Option Plan.
7 Chartered Asset Management Pte. Ltd. notifi ed the Company that it, as well, as its associates, Capital Growth Investments Pte. Ltd., Mr. Colin Lee Yung-Shih and Ms. Low Siew Kheng, are deemed interested in the shares as investment managers acting for various funds and clients.
8Fisher Funds Management Ltd. notifi ed the Company that it is deemed interested in the shares as an investment manager acting for various funds and clients.

Sari
n T
ech
no
log
ies
Ltd
. | A
nn
ual
Rep
ort
201
0
83
Notice of Annual General Meeting
NOTICE IS HEREBY GIVEN THAT the Annual General Meeting of the Company will be held at the offi ces of Eyal Khayat, Zolty, Neiger & Co., Law Offi ces, 9 Hamenofi m Street, Eleventh Floor Herzliya Pituach, Israel [See Explanatory Note (a)] on the 27th day of April 2011 at 10.00 A.M. Israel time (3:00 PM Singapore time) to transact the following business :-
Ordinary Business
1. To receive and consider the audited accounts for the year ended 31 December 2010 and the reports of the Directors and Auditors thereon.
2. To declare a fi nal dividend of US cent 0.75 (gross) per share less tax (as applicable) for the year ended 31 December 2010.
3. To re-elect the following retiring Directors of the Company
a. Daniel Benjamin Glinertb. Uzi Levami c. Eyal Mashiahd. Avraham Eshede. Ehud Harelf. Hanoh Stark g. Chan Kam Loon [see Explanatory Note (b)]h. Yehezkel Pinhas Blum [see Explanatory Note (b)]i. Valerie Ong Choo Lin [see Explanatory Note (b)]
4. To approve Directors’ fees of up to US$ 1,000,000 for the year ending 31 December 2011 (for the year ended on 31 December 2010: US$ 1,000,000) [See Explanatory Note (c)] and the grant of up to 1,350,000 options to Directors, under the Company’s 2005 Share Option Plan. [See Explanatory Note (d)]
5. To re-appoint Somekh Chaikin Certifi ed Public Accountants (Isr.), Member fi rm of KPMG International and Chaikin, Cohen & Rubin, Certifi ed Public Accountants (Isr.) as external auditors and to authorise the Directors to fi x their remuneration.
Special Business
6. To consider and, if thought fi t, to pass the following shareholders’ resolutions with or without amendments [see Explanatory Note (e)]:-
6.1 Authority to issue shares
That authority be given to the Directors to issue and allot shares in the Company whether by way of rights, bonus or otherwise (including but not limited to the issue and allotment of shares at any time, whether during the continuance of such authority or thereafter, pursuant to offers, agreements or options made or granted by the Company while this authority remains in force) by the Directors, or otherwise disposal of shares (including making and granting offers, agreements and options which would or might require shares to be issued, allotted or otherwise disposed of, whether during the continuance of such authority or thereafter) by the Directors at any time to such persons (whether or not such persons are shareholders), upon such terms and conditions and for such purposes as the Directors may in their absolute discretion deem fi t PROVIDED THAT:
the aggregate number of shares to be issued pursuant to such authority shall not exceed 50% of the issued (i) shares in the capital of the Company (as calculated in accordance with paragraph (ii) below), of which the aggregate number of shares and convertible securities issued other than on a pro rata basis to existing shareholders must not be more than 20% of the total issued shares in the capital of the Company;
(subject to such calculation as may be prescribed by the Singapore exchange Securities Trading Limited) for (ii) the purpose of determining the aggregate number of shares that may be issued under paragraph (i) above, the total number of issued shares shall be based on the number of issued shares in the capital of the Company at the time this resolution is passed after adjusting for new shares arising from the conversion or exercise of convertible securities or new shares arising from exercising share options or vesting of share awards outstanding or subsisting at the time this resolution is passed and any subsequent bonus issue, consolidation or subdivision of the Company’s shares;

Sari
n T
ech
no
log
ies
Ltd
. | A
nn
ual
Rep
ort
201
0
Notice of Annual General Meeting
unless revoked or varied by the Company in a general meeting, such authority shall continue in full force until (iii) the conclusion of the next Annual General Meeting of the Company or the date by which the next Annual General Meeting of the Company is required by law to be held, whichever is the earlier. [See Explanatory Note (f)]
6.2 Authority to offer and grant options and issue shares pursuant to the Sarin Technologies Ltd 2005 Share Option Plan
That the Directors of the Company be and are hereby authorised to offer and grant options in accordance with the provisions of the Sarin Technologies Ltd 2005 Share Option Plan (the “Plan”) and to allot and issue from time to time such number of shares in the capital of the Company as may be required to be issued pursuant to the exercise of options under the Plan provided always that the aggregate number of such shares to be issued pursuant to the Plan and any other share option schemes of the Company for the time being in force shall not exceed 15% of the issued shares in the capital of the Company from time to time; and offer and grant options with exercise price (as defi ned in the Plan) set at a discount to the market price (as defi ned in the Plan) provided that such discount shall not exceed the maximum discount allowed under the Plan. [See Explanatory Note (g)]
7. To transact any other business which may properly be transacted at an Annual General Meeting.
BY ORDER OF THE BOARD
AMIR JACOB ZOLTYCompany Secretary
Israel,12 April 2011
Proxies :-
A member entitled to attend and vote at the meeting is entitled to appoint a proxy to attend and vote in his stead. A proxy need not be a member of the Company.
An instrument appointing a proxy must be deposited at the offi ce of the Company’s main offi ces in Israel or at the Singapore Share Transfer Agent at 138 Robinson Road #17-00 The Corporate Offi ce Singapore 068906 not less than 24 hours before the time fi xed for the meeting.
84

Sari
n T
ech
no
log
ies
Ltd
. | A
nn
ual
Rep
ort
201
0
85
Notice of Annual General Meeting
Explanatory Notes :-
(a) Singapore shareholders who wish to take part in the Annual General Meeting from Singapore may do so by attending at the Levels 30 Boardroom, 6 Battery Road, Singapore 049909 at 15:00 (3:00 PM) Singapore time on said day (April 27, 2011). The persons attending the said video/audio conference will be able to pose questions to the Company and to comment on the Company’s reports. It should be noted, however, that only persons who shall actually attend the Annual General Meeting in Israel (whether in person or via proxy) may vote in the Annual General Meeting.
(b) Article 37(c) of the Company’s Articles of Association provides that: “Each Director shall serve, subject to Articles 39 and 40 hereof, and unless the Annual General Meeting appointing
him provides otherwise, until the third Annual General Meeting following the Annual General Meeting at which such Director was appointed, or his earlier removal pursuant to this Article 37. A Director who has completed his term of service or has been removed as aforesaid (a “retiring Director”) shall be eligible for re-election.”
All of the Company’s Directors (other than Mr. Uzi Levami, who was appointed by the Annual General Meeting held on 27 April 2009) were appointed by the Annual General Meeting held on 28 April 2008. Therefore, it is proposed to re-appoint the current Directors of the Company. The current (and proposed) Directors’ CVs may be found in the Company’s Annual Report.
Mr Chan Kam Loon, if re-elected, will remain as Chairperson of the Audit Committee and will be regarded as an independent director. Ms Valerie Ong Choo Lin and Mr Yehezkel Pinhas Blum, if re-elected, will remain as members of the Audit Committee and will be considered as independent directors.
(c) The Board of Directors of the Company appointed Mr. Uzi Levami as Chief Executive Offi cer of the Company on February 22, 2009, in addition to his position as an Executive Director (as of December 11, 2008 and ratifi ed by the AGM on April 27, 2009). As such, the Directors’ fees reported for 2010 and requested for 2011 signifi cantly differ than in previous years, as inasmuch as they refl ect both the fees of the Executive Directors, Non-Executive Directors, Independent Directors and the compensation of the Chief Executive Offi cer of the Company. Mr. Levami’s CV may be found in the Company’s Annual Report both under Board of Directors and Key Management sections. The fees requested for 2010 (US$ 850,000) were, in reality, exceeded by US$ 150,000 and tallied US$ 1,000,000, as the net profi ts for the 2010 far exceeded the Board’s expectations, and thus the incentive-related compensation to the CEO and Executive Directors exceeded the Board’s expectations as requested at last year’s AGM. The fees requested for 2011 refl ect reserve for incentive-related compensation for the CEO and Executive Directors based on commercial goals now set for the coming year, which incentive-related compensation shall be paid upon and subject to reaching those goals.
(d) The Company’s Board of Directors, Audit Committee and Remuneration Committee have resolved to grant options, under the Company’s 2005 Share Option Plan to certain Directors of the Company, as follows:
(i) 300,000 options to each of Messrs. Avraham Eshed and Eyal Mashiah.
(ii) 250,000 options to each of Messrs. Philip Chan Kam Loon, Yehezkel Pinhas Blum and Valerie Ong.
It was further resolved that the exercise price of these options shall be at a 20% discount off the Market Price (as such term is defi ned in the Plan) and that the aforementioned options shall vest upon the lapse of two years from the date of grant.
Under the applicable Israeli Companies Law, 1999, the grant of options to directors requires the approval of the Company’s General Meeting.
(e) A shareholders’ resolution shall be deemed adopted if approved by the holders of a majority of the voting power represented at the meeting in person or by proxy and voting thereon.
(f) The shareholders’ resolution set out in item 6.1 above, if passed, will empower the Directors from the date of the above meeting until the date of the next Annual General Meeting, to issue shares in the Company. The maximum number of shares which the Directors may issue under this resolution shall not exceed the quantum set out in this resolution.
(g) The shareholders’ resolution set out in item 6.2 above, if passed, will empower the Directors to offer and grant options and to allot and issue shares in the capital of the Company pursuant to the exercise of the options under the Plan.

This page has been intentionally left blank.

SARIN TECHNOLOGIES LTD. (Incorporated in Israel)Israel Registration No. 51 1332207
PROXY FORM
I/We , NRIC/Passport no.
of
being a member/members of Sarin Technologies Ltd. (the “Company”), hereby appoint
Name Address NRIC/Passport No. No. of Shares
and/or (delete as appropriate)
Name Address NRIC/Passport No. No. of Shares
as my/our proxy/proxies to attend and to vote for me/us on my/our behalf and, if necessary, to demand a poll at the Annual General Meeting of the Company to be held at the offi ces of Eyal Khayat, Zolty, Neiger & Co., Law Offi ces, 9 Hamenofi m Street, Eleventh Floor. Herzliya Pituach, Israel on 27 April 2011 at 10:00 a.m. Israel time (3:00 p.m. Singapore time) and at any adjournment thereof.
Please indicate with an “X” in the spaces provided whether you wish your vote(s) to be cast for or against the resolutions as set out in the Notice of Annual General Meeting. In the absence of specifi c directions, the proxy/proxies will vote or abstain as he/they may think fi t, as he/they will on any other matters arising at the Annual General Meeting.
No. Resolution For Against
1 Adoption of reports and accounts2 Declaration of fi nal dividend for the year ended 31 December 2010.3 Re-election of all retiring Directors of the Company:
a. Daniel Benjamin Glinertb. Uzi Levamic. Avraham Eshedd. Eyal Mashiah e. Ehud Harelf. Hanoh Starkg. Chan Kam Loonh. Yehezkel Pinhas Blumi. Valerie Ong Choo Lin
4 Approval of Directors’ fees and grant of options to Directors5 Re-appointment of Somekh Chaikin Certifi ed Public Accountants (Isr.), member
fi rm of KPMG International and Chaikin, Cohen, Rubin and Gilboa, Certifi ed Public Accountants (Isr.) as external auditors
6.1 Authority to issue shares6.2 Authority to grant options and issue shares pursuant to the Sarin Technologies Ltd
2005 Share Option Plan
Dated this _____ day of ________________ 2011
Total Number of Shares Held
___________________________________________
Signature(s) of Member(s) or Common SealImportant: Please Read Notes Overleaf

Notes
1 Please insert the total number of shares held by you. If you have shares entered against your name in the Depository Register, you should insert that number. If you have shares registered in your name in the Register of Members of the Company, you should insert that number. If you have shares entered against your name in the Depository Register and shares registered in your name in the Register of Members, you should insert the aggregate number. If no number is inserted, this form of proxy will be deemed to relate to all the shares held by you.
2 A member entitled to attend and vote at a meeting of the Company is entitled to appoint not more than two proxies to attend and vote on his behalf. A proxy need not be a member of the Company.
3 The instrument appointing a proxy or proxies must be deposited either at the offi ces of the Company in 7 Atir Yeda Street (2nd Floor), Kfar Saba, Israel or at the offi ce of the Company’s Singapore Share Transfer Agent at 138 Robinson Road #17-00 The Corporate Offi ce Singapore 068906 not less than 24 hours before the time appointed for holding the meeting.
4 Where a member appoints more than one proxy, he shall specify the number of shares to be represented by each proxy, failing which, the fi rst named proxy may be treated as representing 100% of the shareholding and any second named proxy as an alternate to the fi rst named.
5 The instrument appointing a proxy or proxies must be under the hand of the appointor or of his attorney duly authorised in writing. Where the instrument appointing a proxy or proxies is executed by a company or other body corporate, it must be executed under its common seal or stamp or under the hand of its duly authorised agent or attorney on behalf of the corporation.
6 Where an instrument appointing a proxy or proxies is signed on behalf of the appointor by an attorney or other authority, the power of attorney or authority or a notarially certifi ed copy thereof must be lodged with the instrument of proxy, failing which the instrument of proxy may be treated as invalid.
7 A company or other body corporate which is a member may authorize, by resolution of its directors or any other managing body, such person as it thinks fi t to act as its representative at the meeting.
8 The Company shall be entitled to reject an instrument of proxy which is incomplete, improperly completed, illegible or where the true intentions of the appointor are not ascertainable from the instructions of the appointor specifi ed on the instrument of proxy. In addition, in the case of shares entered in the Depository Register, the Company may reject an instrument of proxy if the member, being the appointor, is not shown to have shares entered against his name in the Depository Register as at 24 hours before the time appointed for holding the meeting, as certifi ed by The Central Depository (Pte) Limited to the Company.


7 Atir YedA Street, KfAr SAbA 44643, iSrAel • T +972-9-7903500 • F +972-9-7903501 • www.sar in.com