CLARIFYING THE ADJUSTED BIG MAC INDEX · CLARIFYING THE ADJUSTED BIG MAC INDEX Thomas J. O’Brien*...
24
CLARIFYING THE ADJUSTED BIG MAC INDEX Thomas J. O’Brien* Santiago Ruiz de Vargas ** September 2015 ABSTRACT The Economist’s adjusted Big Mac index takes GDP into account in currency valuation, but the methodology is somewhat mysterious. This paper explains and clarifies the adjusted Big Mac methodology, especially a step that is not standard in the literature. The key is to distinguish between a currency’s bilateral valuation (versus a specific currency) and the currency’s overall valuation (versus a “basket” of a large number of currencies). We also report empirical evidence that the adjusted Big Mac misvaluation estimates have been better forecasts of currency changes than those based on the original “raw” Big Mac index. *Department of Finance, University of Connecticut, School of Business, 2100 Hillside Road, Storrs, CT 06269-1041; [email protected] **Financial Advisory Services, NOERR AG, Wirtschaftsprüfungsgesellschaft Steuerberatungsgesellschaft, Brienner Str. 28, 80333 Munich; [email protected]; +49 (89) 28628 0 For helpful suggestions and discussions, we thank Yin-Wong Cheung, Reid Click, Assaf Eisdorfer (especially), Jeffrey Frankel, Martin Glaum, Alain Krapl, Yingfeng Xu, and Zhibai Zhang.
Transcript of CLARIFYING THE ADJUSTED BIG MAC INDEX · CLARIFYING THE ADJUSTED BIG MAC INDEX Thomas J. O’Brien*...
CLARIFYING THE ADJUSTED BIG MAC INDEX
Thomas J. O’Brien* Santiago Ruiz de Vargas **
September 2015
ABSTRACT The Economist’s adjusted Big Mac index takes GDP into account in currency valuation, but the methodology is somewhat mysterious. This paper explains and clarifies the adjusted Big Mac methodology, especially a step that is not standard in the literature. The key is to distinguish between a currency’s bilateral valuation (versus a specific currency) and the currency’s overall valuation (versus a “basket” of a large number of currencies). We also report empirical evidence that the adjusted Big Mac misvaluation estimates have been better forecasts of currency changes than those based on the original “raw” Big Mac index. *Department of Finance, University of Connecticut, School of Business, 2100 Hillside Road, Storrs, CT
06269-1041; [email protected] **Financial Advisory Services, NOERR AG, Wirtschaftsprüfungsgesellschaft
Steuerberatungsgesellschaft, Brienner Str. 28, 80333 Munich; [email protected]; +49 (89) 28628 0
For helpful suggestions and discussions, we thank Yin-Wong Cheung, Reid Click, Assaf Eisdorfer (especially), Jeffrey Frankel, Martin Glaum, Alain Krapl, Yingfeng Xu, and Zhibai Zhang.
1
CLARIFYING THE ADJUSTED BIG MAC INDEX
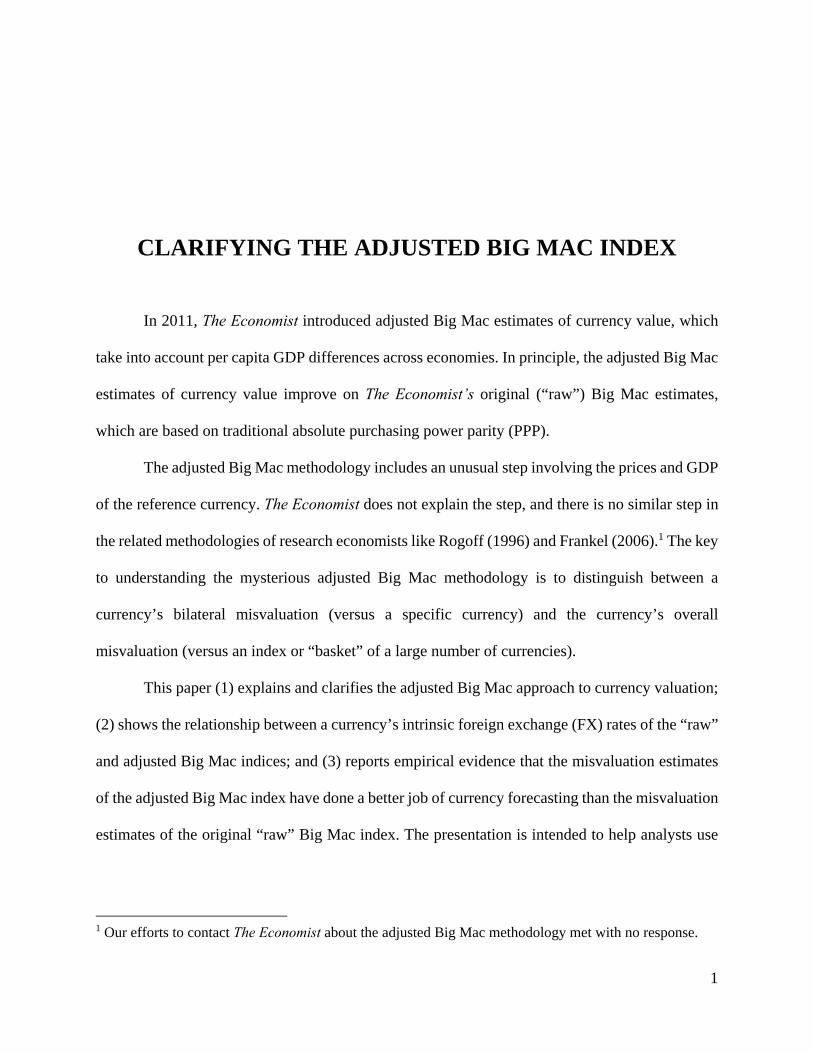
In 2011, The Economist introduced adjusted Big Mac estimates of currency value, which
take into account per capita GDP differences across economies. In principle, the adjusted Big Mac
estimates of currency value improve on The Economist’s original (“raw”) Big Mac estimates,
which are based on traditional absolute purchasing power parity (PPP).
The adjusted Big Mac methodology includes an unusual step involving the prices and GDP
of the reference currency. The Economist does not explain the step, and there is no similar step in
the related methodologies of research economists like Rogoff (1996) and Frankel (2006).1 The key
to understanding the mysterious adjusted Big Mac methodology is to distinguish between a
currency’s bilateral misvaluation (versus a specific currency) and the currency’s overall
misvaluation (versus an index or “basket” of a large number of currencies).
This paper (1) explains and clarifies the adjusted Big Mac approach to currency valuation;
(2) shows the relationship between a currency’s intrinsic foreign exchange (FX) rates of the “raw”
and adjusted Big Mac indices; and (3) reports empirical evidence that the misvaluation estimates
of the adjusted Big Mac index have done a better job of currency forecasting than the misvaluation
estimates of the original “raw” Big Mac index. The presentation is intended to help analysts use
1 Our efforts to contact The Economist about the adjusted Big Mac methodology met with no response.
2
The Economist’s currency misvaluation estimates in FX forecasting, overseas valuation analyses,
business decisions, and research.
Background on the Adjusted Big Mac Index
Despite limitations, and warnings by The Economist to “take it with a grain of salt”, the
original Big Mac index has been popular since its 1986 inception with practitioners, instructors,
and researchers.2 Virtually all textbooks covering international finance use the original Big Mac
index to explain traditional PPP. A Big Mac is viewed as a composite index of traded and
nontraded goods, has appealing simplicity, and overcomes the problem that CPI baskets are usually
different across countries. No doubt, the Big Mac index has helped many have a better
understanding of traditional PPP.
The adjusted Big Mac index is an application of the Penn effect, which refers to the positive
cross-sectional empirical association between economies’ composite price level and real per capita
GDP, expressed in a given reference currency.3 An economy’s real per capita GDP is per capita GDP
in local currency converted to the reference currency at the PPP FX rate between the local and reference
currencies.4 A deviation in the foreign economy’s price index (after conversion to the reference
currency at the current FX rate) and the reference economy’s price index is a deviation from PPP.
2 For examples of research involving the original Big Mac index, see Annaert and De Ceuster (1997), Clements and Lan (2010), Click (1996), Pakko and Pollard (1996, 2003), Cumby (1997), The Economist (2006, 2011), Landry (2008), Ong (1997, 2003), Lutz (2001), Parsley and Wei (2007), Rogoff (1996), and Taylor and Taylor (2004). We are not aware of any studies involving the adjusted Big Mac index at this point, but expect some in the near future, given the many studies of the original Big Mac index. 3 The name Penn effect is credited to Samuelson (1994) and refers to the research home of pioneering empirical studies of price level and GDP, the University of Pennsylvania. See Kravis and Lipsey (1983, 1987); Kravis, Heston and Summers (1978); and Summers and Heston (1991). 4 To simplify reading, we henceforth use the term GDP to represent real per capita GDP.
3
A theoretical relationship between PPP deviations and GDP is difficult to derive in
economic models (Asea and Corden, 1994; Asea and Mendoza, 1994). The implicit assumption of
the empirical Penn effect method is that an individual currency may deviate from the estimated
relationship, perhaps due to speculation, and this deviation is a misvaluation. However, currencies
are on average correctly valued per the estimated relationship. Note that the estimated relationship
tends to vary from one period to the next, because of changes in PPP deviations and GDP estimates.
This empirical approach has been used to estimate currency values by research economists like
Rogoff (1996), Frankel (2006), Xu (2009), and Cheung and Fujii (2014).
Sometimes the Penn effect is called the Balassa-Samuelson effect (Balassa, 1964; Samuelson,
1964), which is the most prominent theoretical explanation for the Penn effect. In the Balassa-
Samuelson effect, FX rates do not align with nontraded goods prices, even if they do align with
traded goods prices according to the international law of one price. This notion is based on the
observation that prices of nontraded goods tend to be higher in more developed and productive
economies. Therefore, the traditional PPP approach, based on composite price indexes that include
both traded and nontraded goods, will yield biased estimates of currency value. Currencies of more
(less) developed economies will tend to be overvalued (undervalued), relative to the traditional
PPP valuation.
The Economist’s “Line of Best Fit”
The Economist’s method of adjusting currency values for GDP differences involves
estimating a cross-sectional “line of best fit” between Big Mac prices and GDP, measured in a
given reference currency.5 If the US dollar is the reference currency, this relationship takes the
5 We use the term "line of best fit" to be consistent with The Economist's language; for all purposes it refers to a simple OLS regression.
4
form $ = α + β•GDP$ + ε, where $ is the Big Mac price in US dollars and GDP$ is in thousands
of US dollars.
A currency’s misvaluation in Penn effect studies is typically measured by the currency’s
residual versus the estimated “line of best fit”. A currency’s residual in the adjusted Big Mac
method, ε, is the actual Big Mac price minus the predicted Big Mac price. Unless the currency’s
residual is zero, the currency is misvalued after the adjustment for GDP; a positive (negative)
residual means an over(under)valuation. The percentage residual is the residual divided by the
predicted Big Mac price.
Using the US dollar as the reference currency and the euro as the representative foreign
currency, the actual Eurozone Big Mac price in US dollars, $ (the E subscript is for Eurozone),
is equal to the actual Eurozone Big Mac price in euros, €, times the actual FX rate, $/€: $ =
€ • $/€. With the Eurozone’s estimated GDP (in US dollars), the estimated “line of best fit”
yields the predicted Eurozone Big Mac price (in US dollars), $, adjusted for the GDP effect. An
estimate of the euro’s misvaluation is the euro’s percentage residual, which simplifies to:
€ = $ / $ – 1 (1)
The Economist estimates the “line of best fit” with data for 49 economies, including 12
individual Eurozone countries and the Eurozone aggregate. In principle, including the individual
countries as well as the Eurozone aggregate in the “line of best fit” estimation would seem to
overweight the euro in the analysis. However, we found that excluding of the twelve individual
Eurozone countries makes only minor differences in the “line of best fit” and the misvaluation
estimates.
5
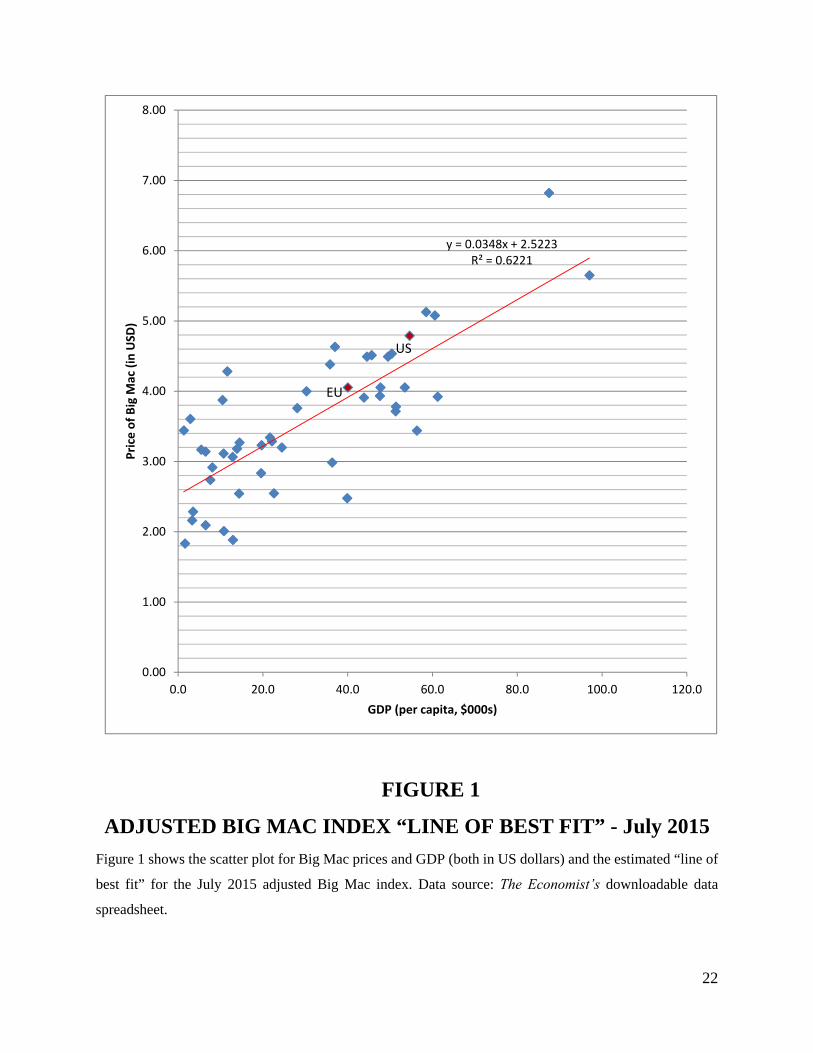
Here is an example from July 2015. The Economist’s estimated “line of best fit” between
Big Mac prices and GDPs (in US dollars) was $ = $2.5223 + 0.03476•GDP$. This estimated
“line of best fit” is shown in Figure 1.6
(Figure 1 here)
Given the Eurozone’s estimated GDP (in US dollars), $40,028, the predicted Eurozone Big
Mac price (in US dollars) was $= $2.5223 + 0.03476•$40.028 = $3.914. Given the Eurozone
Big Mac price in euros, €3.70, and the actual FX rate, 1.0956 $/€, the actual price of a Eurozone
Big Mac in US dollars was $= €3.70•1.0956 $/€ = $4.054. So equation (1) yields the euro’s
estimated misvaluation as $4.054/$3.914 – 1 = 0.0358, a 3.58% overvaluation. This example is
summarized in Table 1.
(Table 1 here)
We expected the adjusted Big Mac analysis would have reported that the euro was
overvalued by an estimated 3.58%, because (1) Frankel (2006) and other Penn effect studies
interpret a currency’s percentage residual as its misvaluation estimate; and (2) The Economist says,
“The difference between the price predicted by the red line for each country, given its income per
person, and its actual price gives a supersized measure of currency under- and over-valuation.”7
6 To replicate The Economist’s July 2015 “line of best fit”, we used the data for the 49 economies from The Economist’s downloadable Big Mac data spreadsheet. When we downloaded the spreadsheet in July 2015, the data included the 49 GDP estimates for the July 2015 “line of best fit”. Subsequently, the GDP estimates were not in the downloadable spreadsheet, and only available in the online interactive chart (by pointing the cursor at the economy’s observation on the scatter plot), and only for the 37 economies other than the 12 individual Eurozone countries. 7 The Economist, July 16, 2015.
6
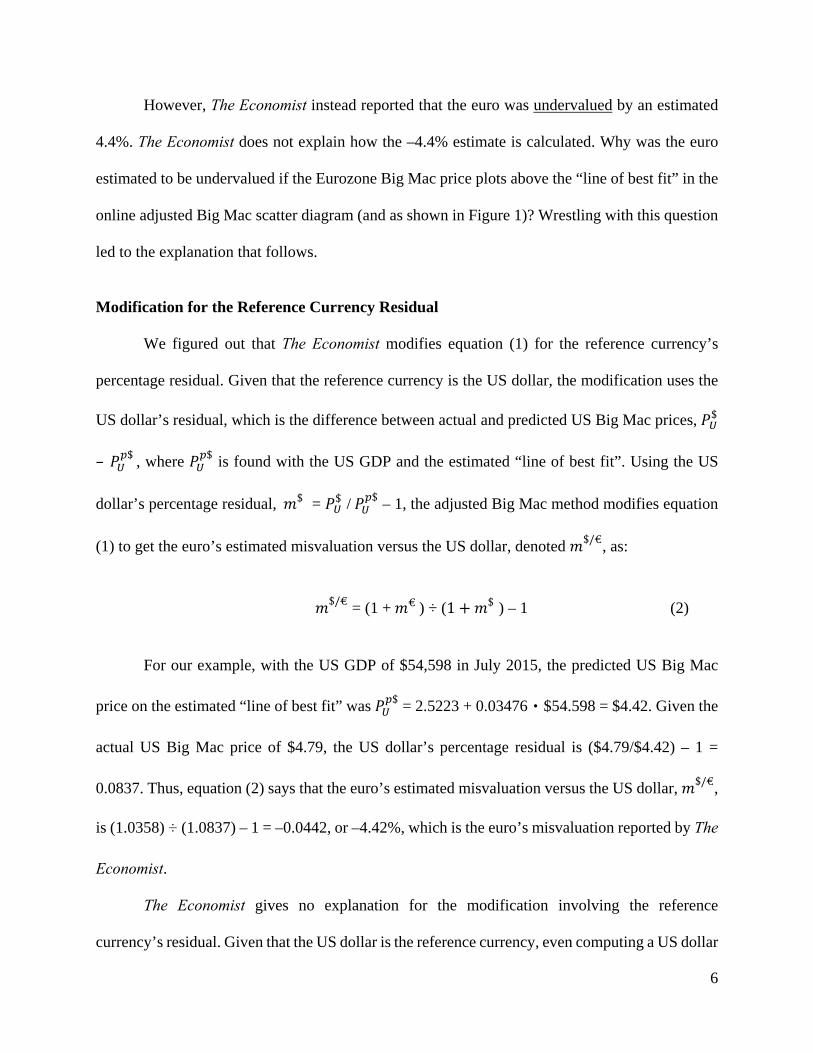
However, The Economist instead reported that the euro was undervalued by an estimated
4.4%. The Economist does not explain how the –4.4% estimate is calculated. Why was the euro
estimated to be undervalued if the Eurozone Big Mac price plots above the “line of best fit” in the
online adjusted Big Mac scatter diagram (and as shown in Figure 1)? Wrestling with this question
led to the explanation that follows.
Modification for the Reference Currency Residual
We figured out that The Economist modifies equation (1) for the reference currency’s
percentage residual. Given that the reference currency is the US dollar, the modification uses the
US dollar’s residual, which is the difference between actual and predicted US Big Mac prices, $
– $, where $ is found with the US GDP and the estimated “line of best fit”. Using the US
dollar’s percentage residual, $ = $ / $ – 1, the adjusted Big Mac method modifies equation
(1) to get the euro’s estimated misvaluation versus the US dollar, denoted $/€, as:
$/€ = (1 + € ) ÷ (1 $ ) – 1 (2)
For our example, with the US GDP of $54,598 in July 2015, the predicted US Big Mac
price on the estimated “line of best fit” was $ = 2.5223 + 0.03476•$54.598 = $4.42. Given the
actual US Big Mac price of $4.79, the US dollar’s percentage residual is ($4.79/$4.42) – 1 =
0.0837. Thus, equation (2) says that the euro’s estimated misvaluation versus the US dollar, $/€,
is (1.0358) ÷ (1.0837) – 1 = –0.0442, or –4.42%, which is the euro’s misvaluation reported by The
Economist.
The Economist gives no explanation for the modification involving the reference
currency’s residual. Given that the US dollar is the reference currency, even computing a US dollar
7
residual seemed odd, because the Penn effect is typically an exercise of explaining PPP deviations
with GDPs, and there is no PPP deviation of the US dollar versus itself. What is the reason for the
modification? Our struggle with this mystery led to the following clarification.
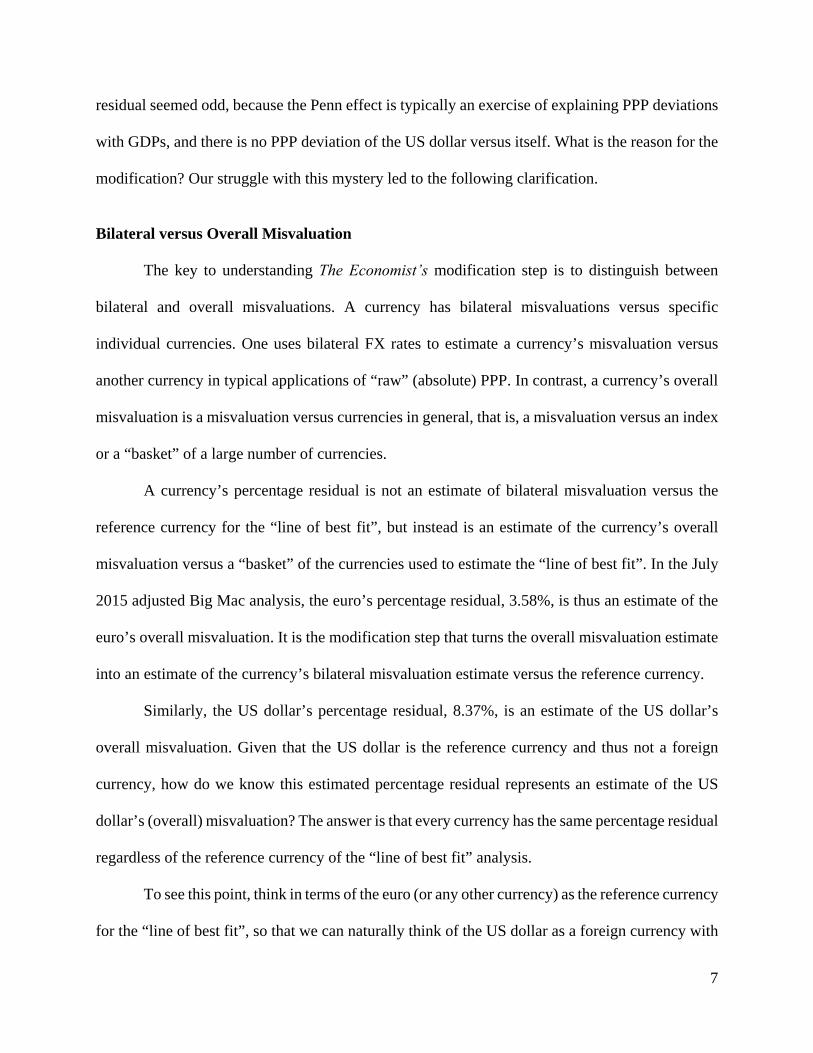
Bilateral versus Overall Misvaluation
The key to understanding The Economist’s modification step is to distinguish between
bilateral and overall misvaluations. A currency has bilateral misvaluations versus specific
individual currencies. One uses bilateral FX rates to estimate a currency’s misvaluation versus
another currency in typical applications of “raw” (absolute) PPP. In contrast, a currency’s overall
misvaluation is a misvaluation versus currencies in general, that is, a misvaluation versus an index
or a “basket” of a large number of currencies.
A currency’s percentage residual is not an estimate of bilateral misvaluation versus the
reference currency for the “line of best fit”, but instead is an estimate of the currency’s overall
misvaluation versus a “basket” of the currencies used to estimate the “line of best fit”. In the July
2015 adjusted Big Mac analysis, the euro’s percentage residual, 3.58%, is thus an estimate of the
euro’s overall misvaluation. It is the modification step that turns the overall misvaluation estimate
into an estimate of the currency’s bilateral misvaluation estimate versus the reference currency.
Similarly, the US dollar’s percentage residual, 8.37%, is an estimate of the US dollar’s
overall misvaluation. Given that the US dollar is the reference currency and thus not a foreign
currency, how do we know this estimated percentage residual represents an estimate of the US
dollar’s (overall) misvaluation? The answer is that every currency has the same percentage residual
regardless of the reference currency of the “line of best fit” analysis.
To see this point, think in terms of the euro (or any other currency) as the reference currency
for the “line of best fit”, so that we can naturally think of the US dollar as a foreign currency with
8
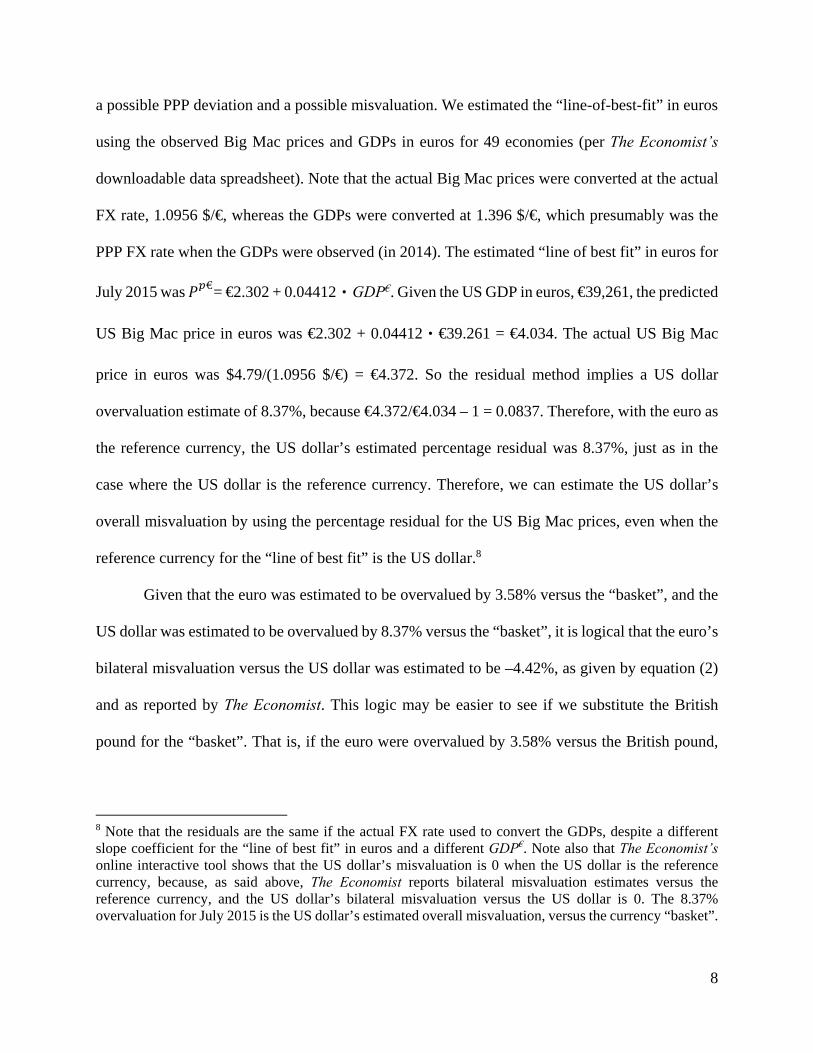
a possible PPP deviation and a possible misvaluation. We estimated the “line-of-best-fit” in euros
using the observed Big Mac prices and GDPs in euros for 49 economies (per The Economist’s
downloadable data spreadsheet). Note that the actual Big Mac prices were converted at the actual
FX rate, 1.0956 $/€, whereas the GDPs were converted at 1.396 $/€, which presumably was the
PPP FX rate when the GDPs were observed (in 2014). The estimated “line of best fit” in euros for
July 2015 was €= €2.302 + 0.04412•GDP€. Given the US GDP in euros, €39,261, the predicted
US Big Mac price in euros was €2.302 + 0.04412•€39.261 = €4.034. The actual US Big Mac
price in euros was $4.79/(1.0956 $/€) = €4.372. So the residual method implies a US dollar
overvaluation estimate of 8.37%, because €4.372/€4.034 – 1 = 0.0837. Therefore, with the euro as
the reference currency, the US dollar’s estimated percentage residual was 8.37%, just as in the
case where the US dollar is the reference currency. Therefore, we can estimate the US dollar’s
overall misvaluation by using the percentage residual for the US Big Mac prices, even when the
reference currency for the “line of best fit” is the US dollar.8
Given that the euro was estimated to be overvalued by 3.58% versus the “basket”, and the
US dollar was estimated to be overvalued by 8.37% versus the “basket”, it is logical that the euro’s
bilateral misvaluation versus the US dollar was estimated to be –4.42%, as given by equation (2)
and as reported by The Economist. This logic may be easier to see if we substitute the British
pound for the “basket”. That is, if the euro were overvalued by 3.58% versus the British pound,
8 Note that the residuals are the same if the actual FX rate used to convert the GDPs, despite a different slope coefficient for the “line of best fit” in euros and a different GDP€. Note also that The Economist’s online interactive tool shows that the US dollar’s misvaluation is 0 when the US dollar is the reference currency, because, as said above, The Economist reports bilateral misvaluation estimates versus the reference currency, and the US dollar’s bilateral misvaluation versus the US dollar is 0. The 8.37% overvaluation for July 2015 is the US dollar’s estimated overall misvaluation, versus the currency “basket”.
9
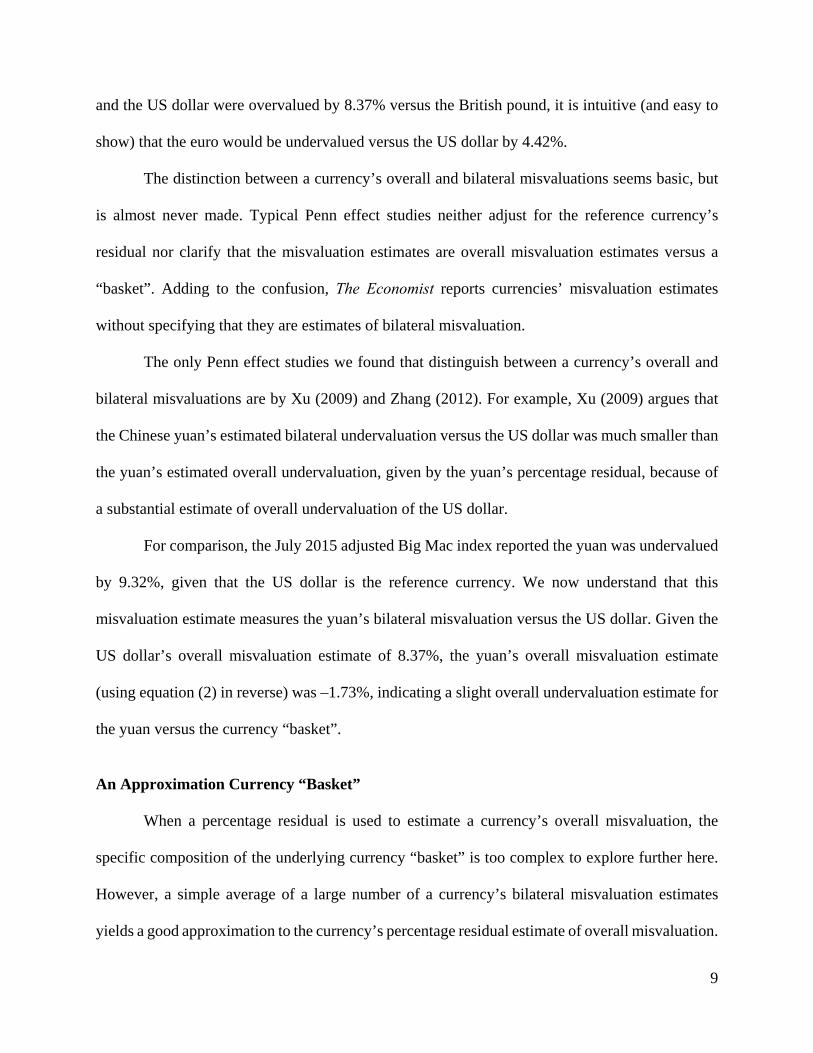
and the US dollar were overvalued by 8.37% versus the British pound, it is intuitive (and easy to
show) that the euro would be undervalued versus the US dollar by 4.42%.
The distinction between a currency’s overall and bilateral misvaluations seems basic, but
is almost never made. Typical Penn effect studies neither adjust for the reference currency’s
residual nor clarify that the misvaluation estimates are overall misvaluation estimates versus a
“basket”. Adding to the confusion, The Economist reports currencies’ misvaluation estimates
without specifying that they are estimates of bilateral misvaluation.
The only Penn effect studies we found that distinguish between a currency’s overall and
bilateral misvaluations are by Xu (2009) and Zhang (2012). For example, Xu (2009) argues that
the Chinese yuan’s estimated bilateral undervaluation versus the US dollar was much smaller than
the yuan’s estimated overall undervaluation, given by the yuan’s percentage residual, because of
a substantial estimate of overall undervaluation of the US dollar.
For comparison, the July 2015 adjusted Big Mac index reported the yuan was undervalued
by 9.32%, given that the US dollar is the reference currency. We now understand that this
misvaluation estimate measures the yuan’s bilateral misvaluation versus the US dollar. Given the
US dollar’s overall misvaluation estimate of 8.37%, the yuan’s overall misvaluation estimate
(using equation (2) in reverse) was –1.73%, indicating a slight overall undervaluation estimate for
the yuan versus the currency “basket”.
An Approximation Currency “Basket”
When a percentage residual is used to estimate a currency’s overall misvaluation, the
specific composition of the underlying currency “basket” is too complex to explore further here.
However, a simple average of a large number of a currency’s bilateral misvaluation estimates
yields a good approximation to the currency’s percentage residual estimate of overall misvaluation.

10
For example, the July 2015 average of 37 bilateral misvaluation estimates versus the US
dollar was –7.70%. This average implies that the “basket” was undervalued by 7.70% versus the
US dollar, and thus that the US dollar’s overall misvaluation versus the “basket” was 1/(1 – 0.0770)
– 1 = 0.0834, or 8.34%. This estimate is approximately equal to the 8.37% overall misvaluation
estimate based on the US dollar’s percentage residual. In a similar example, the average of The
Economist’s 37 bilateral misvaluation estimates versus the euro in July 2015 was –3.43%,
implying that the “basket” had an estimated misvaluation versus the euro of –3.43%, and thus that
the euro’s estimated overall misvaluation versus the “basket” was 1/(1 – 0.0343) – 1 = 0.0355, or
3.55%. This overall misvaluation estimate for the euro is a close approximation to the estimate
based on the euro’s percentage residual, 3.58%.9
The hypothetical “basket”, or currency index, underlying the averaging approach consists
of equal amounts of a given currency, say one US dollar, invested at the bilateral GDP-adjusted
intrinsic FX rates. Then the “basket” is valued at the actual bilateral FX rates. For an example with
euros, given that the euro is undervalued by 4.42% versus the US dollar at the actual bilateral FX
rate, 1.0956 $/€, the euro’s bilateral GDP-adjusted intrinsic FX rate versus the US dollar is (1.0956
$/€) ÷ (1 – 0.0442) = 1.1463 $/€. At this intrinsic FX rate, $1 will buy €0.872. The actual value in
US dollars of €0.872 is €0.872•(1.0956 $/€) = $0.956.
Table 2 lays out the entire July 2015 “basket” for 37 currencies. The data for the bilateral
percentage misvaluation estimates versus the US dollar, $/ , and the actual bilateral FX
rates, $/ (in US dollars per currency C), are from The Economist’s downloadable data
9 Although The Economist’s downloadable data spreadsheet contains 49 bilateral misvaluation estimates (for several reference currencies), only 37 are shown on the website. The other twelve are for individual Eurozone countries, whose bilateral misvaluation estimates make no sense, because there can be only one bilateral misvaluation of the euro versus any given reference currency.

11
spreadsheet. The next column shows bilateral GDP-adjusted intrinsic FX rates, $/ , estimated
using the expression $/ = $/ ÷ (1 + $/ ). The last column shows the values in US dollars,
given the actual FX rates, of a $1 investment in each of the “basket’s” currencies at the bilateral
GDP-adjusted intrinsic FX rate.
(Table 2 here)
The average of the 37 actual values, 0.923 (shown at the bottom of the last column), is the
hypothetical “basket’s” actual overall value per $1 invested. This average implies that the basket
was undervalued by 7.70% versus the US dollar, confirming that the US dollar’s estimated overall
misvaluation versus the “basket” was 1/(1 – 0.0770) – 1 = 0.0834, or 8.34%, as we found above
by averaging the 37 estimated bilateral misvaluation percentages. Thus, when you compare the
entire “basket’s” actual value with its intrinsic value, you get the same overall misvaluation
estimate as when you average all of the bilateral percentage misvaluation estimates.
GDP-Adjusted Intrinsic FX Rates and “Raw” PPP
There is a relationship between a currency’s bilateral GDP-adjusted intrinsic FX rate and
the currency’s “raw” PPP intrinsic FX rate, which we will denote $/€ . Using US dollars and
euros, the relationship is:10
$/€ = $/€ • [ $ / $] (3)
10 Substitute from equation (2) into $/€ $/€÷ (1 + $/€), then $ / $for 1 + € and $ / $ for
1 + $ , and rearrange. Note that the “raw” PPP intrinsic FX rate is $/€ = $ / €.

12
In words, equation (3) says that the bilateral GDP-adjusted intrinsic FX rate (in US dollars
per euro) is equal to the “raw” PPP intrinsic FX rate times the ratio of the Eurozone and US
predicted Big Mac prices. For July 2015, for example, $ was $3.914, $ was $4.42, and the
PPP intrinsic FX rate was $4.79/€3.70 = 1.2946 $/€. By equation (3), the bilateral GDP-adjusted
intrinsic FX rate between US dollars and euros, $/€ , was equal to (1.2946 $/€) • $3.914/$4.42]
= 1.146 $/€, as found earlier.11
US Dollar’s Overall Misvaluation over Time
For the semiannual dates that The Economist has reported adjusted Big Mac estimates of
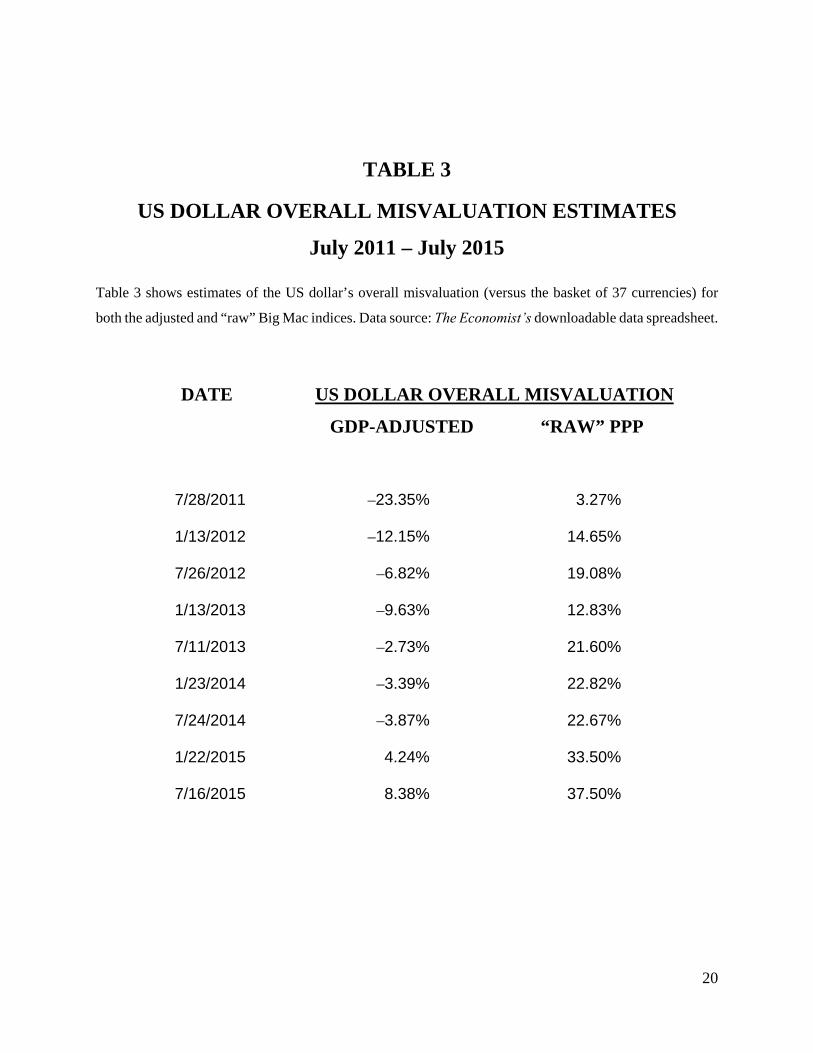
currency values, Table 3 shows estimates of the US dollar’s overall misvaluation for both the
adjusted and “raw” Big Mac indices. The GDP-adjusted estimates of bilateral misvaluation versus
the US dollar are reported for each period in The Economist’s downloadable spreadsheet, but GDP
estimates are not. We therefore did not use the percentage residual approach to estimate the US
dollar’s overall misvaluation. Instead, we used the “basket” approximation method shown above:
by averaging 37 reported estimates of GDP-adjusted bilateral misvaluation versus the US dollar,
and then inverting the currency direction of the result.12
(Table 3 here)
Prior to January 2015, the adjusted Big Mac index implied that the US dollar was
undervalued in the overall sense. The largest estimated overall US dollar undervaluation was by
11 Note that by the “raw” Big Mac PPP standard of currency value, the euro was bilaterally misvalued versus the US dollar by (1.0956 $/€)/(1.2946 $/€) – 1 = –0.1537, or undervalued by 15.37%. 12 The exception is July 2015, for which we report the percentage residual estimate, 8.37%. For the other dates, we also estimated a “line of best fit” for each period using GDP estimates from World Bank and IMF sources. Using the US dollar residual and equation (1) to estimate the US dollar’s overall misvaluation gives results that are similar to the GDP-adjusted estimates in Table 3.
13
23.35%, in July 2011. Gradually, the US dollar strengthened to the 8.37% estimated GDP-adjusted
overall overvaluation as of July 2015. Figure 2 shows a plot of the US dollar’s overall adjusted
Big Mac misvaluation estimates over time.
(Figure 2 here)
For comparison, we similarly averaged the 37 “raw” PPP bilateral misvaluation estimates
versus the US dollar (reported by The Economist) and then inverted the average to estimate the US
dollar’s overall misvaluation based on “raw” PPP. For example, the average “raw” PPP
misvaluation estimate in July 2015 was 27.28%, so the US dollar’s overall misvaluation estimate
was 1/(1 – 0.2728) – 1 = 0.375, or an overvaluation by 37.5%.
As you see in the last column of Table 3, the US dollar appears to have been overvalued in
every period based on traditional “raw” PPP. Adjusting for GDP, the US dollar was estimated to
be undervalued until January 2015. The comparison between the “raw” and adjusted versions of
the Big Mac index shows how different the two measures can be. Only in 2015 do both versions
estimate an overall US dollar overvaluation, but even then with a large difference in magnitude.
Currency Forecasting: Adjusted versus “Raw” Big Mac
Does the adjusted Big Mac index yield better estimates of currency misvaluation than the
“raw” Big Mac index? One way to investigate this question is to compare the misvaluation
estimates in terms of forecasting actual FX changes, which presumably contain a component for a
misvaluation correction.
We empirically compared estimated misvaluations with the actual percentage FX change
over the ensuing two-year horizon. We did this for 36 currencies versus the US dollar for five
editions of the Big Mac index, beginning with July 2011 and ending with July 2013.

14
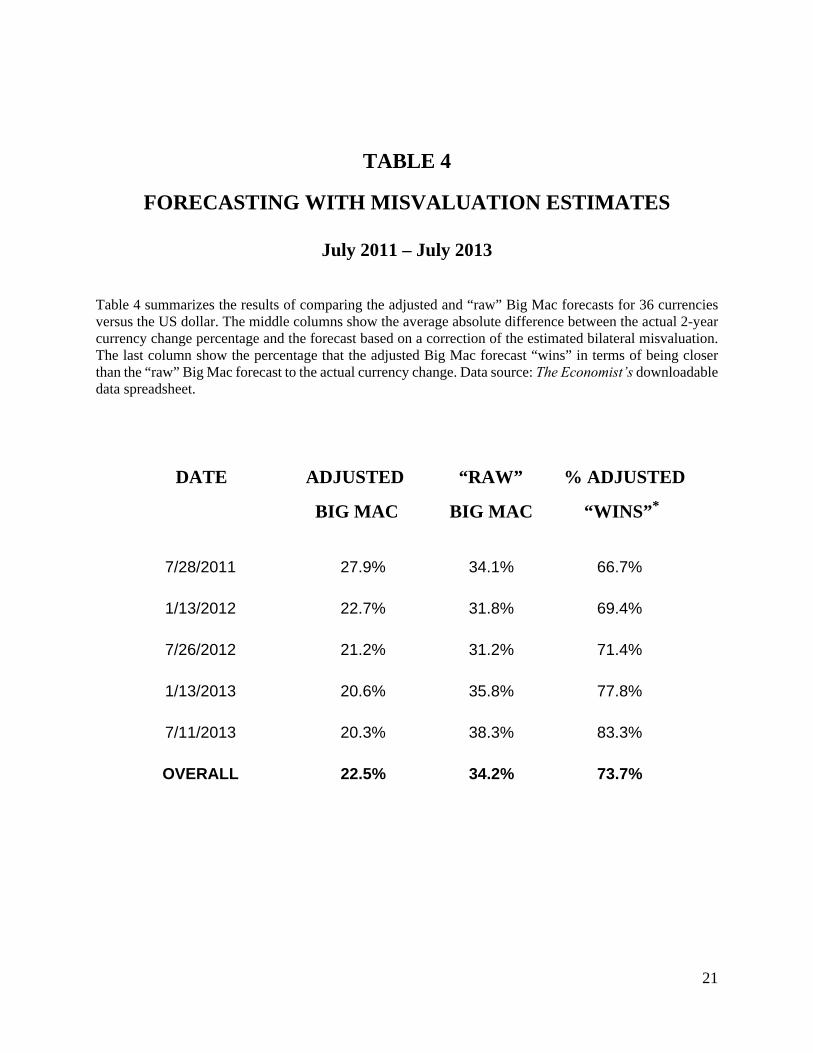
Overall, the FX forecast based on a correction of the adjusted Big Mac misvaluation
estimate has done a better job of forecasting the actual FX change. The average absolute difference
between the actual percentage FX change and the forecast based of the “raw” Big Mac
misvaluation estimate was 34.2%, whereas the average was 22.5% for the adjusted Big Mac
misvaluation estimate. The absolute difference between the actual percentage FX change and the
forecast based on the adjusted Big Mac index was smaller in 73.7% of the observations. The year
by year results are shown in Table 4.
(Table 4 here)
We did no formal significance test due to the relatively small number of observations, but
the implication of the empirical findings is clear: If you want to include a currency’s misvaluation
estimate in an FX forecast, the adjusted Big Mac misvaluation estimate is a better choice than the
“raw” Big Mac misvaluation estimate. Of course, a number of other factors can affect FX forecasts
and actual FX changes.
Conclusion
The Economist’s adjusted Big Mac method includes an unusual step based on the prices
and GDP of the reference currency. This step, and the possible motivation for it, are not explained
by The Economist.
The key to understanding the step is to distinguish between a currency’s bilateral valuation
versus a specific currency and the currency’s overall valuation versus am index, or “basket”, of a
large number of currencies. This distinction is not made by either The Economist or most studies
in the related literature.
As a colleague who read a draft of this note told us, “When I covered the adjusted Big Mac
topic in my course in 2013, I got confused. Now I know why.” To try to prevent potential future
15
confusion, this paper passes along to the community of Big Mac index users what we struggled to
demystify.
In addition, we show a relationship between the intrinsic FX rates of the adjusted and “raw”
Big Mac indices. Finally, we report the empirical finding that the misvaluation estimates of the
adjusted Big Mac index have been better forecasters of FX changes than the misvaluation estimates
of the original “raw” Big Mac index.

16
References
Annaert, Jan; De Ceuster, Marc J.K.: The Big Mac: More Than a Junk Asset Allocator? International Review of Financial Analysis, 1997, Vol. 6(3), pp. 179-192.
Asea, Patrick K.; Corden, W. Max: The Balassa-Samuelson Model: An Overview. Review of International Economics, 1994, Vol. 2 (3), pp. 191-200.
Asea, Patrick K.; Mendoza, Enrique G.: The Balassa-Samuelson Model: A General Equilibrium Appraisal. Review of International Economics, 1994, Vol. 2 (3), pp. 244-267.
Balassa, Bela: The Purchasing-Power Parity Doctrine: A Reappraisal. The Journal of Political Economy, 1964, pp. 584-596.
Cheung, Yin-Wong; Fujii, Eiji: Exchange Rate Misalignment Estimates – Sources of Differences. International Journal of Finance and Economics, 2014, Vol. 19 (2), pp. 91-121.
Clements, Kenneth W.; Lan, Yihui: A New Approach to Forecasting Exchange Rates. Journal of International Money and Finance, 2010, Vol. 29 (7), pp. 1424-1437.
Click, Reid W.: Contrarian MacParity. Economics Letters, 1996, Vol. 53 (2), pp. 209-212.
Cumby, Robert E.: Forecasting Exchange Rates and Relative Prices with the Hamburger Standard: Is What You Want What You Get With McParity? Unpublished manuscript, Georgetown University, May 1997.
Economist (online): Economics focus McCurrencies: Happy 20th Birthday to our Big Mac Index, 25th May 2006.
Economist (online): The Big Mac Index, Currency Comparisons, To Go, 28th July 2011.
Economist (online): The Big Mac Index, Global Exchange Rates, To Go, 16th July 2015.
Frankel, Jeffrey: The Balassa-Samuelson Relationship and the Renminbi, Working Paper, Harvard University, USA, 2006.
Kravis, Irving B.; Lipsey, Robert E.: Toward an Explanation of National Price Levels, Princeton Studies in International Finance No. 52, Princeton, NJ: International Finance Center, Princeton University, 1983.
Kravis, Irving B.; Lipsey, Robert E.: 1987. The Assessment of National Price Levels. In Real Financial Linkages Among Open Economies, edited by Sven W. Arndt and J. David Richardson. Cambridge, MA: MIT Press, 1987, pp. 97-134.
17
Kravis, Irving B.; Heston, Alan; Summers, Robert: International Comparisons of Real Product and Purchasing Power, Baltimore: The Johns Hopkins University Press, 1978.
Landry, Anthony: The Big Mac: A Global-to-Local Look at Pricing. Economics Letters, 2008, Vol. 3 (9).
Lutz, M.: Beyond Burgernomics and MacParity: Forecasting Exchange Rates with Micro-level Price Data, Working Paper, Institute of Economics, University of St. Gallen, Switzerland, 2001.
Ong, Li Lian: Burgernomics: The Economics of the Big Mac Standard. Journal of International Money and Finance, 1997, Vol. 16 (6), pp. 865-878.
Ong, Li Lian: The Big Mac Index: Applications of Purchasing Power Parity. New York, 2003.
Pakko, Michael R.; Pollard, Patricia S.: For Here or to Go? Purchasing Power Parity and the Big Mac. Federal Reserve Bank of St. Louis Review, 1996, Vol. 78 (1), January/February, pp. 3-21.
Pakko, Michael R.; Pollard, Patricia S.: Burgernomics: A Big Mac™ Guide to Purchasing Power Parity. Federal Reserve Bank of St. Louis Review, 2003, Vol. 85 (6), November/December, pp. 9-28.
Parsley, David C.; Wei, Shang‐Jin: A Prism into the PPP Puzzles: The Micro‐Foundations of Big Mac Real Exchange Rates. Economic Journal, 2007, Vol. 117 (523), pp. 1336-1356.
Rogoff, Kenneth: The Purchasing Power Parity Puzzle. Journal of Economic Literature, 1996, Vol. 34, pp. 647-668.
Samuelson, Paul A.: Theoretical Notes on Trade Problems. The Review of Economics and Statistics, 1964, Vol. 46 (2), pp. 145-154.
Samuelson, Paul A.: Facets of Balassa-Samuelson Thirty Years Later. The Review of International Economics, 1994, Vol. 2 (3), pp. 201-226.
Summers, Robert; Heston, Alan: The Penn World Table (Mark 5): An Extended Set of International Comparisons, 1950-1988m Quarterly Journal of Economics, 1991, Vol, 106, pp. 327-368.
Taylor, Alan M.; Taylor, Mark P.: The Purchasing Power Parity Debate. Journal of Economic Perspectives, 2004, Vol. 18 (4), pp. 135-158.
Xu, Yingfeng: Relevant International Experience of Real Exchange Rate Adjustment for China. China Economic Review, 2009, Vol. 20 (3), pp. 440–451.
Zhang, Zhibai: A Simple Model and its Application in the Valuation of Eleven Main Real Exchange Rates. International Research Journal of Finance and Economics, 2012, Issue 97, pp. 55-59.

18
TABLE 1
ADJUSTED BIG MAC ANALYSIS OF THE EURO
July 2015
Table 1 summarizes the text example of estimating the predicted Eurozone Big Mac price in US dollars and
the misvaluation percentage for the euro, € , using equation (1). Data source: The Economist’s
downloadable data spreadsheet.
BASIC INFORMATION
US Big Mac Price $4.79
Eurozone Big Mac Price (€s) €3.70
Actual FX Rate 1.0956 $/€
Estimated “Line of Best Fit” $ = 2.5223 + 0.03476•GDP$
$ = Predicted Big Mac Price ($s)
GDP$ in 000s of $s
Eurozone GDP ($s) $40,028
RESULTS
Eurozone Big Mac Price ($s) Percentage Residual ( € )
Actual ( $ ) $4.054
Predicted ( $) $3.914 3.58%

19
TABLE 2
“BASKET” VALUATION VS US DOLLAR: July 2015
Table 2 lays out the “basket” approximation for the US dollar’s overall misvaluation versus 37 currencies. $/ =
currency C’s bilateral misvaluation % versus the US dollar; $/ = actual bilateral FX rate ($ per currency C); $/ = bilateral GDP-adjusted intrinsic FX rate; VALUE ($) = value in US dollars, given the bilateral actual
FX rate, of investing $1 in currency C at $/ . Data source: The Economist’s downloadable data spreadsheet.
ECONOMY $/ $/ $/ VALUE ($)
Argentina -4.76% 0.1095 0.1149 0.952Australia -22.17% 0.7401 0.9508 0.778Brazil 35.07% 0.3172 0.2349 1.351United Kingdom 1.33% 1.5614 1.5409 1.013Canada -2.07% 0.7754 0.7918 0.979Chile -0.30% 0.0016 0.0016 0.997China -9.32% 0.1611 0.1776 0.907Colombia -3.99% 0.0004 0.0004 0.960Czech Republic -18.34% 0.0405 0.0496 0.817Denmark 1.27% 0.1468 0.1450 1.013Egypt -24.34% 0.1277 0.1688 0.757Eurozone -4.42% 1.0957 1.1463 0.956Hong Kong -41.51% 0.1290 0.2206 0.585Hungary -2.29% 0.0035 0.0036 0.977India -34.42% 0.0158 0.0240 0.656Indonesia -20.26% 0.0001 0.0001 0.797Israel 12.23% 0.2647 0.2358 1.122Japan -27.22% 0.0081 0.0111 0.728Malaysia -36.00% 0.2627 0.4105 0.640Mexico -0.76% 0.0635 0.0640 0.992New Zealand -10.83% 0.6627 0.7432 0.892Norway -11.56% 0.1228 0.1389 0.884Pakistan 23.62% 0.0098 0.0080 1.236Peru 5.53% 0.3141 0.2977 1.055Philippines 26.89% 0.0221 0.0174 1.269Poland -22.32% 0.2650 0.3411 0.777Russia -41.52% 0.0176 0.0301 0.585Saudi Arabia -12.45% 0.2666 0.3045 0.875Singapore -29.15% 0.7319 1.0330 0.709South Africa -29.66% 0.0806 0.1145 0.703Korea -0.83% 0.0009 0.0009 0.992Sweden 3.86% 0.1173 0.1130 1.039Switzerland 13.16% 1.0495 0.9275 1.132Taiwan -28.95% 0.0322 0.0454 0.710Thailand 7.82% 0.0293 0.0272 1.078Turkey 23.85% 0.3780 0.3052 1.238United States 0.00% 1.0000 1.0000 1.000AVERAGE -7.70% 0.923
20
TABLE 3
US DOLLAR OVERALL MISVALUATION ESTIMATES
July 2011 – July 2015
Table 3 shows estimates of the US dollar’s overall misvaluation (versus the basket of 37 currencies) for
both the adjusted and “raw” Big Mac indices. Data source: The Economist’s downloadable data spreadsheet.
DATE US DOLLAR OVERALL MISVALUATION
GDP-ADJUSTED “RAW” PPP
7/28/2011 –23.35% 3.27%
1/13/2012 –12.15% 14.65%
7/26/2012 –6.82% 19.08%
1/13/2013 –9.63% 12.83%
7/11/2013 –2.73% 21.60%
1/23/2014 –3.39% 22.82%
7/24/2014 –3.87% 22.67%
1/22/2015 4.24% 33.50%
7/16/2015 8.38% 37.50%
21
TABLE 4
FORECASTING WITH MISVALUATION ESTIMATES
July 2011 – July 2013
Table 4 summarizes the results of comparing the adjusted and “raw” Big Mac forecasts for 36 currencies versus the US dollar. The middle columns show the average absolute difference between the actual 2-year currency change percentage and the forecast based on a correction of the estimated bilateral misvaluation. The last column show the percentage that the adjusted Big Mac forecast “wins” in terms of being closer than the “raw” Big Mac forecast to the actual currency change. Data source: The Economist’s downloadable data spreadsheet.
DATE ADJUSTED “RAW” % ADJUSTED
BIG MAC BIG MAC “WINS”*
7/28/2011 27.9% 34.1% 66.7%
1/13/2012 22.7% 31.8% 69.4%
7/26/2012 21.2% 31.2% 71.4%
1/13/2013 20.6% 35.8% 77.8%
7/11/2013 20.3% 38.3% 83.3%
OVERALL 22.5% 34.2% 73.7%
22
FIGURE 1
ADJUSTED BIG MAC INDEX “LINE OF BEST FIT” - July 2015
Figure 1 shows the scatter plot for Big Mac prices and GDP (both in US dollars) and the estimated “line of
best fit” for the July 2015 adjusted Big Mac index. Data source: The Economist’s downloadable data
spreadsheet.
y = 0.0348x + 2.5223R² = 0.6221
0.00
1.00
2.00
3.00
4.00
5.00
6.00
7.00
8.00
0.0 20.0 40.0 60.0 80.0 100.0 120.0
Price of Big M
ac (in USD
)
GDP (per capita, $000s)
EU
US

23
FIGURE 2
US DOLLAR OVERALL MISVALUATION ESTIMATES
ADJUSTED BIG MAC: July 2011 – July 2015
Figure 2 plots the US dollar’s overall misvaluation estimates, adjusted for GDP, for the period July 2011
through July 2015, as described in Table 3.
‐25.00%
‐20.00%
‐15.00%
‐10.00%
‐5.00%
0.00%
5.00%
10.00%
7/1/2011
9/1/2011
11/1/2011
1/1/2012
3/1/2012
5/1/2012
7/1/2012
9/1/2012
11/1/2012
1/1/2013
3/1/2013
5/1/2013
7/1/2013
9/1/2013
11/1/2013
1/1/2014
3/1/2014
5/1/2014
7/1/2014
9/1/2014
11/1/2014
1/1/2015
3/1/2015
5/1/2015
7/1/2015