Clarified OJT/Local Employer
25
COCONINO COUNTY LOCAL WORKFORCE AREA SUMMARY OF CHANGES TO THE WORKFORCE BUSINESS PLAN The Workforce Innovation and Opportunity Act (WIOA) requires the Coconino County Local Workforce Development Board, in partnership with the Coconino County Board of Supervisors to review, prepare, and submit local plan modifications at the end of the first two- year period of the four-year local plan. The plan must identify and describe the policies, procedures, and local activities that are carried out in the local area, consistent with the state plan. Modifications are required to reflect changes to: A. Labor market and economic conditions; B. Updated performance measures; and C. Other factors affecting the implementation of the local plan including: a. Define ‘Requires additional assistance ' for youth eligibility. b. Define ‘underemployed’. The following chart and attachment are a summary of modifications. These modifications are provided as an attachment to the current plan. Plan Sections are noted also. PLAN ELEMENT Section MODIFICATION Labor Market Analysis Attached Section 3 The Coconino County Workforce Development Board has worked with the Arizona Office of Economic Opportunity to provide an updated labor market analysis specific for the Coconino County Local Workforce Development Area. Performance Measures Attached Section 9 Coconino County has negotiated new Levels of Performance for Program Years 201 8 and 2019. The levels have been agreed-upon by both the State and the Coconino County Workforce Development Board and are now included in the plan. Youth 'Requires Additional Assistance’ Definition Attached The Coconino County Workforce Development Board has defined the eligibility option for youth participants. WIOA 20 CFR 681.300 requires local areas to define this eligibility option in their Plan when it has not been defined by the state.
Transcript of Clarified OJT/Local Employer

COCONINO COUNTY LOCAL WORKFORCE
AREA SUMMARY OF CHANGES TO THE WORKFORCE BUSINESS PLAN
The Workforce Innovation and Opportunity Act (WIOA) requires the Coconino County
Local Workforce Development Board, in partnership with the Coconino County Board of
Supervisors to review, prepare, and submit local plan modifications at the end of the first two-
year period of the four-year local plan. The plan must identify and describe the policies,
procedures, and local activities that are carried out in the local area, consistent with the state
plan.
Modifications are required to reflect changes to: A. Labor market and economic conditions; B. Updated performance measures; and C. Other factors affecting the implementation of the local plan including:
a. Define ‘Requires additional assistance ' for youth eligibility. b. Define ‘underemployed’.
The following chart and attachment are a summary of modifications. These modifications are provided as an attachment to the current plan. Plan Sections are noted also.
PLAN ELEMENT Section MODIFICATION
Labor Market Analysis Attached Section 3
The Coconino County Workforce Development Board has worked with the Arizona Office of Economic Opportunity to provide an updated labor market analysis specific for the Coconino County Local Workforce Development Area.
Performance Measures Attached Section 9
Coconino County has negotiated new Levels of Performance for Program Years 201 8 and 2019. The levels have been agreed-upon by both the State and the Coconino County Workforce Development Board and are now included in the plan.
Youth 'Requires Additional Assistance’ Definition
Attached The Coconino County Workforce Development Board has defined the eligibility option for youth participants. WIOA 20 CFR 681.300 requires local areas to define this eligibility option in their Plan when it has not been defined by the state.

‘Underemployed’ Definition Attached Section 8
The Coconino County Workforce Development Board has defined ‘underemployed’ which may be used to determine whether employed adults and dislocated workers are in need of individualized services through the WIOA Title I-B program.
Added to Plan to clarify requirements.
Attached Section 4
All procurements will follow federal, state, and local procurement laws, regulations, and policies.
Updated Plan with new contact information
Attached Section 6
Kerry Bernard, State WIOA EO Officer Office of EEO, Department of Economic Security 1789 W. Jefferson Ave, MD 15H3 Phoenix AZ 85007 [email protected] 602-364-3976; 602-364-3982; TYY/TDD 7-1-1
Clarified OJT/Local Employer Attached Section 8
OJT and Local Employer Recognized Training are not the same service. When OJT is provided, OJT must be added to the S&T Plan in AJC. OJT is exempt from ETPL requirements. Local Employer Recognized Training must be listed on ETPL.
Clarification of Training for Adult/DW Program
Attached Section 8
and Section 9
Transitional employment and Locally Recognized Training are not considered training for Adult./DW program. Removed both from Training Services list. Added OJT to the Training Services list.
Corrected language in determining denial of training.
Attached Section
10
Removed “Do not reside in off-reservation Coconino County.”
October 2018

1
Coconino County LWIA
Labor Market Information
Introduction Summary The Arizona Office of Economic Opportunity (OEO) produces demographic, labor force, regulatory, workforce, and economic information for Arizona and substate areas. OEO created the following summary of economic highlights for Coconino County. • Coconino County experienced positive population growth between 2010 and 2017. Over this period,
Coconino County’s population increased by 6,341 individuals. • The population in Coconino County is projected to continue growing into future at a rate of roughly 1%
per year. • Arizona’s population over the age of 65 is growing much faster than other age cohorts, but this growth rate
is expected to decline starting in 2020. • Coconino County has lower income, a lower median age, and a higher rate of poverty than the rest of
Arizona. • There is a much higher proportion of Coconino County residents with postsecondary educational degrees
compared to the rest of Arizona. • Unemployment tends to decrease with higher educational attainment. Coconino County’s unemployment
rate for individuals with a Bachelor’s Degree or higher is 0.6% while residents who did not complete high school have a 19.7% unemployment rate.
• Despite much higher rates of poverty in Coconino County, public assistance is utilized by roughly the same proportion of households in Coconino County as the rest of Arizona.
• Sources of health insurance for Coconino County residents mirror the trends in all of Arizona. • The unemployment rate in Coconino County tends to hover slightly above Arizona’s unemployment rate. • From 2001-2017, the composition of the economy changed. Education and Health Services; Leisure and
Hospitality; and Manufacturing gained shares. Government; Trade, Transportation, and Utilities; and Mining and Construction lost shares.
• Coconino County is projected to experience modest job growth in many different industries.

2
This section summarizes labor market and workforce trends occurring within the Coconino County economy to help address and manage future workforce challenges.
Economic Overview Coconino County
How to use data:
–Use data to drive decision, not validate decisions
–Use more than one source of data – don’t lock yourself into a single estimate, consider all
of the available data to get the most accurate picture
–Know the limitations of your data set – it’s easy to accidently misuse data and draw
erroneous conclusions
–Become familiar with different data sets (or someone who is) – there is no one place to
find all the data you need
Immerse yourself in the data
Be prepared to accept surprising surprises
Population Growth by County (2010-2017):

3
Source: Produced by the Arizona Office of Economic Opportunity using 2017 Popula on Es mates (PEPTCOMP) in coopera on
with the US Census Bureau
Maricopa, Pima, and Pinal Counties represented 94% of total population growth within the state; however, these counties are also the most populous. Coconino County’s growth over this period represents 4.4% of the total population of Coconino County on July 1st, 2017. Projected population growth is expected to remain positive until the end of the projection period in 2050.
Coconino County Population Projections 2015 Medium Series
Year Population Population Change
Population % Change
Natural Change
(BirthsDeaths)
Total Net Migration (Inflows-Outflows)
2017 145,345 1,729 1.2% 899 643
2018 146,902 1,557 1.1% 869 496 2019 148,362 1,460 1.0% 839 425

4
2020 149,769 1,406 0.9% 806 399 2021 151,147 1,379 0.9% 775 398 Source: Arizona Office of Economic Opportunity 2015-2050 Population Projections, Medium Series
Coconino County is projected to have steady, modest growth until the end of the projection period in 2050. Roughly two thirds of this population growth will be created by natural change (number of births exceeding the number of deaths). Roughly one third of this population growth will be created by net migration (number of individuals moving to Coconino County exceeding the number of individuals moving away from Coconino County).
Source: Arizona Office of Economic Opportunity 2015‐2050 Popula on Projec ons, Medium Series
Chart note: data is for the whole state of Arizona
The 65 and over population is projected to grow at nearly 2-3 times the rate of the 18-64 age group and 3-4 times the rate of the 17 and under age group. The growth rate of the 65 and over cohort will steadily decline over the next decade. The 18-64 cohort will experience slower declines in their growth rate over the next decade. The 17 and under cohort will see modest increases in growth rates during the same period.

5
Population Characteristics (2017) Indicator Coconino County Arizona United States
Median Household Income $54,893 $56,581 $60,336
Median Age 31.6 37.7 38.1
Individuals with a Disability between 18-64 11.3% 10.5% 10.3%
Veterans 6.6% 9.0% 7.3% Poverty Status 19.0% 14.9% 13.4%
Mean Travel Time to Work (minutes) 18:36 25:36 26:54
Civilian Labor Force Participation Rate 63.5% 59.6% 62.8%
Population over 16 115,132 5,571,583 260,564,248 Source: Produced by the Arizona Office of Economic Opportunity using 2017 ACS 1‐Year Es mates (DP03, B01002, S1810, S2101) in coopera on with the US Census Bureau • Coconino County has a lower median household income than Arizona or the United States.
• Coconino County’s median age is significantly lower than the state or national median ages.
• Coconino County shows a higher rate of poverty.
These are some of the issues that can shape workforce development policies. Coconino County is a unique area with unique circumstances.
Highest Educational Level Achieved (Population over 25 years of age; 2017) Coconino County Arizona United States
Less than High School 8.8% 12.8% 12.0%
High School Graduate (includes equivalency) 46.8% 49.1% 47.5%
Associate’s Degree 7.1% 8.7% 8.5%
Bachelor’s Degree 21.7% 18.3% 19.7% Graduate or Professional Degree 15.6% 11.0% 12.3%
6
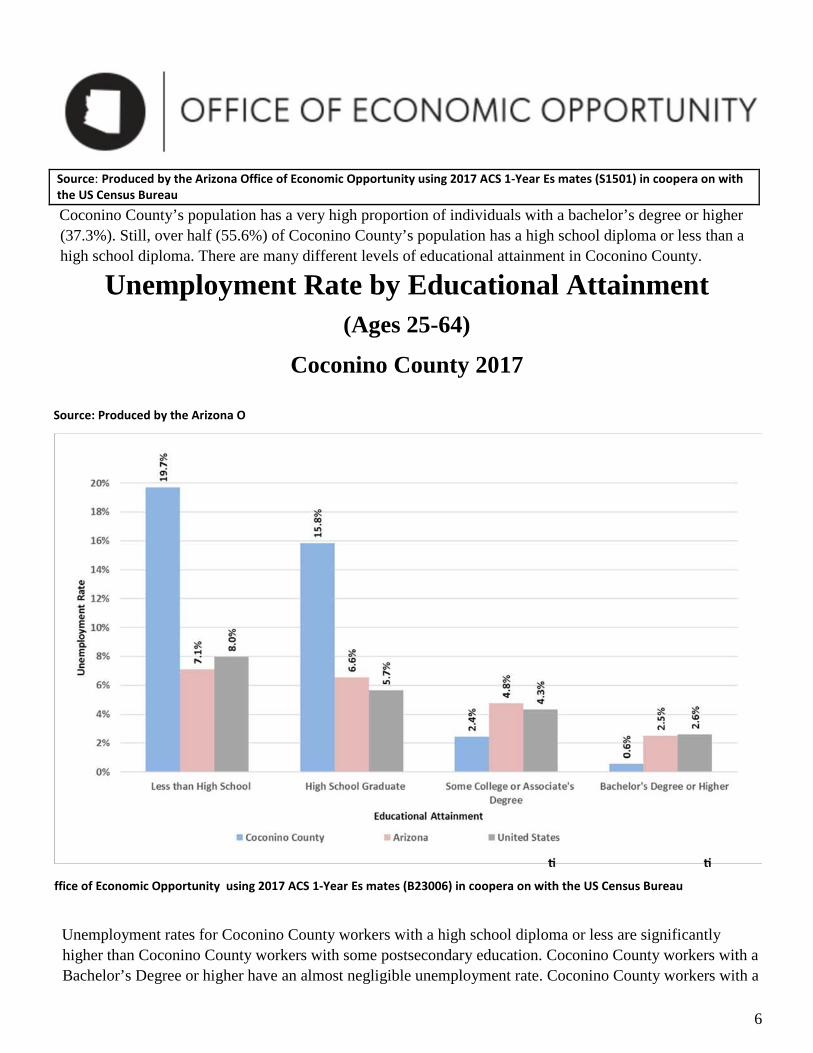
Source: Produced by the Arizona Office of Economic Opportunity using 2017 ACS 1‐Year Es mates (S1501) in coopera on with the US Census Bureau Coconino County’s population has a very high proportion of individuals with a bachelor’s degree or higher (37.3%). Still, over half (55.6%) of Coconino County’s population has a high school diploma or less than a high school diploma. There are many different levels of educational attainment in Coconino County.
Unemployment Rate by Educational Attainment (Ages 25-64)
Coconino County 2017
Source: Produced by the Arizona O
ffice of Economic Opportunity using 2017 ACS 1‐Year Es mates (B23006) in coopera on with the US Census Bureau
Unemployment rates for Coconino County workers with a high school diploma or less are significantly higher than Coconino County workers with some postsecondary education. Coconino County workers with a Bachelor’s Degree or higher have an almost negligible unemployment rate. Coconino County workers with a

7
High School Diploma or less comprise a smaller portion of the prime working age (25-64) participants in the civilian labor force in Coconino County at 28.5%. Coconino County workers with some type of postsecondary education comprise 71.5% of the civilian labor force for prime working age individuals.
In regards to unemployment, whether a worker is in Coconino County or another part of the US, unemployment tends to decrease as educational attainment increases.
Coconino County Public Assistance Households (2017) Coconino County Arizona United States
TANF (Temporary Assistance for Needy Families) 1.6% 1.6% 2.3%
SSI (Supplemental Security Income) 5.4% 4.3% 5.3%
SNAP (Supplemental Nutrition Assistance Program) 10.3% 10.8% 11.7%
Medicaid/AHCCCS (Arizona Health Care Cost Containment System)
18.8% 17.4% 15.3%
Source: Produced by the Arizona Office of Economic Opportunity using 2017 ACS 1‐Year Es mates (DP03, B27010) in coopera on with the US Census Bureau
Chart note: TANF, SSI, and SNAP propor ons are based on households, while Medicaid/AHCCCS proporons
are based on individuals.
Coconino County has a higher rate of poverty than Arizona or the United States, but Coconino County has a lower rate of SNAP (Supplemental Nutrition Assistance Program) utilization than either Arizona or the United States. Coconino County also has a higher rate of individuals using Medicaid/AHCCCS for health care coverage than Arizona or the United States.
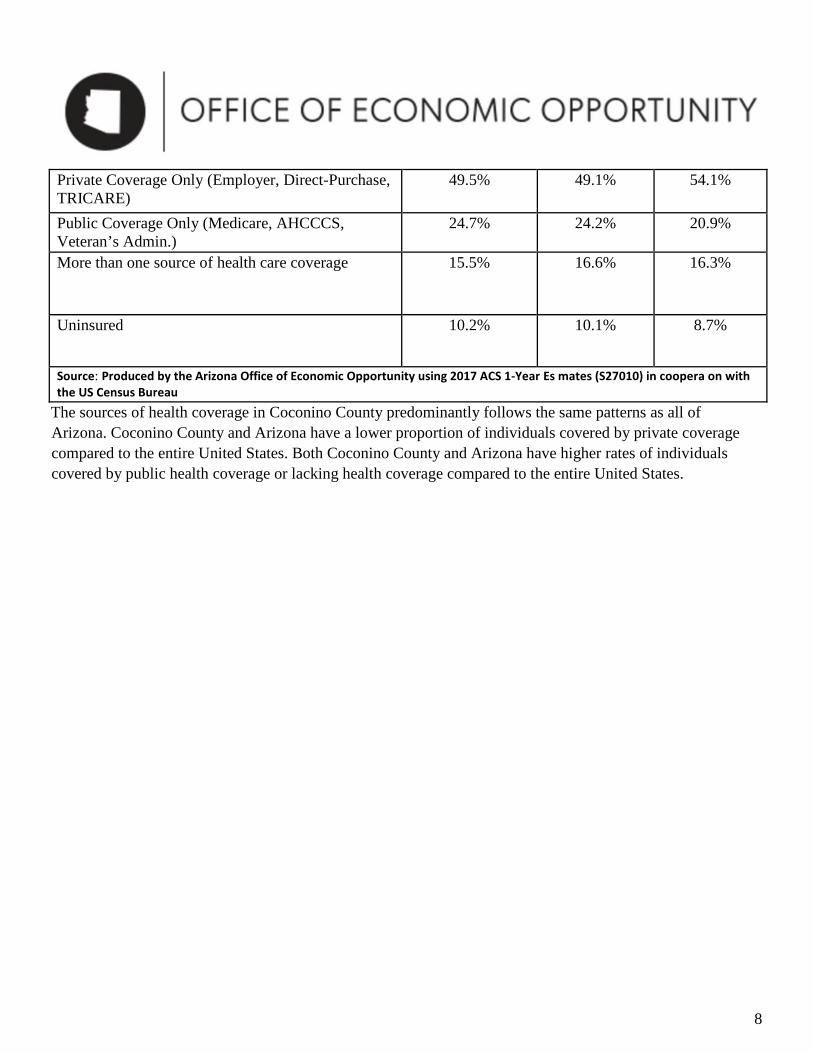
Coconino County Health Insurance (2017) Coconino County Arizona United States
8
Private Coverage Only (Employer, Direct-Purchase, TRICARE)
49.5% 49.1% 54.1%
Public Coverage Only (Medicare, AHCCCS, Veteran’s Admin.)
24.7% 24.2% 20.9%
More than one source of health care coverage 15.5% 16.6% 16.3%
Uninsured 10.2% 10.1% 8.7%
Source: Produced by the Arizona Office of Economic Opportunity using 2017 ACS 1‐Year Es mates (S27010) in coopera on with the US Census Bureau
The sources of health coverage in Coconino County predominantly follows the same patterns as all of Arizona. Coconino County and Arizona have a lower proportion of individuals covered by private coverage compared to the entire United States. Both Coconino County and Arizona have higher rates of individuals covered by public health coverage or lacking health coverage compared to the entire United States.
9
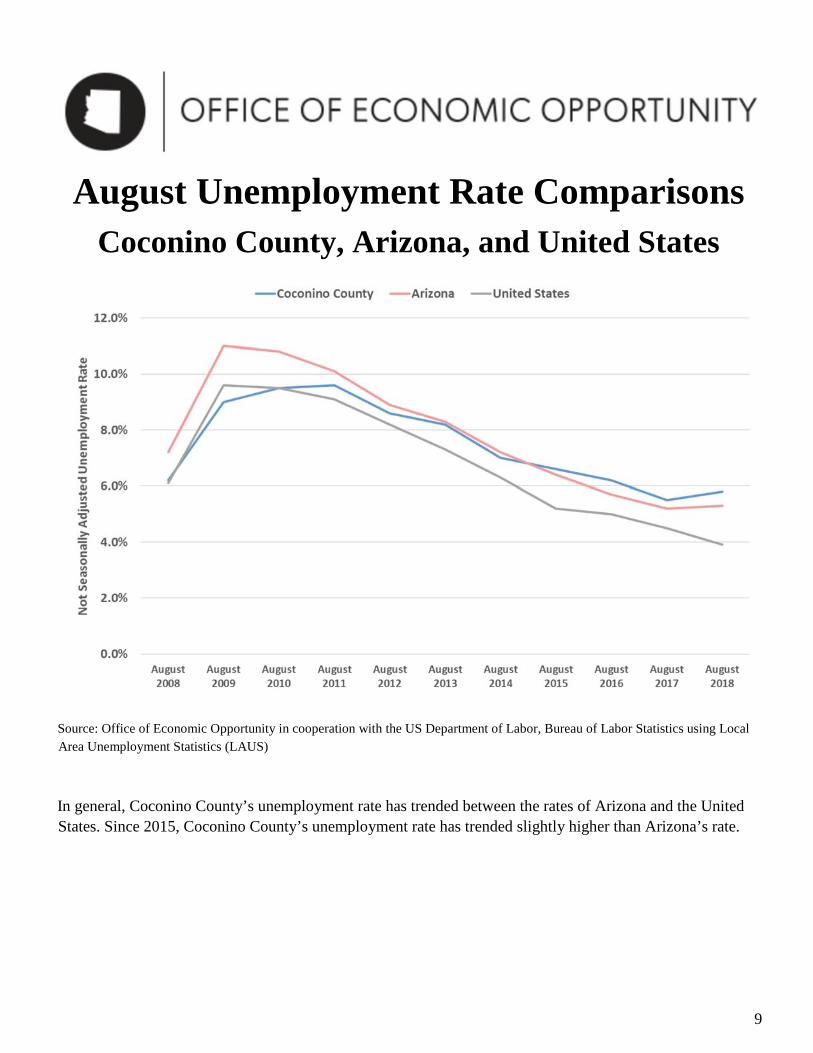
August Unemployment Rate Comparisons Coconino County, Arizona, and United States
Source: Office of Economic Opportunity in cooperation with the US Department of Labor, Bureau of Labor Statistics using Local Area Unemployment Statistics (LAUS)
In general, Coconino County’s unemployment rate has trended between the rates of Arizona and the United States. Since 2015, Coconino County’s unemployment rate has trended slightly higher than Arizona’s rate.

10
Coconino County Industry Nonfarm Employment Share
2001 and 2017 Annual Averages Industry Employment
Share 2001
Employment Share 2017
Change
Education and Health Services 10.9% 14.3% 3.3%
Leisure and Hospitality 19.1% 22.1% 3.0%
Manufacturing 4.8% 6.4% 1.6%
Professional and Business Services 4.4% 4.8% 0.3%
Other Services 2.7% 2.7% -0.1%
Information 0.9% 0.7% -0.1%
Financial Activities 2.6% 2.1% -0.5%
Mining and Construction 4.6% 3.6% -1.0%
Trade, Transportation, and Utilities 15.5% 14.1% -1.4%
Government 34.5% 29.3% -5.2%
Total 100.0% 100.0% 0.0%
Source: Produced by the Arizona Office of Economic Opportunity using CES data in coopera on with the US Department of Labor, Bureau of Labor Sta s cs
Coconino County’s economy has changed in the 21st century. While total employment has grown, the distribution between industries has changed over time. Government employment has lost the most shares (-5.2%). It is followed by Trade, Transportation, and Utilities (-1.4%) and Mining and Construction (-1.0%). Generally, Mining and Construction is dominated by Construction. These sectors lost shares while employment in three sectors gained roughly equal shares: Education and Health Services (3.3%); Leisure and Hospitality (3.0%); and Manufacturing (1.6%). Generally, Education and Health Services is dominated by Health Services.

11
Coconino County Nonfarm Employment Historical Over The Year Numeric Changes
Source: Office of Economic Opportunity in cooperation with the US Department of Labor, Bureau of Labor Statistics using Current Employment Statistics (CES)
Coconino County has reported modest and consistent annual total nonfarm job growth since 2011.
August 2018 Nonfarm Employment Report Coconino County Numeric Over-the-Year Employment Gain/Loss by Sector

12
rent Employment Statistics (CES)
Coconino County Percentage Over-the-Year Employment Gain/Loss by Sector August 2018
rent Employment Statistics (CES)
In August of 2018, Coconino County saw significant annual job growth in Leisure and Hospitality; Education and Health Services; and Mining and Construction. Professional and Business Services and Trade, Transportation, and Utilities saw modest declines.
August 2018
Source: Office of Economic Opportunity in cooperation with the US Department of Labor, Bureau of Labor Statistics using Cur-
Source: Office of Economic Opportunity in cooperation with the US Department of Labor, Bureau of Labor Statistics using Cur-

13
2017‐2019 Coconino County Industry Employment Projec ons North American Industry Classifica on (NAICS) 2‐Year Change
000000 Total All Industries 70,107 72,350 2,243 3.2%
000067 Self‐Employed and Unpaid Family Workers, All Jobs 3,864 4,035 171 4.4%
000990 Unclassified Payroll Employment 471 483 12 2.5%
110000 Agriculture, Forestry, Fishing and Hun ng 2,334 2,407 73 3.1%
210000 Mining 31 30 ‐1 ‐3.2%
220000 U li es 766 676 ‐90 ‐11.7%
230000 Construc on 2,487 2,627 140 5.6%
310000 Manufacturing 4,247 4,303 56 1.3%
420000 Wholesale Trade 894 846 ‐48 ‐5.4%
440000 Retail Trade 6,931 6,938 7 0.1%
480000 Transporta on and Warehousing 1,562 1,605 43 2.8%
510000 Informa on 620 649 29 4.7%
520000 Finance and Insurance 669 662 ‐7 ‐1.0%
530000 Real Estate and Rental and Leasing 714 733 19 2.7%
540000 Professional, Scien fic, and Technical Services 1,524 1,639 115 7.5%
550000 Management of Companies and Enterprises 181 191 10 5.5%
Administra ve and Support and Waste Management and 560000 1,697 1,741 44 2.6%
Remedia on Services 610000 Educa onal Services 7,656 7,717 61 0.8%
620000 Health Care and Social Assistance 10,084 10,483 399 4.0%
710000 Arts, Entertainment, and Recrea on 3,248 3,669 421 13.0%
720000 Accommoda on and Food Services 13,499 14,202 703 5.2%
810000 Other Services (Except Government) 2,278 2,307 29 1.3%
900000 Government 4,350 4,407 57 1.3%

14
Arizona Office of Economic Opportunity 2017‐2019 Industry Projec ons
Arts, Entertainment, and Recrea on (13.0%); Professional, Scien fic, and Technical Services (7.5%); Construc on (5.6%); Management of Companies and Enterprises (5.5%); and Accommoda on and Food Services (5.2%) are all projected to have growth rates that exceed 5.0% growth rates over the two year projec on period. Accommoda on and Food Services (703 jobs); Arts, Entertainment, and Recrea on (421 jobs); and Health Care and Social Assistance (399 jobs) are projected to have the largest numeric increases in Coconino County during the two year projec on period.
2017‐2019 Projected Job Growth by Region
2017 Es mated Total Employment
Area Name Level
2019 Es mated Total
Employment Level
2‐year Numeric Growth
2‐Year Annualized Percentage
Growth
Arizona 2,933,968 3,086,936 152,968 2.6%
Coconino County 70,107 72,350 2,243 1.6%
Maricopa County 2,067,036 2,190,157 123,121 3.0%
Mohave and La Paz 59,173 61,573 2,400 2.0%
Northeastern Arizona 74,509 76,772 2,263 1.5%
Pima County 392,316 405,671 13,355 1.7%
Pinal County 66,356 69,239 2,883 2.1%
Santa Cruz County 15,080 15,156 76 0.3%
Southeastern Arizona 53,375 55,103 1,728 1.6%
Yavapai County 69,233 72,103 2,870 2.1%

15
Yuma County 66,281 68,306 2,025 1.5% Arizona Office of Economic Opportunity 2017‐2019 Industry Projec ons
The different regions in Arizona are projected to experience job growth during the projec ons period. Some are projected to grow faster than others, but the growth rates are projected to be posi‐
ve.
Coconino County Commuting Patterns Coconino County 2015
Work in Live in Coconino Coconino
County and County and Live Work
Elsewhere Elsewhere
17,673 14,613
Source: Produced by the Arizona Office of Economic Opportunity using On The Map in cooperation with the US Census Bureau
Work and Live in Coconino County
34 ,192

16
On The Map can provide information about commuting patterns for residents and workers within Coconino County. Most workers in Coconino County also live in Coconino County, but there are both inflows and outflows. Coconino County has slightly more workers coming into the area for work than leaving the area.
The dark green circle represents the population that works in Coconino County (51,865 individuals). The light green circle represents the population that lives in Coconino County (48,805 individuals). The area where the circles overlap represents the population that both lives and works within Coconino County (34,192 individuals).
Top 9 Places of Residence for Coconino County Workers (Flagstaff Excluded)
Coconino County 2015
Source: Produced by the Arizona Office of Economic Opportunity using On The Map in cooperation with the US Census Bureau

17
Of the 51,865 individuals who work in Coconino County, these are the top 9 places where these individuals live (dark green circle). Flagstaff is the top place for Coconino County workers to live, but it was excluded because the scale would have made the nine places listed incomprehensible. 21,124 of the 51,865 individuals who work in Coconino County live in Flagstaff (40.7%).
Top 9 Places of Employment for Coconino County Residents (Flagstaff Excluded) Coconino County 2015
Of the 48,805 individuals who live in Coconino County, these are the top 9 places where these individuals work (light green circle). Flagstaff is the top place for Coconino County residents to work, but it was
Source: Produced by the Arizona Office of Economic Opportunity using On The Map in cooperation with the US Census Bureau

18
excluded because the scale would have made the nine places listed incomprehensible. 24,340 of the 48,805 individuals who live in Coconino County work in Flagstaff (49.9%).
Data Sources
LaborStats.az.gov
Employment Data:
laborstats.az.gov/employment
Unemployment Data:
laborstats.az.gov/unemployment
Wage & Income Data:
laborstats.az.gov/wages‐income
Employment Projec ons Data:
laborstats.az.gov/employment‐forecasts
Popula on Data:
laborstats.az.gov/popula on
Other Labor Market Data Sources
Commu ng Pa erns Data:
On the Map: onthemap.ces.census.gov/
Demographics Data:
American Community Survey: census.gov/programs‐surveys/acs/
Personal Income and State GDP Data:
US Bureau of Economic Analysis: bea.gov/regional/index.htm

19
Interac ve Employment Mapping
Maricopa Associa on of Governments: h p://geo.azmag.gov/maps/azdemographics/
Skills and Training Requirement Data:
O*NET: onetonline.org/find/descriptor/browse
Contact Information
Website: h ps://laborstats.az.gov
Phone: 602.771.2222
Office Email: [email protected]
Doug Walls: [email protected]

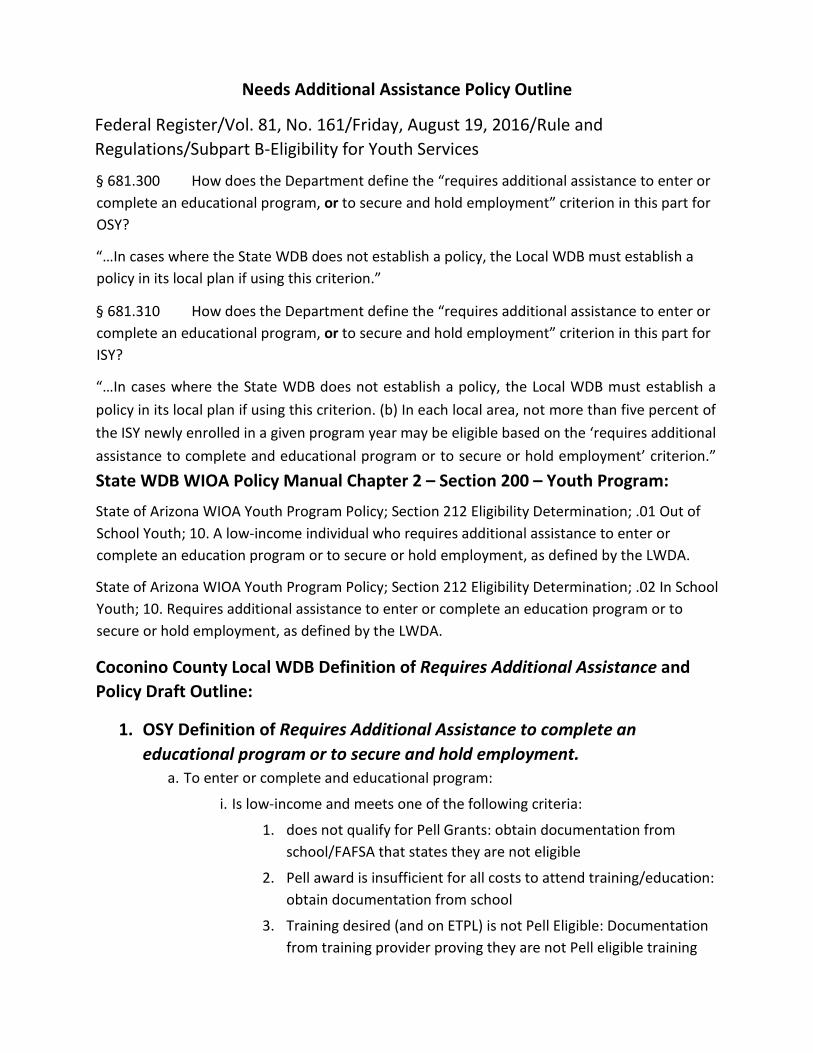
Needs Additional Assistance Policy Outline
Federal Register/Vol. 81, No. 161/Friday, August 19, 2016/Rule and Regulations/Subpart B‐Eligibility for Youth Services
§ 681.300 How does the Department define the “requires additional assistance to enter or complete an educational program, or to secure and hold employment” criterion in this part for OSY?
“…In cases where the State WDB does not establish a policy, the Local WDB must establish a policy in its local plan if using this criterion.”
§ 681.310 How does the Department define the “requires additional assistance to enter or complete an educational program, or to secure and hold employment” criterion in this part for ISY?
“…In cases where the State WDB does not establish a policy, the Local WDB must establish a policy in its local plan if using this criterion. (b) In each local area, not more than five percent of the ISY newly enrolled in a given program year may be eligible based on the ‘requires additional assistance to complete and educational program or to secure or hold employment’ criterion.”
State WDB WIOA Policy Manual Chapter 2 – Section 200 – Youth Program:
State of Arizona WIOA Youth Program Policy; Section 212 Eligibility Determination; .01 Out of School Youth; 10. A low‐income individual who requires additional assistance to enter or complete an education program or to secure or hold employment, as defined by the LWDA.
State of Arizona WIOA Youth Program Policy; Section 212 Eligibility Determination; .02 In School Youth; 10. Requires additional assistance to enter or complete an education program or to secure or hold employment, as defined by the LWDA.
Coconino County Local WDB Definition of Requires Additional Assistance and Policy Draft Outline:
1. OSY Definition of Requires Additional Assistance to complete an educational program or to secure and hold employment.
a. To enter or complete and educational program:
i. Is low‐income and meets one of the following criteria:
1. does not qualify for Pell Grants: obtain documentation from school/FAFSA that states they are not eligible
2. Pell award is insufficient for all costs to attend training/education: obtain documentation from school
3. Training desired (and on ETPL) is not Pell Eligible: Documentation from training provider proving they are not Pell eligible training

and AJC print out showing in is on ETPL/case note stating it is on ETPL.
4. First generation college student and has insufficient family support
b. To secure and hold employment:
i. Applicant proves to be unprepared for job search because they are lacking at least one of the following:
1. Resume
2. Interview knowledge/experience
3. Job application experience
4. Workplace skills
5. Transportation
6. Appropriate Attire
7. Clear career direction: Can use YES Assessment as documentation 8.
2. ISY Definition of Requires Additional Assistance to complete an educational program or to secure and hold employment.
a. To enter or complete and educational program must have one of the following barriers:
i. Transportation
ii. Does not qualify for Pell Grants: obtain documentation from school/FAFSA that states they are not eligible
iii. Pell award is insufficient for all costs to attend training/education: obtain documentation from school
iv. Needs assistance with cost of school supplies needed to complete training/education.
v. Has been awarded Needs Based Scholarship
b. To enter or secure and hold employment
i. Applicant proves to be unprepared for job search because they are lacking at least one of the following:
1. Resume
2. Interview knowledge/experience
3. Job application experience
4. Workplace skills
5. Transportation

6. Appropriate Attire
7. Clear career direction: Can use YES Assessment as documentation
8. Proper academic support such as a tutor to remain in school and hold employment concurrently (Youth Element for Dropout Prevention):
a. Has a low GPA
b. Behind in credits and in need of credit recovery plan
c. In jeopardy of dropping out of school
Local Workforce Development Area Coconino County Arizona
2017-2021 Workforce Plan
2019 Modification
Definition of Underemployed. Individuals who are Underemployed can be considered as having stop-gap employment. The definition of underemployed is an individual who is:
• Employed less than full-time but is seeking full-time employment; or • Employed in a position that is inadequate with respect to their skills and training; or • Employed and meets the definition of low income; or • Employed, but whose current job earnings are not sufficient compared to their earnings
from their job of dislocation.