Clare Narrod, JIFSAN, University of...
28
Risk analysis training program Clare Narrod, JIFSAN, University of Maryland 1 Univ. Of Maryland & US FDA Joint Institute for Food safety and Applied Nutrition
Transcript of Clare Narrod, JIFSAN, University of...

Risk analysis training program Clare Narrod, JIFSAN, University of Maryland
1 Univ. Of Maryland & US FDA Joint Institute for Food safety and Applied Nutrition
2 Univ. Of Maryland & US FDA Joint Institute for Food safety and Applied Nutrition
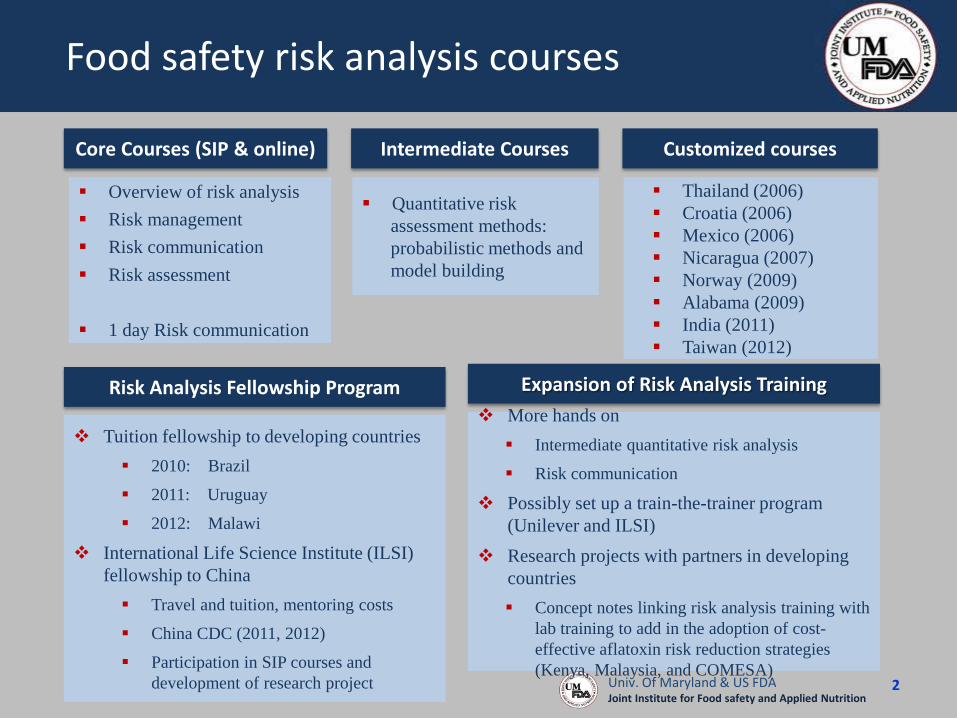
Food safety risk analysis courses
Core Courses (SIP & online)
Overview of risk analysis Risk management Risk communication Risk assessment
1 day Risk communication
Intermediate Courses
Quantitative risk assessment methods: probabilistic methods and model building
Customized courses
Thailand (2006) Croatia (2006) Mexico (2006) Nicaragua (2007) Norway (2009) Alabama (2009) India (2011) Taiwan (2012)
Tuition fellowship to developing countries 2010: Brazil
2011: Uruguay
2012: Malawi
International Life Science Institute (ILSI) fellowship to China Travel and tuition, mentoring costs
China CDC (2011, 2012)
Participation in SIP courses and development of research project
Risk Analysis Fellowship Program Expansion of Risk Analysis Training More hands on Intermediate quantitative risk analysis
Risk communication
Possibly set up a train-the-trainer program (Unilever and ILSI)
Research projects with partners in developing countries Concept notes linking risk analysis training with
lab training to add in the adoption of cost-effective aflatoxin risk reduction strategies (Kenya, Malaysia, and COMESA)

Lectures in classroom

4

5 Univ. Of Maryland & US FDA Joint Institute for Food safety and Applied Nutrition
Food safety risk analysis courses
Have trained 1300 individuals from over 32 different countries who took over 2000 course
‘

China ILSI Fellowship Dr Zhu: Salmonella in Broiler Chicken Dr Song: Campylobacter in Broiler Chicken
China National Center for Food Safety Risk Assessment, established 2011

8 Univ. Of Maryland & US FDA Joint Institute for Food safety and Applied Nutrition
FoodRisk.org database
Only comprehensive on-line resource for food safety risk analysis;
Includes unique datasets, tools, and links to numerous sources of information.
New Web based tools Interactive online Catalogue of quantitative
risk assessments (Netherlands, Denmark, JIFSAN)
Food Commodity Intake Database, 2003-2006 (EPA) to improve the utility of the WWEIA food consumption survey for dietary exposure assessment
iRisk – FDA allows users to evaluate the risk posed by various food-borne hazards in the food supply, and conduct preliminary ranking of these hazards in order to efficiently prioritize risk management options.
Produce Point of Origin Database links USDA commodity shipment data to CFSAN’s outbreak and positive-findings data
Page for analyses supporting rulemaking process + links to rules
Host to the US Interagency Risk Assessment Consortium
Last year Site is visited regularly by users in every country (193); Has been visited by more than 100 Countries over 10 times Last year over 20,000 unique visitors/computers; 100,000 pages visited

Interactive online Catalogue of quantitative risk assessments (ICRA)
9

Food Commodity Intake Database, 2003-2006
10

iRisk
11

Produce Point of Origin Database (PPOD)
12

Analyses supporting rulemaking
13

Metrics Project
JIFSAN, University of Maryland
14 Univ. Of Maryland & US FDA Joint Institute for Food safety and Applied Nutrition

15 Univ. Of Maryland & US FDA Joint Institute for Food safety and Applied Nutrition
METRICS
JIFSAN developing pilot evaluation tools/instruments to measure effectiveness and impact of its international capacity building training programs
Food Modernization Act charged FDA to develop a comprehensive plan to expand the technical, scientific and regulatory capacity of foreign governments, and their respective food industries, from which the foods are exported to the US
1) Retrospect of past programs Numbers trained and people/hours
2) Framework for measuring impact 3) Work with instructors to develop survey instruments 4) International programs abroad getting buy in from partners

GAP Training Programs (2000-12) Trinidad 2000 Brazil 2001 Dominican Republic, Mexico, Puerto Rico 2002 Mexico (2), Peru 2003 Guatemala, Honduras, Korea 2004 Thailand, Brazil, Mexico 2005 Mexico, El Salvador, China 2006 Guatemala, Peru, Nicaragua 2007 Costa Rica, Honduras 2008 Honduras, Dominican Republic, Guatemala, Mexico, El Salvador 2009 Peru, Costa Rica, Mexico (2) 2010 Mexico 2011 Honduras (Central America) 2012
36 trainings in 16 countries

JIFSAN – The programs
0
1
2
3
4
5
6
7
8
9
2000 2001 2002 2003 2004 2005 2006 2007 2008 2009 2010 2011 2012
FoodInspectorTraining
CommercialFoodProcessingTechnologyGoodAquaculturalPractices
GoodAgriculturalPractices
Trinidad Brazil Dominican Republic, Mexico, Puerto Rico
Mexico (2), Peru
Guatemala, Honduras, Korea
Thailand, Brazil, Mexico
Mexico, El Salvador, China. Vietnam
Guatemala, Peru, Nicaragua
Costa Rica, Honduras. Indonesia, Thailand
Honduras, Dominican Republic, Guatemala, Mexico, El Salvador. Bangladesh. Morocco
Peru, Costa Rica, Mexico (2) . Bangladesh, Malaysia, US*. China
Mexico. Bangladesh, China. China.
Honduras (Central America), India (spices and botanicals). India, Vietnam. China.
GAPs: 34 trainings in 17 countries GAqPs: 10 trainings in 7 countries
17 Univ. Of Maryland & US FDA Joint Institute for Food safety and Applied Nutrition
* 10 day internship in US for 9 Bangladeshi trainers (2010)

18 Univ. Of Maryland & US FDA Joint Institute for Food safety and Applied Nutrition
JIFSAN Training achievements – GAPs
0
50
100
150
200
250
2000 2001 2002 2003 2004 2005 2006 2007 2008 2009 2010 2011 2012 2013
Part
icip
ants
Trinidad, West IndiesThailandPuerto RicoPeruNicaraguaMexicoKoreaJamaicaHondurasGuatemalaEl SalvadorEcuadorDominican RepublicCosta RicaChina
0
200
400
600
800
1000
1200
2000 2001 2002 2003 2004 2005 2006 2007 2008 2009 2010 2011 2012 2013
Trai
ning
-day
s
JamaicaEcuadorHondurasCosta RicaNicaraguaChinaEl SalvadorThailandKoreaGuatemalaPeruMexicoDominican RepublicPuerto RicoBrazil

19 Univ. Of Maryland & US FDA Joint Institute for Food safety and Applied Nutrition
JIFSAN Training achievements – GAqPs
0
20
40
60
80
100
120
140
2006 2007 2008 2009 2010 2011 2012 2013
Part
icip
ants
Vietnam
Thailand
Peru
Malaysia
India
Indonesia
China
US
Bangladesh
0
100
200
300
400
500
600
700
2006 2007 2008 2009 2010 2011 2012 2013
Tra
inin
g D
ays
Vietnam
Thailand
Peru
Malaysia
India
Indonesia
China
US
Bangladesh

20 Univ. Of Maryland & US FDA Joint Institute for Food safety and Applied Nutrition
JIFSAN Training achievements –Risk Analysis
0
20
40
60
80
100
120
140
2006 2007 2008 2009 2010 2011 2012
US
Thailand
Taiwan
Norway
Nicaragua
Mexico
India.
Croatia
Canada
0
50
100
150
200
250
300
350
400
450
2006 2007 2008 2009 2010 2011 2012
US
Thailand
Taiwan
Norway
Nicaragua
Mexico
India.
Croatia
Canada
Customized SIP
0
20
40
60
80
100
120
140
160
2009 2010 2011 2012
intro to riskcommunciationquantitativerisk assessmentriskcommunicationriskmanagementQualitative
Overview
0
50
100
150
200
250
300
350
400
2009 2010 2011 2012
intro to riskcommunciationquantitativerisk assessmentriskcommunicationriskmanagementQualitative
Overview

Pre-training
Post-training
Q3: Post-training (Instructors Assessment)
Inst
ruct
or(s
)
Process Evaluation (Conducted immediately pre- and post-training)
Outcome Evaluation (Conducted 6 & 12 months post-
training)
Impact Evaluation (Conducted >1 year post-training)
Exte
rnal
So
urce
s
Q1: Pre-training (Knowledge, Attitudes,
Practices)
FT1: Pre-training (Factual test)
FT2: Post-training (Factual test)
Q2: Post-training (Knowledge, Attitudes,
Practices)
Trai
nees
Q4: Follow-up (Knowledge, Attitudes,
Practices)
JIFSAN Training Course
Statistical Source Review of Impact
Indicators
Further analysis (Need to establish link
Between Outcome and Impact)
22 Univ. Of Maryland & US FDA Joint Institute for Food safety and Applied Nutrition
METRICS: Approach to Evaluating the Effectiveness of JISFAN Training Courses

23 Univ. Of Maryland & US FDA Joint Institute for Food safety and Applied Nutrition
trainees’ socio-economic background (age, gender, education, nationality, etc.)
professional status (role in company/ industry/government, years in the profession)
perceptions regarding deficiencies (equipment, infrastructure, etc.) their company/agency faces;
questions on past involvement in food safety training activities, self-assessment of current skills
Pre KAP Post KAP
trainees’ satisfaction with the different components of the training and with the instructors’ display;
Self-assessment of ones understanding and readiness to implement the different components covered during the training
Knowledge, attitude, and practices - based on the participants’ opinions and stated satisfaction regarding training
METRICS - 1st Process Indicator: KAP assessment (pre/post)
Can be used by the instructors to adjust the training to the trainees' needs
Can be used by the instructors to adjust the training based on trainees’ satisfaction

0
10
20
30
40
50
60
Clear CourseObjectives
ThoroughCourseContent
AccuratePracticeExercises
UsefulMaterials
Relevancy
Rank your satisfaction with...
StronglyAgreeAgree
Neither
Disagree
StronglyDisagree
0
10
20
30
40
50
60
before the Training after the Training
Rank your Knowledge...
High
ModeratelyHigh
Average
ModeratelyLow
Low
Yes 91%
No 0%
Maybe 9%
Other 0%
Would you recommand this training...
Strongly Disagree
4% Disagree 4% Neither
6%
Agree 56%
Strongly Agree 30%
Your Goals were achieved
24 Univ. Of Maryland & US FDA Joint Institute for Food safety and Applied Nutrition
METRICS - 1st Process Indicator: KAP analysis of GAPs training Honduras

0
10
20
30
40
50
60
Importance ofGAP and GMP
GoodAgricultural
Practices
GoodManufacturing
Practices
Fresh Produce Pesticides andFood Safety
Food Safety &Quality
Assurance
DevelopingEffectiveTraining
Food Laws &Regulations
PracticalExercises
Rank your satisfaction with...
Strongly Agree
Agree
Neither
Disagree
Strongly Disagree
0
10
20
30
40
50
60
Importance ofGAP and GMP
GoodAgricultural
Practices
GoodManufacturing
Practices
Fresh Produce Pesticides andFood Safety
Food Safety &Quality
Assurance
DevelopingEffectiveTraining
Food Laws &Regulations
PracticalExercises
Rank your ability in applying the new skills ...
Strongly Agree
Agree
Neither
Disagree
Strongly Disagree

26 Univ. Of Maryland & US FDA Joint Institute for Food safety and Applied Nutrition
METRICS – 2nd Process Indicator: Factual Tests
Provides a quantifiable measure on the impact of the training program;
Survey tests administered in class via ‘digi-voting’ to make it pleasant and interactive for the trainees; results displayed on PowerPoint;
Anonymous - answer fall in a bar chart vis-à-vis the other students;
Enable us to gauge what people learned during the training, and identify potential areas where improvement is needed;
Pre Factual Test Report from a previous training

27
METRICS – 2nd Process Indicator: Quantitative Risk Analysis Factual Test
27 Univ. Of Maryland & US FDA Joint Institute for Food safety and Applied Nutrition
Evolution (Number and Percentage) of correct answers before and after the training
-4
-2
0
2
4
6
8
10
12
14
Q1 Q2 Q3 Q4 Q5 Q6 Q7 Q8 Q9 Q10 Q11 Q12 Q13 Q14 Q15 Q16 Q17 Q18 Q19 Q20 Q21 Q22 Q23 Q24 Q25
Before
After
Change

28
METRICS – 2nd Process Indicator: IFSTL Factual Tests
Result of factual test administered pre/post Salmonella course
Result of factual test administered pre/post Cronobacter course. (After* adjusted to the number of
participants)
Result of factual test administered pre/post E coli course
0
1
2
3
4
Q1 Q2 Q3 Q4 Q5 Q6 Q7 Q8 Q9 Q10 Q11 Q12 Q13 Q14 Q15
Before
After
Change
0
2
4
6
8
Q1 Q2 Q3 Q4 Q5 Q6 Q7 Q8 Q9 Q10 Q11
Before
After*
Change
0
2
4
6
Q1 Q2 Q3 Q4 Q5 Q6 Q7 Q8 Q9
Before
After
Change
28 Univ. Of Maryland & US FDA Joint Institute for Food safety and Applied Nutrition

29 Univ. Of Maryland & US FDA Joint Institute for Food safety and Applied Nutrition
Measure the multiplier effect of the training programs and to understand what of the previous trainings trainers were able to implement and if parts were not implemented to understand why
Administered 6 and 12 months after the training
Case of the international programs, the evaluation tool are being developed jointly by JIFSAN and the organization requesting the training
Intermediate assessment post training Impact Indicators
Assess long term impacts that may be attributable to the trainings such as increased trade, reduced # of rejected product, reduced food borne outbreaks traced to imported foods, reduced foodborne outbreaks domestically (from exporting country).
Propose to use existing data sources (FDA/CDC, UNCOMTRADE….) and other statistical data bases.
METRICS – Outcome & Impact Indicators
30