Claim simulations and liability estimation methods · Claim simulations and liability estimation...
23
Claim simulations and liability estimation methods Prepared by Richard Cumpston and Hugh Sarjeant Presented to the Institute of Actuaries of Australia XIV General Insurance Seminar 2003 9-12 November 2003 This paper has been prepared for issue to, and discussion by, Members of the Institute of Actuaries of Australia (IAAust). The IAAust Council wishes it to be understood that opinions put forward herein are not necessarily those of the IAAust and the Council is not responsible for those opinions. 2003 Institute of Actuaries of Australia The Institute of Actuaries of Australia Level 7 Challis House 4 Martin Place Sydney NSW Australia 2000 Telephone: +61 2 9233 3466 Facsimile: +61 2 9233 3446 Email: [email protected] Website: www.actuaries.asn.au
-
Upload
nguyenkhanh -
Category
Documents
-
view
224 -
download
0
Transcript of Claim simulations and liability estimation methods · Claim simulations and liability estimation...

Claim simulations and liability estimation methods
Prepared by Richard Cumpston and Hugh Sarjeant
Presented to the Institute of Actuaries of Australia XIV General Insurance Seminar 2003
9-12 November 2003
This paper has been prepared for issue to, and discussion by, Members of the Institute of Actuaries of Australia (IAAust). The IAAust Council wishes it to be understood that opinions put forward herein are not necessarily those of
the IAAust and the Council is not responsible for those opinions.
2003 Institute of Actuaries of Australia
The Institute of Actuaries of Australia Level 7 Challis House 4 Martin Place
Sydney NSW Australia 2000 Telephone: +61 2 9233 3466 Facsimile: +61 2 9233 3446
Email: [email protected] Website: www.actuaries.asn.au

Claim simulations and liability estimation methods
Richard Cumpston and Hugh Sarjeant
This paper has been written for the Institute of Actuaries of Australia GeneralInsurance Seminar in Canberra, 9-12 November 2003. Richard and Hugh aredirectors of Cumpston Sarjeant Truslove, consulting actuaries, Melbourne.
Summary
This paper uses simulated claims to generate claim liability error distributions for fiveaggregate estimation methods. Error distributions are also derived for premiumliability estimates. Results are given for five classes of insurance. Someconclusions are
• simulated claims can be used to choose between estimation methods,and to estimate risk margins for premium and claim liabilities
• for up to about 10,000 claims pa, risk margins decrease with increasingclaim numbers, and are broadly similar for all the classes modelled
• above 10,000 claims pa, risk margins depend on external factors suchas inflation and legislation.
• if the standard error of case estimates is about 1, case estimate-basedmethods are likely to be more reliable than other aggregate methods
• our best simulations give 75% probability estimates for compulsory thirdparty insurance broadly similar to those of Collings & White (2001).
Background to paper
The Royal Commissioner's report on HIH (April 2003, xvii) concluded
"The deficiency of several billion dollars has arisen because claimsarising from insured events in previous years were far greater than thecompany had provided for."
One of the issues in the evidence to the Commission was whether actuaries shouldpay any regard to case estimates.
At the Institute of Actuaries of Australia Convention on 20/5/03, Geoff Atkinscommented that the new role of appointed actuaries under the Insurance Act 1973 isnot yet supported by adequate actuarial science. He doubted the validity of the Mackmethod of estimating the variance of claims estimates, and hoped that prospectiveestimates could be made.
Richard Cumpston and Hugh Sarjeant 1 LiabilityEstimationIAA.xls 7/10/2003

A presentation on 26/5/03, by Robert Thomson and Helen Martin of APRA, discussedthe estimates of risk margins and diversification benefits made by appointedactuaries. There appears to be considerable reliance on recent papers by Bateup &Reed (2001) and Collings and White (2001), both of which used the Mack method tosuggest risk margins.
Early this year we were involved in two sets of litigation involving actuarial valuationsof transferred claims.
Greg Taylor (2003) has suggested that actuaries are most likely to be sued overrelatively small jobs.
Needs for liability estimates
Some of the needs for liability estimates in practice are
• premium-setting• balance-sheet provisions for premium and claim liabilities• insurer mergers, acquisitions and share market floats• transfers of self-insured workers compensation claims• guarantees for self-insured workers compensation claims• reinsurance strategies• changes to legislation.
Some liability estimation methods used in practice
Estimation method Data used
premium basis claim numbers and sizespayment chain ladder claim payments by accident and payment periodspayments per claim incurred claim numbers reported by accident and report periods
claim payments by accident and payment periodspayments per claim finalised claim numbers reported by accident and report periods(and payments per claim payments by accident and payment periodsclaim outstanding) claim numbers outstanding by accident periods and
estimation datesincurred chain ladder payments plus case estimates by accident periods and
estimation datesprojected case estimates claim payments by accident and payment periods
case estimates by accident periods and estimation datesstatistical case estimates statistical models fitted to individual claimant
characteristics and payment detailscase estimates estimates based on full knowledge available on each claim
Variations of these methods found in practice include
• payment per claim incurred estimates made separately for each
Richard Cumpston and Hugh Sarjeant 2 LiabilityEstimationIAA.xls 7/10/2003

payment type (particularly for monopoly compensation schemes)• projected case estimates based on the development of reported claims,
with separate estimates for claims incurred but not reported• estimates from several methods combined, taking into account the
expected reliability of each method for each accident year.
Methods using individual claims data
England & Verrall (2002, p507) commented
"With the continuing increase in computer power, it has to be questionedwhether it would not be better to examine individual claims rather thanaggregated data… Models could be developed, investigating, for example,the time taken to report claims, the sizes and timings of partialpayments, the delay between occurrence and reporting of claims … thisallows much closer modelling of the process, including the individualcase reserve amounts."
For at least a decade, it has been common Australian actuarial practice to obtainindividual claims data, and to fit a variety of statistical models (Taylor 2003). Butaggregate methods are still widely used, and assistance in judging theirreliability may be useful. This paper uses individual claim simulations to estimateerror-distributions for five commonly used aggregate methods.
Modelling process
Our modelling process is shown in the above flow-chart:
• individual claims are randomly simulated for the selected classes, andstored in a database
• successive annual valuations are made of outstanding claims, using theselected methods, and the results stored in the database
• the valuation errors are sorted by size, and 70%, 75%, 80% and 85%points reported, together with means and standard deviations.
Although using a database increased run times, it proved very useful in checking
Report results
Simulate claims
Valueclaims
Database
Richard Cumpston and Hugh Sarjeant 3 LiabilityEstimationIAA.xls 7/10/2003
results.
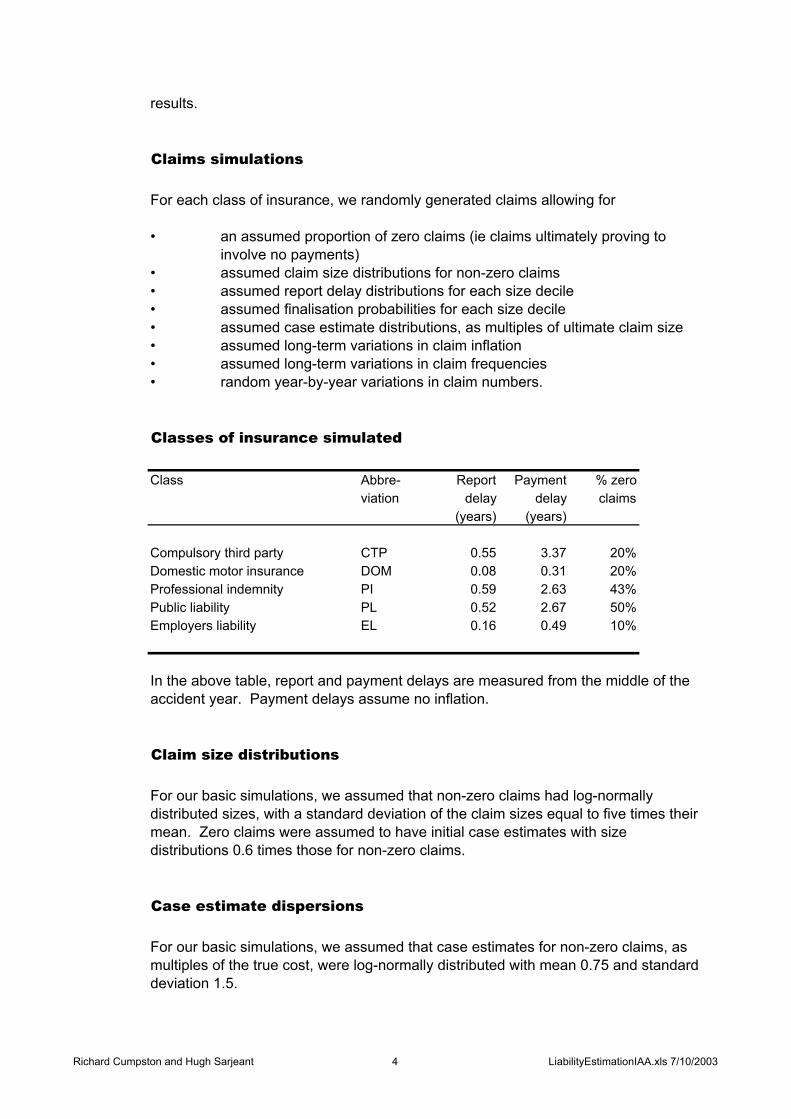
Claims simulations
For each class of insurance, we randomly generated claims allowing for
• an assumed proportion of zero claims (ie claims ultimately proving toinvolve no payments)
• assumed claim size distributions for non-zero claims• assumed report delay distributions for each size decile• assumed finalisation probabilities for each size decile• assumed case estimate distributions, as multiples of ultimate claim size• assumed long-term variations in claim inflation• assumed long-term variations in claim frequencies• random year-by-year variations in claim numbers.
Classes of insurance simulated
Class Abbre- Report Payment % zeroviation delay delay claims
(years) (years)
Compulsory third party CTP 0.55 3.37 20%Domestic motor insurance DOM 0.08 0.31 20%Professional indemnity PI 0.59 2.63 43%Public liability PL 0.52 2.67 50%Employers liability EL 0.16 0.49 10%
In the above table, report and payment delays are measured from the middle of theaccident year. Payment delays assume no inflation.
Claim size distributions
For our basic simulations, we assumed that non-zero claims had log-normallydistributed sizes, with a standard deviation of the claim sizes equal to five times theirmean. Zero claims were assumed to have initial case estimates with sizedistributions 0.6 times those for non-zero claims.
Case estimate dispersions
For our basic simulations, we assumed that case estimates for non-zero claims, asmultiples of the true cost, were log-normally distributed with mean 0.75 and standarddeviation 1.5.
Richard Cumpston and Hugh Sarjeant 4 LiabilityEstimationIAA.xls 7/10/2003

Report and finalisation patterns
Claims simulations require assumptions about the reporting and finalisation patternsof different sizes of claims, rather than average assumptions about all claims.These assumptions should be based on analyses of relevant individual claims data.While we had access to some specialist data, we had concerns about confidentialityand representativeness. We were also deterred by the work needed to derivereasonable assumptions.
We thus derived assumptions for five classes of insurance, intended toapproximately reproduce the reporting, finalisation and payment delays evident fromthe last published runoff tables (Insurance and Superannuation Commission 1998). The resulting reporting and finalisation patterns are in appendix C, separately for zeroclaims and for each size decile of non-zero claims. We strongly recommendagainst the use of these patterns for any particular portfolio.
Zero claims
In practice, the proportions of zero claims depend on the nature of the business, andon office practice in establishing claim files. The above assumptions may not berealistic for many insurers. The underlying proportion of zero claims for each classwas assumed to randomly vary each year in a band from 90% to 110% of theassumed proportion. In general, the higher the proportion of zero claims, the higherthe risk margins, as there are fewer claims generating payments.
Years simulated
Number claims pa Years simulated Claims simulated
100 1000 100,000300 300 90,0001000 100 100,0003000 100 300,00010000 100 1,000,000
For simulations with 1000 or less claim pa, we felt that at least 100,000 claimsneeded to be simulated to give reasonably reliable variability estimates. Forsimulations with more than 1000 claim pa, we felt that at least 100 experience yearsneeded to be simulated in order to get reasonably representative samples of claimsinflation and long-term claim number fluctuations. In addition to the simulation yearsshown in the above table, an initial 10 years was used to generate initial claimsoutstanding.
Richard Cumpston and Hugh Sarjeant 5 LiabilityEstimationIAA.xls 7/10/2003

Premium liability estimates
Payments per claim incurred estimates were made of premium liabilities, usingexponential smoothing to estimate the number of claims likely to arise from thecoming year of cover: The number of claims expected in year n was estimated as
0.2 * (number of claims in year n-1) + 0.8 * (number claims expected in year n-1)
Claim size inflation
A single claim size index was randomly generated, intended to represent thecombined effects of both inflation and superimposed inflation. For convenience, aclaim size index was generated intended to fluctuate around a long-term value of 1.This was done by
• generating a random number for each projection year from a normaldistribution with zero mean and 5% standard distribution
• calculating a size variable for the year as the generated randomnumber plus 80% of the size variable for the preceding year
• taking the exponential of the size variable to get the claim size index (doneto avoid negative values).
The above graph shows one such randomly generated claim size index for a 100year period. Note that no autocorrelation has been assumed between successiveinflation rates, although in practice several years of high inflation have occurredtogether, at times such as the mid 1970s.
Randomly generated claim size index
0.75
1.00
1.25
0 20 40 60 80 100
Projection year
Richard Cumpston and Hugh Sarjeant 6 LiabilityEstimationIAA.xls 7/10/2003

Simulations of 75% risk margins for outstanding claims
The source values for the above graph are in appendix A1. Some generalconclusions from this graph, and those for the other four classes simulated (A2 toA5), are:
• the risk margins needed reduce as the numbers of claims pa increase
• at very high claim numbers, all methods appear to converge to a non-zeroerror
• payment chain ladder estimates are less reliable than those of the otherfour methods simulated (but this conclusion depends on the assumedreliability of case estimates).
Simulations of 75% risk margins for premium liability
75% risk margins for outstanding claims - CTP
0%
25%
50%
100 1000 10000
Number of claims pa
PPCIPCLICLPCEPPCF
75% risk margins for premium liability
0%
10%
20%
30%
100 1000 10000
Number of claims pa
CTPDomesticPIPLEL
Richard Cumpston and Hugh Sarjeant 7 LiabilityEstimationIAA.xls 7/10/2003

Premium liability risk margins also decrease with numbers of claims (see A6), butnot to quite such low levels as outstanding claim risk margins. This is because thereis uncertainty about the numbers of claims in the coming year, as well as uncertaintyabout the level of inflation compared with that in prior years.
Effects of case estimate variability
Our basic simulations were done assuming that case estimates, as a proportion ofthe ultimate cost of the claim, were log-normally distributed, with a mean of 0.75 anda standard deviation of 1.5. Other simulations for compulsory third party were madewith a standard deviation of 0.75, 2.25, 3 and 3.75. Our results show that moreaccurate case estimates give significantly lower estimation errors, both for incurredchain ladder and projected case estimates (see B1 and B2).
Effects of averaging period
75% risk margins for CTP outstandings - ICL
0%
10%
20%
30%
40%
100 1000 10000
Number claims pa
SD=0.75SD=1.50SD=2.25SD=3.00SD=3.75
75% risk margins for CTP outstanding (1000 claims pa)
0%
5%
10%
15%
20%
25%
3 4 5 6 7 8 9
Averaging period in years
PPCIPCLICLPCEPPCF
Richard Cumpston and Hugh Sarjeant 8 LiabilityEstimationIAA.xls 7/10/2003

Longer calendar-year averaging periods reduced the estimation errors in oursimulations for all methods (see B3). In practice there are always doubts about thestability of the claims environment and the office operating procedures, and areluctance to use long averaging periods.
75% risk margins for different estimation methods
Appendix A7 gives 75% risk margins for each accident year, for a compulsory thirdparty claims portfolio with 1000 claims pa. Payment per chain ladder estimates canbe very unreliable at short durations, and this is why they are rarely used for long-tailclasses. Incurred chain ladder and projected case estimates gave surprisingly poor results at long durations, and this may reflect the absence of any development yearsmoothing in our simulations. This needs further investigation, but it does notsupport the blending of payment-based methods at short durations withcase-estimate based methods at long durations.
Comparing 75% margins with 50% of the standard error
Throughout this paper we have shown 75% probability levels, as these proved to bemore stable than standard errors. Our detailed outputs showed that the 75% levelswere nearly always greater than 50% of the standard error (APRA's alternativecapital requirement). Our incurred chain ladder and projected case estimatesimulations did however sometimes generate very high outliers, giving large standarderrors. We suspect these outliers resulted from our lack of development yearsmoothing at old durations, but need to investigate this further.
75% margins for CTP outstanding claims (1000 claims pa)
0%
20%
40%
60%
80%
100%
0 2 4 6 8 10 12
Years since start of accident year
PPCIPCLICLPCEPPCF
Richard Cumpston and Hugh Sarjeant 9 LiabilityEstimationIAA.xls 7/10/2003

Comparisons with Collings & White 75% CTP margins
The above graph compares the 75% percentile results in Collings & White (2001,appendix A) with our best simulations for CTP. Collings & White only rank theirinsurers by size, and we have arbitrarily assumed the smallest insurer had 100claims pa and the largest 10000, with an even spacing between. Our bestsimulations used projected case estimates, and assumed that the standard deviationof case estimates, as multiples of the actual outcomes, was 0.75. Our bestsimulations are broadly similar to those of Collings and White (see A8).
Limitations of work to date
Some of the limitations of our work are
• report delays, finalization probabilities, claim size distributions and caseestimate errors are all broad assumptions, rather than being based onspecific portfolios
• all claims are assumed to be paid in one amount (a particularly poorassumption for employers liability)
• the case estimate for each claim is assumed to be constant until it issettled
• no distinction is made between inflation and superimposed inflation, andtheir combined long-term rate is assumed to be zero
• no allowance is made for discounting
• no allowance is made for correlation between classes (needed ifestimates are to be made of diversification benefits).
• the allowances for inflation and superimposed inflation may understate the
CTP 75% margins from Collings & White
0%
10%
20%
30%
100 1000 10000
Number of claims pa
Stochastic chain ladderMackBest simulations
Richard Cumpston and Hugh Sarjeant 10 LiabilityEstimationIAA.xls 7/10/2003

large costs and savings sometimes resulting from legislative changes
• no simulations have yet been made of the effects of excess reinsurance.
Further work
We hope that further work will be done on many of the issues that we have leftunexplored or unresolved. We would be happy to collaborate in any such work.
Acknowledgements
We are grateful for the help given to us by Greg Taylor, personally and through hisbook "Loss reserving - an actuarial perspective" (2000). Adrian Gould and BobBuchanan provided helpful data on claim size distributions. Scott Collings andGraham White's excellent 2001 paper provided some valuable data to check ourresults. We are also grateful to Paul Cassidy and David Service, for letting us testsome of the ideas in this paper on their general insurance and control cycle students.
References
Robyn Bateup & Ian Reed (2001) "Research and data analysis relevant to thedevelopment of standards and guidelines on liability valuation for general insurance",Tillinghast-Towers Perrin report for the Institute of Actuaries of Australia, 20November
Scott Collings & Graham White (2001) "APRA risk margin analysis", presented to theInstitute of Actuaries of Australia eighth general insurance seminar, 25-28November, 32 pages
England PF & Verrall RJ (2002) "Stochastic claims reserving in general insurance",British Actuarial Journal v8 III pp 443-518
HIH Royal Commission (2003) "The failure of HIH Insurance", Canberra, April, 3volumes
Insurance and Superannuation Commission (1998) "Selected statistics on thegeneral insurance industry for year ended 30 June 1997", Canberra, April, 174 pages
Greg Taylor (2000) "Loss reserving - an actuarial perspective", Kluwer AcademicPress, Boston, xii + 389 pages
Greg Taylor (2003) personal communication 2 April.
Richard Cumpston and Hugh Sarjeant 11 LiabilityEstimationIAA.xls 7/10/2003

Appendix A : Basic simulations
A1 75% risk margins for outstanding claims - CTP
Method Claims pa100 300 1000 3000 10000
PPCI 27% 16% 12% 8% 7%PCL 47% 26% 16% 13% 11%ICL 29% 19% 12% 8% 4%PCE 20% 16% 16% 8% 4%PPCF 30% 17% 10% 7% 8%
A2 75% risk margins for outstanding claims - domestic motor
Method Claims pa100 300 1000 3000 10000
PPCI 41% 32% 12% 12% 9%PCL 57% 47% 17% 16% 12%ICL 59% 47% 27% 17% 11%PCE 48% 33% 21% 17% 12%PPCF 44% 32% 14% 12% 10%
75% risk margins for outstanding claims - domestic motor
0%
20%
40%
60%
100 1000 10000
Number of claims pa
PPCIPCLICLPCEPPCF
Richard Cumpston and Hugh Sarjeant 12 LiabilityEstimationIAA.xls 7/10/2003

A3 75% risk margins for outstanding claims - prof indemnity
Method Claims pa100 300 1000 3000 10000
PPCI 39% 26% 12% 8% 8%PCL 50% 35% 18% 15% 11%ICL 32% 19% 13% 10% 6%PCE 25% 14% 12% 8% 6%PPCF 38% 28% 11% 9% 8%
75% risk margins for outstanding claims - professional indemnity
0%
20%
40%
60%
100 1000 10000Number of claims pa
PPCIPCLICLPCEPPCF
Richard Cumpston and Hugh Sarjeant 13 LiabilityEstimationIAA.xls 7/10/2003

A4 75% risk margins for outstanding claims - public liability
Method Claims pa100 300 1000 3000 10000
PPCI 39% 29% 16% 13% 7%PCL 51% 35% 20% 13% 11%ICL 41% 32% 14% 11% 5%PCE 29% 16% 13% 11% 6%PPCF 39% 30% 17% 13% 8%
projected case estimates based on the development of reported claims,
75% risk margins for outstanding claims - public liability
0%
20%
40%
60%
100 1000 10000
Number of claims pa
PPCIPCLICLPCEPPCF
Richard Cumpston and Hugh Sarjeant 14 LiabilityEstimationIAA.xls 7/10/2003

A5 75% risk margins for outstanding claims - employers liability
Method Claims pa100 300 1000 3000 10000
PPCI 35% 22% 11% 5% 7%PCL 38% 27% 16% 9% 6%ICL 33% 28% 16% 12% 6%PCE 22% 13% 10% 10% 6%PPCF 33% 22% 11% 5% 7%
A6 75% risk margins for premium liability
Class Claims pa100 300 1000 3000 10000
CTP 24% 19% 11% 8% 8%Domestic 22% 14% 8% 7% 5%PI 28% 21% 11% 9% 9%PL 29% 18% 14% 11% 9%EL 25% 17% 11% 6% 5%
75% risk margin for outstanding claims - employers liability
0%
20%
40%
100 1000 10000
Number of claims pa
PPCIPCLICLPCEPPCF
Richard Cumpston and Hugh Sarjeant 15 LiabilityEstimationIAA.xls 7/10/2003

A7 75% risk margins for outstanding claims - CTP 1000 claims pa
Accident 75% risk margins for outstanding claimsyear PPCI PCL ICL PCE PPCF
PPCI PCL ICL PCE PPCF1 12.7% 95.2% 19.9% 13.8% 20.0%2 11.2% 30.2% 20.9% 22.3% 12.3%3 15.8% 23.0% 21.5% 23.8% 14.9%4 14.1% 28.1% 22.2% 26.3% 15.0%5 15.4% 21.2% 25.7% 35.8% 16.7%6 11.1% 27.9% 32.1% 44.6% 11.6%7 18.0% 38.9% 39.7% 67.9% 19.1%8 23.8% 25.5% 40.2% 69.9% 23.4%9 23.9% 21.1% 42.4% 80.9% 23.0%10 28.3% 22.4% 50.6% 88.7% 28.8%11 22.8% 19.7% 41.2% 94.1% 22.9%
Total 11.8% 16.2% 11.9% 15.7% 10.4%
A8 Comparison with Collings & White CTP 75% percentiles
Claims pa SCL Mack Best simulationsSCL Mack Best simulations
100 8.7% 11.2% 17.6%167 19.9% 24.7% 15.8%278 11.8% 11.3% 13.9%464 8.0% 6.5% 12.3%774 8.3% 21.6% 10.7%1292 8.4% 6.1% 8.5%2154 7.2% 8.0% 5.7%3594 3.7% 10.7% 3.6%5995 6.2% 4.5% 2.9%10000 2.9% 2.6% 2.2%
The stochastic chain ladder and Mack values are from Collings & White (2001,appendix A). The best simulations are interpolated from the PCE results in B2 with astandard error of 0.75.
Richard Cumpston and Hugh Sarjeant 16 LiabilityEstimationIAA.xls 7/10/2003

Appendix B : Variations to basic simulations
B1 75% risk margins for outstandings - CTP with ICL method
Standard deviation of case Claims paestimate adequacy 100 300 1000 3000 10000
SD=0.75 23% 15% 8% 4% 3%SD=1.50 29% 19% 12% 8% 4%SD=2.25 35% 21% 15%SD=3.00 35% 23% 16%SD=3.75 35% 26% 17%
B2 75% risk margins for outstandings - CTP with PCE method
Standard error of case Claims paestimate adequacy 100 300 1000 3000 10000
SD=0.75 18% 14% 10% 4% 2%SD=1.50 20% 16% 16% 8% 4%SD=2.25 19% 20% 14%SD=3.00 17% 20% 14%SD=3.75 16% 20% 14%
B3 75% risk margins for outstandings - CTP 1000 claims
Method Averaging period in years3 5 7 9
PPCI 13% 12% 9% 9%PCL 20% 16% 16% 13%ICL 15% 12% 9% 10%PCE 16% 16% 10% 10%PPCF 14% 10% 8% 7%
Richard Cumpston and Hugh Sarjeant 17 LiabilityEstimationIAA.xls 7/10/2003

Appendix C : Class assumptions
Report patterns - CTP
Size Proportion of claims reported in the following development yearsdecile 0 1 2 3 4 5 6 7 8 9 10+
0 0.667 0.230 0.052 0.028 0.009 0.003 0.003 0.002 0.001 0.001 0.0031 0.782 0.214 0.002 0.001 0.000 0.000 0.000 0.000 0.000 0.000 0.0002 0.777 0.217 0.003 0.002 0.001 0.000 0.000 0.000 0.000 0.000 0.0003 0.769 0.221 0.005 0.003 0.001 0.000 0.000 0.000 0.000 0.000 0.0004 0.758 0.225 0.009 0.005 0.002 0.001 0.001 0.000 0.000 0.000 0.0015 0.742 0.228 0.015 0.008 0.003 0.001 0.001 0.001 0.000 0.000 0.0016 0.718 0.232 0.025 0.014 0.004 0.001 0.002 0.001 0.000 0.000 0.0027 0.679 0.235 0.043 0.024 0.008 0.003 0.003 0.002 0.001 0.001 0.0038 0.614 0.239 0.074 0.041 0.013 0.004 0.005 0.003 0.001 0.001 0.0059 0.506 0.243 0.127 0.069 0.022 0.007 0.008 0.005 0.002 0.002 0.00810 0.323 0.247 0.217 0.118 0.038 0.013 0.013 0.009 0.004 0.004 0.014
Mean 0.667 0.230 0.052 0.028 0.009 0.003 0.003 0.002 0.001 0.001 0.003
Finalisation probabilities - CTP
Size Probability of finalisation in the following development yearsdecile 0 1 2 3 4 5 6 7 8 9 10+
0 0.049 0.371 0.700 0.700 0.700 0.700 0.700 0.700 0.700 0.700 0.7001 0.049 0.371 0.700 0.700 0.700 0.700 0.700 0.700 0.700 0.700 0.7002 0.049 0.371 0.700 0.700 0.700 0.700 0.700 0.700 0.700 0.700 0.7003 0.049 0.371 0.700 0.700 0.700 0.700 0.700 0.700 0.700 0.700 0.7004 0.049 0.371 0.700 0.700 0.700 0.700 0.700 0.700 0.700 0.700 0.7005 0.049 0.371 0.700 0.700 0.700 0.700 0.700 0.700 0.700 0.700 0.7006 0.049 0.371 0.700 0.700 0.700 0.700 0.700 0.700 0.700 0.700 0.7007 0.056 0.308 0.576 0.576 0.576 0.576 0.576 0.576 0.576 0.576 0.5768 0.063 0.245 0.451 0.451 0.451 0.451 0.451 0.451 0.451 0.451 0.4519 0.070 0.182 0.327 0.327 0.327 0.327 0.327 0.327 0.327 0.327 0.32710 0.078 0.119 0.203 0.203 0.203 0.203 0.203 0.203 0.203 0.203 0.203
The above assumptions were chosen so as to approximately replicate the CTPdata for states other than NSW in table 6.2 of "Selected statistics on the generalinsurance industry for year ended 30 June 1997" (Insurance and SuperannuationCommission 1988).
"Size decile 0" was used to describe the behaviour of claims ultimately proving tobe zero. Size deciles 1 to 10 describe claims ultimately proving to be non-zero.
Richard Cumpston and Hugh Sarjeant 18 LiabilityEstimationIAA.xls 7/10/2003

Report patterns - DOM
Size Proportion of claims reported in the following development yearsdecile 0 1 2 3 4 5 6 7 8 9 10+
0 0.932 0.064 0.002 0.001 0.000 0.000 0.000 0.000 0.000 0.000 0.0001 0.871 0.118 0.007 0.002 0.001 0.001 0.000 0.000 0.000 0.000 0.0002 0.891 0.101 0.005 0.001 0.001 0.000 0.000 0.000 0.000 0.000 0.0003 0.908 0.086 0.003 0.001 0.001 0.000 0.000 0.000 0.000 0.000 0.0004 0.923 0.073 0.002 0.001 0.000 0.000 0.000 0.000 0.000 0.000 0.0005 0.935 0.063 0.002 0.000 0.000 0.000 0.000 0.000 0.000 0.000 0.0006 0.945 0.053 0.001 0.000 0.000 0.000 0.000 0.000 0.000 0.000 0.0007 0.953 0.046 0.001 0.000 0.000 0.000 0.000 0.000 0.000 0.000 0.0008 0.960 0.039 0.001 0.000 0.000 0.000 0.000 0.000 0.000 0.000 0.0009 0.966 0.033 0.000 0.000 0.000 0.000 0.000 0.000 0.000 0.000 0.00010 0.971 0.028 0.000 0.000 0.000 0.000 0.000 0.000 0.000 0.000 0.000
Mean 0.932 0.064 0.002 0.001 0.000 0.000 0.000 0.000 0.000 0.000 0.000
Finalisation probabilities - DOM
Size Proportion of finalisation in the following development yearsdecile 0 1 2 3 4 5 6 7 8 9 10+
0 0.720 0.906 0.300 0.300 0.300 0.300 0.300 0.300 0.300 0.300 0.3001 0.720 0.906 0.300 0.300 0.300 0.300 0.300 0.300 0.300 0.300 0.3002 0.720 0.906 0.300 0.300 0.300 0.300 0.300 0.300 0.300 0.300 0.3003 0.720 0.906 0.300 0.300 0.300 0.300 0.300 0.300 0.300 0.300 0.3004 0.720 0.906 0.300 0.300 0.300 0.300 0.300 0.300 0.300 0.300 0.3005 0.720 0.906 0.300 0.300 0.300 0.300 0.300 0.300 0.300 0.300 0.3006 0.720 0.906 0.300 0.300 0.300 0.300 0.300 0.300 0.300 0.300 0.3007 0.750 0.860 0.450 0.450 0.450 0.450 0.450 0.450 0.450 0.450 0.4508 0.780 0.814 0.600 0.600 0.600 0.600 0.600 0.600 0.600 0.600 0.6009 0.810 0.767 0.750 0.750 0.750 0.750 0.750 0.750 0.750 0.750 0.75010 0.840 0.721 0.900 0.900 0.900 0.900 0.900 0.900 0.900 0.900 0.900
The above assumptions were chosen so as to approximately replicate thedomestic motor vehicle data in table 6.4 of "Selected statistics on the generalinsurance industry for year ended 30 June 1997" (Insurance and SuperannuationCommission 1988).
Richard Cumpston and Hugh Sarjeant 19 LiabilityEstimationIAA.xls 7/10/2003
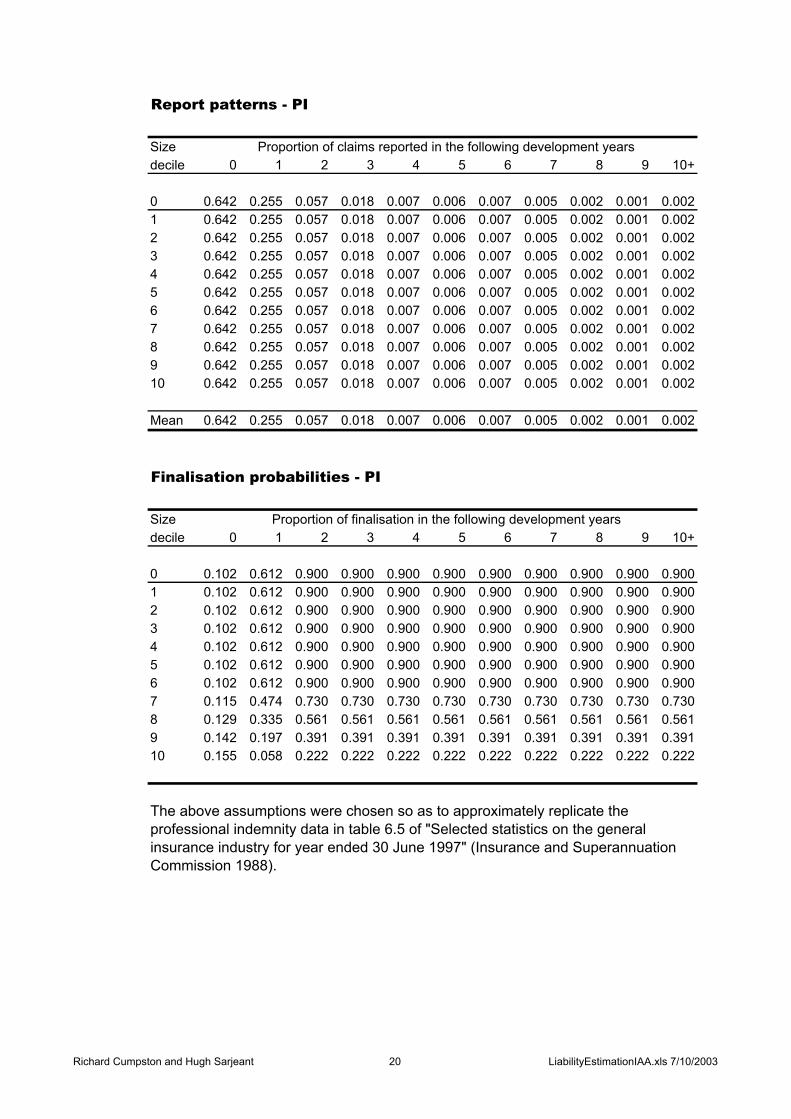
Report patterns - PI
Size Proportion of claims reported in the following development yearsdecile 0 1 2 3 4 5 6 7 8 9 10+
0 0.642 0.255 0.057 0.018 0.007 0.006 0.007 0.005 0.002 0.001 0.0021 0.642 0.255 0.057 0.018 0.007 0.006 0.007 0.005 0.002 0.001 0.0022 0.642 0.255 0.057 0.018 0.007 0.006 0.007 0.005 0.002 0.001 0.0023 0.642 0.255 0.057 0.018 0.007 0.006 0.007 0.005 0.002 0.001 0.0024 0.642 0.255 0.057 0.018 0.007 0.006 0.007 0.005 0.002 0.001 0.0025 0.642 0.255 0.057 0.018 0.007 0.006 0.007 0.005 0.002 0.001 0.0026 0.642 0.255 0.057 0.018 0.007 0.006 0.007 0.005 0.002 0.001 0.0027 0.642 0.255 0.057 0.018 0.007 0.006 0.007 0.005 0.002 0.001 0.0028 0.642 0.255 0.057 0.018 0.007 0.006 0.007 0.005 0.002 0.001 0.0029 0.642 0.255 0.057 0.018 0.007 0.006 0.007 0.005 0.002 0.001 0.00210 0.642 0.255 0.057 0.018 0.007 0.006 0.007 0.005 0.002 0.001 0.002
Mean 0.642 0.255 0.057 0.018 0.007 0.006 0.007 0.005 0.002 0.001 0.002
Finalisation probabilities - PI
Size Proportion of finalisation in the following development yearsdecile 0 1 2 3 4 5 6 7 8 9 10+
0 0.102 0.612 0.900 0.900 0.900 0.900 0.900 0.900 0.900 0.900 0.9001 0.102 0.612 0.900 0.900 0.900 0.900 0.900 0.900 0.900 0.900 0.9002 0.102 0.612 0.900 0.900 0.900 0.900 0.900 0.900 0.900 0.900 0.9003 0.102 0.612 0.900 0.900 0.900 0.900 0.900 0.900 0.900 0.900 0.9004 0.102 0.612 0.900 0.900 0.900 0.900 0.900 0.900 0.900 0.900 0.9005 0.102 0.612 0.900 0.900 0.900 0.900 0.900 0.900 0.900 0.900 0.9006 0.102 0.612 0.900 0.900 0.900 0.900 0.900 0.900 0.900 0.900 0.9007 0.115 0.474 0.730 0.730 0.730 0.730 0.730 0.730 0.730 0.730 0.7308 0.129 0.335 0.561 0.561 0.561 0.561 0.561 0.561 0.561 0.561 0.5619 0.142 0.197 0.391 0.391 0.391 0.391 0.391 0.391 0.391 0.391 0.39110 0.155 0.058 0.222 0.222 0.222 0.222 0.222 0.222 0.222 0.222 0.222
The above assumptions were chosen so as to approximately replicate theprofessional indemnity data in table 6.5 of "Selected statistics on the generalinsurance industry for year ended 30 June 1997" (Insurance and SuperannuationCommission 1988).
Richard Cumpston and Hugh Sarjeant 20 LiabilityEstimationIAA.xls 7/10/2003

Report patterns - PL
Size Proportion of claims reported in the following development yearsdecile 0 1 2 3 4 5 6 7 8 9 10+
0 0.720 0.202 0.030 0.018 0.008 0.004 0.004 0.002 0.001 0.001 0.0091 0.810 0.188 0.001 0.001 0.000 0.000 0.000 0.000 0.000 0.000 0.0002 0.805 0.191 0.002 0.001 0.000 0.000 0.000 0.000 0.000 0.000 0.0013 0.799 0.194 0.003 0.002 0.001 0.000 0.000 0.000 0.000 0.000 0.0014 0.790 0.197 0.005 0.003 0.001 0.001 0.001 0.000 0.000 0.000 0.0025 0.778 0.200 0.009 0.005 0.002 0.001 0.001 0.001 0.000 0.000 0.0036 0.759 0.203 0.015 0.009 0.004 0.002 0.002 0.001 0.000 0.000 0.0057 0.729 0.207 0.025 0.015 0.006 0.003 0.004 0.002 0.001 0.001 0.0088 0.679 0.210 0.043 0.026 0.011 0.006 0.006 0.003 0.001 0.001 0.0139 0.597 0.213 0.074 0.045 0.019 0.010 0.010 0.005 0.002 0.002 0.02310 0.459 0.217 0.126 0.076 0.032 0.017 0.018 0.009 0.004 0.003 0.039
Mean 0.720 0.202 0.030 0.018 0.008 0.004 0.004 0.002 0.001 0.001 0.009
Finalisation probabilities - PL
Size Proportion of finalisation in the following development yearsdecile 0 1 2 3 4 5 6 7 8 9 10+
0 0.594 0.720 0.700 0.700 0.700 0.700 0.700 0.700 0.700 0.700 0.7001 0.594 0.720 0.700 0.700 0.700 0.700 0.700 0.700 0.700 0.700 0.7002 0.594 0.720 0.700 0.700 0.700 0.700 0.700 0.700 0.700 0.700 0.7003 0.594 0.720 0.700 0.700 0.700 0.700 0.700 0.700 0.700 0.700 0.7004 0.594 0.720 0.700 0.700 0.700 0.700 0.700 0.700 0.700 0.700 0.7005 0.594 0.720 0.700 0.700 0.700 0.700 0.700 0.700 0.700 0.700 0.7006 0.594 0.720 0.700 0.700 0.700 0.700 0.700 0.700 0.700 0.700 0.7007 0.467 0.580 0.582 0.582 0.582 0.582 0.582 0.582 0.582 0.582 0.5828 0.341 0.439 0.464 0.464 0.464 0.464 0.464 0.464 0.464 0.464 0.4649 0.214 0.299 0.346 0.346 0.346 0.346 0.346 0.346 0.346 0.346 0.34610 0.087 0.158 0.228 0.228 0.228 0.228 0.228 0.228 0.228 0.228 0.228
The above assumptions were chosen so as to approximately replicate the publicliability data in table 6.7 of "Selected statistics on the general insurance industry foryear ended 30 June 1997" (Insurance and Superannuation Commission 1988).
Richard Cumpston and Hugh Sarjeant 21 LiabilityEstimationIAA.xls 7/10/2003

Report patterns - EL
Size Proportion of claims reported in the following development yearsdecile 0 1 2 3 4 5 6 7 8 9 10+
0 0.879 0.103 0.010 0.003 0.002 0.001 0.001 0.000 0.000 0.000 0.0011 0.927 0.062 0.006 0.002 0.001 0.001 0.001 0.000 0.000 0.000 0.0002 0.919 0.069 0.007 0.002 0.001 0.001 0.001 0.000 0.000 0.000 0.0003 0.910 0.076 0.008 0.002 0.001 0.001 0.001 0.000 0.000 0.000 0.0004 0.900 0.084 0.008 0.002 0.001 0.001 0.001 0.000 0.000 0.000 0.0005 0.890 0.093 0.009 0.003 0.002 0.001 0.001 0.000 0.000 0.000 0.0016 0.878 0.104 0.010 0.003 0.002 0.001 0.001 0.000 0.000 0.000 0.0017 0.865 0.115 0.012 0.003 0.002 0.001 0.001 0.000 0.001 0.000 0.0018 0.850 0.127 0.013 0.004 0.002 0.001 0.001 0.001 0.001 0.000 0.0019 0.834 0.141 0.014 0.004 0.002 0.001 0.001 0.001 0.001 0.000 0.00110 0.816 0.156 0.016 0.004 0.003 0.001 0.001 0.001 0.001 0.000 0.001
Mean 0.879 0.103 0.010 0.003 0.002 0.001 0.001 0.000 0.000 0.000 0.001
Finalisation probabilities - EL
Size Proportion of finalisation in the following development yearsdecile 0 1 2 3 4 5 6 7 8 9 10+
0 0.697 0.990 0.600 0.600 0.600 0.600 0.600 0.600 0.600 0.600 0.6001 0.697 0.990 0.600 0.600 0.600 0.600 0.600 0.600 0.600 0.600 0.6002 0.697 0.990 0.600 0.600 0.600 0.600 0.600 0.600 0.600 0.600 0.6003 0.697 0.990 0.600 0.600 0.600 0.600 0.600 0.600 0.600 0.600 0.6004 0.697 0.990 0.600 0.600 0.600 0.600 0.600 0.600 0.600 0.600 0.6005 0.697 0.990 0.600 0.600 0.600 0.600 0.600 0.600 0.600 0.600 0.6006 0.697 0.990 0.600 0.600 0.600 0.600 0.600 0.600 0.600 0.600 0.6007 0.697 0.990 0.600 0.600 0.600 0.600 0.600 0.600 0.600 0.600 0.6008 0.697 0.990 0.600 0.600 0.600 0.600 0.600 0.600 0.600 0.600 0.6009 0.697 0.990 0.600 0.600 0.600 0.600 0.600 0.600 0.600 0.600 0.60010 0.111 0.212 0.283 0.283 0.283 0.283 0.283 0.283 0.283 0.283 0.283
The above assumptions were chosen so as to approximately replicate theemployers liability data for Western Australia in table 6.11 of "Selected statistics onthe general insurance industry for year ended 30 June 1997" (Insurance andSuperannuation Commission 1988).
Richard Cumpston and Hugh Sarjeant 22 LiabilityEstimationIAA.xls 7/10/2003