C&K Trucking, LLC - Northwestern...
39
C&K Trucking, LLC Presentation to Third Annual William O. Lipinski Symposium on Transportation Policy November 2, 2009
Transcript of C&K Trucking, LLC - Northwestern...
C&K Trucking, LLCPresentation to
Third Annual William O. Lipinski Symposium on Transportation Policy
November 2, 2009
Topic
“The Myth or Reality of Chicago as an Intermodal Black hole”
A Trucker’s Perspective
Overview
• Quick background on C&K.• Explanation of “Crosstowns”.• Discuss “Black Hole”.• Factors impacting “Black Hole” the next 5 years.• Questions.
C&K Trucking Background• C&K started Intermodal in 1994.• Headquartered in Chicago Ridge, IL.• Currently 11 Locations (Midwest and East Coast).• Approximately 600 trucks.• Larger customers include Home Depot, JB Hunt, Swift,
US Xpress, CSX, BNSF, UP, NS.• We focus solely on Intermodal Drayage – 400,000+
moves a year.
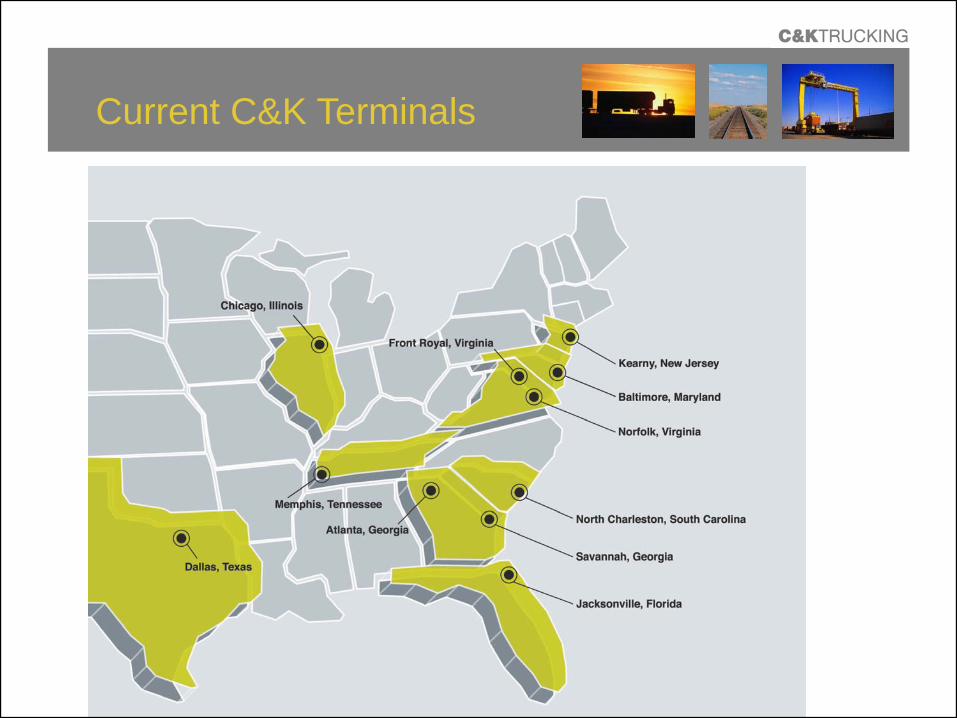
Current C&K Terminals
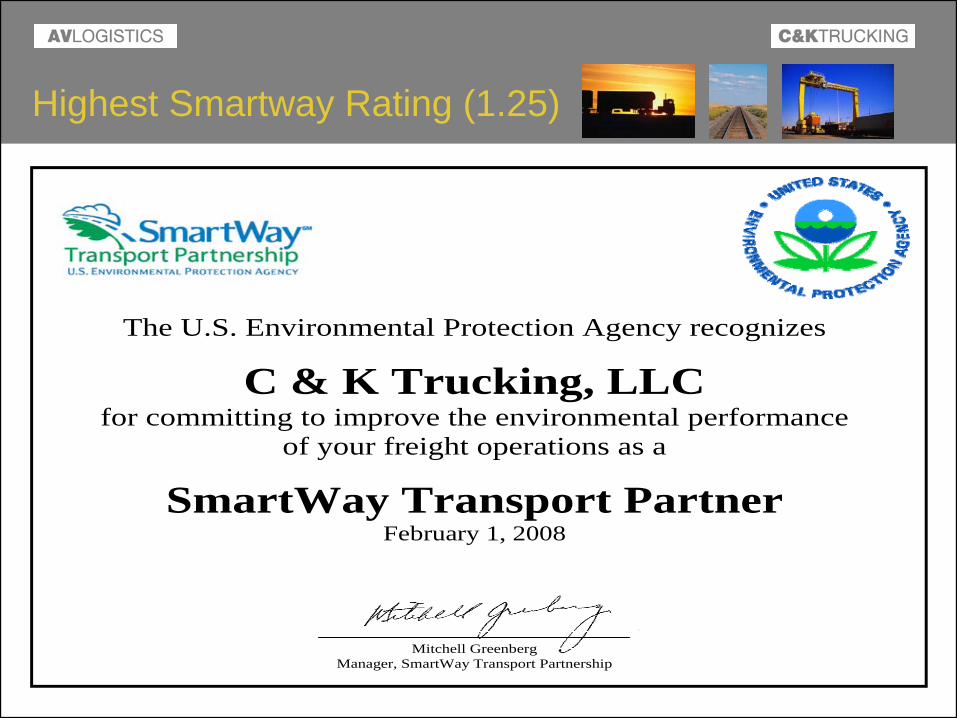
Highest Smartway Rating (1.25)
The U.S. Environmental Protection Agency recognizes
C & K Trucking, LLC
for committing to improve the environmental performance of your freight operations as a
SmartWay Transport Partner February 1, 2008
Mitchell Greenberg
Manager, SmartWay Transport Partnership
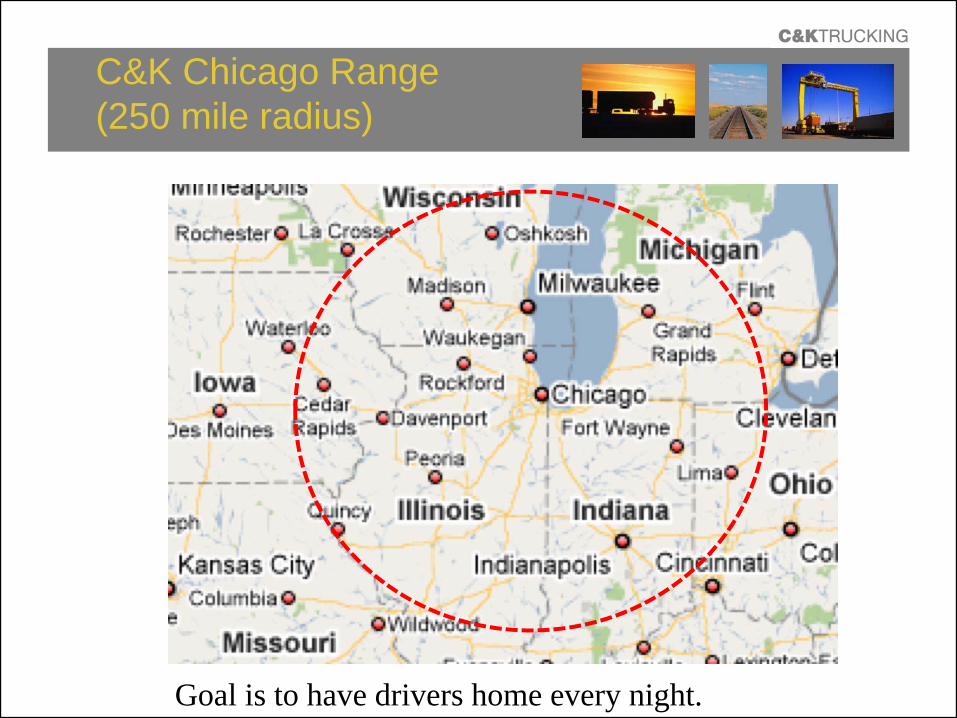
C&K Chicago Range(250 mile radius)
Goal is to have drivers home every night.
C&K Trucking Background
• In Chicago, C&K specializes in Crosstowns.
• Crosstowns are movements from one rail yard to another rail yard in the same city.
• We have approximately 100 of our 160 trucks in Chicago focused on this business segment.
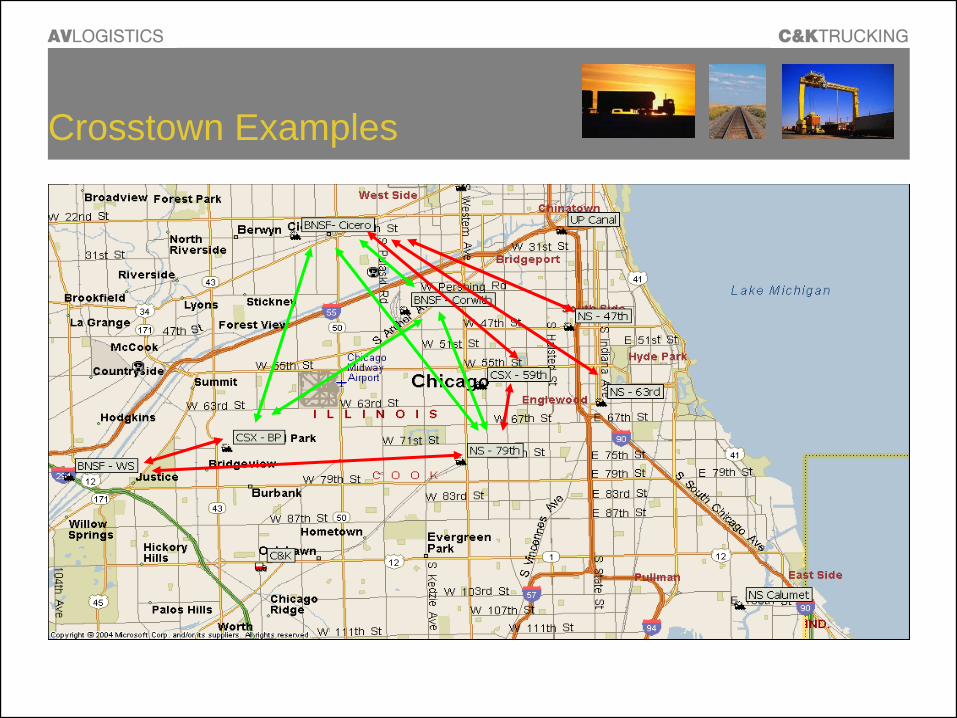
Crosstown Examples
Reason for Topic
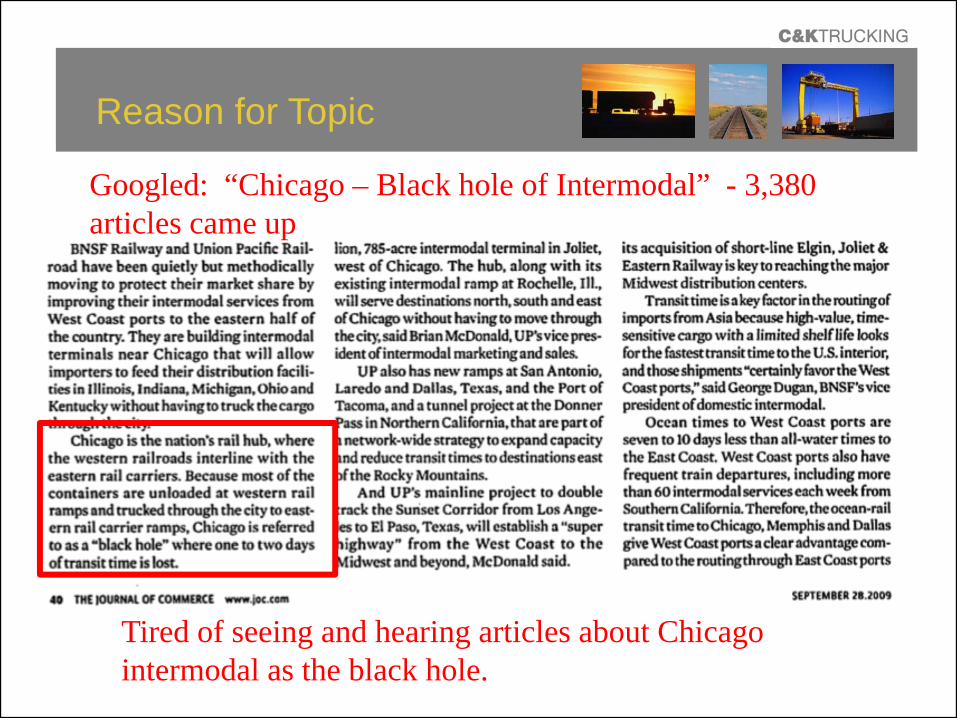
Tired of seeing and hearing articles about Chicago intermodal as the black hole.
Googled: “Chicago – Black hole of Intermodal” - 3,380 articles came up
Intermodal Review
In order to understand the “black hole”, let’s take a step back and quickly look at how intermodal containers/trailers come through Chicago.
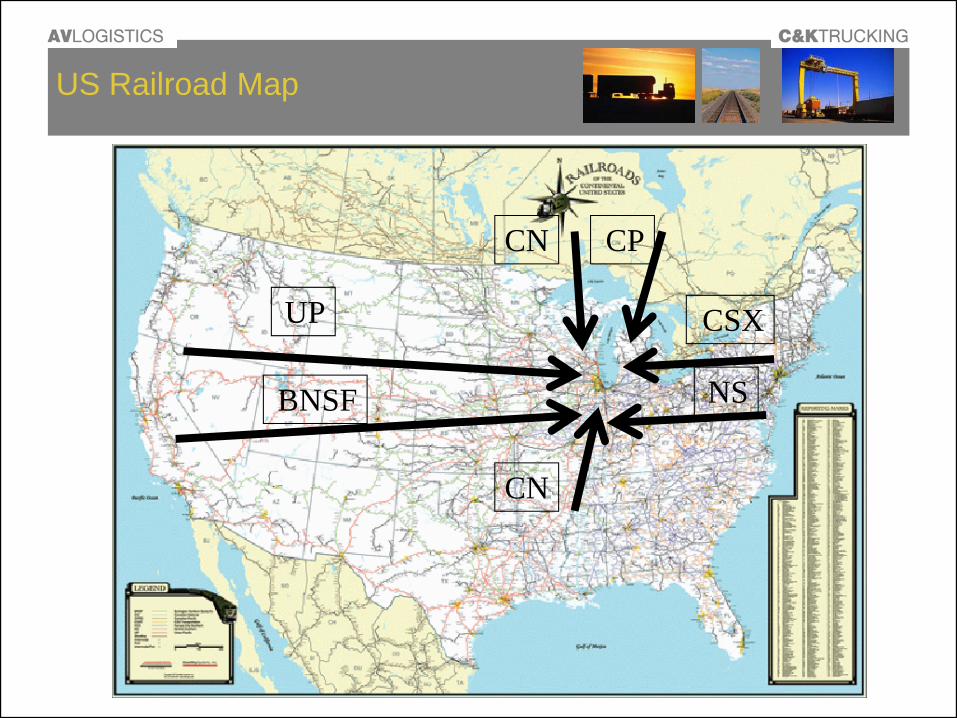
US Railroad Map
Ra
BNSF
UP
CN CP
CSX
NS
CN
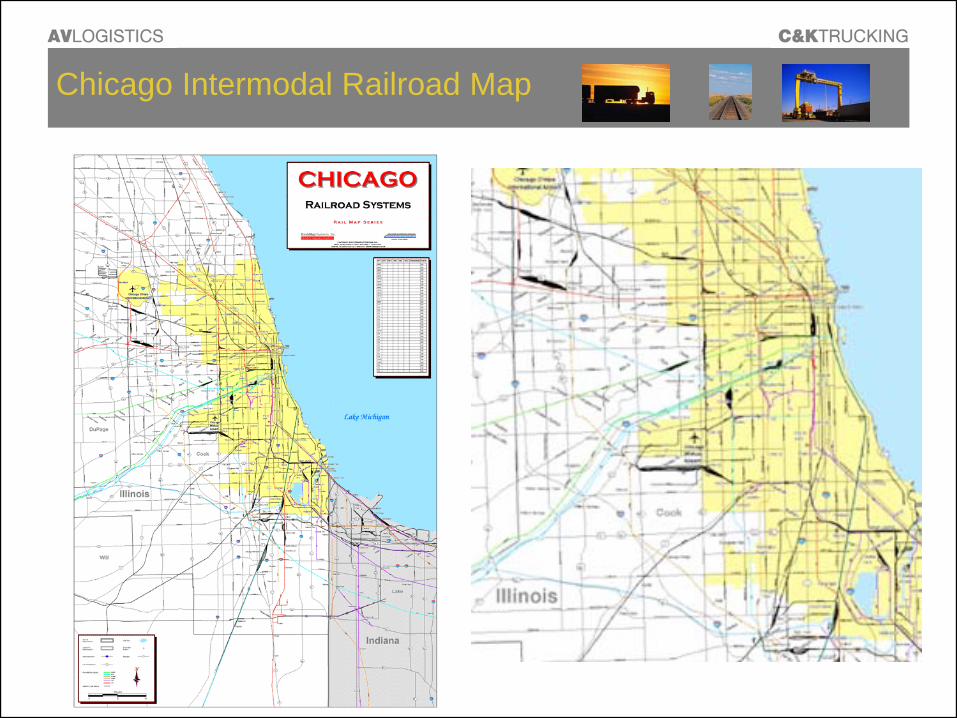
Chicago Intermodal Railroad Map
Ra
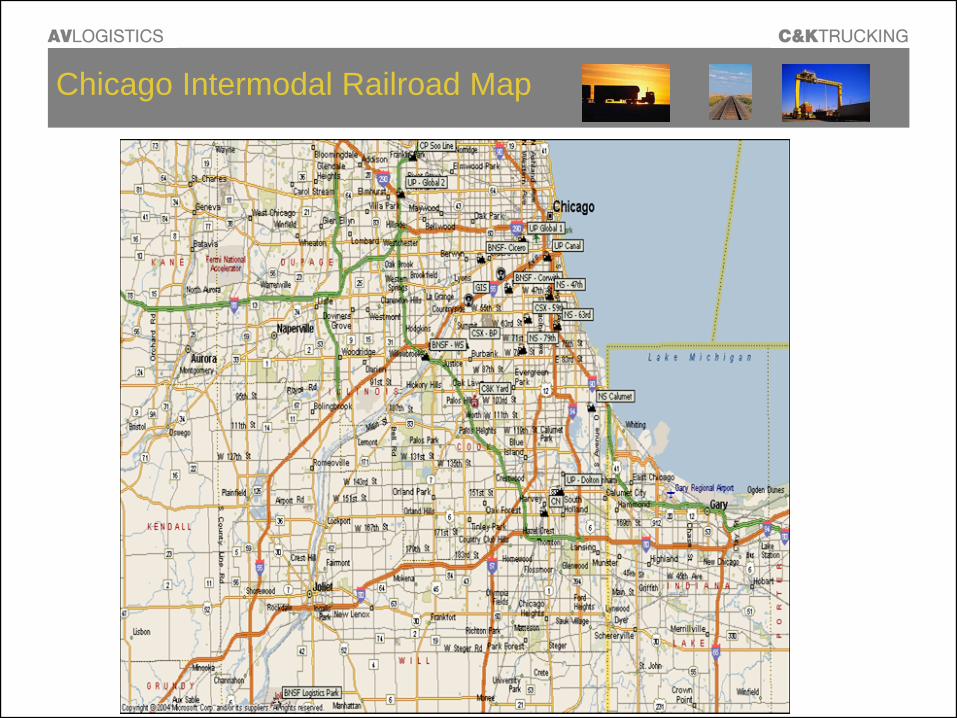
Chicago Intermodal Railroad Map
Ra
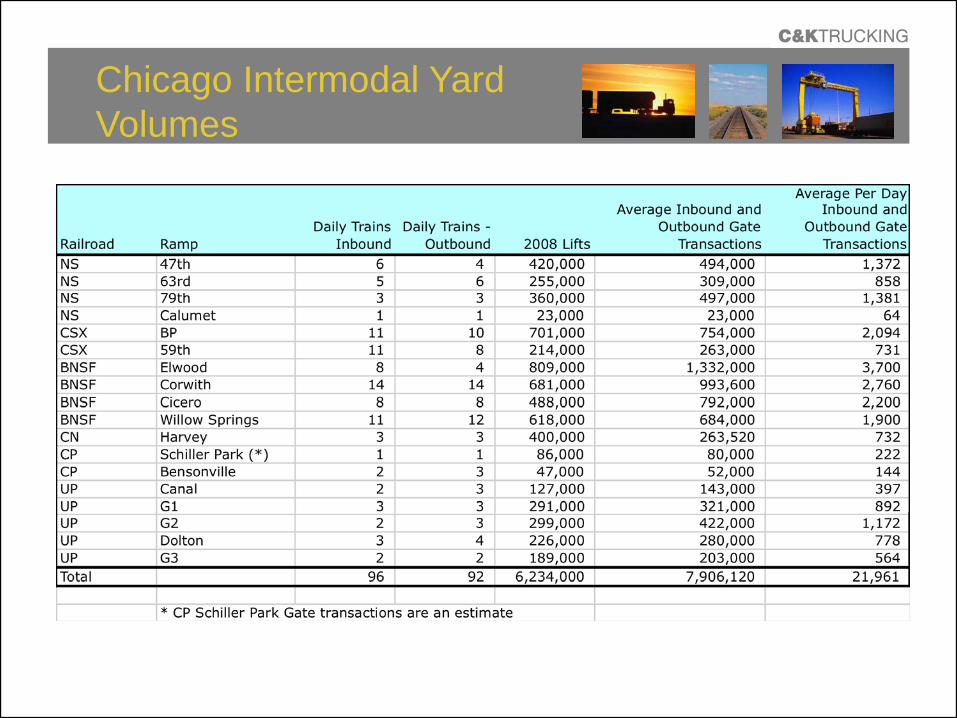
Chicago Intermodal Yard Volumes
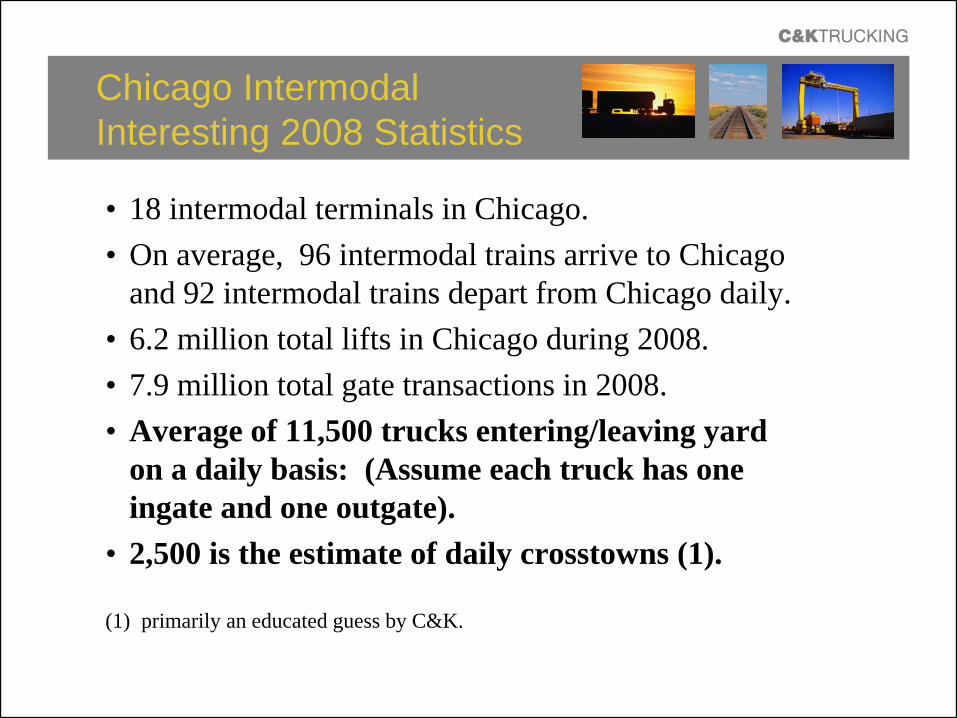
Chicago IntermodalInteresting 2008 Statistics
• 18 intermodal terminals in Chicago.• On average, 96 intermodal trains arrive to Chicago
and 92 intermodal trains depart from Chicago daily.• 6.2 million total lifts in Chicago during 2008.• 7.9 million total gate transactions in 2008.• Average of 11,500 trucks entering/leaving yard
on a daily basis: (Assume each truck has one ingate and one outgate).
• 2,500 is the estimate of daily crosstowns (1).
(1) primarily an educated guess by C&K.
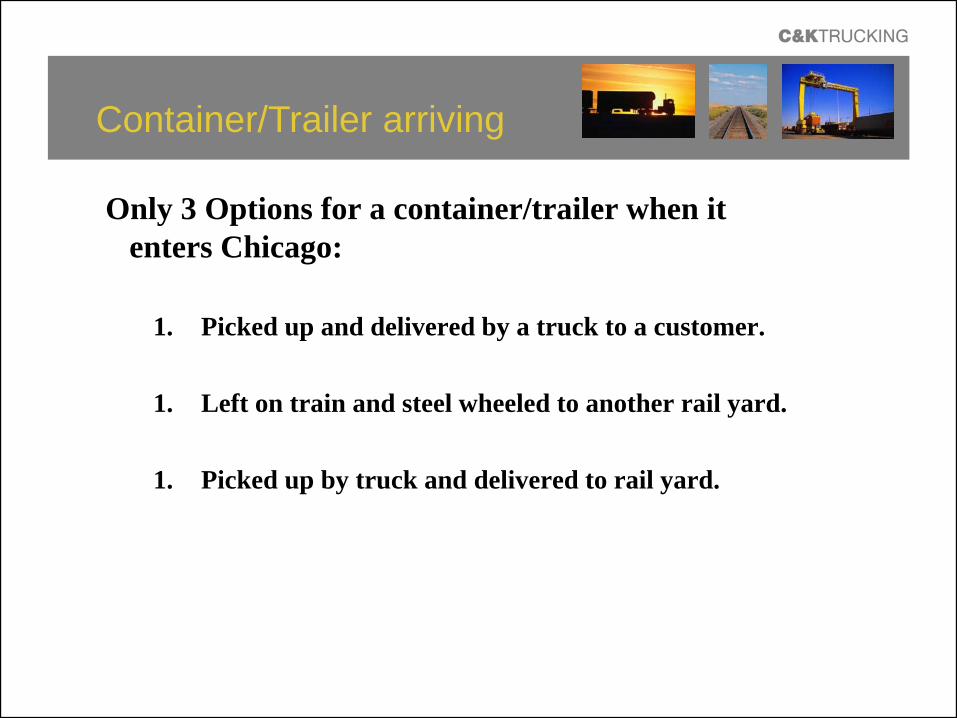
Container/Trailer arriving
Only 3 Options for a container/trailer when it enters Chicago:
1. Picked up and delivered by a truck to a customer.
1. Left on train and steel wheeled to another rail yard.
1. Picked up by truck and delivered to rail yard.
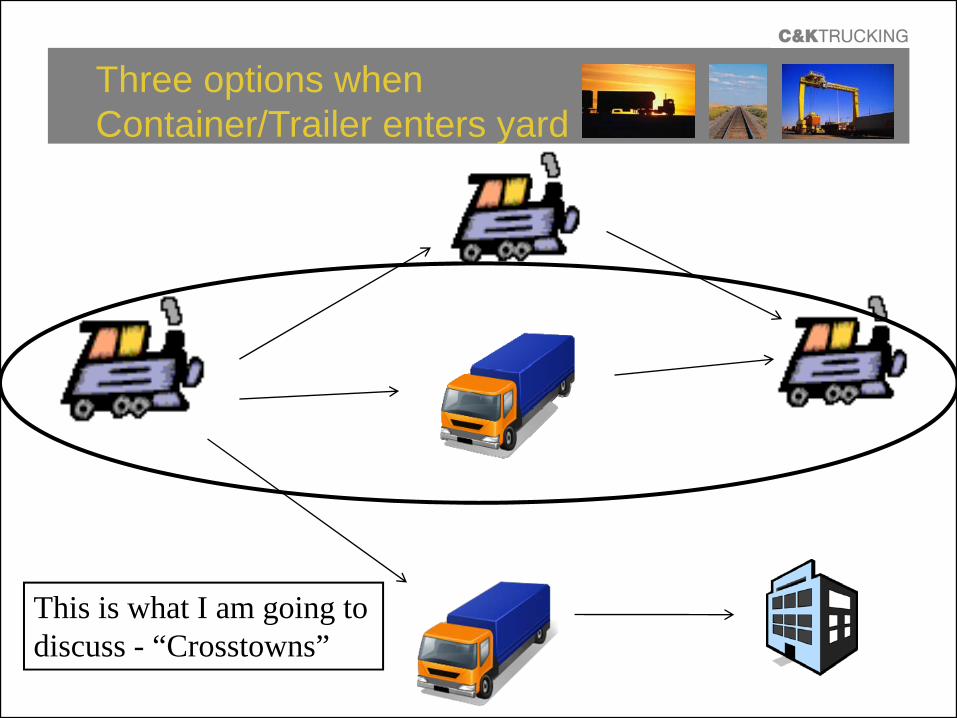
Three options when Container/Trailer enters yard
This is what I am going to discuss - “Crosstowns”
Dwell – The definition ofBlack Hole
“Black Hole” – we define this time as “dwell”.
“Dwell” is the time it takes from when the container/trailer becomes available at the first rail yard to when it is ingated to the next rail yard.
For the last several years, we can now measure this statistic. Here is what you will find.
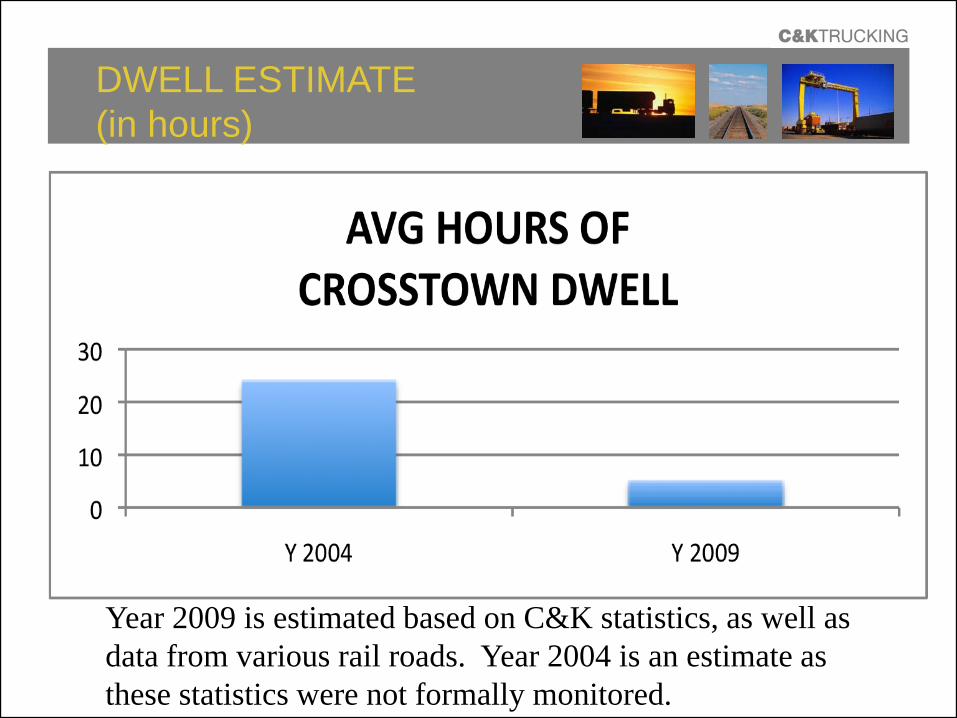
DWELL ESTIMATE(in hours)
Year 2009 is estimated based on C&K statistics, as well as data from various rail roads. Year 2004 is an estimate as these statistics were not formally monitored.
Premium Freight Expectations
As an example of what is expected now from the railroads and Carriers:
For premium freight (ie: UPS, JB Hunt, Swift, US Xpress), it is expected that the container/trailer make the next cut as long as there is a 2 hour window.
For 2008/2009, C&K and other carriers are 99.6% hitting this requirement.
Why has there beensuch an improvement?
1) Railroads focused on dwell in Chicago and invested heavily in infrastructure and systems to reduce dwell over last five years.
2) Opening of BNSF Elwood and UP Global 3 (Rochelle) - moved freight out of the city, reduced congestion.
3) Freight volumes are down due to economic conditions and global trade.
4) Chassis pools in Chicago have reduced congestion/volumes.
Railroads focused on reducingDwell / improving services
1) Railroads began measuring Dwell.2) Investment in new yard and gate systems.3) Better blocking at origin.4) Mutually working together to create bypass
trains.5) Opening of lanes outside of Chicago (ie: LA to
Atlanta).
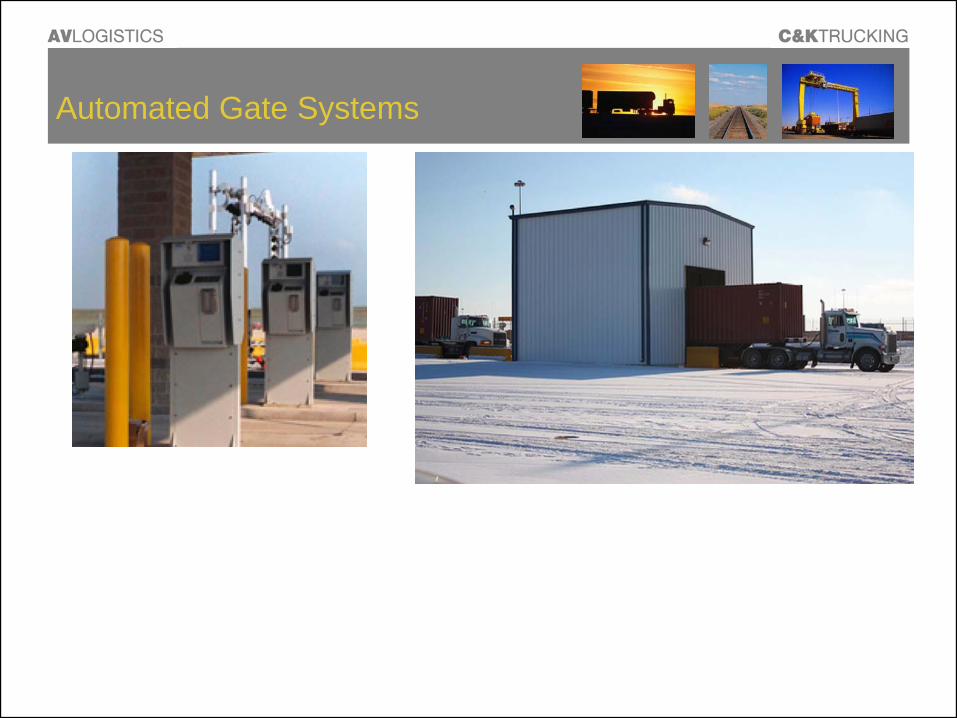
Automated Gate Systems
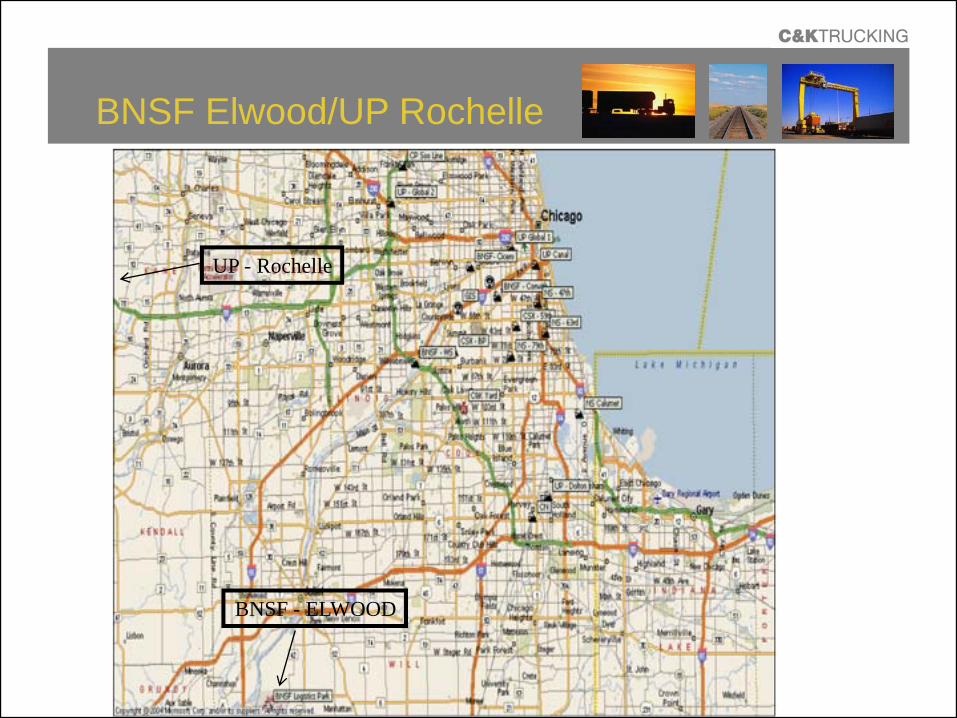
BNSF Elwood/UP Rochelle
BNSF - ELWOOD
UP - Rochelle
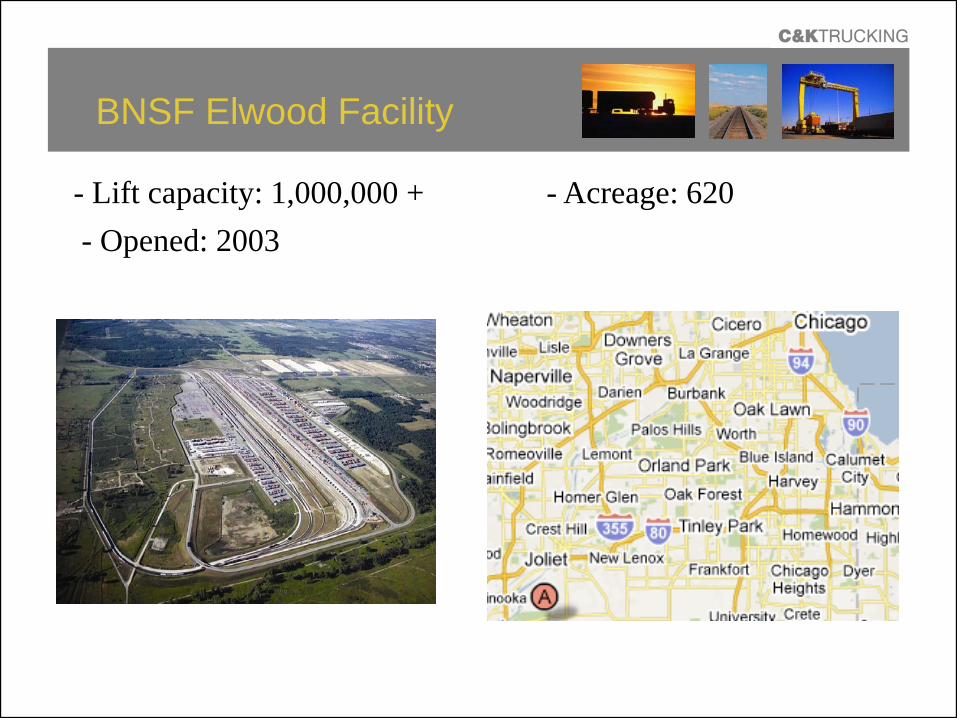
BNSF Elwood Facility
- Lift capacity: 1,000,000 +- Opened: 2003
- Acreage: 620
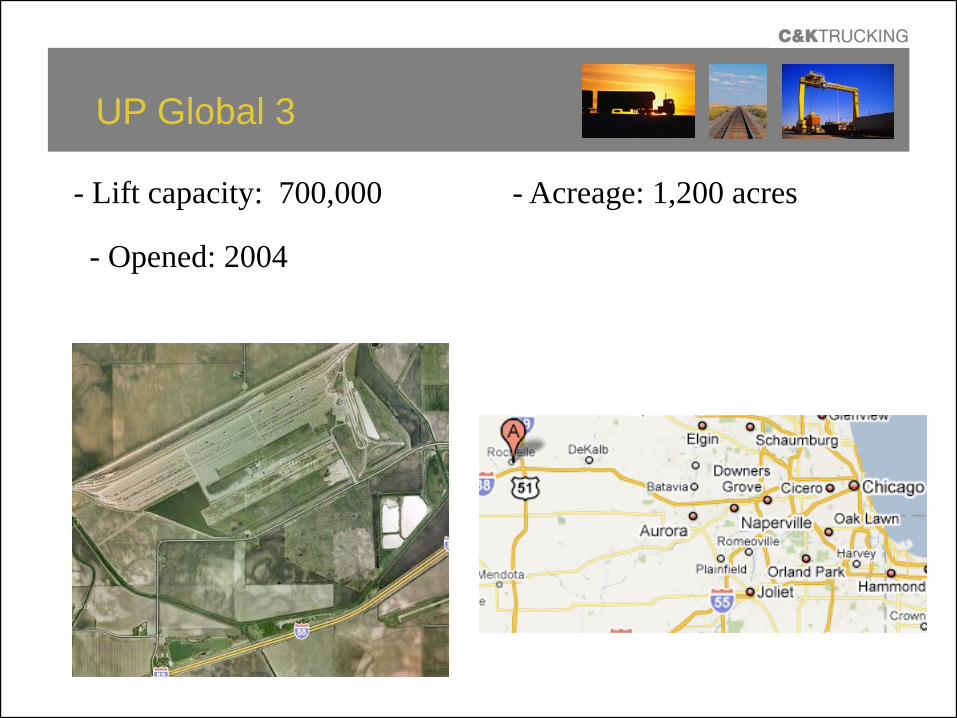
UP Global 3
- Lift capacity: 700,000
- Opened: 2004
- Acreage: 1,200 acres
BNSF Elwood and UPRochelle - Key Impacts
• 1.0 million lifts and 1.5 million gate transactions were moved out of the City of Chicago rail area in 2008 due to the opening of BNSF Elwood and UP Rochelle.
• This represented a shift of 15% of the Chicago 2008 volume outside of the City of Chicago.
• Conclusion: The opening of the new facilities reduced City rail traffic by 15% which had a material impact on reducing congestion in City rails and improving “Dwell”.
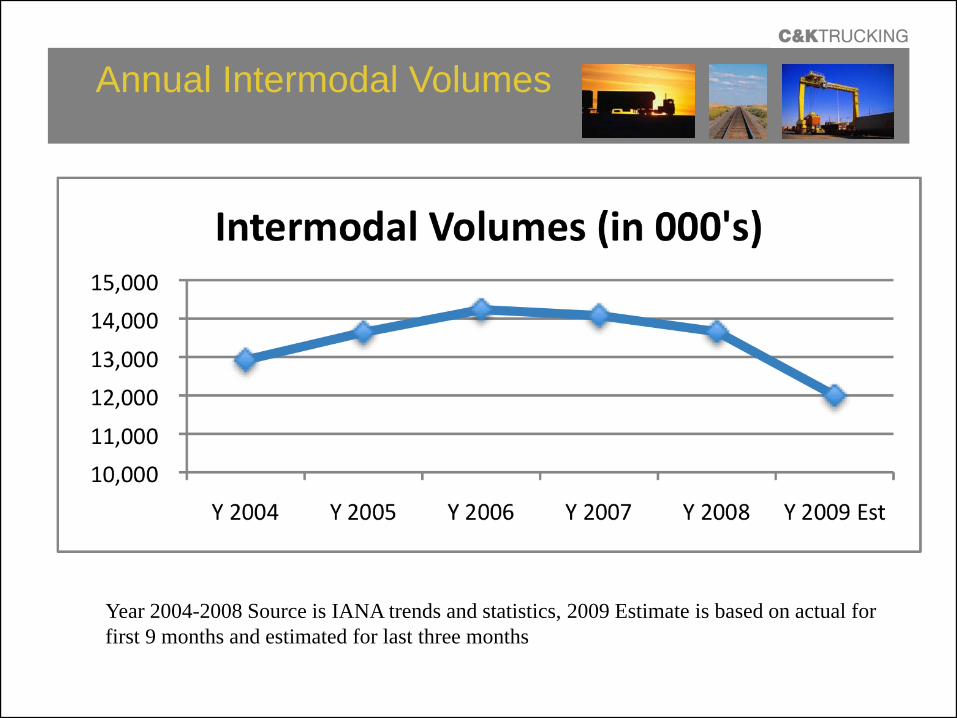
Annual Intermodal Volumes
Year 2004-2008 Source is IANA trends and statistics, 2009 Estimate is based on actual for first 9 months and estimated for last three months
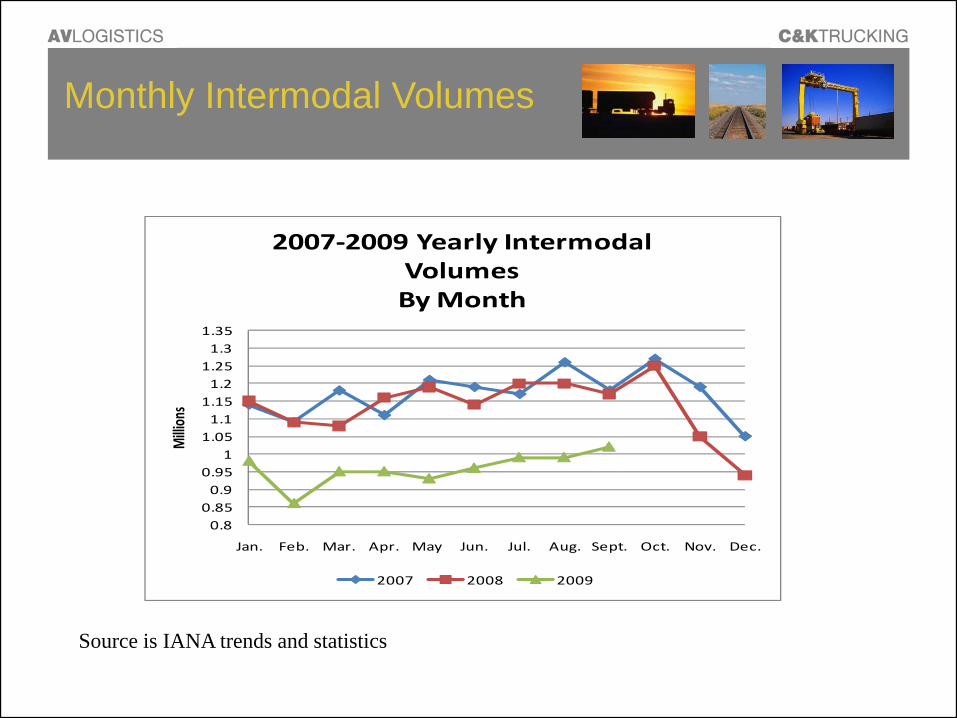
Monthly Intermodal Volumes
0.80.850.90.95
11.051.11.151.21.251.31.35
Jan. Feb. Mar. Apr. May Jun. Jul. Aug. Sept. Oct. Nov. Dec.
Million
s
2007‐2009 Yearly Intermodal VolumesBy Month
2007 2008 2009
Source is IANA trends and statistics
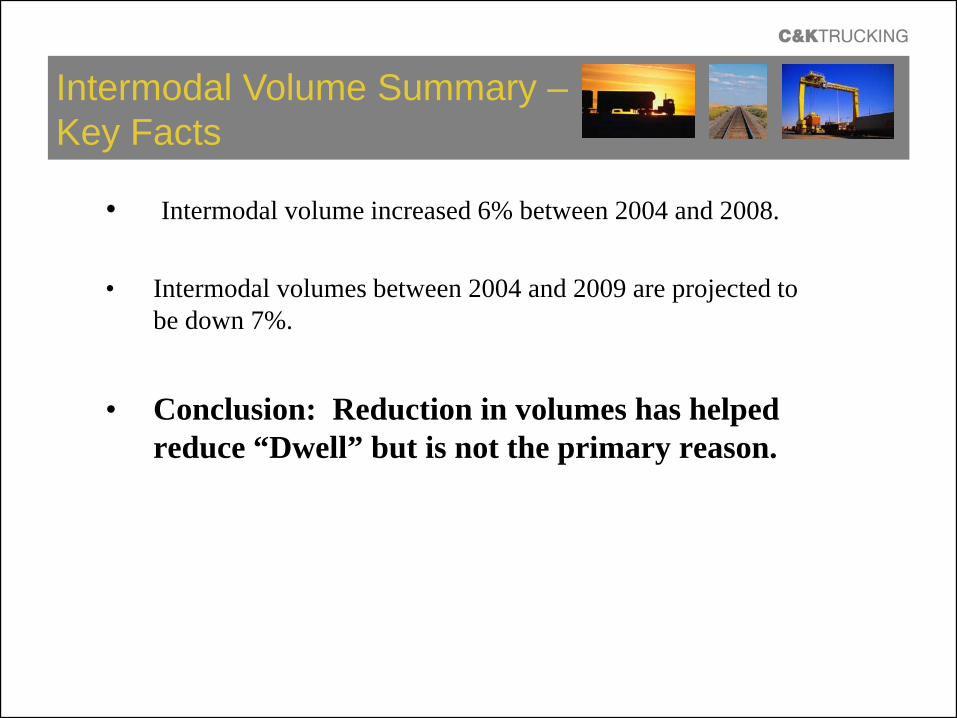
Intermodal Volume Summary –Key Facts
• Intermodal volume increased 6% between 2004 and 2008.
• Intermodal volumes between 2004 and 2009 are projected to be down 7%.
• Conclusion: Reduction in volumes has helped reduce “Dwell” but is not the primary reason.
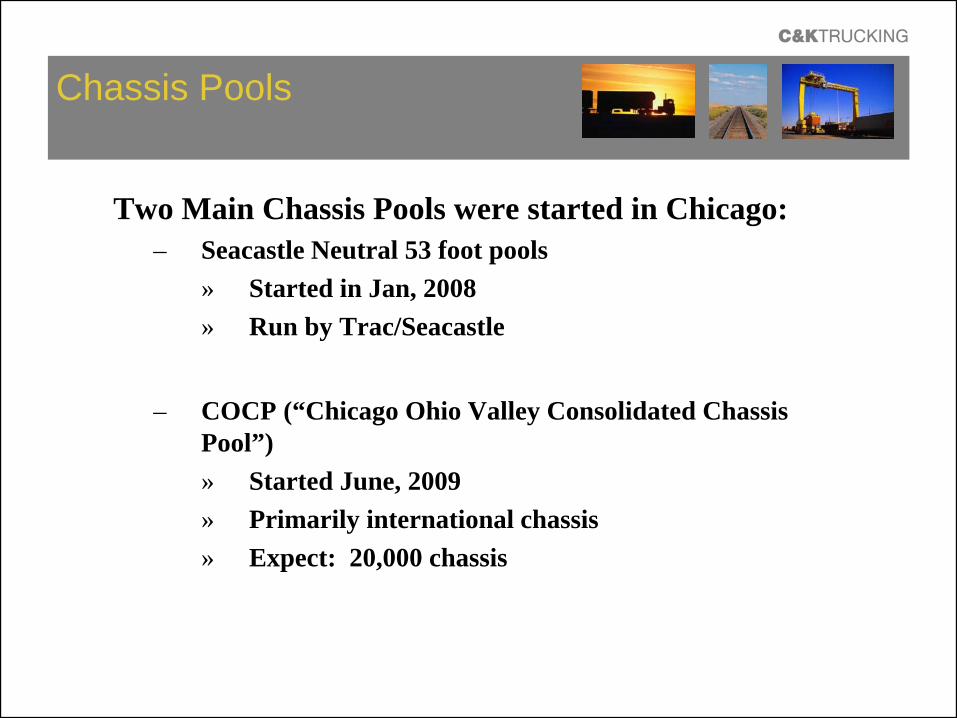
Chassis Pools
Two Main Chassis Pools were started in Chicago:– Seacastle Neutral 53 foot pools
» Started in Jan, 2008» Run by Trac/Seacastle
– COCP (“Chicago Ohio Valley Consolidated Chassis Pool”)» Started June, 2009» Primarily international chassis» Expect: 20,000 chassis
Chassis PoolsKey Points
• In 2004, chassis drays represent 30% of the total crosstown drays.
• In 2008, chassis drays represented less than 20% of the crosstown drays.
• Conclusion - The Pools reduced chassis drays and congestion.
Summary Reasons for Dwell Reduction
• Over last five years, Dwell has come down to below 5 hours due primarily to:
– Railroads investing in systems and technology– Opening of BNSF Elwood and UP Rochelle– Chassis Pools
- Volume was a factor, but not a material factor.
Factors Impacting Chicago RailTraffic Next 5 years
1) UP Global 4 (Elwood) Opening Fall 2010.2) EJ&E acquisition by CN.3) Rail Roads continuing effort for “bypass”
trains and alternative routes. 4) 2014 Widening of Panama Canal.5) Heartland Corridor being completed in 2010.

Future Growth Impacts- Next 5 years
Will we see “the black hole” return over the next five years as the economy turns around and we see growth?
- No, even with growth over next five years, the effects of the upcoming changes will allow for the absorption of the increased freight.
City of Chicago Traffic Statistics
City of Chicago Traffic Management Authority did a study in 2008. Key statistics were:– 3,800 miles of streets – 26,000 intersections (approx) – 2,900 + signalized intersections – Over a million estimated vehicles in the
streets every day.
– C&K estimates 2,500 crosstowns a day. 2/10 of 1% of Chicago traffic could be from crosstowns. Not a material impact.
Interesting Facts –Crosstown Traffic
• 30% of crosstowns occur on Saturday and Sunday
• 40% of crosstowns occur at night• Crosstown drivers avoid traffic congestion
given the economics
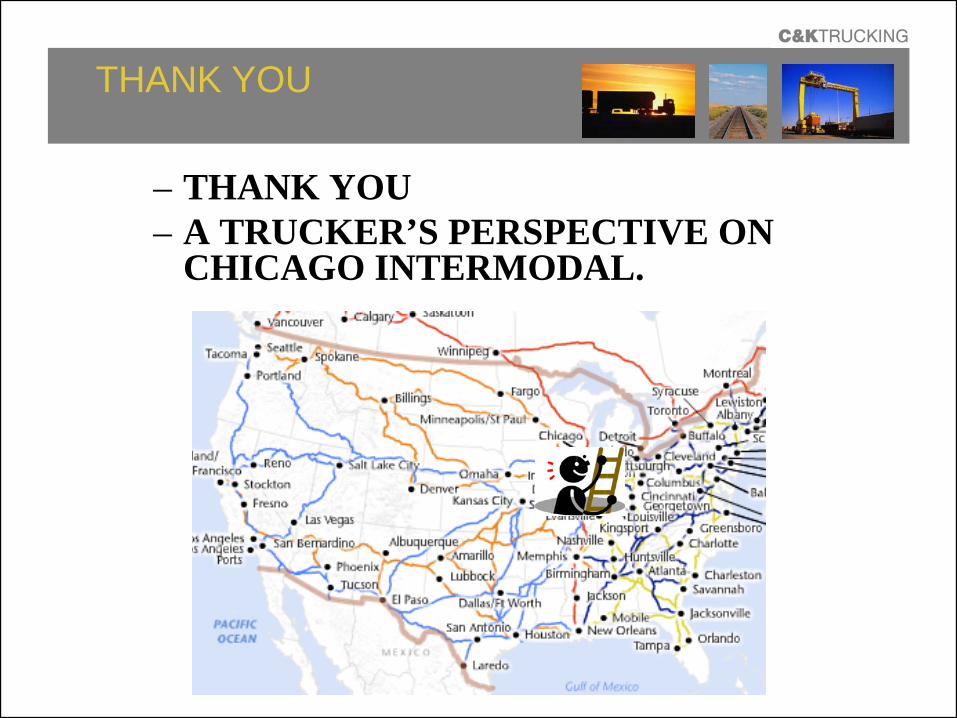
THANK YOU
– THANK YOU– A TRUCKER’S PERSPECTIVE ON
CHICAGO INTERMODAL.