Civil Service Employee Engagement Survey 2015
44
Department of Public Expenditure and Reform Government Buildings Upper Merrion Street Dublin 2 Ireland www.per.gov.ie Civil Service Employee Engagement Survey 2015 70% Employee Engagement 2015
Transcript of Civil Service Employee Engagement Survey 2015
Department of Public Expenditure and Reform Government Buildings Upper Merrion Street Dublin 2 Ireland
www.per.gov.ie
Civil Service Employee Engagement Survey 2015
50%40%30%20%10%00% 60% 70% 80% 90% 100%
70% Employee Engagement 2015
Welcome to the results of the 2015 Civil Service Employee Engagement Survey, the first of its kind in the history of the Civil Service.
We would like to thank all those who took the time to complete the 2015 survey. By providing us with your views you have given us critical information about your experience of the Civil Service – highlighting the things we are doing well and the areas we need to improve.
The Employee Engagement Survey is an important action in the Civil Service Renewal Plan: a plan focused on building on the strengths of the Civil Service and tracking what needs to improve for the future. Over 15,500 civil servants completed the survey, and we are happy to report that the results indicate that overall Employee Engagement is high at 70%. This means that the majority of staff have a sense of energy and connection with their work, can cope with the demands of their job and find their work fulfilling. This is a result that compares well with other administrations across the world, and also many private sector organisations at home.
While the results show many strengths, they also show areas the Civil Service needs to improve: organisational support, leadership, career development, communicating with and listening to staff.
This 2015 report summarises the results for the Civil Service overall, and it will allow us to listen, act, and grow as an organisation.
We know that publishing the report is only the first step. We now need to work with staff to build on the elements that are good and change the things that need to be improved.
We will track our progress and provide regular updates on www.per.gov.ie/csrenewal or https://csvision.per.gov.ie
This year’s results are encouraging and show that we are on our way to a more professional, responsive, open and unified organisation that continues to deliver for the State and the public we serve.
The Civil Service Management Board
Message from the Civil Service Management Board Martin Fraser
Secretary General to the Government Secretary General Department of the Taoiseach
Robert Watt Secretary General Department of Public Expenditure and Reform
Jim Breslin Secretary General Department of Health
Derek Moran Secretary General Department of Finance
Niall Burgess Secretary General Department of Foreign Affairs and Trade
Aidan O’Driscoll Secretary General Department of Agriculture, Food and the Marine
Fergal Lynch Secretary General Department of Children and Youth Affairs
John Murphy Secretary General Department of Jobs, Enterprise and Innovation
Padraig Dalton Director General Central Statistics Office
Liam O’Daly Director General Office of the Attorney General
Niall Cody Chairman Office of the Revenue Commissioners
Niamh O’Donoghue Secretary General Department of Social Protection
Mark Griffin Secretary General Department of Communications, Energy and Natural Resources
Seán Ó Foghlú Secretary General Department of Education and Skills
Joe Hamill Secretary General Department of Arts, Heritage and the Gaeltacht
Graham Doyle Secretary General Department of Transport, Tourism and Sport
John McCarthy Secretary General Department of Environment, Community and Local Government
Maurice Quinn Secretary General Department of Defence
Clare McGrath Chairman Office of Public Works
Noel Waters Secretary General (acting) Department of Justice and Equality
Fiona Tierney Chief Executive Public Appointments Service

50%40%30%20%10%00% 60% 70% 80% 90% 100%
Executive Summary
Civil Service Employee Engagement Survey 20152 3Civil Service Employee Engagement Survey 2015

Structure of this Report
Executive Summary ...........................................................................................................................3
Top 5 positive results for the Civil Service ................................................................................................6
Top 5 challenging results for the Civil Service ..........................................................................................7
The Results for 2015 .................................................................................................................................8
Key Messages 2015.................................................................................................................................10
The Results ......................................................................................................................................13
Quick Guide .............................................................................................................................................14
My Organisation ......................................................................................................................................16
My Job .....................................................................................................................................................24
My Supports ............................................................................................................................................40
My Environment .....................................................................................................................................50
My Views on the Civil Service .................................................................................................................54
How do the results vary across the Civil Service? ..................................................................................65
Brief insights on Gender .........................................................................................................................70
Brief insights on Grade ...........................................................................................................................71
Analysis ...........................................................................................................................................72
Notes and Data Tables .....................................................................................................................76
Background to this Report
Why is employee engagement important?High levels of employee engagement are important in any organisation. Evidence shows that employee engagement has a significant, positive effect on performance, productivity, absenteeism, attendance rates, retention levels, motivation, well-being, and morale. The hard part is measuring employee engagement effectively.
Why measure employee engagement?Many large organisations across the private and public sectors use engagement surveys to understand employees’ experiences in the workplace and to measure what drives engagement in organisations. Similar surveys have been used in different parts of the Civil Service for years. This has provided a helpful foundation to understand engagement in the Irish Civil Service. However, it has also created inefficiencies and big data gaps as no comprehensive data existed on engagement for the Civil Service as a whole. To remedy this, the Civil Service Renewal Plan (October 2014) committed to ‘introduce an annual employee engagement survey to involve staff at all levels in ongoing organisational improvement’.
What is the Civil Service Employee Engagement Survey?The Civil Service Management Board (CSMB) asked the Central Statistics Office to develop, administer and analyse the survey for the Civil Service. The survey asked civil servants to respond to 112 statements about working in the Civil Service. It is informed by best practice and builds on the considerable amount of research and analysis that has been conducted on engagement in the last 20 years. The survey questions were developed with support from internal and external stakeholders during 2015, piloted in July and launched in September 2015. All civil servants had the opportunity to respond.
Who participated in the Survey? More than 15,500 Irish civil servants worldwide responded to the survey in 2015. The results are summarised on pages 8-9 and detailed on pages 16-63. Of the 15,500 respondents 54.2% were women, 37.7% were men and 8.1% preferred not to say. In terms of geographical spread, 48% of respondents were from Dublin and 43% were from regional offices, the rest chose not to indicate their location. It’s important to remember that the report only summarises the levels of employee engagement for those that participated in the survey. However, the responses in 2015 are representative across all staff groups (grade, gender, age, length of service etc.) and there is no statistical bias in the results. This means we can confidently draw conclusions from the data.
What is captured in this report? This report summarises the results of the survey undertaken in September 2015.
The results establish for the first time, a baseline to measure employees views and perceptions on the performance and operation of the Civil Service in Ireland. The information will also set a benchmark across the Civil Service to measure and compare employee engagement between different Departments and Offices. However, it’s important to remember that staff and organisations across the Civil Service do very different jobs. To reflect this, CSO will also prepare detailed reports for each participating organisation so that staff and managers can review their own organisational results and act appropriately.
The results are published in full with no exceptions. This upholds a commitment to staff to regularly and openly engage with them. It also demonstrates active support for managers to provide regular accurate information to them, that they can draw on to support and motivate their teams. By carrying out the survey the quality of management information available in the Civil Service will improve which will better inform decisions of the Civil Service Management Board.
Civil Service Employee Engagement Survey 20154 5Civil Service Employee Engagement Survey 2015
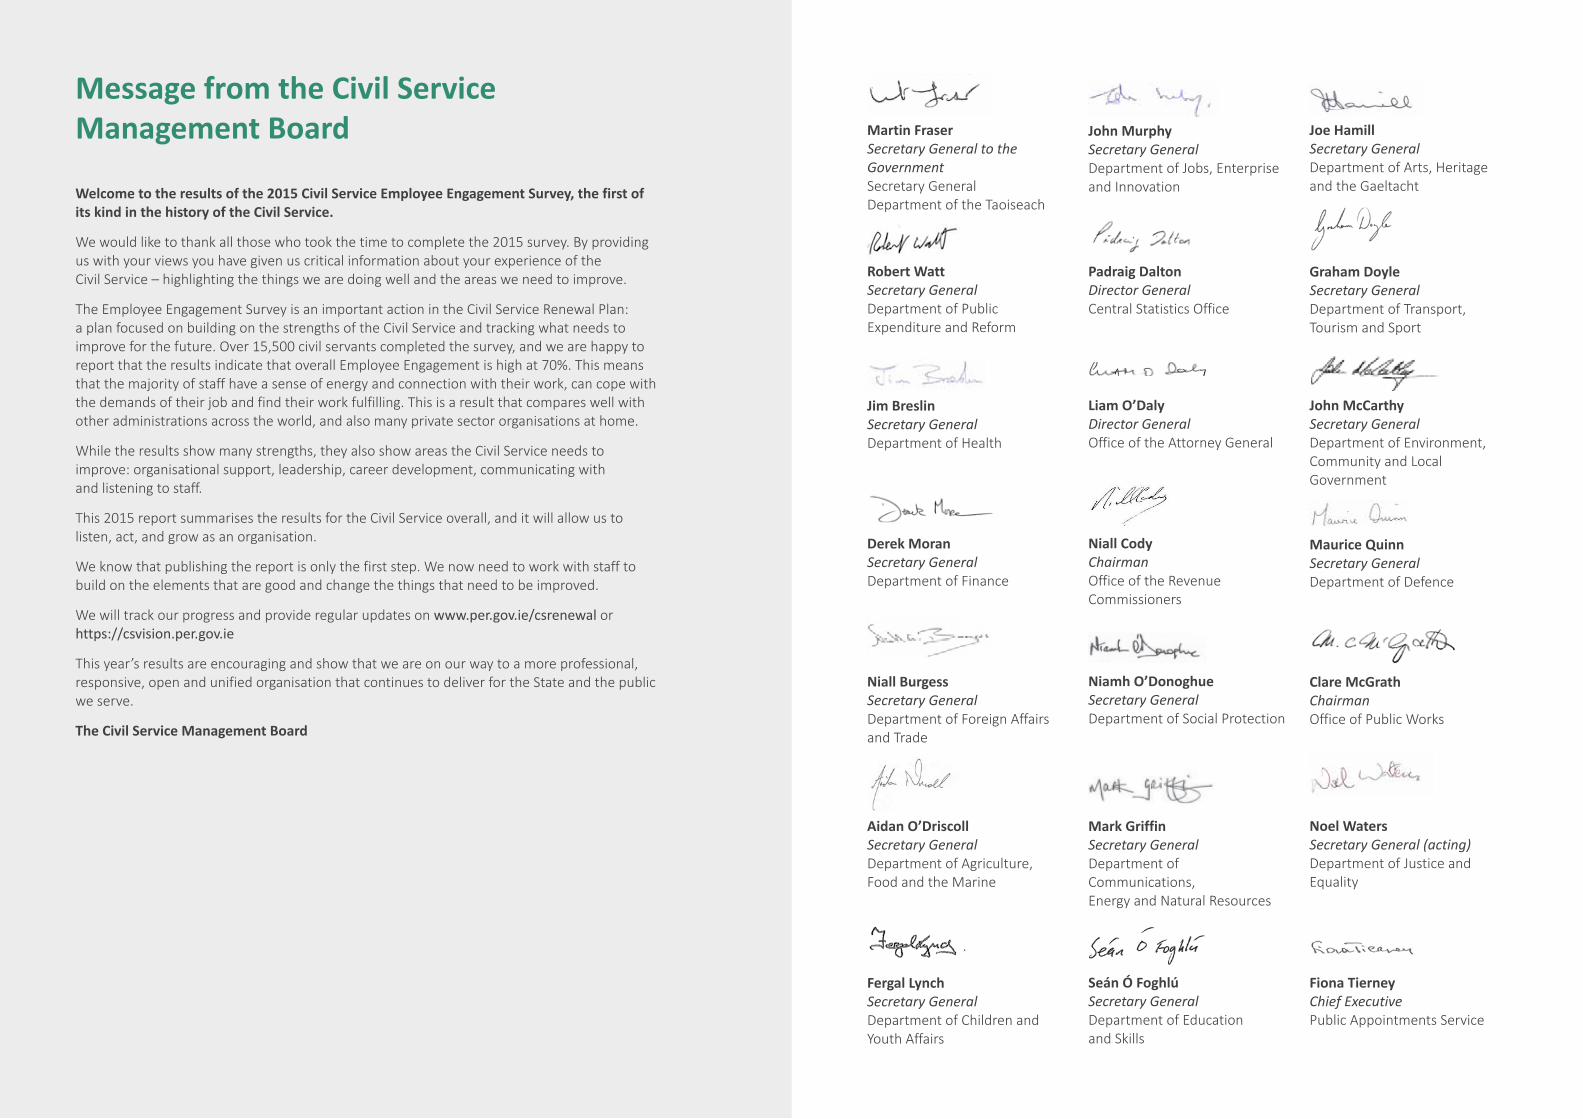
Top 5 positive results for the Civil Service Top 5 challenging results for the Civil Service
80%
75%
70%
70%
69%
33%
36%
42%
44%
44%
1. Competence This measures civil servants' belief in their ability and
skills to carry out the work required in their role. (page 28)
1. Public Perception of the Civil Service This measures how civil servants feel they are valued and
perceived by the general public. (page 56)
2. Well-being This measures the extent to which civil servants feel they can realise
their own potential and cope with the normal stresses of life. (page 20)
2. Involvement Climate This measures the extent to which civil servants feel that they
are involved openly in decision making in their organisation. (page 52)
3. Employee Engagement This measures the sense of energy, connection and fulfilment
civil servants have with their work. (page 16)
3. Your Pay This measures how civil servants feel about their pay in relation
to their efforts and contributions at work, and others who are like them.
(page 36)
4. Social Support This measures the extent to which civil servants feel they have
the opportunities to develop close relationships at work. (page 42)
4. Organisational Support This measures the degree to which employees feel their organisation
values their contribution and cares for their well-being. (page 46)
5. Coping with Change This measures the extent to which civil servants feel they can
cope with change, including managing any negative emotions. (page 22)
5. Career Development and Mobility This measures the extent to which civil servants feel there
are sufficient opportunities for career development, learning, mobility and promotion in the Civil Service.
(page 34)
Civil Service Employee Engagement Survey 20156 7Civil Service Employee Engagement Survey 2015
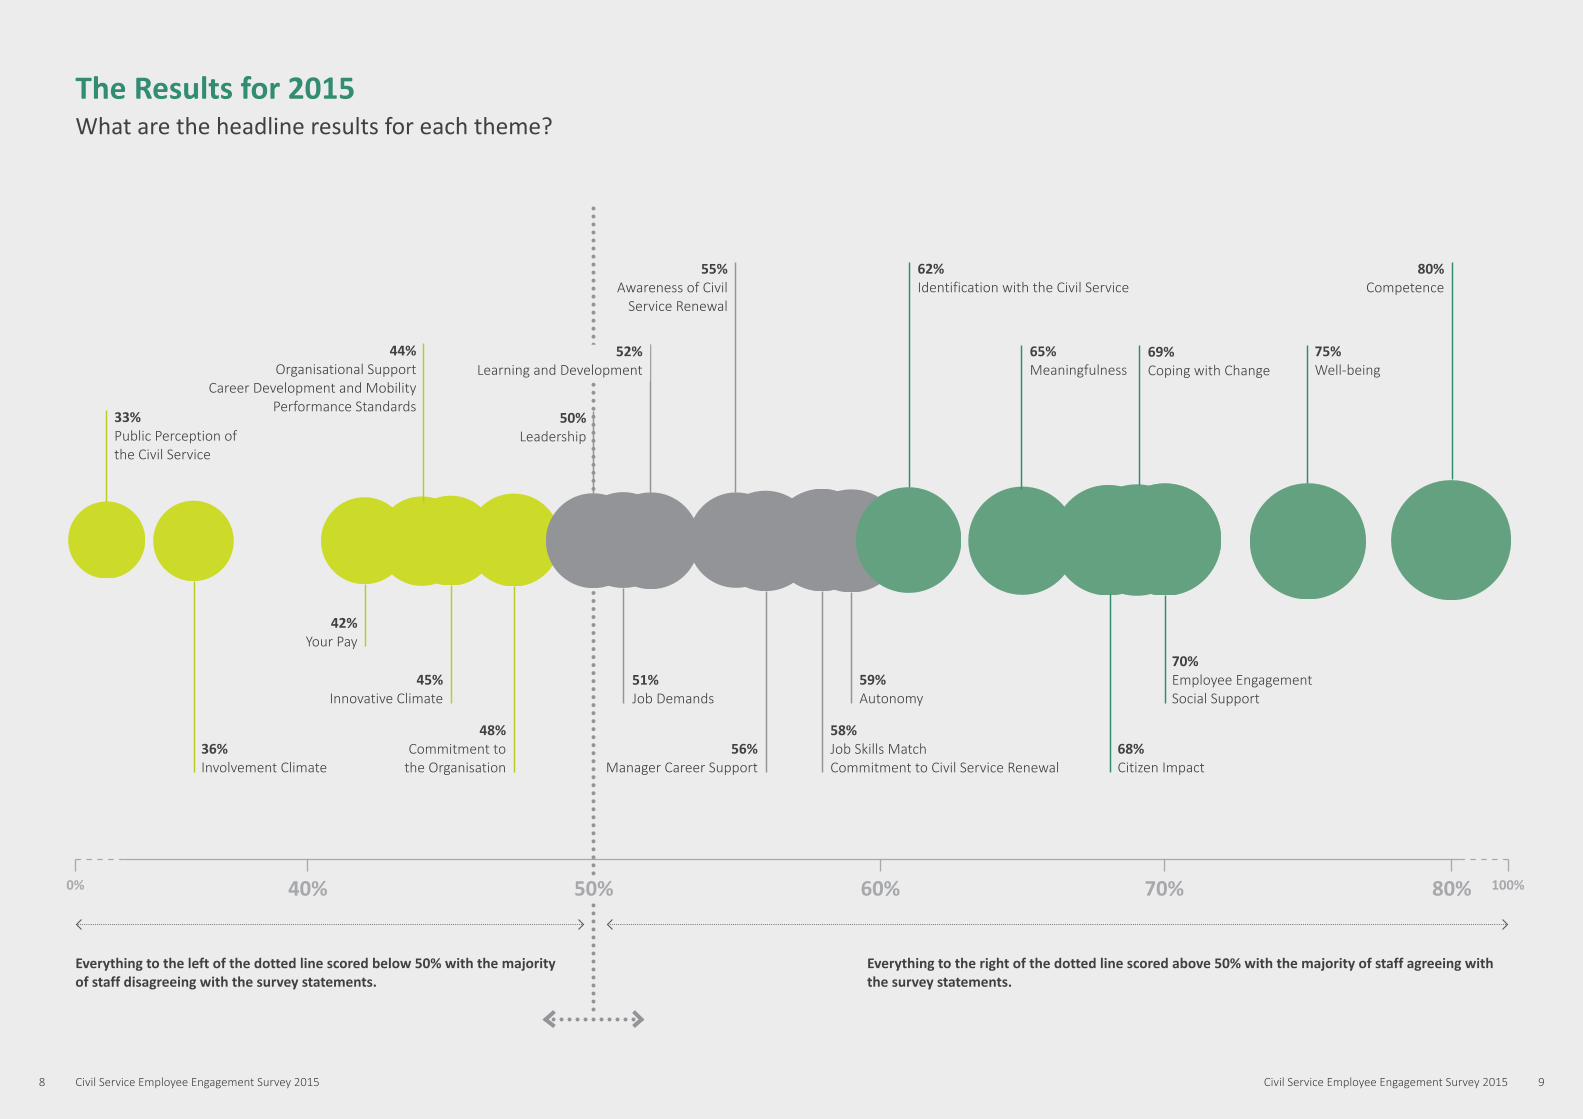
The Results for 2015What are the headline results for each theme?
Everything to the left of the dotted line scored below 50% with the majority of staff disagreeing with the survey statements.
Everything to the right of the dotted line scored above 50% with the majority of staff agreeing with the survey statements.
50%40%30%20%10%00% 60% 70% 80% 90% 100%
70% Employee Engagement Social Support
58% Job Skills Match Commitment to Civil Service Renewal
65% Meaningfulness
75% Well-being
80% Competence
50% Leadership
52% Learning and Development
55% Awareness of Civil
Service Renewal
42% Your Pay
44% Organisational Support
Career Development and Mobility Performance Standards
48% Commitment to
the Organisation
33% Public Perception of the Civil Service
45% Innovative Climate
59% Autonomy
36% Involvement Climate
62% Identification with the Civil Service
56% Manager Career Support
68% Citizen Impact
69% Coping with Change
70% 80%60%50%40% 100%0%
51% Job Demands
Civil Service Employee Engagement Survey 20158 9Civil Service Employee Engagement Survey 2015

Key Messages 2015What do the results tell us about the Civil Service?
1. Civil servants feel highly engagedThe primary aim of this survey was to measure levels of engagement. At 70%, engagement levels across the Civil Service are high and show that civil servants have a strong sense of energy and connection with their work, can cope with the demands of their job, and find their work fulfilling. These results are broadly stable across different staff groups (age, gender, grade etc.) and compare well with international surveys on engagement. This is a very positive outcome and a solid foundation on which to build for the Civil Service of the future.
6. Staff do not recognise a culture of involvement or innovation in the Civil ServiceDespite major reforms which have occurred since 2008, staff do not feel involved in organisational decisions (36%) and do not feel that they have the opportunity to innovate and take the initiative (45%). The results show that the majority of staff (and more women than men) feel that changes are made without consultation, decisions are made over their heads, and information is not widely shared. These views are particularly strong at junior grades, providing evidence of a hierarchical culture.
Responses to almost all the areas surveyed are more positive at senior rather than junior grades, in some cases markedly so. For example, response to the statement ‘my job inspires me’ is at 90% for the most senior grades and 39% for the most junior grades (Clerical Officers). Levels of commitment to the organisation also vary widely. At 88% the most senior grades feel a strong sense of belonging to the organisation compared to 27% at the most junior grades.
Similarly while 68% of senior managers are positive about their opportunities to be moved around to learn a broad range of skills for career development, only 21% of Industrial staff felt the same.
7. Staff feel that their work is not fully valued by the public they serve Perceptions of how the public values the work of civil servants, at 33%, is the lowest score of all the areas measured. This is in marked contrast to the strong results for the value and meaning staff attach to their own work (65%) and the extent to which staff feel their work impacts on citizens (68%). The responses to the question on whether the public appreciates the work that they do, at 15%, highlights the depth of feeling among civil servants in relation to how they are perceived by the general public. This is in stark contrast to the results of the Civil Service Customer Service Survey 2015 which showed consistently high satisfaction levels among the public.
2. The results compare well internationallyNo previous Civil Service wide survey exists so there is little organisational data to compare and contrast the results this year. However, several countries run employee surveys (using different methodologies) and while not directly comparable those results highlight interesting comparisons. For example, on Employee Engagement where Ireland scored 70%:
• In the Canadian Public Service Employee Survey 2014, employee engagement scored an average of 74% over a range of employee engagement questions.
• The Australian Public Service scored 6.7 out of 10 in relation to job engagement in 2015.
• The Engagement Index in the UK Civil Service in 2015 is 58%.
3. Civil servants feel positive about their own work and their immediate working environmentCivil servants like the work they do (70%), feel competent in their ability to do their jobs (80%), have good social supports and friendships at work (70%), experience a real sense of purpose and meaning at work (65%), and feel what they do has a positive impact on the public (68%).
Civil servants are highly resilientThe majority of civil servants experience a sense of well-being at work (75%) and feel able to cope with change (69%). These results are reinforced by strong responses to statements on personal resilience; always persevering at work even when things do not go well (94%); coping with work problems (88%); and reacting to change in a problem-solving way (84%).
These results demonstrate high levels of personal resilience among civil servants when viewed alongside other measures where perceptions are markedly low, for example, Organisational Support (44%), Public Perception of the Civil Service (33%), and fairness in Pay and rewards (42%). This widespread resilience is a striking result in view of the negative public commentary, changes to terms and conditions including reductions to core pay, reduced staff numbers and increasing demands for services that civil servants have experienced in recent years.
4.
5. Civil servants are noticeably less positive about their leaders and their organisationsWhile well-being levels are reported as being relatively high (75%) it is worth noting that the results suggest that this is linked to issues within the individual’s personal domain rather than organisational domain issues and supports.
Civil servants are less happy with the organisations in which they work. Commitment to the organisation is low relative to other results at 48%; perception of support from the organisation is also low at 44% and feedback on support from managers and leadership effectiveness are mixed at 56% and 50% respectively. Civil servants do not feel sufficiently involved in decision-making in their organisation (36%) and they do not feel that performance is managed effectively (44%). This makes for challenging reading for those in leadership and senior management positions.
In contrast, while responses are high for areas that are within the individual’s personal domain – areas such as Competence, Coping with Change and as referenced above Well-being – scores for more organisational areas outside of the employee’s control are not as strong. This suggests a difference of perception in regard to the individual and the organisation and it is worth noting that this difference is largest at more junior grades.
Civil Service Employee Engagement Survey 201510 11Civil Service Employee Engagement Survey 2015
50%40%30%20%10%00% 60% 70% 80% 90% 100%
The Results
Civil Service Employee Engagement Survey 201512 13Civil Service Employee Engagement Survey 2015
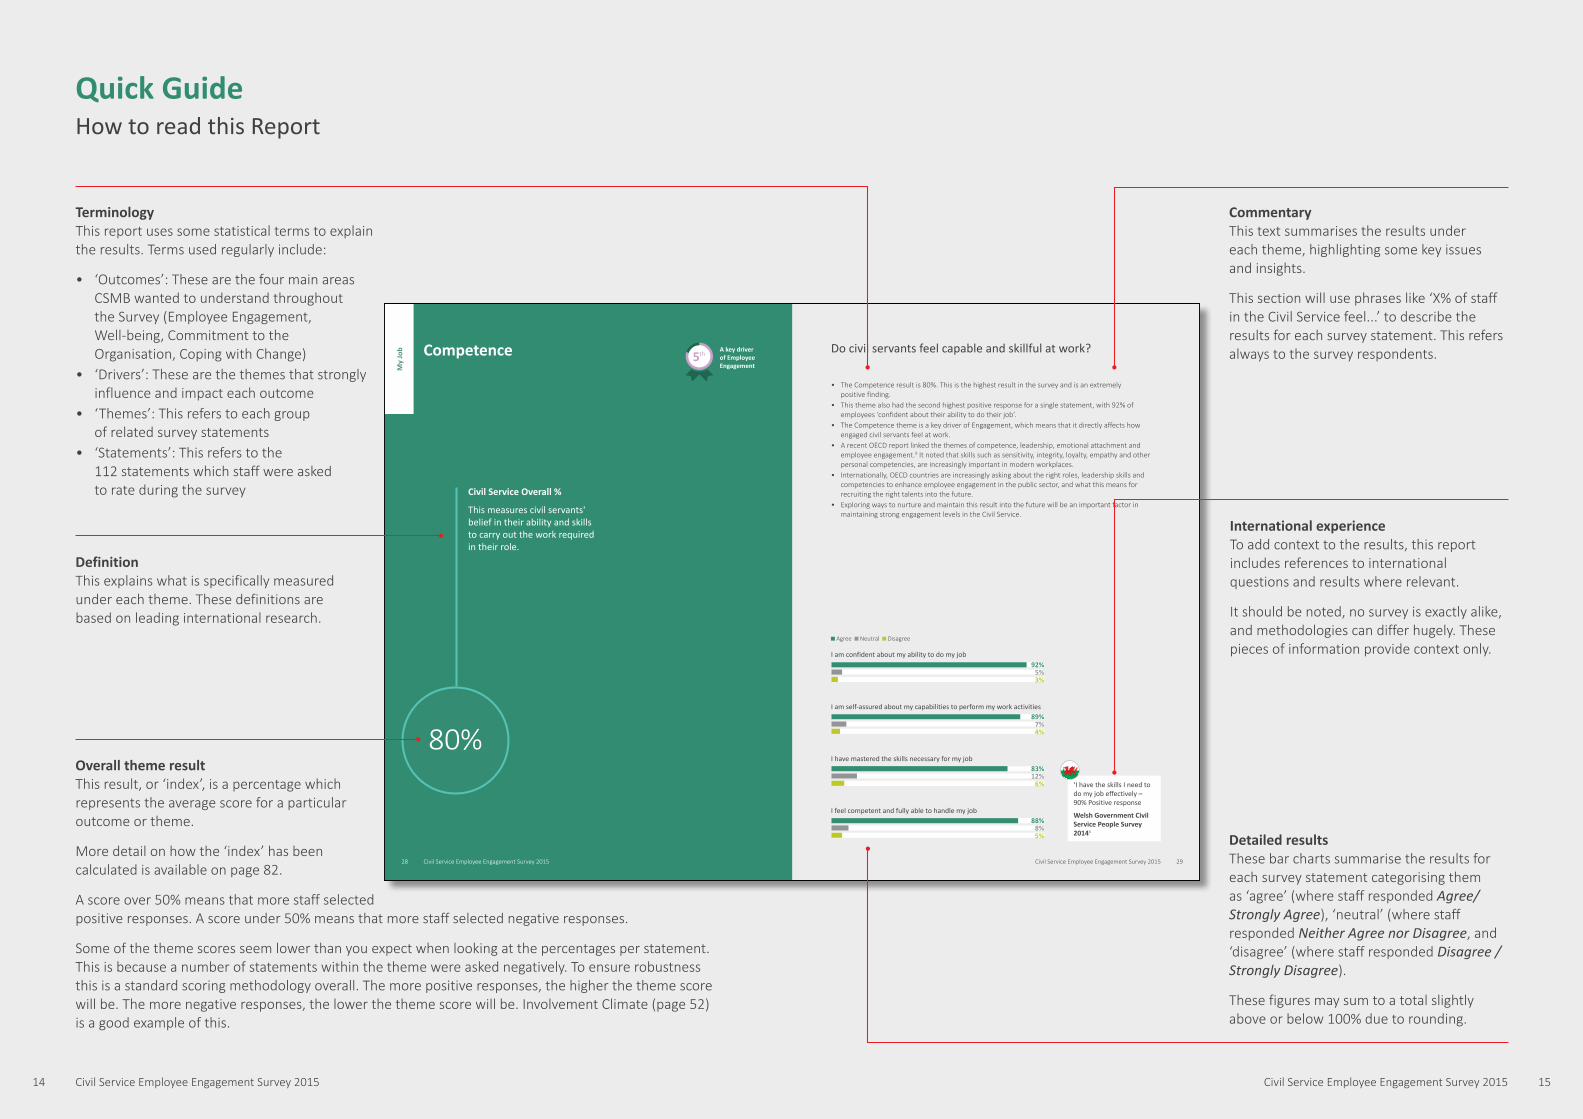
Overall theme result This result, or ‘index’, is a percentage which represents the average score for a particular outcome or theme.
More detail on how the ‘index’ has been calculated is available on page 82.
A score over 50% means that more staff selected positive responses. A score under 50% means that more staff selected negative responses.
Some of the theme scores seem lower than you expect when looking at the percentages per statement. This is because a number of statements within the theme were asked negatively. To ensure robustness this is a standard scoring methodology overall. The more positive responses, the higher the theme score will be. The more negative responses, the lower the theme score will be. Involvement Climate (page 52) is a good example of this.
Quick GuideHow to read this Report
50%40%30%20%10%00% 60% 70% 80% 90% 100%
Competence Do civil servants feel capable and skillful at work?
• The Competence result is 80%. This is the highest result in the survey and is an extremely positive finding.
• This theme also had the second highest positive response for a single statement, with 92% of employees ‘confident about their ability to do their job’.
• The Competence theme is a key driver of Engagement, which means that it directly affects how engaged civil servants feel at work.
• A recent OECD report linked the themes of competence, leadership, emotional attachment and employee engagement.9 It noted that skills such as sensitivity, integrity, loyalty, empathy and other personal competencies, are increasingly important in modern workplaces.
• Internationally, OECD countries are increasingly asking about the right roles, leadership skills and competencies to enhance employee engagement in the public sector, and what this means for recruiting the right talents into the future.
• Exploring ways to nurture and maintain this result into the future will be an important factor in maintaining strong engagement levels in the Civil Service.
I am confident about my ability to do my job
I am self-assured about my capabilities to perform my work activities
I have mastered the skills necessary for my job
I feel competent and fully able to handle my job
92%5%3%
89%7%4%
83%12%6%
88%8%5%
‘I have the skills I need to do my job effectively – 90% Positive response
Welsh Government Civil Service People Survey 20146
Civil Service Overall %
This measures civil servants' belief in their ability and skills to carry out the work required in their role.
Agree Neutral Disagree
A key driver of Employee Engagement
5th
80%
My
Job
29Civil Service Employee Engagement Survey 2015Civil Service Employee Engagement Survey 201528
DefinitionThis explains what is specifically measured under each theme. These definitions are based on leading international research.
CommentaryThis text summarises the results under each theme, highlighting some key issues and insights.
This section will use phrases like ‘X% of staff in the Civil Service feel...’ to describe the results for each survey statement. This refers always to the survey respondents.
TerminologyThis report uses some statistical terms to explain the results. Terms used regularly include:
• ‘Outcomes’: These are the four main areas CSMB wanted to understand throughout the Survey (Employee Engagement, Well-being, Commitment to the Organisation, Coping with Change)
• ‘Drivers’: These are the themes that strongly influence and impact each outcome
• ‘Themes’: This refers to each group of related survey statements
• ‘Statements’: This refers to the 112 statements which staff were asked to rate during the survey
Detailed resultsThese bar charts summarise the results for each survey statement categorising them as ‘agree’ (where staff responded Agree/Strongly Agree), ‘neutral’ (where staff responded Neither Agree nor Disagree, and ‘disagree’ (where staff responded Disagree / Strongly Disagree).
These figures may sum to a total slightly above or below 100% due to rounding.
International experienceTo add context to the results, this report includes references to international questions and results where relevant.
It should be noted, no survey is exactly alike, and methodologies can differ hugely. These pieces of information provide context only.
Civil Service Employee Engagement Survey 201514 15Civil Service Employee Engagement Survey 2015
50%40%30%20%10%00% 60% 70% 80% 90% 100%
‘I am proud of the work that I do’ – 88% responded positively
Canadian Public Service Employee Survey, February 20154
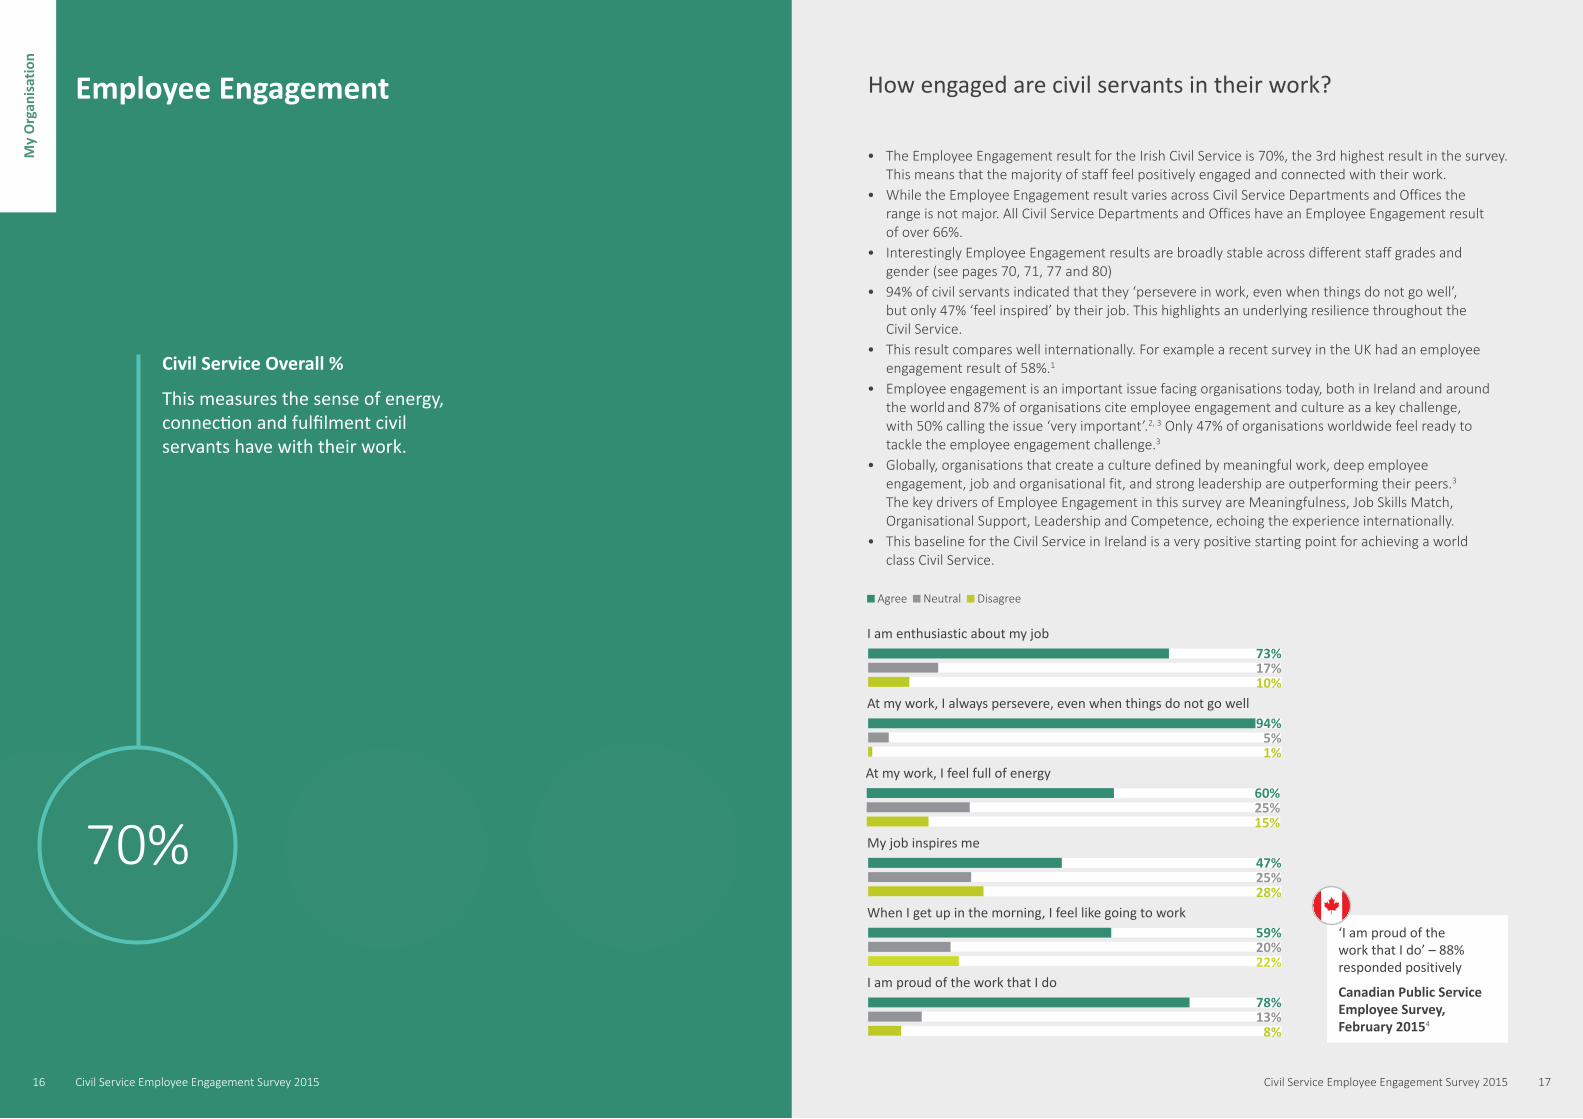
73%17%10%
94%5%1%
I am proud of the work that I do
When I get up in the morning, I feel like going to work
My job inspires me
At my work, I always persevere, even when things do not go well
I am enthusiastic about my job
Employee Engagement
• The Employee Engagement result for the Irish Civil Service is 70%, the 3rd highest result in the survey. This means that the majority of staff feel positively engaged and connected with their work.
• While the Employee Engagement result varies across Civil Service Departments and Offices the range is not major. All Civil Service Departments and Offices have an Employee Engagement result of over 66%.
• Interestingly Employee Engagement results are broadly stable across different staff grades and gender (see pages 70, 71, 77 and 80)
• 94% of civil servants indicated that they ‘persevere in work, even when things do not go well’, but only 47% ‘feel inspired’ by their job. This highlights an underlying resilience throughout the Civil Service.
• This result compares well internationally. For example a recent survey in the UK had an employee engagement result of 58%.1
• Employee engagement is an important issue facing organisations today, both in Ireland and around the world and 87% of organisations cite employee engagement and culture as a key challenge, with 50% calling the issue ‘very important’.2, 3 Only 47% of organisations worldwide feel ready to tackle the employee engagement challenge.3
• Globally, organisations that create a culture defined by meaningful work, deep employee engagement, job and organisational fit, and strong leadership are outperforming their peers.3
The key drivers of Employee Engagement in this survey are Meaningfulness, Job Skills Match, Organisational Support, Leadership and Competence, echoing the experience internationally.
• This baseline for the Civil Service in Ireland is a very positive starting point for achieving a world class Civil Service.
78%13%8%
59%20%22%
47%25%28%
60%25%15%
70%
Civil Service Overall %
This measures the sense of energy, connection and fulfilment civil servants have with their work.
At my work, I feel full of energy
How engaged are civil servants in their work?
Agree Neutral Disagree
My
Org
anis
atio
n
17Civil Service Employee Engagement Survey 2015Civil Service Employee Engagement Survey 201516

50%40%30%20%10%00% 60% 70% 80% 90% 100%
I do not feel like ‘part of the family’ at the Department
I do not feel a strong sense of ‘belonging’ to the Department
I do not feel ‘emotionally attached’ to the Department
Commitment to the Organisation
• The Commitment to the Organisation result is 48%.• Over one third of all civil servants do not feel ‘a strong sense of belonging’ or ‘emotional attachment’
to their Department. • Nearly one quarter of employees were neutral which also raises concerns about their level of
attachment. • Commitment levels vary significantly by grade, with senior staff registering higher levels of
Commitment to the Organisation.• This result is interesting when compared to the result for Identification with the Civil Service which
is higher at 62%. This result might therefore be good news for the prospects of achieving a 'unified' Civil Service as set out in the Civil Service Renewal Plan.
• International experience is mixed in this area; for example: – 60% of Australian Public Service employees feel a strong personal attachment to their agency5
– 51% of civil servants in Wales feel a strong personal attachment to their organisation6
– 50% of civil servants in Scotland civil servants feel a strong personal attachment to their organisation7
• Research shows that employees’ motivations are changing, with organisational commitment increasingly being influenced by elements like purpose, mission, and work-life balance. This is particularly the case for younger employees.8
• Changing commitment levels, will require a focus on the key drivers, in particular ensuring staff have meaningful work (65%) and improving organisational supports (44%).
37%21%42%
38%27%35%
35%22%43%
Civil Service Overall %
This measures the level of attachment that civil servants have to the Department/Office they work for.
‘I feel a strong personal attachment to my organisation’ – 47% responded positively
UK Civil Service People Survey, November 20151
48%
How committed are civil servants to their Department?
Agree Neutral Disagree
My
Org
anis
atio
n
19Civil Service Employee Engagement Survey 2015Civil Service Employee Engagement Survey 201518
50%40%30%20%10%00% 60% 70% 80% 90% 100%
Well-being What are the levels of well-being in the Civil Service?
75%
Civil Service Overall %
This measures the extent to which civil servants feel they can realise their own potential and cope with the normal stresses of life.
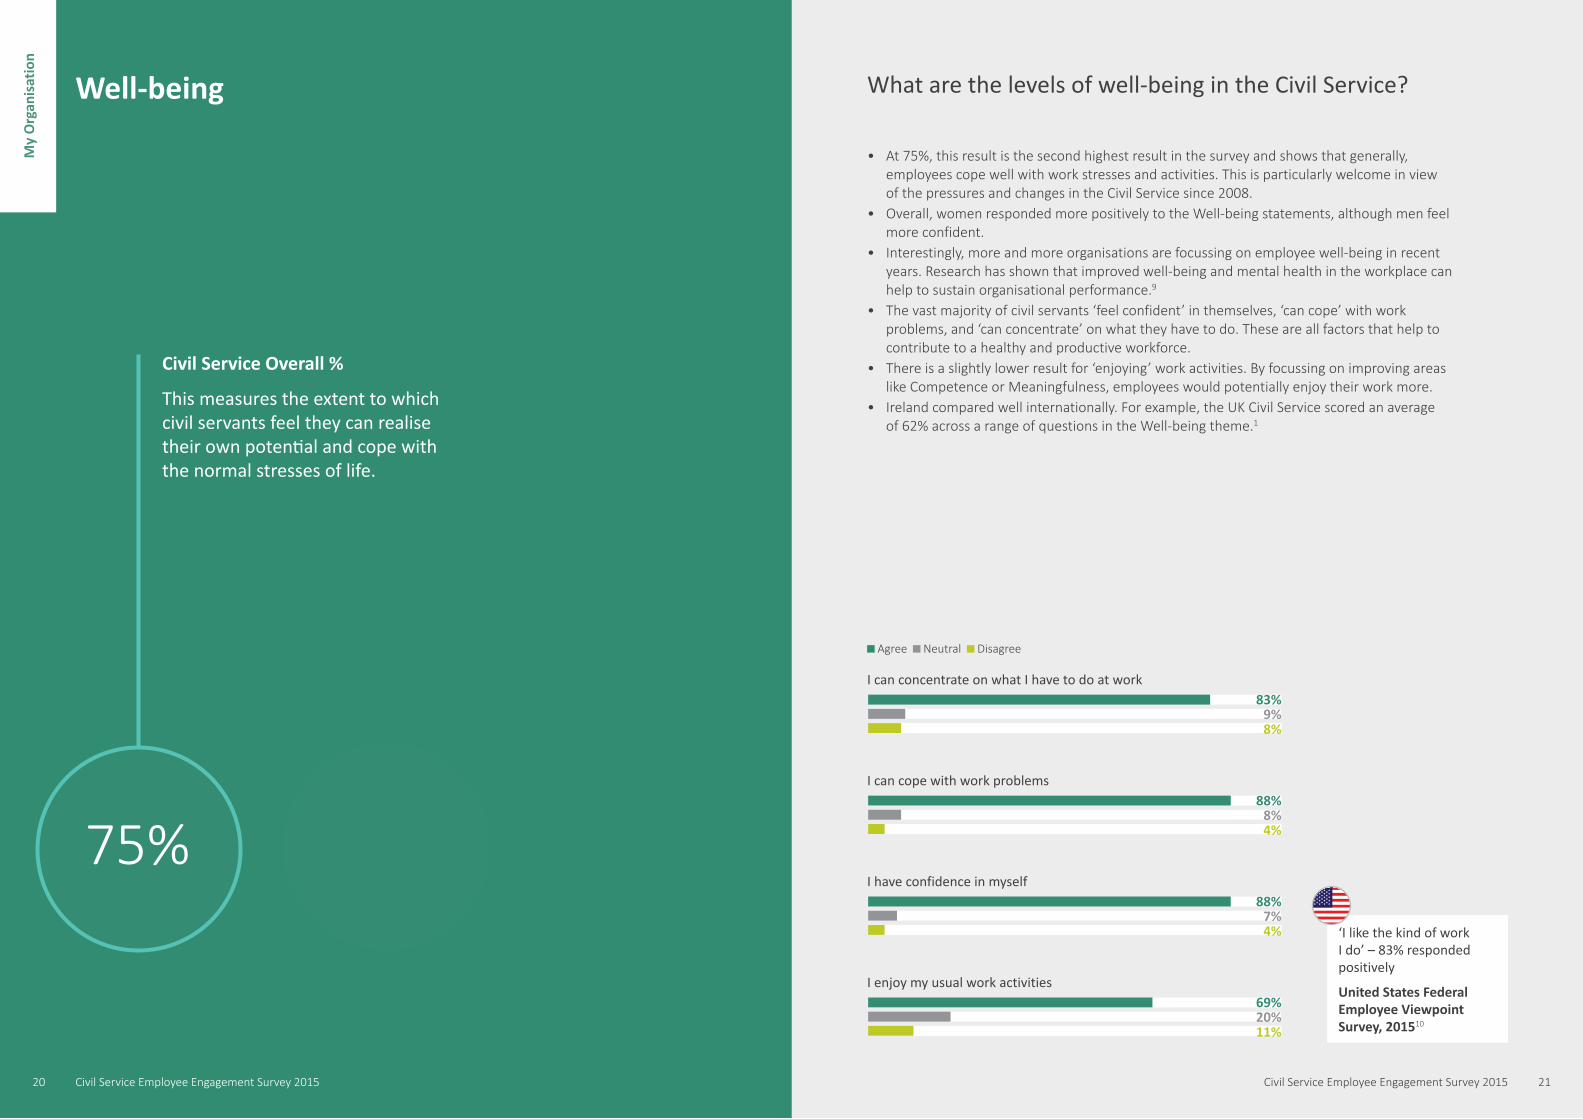
• At 75%, this result is the second highest result in the survey and shows that generally, employees cope well with work stresses and activities. This is particularly welcome in view of the pressures and changes in the Civil Service since 2008.
• Overall, women responded more positively to the Well-being statements, although men feel more confident.
• Interestingly, more and more organisations are focussing on employee well-being in recent years. Research has shown that improved well-being and mental health in the workplace can help to sustain organisational performance.9
• The vast majority of civil servants ‘feel confident’ in themselves, ‘can cope’ with work problems, and ‘can concentrate’ on what they have to do. These are all factors that help to contribute to a healthy and productive workforce.
• There is a slightly lower result for ‘enjoying’ work activities. By focussing on improving areas like Competence or Meaningfulness, employees would potentially enjoy their work more.
• Ireland compared well internationally. For example, the UK Civil Service scored an average of 62% across a range of questions in the Well-being theme.1
I can concentrate on what I have to do at work
I can cope with work problems
I have confidence in myself
I enjoy my usual work activities
83%9%8%
88%8%4%
88%7%4%
69%20%11%
Agree Neutral Disagree
‘I like the kind of work I do’ – 83% responded positively
United States Federal Employee Viewpoint Survey, 201510
My
Org
anis
atio
n
21Civil Service Employee Engagement Survey 2015Civil Service Employee Engagement Survey 201520

84%13%2%
50%40%30%20%10%00% 60% 70% 80% 90% 100%
22%30%48%
Coping with Change How well do civil servants cope with change?
69%
Civil Service Overall %
This measures the extent to which civil servants feel they can cope with change including managing any negative emotions.
• At 69%, this is a strong result that shows that most staff generally feel they can cope with change.• This result is very positive, particularly in the context of the rapidly changing political, social and
economic environment the Civil Service operates within.• The vast majority of staff consider that they ‘react in a problem solving way’ and ‘try to manage
change rather than complain about it’. • 22% of civil servants did note change as a cause for stress. This is a significant result and must be
considered as part of the response to the survey.• The range of positive scores for the Coping with Change theme (48-86%), are higher than the
range of positive scores for the Commitment to Civil Service Renewal theme (32-49%). It will be interesting to explore the reasons for this as part of the on-going implementation of the Civil Service Renewal Plan.
69%26%5%
When change happens in the Department, I react by trying to manage the change rather than complain about it
When changes are announced, I try to react in a problem-solving way
When change occurs in the Department, it causes me stress
I embrace change in the Department
86%11%3%
54%38%8%
I think I cope with change better than most‘I feel that change is managed well in the organisation’ 32% responded positively
Welsh Government Civil Service People Survey 20146
Agree Neutral Disagree
My
Org
anis
atio
n
23Civil Service Employee Engagement Survey 2015Civil Service Employee Engagement Survey 201522
50%40%30%20%10%00% 60% 70% 80% 90% 100%
Autonomy How much autonomy do civil servants have at work?
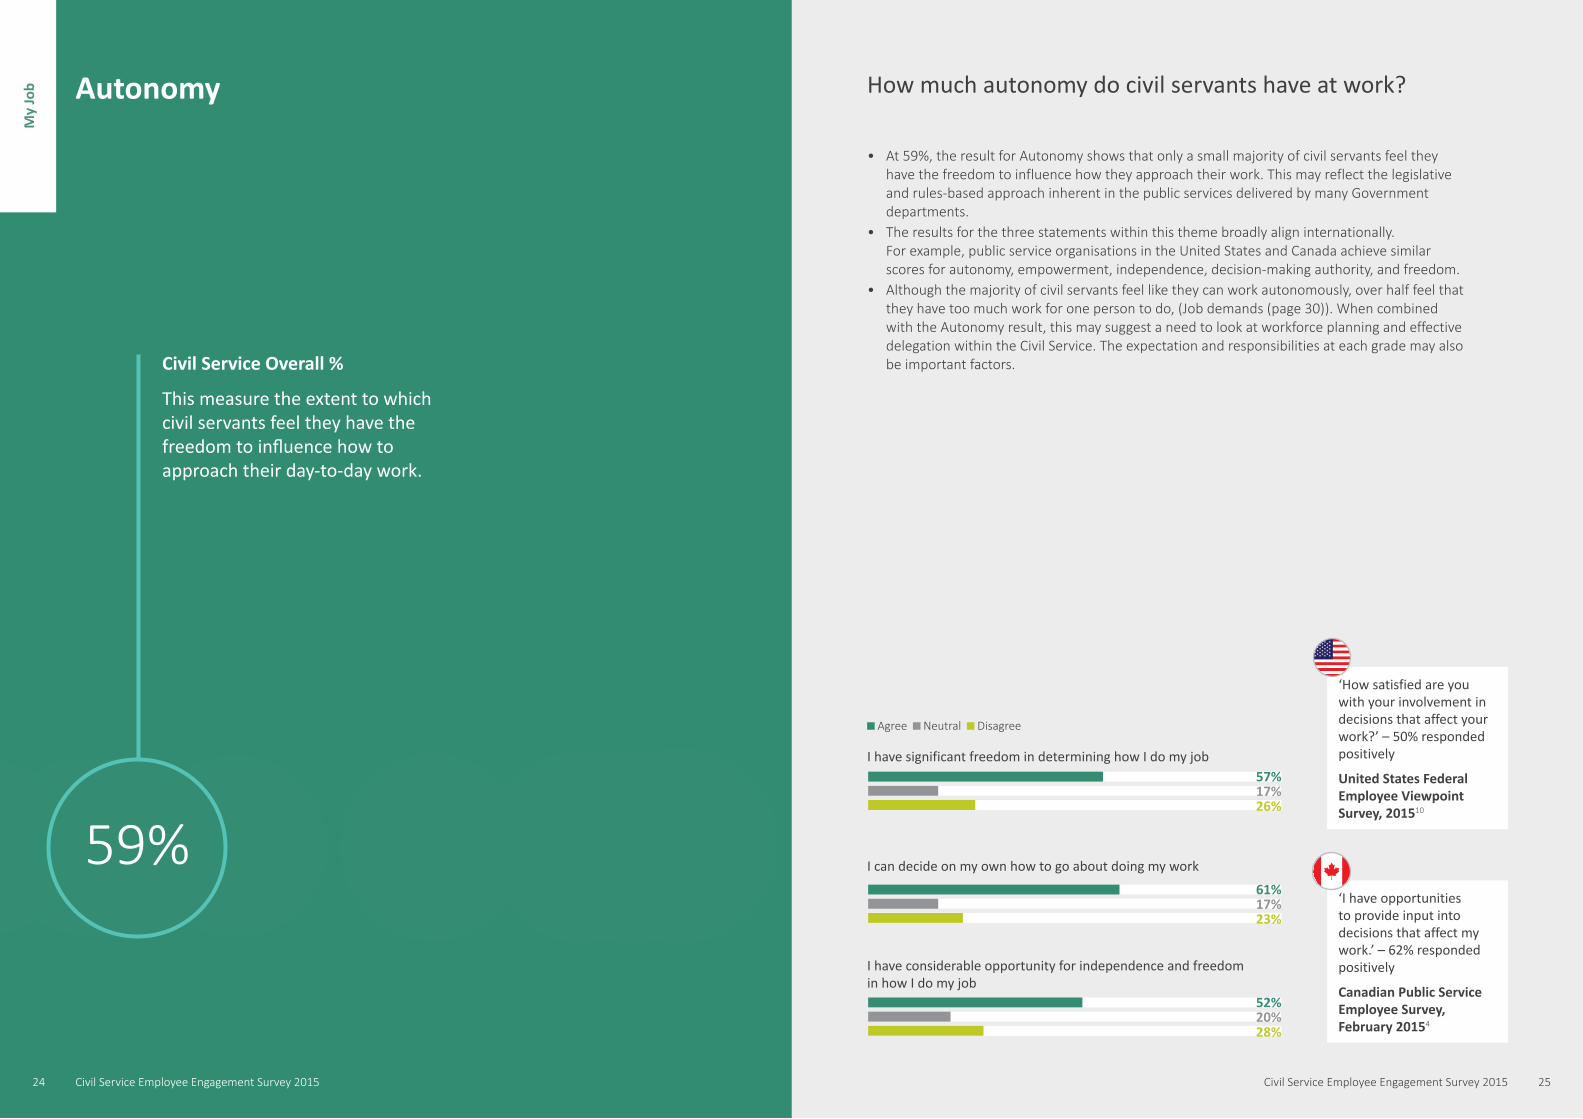
I have significant freedom in determining how I do my job
I can decide on my own how to go about doing my work
I have considerable opportunity for independence and freedom in how I do my job
57%17%26%
61%17%23%
52%20%28%
59%
Civil Service Overall %
This measure the extent to which civil servants feel they have the freedom to influence how to approach their day-to-day work.
‘How satisfied are you with your involvement in decisions that affect your work?’ – 50% responded positively
United States Federal Employee Viewpoint Survey, 201510
‘I have opportunities to provide input into decisions that affect my work.’ – 62% responded positively
Canadian Public Service Employee Survey, February 20154
• At 59%, the result for Autonomy shows that only a small majority of civil servants feel they have the freedom to influence how they approach their work. This may reflect the legislative and rules-based approach inherent in the public services delivered by many Government departments.
• The results for the three statements within this theme broadly align internationally. For example, public service organisations in the United States and Canada achieve similar scores for autonomy, empowerment, independence, decision-making authority, and freedom.
• Although the majority of civil servants feel like they can work autonomously, over half feel that they have too much work for one person to do, (Job demands (page 30)). When combined with the Autonomy result, this may suggest a need to look at workforce planning and effective delegation within the Civil Service. The expectation and responsibilities at each grade may also be important factors.
Agree Neutral Disagree
My
Job
25Civil Service Employee Engagement Survey 2015Civil Service Employee Engagement Survey 201524

50%40%30%20%10%00% 60% 70% 80% 90% 100%
Meaningfulness Do civil servants find their work meaningful?
The work I do is very important to me
My job activities are personally meaningful to me
The work I do is meaningful to me
68%20%12%
54%28%19%
63%22%16%
65%
Civil Service Overall %
This measures the extent to which civil servants feel their work has value, meaning and purpose.
• The Meaningfulness result for the Civil Service is 65%. • This result is very important for the Civil Service because meaningful work is a main driver for
all survey outcomes (Employee Engagement, Well-being, Commitment to the Organisation, Coping with Change).
• Almost two out of three civil servants agree that their work is ‘meaningful’.• Interestingly, this view is particularly strong at the most senior levels.• Overall the Civil Service is starting from a strong position. Ensuring meaningfulness is a focus
across the Civil Service will mean it continues to positively impact employee engagement in the years ahead.
• Internationally, ‘meaningful work’ is widely recognised as a critical element of employee engagement alongside areas like supportive management and trust in leadership.11
A key driver of Employee Engagement
Agree Neutral Disagree
1st
My
Job
27Civil Service Employee Engagement Survey 2015Civil Service Employee Engagement Survey 201526

50%40%30%20%10%00% 60% 70% 80% 90% 100%
Competence Do civil servants feel capable and skillful at work?
• The Competence result is 80%. This is the highest result in the survey and is an extremely positive finding.
• This theme also had the second highest positive response for a single statement, with 92% of employees ‘confident about their ability to do their job’.
• The Competence theme is a key driver of Engagement, which means that it directly affects how engaged civil servants feel at work.
• A recent OECD report linked the themes of competence, leadership, emotional attachment and employee engagement. It noted that skills such as sensitivity, integrity, loyalty, empathy and other personal competencies, are increasingly important in modern workplaces.9
• Internationally, OECD countries are increasingly asking about the right roles, leadership skills and competencies to enhance employee engagement in the public sector, and what this means for recruiting the right talents into the future.
• Exploring ways to nurture and maintain this result into the future will be an important factor in maintaining strong engagement levels in the Civil Service.
I am confident about my ability to do my job
I am self-assured about my capabilities to perform my work activities
I have mastered the skills necessary for my job
I feel competent and fully able to handle my job
92%5%3%
89%7%4%
83%12%6%
88%8%5%
‘I have the skills I need to do my job effectively – 90% Positive response
Welsh Government Civil Service People Survey 20146
Civil Service Overall %
This measures civil servants' belief in their ability and skills to carry out the work required in their role.
Agree Neutral Disagree
A key driver of Employee Engagement
5th
80%
My
Job
29Civil Service Employee Engagement Survey 2015Civil Service Employee Engagement Survey 201528

50%40%30%20%10%00% 60% 70% 80% 90% 100%
47%28%24%
• At 51%, the Job Demands result indicates mixed views about how demanding civil servants find their work.
• 52% of civil servants feel like they have too much work to do for one person. This may be as a result of increased work demands and staff reductions in recent years. The scope and scale of national political priorities during the economic recovery may also be a factor here.
• Increasing job demands is not unique to the Civil Service in Ireland. Organisations are simplifying work in response to employees becoming overwhelmed by increasing organisational complexity, growing information overload, and a stressful 24/7 work environment, with many organisations looking for solutions to this challenge.3
• For the Civil Service, it will be important to look at Job Demands, Competence, Autonomy, Innovative Climate and Manager Career Support going forward. Combined, these results suggest the working culture and processes in the Civil Service can be simplified and improved.
Job Demands How demanding do civil servants find their work?
51%
Civil Service Overall %
This measures how demanding civil servants find their work in terms of the content of their work and the time required to complete their work.
12%36%52%
There is too much work to do everything well
It often seems like I have too much work for one person to do
I never seem to have enough time to get everything done in my job
The amount of work I’m asked to do is fair
The performance standards on my job are too high
34%27%39%
52%24%24%
44%27%29%
48%26%27%
I am given enough time to do what is expected of me in my job
‘I have an acceptable workload’ – 65% responded positively
Scottish Government Civil Service People Survey 20147
Agree Neutral Disagree
My
Job
31Civil Service Employee Engagement Survey 2015Civil Service Employee Engagement Survey 201530

50%40%30%20%10%00% 60% 70% 80% 90% 100%
Job Skills Match Do civil servants find their skills being utilised at work?
58%
Civil Service Overall %
This measures how well civil servants feel their skills and abilities are matched to their job.
I feel that my work utilises my full abilities
I feel that my job and I are well matched
My job gives me a chance to do the things I feel I do best
I feel I have had adequate preparation for the job I now hold
42%18%40%
59%24%17%
46%26%27%
60%18%21%
• The Job Skill Match score is 58%.• This is particularly significant because this theme is the second highest driver of Employee
Engagement.• With 40% of civil servants feeling that their work does not ‘utilise their full abilities’, there is
a clear opportunity for civil servants to be empowered.• Given that 52% of employees feel like they have too much work to do (Job Demands), it may
be the case that either the current volume of work, or burden of tasks that are heavily process driven, manual or time-consuming are preventing staff skills from being utilised in full.
• Recent international research proposes that this is a common issue for organisations.3, 12 • This suggests that process and technology improvements focussing on simplification will
continue to be important in the years ahead, as well as greater mobility opportunities, so that staff have more flexibility to move to roles that match their skills.
‘My job gives me opportunities to utilise my skills’ – 71% responded positively
Australian Public Service – State of the Service Report, 20145
Agree Neutral Disagree
A key driver of Employee Engagement
2nd
My
Job
33Civil Service Employee Engagement Survey 2015Civil Service Employee Engagement Survey 201532
50%40%30%20%10%00% 60% 70% 80% 90% 100%
37%21%42%
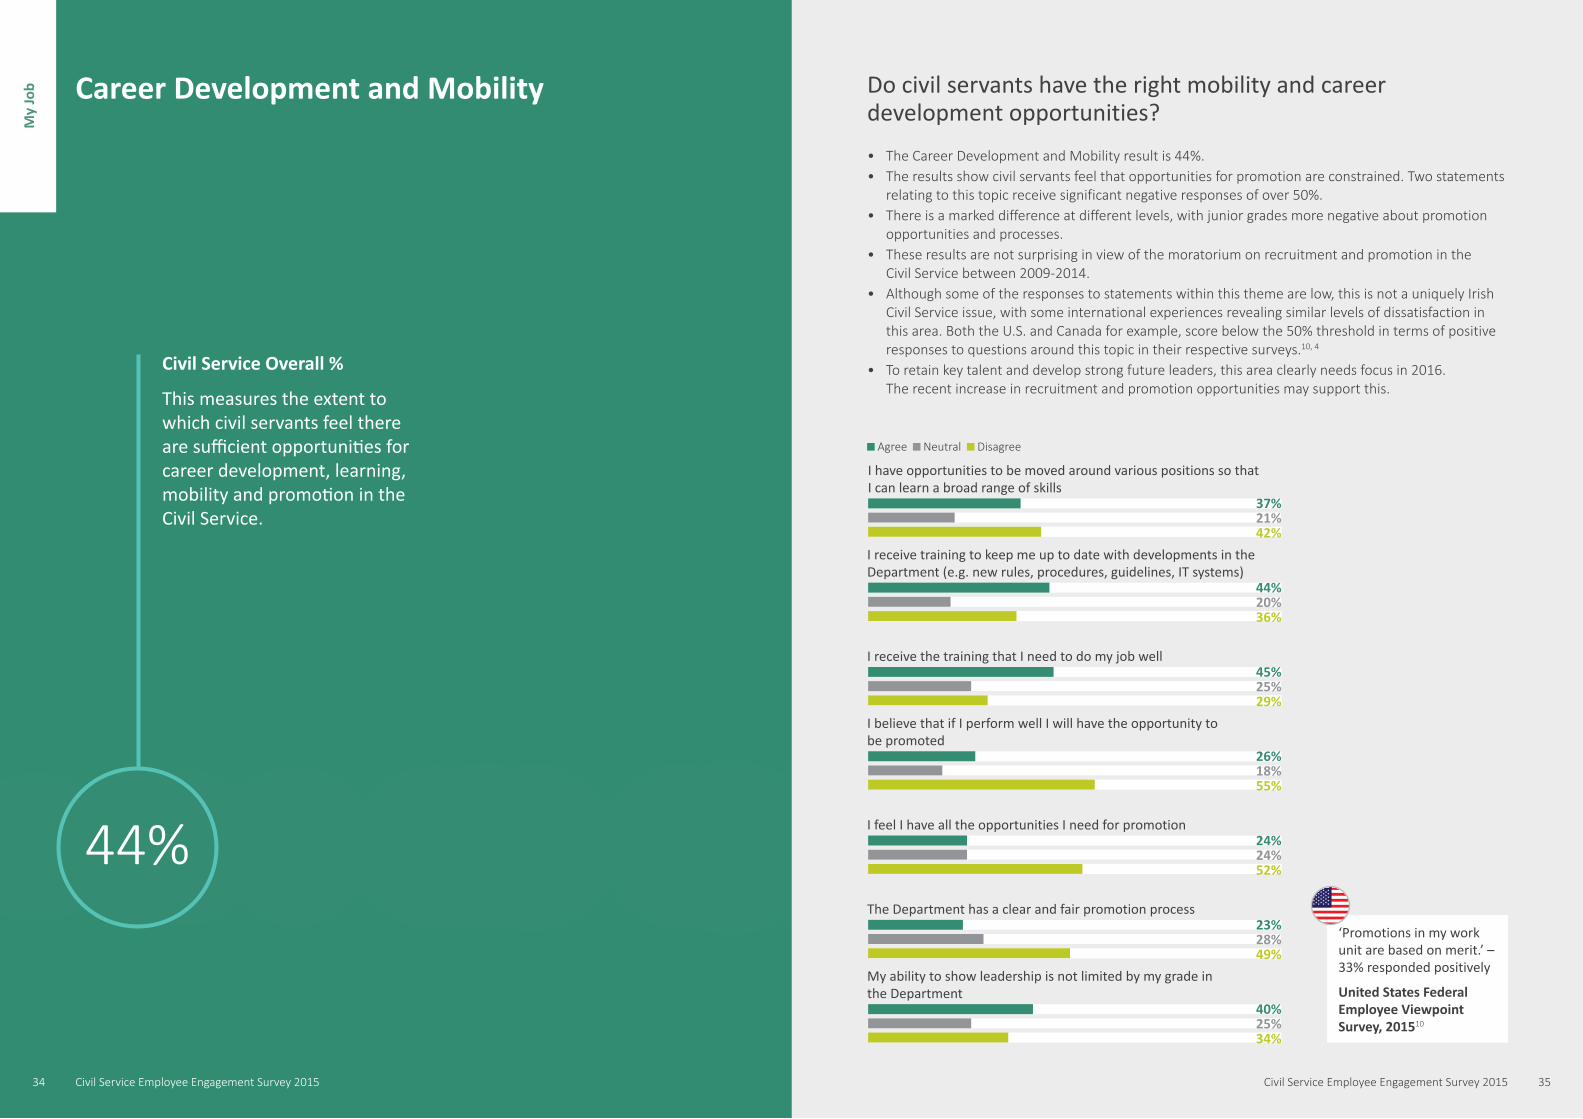
• The Career Development and Mobility result is 44%. • The results show civil servants feel that opportunities for promotion are constrained. Two statements
relating to this topic receive significant negative responses of over 50%.• There is a marked difference at different levels, with junior grades more negative about promotion
opportunities and processes.• These results are not surprising in view of the moratorium on recruitment and promotion in the
Civil Service between 2009-2014.• Although some of the responses to statements within this theme are low, this is not a uniquely Irish
Civil Service issue, with some international experiences revealing similar levels of dissatisfaction in this area. Both the U.S. and Canada for example, score below the 50% threshold in terms of positive responses to questions around this topic in their respective surveys.10, 4
• To retain key talent and develop strong future leaders, this area clearly needs focus in 2016. The recent increase in recruitment and promotion opportunities may support this.
I have opportunities to be moved around various positions so that I can learn a broad range of skills
44%20%36%
45%25%29%
Career Development and Mobility Do civil servants have the right mobility and career development opportunities?
44%
Civil Service Overall %
This measures the extent to which civil servants feel there are sufficient opportunities for career development, learning, mobility and promotion in the Civil Service.
40%25%34%
I receive the training that I need to do my job well
I receive training to keep me up to date with developments in the Department (e.g. new rules, procedures, guidelines, IT systems)
I believe that if I perform well I will have the opportunity to be promoted
My ability to show leadership is not limited by my grade in the Department
26%18%55%
24%24%52%
23%28%49%
The Department has a clear and fair promotion process
‘Promotions in my work unit are based on merit.’ – 33% responded positively
United States Federal Employee Viewpoint Survey, 201510
Agree Neutral Disagree
I feel I have all the opportunities I need for promotion
My
Job
35Civil Service Employee Engagement Survey 2015Civil Service Employee Engagement Survey 201534

50%40%30%20%10%00% 60% 70% 80% 90% 100%
Your Pay Do civil servants feel fairly rewarded for their work?
• At 42%, the Pay result is the third lowest result in the survey. This result reflects recent changes to ‘Terms and Conditions’ in response to the economic crisis which led to significant reductions in core pay.
• Less than half of civil servants feel fairly rewarded for their work – only one in four consider their pay ‘reasonable’, compared to people doing a similar job in the private sector.
• A minority of staff in the Civil Service feel that their pay adequately reflects their performance. Internationally, the UK Civil Service has also seen similar results.1
• Looking at the Pay and Competency themes together, it may be that staff feel that they are not adequately compensated relative to their perceived competence – which at 80% most staff deem to be high.
• These results are significant, however some caution is required around how they are interpreted. For example, recent research, suggests it is not always possible for employees to assess their own compensation objectively.13
• As the Government implements the phased restoration of remuneration to civil servants from 1st January 2016, future responses to this theme may improve.
• It is notable that Employee Engagement is high in the context of this result and that pay is not a key driver of employees’ sense of engagement with the organisation.
I feel that my pay adequately reflects my performance
I am satisfied with the terms and conditions of my employment
Compared to people doing a similar job to me, I feel that my pay is reasonable
Compared to people doing a similar job in the private sector, I feel that my pay is reasonable
27%20%52%
42%25%33%
32%23%46%
25%22%53%
‘I feel that my pay adequately reflects my performance’ – 36% Positive response
Scottish Government Civil Service People Survey 20147
‘Considering everything, how satisfied are you with your pay?’ – 69% responded positively.
United States Federal Employee Viewpoint Survey, 201510
42%
Civil Service Overall %
This measures how civil servants feel about their pay in relation to their efforts and contributions at work and others who are like them.
‘Satisfaction with your remuneration in relation to the challenges and demands of your work’ Scored 2.92 out of 5, where 1 = Very Dissatisfied and 5 = Very satisfied.
Job satisfaction of the personnel of the State in Finland survey 201414 Agree Neutral Disagree
My
Job
37Civil Service Employee Engagement Survey 2015Civil Service Employee Engagement Survey 201536
50%40%30%20%10%00% 60% 70% 80% 90% 100%
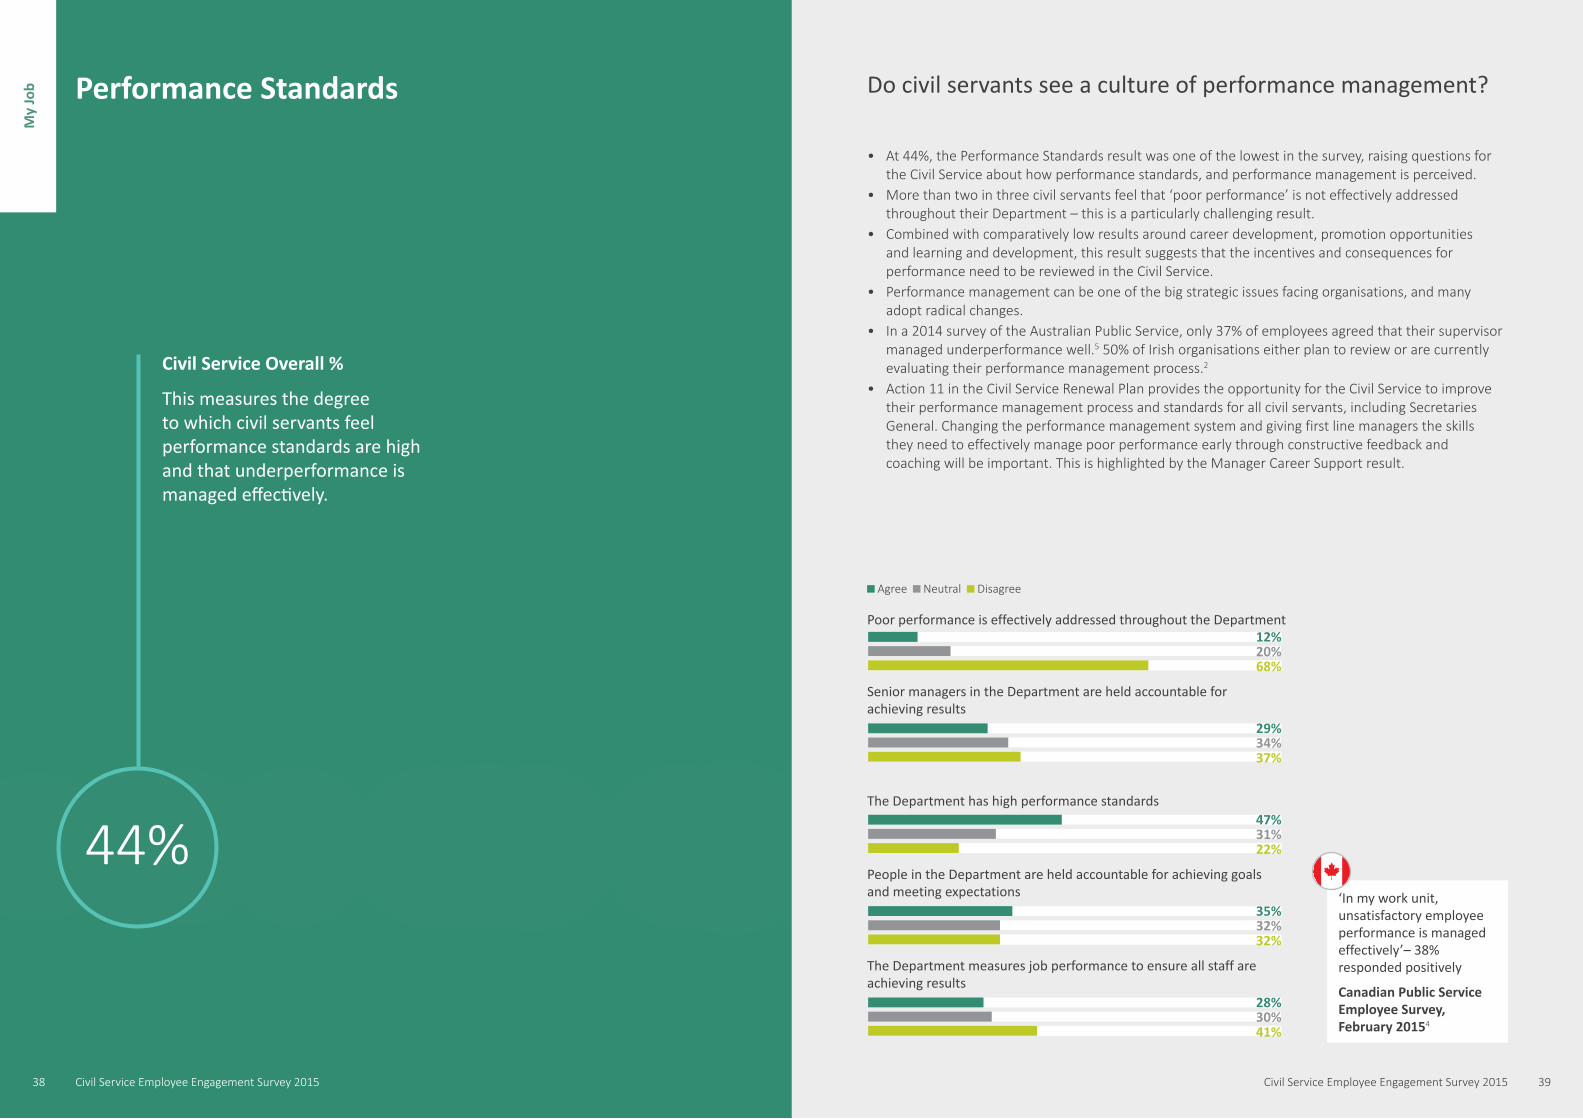
• At 44%, the Performance Standards result was one of the lowest in the survey, raising questions for the Civil Service about how performance standards, and performance management is perceived.
• More than two in three civil servants feel that ‘poor performance’ is not effectively addressed throughout their Department – this is a particularly challenging result.
• Combined with comparatively low results around career development, promotion opportunities and learning and development, this result suggests that the incentives and consequences for performance need to be reviewed in the Civil Service.
• Performance management can be one of the big strategic issues facing organisations, and many adopt radical changes.
• In a 2014 survey of the Australian Public Service, only 37% of employees agreed that their supervisor managed underperformance well.5 50% of Irish organisations either plan to review or are currently evaluating their performance management process.2
• Action 11 in the Civil Service Renewal Plan provides the opportunity for the Civil Service to improve their performance management process and standards for all civil servants, including Secretaries General. Changing the performance management system and giving first line managers the skills they need to effectively manage poor performance early through constructive feedback and coaching will be important. This is highlighted by the Manager Career Support result.
Performance Standards Do civil servants see a culture of performance management?
44%
Civil Service Overall %
This measures the degree to which civil servants feel performance standards are high and that underperformance is managed effectively.
28%30%41%
Poor performance is effectively addressed throughout the Department
Senior managers in the Department are held accountable for achieving results
The Department has high performance standards
The Department measures job performance to ensure all staff are achieving results
12%20%68%
29%34%37%
47%31%22%
35%32%32%
People in the Department are held accountable for achieving goals and meeting expectations ‘In my work unit,
unsatisfactory employee performance is managed effectively’– 38% responded positively
Canadian Public Service Employee Survey, February 20154
Agree Neutral Disagree
My
Job
39Civil Service Employee Engagement Survey 2015Civil Service Employee Engagement Survey 201538

50%40%30%20%10%00% 60% 70% 80% 90% 100%
Manager Career Support How well supported do civil servants feel by their manager?
56%
Civil Service Overall %
This measures the level of support and development civil servants feel is provided from their immediate manager.
My immediate manager takes an interest in my career development
My immediate manager makes sure I get credit for my achievements
My immediate manager gives me helpful feedback to improve my performance
My immediate manager provides assignments that give me the opportunity to develop new skills
49%22%29%
56%21%23%
52%22%26%
42%27%31%
• The Manager Career Support result of 56% shows mixed responses to the level of support staff receive from their immediate line managers. This result is behind other international administrations, for example, Wales (73%), Scotland (71%), and the UK overall (68%).6, 7, 1
• Looking at civil servants’ perceived levels of support, it is interesting to note that the support of their peers is highest (Social Support – 70%), then their immediate manager (Manager Career Support – 56%), followed by organisational support (Organisational Support – 44%). This shows first line managers provide a key link between staff and leaders, and therefore improvements to this central relationship might have the most impact.
• Organisational research has Identified three key areas that managers can focus on to improve the support they provide to their teams:15
– Setting clear and simple goals – Coaching staff and creating a coaching culture – Invest heavily in developing staff, particularly leadership attributes
• The results of this theme show the importance of skillful managers that can build strong, positive relationships with their employees.
‘My manager recognises when I have done my job well’ – 83% responded positively
Scottish Government Civil Service People Survey 20147
Agree Neutral Disagree
My
Supp
orts
41Civil Service Employee Engagement Survey 2015Civil Service Employee Engagement Survey 201540
50%40%30%20%10%00% 60% 70% 80% 90% 100%
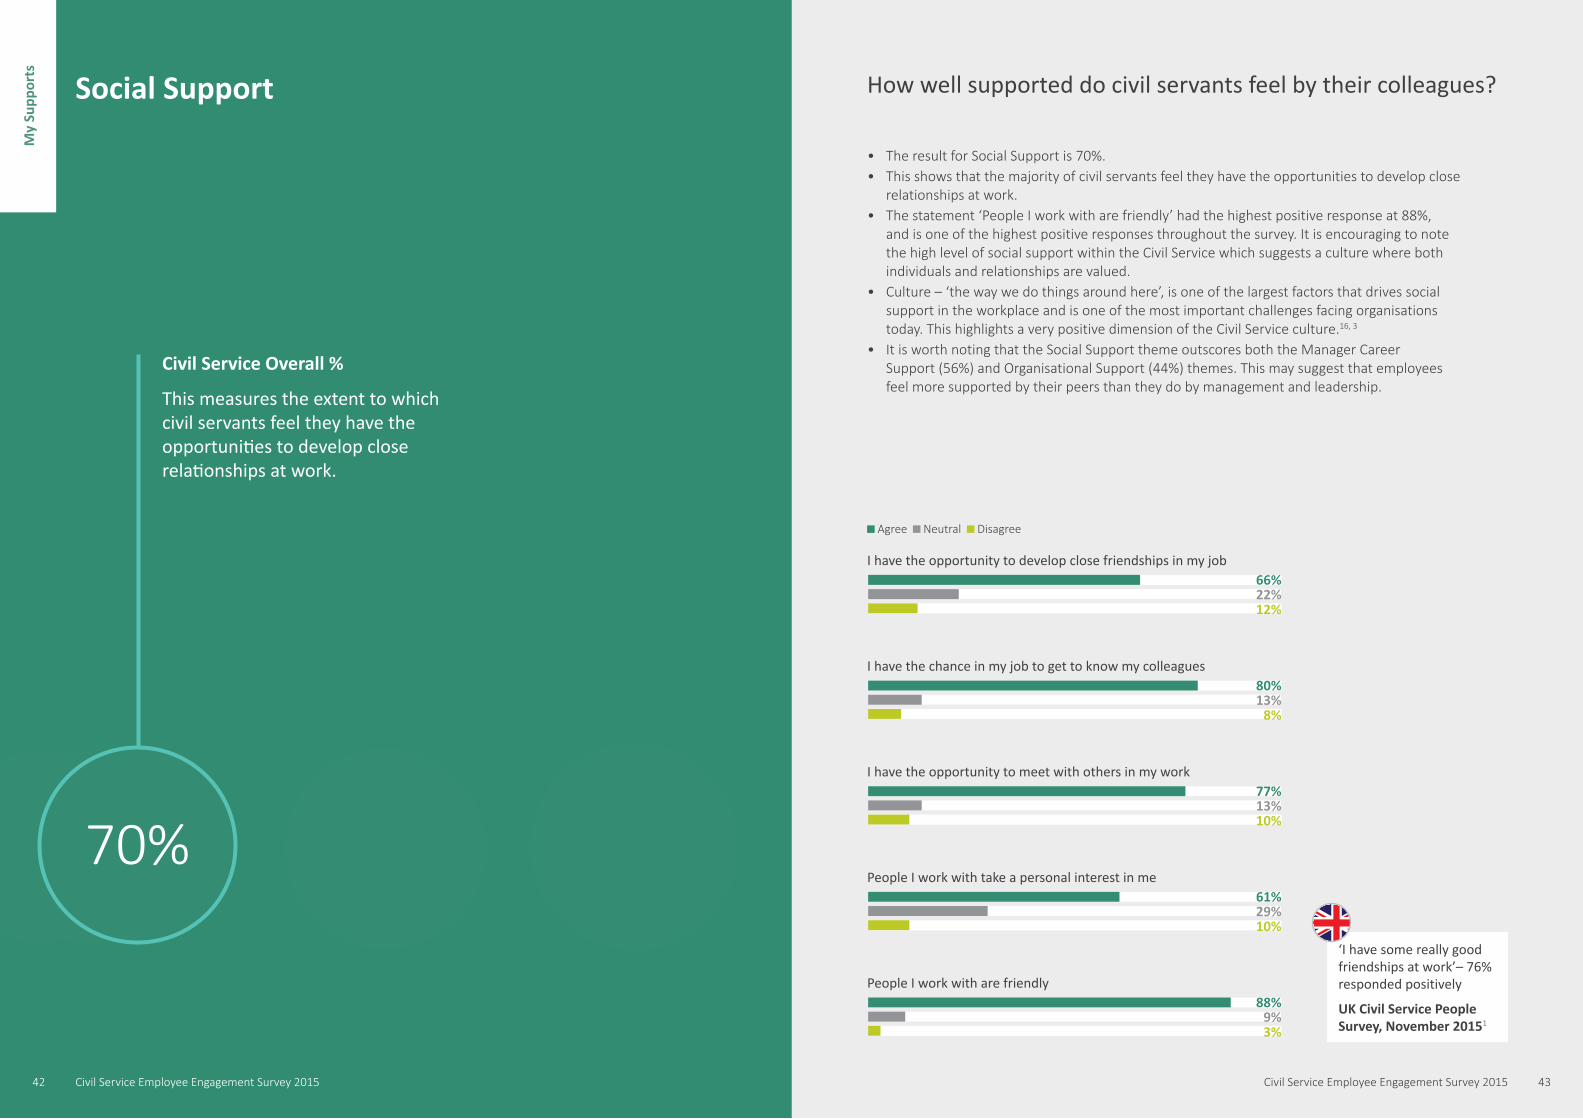
Social Support How well supported do civil servants feel by their colleagues?
Civil Service Overall %
This measures the extent to which civil servants feel they have the opportunities to develop close relationships at work.
70%
• The result for Social Support is 70%.• This shows that the majority of civil servants feel they have the opportunities to develop close
relationships at work.• The statement ‘People I work with are friendly’ had the highest positive response at 88%,
and is one of the highest positive responses throughout the survey. It is encouraging to note the high level of social support within the Civil Service which suggests a culture where both individuals and relationships are valued.
• Culture – ‘the way we do things around here’, is one of the largest factors that drives social support in the workplace and is one of the most important challenges facing organisations today. This highlights a very positive dimension of the Civil Service culture.16, 3
• It is worth noting that the Social Support theme outscores both the Manager Career Support (56%) and Organisational Support (44%) themes. This may suggest that employees feel more supported by their peers than they do by management and leadership.
88%9%3%
I have the opportunity to develop close friendships in my job
I have the chance in my job to get to know my colleagues
I have the opportunity to meet with others in my work
People I work with are friendly
66%22%12%
80%13%8%
77%13%10%
61%29%10%
People I work with take a personal interest in me
‘I have some really good friendships at work’– 76% responded positively
UK Civil Service People Survey, November 20151
Agree Neutral Disagree
My
Supp
orts
43Civil Service Employee Engagement Survey 2015Civil Service Employee Engagement Survey 201542
50%40%30%20%10%00% 60% 70% 80% 90% 100%
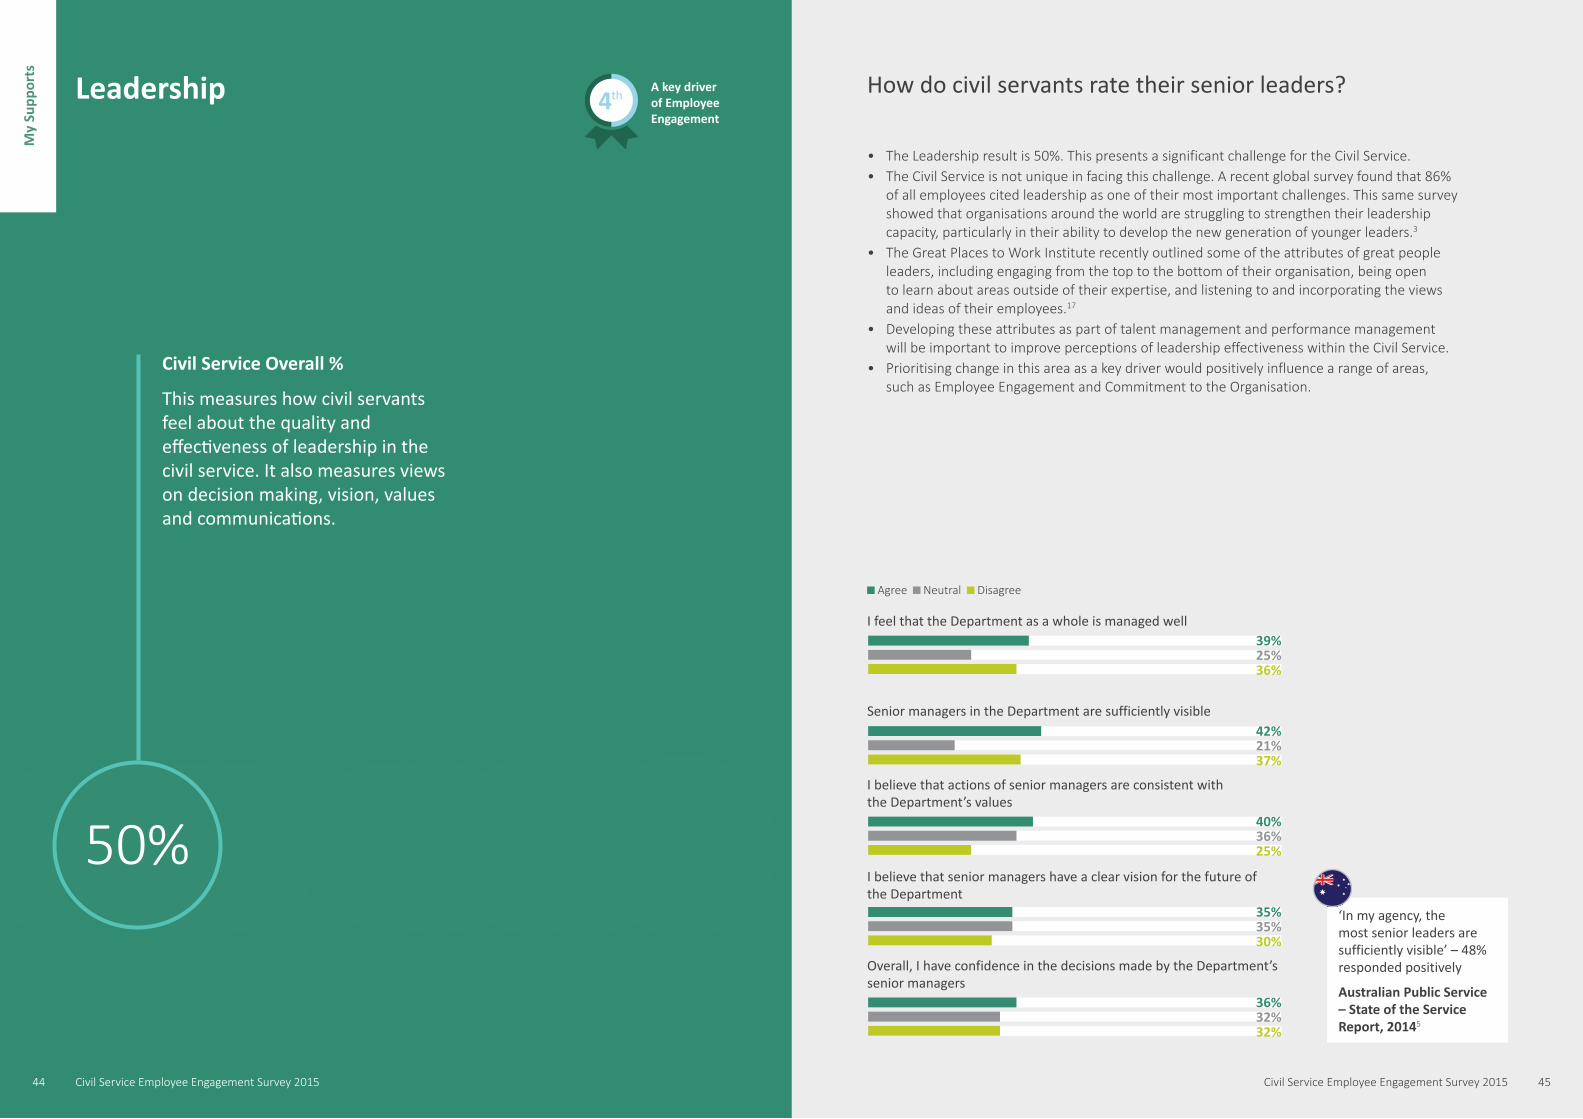
• The Leadership result is 50%. This presents a significant challenge for the Civil Service.• The Civil Service is not unique in facing this challenge. A recent global survey found that 86%
of all employees cited leadership as one of their most important challenges. This same survey showed that organisations around the world are struggling to strengthen their leadership capacity, particularly in their ability to develop the new generation of younger leaders.3
• The Great Places to Work Institute recently outlined some of the attributes of great people leaders, including engaging from the top to the bottom of their organisation, being open to learn about areas outside of their expertise, and listening to and incorporating the views and ideas of their employees.17
• Developing these attributes as part of talent management and performance management will be important to improve perceptions of leadership effectiveness within the Civil Service.
• Prioritising change in this area as a key driver would positively influence a range of areas, such as Employee Engagement and Commitment to the Organisation.
‘In my agency, the most senior leaders are sufficiently visible’ – 48% responded positively
Australian Public Service – State of the Service Report, 20145
Leadership How do civil servants rate their senior leaders?
36%32%32%
I feel that the Department as a whole is managed well
Senior managers in the Department are sufficiently visible
I believe that actions of senior managers are consistent with the Department’s values
Overall, I have confidence in the decisions made by the Department’s senior managers
39%25%36%
42%21%37%
40%36%25%
35%35%30%
I believe that senior managers have a clear vision for the future of the Department
50%
Civil Service Overall %
This measures how civil servants feel about the quality and effectiveness of leadership in the civil service. It also measures views on decision making, vision, values and communications.
Agree Neutral Disagree
A key driver of Employee Engagement
4th
My
Supp
orts
45Civil Service Employee Engagement Survey 2015Civil Service Employee Engagement Survey 201544

50%40%30%20%10%00% 60% 70% 80% 90% 100%
Organisational Support How well supported do civil servants feel by their organisation?
44%
Civil Service Overall %
This measures the degree to which employees feel their organisation values their contribution and cares for their well-being.
The Department cares about my opinions
The Department cares about my well-being
The Department considers my goals and values
The Department provides support for me in times of need
22%30%47%
31%31%39%
22%36%42%
38%36%27%
• At 44%, Organisational Support is one of the lowest scores in the survey.• Three out of four of the statements for this theme recorded a higher proportion of negative
responses than positive responses.• These results need to be viewed seriously, considering that this theme is one of the main
drivers of Employee Engagement and directly affects how engaged civil servants feel at work.• Interestingly, although the CSMB selected Well-being (page 20) as a key outcome, and the
result for this is high at 75%, only 31% of employees feel their own Department ‘cares about their well-being’.
• A recent Gallup report suggests that organisations need to embed support for well-being in their culture, and that managers must play a key role in promoting employee well-being.18
• Increasing levels of Organisational Support must start with leaders and managers focussing on finding a range of new ways to take into account the views of staff regularly and transparently.
‘Considering everything, how satisfied are you with your organisation?’ – 56% responded positively
United States Federal Employee Viewpoint Survey, 201510
Agree Neutral Disagree
A key driver of Employee Engagement
3rd
My
Supp
orts
47Civil Service Employee Engagement Survey 2015Civil Service Employee Engagement Survey 201546

50%40%30%20%10%00% 60% 70% 80% 90% 100%
• The learning and development result is 52%. • Just over one third of civil servants could neither agree nor disagree that learning and
development activities they had completed in the last 12 months had helped to improve their performance.
• It is interesting to consider this in the context of the Competence theme (page 28), where there was a strong belief in employees’ ability to perform their work activities skillfully. This may suggest that employees feel that they do not need additional training being offered to them, or they are being offered the wrong type of development opportunities.
• Less than half of civil servants feel like their work utilises their full abilities (Job Skills Match page 32). Employees may feel that new skills would not be utilised if they did wish to pursue further training and development.
• Looking at international experiences, such as Scotland, Wales and the UK Civil Service as a whole, Ireland is behind when it comes to civil servants perceptions about learning and development in their organisation.7, 6, 1
• In a 2015 survey on global trends, ‘learning and development’ was identified as a key challenge facing organisations. As the economy improves and the market for highly skilled talent grows, organisations are realising they cannot simply recruit all the talent they need but must also develop it internally.3
• This supports the work ongoing to improve learning and development in the Civil Service through Action 9 in the Civil Service Renewal Plan, especially around leadership development.
Learning and Development Do civil servants have the right learning and development opportunities?
52%
Civil Service Overall %
This measures the extent to which civil servants feel they have sufficient and effective opportunities for learning and development.
I am able to access the right learning and development opportunities when I need to
Learning and development activities I have completed in the last 12 months have helped improve my performance
There are opportunities for me to develop my career in the Department
Learning and development activities I have completed while working for the Department are helping me to develop my career
50%24%26%
42%36%23%
39%22%39%
40%31%29%
‘I am able to access the right learning and development opportunities when I need to’– 69% responded positively
Welsh Government Civil Service People Survey 20146
Agree Neutral Disagree
My
Supp
orts
49Civil Service Employee Engagement Survey 2015Civil Service Employee Engagement Survey 201548

50%40%30%20%10%00% 60% 70% 80% 90% 100%
• At only 45%, Innovative Climate is among the lowest scoring themes. When combined with the results for Involvement Climate, this shows that staff perceive a serious absence of collaboration and innovation in the current Civil Service culture. This is interesting given the scale and scope of change civil servants have successfully implemented in recent years.
• There could be several factors influencing this result. It may be that workload commitments do not allow civil servants to be innovative. As it is, 44% of civil servants feel as if they don’t have enough time to get everything done (Job Demands page 30).
• 45% of civil servants also think that management are not quick to respond when changes need to be made and 41% of staff feel that their Department is not flexible – this suggests adopting more agile working processes might help drive this score up.
• This is also a major area of focus internationally, for example, Australia have approved a number of initiatives such as assigning Innovation Champions within departments.19
Innovative Climate Do civil servants see the culture as innovative?
45%
Civil Service Overall %
This measures the extent to which civil servants feel the organisation supports and encourages them to be innovative.
30%37%33%
New ideas are readily accepted here
The Department is quick to respond when changes need to be made
Management here are quick to spot the need to do things differently
People in the Department are always searching for new ways of looking at problems
32%32%36%
31%29%40%
25%30%45%
29%30%41%
The Department is very flexible: it can quickly change procedures to meet new conditions and solve problems as they arise
When asked if their immediate supervisor encourages innovation, 63% of those surveyed responded positively
Australian Public Service, State of the Service Report, 201519
‘I am encouraged to be innovative or to take initiative in my work.’ 63% gave a positive response
Canadian Public Service Employee Survey, February 20154
Agree Neutral Disagree
My
Envi
ronm
ent
51Civil Service Employee Engagement Survey 2015Civil Service Employee Engagement Survey 201550

50%40%30%20%10%00% 60% 70% 80% 90% 100%
Involvement Climate Do civil servants see the culture as collaborative?
36%
Civil Service Overall %
This measures the extent to which civil servants feel that they are involved openly in decision making in their organisation.
My
Envi
ronm
ent
60%22%18%
Changes are made without talking to the people involved in them
People don’t have any say in decisions which affect their work
People feel decisions are frequently made over their heads
There are often breakdowns in communication here
64%20%16%
58%23%19%
71%18%11%
29%26%46%
Information is widely shared
• At 36%, this result shows that only a minority of civil servants feel they are openly involved in decision making in their department or office.
• 71% of staff feel that decisions are made ‘over their heads’. 60% feel that there are communication breakdowns and 64% felt that changes are made without involving them.
• Results from this theme suggest that it may be the hierarchical culture that is affecting staff engagement. This view is reinforced by the low score for the Innovative Climate theme (45%), where there is a perception of limited support and encouragement for employees to take initiative.
• There is an interesting gender dimension to this result, with women feeling that they have less of a say in decisions which affect their work more so than men. This may reflect the fact that women are more prevalent in the junior grades.
• International research shows that employees like to be involved in decision making, and communications within their organisation. For example, a recent survey asked employees what they valued in their workplace and interestingly, ‘feeling in on things’ ranked second out of ten potential options.20
• While not a main driver for Employee Engagement, the Involvement Climate theme is important, as it relates to communication which is crucial for the success of any organisation, especially those going through a process of renewal.
‘I feel involved in the decisions that affect my work’ – 56% responded positively
UK Civil Service People Survey, November 20151
Agree Neutral Disagree
53Civil Service Employee Engagement Survey 2015Civil Service Employee Engagement Survey 201552

50%40%30%20%10%00% 60% 70% 80% 90% 100%
• At 68%, the majority of civil servants feel their work has a positive impact on the public.• It is interesting to note the difference between this theme and the Public Perception of the
Civil Service theme. While the majority of civil servants feel that their work impacts, benefits, and makes a difference in citizens’ lives. They also feel that the public don’t value, respect or appreciate the work that they do.
• In contrast, a recent Irish Civil Service Customer Satisfaction Survey has shown that general perceptions of the Civil Service are quite positive, for example:
– 66% of Civil Service customers feel that the Civil Service is efficient – 53% of Civil Service customers feel that the Civil Service is independent and trustworthy – 57% of Civil Service customers feel that the Civil Service deals with people in a fair and equal way
• This suggests that civil servants are not fully aware of how positively the public view the role the Civil Service plays in Irish life. This presents a good opportunity for Civil Service leaders to continue to highlight to staff the real impact of what they do.
Citizen Impact Do civil servants feel they make an impact through their work?
I feel that my work makes a positive difference in citizens’ lives
I am very aware of the ways in which my work is benefiting citizens
I am very conscious of the positive impact that my work has on citizens
65%23%12%
68%21%11%
64%24%12%
68%
Civil Service Overall %
This measures the extent to which civil servants feel their work has an impact on the public.
‘I feel that the service provided by the Civil Service has improved in the last 5 years.’ – 50% responded positively
‘The Civil Service serves all segments of society in Ireland equally’ – 52% of Civil Service customers responded positively
Irish Civil Service Customer Satisfaction Survey, 2015
Agree Neutral Disagree
‘The work I do is important.’ – 90% responded positively
United States Federal Employee Viewpoint Survey, 201510
My
View
s on
the
Ci
vil S
ervi
ce
55Civil Service Employee Engagement Survey 2015Civil Service Employee Engagement Survey 201554
50%40%30%20%10%00% 60% 70% 80% 90% 100%
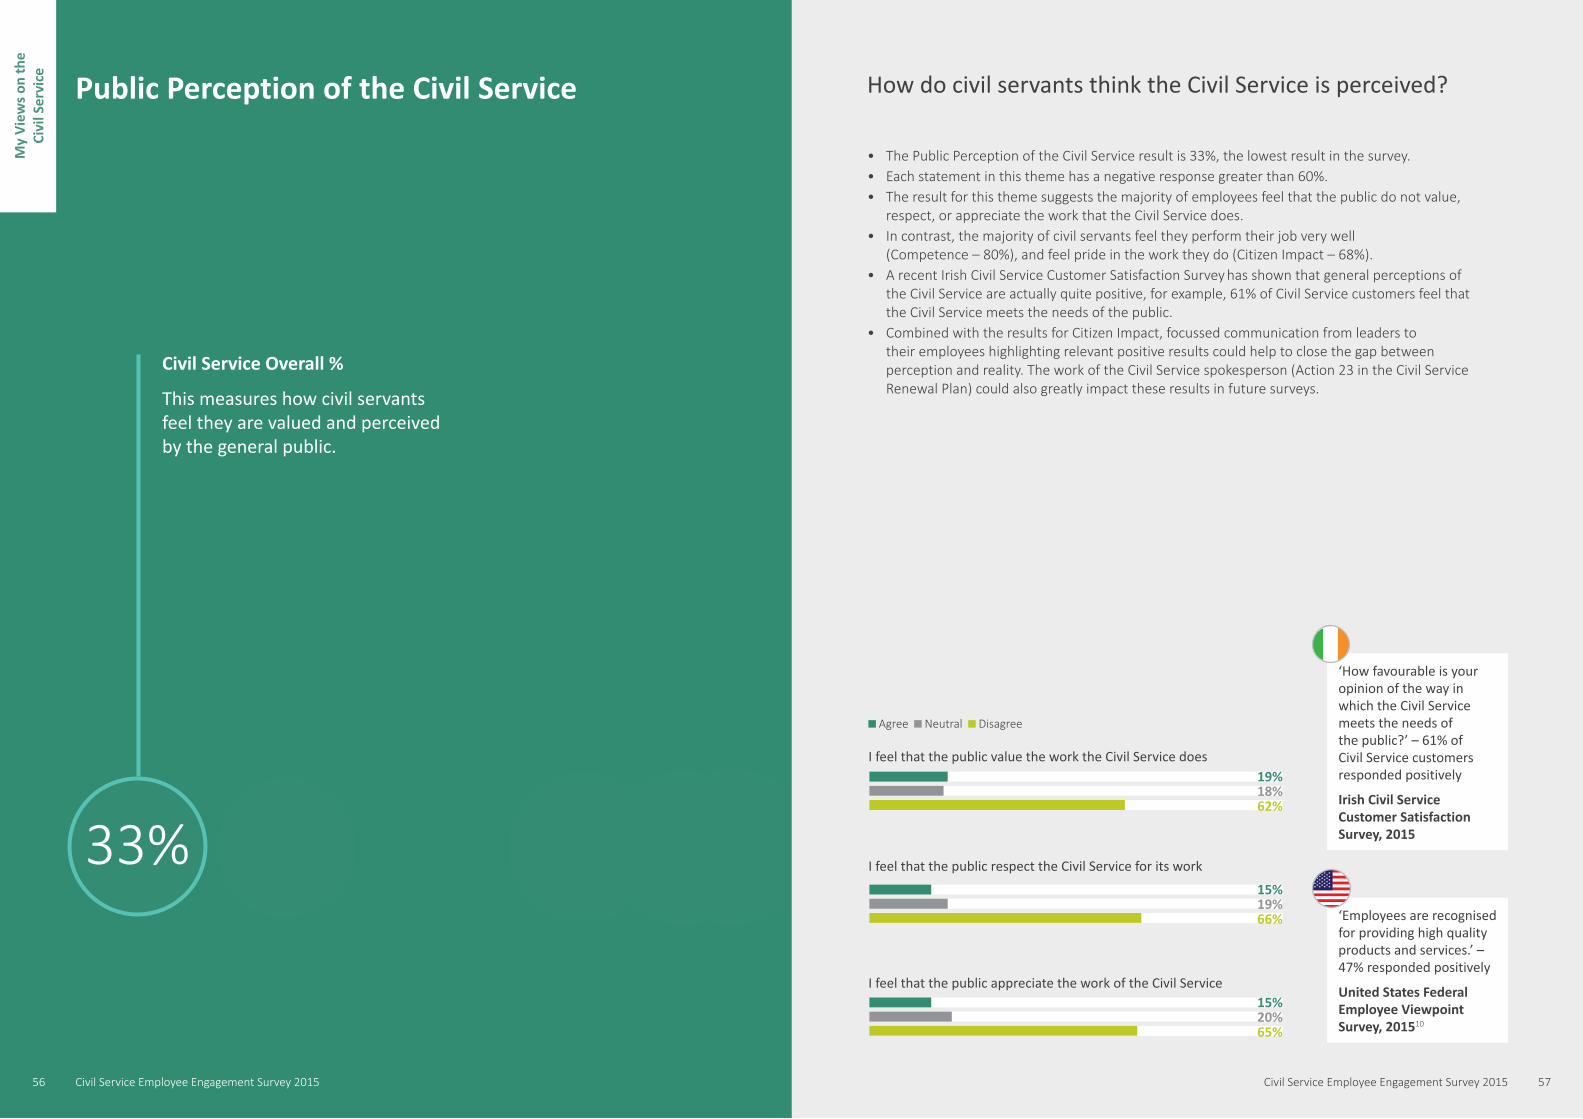
Public Perception of the Civil Service How do civil servants think the Civil Service is perceived?
33%
Civil Service Overall %
This measures how civil servants feel they are valued and perceived by the general public.
I feel that the public value the work the Civil Service does
I feel that the public respect the Civil Service for its work
I feel that the public appreciate the work of the Civil Service
19%18%62%
15%19%66%
15%20%65%
• The Public Perception of the Civil Service result is 33%, the lowest result in the survey. • Each statement in this theme has a negative response greater than 60%.• The result for this theme suggests the majority of employees feel that the public do not value,
respect, or appreciate the work that the Civil Service does. • In contrast, the majority of civil servants feel they perform their job very well
(Competence – 80%), and feel pride in the work they do (Citizen Impact – 68%).• A recent Irish Civil Service Customer Satisfaction Survey has shown that general perceptions of
the Civil Service are actually quite positive, for example, 61% of Civil Service customers feel that the Civil Service meets the needs of the public.
• Combined with the results for Citizen Impact, focussed communication from leaders to their employees highlighting relevant positive results could help to close the gap between perception and reality. The work of the Civil Service spokesperson (Action 23 in the Civil Service Renewal Plan) could also greatly impact these results in future surveys.
‘Employees are recognised for providing high quality products and services.’ – 47% responded positively
United States Federal Employee Viewpoint Survey, 201510
Agree Neutral Disagree
‘How favourable is your opinion of the way in which the Civil Service meets the needs of the public?’ – 61% of Civil Service customers responded positively
Irish Civil Service Customer Satisfaction Survey, 2015
My
View
s on
the
Ci
vil S
ervi
ce
57Civil Service Employee Engagement Survey 2015Civil Service Employee Engagement Survey 201556

50%40%30%20%10%00% 60% 70% 80% 90% 100%
42%40%18%
72%23%5%
67%21%12%
53%29%18%
47%28%25%
57%24%19%
• The Identification with the Civil Service result is 62%. This is a very positive result and highlights a strong foundation for building a 'unified' Civil Service.
• Civil servants mostly agreed with the statements in this theme, showing that they identify with and feel strongly about the values and ethos of the Civil Service.
• Interestingly, staff who have served less than one year or over 30 years identify most positively with the Civil Service.
• Identification can be improved through greater communication across the Civil Service and civil servants feeling that the Civil Service is one organisation as a whole. The collective work of the Civil Service Management Board (Action 2 – Civil Service Renewal Plan) should contribute to this.
Identification with the Civil Service Do civil servants identify with the Civil Service?
62%
Civil Service Overall %
This measures the extent to which civil servants feel a sense of belonging to the Civil Service compared to the Department or Office that employs them.
It is important to me that my work aligns with the values and ethos of the Civil Service
I feel that my values and those of the Civil Service are very similar (e.g. independence, integrity, impartiality, equality, fairness and respect)
When someone praises the Civil Service, it feels like a personal compliment
If a story in the media criticised the Civil Service, I would feel embarrassed
I feel that people in the Department live the values of the Civil Service
When I talk about the Civil Service, I usually say ‘we’ rather than ‘they’
‘When I talk about my organisation I say “we” rather than “they”’ – 70% responded positively
UK Civil Service People Survey, November 20151
‘When I talk about the organisation I say “we” rather than “they”’ – 72% responded positively
Welsh Government Civil Service People Survey 20146
‘When I talk about the Scottish Government I say “we” rather than “they”’– 69% responded positively
Scottish Government Civil Service People Survey 20147
Agree Neutral Disagree
My
View
s on
the
Ci
vil S
ervi
ce
59Civil Service Employee Engagement Survey 2015Civil Service Employee Engagement Survey 201558

50%40%30%20%10%00% 60% 70% 80% 90% 100%
Commitment to Civil Service Renewal Do civil servants feel committed to Civil Service Renewal?
58%
Civil Service Overall %
This measures the degree to which civil servants support Civil Service Renewal.
I believe in the value of the Civil Service Renewal Plan
The Civil Service Renewal Plan is a good strategy for the Department
I recognise that the Civil Service Renewal Plan serves an important purpose
The Civil Service Renewal Plan is necessary
36%50%14%
32%57%12%
44%46%10%
49%43%8%
• Commitment to Civil Service Renewal is 58%.• Interestingly this theme has a high proportion of neutral responses to the statements, indicating
that employees may be 'holding' until they see tangible and real change as a result of the Civil Service Renewal Plan. Although it is also interesting to see small proportions of negative views compared to other survey themes.
• Given employees feel that information is not widely shared and there are often breakdowns in communication (Involvement Climate) there is an opportunity here to positively influence support for the Civil Service Renewal Plan, through increased communication on the tangible links between the plan and employees.
• Poor communication may also explain the difference between employees’ perceived ability to cope with change (Coping with Change – 69%) and their views on the value of the Civil Service Renewal Plan (36%).
• Revisiting and revising the existing communication strategy for the Civil Service Renewal Plan could be valuable to increase the result for this theme in the future.
Agree Neutral Disagree
My
View
s on
the
Ci
vil S
ervi
ce
Civil Service Employee Engagement Survey 201560 61Civil Service Employee Engagement Survey 2015
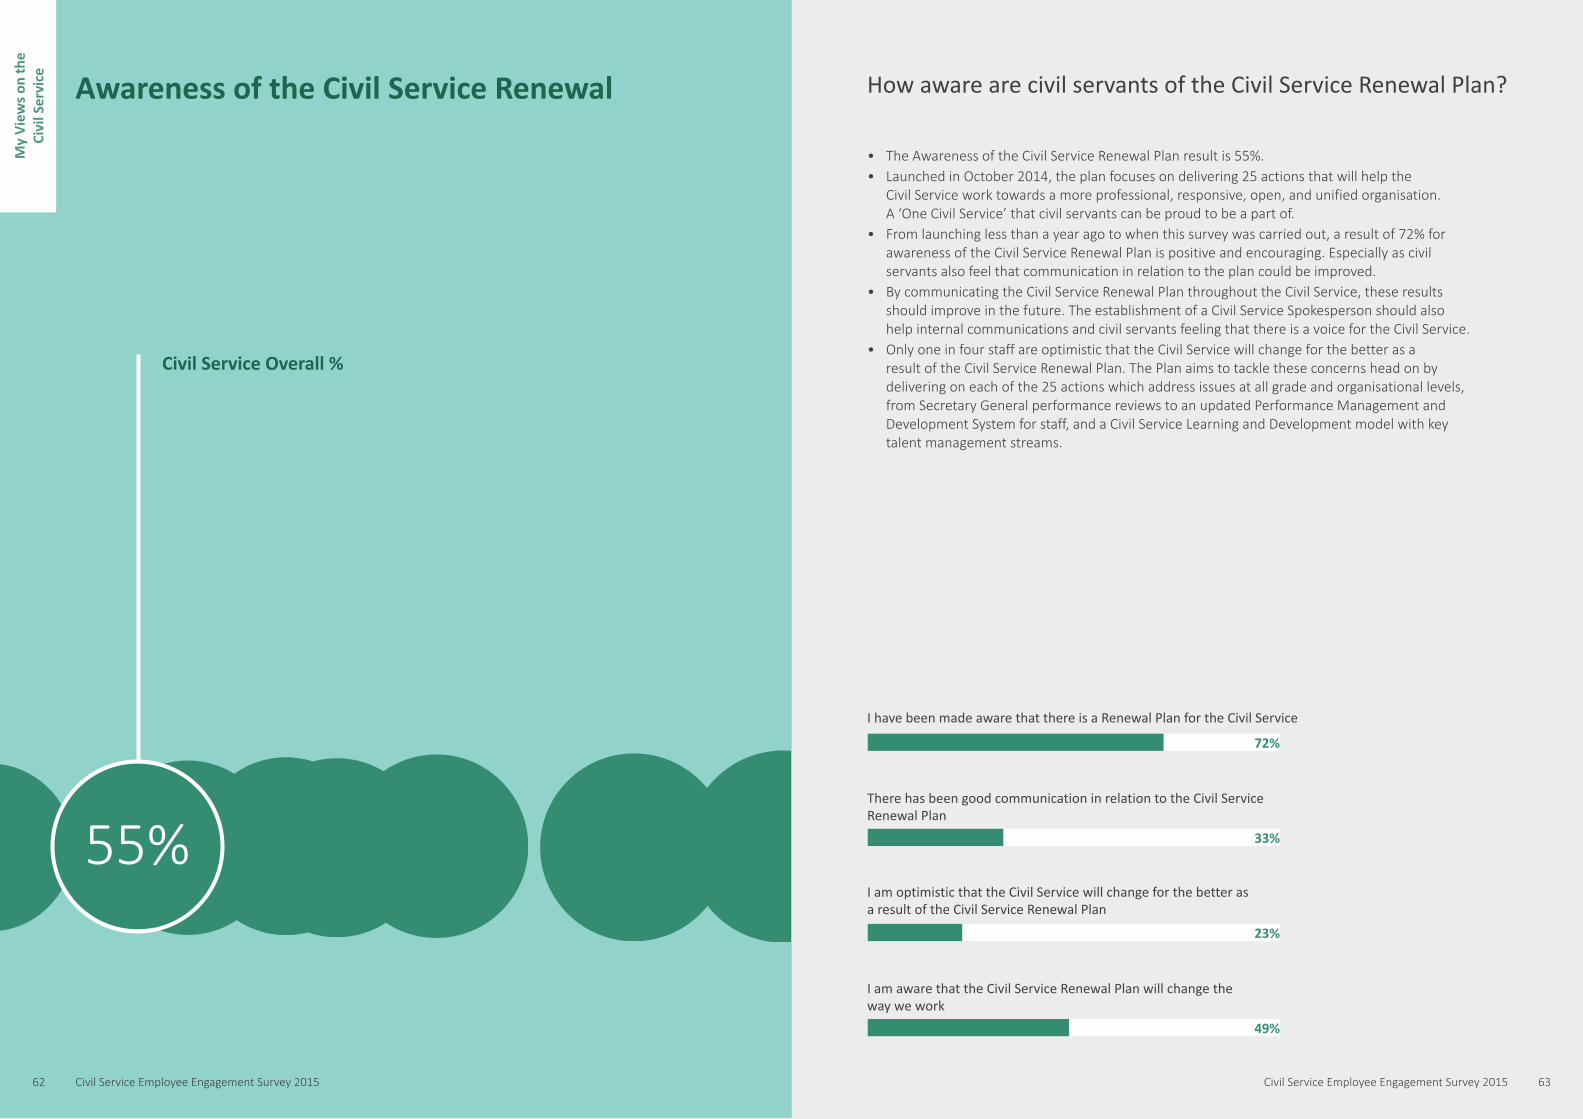
• The Awareness of the Civil Service Renewal Plan result is 55%.• Launched in October 2014, the plan focuses on delivering 25 actions that will help the
Civil Service work towards a more professional, responsive, open, and unified organisation. A ‘One Civil Service’ that civil servants can be proud to be a part of.
• From launching less than a year ago to when this survey was carried out, a result of 72% for awareness of the Civil Service Renewal Plan is positive and encouraging. Especially as civil servants also feel that communication in relation to the plan could be improved.
• By communicating the Civil Service Renewal Plan throughout the Civil Service, these results should improve in the future. The establishment of a Civil Service Spokesperson should also help internal communications and civil servants feeling that there is a voice for the Civil Service.
• Only one in four staff are optimistic that the Civil Service will change for the better as a result of the Civil Service Renewal Plan. The Plan aims to tackle these concerns head on by delivering on each of the 25 actions which address issues at all grade and organisational levels, from Secretary General performance reviews to an updated Performance Management and Development System for staff, and a Civil Service Learning and Development model with key talent management streams.
Awareness of the Civil Service Renewal How aware are civil servants of the Civil Service Renewal Plan?
50%40%30%20%10%00% 60% 70% 80% 90% 100%
55%
Civil Service Overall %
I have been made aware that there is a Renewal Plan for the Civil Service
There has been good communication in relation to the Civil Service Renewal Plan
I am optimistic that the Civil Service will change for the better as a result of the Civil Service Renewal Plan
I am aware that the Civil Service Renewal Plan will change the way we work
72%
33%
23%
49%
My
View
s on
the
Ci
vil S
ervi
ce
Civil Service Employee Engagement Survey 201562 63Civil Service Employee Engagement Survey 2015

What is the Civil Service?
This report focuses exclusively on the overall results for the Civil Service – aggregating all of the responses from staff in different Civil Service Departments, Offices and Agencies. These overall results are important and provide a picture of ‘One Civil Service’.
However, what the Civil Service does is complex and varied and the results need to be understood in the context of what different Departments do and how they do it. The Civil Service includes more than 60 organisations with different governance and decision making structures. These organisations are dispersed across hundreds of locations in Ireland and abroad.
The Civil Service includes policy making organisations, regulatory bodies, and operational organisations managing the direct delivery of services.
The largest Civil Service organisations employ more than 6,500 staff, the smallest less than 100.
Each of the four main outcomes (Employee Engagement, Well-being, Coping with Change, Commitment to the Organisation) affects each Department differently and data will be produced to summarise responses in individual Departments.
No engagement survey will ever capture a perfect image of the working environment and the complexity of the Civil Service makes it harder. But by carrying out the employee engagement survey each year we are gathering data that will allow us to improve and work towards a world class Civil Service.
Each day, civil servants make vital contributions that affect Irish life positively. The Civil Service proudly serves Irish citizens and civil servants should be proud of the work they do.
How do the Employee Engagement results vary across the Civil Service?
Empl
oyee
Eng
agem
ent
0%10
0%
Agric
ultu
re, F
ood
and
the
Mar
ine
Arts
, Her
itage
and
the
Gae
ltach
t
Cent
ral S
ta�s
�cs
Offi
ce
Child
ren
and
Yout
h Aff
airs
Com
ms.
, Ene
rgy
and
Nat
ural
Res
ourc
es
Def
ence
Educ
a�on
and
Ski
lls
Envi
ronm
ent,
Com
mun
ity a
nd L
ocal
Gov
.
Fina
nce
Fore
ign
Affai
rs a
nd T
rade
Hea
lth
Jobs
, Ent
erpr
ise
and
Inno
va�o
n
Jus�
ce a
nd E
qual
ity
Offi
ce o
f the
A�
orne
y G
ener
al
Offi
ce o
f Pub
lic W
orks
Offi
ce o
f the
Rev
enue
Com
mis
sion
ers
Publ
ic A
ppoi
ntm
ents
Ser
vice
Publ
ic E
xpen
ditu
re a
nd R
efor
m
Soci
al P
rote
c�on
Taoi
seac
h (D
epar
tmen
t of)
Tran
spor
t, T
ouris
m a
nd S
port
71%
72%
72%
70%
69%
71%
73%
71%
71%
75%
66%
69%
68%
74%
75%
70%
77%
69%
67%
71%
67%
Civi
l Ser
vice
Ove
rall
70%
65Civil Service Employee Engagement Survey 2015Civil Service Employee Engagement Survey 201564

0%10
0%
Agric
ultu
re, F
ood
and
the
Mar
ine
Arts
, Her
itage
and
the
Gae
ltach
t
Cent
ral S
ta�s
�cs
Offi
ce
Child
r en
and
Yout
h Aff
airs
Com
ms.
, Ene
rgy
and
Nat
ural
Res
ourc
es
Def
ence
Educ
a�on
and
Ski
lls
Envi
ronm
ent,
Com
mun
ity a
nd L
ocal
Gov
.
Fina
nce
Fore
ign
Affai
rs a
nd T
rade
Hea
lth
Jobs
, Ent
erpr
ise
and
Inno
va�o
n
Jus�
ce a
nd E
qual
ity
Offi
ce o
f the
A�
orne
y G
ener
al
Offi
ce o
f Pub
lic W
orks
Offi
ce o
f the
Rev
enue
Com
mis
sion
ers
Publ
ic A
ppoi
ntm
ents
Ser
vice
Publ
ic E
xpen
ditu
re a
nd R
efor
m
Soci
al P
rote
c�on
Taoi
seac
h (D
epar
tmen
t of)
Tran
spor
t, T
ouris
m a
nd S
port
48%
44%
50%
53%
50%
49%
50%
48%
49%
53%
51%
47%
45%
55%
51%
49%
63%
47%
43%
52%
48%
Civi
l Ser
vice
Ove
rall
48%
0%10
0%
Agric
ultu
re, F
ood
and
the
Mar
ine
Arts
, Her
itage
and
the
Gae
ltach
t
Cent
ral S
ta�s
�cs
Offi
ce
Child
r en
and
Yout
h Aff
airs
Com
ms.
, Ene
rgy
and
Nat
ural
Res
ourc
es
Def
ence
Educ
a�on
and
Ski
lls
Envi
ronm
ent,
Com
mun
ity a
nd L
ocal
Gov
.
Fina
nce
Fore
ign
Affai
rs a
nd T
rade
Hea
lth
Jobs
, Ent
erpr
ise
and
Inno
va�o
n
Jus�
ce a
nd E
qual
ity
Offi
ce o
f the
A�
orne
y G
ener
al
Offi
ce o
f Pub
lic W
orks
Offi
ce o
f the
Rev
enue
Com
mis
sion
ers
Publ
ic A
ppoi
ntm
ents
Ser
vice
Publ
ic E
xpen
ditu
re a
nd R
efor
m
Soci
al P
rote
c�on
Taoi
seac
h (D
epar
tmen
t of)
Tran
spor
t, T
ouris
m a
nd S
port
76%
73%
78%
76%
74%
76%
76%
75%
74%
76%
70%
75%
75%
76%
77%
75%
81%
73%
72%
75%
72%
Civi
l Ser
vice
Ove
rall
75%
How does employee well-being vary across the Civil Service?
How does employee commitment vary across the Civil Service?
Wel
l-bei
ng
Com
mitm
ent t
o th
e O
rgan
isatio
n
Civil Service Employee Engagement Survey 201566 67Civil Service Employee Engagement Survey 2015

0%10
0%
Agric
ultu
re, F
ood
and
the
Mar
ine
Arts
, Her
itage
and
the
Gae
ltach
t
Cent
ral S
ta�s
�cs
Offi
ce
Child
r en
and
Yout
h Aff
airs
Com
ms.
, Ene
rgy
and
Nat
ural
Res
ourc
es
Def
ence
Educ
a�on
and
Ski
lls
Envi
ronm
ent,
Com
mun
ity a
nd L
ocal
Gov
.
Fina
nce
Fore
ign
Affai
rs a
nd T
rade
Hea
lth
Jobs
, Ent
erpr
ise
and
Inno
va�o
n
Jus�
ce a
nd E
qual
ity
Offi
ce o
f the
A�
orne
y G
ener
al
Offi
ce o
f Pub
lic W
orks
Offi
ce o
f the
Rev
enue
Com
mis
sion
ers
Publ
ic A
ppoi
ntm
ents
Ser
vice
Publ
ic E
xpen
ditu
re a
nd R
efor
m
Soci
al P
rote
c�on
Taoi
seac
h (D
epar
tmen
t of)
Tran
spor
t, T
ouris
m a
nd S
port
69%
68%
70%
73%
71%
72%
72%
69%
69%
71%
70%
70%
70%
70%
64%
69%
72%
71%
68%
72%
69%
Civi
l Ser
vice
Ove
rall
69%
Dublin
47.7%
Ulster
3.3%
Connaught
7.3%
Not Indicated
0.6%
Prefer not to say
8%
These results are broadly representative of the distribution of staff with approximately 50% in Dublin and 50% in other regions.
39,468 surveys issued in 2015 in electronic and paper format. Response rates are often lower in the first year.
Munster
17.1%
Rest of Leinster
16%
Respondents by Region and Age
UK Civil Service People Survey 2015
Population: 430,000 approx Respondents: 279,653 Response rate: 65%
Republic of Ireland Civil Service Employee Engagement Survey 2015
Population: 37,000 approx Respondents: 15,519 Response rate: 39.2%
Australian Public Service Commission Employee Survey 2013-2014
Population: 145,000 approx Respondents: 99,392 Response rate: 68%
Canadian Public Service Employee Survey 2014
Population: 250,000 approx Respondents: 178,500 Response rate: 71%
Does change capability vary across the Civil Service?
Age Band Count Percent
Not Indicated 73 0.5%16-19 5 0.0%20-24 121 0.8%25-29 434 2.8%30-34 1,402 9.0%35-39 1,903 12.3%40-44 2,427 15.6%45-49 2,299 14.8%50-54 2,924 18.8%55-59 2,096 13.5%60-64 809 5.2%65 and over 40 0.3%Prefer not to say 986 6.4%
Copi
ng w
ith C
hang
e
Civil Service Employee Engagement Survey 201568 69Civil Service Employee Engagement Survey 201568

Brief Insights on Gender
Of the 15,500 employees that took part in the 2015 survey 54.2% were women, 37.7% were men and 8.1% preferred not to say.
Women are slightly more engaged than men, scoring higher or equal to men on all the engagement questions. The largest difference between the genders is for the question 'I am enthusiastic about my job', with 75% of women agreeing compared to 71% of men.
Although women score higher than men on the Well-being theme it is interesting to note that men score higher on one question 'I have confidence in myself', with 90% agreeing, as opposed to 88% of women. This is interesting, particularly in light of the gender differences between responses to Involvement Climate questions. Here again more men answered positively than women. The question with the largest difference between genders was 'People don’t have any say in decisions which affect their work'. 62% of women agreed with this statement meaning that women feel decisions about their work are made without talking to them, more so than men.
There is a large variation by gender to responses to the Public Perception of the Civil Service theme, with more men than women agreeing with statements like ‘I feel that the public value the work the Civil Service does’ (23% of men and 16% of women) and ‘I feel that the public respect the Civil Service for its work’ (19% of men and 12% of women).
Looking at how the different genders responded to statements across the survey, we can see the following across the drivers:
• Men are generally more positive around the ‘Meaningfulness’ theme• Women are generally more positive around the ‘Competence’ theme• Men are generally more positive around the ‘Job Skills Match’ theme• Men are generally more positive around the ‘Organisational Support’ theme• Men are generally more positive around the ‘Leadership’ theme
While the gender results looked at side by side are not vastly different, it is useful to have such information at hand to allow senior managers to reflect on what can be done to ensure that both men and women feel they have ample opportunities, feel confident in themselves and are included in decisions that affect their role. For additional data on gender, see the accompanying document: ‘Supporting documentation: Survey Data by Gender’.
Of the 15,500 employees that took part in the 2015 survey 6.4% were Principal (senior level) and above, 49.7% were HEO/AO and AP, 36.5% were CO, SO and EO; and 7.4% preferred not to say.*
There are significant differences between grades across the themes. The higher the grade the higher the sense of commitment to the organisation. 88% of Secretaries Generals and equivalents noted their strong sense of belonging to their Department, contrasted with only 27% of COs and 37% of HEOs answering in a similar way. This large variation could relate to the increased levels of autonomy that naturally exist as a civil servant takes on more responsibility at higher grades.
Aligned with higher grades is the level of opportunities staff perceived to be available to them. The grade groups of SO (18%) and Industrial staff (21%) felt they didn't have opportunities to move around, while Secretary General level and equivalent disagreed (68%); possibly due to the nature of work and autonomy that each grade undertakes and the mobility schemes that exist in higher levels. This could also relate to special departments and specialised roles.
The results above are not hugely surprising due to the pressures and challenges that the Civil Service has faced over the last number of years. It is hoped that these figures will improve in 2016 due to the introduction of measures under the Civil Service Renewal Plan that focus on increased mobility at all grades and more opportunities for promotion through open competitions at all grades. For additional data on grade, see the accompanying document: ‘Supporting documentation: Survey Data by Grade’.
* All equivalents of grades are included in figures quoted – e.g. HEO or equivalent.
Brief Insights on Grade
Civil Service Employee Engagement Survey 201570 71Civil Service Employee Engagement Survey 2015

Analysis What are the results telling us?Understanding the main outcomes
Well-beingEmployee Engagement
Coping with Change Commitment to the Organisation
Data analysis is complex. This section of the document provides a light overview of the underpinning principles of the survey and how they’re linked. These linkages are important as they help shape the actions required to improve employee engagement in the Civil Service. The findings in this section are based on advanced statistical analysis and they provide key insights that provide a deeper understanding of what the survey data means for the Civil Service.
To fully understand the ‘employee experience’ in the Civil Service, the Civil Service Management Board (CSMB) wanted the survey to tell them about 4 main outcomes:
• The extent to which civil servants have a sense of energy and connection with their work activities, can deal with the demands of their job and find their work fulfilling (Employee Engagement)
• The extent to which civil servants feel they can cope with the normal stresses of life and make a contribution to their own community (Well-being)
• The extent to which civil servants attempt to minimise the negative emotions that arise from the experience of change events (Coping with Change)
• The emotional bond or attachment that civil servants feel to the Department or Office they work for (Commitment to the Organisation)
These outcomes were selected to reflect major strategic issues facing the Civil Service following a period of enormous change.
The results of the survey show interesting findings across these 4 dimensions, highlighted in the graphic below. The sense of Employee Engagement and Well-being in the Civil Service is very high at 70% and 75% respectively. Looking at other international administrations, Ireland scores favourably. For example, the Employee Engagement result in the UK is 58% and their average Well-being score is 62%. Although the positive responses to Coping with Change are reassuring, a 48% score for Commitment to the Organisation shows that a small majority favoured the negative options over the positive ones. This is something the Civil Service and its Departments and Offices will need to look at closely over the year ahead.
70%
69%
75%
48%73Civil Service Employee Engagement Survey 2015Civil Service Employee Engagement Survey 201572

Survey Result: 65% Survey Result: 44% Survey Result: 70% Survey Result: 44% Survey Result: 50%
2nd1st 3rd 4th 5thOutcome 4: Commitment to the OrganisationHere are the five key drivers associated with Commitment to the Organisation.
Meaningful work is the factor that influences commitment to the organisation more than any other. Similarly, providing sufficient organisational support is also an important driver.
Career Development and Mobility
Meaningfulness LeadershipOrganisational Support
Social Support
What are the most important things to act on?Understanding key drivers
Knowing the score for each outcome only tells us part of the story. We also need to understand what factors drive and determine each outcome. Understanding this helps us to focus our efforts on the right areas.
Different factors influence each outcome – these ‘drivers’ are captured in this graphic, and are ranked in line with how strongly they impact the outcome score. The level of impact or influence does not automatically align with the highest scoring driver. This is due to the statistical analysis underpinning it (see notes on pages 81-83).
Survey Result: 65% Survey Result: 58% Survey Result: 44% Survey Result: 50% Survey Result: 80%
2nd1st 3rd 4th 5thOutcome 1: Employee EngagementHere are the five key drivers associated with Employee Engagement.
Meaningful work is the factor that influences employee engagement more than any other in the Civil Service. Ensuring employees find meaning, value and purpose to their work will need to be a priority for CSMB in the year ahead.
Organisational Support
LeadershipMeaningfulness CompetenceJob Skills Match
Survey Result: 80% Survey Result: 65% Survey Result: 51% Survey Result: 58% Survey Result: 59%
2nd1st 3rd 4th 5thOutcome 2: Well-beingHere are the five key drivers associated with Well-being.
Feeling competent and capable is the factor that influences employee well-being more than any other. This means ensuring civil servants continue to feel capable to perform their work activities skillfully should remain a priority for CSMB in the year ahead.
Job Demands
Job Skills Match
Competence AutonomyMeaningfulness
Survey Result: 65% Survey Result: 44% Survey Result: 80% Survey Result: 58% Survey Result: 44%
2nd1st 3rd 4th 5thOutcome 3: Coping with ChangeHere are the five key drivers associated with Coping with Change.
Meaningful work is the factor that influences Coping with Change more than any other. Also important are opportunities to move and develop at work. Mobility and learning and development are key priorities in the Civil Service Renewal Plan.
Competence Job Skills Match
Meaningfulness Performance Standards
Career Development and Mobility
Survey Result: 80%
5th
How to read this chart• The survey is focussed on 4 main outcomes – Employee Engagement,
Well-being, Coping with Change, Commitment to the Organisation• Statistical analysis shows that different themes influence the
outcome score • Some of the 24 themes have a particularly strong positive impact on
the outcome score. These are known as ‘drivers’. The top 5 drivers are ranked from 1 (the driver with the highest impact) to 5. (1)
• To influence the outcome score in future, focus should be on the highest ranking drivers. In some cases, drivers can be negative.
• The highest ranking (most influential) drivers are not always the highest scoring in the survey. (2)
1
2
Civil Service Employee Engagement Survey 201574 75Civil Service Employee Engagement Survey 2015
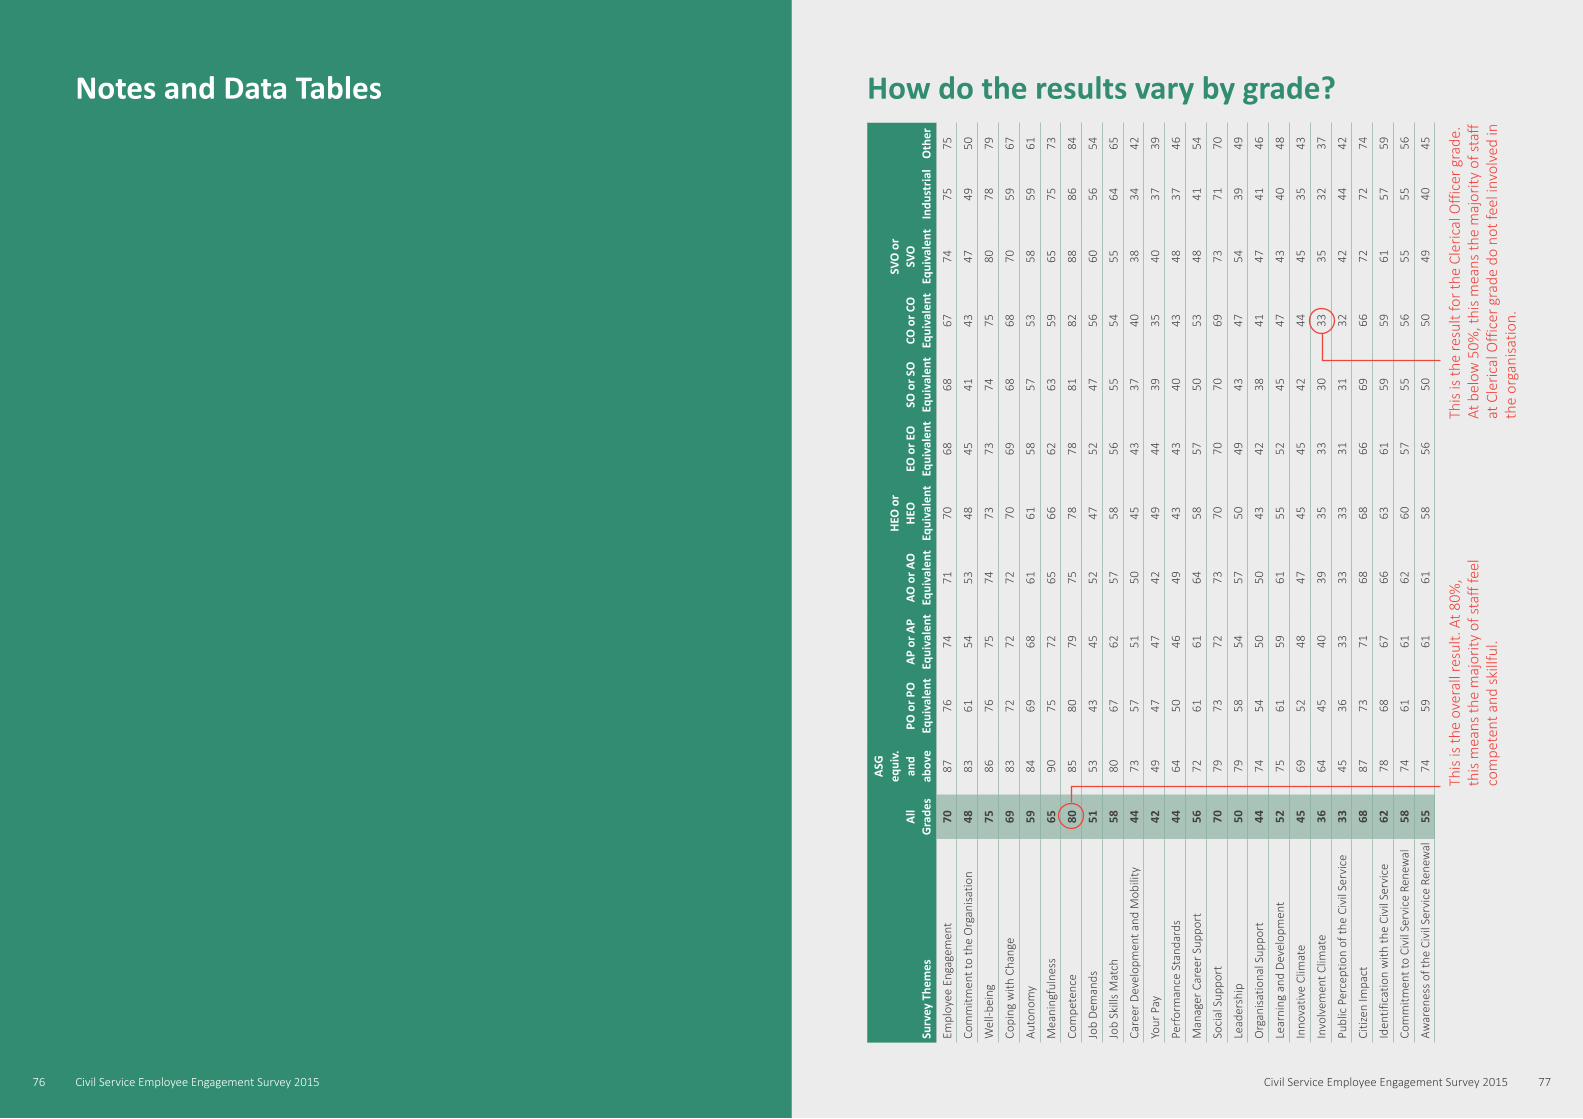
Notes and Data Tables
Surv
ey T
hem
esAl
l G
rade
s
ASG
eq
uiv.
an
d ab
ove
PO o
r PO
Eq
uiva
lent
AP o
r AP
Equi
vale
ntAO
or A
O
Equi
vale
nt
HEO
or
HEO
Eq
uiva
lent
EO o
r EO
Eq
uiva
lent
SO o
r SO
Eq
uiva
lent
CO o
r CO
Eq
uiva
lent
SVO
or
SVO
Eq
uiva
lent
Indu
stria
lO
ther
Empl
oyee
Eng
agem
ent
7087
7674
7170
6868
6774
7575
Com
mitm
ent t
o th
e O
rgan
isat
ion
4883
6154
5348
4541
4347
4950
Wel
l-bei
ng75
8676
7574
7373
7475
8078
79
Copi
ng w
ith C
hang
e69
8372
7272
7069
6868
7059
67
Auto
nom
y59
8469
6861
6158
5753
5859
61
Mea
ning
fuln
ess
6590
7572
6566
6263
5965
7573
Com
pete
nce
8085
8079
7578
7881
8288
8684
Job
Dem
ands
5153
4345
5247
5247
5660
5654
Job
Skill
s M
atch
5880
6762
5758
5655
5455
6465
Care
er D
evel
opm
ent a
nd M
obili
ty44
7357
5150
4543
3740
3834
42
Your
Pay
4249
4747
4249
4439
3540
3739
Perf
orm
ance
Sta
ndar
ds44
6450
4649
4343
4043
4837
46
Man
ager
Car
eer S
uppo
rt56
7261
6164
5857
5053
4841
54
Soci
al S
uppo
rt70
7973
7273
7070
7069
7371
70
Lead
ersh
ip50
7958
5457
5049
4347
5439
49
Org
anis
atio
nal S
uppo
rt44
7454
5050
4342
3841
4741
46
Lear
ning
and
Dev
elop
men
t52
7561
5961
5552
4547
4340
48
Inno
vativ
e Cl
imat
e45
6952
4847
4545
4244
4535
43
Invo
lvem
ent C
limat
e36
6445
4039
3533
3033
3532
37
Publ
ic P
erce
ptio
n of
the
Civi
l Ser
vice
3345
3633
3333
3131
3242
4442
Citiz
en Im
pact
6887
7371
6868
6669
6672
7274
Iden
tific
atio
n w
ith th
e Ci
vil S
ervi
ce62
7868
6766
6361
5959
6157
59
Com
mitm
ent t
o Ci
vil S
ervi
ce R
enew
al58
7461
6162
6057
5556
5555
56
Awar
enes
s of
the
Civi
l Ser
vice
Ren
ewal
5574
5961
6158
5650
5049
4045
How do the results vary by grade?
This
is th
e ov
eral
l res
ult.
At 8
0%,
this
mea
ns th
e m
ajor
ity o
f sta
ff fe
el
com
pete
nt a
nd s
killf
ul.
This
is th
e re
sult
for t
he C
leric
al O
ffic
er g
rade
. At
bel
ow 5
0%, t
his
mea
ns th
e m
ajor
ity o
f sta
ff
at C
leric
al O
ffic
er g
rade
do
not f
eel i
nvol
ved
in
the
orga
nisa
tion.
77Civil Service Employee Engagement Survey 2015Civil Service Employee Engagement Survey 201576

Surv
ey T
hem
esO
vera
ll Re
sult
24 a
nd
unde
r25
-29
30-3
435
-39
40-4
445
-49
50-5
455
-59
60-6
465
and
ov
er
Empl
oyee
Eng
agem
ent
7072
7066
6769
6971
7477
84
Com
mitm
ent t
o th
e O
rgan
isat
ion
4850
4947
4747
4747
5152
53
Wel
l-bei
ng75
7977
7474
7473
7477
7987
Copi
ng w
ith C
hang
e69
7574
7271
7068
6868
6970
Auto
nom
y59
5958
5958
5858
6062
6371
Mea
ning
fuln
ess
6559
6059
6264
6367
7173
75
Com
pete
nce
8079
7981
8079
7979
8183
88
Job
Dem
ands
5162
6153
5150
4949
5154
62
Job
Skill
s M
atch
5854
5654
5457
5760
6366
67
Care
er D
evel
opm
ent a
nd M
obili
ty44
5552
4244
4443
4446
4645
Your
Pay
4243
3436
4241
4345
4647
46
Perf
orm
ance
Sta
ndar
ds44
5752
4242
4243
4547
4749
Man
ager
Car
eer S
uppo
rt56
7265
5856
5555
5657
5762
Soci
al S
uppo
rt70
7676
7271
7069
7071
7171
Lead
ersh
ip50
6256
4848
4949
5053
5349
Org
anis
atio
nal S
uppo
rt44
5851
4343
4343
4547
4750
Lear
ning
and
Dev
elop
men
t52
6160
5252
5151
5254
5349
Inno
vativ
e Cl
imat
e45
5451
4343
4444
4748
4745
Invo
lvem
ent C
limat
e36
4740
3333
3436
3638
3839
Publ
ic P
erce
ptio
n of
the
Civi
l Ser
vice
3338
3428
3031
3235
3841
59
Citiz
en Im
pact
6867
6865
6768
6770
7172
76
Iden
tific
atio
n w
ith th
e Ci
vil S
ervi
ce62
6463
6061
6161
6364
6366
Com
mitm
ent t
o Ci
vil S
ervi
ce R
enew
al58
6259
5858
5857
5858
6161
Awar
enes
s of
the
Civi
l Ser
vice
Ren
ewal
5552
5352
5454
5556
5756
51
How do the results vary by age?
This
is th
e ov
eral
l res
ult f
or P
ublic
Pe
rcep
tion.
At b
elow
50%
, thi
s m
eans
a
sign
ifica
nt m
ajor
ity o
f sta
ff d
o no
t fe
el th
e pu
blic
val
ue th
eir w
ork.
This
is th
e re
sult
for a
ll st
aff a
ged
35-3
9 in
the
Civi
l Se
rvic
e. A
t 71%
this
mea
ns th
at th
e m
ajor
ity o
f civ
il se
rvan
ts b
etw
een
the
age
of 3
5-39
feel
ade
quat
ely
supp
orte
d by
thei
r man
ager
s.
How do the results vary by length of service?
Surv
ey T
hem
esO
vera
ll Re
sult
Less
than
1
year
1 to
5
year
s5
to 1
0 ye
ars
10 to
15
yea
rs15
to
20 y
ears
20 to
25
yea
rs25
to
30 y
ears
Gre
ater
th
an 3
0 ye
ars
Empl
oyee
Eng
agem
ent
7078
7468
6769
7070
73
Com
mitm
ent t
o th
e O
rgan
isat
ion
4852
5046
4646
4748
51
Wel
l-bei
ng75
8177
7474
7474
7375
Copi
ng w
ith C
hang
e69
7472
7169
6969
6868
Auto
nom
y59
6059
5857
5959
5963
Mea
ning
fuln
ess
6567
6962
6264
6565
69
Com
pete
nce
8078
8181
8080
8078
80
Job
Dem
ands
5165
5252
5150
4949
49
Job
Skill
s M
atch
5858
5954
5558
5959
62
Care
er D
evel
opm
ent a
nd M
obili
ty44
5847
4141
4344
4447
Your
Pay
4239
3839
4242
4444
46
Perf
orm
ance
Sta
ndar
ds44
6046
4141
4343
4547
Man
ager
Car
eer S
uppo
rt56
7159
5556
5554
5557
Soci
al S
uppo
rt70
7570
7069
7070
7071
Lead
ersh
ip50
6551
4646
4949
5153
Org
anis
atio
nal S
uppo
rt44
6047
4241
4343
4447
Lear
ning
and
Dev
elop
men
t52
6555
4850
5251
5254
Inno
vativ
e Cl
imat
e45
5744
4142
4445
4750
Invo
lvem
ent C
limat
e36
4936
3233
3435
3738
Publ
ic P
erce
ptio
n of
the
Civi
l Ser
vice
3341
3731
3031
3332
36
Citiz
en Im
pact
6870
7166
6767
6869
71
Iden
tific
atio
n w
ith th
e Ci
vil S
ervi
ce62
6561
6060
6162
6264
Com
mitm
ent t
o Ci
vil S
ervi
ce R
enew
al58
6262
5958
5757
5758
Awar
enes
s of
the
Civi
l Ser
vice
Ren
ewal
5554
5452
5354
5556
58
This
is th
e ov
eral
l res
ult f
or a
ll ci
vil s
erva
nts.
Be
caus
e th
is is
abo
ve 5
0%, t
his
mea
ns th
at a
sl
ight
maj
ority
of c
ivil
serv
ants
feel
ade
quat
ely
supp
orte
d by
thei
r man
ager
.
This
is th
e re
sult
for a
ll ci
vil s
erva
nts
who
hav
e se
rved
fo
r bet
wee
n 1-
5 ye
ars.
Bec
ause
this
is b
elow
50%
, th
is m
eans
that
a m
inor
ity o
f sta
ff w
orki
ng in
the
Civi
l Se
rvic
e fo
r bet
wee
n 1-
5 ye
ars
feel
fairl
y re
war
ded.
Civil Service Employee Engagement Survey 201578 79Civil Service Employee Engagement Survey 2015
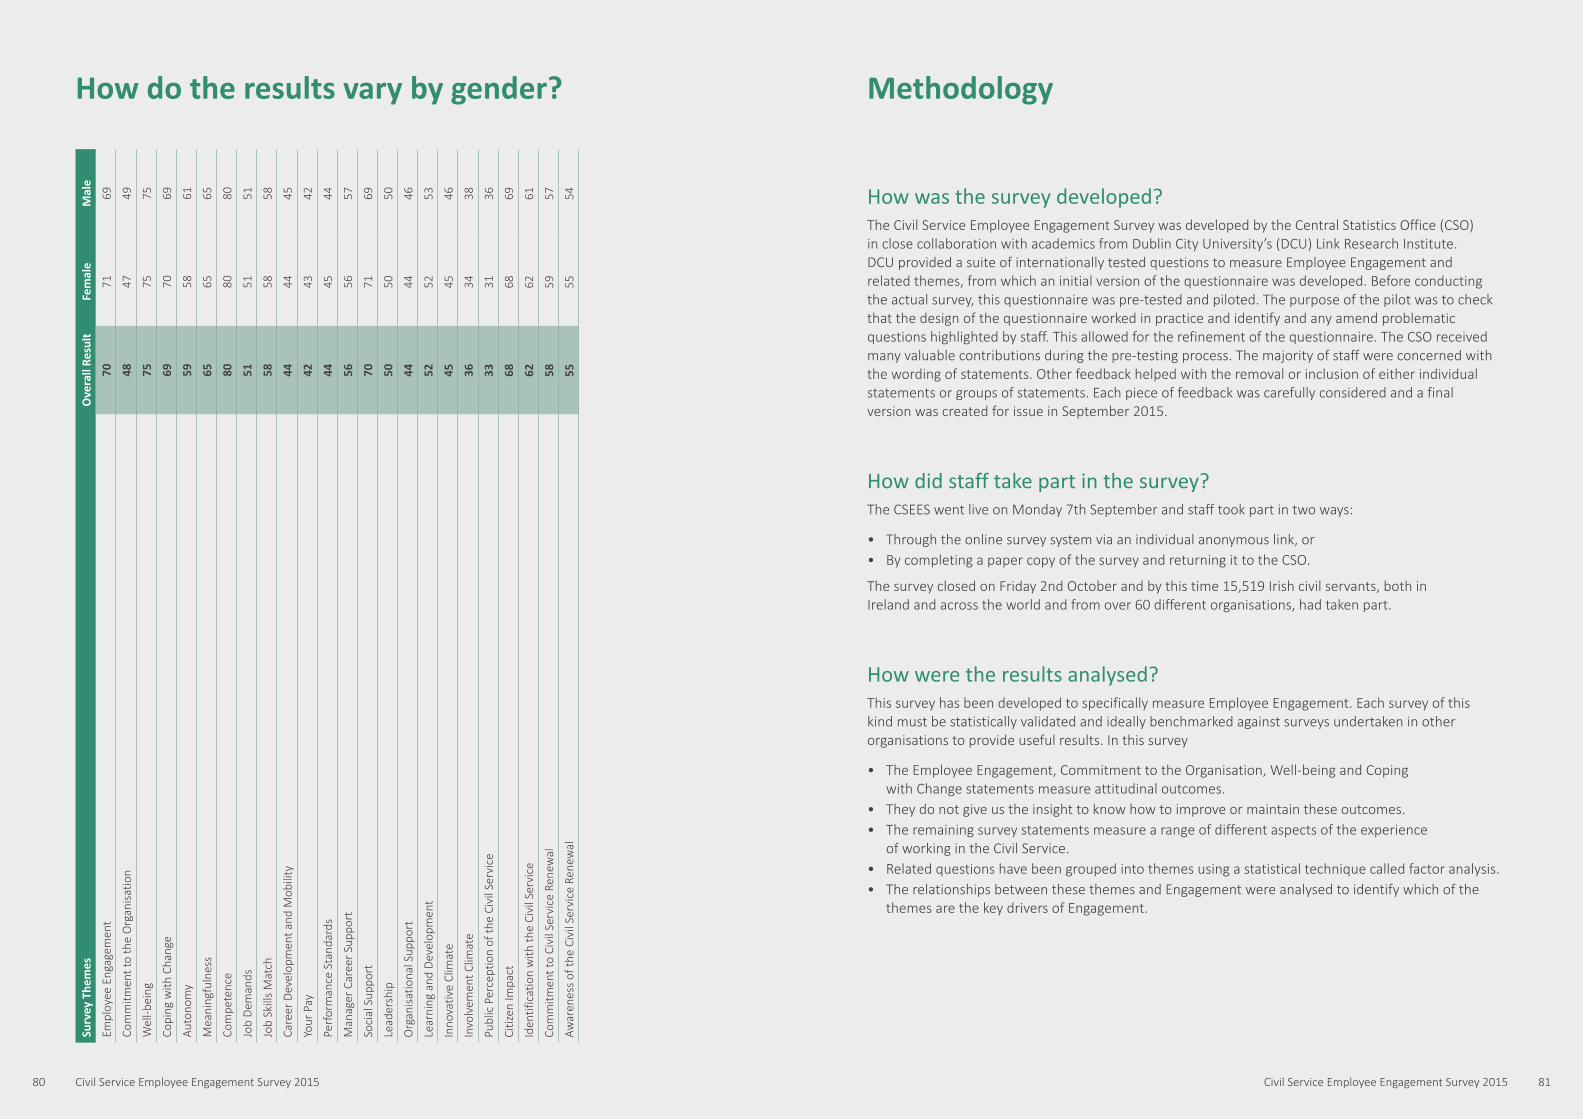
How was the survey developed?The Civil Service Employee Engagement Survey was developed by the Central Statistics Office (CSO) in close collaboration with academics from Dublin City University’s (DCU) Link Research Institute. DCU provided a suite of internationally tested questions to measure Employee Engagement and related themes, from which an initial version of the questionnaire was developed. Before conducting the actual survey, this questionnaire was pre-tested and piloted. The purpose of the pilot was to check that the design of the questionnaire worked in practice and identify and any amend problematic questions highlighted by staff. This allowed for the refinement of the questionnaire. The CSO received many valuable contributions during the pre-testing process. The majority of staff were concerned with the wording of statements. Other feedback helped with the removal or inclusion of either individual statements or groups of statements. Each piece of feedback was carefully considered and a final version was created for issue in September 2015.
How did staff take part in the survey?The CSEES went live on Monday 7th September and staff took part in two ways:
• Through the online survey system via an individual anonymous link, or• By completing a paper copy of the survey and returning it to the CSO.
The survey closed on Friday 2nd October and by this time 15,519 Irish civil servants, both in Ireland and across the world and from over 60 different organisations, had taken part.
How were the results analysed?This survey has been developed to specifically measure Employee Engagement. Each survey of this kind must be statistically validated and ideally benchmarked against surveys undertaken in other organisations to provide useful results. In this survey
• The Employee Engagement, Commitment to the Organisation, Well-being and Coping with Change statements measure attitudinal outcomes.
• They do not give us the insight to know how to improve or maintain these outcomes. • The remaining survey statements measure a range of different aspects of the experience
of working in the Civil Service. • Related questions have been grouped into themes using a statistical technique called factor analysis. • The relationships between these themes and Engagement were analysed to identify which of the
themes are the key drivers of Engagement.
MethodologyHow do the results vary by gender?Su
rvey
The
mes
Ove
rall
Resu
ltFe
mal
eM
ale
Empl
oyee
Eng
agem
ent
7071
69
Com
mitm
ent t
o th
e O
rgan
isat
ion
4847
49
Wel
l-bei
ng75
7575
Copi
ng w
ith C
hang
e69
7069
Auto
nom
y59
5861
Mea
ning
fuln
ess
6565
65
Com
pete
nce
8080
80
Job
Dem
ands
5151
51
Job
Skill
s M
atch
5858
58
Care
er D
evel
opm
ent a
nd M
obili
ty44
4445
Your
Pay
4243
42
Perf
orm
ance
Sta
ndar
ds44
4544
Man
ager
Car
eer S
uppo
rt56
5657
Soci
al S
uppo
rt70
7169
Lead
ersh
ip50
5050
Org
anis
atio
nal S
uppo
rt44
4446
Lear
ning
and
Dev
elop
men
t52
5253
Inno
vativ
e Cl
imat
e45
4546
Invo
lvem
ent C
limat
e36
3438
Publ
ic P
erce
ptio
n of
the
Civi
l Ser
vice
3331
36
Citiz
en Im
pact
6868
69
Iden
tific
atio
n w
ith th
e Ci
vil S
ervi
ce62
6261
Com
mitm
ent t
o Ci
vil S
ervi
ce R
enew
al58
5957
Awar
enes
s of
the
Civi
l Ser
vice
Ren
ewal
5555
54
Civil Service Employee Engagement Survey 201580 81Civil Service Employee Engagement Survey 2015
For example, the Coping with Change theme contains 5 statements. Of these, 4 are positively worded, so respondents who agree with the statements score more highly on the ability to cope with change. One statement was negatively worded – this is 'When change occurs in the Department, it causes me stress'. Respondents who agree with this statement are actually answering negatively and are less able to cope with change.
For this statement, where a user selected Strongly Agree, they were given a score of 0, while a response of Agree resulted in a score of 1, Neither Agree nor Disagree resulted in 2, Disagree gave 3 and Strongly Disagree gave 4. This is the reverse of the scoring for positively worded statements, where Strongly Agree gives the highest score and Strongly Disagree the lowest.
Each respondent’s score on the whole Coping with Change theme was then calculated as the average of their score across the 5 statements. The respondents with the very highest scores agreed with the 4 positive statements and disagreed with the negative statement. The scores were converted to percentages, and the Coping with Change index calculated as the average score across the Civil Service.
How were the drivers of Employee Engagement, Commitment, Well-Being and Coping with Change identified?To identify the key drivers of Employee Engagement, the extent that each of the themes is associated with Engagement was measured using a statistical technique called key driver analysis. This method uses multiple linear regression to determine which of the themes have the strongest association with Employee Engagement. These themes are called the key drivers of Employee Engagement. While it is not possible to increase Employee Engagement directly, it may be possible to identify actions that improve scores on the key drivers. These in turn will drive up the Employee Engagement score. Items with low scores that are strongly linked to Employee Engagement should be the main focus of change initiatives and engagement strategies.
The same technique was used to identify the key drivers of the other outcomes: Commitment to the Organisation, Well-being and Coping with Change.
What happens to the data now?The CSO will continue to analyse the data so that each Civil Service organisation that took part in the survey can receive Departmental data that will allow them to focus on issues specific to their staff and environment/culture.
As with all CSO analysis, full anonymity will be upheld for all respondents.
Do all the questions from the survey appear in the report?Following international standards, all the themes and statements in this report underwent a quality assessment to measure their relevance for inclusion. Certain statements that failed this assessment were excluded from this report. For example, if too many respondents skipped this statement and response rates were too low to be statistically significant.
Why do questions in the Civil Service Renewal theme only show a single result?The statements in the Civil Service Renewal theme were not developed the same way as the other themes in this report. This means that a reduced set of outputs are available for this theme compared to others.
How were the result scores developed?For each respondent, an Engagement score was calculated as the average score across the seven response options where Never is equivalent to 0, Almost Never is equivalent to 1, Rarely is equivalent to 2, Sometimes is equivalent to 3, Often is equivalent to 4, Very Often equivalent to 5 and Always is equivalent to 6. This score was converted to a percentage, where a respondent who selects Always to each question gets a score of 100%, while one who selects Never to each gets a score of 0%. The Employee Engagement index was then calculated as the average Engagement score in the Civil Service.
Similarly, the average score for each respondent on each of the outcomes Employee Engagement, Commitment to the Organisation, Well-being and Coping with Change was calculated from the 5 point scale Strongly Disagree, Disagree, Neither Agree nor Disagree, Agree, Strongly Agree. The scores were converted to percentages and averaged across the whole Civil Service.
A score of 50% means that the same proportion of respondents answered positively to the questions as answered negatively. A theme index of 100% would mean that all respondents selected Strongly Agree to all questions in the theme, while 0% indicates that all respondents chose Strongly Disagree.
Reverse Scoring – what does it mean?It’s necessary as part of the survey to use negatively phrased statements, for example – 'When change occurs in the Department, it causes me stress'. If you Strongly Agree to this statement you’re answering in a negative way. You do feel stress when change occurs in the Department. Therefore the results for this statement need to be ‘reverse scored’ to take into account the negative scenario.
Looking at it from the other end of the scale, those that answered Strongly Disagree to this statement don’t feel stress when change occurs – this is a positive response but needs to be ‘reverse scored’ to reflect this. Each theme with negatively phrased statements takes these scenarios into account in the index calculation by reversing the scores for these statements.
Civil Service Employee Engagement Survey 201582 83Civil Service Employee Engagement Survey 201582

Endnotes Grades
1. Cabinet Office. ‘UK Civil Service People Survey – Civil Service Benchmark Scores’. November, 2015.2. Cormac Hughes et al. ‘Human Capital Trends 2015: Leading in the new world of work – Irish Report.’
Deloitte University Press. 2015.3. Julie May et al. ‘Global Human Capital Trends 2015 – Leading in the new world of work.’ Deloitte
University Press. 2015.4. Government of Canada. ‘Public Service Employee Survey – Summary Report’. Treasury Board of
Canada Secretariat. February, 2015.5. David Schmidtchen and Angie Sturrock et al. ‘Australian Public Service Commission State of the
Service Report 2013-14’. Australian Government. 2014.6. Welsh Government Corporate Research Team. ‘Civil Service People Survey 2014’. ORC International.
January 2015.7. Scottish Government Cabinet Office. ‘Civil Service People Survey 2014’. ORC International.
January 2015.8. Deloitte. ‘Business needs to reset its purpose to attract Millennials, according to Deloitte’s annual
survey’ Press release, January 14, 2015. 9. Daniel Gerson and Beatrix Behrens. ‘Lead-Engage-Perform: Enhancing Employee Engagement to
Foster Innovation and Productivity in the Public Sector’. OECD Network on Public Employment and Management. April, 2015.
10. United States Office of Personnel Management. ‘Federal Employee Viewpoint Survey Results – Employees Influencing Change’. Governmentwide Management Report. 2015.
11. Josh Bersin. ‘The five elements of a ‘simply irresistible’ organization’. Bersin by Deloitte. April, 2014.12. Chandler Macleod. ‘Skills Utilisation – How effectively are businesses utilising the skills at their
disposal?’ Lonergan Research. 201413. Jonas Johnson. ‘Perceived Fairness in Compensation’. Economic Research Institute. 201214. Ministry of Finance, Personnel and Governance Policy Department in Finland. ‘Job satisfaction of
the personnel of the State in Finland survey 2014’. Office for the Government as Employer. 201415. Josh Bersin. ‘Becoming irresistible: A new model for employee engagement’. Deloitte Review. Issue
16. 2015.16. Marvin Bower. ‘The Will to Manage: Corporate Success through Programmed Management’.
McGraw-Hill. 1966.17. John Ryan. ‘Great People Leaders Do Things Differently’. Great Places to Work Article. October
2015. 18. Douglas R. Stover and Jade Wood. ‘Most Company Wellness Programs Are a Bust’. Gallup Business
Journal. February, 2015.19. John Lloyd. ‘Australian Public Service Commission State of the Service Report 2014-15’. Australian
Government. 2015.20. ‘What Do Employees Value in a Workplace?’ Quandora. November, 2012.
Director, Assistant Secretary General and above (and equivalents) –Principal (and equivalents) POAssistant Principal Officer (and equivalents) APAdministrative Officer (and equivalents) AOHigher Executive Officer (and equivalents) HEOExecutive Officer (and equivalents) EOStaff Officer (and equivalents) SOClerical Officer (and equivalents) COService Officer (and equivalents) SVOIndustrial (and equivalents) –
Civil Service Employee Engagement Survey 201584