Civil Engineering Department Contract No. CV/2000/09 ... · Contract No. CV/2000/09 Infrastructure...
39
Contract No. CV/2000/09 Infrastructure for Penny’s Bay Development – Contract 1 Impact Environmental Monitoring & Audit Report April 2003 Rev. A K:\2001\014 (Penny Bay Phase I)\Electronic Reporting\2003\Apr 03\R2296 (Apr 03 Rev. A).doc Action-United Environmental Services and Consulting i Civil Engineering Department Contract No. CV/2000/09 Infrastructure for Penny’s Bay Development - Contract 1 Impact Environmental Monitoring and Audit (EM&A) Report April 2003 Revision A
Transcript of Civil Engineering Department Contract No. CV/2000/09 ... · Contract No. CV/2000/09 Infrastructure...

Contract No. CV/2000/09 Infrastructure for Penny’s Bay Development – Contract 1 Impact Environmental Monitoring & Audit Report April 2003 Rev. A
K:\2001\014 (Penny Bay Phase I)\Electronic Reporting\2003\Apr 03\R2296 (Apr 03 Rev. A).doc Action-United Environmental Services and Consulting
i
Civil Engineering Department Contract No. CV/2000/09 Infrastructure for Penny’s Bay Development - Contract 1 Impact Environmental Monitoring and Audit (EM&A) Report April 2003 Revision A

Contract No. CV/2000/09 Infrastructure for Penny’s Bay Development – Contract 1 Impact Environmental Monitoring & Audit Report April 2003 Rev. A
K:\2001\014 (Penny Bay Phase I)\Electronic Reporting\2003\Apr 03\R2296 (Apr 03 Rev. A).doc Action-United Environmental Services and Consulting
ii
Contract No. CV/2000/09 Infrastructure for Penny’s Bay Development – Contract 1 Impact Environmental Monitoring & Audit Report April 2003 Rev. A
K:\2001\014 (Penny Bay Phase I)\Electronic Reporting\2003\Apr 03\R2296 (Apr 03 Rev. A).doc Action-United Environmental Services and Consulting
iii
Quality Control Page
Civil Engineering Department Contract No. CV/2000/09 Infrastructure for Penny’s Bay Development - Contract 1 Impact Environmental Monitoring and Audit (EM&A) Report April 2003 Revision A
kinho

Contract No. CV/2000/09 Infrastructure for Penny’s Bay Development – Contract 1 Impact Environmental Monitoring & Audit Report April 2003 Rev. A
K:\2001\014 (Penny Bay Phase I)\Electronic Reporting\2003\Apr 03\R2296 (Apr 03 Rev. A).doc Action-United Environmental Services and Consulting
iv
TABLE OF CONTENTS
EXECUTIVE SUMMARY........................................................................................................................................................ VII
1.0 INTRODUCTION.........................................................................................................................................................1 1.1 REPORT STRUCTURE .....................................................................................................................................................1 2.0 PROJECT ORGANIZATION AND CONSTRUCTION PROGRESS...........................................................................2 2.1 PROJECT ORGANIZATION AND MANAGEMENT STRUCTURE................................................................................................2 2.2 CONSTRUCTION PROGRESS IN APRIL 2003 .....................................................................................................................2 2.3 STATUS OF ENVIRONMENTAL APPROVAL DOCUMENTS ......................................................................................................4 2.3.1 Summary of Valid Environmental Approval Documents ..............................................................................................4 3.0 AIR QUALITY MONITORING .....................................................................................................................................5 3.1 MONITORING LOCATIONS................................................................................................................................................5 3.2 MONITORING FREQUENCY AND METHODOLOGY ...............................................................................................................5 3.2.1 Monitoring Frequency..................................................................................................................................................5 3.2.2 Monitoring Methodology and Equipment Used ...........................................................................................................5 3.2.3 Monitoring Procedures and Calibration Details ...........................................................................................................6 3.3 ACTION AND LIMIT LEVELS..............................................................................................................................................7 3.4 AIR QUALITY MONITORING RESULTS AND AUDITS.............................................................................................................7 4.0 CONSTRUCTION NOISE MONITORING...................................................................................................................9 4.1 MONITORING LOCATIONS................................................................................................................................................9 4.2 MONITORING FREQUENCY AND METHODOLOGY ...............................................................................................................9 4.2.1 Monitoring Frequency..................................................................................................................................................9 4.2.2 Monitoring Methodology and Equipment Used ...........................................................................................................9 4.2.3 Monitoring Procedures and Calibration Details .........................................................................................................10 4.3 ACTION AND LIMIT LEVELS............................................................................................................................................10 4.4 NOISE MONITORING RESULTS AND AUDITS .................................................................................................................... 11 5.0 MARINE WATER QUALITY MONITORING.............................................................................................................14 5.1 MONITORING LOCATIONS..............................................................................................................................................14 5.2 MONITORING FREQUENCY AND METHODOLOGY .............................................................................................................14 5.2.1 Monitoring Parameters and Frequency .....................................................................................................................14 5.2.2 Monitoring Methodology and Equipment Used .........................................................................................................14 5.3 ACTION AND LIMIT LEVELS............................................................................................................................................16 5.4 MARINE WATER MONITORING RESULTS AND AUDITS ......................................................................................................16 5.4.1 Dissolved Oxygen, Turbidity and Suspended Solids.................................................................................................17 6.0 ECOLOGICAL MONITORING ..................................................................................................................................18 6.1 TERRESTRIAL ECOLOGY...............................................................................................................................................18 6.1.1 Monitoring Location ...................................................................................................................................................18 6.1.2 Monitoring Parameters and Frequency .....................................................................................................................18 6.1.3 Monitoring Methodology ............................................................................................................................................18 6.1.4 Monitoring Equipment ...............................................................................................................................................18 6.1.5 Monitoring Results and Audits...................................................................................................................................18 6.2 RARE/RESTRICTED/PROTECTED PLANT SPECIES...........................................................................................................19 6.3 MARINE MAMMAL MONITORING.....................................................................................................................................19 6.3.1 Monitoring Location ...................................................................................................................................................19 6.3.2 Monitoring Parameters and Frequency .....................................................................................................................20 6.3.3 Monitoring Methodology ............................................................................................................................................20 6.3.4 Monitoring Equipment ...............................................................................................................................................20 6.3.5 Monitoring Results and Audits...................................................................................................................................21 7.0 ENVIRONMENTAL NON-CONFORMANCE ............................................................................................................22 7.1 SUMMARY OF MONITORING EXCEEDANCES ...................................................................................................................22 7.2 SUMMARY OF ENVIRONMENTAL COMPLAINTS.................................................................................................................22 7.3 ENVIRONMENTAL SUMMONS .........................................................................................................................................23

Contract No. CV/2000/09 Infrastructure for Penny’s Bay Development – Contract 1 Impact Environmental Monitoring & Audit Report April 2003 Rev. A
K:\2001\014 (Penny Bay Phase I)\Electronic Reporting\2003\Apr 03\R2296 (Apr 03 Rev. A).doc Action-United Environmental Services and Consulting
v
8.0 WASTE MANAGEMENT ..........................................................................................................................................24
9.0 CULTURAL HERITAGE ...........................................................................................................................................25
10.0 LANDSCAPE AND VISUAL .....................................................................................................................................25
11.0 SITE INSPECTION ...................................................................................................................................................25
12.0 WESTERN DRAINAGE CHANNEL (WDC)..............................................................................................................25
13.0 IMPLEMENTATION STATUS OF MITIGATION MEASURES .................................................................................26
14.0 IMPACT FORECAST AND MONITORING SCHEDULE FOR MAY 2003 ...............................................................26 14.1 KEY ISSUES FOR THE COMING MONTH ..........................................................................................................................26 14.2 MONITORING SCHEDULE FOR THE NEXT 3 MONTHS .......................................................................................................26 14.3 CONSTRUCTION PROGRAM FOR THE NEXT 3 MONTHS ...................................................................................................26 15.0 CONCLUSIONS AND RECOMMENDATIONS.........................................................................................................27
LIST OF TABLES
Table 2-1 Major Construction Activities in April 2003 Table 2-2 Summary of Sand Filling Activities Table 2-3 Construction Activities and Corresponding Environmental Mitigation Measures Table 2-4 Status of Environmental Licenses and Permits Table 3-1 Locations of Air Monitoring Stations Table 3-2 Frequency and Duration of Air Quality Monitoring Table 3-3 Air Quality Monitoring Equipment Table 3-4 Action/Limit Levels for 24-hr TSP Monitoring Table 3-5 Action/Limit Levels for 1-hr TSP Monitoring Table 4-1 Locations of Noise Monitoring Stations Table 4-2 Frequency and Parameters of Noise Monitoring Table 4-3 Construction Noise Monitoring Equipment Table 4-4 Action/Limit Levels for Construction Noise Monitoring Table 4-5 Summary of Noise Monitoring Results Table 4-6 Summary of Restricted-hours Noise Monitoring (1900-2300 Hrs) - Evening Table 4-7 Summary of Restricted-hours Noise Monitoring (2300-0700 Hrs Next Day) - Night Table 5-1 Locations of Marine Water Monitoring Stations Table 5-2 Water Quality Monitoring Parameters and Frequency Table 5-3 Marine Water Quality Monitoring Equipment Table 5-4 Action/Limit Levels for Marine Water Quality Monitoring Table 5-5 Summary of Marine Water Quality Exceedances Table 6-1 Monitoring Results of White-bellied Sea Eagles Table 7-1 Statistical Summary of Environmental Complaints Table 7-2 Statistical Summary of Legal Proceedings Table 8-1 Summary of Quantities of Waste for Disposal Table 8-2 Summary of Quantities of Recycling Materials
Contract No. CV/2000/09 Infrastructure for Penny’s Bay Development – Contract 1 Impact Environmental Monitoring & Audit Report April 2003 Rev. A
K:\2001\014 (Penny Bay Phase I)\Electronic Reporting\2003\Apr 03\R2296 (Apr 03 Rev. A).doc Action-United Environmental Services and Consulting
vi
List of Appendices Appendix A Project Site Layout Appendix B Project Environmental Organization Structure Appendix C Layout Plan of Works Areas Appendix D Locations of Environmental Monitoring Stations and Wind Monitoring Station Appendix E Schedule of EM&A Activities Appendix F Schedule of Calibration Certificates Appendix G Event and Action Plan Appendix H Graphical Plots of Air Monitoring Results and Raw Data Records Appendix I Graphical Plots of Noise Monitoring Results Appendix J Meteorological Data Appendix K HOKLAS Certificates, QA/QC Procedures & Results Appendix L Graphical Plots of Water Monitoring Results (Dissolved Oxygen) Appendix L Graphical Plots of Water Monitoring Results (Turbidity) Appendix L Graphical Plots of Water Monitoring Results (Suspended Solids) Appendix M Raw Data of Water Quality Monitoring Results Appendix N Photographs of White-bellied Sea Eagles Appendix O Records of Marine Mammal Monitoring Appendix P Photographs of Marine Mammals Appendix Q Details of Monitoring Exceedance Appendix R Site Inspection Records Appendix S Environmental Mitigation Implementation Schedule Appendix T Construction Program Appendix U Audit Summary
Contract No. CV/2000/09 Infrastructure for Penny’s Bay Development – Contract 1 Impact Environmental Monitoring & Audit Report April 2003 Rev. A
K:\2001\014 (Penny Bay Phase I)\Electronic Reporting\2003\Apr 03\R2296 (Apr 03 Rev. A).doc Action-United Environmental Services and Consulting
vii
EXECUTIVE SUMMARY The China State Construction Engineering (Hong Kong) Limited (hereinafter referred to as “CSCE”) was awarded by the Civil Engineering Department (CED) the Contract CV/2000/09 of Infrastructure for Penny’s Bay Development Contract 1 (hereinafter referred to as “the Project”).
Action-United Environmental Services and Consulting (AUES) was commissioned by CSCE to implement an Environmental Monitoring and Audit (EM&A) program in accordance with the EM&A Manual as the Environmental Team (ET).
This monthly EM&A report (No. 17) summarizes the impact monitoring results and audit findings of the EM&A program during the reporting period from 26 March 2003 to 25 April 2003. Environmental Monitoring and Audit Progress
The impact EM&A program was undertaken based on the EM&A manual. A summary of the monitoring activities in this reporting month is listed below:
• 24-hr Total Suspended Particulate (TSP) Monitoring 10 Occasions • Daytime Noise Monitoring 15 Occasions • Restricted-hours Noise Monitoring (1900-2300 hours) 15 Occasions • Restricted-hours Noise Monitoring (2300-0700 hours) 15 Occasions • Marine Water Quality Monitoring 13 Monitoring Days • Joint Site Inspection 5 Times • Waste Management Audit 1 Time • Marine Mammal Survey 2 Times • Ecological Survey for White-bellied Sea Eagle 2 Times Air Quality
All 24 hours TSP measurement results were below the Action and Limit Levels this month. A complaint on dark smoke emission was received by the ET on 2 April 2003 and closed by the IEC on 10 April 2003. Details are given the Environmental Complaint section in this Executive Summary. Previous exceedances in January and February 2003 have not been verified by the IEC. Also the air quality complaint received on 24 January 2003 is still outstanding and not closed by the IEC. Construction Noise Daytime Noise Monitoring All daytime noise measurement results were below the Action and Limit Levels. Restricted-hours Noise Monitoring (1900-2300 hours) - Evening Two Limit-level exceedances were recorded at NM3 on 28 March and 9 April 2003. Site observations indicated that the most noticeable noise sources at the time of monitoring were MTR Airport Express trains and aircrafts. Restricted-hours Noise Monitoring (2300-0700 hours next day) - Night
Fifteen Limit-level exceedances in total were recorded at all 3 noise monitoring stations on 22 March, 3, 9, 15 and 21 April 2003. In summary, site observations recorded by the ET indicated that the dominant noise sources were mostly background noise e.g. traffic flows, aircrafts, ferry, sea waves and vegetation rustling. The IEC concurred with the ET’s findings and verified the investigation reports submitted by the ET.

Contract No. CV/2000/09 Infrastructure for Penny’s Bay Development – Contract 1 Impact Environmental Monitoring & Audit Report April 2003 Rev. A
K:\2001\014 (Penny Bay Phase I)\Electronic Reporting\2003\Apr 03\R2296 (Apr 03 Rev. A).doc Action-United Environmental Services and Consulting
viii
Restricted-hours Noise Monitoring (1900-0700 hours next day)
During restricted hours (both evening and night), the overall compliance rate is 48.9%. The overall compliance rate on restricted-hours noise measurements increased from 46.7% in the previous month to 48.9% this month. The IEC-verified investigation reports confirmed that the noise exceedances were not due to the Project but rather indicative of the local background noise environment. Water Quality
There were two Action-level suspended solids (SS) exceedances recorded on 18 April 2003. The exceedances were recorded at SR4 during mid-ebb tide and at SR6 during mid-flood tide. The water flow during mid-flood tide was from SR6 to the works area. Therefore, the mid-flood exceedance is not likely to be due to the Project. The water flow during mid-ebb was from the works area to SR4. However, Gradient Stations G7, G5 and G6, which are in the immediate vicinity of the works area, recorded no exceedances and had values lower than that recorded at SR4. Therefore, the mid-ebb exceedance at SR4 is unlikely to be caused by the Project. No further exceedance was recorded and subsequent SS results were all below the Action Level. An investigation report submitted by the ET has not yet been verified by the IEC. Summary of Monitoring Exceedances A summary of monitoring exceedances for air, noise and water quality monitoring is presented below:
Env. Quality Parameters Compliance % Investigation & Corrective Actions Air Quality 24-hr TSP 100 Not Required for 100% Compliance
Leq (30min) Daytime 100 Not Required for 100% Compliance Noise Leq (5min) Restricted Hours 48.9 ET’s Investigation Completed# Suspended Solids 98.1 ET’s Investigation Completed# Turbidity 100 Not Required for 100% Compliance Water Quality Dissolved Oxygen 100 Not Required for 100% Compliance
# Details of the monitoring exceedances recorded by ET and actions taken by CSCE are presented in Appendix Q. Ecological Monitoring Marine mammal surveys were conducted on 2 and 16 April 2003. On-effort monitoring on 2 April 2003 was abandoned due to unstable weather conditions. The survey team decided to maximise the search effort in key areas, which included the vicinity of the work site, the area around the Brothers' Island and along the coast between Siu Ho and Tung Chung. No sighting was recorded on 2 April 2003. An on-effort survey was conducted on 16 April 2003 and no sighting was recorded for that day either. No direct impacts on the marine mammals attributable to the Project were observed. Monitoring of the White-Bellied Sea Eagle (WBSE) Haliaeetus leucogaster was undertaken at Pa Tau Kwu, Lantau Island on 3 and 15 April 2003. Both male and female birds were present at the monitoring site during the two surveys. No incubation, chick feeding activity or juvenile WBSEs were observed during this month. This would suggest that the breeding of the WBSEs has been unsuccessful this season since March 2003 when similar observations were made. No noticeable disturbance to the WBSEs was observed during the survey. A total of 98 plants of Schoenus falcatus and three patches of Eriocaulon merrilli had been transplanted from the project site in Penny’s Bay to the receptor sites at Sze Pak Wan on 13 and 14 January 2003. All the transplanted individuals of Schoenus falcatus and Eriocaulon merrilli were still alive during the third monitoring period from 15 March 2003 to 15 April 2003 as reported by CSCE.

Contract No. CV/2000/09 Infrastructure for Penny’s Bay Development – Contract 1 Impact Environmental Monitoring & Audit Report April 2003 Rev. A
K:\2001\014 (Penny Bay Phase I)\Electronic Reporting\2003\Apr 03\R2296 (Apr 03 Rev. A).doc Action-United Environmental Services and Consulting
ix
Most of the transplanted Schoenus falcatus individuals showed improvement from the previous monitoring session. Thirteen transplanted Schoenus falcatus individuals were recorded to have flowers with new roots and strong rhizomes observed indicating self-regeneration of the plants. The overall condition of the transplanted Schoenus falcatus was noted as good and the Eriocaulon merrilli acceptable. Western Drainage Channel (WDC)
No environmental deficiencies were noted in the Western Drainage Channel this month. Environmental Complaints The ET received one complaint on dark smoke emissions on 2 April 2003. Investigation by the ET and CSCE revealed that an excavator operating near the CLP Penny’s Bay Gas Turbine Power Station on 22 March 2003 was probably the cause of the complaint. The concerned excavator was immediately stopped by CSCE on that day and the responsible subcontractor was required to carry out proper maintenance before the equipment was allowed to resume operation. The ET submitted an investigation report on 4 April 2003 and the complaint was closed by the IEC on 10 April 2003. Environmental Summons No summons or prosecutions were received in this month. Site Inspection and Audit
Representatives of the IEC, the RE, CSCE and the ET carried out five weekly joint site inspections on 26 March, 3, 9, 15 and 23 April 2003. Details of the audit/inspection findings are presented in Section 11 and Appendix R. Marine Works Dredging at the Yam O reclamation site was completed on 3 October 2002. Sand filling activities were carried out everyday this month. The daily sand filling quantities were all below the maximum limit of 14,000 m3/day for Yam O reclamation. No fill import from Tseung Kwan O was recorded. Daily rates for sand filling are shown in Section 2.2. Future Key Issues Based on the joint site inspections and forecast of engineering works in the coming month, key issues to be considered in near future are summarized as follows: Marine water quality impact due to sand filling works at Yam O; Maintenance of silt curtains at Yam O; Marine water quality impact due to unloading of Completely Decomposed Granite (CDG)
material at seawall; Stockpiles and exposed soil surfaces should be covered with impermeable sheeting to prevent
surface water runoff carrying soil particles into adjacent channels; Drainage channels should be well maintained in preparation for the oncoming rainy season; Review of soil contamination issues observed in workshop areas; Improvement of the management and control of chemical and C&D wastes; Regular cleaning of mud from paved haul roads; Follow-up improvements on general waste management issues; and The discharge of excavation water into the adjacent seawall.

Contract No. CV/2000/09 Infrastructure for Penny’s Bay Development – Contract 1 Impact Environmental Monitoring & Audit Report April 2003 Rev. A
K:\2001\014 (Penny Bay Phase I)\Electronic Reporting\2003\Apr 03\R2296 (Apr 03 Rev. A).doc Action-United Environmental Services and Consulting
x
Overall Situation
Two suspended solids (SS) exceedances were reported for water quality this month. ET’s investigation concluded that the SS exceedances were not project related. A decrease in the number of restricted-hours noise exceedances was noted compared with last month. It should be noted that all noise exceedances were not caused by the Project. No exceedances were reported for air quality. Dust suppression measures continued as scheduled particularly along the haul roads. Environmental monitoring will continue next month and any updates on the site situation will be reported.

Contract No. CV/2000/09 Infrastructure for Penny’s Bay Development – Contract 1 Impact Environmental Monitoring & Audit Report April 2003 Rev. A
K:\2001\014 (Penny Bay Phase I)\Electronic Reporting\2003\Apr 03\R2296 (Apr 03 Rev. A).doc Action-United Environmental Services and Consulting
1.0 INTRODUCTION The China State Construction Engineering (Hong Kong) Limited (hereinafter referred to as “CSCE”) was awarded by the Civil Engineering Department (CED) the Contract CV/2000/09 of Infrastructure for Penny’s Bay Development Contract 1 (hereinafter referred to as “the Project”). Action-United Environmental Services and Consulting (AUES) was commissioned by CSCE to implement an Environmental Monitoring and Audit (EM&A) program in accordance with the EM&A Manual as the Environmental Team (ET). A site map showing the project boundary is shown in Appendix A. This monthly EM&A report (No. 17) summarises the impact monitoring results and audit findings of the EM&A program during the reporting period from 26 March 2003 to 25 April 2003.
1.1 REPORT STRUCTURE The structure of this EM&A report is organized into 15 sections as follows:
Section 1 Introduction; Section 2 Project Organization and Construction Progress; Section 3 Air Quality Monitoring; Section 4 Construction Noise Monitoring; Section 5 Marine Water Quality Monitoring; Section 6 Ecological Monitoring; Section 7 Environmental Non-Conformance; Section 8 Waste Management; Section 9 Cultural Heritage; Section 10 Landscape and Visual; Section 11 Site Inspection; Section 12 Western Drainage Channel; Section 13 Implementation Status of Mitigation Measures; Section 14 Impact Forecast and Monitoring Schedule for May 2003; and Section 15 Conclusions and Recommendations.

Contract No. CV/2000/09 Infrastructure for Penny’s Bay Development – Contract 1 Impact Environmental Monitoring & Audit Report April 2003 Rev. A
K:\2001\014 (Penny Bay Phase I)\Electronic Reporting\2003\Apr 03\R2296 (Apr 03 Rev. A).doc Action-United Environmental Services and Consulting
2.0 PROJECT ORGANIZATION AND CONSTRUCTION PROGRESS 2.1 PROJECT ORGANIZATION AND MANAGEMENT STRUCTURE
The organization chart and lines of communication with respect to the on-site environmental management and monitoring program are shown in Appendix B.
2.2 CONSTRUCTION PROGRESS IN APRIL 2003 A summary of the major construction activities undertaken in this reporting month is shown in Table 2-1. Table 2-1 Major Construction Activities in April 2003
Section / Stage Description of Construction Activities Section 1 Remaining Works
Construction of Penny’s Bay Sewage Pumping Station, Sewage Pumping Station No.1, Sewage Pumping Station No.2, and Yam O Sewage Pumping Station had been completed.
Transformer room of Penny’s Bay Sewage Pumping Station is under construction. Underground Laying of road drain and rising main are in progress. Combined works of topsoil placement, installation of root barrier, and irrigation
sub-mains in the roadside planting areas along West Resort Road are in progress. Section 2 Remaining Works
Box Culvert CHCA at Ch 0 to 622 in progress - Triple-Cell Ch 0 - 622 (total 59 bays).
Box Culvert CHGA at Ch 0 to 648 in progress - Single-Cell Ch 0 - 648 (total 57 bays).
Box Culvert CHGC at Ch 0 to 484 in progress - Single-Cell Ch 0 - 484 (total 44 bays).
Box Culvert CHFA at Ch –33.18 to 1207.963 in progress - Single-Twin-Triple-cell Ch –33.18 to 1207.963 (Total 119 bays).
Underground Laying, Western Maintenance Access Road Ch 100-1143, berm core filling and topsoil placement of rock catcher bund, berm core filling of Berm TP2-N, Berm CP2, Berm CP3, Berm CP4, Berm PW3, Berm UY3, Berm PS, Berm PO2 and TP2-N are in progress.
Section 2A Artificial Lake excavation is in progress. Section 2B Construction of utility service tunnel in Area 3J is in progress. Section 2C Underground laying of Irrigation Main, Fresh Water Main, and Salt Water Main are in
progress. Structural works for Penny’s Bay Irrigation Pumping Station was completed.
Stage F Slope Cutting at Areas 12A, 12B and 12 ongoing. Retaining Wall S6 at Ch 0-195 is ongoing. Retaining Wall W5A at Ch 0-82.5 is completed. Underground Laying
- Fresh water main, salt water main and rising main ongoing. Stage K Underground Laying
- Fresh Water main and salt water main in progress. Stage G Marine Works at Yam O (sandfilling, Cat 0, and Grade 200) are in progress.
Underground Works at Yam O (gravity sewer, rising main, fresh water main) are in progress.
Construction of Bridge P2 in progress. Stage L1 Compensatory Woodland Planting is in progress. Dredging at the Yam O reclamation site was completed on 3 October 2002. Sand filling activities were carried out everyday from the 26 March 2003 to 25 April 2003. The daily sand filling quantities were all below the maximum limit of 14,000 m3/day for Yam O reclamation. No fill import from Tseung Kwan O was recorded. Daily rates for sand filling are shown in Section 2.2.

Contract No. CV/2000/09 Infrastructure for Penny’s Bay Development – Contract 1 Impact Environmental Monitoring & Audit Report April 2003 Rev. A
K:\2001\014 (Penny Bay Phase I)\Electronic Reporting\2003\Apr 03\R2296 (Apr 03 Rev. A).doc Action-United Environmental Services and Consulting
Table 2- 2 Summary of Daily Sand Filling Activities
Date Daily Sandfilling Volume (m3) Date Daily Sandfilling
Volume (m3) Date Daily Sandfilling Volume (m3)
26-Mar-03 2890.00 6-Apr-03 7947.50 17-Apr-03 6502.50 27-Mar-03 5057.50 7-Apr-03 5780.00 18-Apr-03 6502.50 28-Mar-03 3612.50 8-Apr-03 8670.00 19-Apr-03 5057.50 29-Mar-03 1445.00 9-Apr-03 6502.50 20-Apr-03 5780.00 30-Mar-03 1445.00 10-Apr-03 7225.00 21-Apr-03 6502.50 31-Mar-03 2167.50 11-Apr-03 7947.50 22-Apr-03 4335.00 1-Apr-03 1360.00 12-Apr-03 9392.50 23-Apr-03 3612.50 2-Apr-03 2040.00 13-Apr-03 5780.00 24-Apr-03 5057.50 3-Apr-03 2040.00 14-Apr-03 5780.00 25-Apr-03 722.50 4-Apr-03 12282.50 15-Apr-03 7947.50 5-Apr-03 2167.50 16-Apr-03 6502.50
Total 160055.00 In general, the environmental mitigation measures were implemented as given in Table 2-3. Table 2-3 Implementation of Environmental Mitigation Measures Construction Activity Environmental Mitigation Measures Excavation, piling and general construction works
All machines should be turned off when plants and dumping trucks are idlingto minimise the noise impact;
Use of soak-away and de-silting tanks and de-silting bays to properly treatsite effluent generated; and
Use of water spraying to minimize dust generation. Sandfilling Restrict daily filling rate to be less than 14,000 m3/day. Public Fill Use tarpaulin to cover load when transporting fill The locations of the above-mentioned construction activities being undertaken are shown in Appendix C. Some construction works were being undertaken during restricted hours under valid Construction Noise Permits (CNPs) issued by the Environmental Protection Department (EPD). A list of valid CNPs currently held by CSCE is detailed in Table 2-4.

Contract No. CV/2000/09 Infrastructure for Penny’s Bay Development – Contract 1 Impact Environmental Monitoring & Audit Report April 2003 Rev. A
K:\2001\014 (Penny Bay Phase I)\Electronic Reporting\2003\Apr 03\R2296 (Apr 03 Rev. A).doc Action-United Environmental Services and Consulting
2.3 STATUS OF ENVIRONMENTAL APPROVAL DOCUMENTS 2.3.1 Summary of Valid Environmental Approval Documents
A summary of the relevant permits, licences, and/or notifications on environmental protection for this Project as of 25 April 2003 is presented in Table 2-4. Table 2-4 Status of Environmental Licenses and Permits
Item Item Description Permit Status
1 Environmental Permit for Infrastructure for Penny’s Bay Development Contract 1 (no. EP-097/2001/B) Issued to CED on 13-Jan-2003
2 Dumping Permit EP/MD/03-140 Valid (6-Feb-03 to 5-Aug-03)
3 Wastewater Discharge License (EP 742/974/0036I) Valid (18-Mar-02 to 31-Mar-07)
4 Wastewater Discharge License (EP 742/974/0038I) Valid (24-Apr-02 to 30-Apr-07)
5* CNP for Civil Works in Penny’s Bay, GW-UW0319-02 Valid (29-Oct-02 to 28-Apr-03)
6* CNP for Civil Works at East of Penny’s Bay, GW-UW0322-02 Valid (30-Oct-02 to 29-Apr-03)
7* CNP for Civil Works and Waterworks at Yam O and Slope works in Area 12A and 12B, GW-UW0320-02 Valid (2-Nov-02 to 1-May-03)
8 CNP for Yam O Reclamation, GW-UW0416-02 Valid (9 Jan 03 to 27 Jun 03)
9* CNP for Yam O Reclamation, GW-UW0329-02 Valid (11 Nov 02 to 10 May 03) Surrendered
10 CNP for Band Drain at Penny’s Bay, GW-UW-0043-03 Valid (25-Feb-03 to 19-Aug-03)
11 CNP for Yam O Reclamation, GW-UW0099-03 Valid (11-Apr-03 to 30-Sep-03)
12 CNP for Civil Works at Penny’s Bay, GW-UW0112-03 Valid (28-Apr-03 to 27-Oct-03)
13 CNP for Civil Works at East of Penny’s Bay, GW-UW0113-03 Valid (28-Apr-03 to 27-Oct-03)
14 CNP for Spoil Dumping at South of Cheung Chau, GW-UW0114-03 Valid (16-Apr-03 to 11-Oct-03)
15 CNP for Tseung Kwan O Area 137, GW-TE0065-03 Valid (23-Apr-03 to 14-Oct-03)
Remarks: * Construction Noise Permit will expire during next reporting month.

Contract No. CV/2000/09 Infrastructure for Penny’s Bay Development – Contract 1 Impact Environmental Monitoring & Audit Report April 2003 Rev. A
K:\2001\014 (Penny Bay Phase I)\Electronic Reporting\2003\Apr 03\R2296 (Apr 03 Rev. A).doc Action-United Environmental Services and Consulting
3.0 AIR QUALITY MONITORING According to the EM&A manual, potential air quality impact arising from the construction is measured in terms of 1-hr (in case of complaints only) and 24-hr Total Suspended Particulates (TSP). The EM&A manual requires that 2 fixed monitoring locations should be set up for regular measurement of 24-hr TSP. The monitoring stations are designated as AM1 and AM2. Monitoring at Luk Keng Tsuen (AM2) has been undertaken by the ET since commencement of works. Data at the Penny’s Bay Gas Turbine Power Station (AM1) were previously collected under a separate CED contract up to 7 December 2002. The ET had taken over the TSP monitoring at AM1 from 8 December 2002 onwards. Since then both AM1 and AM2 had been monitored under this Project.
3.1 MONITORING LOCATIONS The air quality monitoring locations are shown in Table 3-1. The monitoring stations are shown in Appendix D.
Table 3-1 Locations of Air Monitoring Stations
Station ID Name of Location
AM1 Penny’s Bay Gas Turbine Power Station
AM2 Luk Keng Tsuen
3.2 MONITORING FREQUENCY AND METHODOLOGY 3.2.1 Monitoring Frequency
The monitoring parameters and frequency are summarized in Table 3-2.
Table 3-2 Frequency and Duration of Air Quality Monitoring Parameters Frequency Duration 24-hr TSP Once Every 6 Days Throughout the Construction Period 1-hr TSP* 3 Times Every 6 Days Throughout the Construction Period*
* 1-hr TSP is to be carried out in case of any air quality complaint received.
The monitoring schedule summarizing the EM&A activities undertaken in this reporting month is presented in Appendix E.
3.2.2 Monitoring Methodology and Equipment Used The 24-hr TSP and 1-hr TSP (in case of complaints only) monitoring were undertaken in accordance with the standard high volume sampling method as set out in Title 40 of the Code of Federal Regulations Chapter 1 (Part 50) Appendix B.
This method involves the drawing of air at a controlled rate into a High Volume Air Sampler
(HVAS) fitted with a pre-conditioned and pre-weighed filter paper with a unique label. After sampling for 24 hours, the filter paper from AM2 with retained particulates was delivered to ALS Environmental and filter paper from AM1 was delivered to Wellab for drying in a temperature-controlled oven for at least 24 hours before being weighed on an electronic balance with an accuracy down to 0.1 mg. The TSP levels were then calculated from the ratio of the mass of particulates retained on the filter paper to the total volume of air sampled.

Contract No. CV/2000/09 Infrastructure for Penny’s Bay Development – Contract 1 Impact Environmental Monitoring & Audit Report April 2003 Rev. A
K:\2001\014 (Penny Bay Phase I)\Electronic Reporting\2003\Apr 03\R2296 (Apr 03 Rev. A).doc Action-United Environmental Services and Consulting
3.2.3 Monitoring Procedures and Calibration Details Installation The HVAS was placed at the aforesaid locations where are freestanding with no obstruction. The following criteria were considered in the installation of the HVAS.
A horizontal platform with appropriate support to secure the samplers against gusty winds
was provided; No 2 HVASs were placed less than 2 meters apart; The distance between the HVAS and any obstacles, such as buildings, was at least twice
the height that the obstacle protrudes above the HVAS; A minimum of 2 meters separation from walls, parapets and penthouses were required for
rooftop samplers; No furnace or incinerator flues was nearby; Airflow around the sampler was unrestricted; and Permission was obtained to set up the samplers and to obtain access to the monitoring
stations. Preparation of Filter Papers by ALS Environmental and Wellab • Glass-fibre filters, were labeled and sufficient filters that were clean and without pinholes
were selected; • All filters were equilibrated in the conditioning environment for 24 hours before
weighing. The conditioning environment temperature was around 25 °C and not variable by more than ±3 °C; the relative humidity (RH) was < 50% and not variable by more than ±5%. A convenient working RH was 40%; and
• ALS Environmental and Wellab have comprehensive quality assurance and quality control programs for TSP analysis and have attained HOKLAS accreditation for a range of other environmental testing.
Field Monitoring • The power supply was checked to ensure that the HVAS worked properly; • The filter holder and the area surrounding the filter were cleaned; • The filter holder was removed by loosening the four bolts and a new filter, with stamped
number upward, on a supporting screen aligned carefully; • The filter was properly aligned on the screen so that the gasket formed an airtight seal
on the outer edges of the filter; • The swing bolts were fastened to hold the filter holder down to the frame. The
pressure applied should be sufficient to avoid air leakage at the edges; • Then the shelter lid was closed and secured with the aluminum strip; • The HVAS was warmed-up for about 5 minutes to establish run-temperature conditions; • A new flowrate record sheet was set into the flow recorder; • The flow rate of the HVAS was checked and adjusted at around 1.1 m3/min. The range
specified in the EM&A Manual was between 0.6-1.7 m3/min; • The programmable timer was set for a sampling period of 24 hrs + 1 hr, and the starting
time, weather condition and the filter number were recorded; • The initial elapsed time was recorded; • At the end of sampling, the sampled filter was removed carefully and folded in half
length so that only surfaces with collected particulate matter were in contact; • It was then placed in a clean plastic envelope and sealed; • All monitoring information was recorded on a standard data sheet; and • Filters were sent to ALS Environmental and Wellab for analysis.

Contract No. CV/2000/09 Infrastructure for Penny’s Bay Development – Contract 1 Impact Environmental Monitoring & Audit Report April 2003 Rev. A
K:\2001\014 (Penny Bay Phase I)\Electronic Reporting\2003\Apr 03\R2296 (Apr 03 Rev. A).doc Action-United Environmental Services and Consulting
Maintenance & Calibration • The HVASs and their accessories were maintained in good working condition, such as
replacing motor brushes routinely and checking electrical wiring to ensure a continuous power supply;
• HVASs were calibrated every 2 months for single point calibration and every 6 months for 5-point calibration using TE-5025A TISCH Orifice Calibration Kit throughout all stages of the air quality monitoring; and
• The portable dust meter was calibrated by the manufacturer before the instrument was shipped to the site. The zero response of the instrument will be checked before and after each monitoring event.
The equipments used for the air quality monitoring are summarized in Table 3-3. Table 3-3 Air Quality Monitoring Equipment
Equipment Model High Volume Air Sampler GS2310 Thermo Anderson
Calibration Kit TE-5025A TISCH Orifice
Five points calibration at AM1 was calibrated on 27 February 2003 and at AM2 on 1 April 2003. Therefore the next single point calibration will be undertaken on or before 27 April 2003 for AM1 and 1 June 2003 for AM2. A schedule of calibration and any updated calibration certificate/s during this month is presented in Appendix F.
3.3 ACTION AND LIMIT LEVELS
The Action and Limit (A/L) Levels for the air quality monitoring were adopted from the approved baseline monitoring data provided by the Engineer. The A/L Levels for 24-hr and 1-hr TSP monitoring are presented in Tables 3-4 and 3-5 respectively. Table 3-4 Action/Limit Levels for 24-hr TSP Monitoring
Air Monitoring Stations Location Action Level
(µg/m3) Limit Level
(µg/m3) AM1 Penny’s Bay Gas Turbine Power Station 180 260
AM2 Luk Keng Tsuen 185 260 Table 3-5 Action/Limit Levels for 1-hr TSP Monitoring
Air Monitoring Stations Location Action Level
(µg/m3) Limit Level
(µg/m3) AM1 Penny’s Bay Gas Turbine Power Station 325 500
AM2 Luk Keng Tsuen 318 500
The Event and Action Plan (EAP) for air quality monitoring is presented in Appendix G.
3.4 AIR QUALITY MONITORING RESULTS AND AUDITS The air quality monitoring at AM1 and AM2 was carried out by the ET in this reporting month. Five monitoring events were undertaken at each location as described in Appendix E. Altogether there are 10 monitoring events. The monitoring data and graphical presentations of the monitoring results are provided in Appendix H.

Contract No. CV/2000/09 Infrastructure for Penny’s Bay Development – Contract 1 Impact Environmental Monitoring & Audit Report April 2003 Rev. A
K:\2001\014 (Penny Bay Phase I)\Electronic Reporting\2003\Apr 03\R2296 (Apr 03 Rev. A).doc Action-United Environmental Services and Consulting
The meteorological data presented this month was extracted from three stations used by the Hong Kong Observatory. The meteorological data is presented in Appendix J.
All 24-hr TSP levels measured at AM1 and AM2 were below the Action and Limit (A/L) Levels with no exceedance recorded. A complaint on dart smoke emissions was received on 2 April 2003 by the ET. The complaint was investigated and reported on 4 April 2003 and the IEC verified the report on 10 April 2003. Details regarding the complaint are given in Section 7.2.
All 24-hr TSP exceedances in January and February 2003 have not been verified by the IEC and are still outstanding. Also the complaint received on 24 January 2003 is still outstanding and not closed by the IEC.

Contract No. CV/2000/09 Infrastructure for Penny’s Bay Development – Contract 1 Impact Environmental Monitoring & Audit Report April 2003 Rev. A
K:\2001\014 (Penny Bay Phase I)\Electronic Reporting\2003\Apr 03\R2296 (Apr 03 Rev. A).doc Action-United Environmental Services and Consulting
4.0 CONSTRUCTION NOISE MONITORING Construction noise monitoring was conducted at three designated monitoring stations in accordance with the EM&A manual. Construction noise was assessed in terms of the A-weighted equivalent continuous sound pressure level (Leq).
4.1 MONITORING LOCATIONS The three construction noise monitoring stations are shown in Table 4-1 and Appendix D. Table 4-1 Locations of Noise Monitoring Stations
Station ID Name of Location
NM1 Sea Crest Villa (Peng Chau)
NM2 Crestmont Villa (Discovery Bay)
NM3 Luk Keng Tsuen
4.2 MONITORING FREQUENCY AND METHODOLOGY 4.2.1 Monitoring Frequency
The frequency and parameters of the construction noise monitoring are presented in Table 4-2. The monitoring schedule for construction noise monitoring is provided in Appendix E. Table 4-2 Frequency and Parameters of Construction Noise Monitoring
Time Period Duration Parameters Frequency Day (0700 to 1900 hours) 30 min (6 x 5 min) Leq (30min), L90, L10 Evening* (1900 to 2300 hours) 15 min (3 x 5 min) Night* (2300 to 0700 hours next day) 15 min (3 x 5 min) Leq (5min), L90, L10
Once every six days throughout the construction period
* Construction noise monitoring to be conducted when construction work takes place during restricted hours.
4.2.2 Monitoring Methodology and Equipment Used Regular construction noise measurements were made in terms of the A-weighted equivalent continuous sound pressure level (Leq). Leq (30 min) in six consecutive Leq (5 min) measurements were taken for the time period between 0700-1900 hours on weekdays. During restricted hours, three consecutive Leq (5 min) measurements were taken. The sound level meters used comply with the specifications of the International Electrical Commission (IEC) Publication 651:1979 (Type I) and 804:1995 (Type I). The sound level meter was mounted on a tripod at a height of 1.2 m and placed at the assessment point. The meter was oriented such that the microphone was pointing to the site with the microphone facing perpendicular to the line of sight. A windshield was fitted with the sound level meter throughout all measurements. Field observation of dominant noise sources and/or possible influencing factors at each location was recorded during monitoring. The sound level meter was calibrated using an acoustic calibrator, prior to and after each set of measurements. The meter is delivered to the manufacturer or a qualified HOKLAS laboratory for calibration annually. Table 4-3 details the noise monitoring equipment used.

Contract No. CV/2000/09 Infrastructure for Penny’s Bay Development – Contract 1 Impact Environmental Monitoring & Audit Report April 2003 Rev. A
K:\2001\014 (Penny Bay Phase I)\Electronic Reporting\2003\Apr 03\R2296 (Apr 03 Rev. A).doc Action-United Environmental Services and Consulting
A schedule of calibration certificates of the monitoring equipment is presented in Appendix F.
Table 4-3 Construction Noise Monitoring Equipment Equipment Model
Integrating Sound Level Meter B&K Type 2238 Acoustics Calibrator B&K Type 4231 Integrating Sound Level Meter Rion NL-31 Acoustics Calibrator Rion NC-73 Handheld Anemometer Testo Anemometer
4.2.3 Monitoring Procedures and Calibration Details
Field Monitoring • The sound level meter was set on a tripod at a height of 1.2 m above ground; • For free field measurement, the meter was positioned away from any nearby reflective
surfaces. For reference, a correction of +3dB(A) was made to the free field measurements;
• The battery condition was checked to ensure the correct functioning of the meter; • Parameters such as frequency weighting, time weighting and measurement time were set as
follows: − Frequency weighting : A − Time weighting : Fast − Time measurement : 30 minutes (Regular Hours) / 15 minutes (Restricted Hours)
• Prior to and after each noise measurement, the meter was calibrated using a calibrator for 94 dB at 1000 Hz. If the difference in the calibration level before and after measurement was more than 1 dB(A), the measurement would be considered invalid and repeat of noise measurement would be required after re-calibration or repair of the equipment;
• The wind speed was frequently checked with a portable wind meter; • During the monitoring period, the Leq, L90 and L10 were recorded. In addition, site
conditions and noise sources were recorded on a standard record sheet. The L90 and L10 levels were kept for quality control proposes only. They would not be used for determination of environmental compliance;
• During normal construction working hours (0700-1900 hours Monday to Saturday), monitoring of LAeq, 30min noise levels (as six consecutive LAeq, 5min readings) were carried out. As restricted hours works will be undertaken, monitoring of LAeq, 5min noise levels will be carried out and three consecutive LAeq, 5min reading will be taken to ensure the validity of the results;
• Noise measurements are paused during periods of high intrusive noise (e.g. dog barking, helicopter noise) if possible. Observations were recorded when intrusive noise was unavoidable; and
• Noise monitoring is cancelled in the presence of fog, rain and wind with a steady speed exceeding 5 m/s, or wind with gusts exceeding 10 m/s.
Maintenance and Calibration • The microphone head of the sound level meter and calibrator is cleaned with soft cloth at
quarterly intervals; and • The meter is sent to the supplier or HOKLAS laboratory to check and calibrate at yearly
intervals.
4.3 ACTION AND LIMIT LEVELS The Action/Limit Levels for construction noise monitoring were adopted from the approved baseline monitoring data provided by the Engineer. Table 4-4 presents the established A/L Levels for the construction noise monitoring.

Contract No. CV/2000/09 Infrastructure for Penny’s Bay Development – Contract 1 Impact Environmental Monitoring & Audit Report April 2003 Rev. A
K:\2001\014 (Penny Bay Phase I)\Electronic Reporting\2003\Apr 03\R2296 (Apr 03 Rev. A).doc Action-United Environmental Services and Consulting
Table 4-4 Action/Limit Levels for Construction Noise Monitoring
Time Period Monitoring Station Action Level Limit Level*
Normal Hours 0700-1900 hours on normal weekdays NM1, NM2 and NM3 75 dB(A)
0700-2300 hours on holidays; and 1900-2300 hours on all other days
NM1 & NM2: 60 dB(A) NM3: 65 dB(A) Restricted
Hours 2300-0700 hours of next day
NM1, NM2 and NM3
When one documented complaint is
received NM1 & NM2: 45 dB(A)
NM3: 50 dB(A) * NM1 and NM2 have been assigned an Area Sensitivity Rating of “A” and NM3 of “B” according to noise
assessment procedures laid down in the Environmental Impact Assessment Ordinance (Cap. 499) and Noise Control Ordinance (Cap. 400). Therefore the Limit Levels for NM1 & NM2 are different from NM3 during Restricted Hours.
The Event and Action Plan (EAP) for construction noise monitoring is presented in Appendix G.
4.4 NOISE MONITORING RESULTS AND AUDITS
The construction noise monitoring was carried out at 3 designated monitoring stations. A summary of the construction noise measurements is listed below:
• Daytime Noise Monitoring 15 Occasions • Restricted-hours Noise Monitoring (1900-2300 hours) 15 Occasions • Restricted-hours Noise Monitoring (2300-0700 hours next day) 15 Occasions The noise monitoring results are tabulated in Table 4-5 and depicted in Appendix I. It has been determined in each monthly EM&A report since December 2001 that the overall noise levels were not due to this Project. Table 4-5 Summary of Daytime Noise Monitoring Results
NM1 NM2 NM3 Date
Start Time Leq(30) dB(A) Start Time Leq(30) dB(A) Start Time Leq(30) dB(A)28-Mar-03 15:00 66.8 13:00 51.9 14:15 59.9 3-Apr-03 11:30 57.8 14:10 48.8 16:00 61.0 9-Apr-03 17:00 61.8 15:00 57.2 16:30 67.1
15-Apr-03 13:00 55.4 10:35 56.4 17:35 61.9 21-Apr-03 10:00 53.1 17:45 51.3 14:15 64.2
Action Level Upon Receipt of a Documented Noise Complaint (No complaint was received in this reporting month)
Limit Level 75 dB(A) 75 dB(A) 75 dB(A) Compliance % 100%
The restricted-hours noise monitoring results are tabulated in Tables 4-6 and 4-7 respectively. The plots of the monitoring results are presented in Appendix I.

Contract No. CV/2000/09 Infrastructure for Penny’s Bay Development – Contract 1 Impact Environmental Monitoring & Audit Report April 2003 Rev. A
K:\2001\014 (Penny Bay Phase I)\Electronic Reporting\2003\Apr 03\R2296 (Apr 03 Rev. A).doc Action-United Environmental Services and Consulting
Table 4-6 Summary of Restricted-hours Noise Monitoring Results (1900-2300 hours) – Evening
NM1 NM2 NM3 Date Start
Time Leq(5) dB(A) Start Time Leq(5) dB(A) Start
Time Leq(5) dB(A)
28-Mar-03 22:45 50.6 47.9 48.1 22:45 43.8 43.6 50.6 22:45 55.1 67.3 54.1 3-Apr-03 22:45 48.7 49.5 48.8 22:45 50.6 51.2 52.7 22:45 52.6 52.8 53.2 9-Apr-03 22:45 57.2 58.0 56.3 22:45 58.0 57.2 56.3 22:40 59.9 67.9 60.2
15-Apr-03 22:45 51.9 48.5 49.7 22:45 54.8 51.0 57.9 22:45 58.9 58.2 60.5 21-Apr-03 22:45 51.6 49.8 51.7 22:45 51.0 49.4 52.5 22:45 55.4 55.9 56.1
Leq 5 (min) Action Level
Upon Receipt of a Documented Noise Complaint (No complaint was received in this reporting month)
Leq 5 (min) Limit Level 60 dB(A) 60 dB(A) 65 dB(A)
Compliance % 95.6% Notes: Limit Level of 60 dB(A) means figures of 60.4 dB(A) or below. Limit Level of 65 dB(A) means figures of 65.4 dB(A) or below.
Figures in BOLD denote Limit-level exceedances. Table 4-7 Summary of Restricted-hours Noise Monitoring Results (2300-0700 hours next
day) – Night
NM1 NM2 NM3 Date Start
Time Leq(5) dB(A) Start Time Leq(5) dB(A) Start Time Leq(5) dB(A)
28-Mar-03 23:00 50.8 51.0 50.6 23:00 52.2 46.2 44.5 23:00 57.8 54.9 54.7 3-Apr-03 23:00 50.2 50.8 51.0 23:00 52.6 53.7 51.2 23:00 54.2 54.5 53.6 9-Apr-03 23:00 56.7 56.8 58.2 23:00 55.6 57.4 55.1 23:00 61.0 60.5 59.5
15-Apr-03 23:00 49.3 54.1 51.0 23:00 51.4 51.7 52.6 23:00 57.8 56.7 57.4 21-Apr-03 23:00 51.9 50.8 50.9 23:00 49.7 49.5 50.2 23:00 56.1 55.6 55.2
Leq 5 (min) Action Level
Upon Receipt of a Documented Noise Complaint (No complaint was received in this reporting month)
Leq 5 (min) Limit Level 45 dB(A) 45 dB(A) 50 dB(A)
Compliance % 0% Notes: Limit Level of 45 dB(A) means figures of 45.4 dB(A) or below. Limit Level of 50 dB(A) means figures of 50.4 dB(A) or below. Figures in BOLD denote Limit-level exceedances. Restricted-hours (1900-2300 hours) – Evening
Two Limit-level exceedances were recorded at NM3 on 28 March and 9 April 2003. Site observations indicated that the most noticeable noise sources at the time of monitoring were MTR Airport Express trains and aircrafts. Restricted-hours (2300-0700 hours next day) – Night
Fifteen Limit-level exceedances in total were recorded at all 3 noise monitoring stations on 28 March, 3, 9, 15 and 21 April 2003. For the noise exceedances recorded at NM1 and NM2, site records indicated that no construction activity was observed at the time of monitoring and the major sound sources were from human activities, aircrafts and ferries. All noise levels measured at NM1 and NM2 were either within the range of baseline levels between 47.3 dB(A) and 77.7 dB(A) for NM1 and between 42.8 dB(A) and 69.6 dB(A) for NM2. The ET’s investigation reports confirmed

Contract No. CV/2000/09 Infrastructure for Penny’s Bay Development – Contract 1 Impact Environmental Monitoring & Audit Report April 2003 Rev. A
K:\2001\014 (Penny Bay Phase I)\Electronic Reporting\2003\Apr 03\R2296 (Apr 03 Rev. A).doc Action-United Environmental Services and Consulting
that the exceedances were unlikely to be due to the Project. The reports were verified and closed by the IEC. For the noise exceedances recorded at NM3, site records indicated that one derrick barge was in operation on 9, 15 and 21 April 2003. The operation noise from the plants was not significant. No plant operation took place on 28 March and 3 April 2003. Site observations noted that noise sources during measurements were mainly either from MTR Air-Express trains and/or aircrafts. All measured noise levels were within the range of baseline levels between 41.1 dB(A) and 73.9 dB(A) The ET’s investigation reports concluded that the exceedances were unlikely to be due to the Project. All investigation reports were verified and closed by the IEC.
The monitoring schedule for construction noise monitoring activities is presented in Appendix E. Restricted-hours Noise Monitoring (1900-0700 hours next day) – Evening and Night
During restricted hours (both evening and night), the overall compliance rate is 48.9% from data shown in Tables 4-6 and 4-7. The overall compliance rate for restricted hours noise measurements increased compared to last month. In summary, site observations by the ET indicated that the dominant noise sources were mostly background noise e.g. traffic, aircrafts, ferries, sea waves and vegetation rustling. The IEC considered that all exceedances were unlikely to be due to the Project and verified the investigation reports of the ET.

Contract No. CV/2000/09 Infrastructure for Penny’s Bay Development – Contract 1 Impact Environmental Monitoring & Audit Report April 2003 Rev. A
K:\2001\014 (Penny Bay Phase I)\Electronic Reporting\2003\Apr 03\R2296 (Apr 03 Rev. A).doc Action-United Environmental Services and Consulting
5.0 MARINE WATER QUALITY MONITORING 5.1 MONITORING LOCATIONS
Marine water quality monitoring was undertaken at 12 designated locations as shown in Table 5-1. The monitoring stations are shown in Appendix D.
Table 5-1 Locations of Marine Water Monitoring Stations
Type Monitoring Location HK Metric Grid E HK Metric Grid N CS1 818 678 823 526 CS2 817 764 820 890 CS3 826 137 822 377 CS6 825 871 824 880
Marine Control Stations
CS7 824 506 821 250 G5 821 272 822 301 G6 822 500 823 400 Gradient
Stations G7 820 729 821 862 SR4 823 827 823 208 SR5 823 827 823 705 SR6 824 511 823 518
Sensitive Receiver Stations
SR7 823 810 823 590
5.2 MONITORING FREQUENCY AND METHODOLOGY 5.2.1 Monitoring Parameters and Frequency
The monitoring parameters and frequency of the marine water monitoring are summarized in Table 5-2. The monitoring schedule summarizing the water monitoring activities in this reporting month is presented in Appendix E. Table 5-2 Water Quality Monitoring Parameters and Frequency
Monitoring Station Parameters Frequency Sensitive Receiver (SR) Stations: SR4, SR5, SR6 & SR7 Control Stations: CS1, CS2, CS3, CS6 & CS7 Gradient Stations: G5, G6 & G7
Depth (m); Temperature (oC); Salinity (ppt); DO (mg/L); DO Saturation (%); Turbidity (NTU); and SS (mg/L).
3 times a week, mid-ebb and mid- flood at 3 depths in the course of
marine works
5.2.2 Monitoring Methodology and Equipment Used
A Digital Global Positioning System (DGPS) was used to identify the designated monitoring stations prior to water sampling. A portable, battery-operated echo sounder was used for the determination of water depth at each station. At each station, marine water samples were collected at three depths: 1m below water surface, 1m above sea bottom and at mid-depth when the water depth exceeded 6m. Samples at 1m below water surface and 1m above sea bottom are collected when the water depth is between 3m and 6m. Only 1 sample at mid-depth is taken when the water depth is below 3m. The marine water sampler is lowered into the water body at the predetermined depth. The trigger system of the sampler is activated with a messenger. The opening ends of the sampler are then closed accordingly and water samples are collected.

Contract No. CV/2000/09 Infrastructure for Penny’s Bay Development – Contract 1 Impact Environmental Monitoring & Audit Report April 2003 Rev. A
K:\2001\014 (Penny Bay Phase I)\Electronic Reporting\2003\Apr 03\R2296 (Apr 03 Rev. A).doc Action-United Environmental Services and Consulting
The sample container was rinsed with a portion of the water sample. The water sample was then transferred to the container, labelled with a unique sample number and sealed with a screw cap. Before commencement of the sampling, general information such as the date and time of sampling, weather condition and tidal condition as well as the personnel responsible for the monitoring are recorded on the monitoring field data sheet. At each measurement/sampling depth, two consecutive measurements of dissolved oxygen (DO), dissolved oxygen saturation (DOS) and turbidity are taken. The probes are retrieved out of the water after the first measurement and then re-deployed for the second measurement. Where the difference in the value between the first and second readings of each set is more than 25% of the value of the first reading, the reading is discarded and further readings are taken. Maintenance and Calibration Before each round of monitoring, the dissolved oxygen probe of YSI DO 58 was calibrated by the wet bulb method.
Before each round of monitoring, a zero check in distilled water was performed with the turbidity meter of HACH 2100P and WTW Turb 350IR. The probe was then calibrated with a solution of known NTU. The marine water samples were stored in high-density polythene bottles and packed in a cool box maintained at 4OC. The water samples were then delivered to ALS Environmental on the same day or within the holding time for the required analyses. The YSI Model 6820 Multi-parameter Water Quality Monitoring System, which automates the measurements and data-logging of temperature, dissolved oxygen, dissolved oxygen saturation, turbidity and salinity simultaneously was also used. Before each round of monitoring, the dissolved oxygen probe was calibrated by wet bulb method and the turbidity and salinity probes checked with distilled water. The equipment that was used for the marine water monitoring is summarized in Table 5-3. A schedule of calibration certificates of the monitoring equipment is presented in Appendix F. The analysis of suspended solids concentrations follows the APHA Standard Methods for the Examination of Water and Wastewater 19ed 2540D. ALS Environmental has comprehensive quality assurance and quality control programs and has attained HOKLAS accreditation for a range of environmental testing. For QA/QC procedures, one duplicate sample of every batch of 20 samples was analyzed as required by the HOKLAS. The QA/QC results are summarized in Appendix K.

Contract No. CV/2000/09 Infrastructure for Penny’s Bay Development – Contract 1 Impact Environmental Monitoring & Audit Report April 2003 Rev. A
K:\2001\014 (Penny Bay Phase I)\Electronic Reporting\2003\Apr 03\R2296 (Apr 03 Rev. A).doc Action-United Environmental Services and Consulting
Table 5-3 Marine Water Quality Monitoring Equipment
Type of Analysis Parameters Equipment / Laboratory Coordinate of Monitoring Stations and
Vessel Location Digital Global Positioning System (DGPS)
Dissolved Oxygen Concentration and Temperature YSI DO Meter 58
Salinity WTW 83362 or 82362 Conductivity Meter Turbidity HACH 2100P or WTW Turb 350IR Dissolved Oxygen Concentration and
Temperature, Salinity and Turbidity YSI Model 6820 Multi-parameter WaterQuality Monitoring System
In Situ Measurement
Water Depth Fish ID128 Laboratory Analysis Suspended Solids ALS Environmental
5.3 ACTION AND LIMIT LEVELS
The Action/Limit Levels for marine water quality monitoring are presented in Table 5-4. Table 5-4 Action/Limit Levels for Marine Water Quality Monitoring
Parameter Action Limit Surface & Mid-depth 3.6 3.2 DO (mg/L) Bottom 3.5 2.0
Turbidity (NTU) 14.6 and 120% of upstream control station’s turbidity at the same tide of the same day
20.8 and 130% of upstream control station’s turbidity at the same tide of the same day
SS (mg/L) 19.0 and 120% of upstream control station’s SS at the same tide of the same day
39.0 and 130% of upstream control station’s SS at the same tide of the same day
During mid ebb marine water quality monitoring, the control station for all sensitive receivers (SR4, SR5, SR6 and SR7) is CS1. For the mid flood monitoring, the control station for the sensitive receivers SR4, SR5 and SR7 is CS7; and for the sensitive receiver SR6 is CS3. The Event and Action Plan (EAP) for water quality monitoring is presented in Appendix G.
5.4 MARINE WATER MONITORING RESULTS AND AUDITS Water quality monitoring was carried out at 12 designated monitoring locations to gauge the impact due to marine works at the Yam O reclamation site. There are a total of 13 monitoring days in this reporting month. Details of the monitoring schedule for marine water monitoring activities are presented in Appendix E. The marine water monitoring results in this reporting month are graphically illustrated in Appendix L and summarized in Appendix M.

Contract No. CV/2000/09 Infrastructure for Penny’s Bay Development – Contract 1 Impact Environmental Monitoring & Audit Report April 2003 Rev. A
K:\2001\014 (Penny Bay Phase I)\Electronic Reporting\2003\Apr 03\R2296 (Apr 03 Rev. A).doc Action-United Environmental Services and Consulting
5.4.1 Dissolved Oxygen, Turbidity and Suspended Solids A summary of any marine water exceedances during this reporting month is presented in Table 5-5. There were two Action-level suspended solids exceedances recorded on 18 April 2003. The exceedances were recorded at SR4 during mid-ebb tide and at SR6 during mid-flood tide.
The water flow during mid-flood tide was from SR6 to the works area. Therefore, the mid-flood exceedance is not likely to be due to the Project. The water flow during mid-ebb was from the works area to SR4. However, Gradient Stations G7, G5 and G6, which are in the immediate vicinity of the works area, recorded no exceedances and had values lower than that recorded at SR4. Therefore, the mid-ebb exceedance at SR4 is unlikely to be caused by the Project. No Further Exceedance was recorded and subsequent SS results were all below the Action Level. An investigation report submitted by the ET has not yet been verified.
Table 5-5 Summary of Marine Water Quality Exceedances
DO Turbidity SS Total Station Exceedance
Level Ebb Flood Ebb Flood Ebb Flood Ebb Flood Action 0 0 0 0 1 0 0 0 SR 4 Limit 0 0 0 0 0 0 0 0
Action 0 0 0 0 0 0 0 0 SR 5 Limit 0 0 0 0 0 0 0 0 Action 0 0 0 0 0 1 0 0 SR 6 Limit 0 0 0 0 0 0 0 0 Action 0 0 0 0 0 0 0 0 SR 7 Limit 0 0 0 0 0 0 0 0 Action 0 0 0 0 1 1 2 Total Limit 0 0 0 0 0 0 0
Notes: Figures in BOLD denote marine water quality exceedances.
Contract No. CV/2000/09 Infrastructure for Penny’s Bay Development – Contract 1 Impact Environmental Monitoring & Audit Report April 2003 Rev. A
K:\2001\014 (Penny Bay Phase I)\Electronic Reporting\2003\Apr 03\R2296 (Apr 03 Rev. A).doc Action-United Environmental Services and Consulting
6.0 ECOLOGICAL MONITORING 6.1 TERRESTRIAL ECOLOGY 6.1.1 Monitoring Location
The monitoring location of the White-bellied Sea Eagles (WBSEs) is on Pa Tau Kwu in accordance with the EM&A Manual. The monitoring location is shown in Appendix D.
6.1.2 Monitoring Parameters and Frequency Field surveys for White-bellied Sea Eagles are required twice per month during periods of breeding season (October to April), and once per month at other times of the year. Information on the responses of White-bellied Sea Eagles to any disturbances, their behaviour, and breeding activities were recorded during the survey.
6.1.3 Monitoring Methodology
The monitoring is undertaken on Pa Tau Kwu about 100 m from the nest to avoid disturbance to the normal behaviour of the White-bellied Sea Eagles. Activities of the White-bellied Sea Eagles, including feeding, perching/roosting, preening, soaring, flying, nesting, and territorial guarding and the time spent on each activity, are recorded. The responses and reactions to any disturbance to the White-bellied Sea Eagles are also recorded and examined in conjunction with the construction noise and/or other events related to the works. The Event and Action Plan for the monitoring of White-bellied Sea Eagles is shown in Appendix G
6.1.4 Monitoring Equipment The monitoring equipment includes binoculars (10x) and field-scope (20-60x).
6.1.5 Monitoring Results and Audits
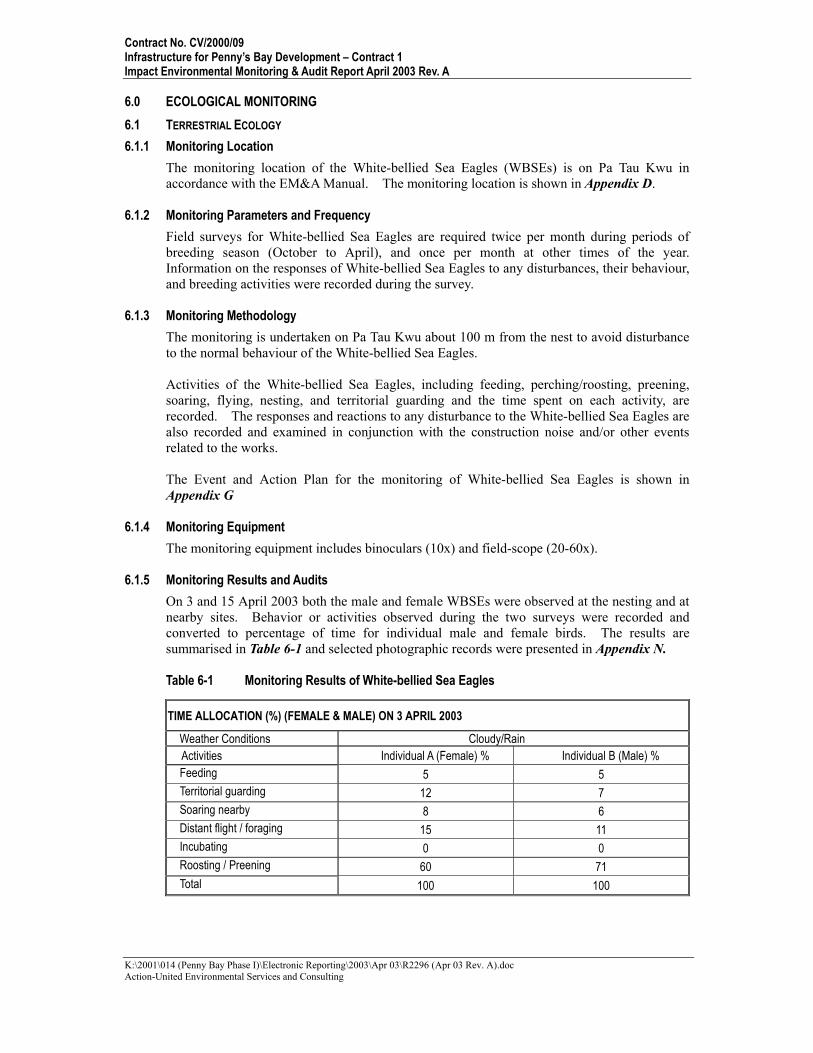
On 3 and 15 April 2003 both the male and female WBSEs were observed at the nesting and at nearby sites. Behavior or activities observed during the two surveys were recorded and converted to percentage of time for individual male and female birds. The results are summarised in Table 6-1 and selected photographic records were presented in Appendix N.
Table 6-1 Monitoring Results of White-bellied Sea Eagles
TIME ALLOCATION (%) (FEMALE & MALE) ON 3 APRIL 2003
Weather Conditions Cloudy/Rain Activities Individual A (Female) % Individual B (Male) % Feeding 5 5 Territorial guarding 12 7 Soaring nearby 8 6 Distant flight / foraging 15 11 Incubating 0 0 Roosting / Preening 60 71 Total 100 100

Contract No. CV/2000/09 Infrastructure for Penny’s Bay Development – Contract 1 Impact Environmental Monitoring & Audit Report April 2003 Rev. A
K:\2001\014 (Penny Bay Phase I)\Electronic Reporting\2003\Apr 03\R2296 (Apr 03 Rev. A).doc Action-United Environmental Services and Consulting
TIME ALLOCATION (%) (FEMALE & MALE) ON 15 APRIL 2003
Weather Conditions Cloudy Activities Individual A (Female) % Individual B (Male) % Feeding 0 2 Territorial guarding 5 3 Soaring nearby 10 5 Distant flight / foraging 18 8 Incubating 0 0 Roosting / Preening 67 82 Total 100 100
Note: Distant flight/foraging includes out of sight time.
Results of behavior monitoring showed that the female WBSE is relatively more active than those recorded for the male WBSE. About 60 to 67% of the total time for the female bird was spent on roosting/preening, while the male bird spent about 71 to 82% of the time roosting/ preening. The birds spent some proportion of time on distant flight, foraging, feeding, territory guarding and soaring (0 – 15%). No feeding activities were observed on 15
April 2003 for the female bird although the bird might have feed outside the monitoring area or time period.
During observations on the feeding and territorial area of the monitored WBSEs, it was noticed that their territory overlapped with the territory of some Black Kites, which is the most abundant bird of prey in Hong Kong. Therefore, territory guarding activities of the WBSEs were often observed against the Black Kites.
The incubation activity of the female bird observed in January and February was not observed in March or April. No chick feeding or juvenile/s were observed this month. Together with the data recorded last month, monitoring results would indicate that the breeding of birds has been unsuccessful. However, other observed activities of the WBSEs were normal and no noticeable disturbance to the WBSEs was observed due to the Project.
6.2 RARE/RESTRICTED/PROTECTED PLANT SPECIES A total of 98 plants of Schoenus falcatus and three patches of Eriocaulon merrilli had been transplanted from the project site in Penny’s Bay to the receptor sites at Sze Pak Wan on 13 and 14 January 2003. The third monthly report was provided by CSCE separately on the status of the transplanted rare/restricted plant species Schoenus falcatus and Eriocaulon merrilli for the monthly period from 15 March 2003 to 15 April 2003. All transplanted individuals of Schoenus falcatus and Eriocaulon merrilli were still alive during the month. Most of the transplanted Schoenus falcatus individuals showed improvement from the previous monitoring session. Thirteen transplanted Schoenus falcatus individuals were recorded to have flowers with new roots and strong rhizomes observed indicating self-regeneration of the plants. The overall condition of the transplanted Schoenus falcatus was noted as good and the Eriocaulon merrilli acceptable.
6.3 MARINE MAMMAL MONITORING 6.3.1 Monitoring Location
The location for marine mammal monitoring is along the shore of North Lantau. Detailed information on the monitoring location including transect lines and coordinates have been provided by the Agriculture, Fisheries and Conservation Department (AFCD). The monitoring location is shown in Appendix D.

Contract No. CV/2000/09 Infrastructure for Penny’s Bay Development – Contract 1 Impact Environmental Monitoring & Audit Report April 2003 Rev. A
K:\2001\014 (Penny Bay Phase I)\Electronic Reporting\2003\Apr 03\R2296 (Apr 03 Rev. A).doc Action-United Environmental Services and Consulting
6.3.2 Monitoring Parameters and Frequency The marine mammal monitoring is undertaken twice per month. Presence, location and characteristics of dolphin and finless porpoise are recorded during the survey.
6.3.3 Monitoring Methodology A critical consideration in the survey is to ensure a strict timed quantification of “sighting effort” in order to maximise the comparative value of the field survey results. The time and position for the start and end of a period of intensive, uninterrupted effort and the sighting conditions associated with it are recorded. The collection of effort data allows comparisons to be made with a single study as well as between studies. Strict recording of time, speed, position and distance traveled along the designated transect (“on-effort”) are recorded. Time spent during any deviation from the transect is recorded as “off-effort”. This effort data allows dolphin abundance to be calculated using line transect methodology. Vessel-based transect observations by a 4-person team are conducted by searching the 180o
degree swath in front of the survey vessel (270o – 90o). The area behind the vessel is not searched, although dolphins observed here can be recorded as off-effort sightings. There are four survey personnel on board the vessel. A primary observer scans the entire search path (270o – 90o) continuously with 7x50 marine binoculars with the second member of the team designates the data recorder, scans the same area with naked eyes and occasional binocular checks. The third observer rotates into the observation team after half an hour, thus relieving one of the initial team members. Observers are shifted every half-hour. While on-effort, observers are instructed to ignore potential sighting cues that can bias the sighting distance calibration (e.g. pair-trawl fishing vessels). Survey personnel are alert at all times during the surveying period. However, during periods of poor weather, when visibility is hindered or when Beaufort force 5 is reached, the survey is temporarily postponed. It is important to maximise survey time and therefore minimise off-transect observations and photo ID-work. The initial sighting distance between the dolphin and the survey vessel and sighting angle is recorded in order to make estimates using line transect analysis. These and other details of the sighting, including the exact location of the sighting, are discussed among the observation team and record immediately. Distances and angles are made as accurate as possible. A Global Positioning System (GPS) is available onboard during every field survey. Sighting records for the initial sighting with time, position, distance, and angle data are recorded during the survey, and verified between primary observer and data recorder. All other information, such as sea state, weather conditions (Beaufort Scale), as well as notes on dolphin group size, age classes, behaviour, association with fishing boat, direction of movement, response to boat and others are completed at the end of the sighting. Standard forms for all dolphin monitoring are used.
6.3.4 Monitoring Equipment A list of the equipment to be used for the marine mammal monitoring is presented as follows:
Equipment Model Global Positioning System (GPS) Magellan NAV 5000D
Camera Canon auto-focus camera with 300m zoom lens Laser Binoculars Busnell Yardage Pro Marine Binoculars Fujinon 7 × 50 marine binocular with compass

Contract No. CV/2000/09 Infrastructure for Penny’s Bay Development – Contract 1 Impact Environmental Monitoring & Audit Report April 2003 Rev. A
K:\2001\014 (Penny Bay Phase I)\Electronic Reporting\2003\Apr 03\R2296 (Apr 03 Rev. A).doc Action-United Environmental Services and Consulting
6.3.5 Monitoring Results and Audits Marine mammal surveys were conducted on 2 and 16 April 2003. On-effort monitoring on 2 April 2003 was abandoned due to unstable weather conditions. The survey team decided to maximise the search effort in key areas, which included the vicinity of the work site, the area around the Brothers' Island and along the coast between Siu Ho and Tung Chung. No sighting was recorded on 2 April 2003. An on-effort survey was conducted on 16 April 2003 and no sighting was recorded for that day either. No direct impacts on the marine mammals attributable to the Project were observed.
The number of marine mammals sightings decreases from December 2002 to April 2003. Although no dolphins were spotted during both survey efforts made in the north-western Lantau area, the current data supports the general consensus that the Chinese White Dolphins frequent less around Brothers’ Island and eastward during winter (December – February) and spring (March – May) months.
The field data sheets are presented in Appendix O. No photograph has been taken for the marine mammal surveys this month.

Contract No. CV/2000/09 Infrastructure for Penny’s Bay Development – Contract 1 Impact Environmental Monitoring & Audit Report April 2003 Rev. A
K:\2001\014 (Penny Bay Phase I)\Electronic Reporting\2003\Apr 03\R2296 (Apr 03 Rev. A).doc Action-United Environmental Services and Consulting
7.0 ENVIRONMENTAL NON-CONFORMANCE 7.1 SUMMARY OF MONITORING EXCEEDANCES
Air Quality Monitoring No 24-hr TSP exceedance was recorded this month. Construction Noise Monitoring No exceedance on daytime construction noise was recorded this month. For restricted-hour noise monitoring, two Limit-level exceedances were recorded at NM3 during restricted hours (1900-2300 hours) - evening and 15 Limit-level exceedances were recorded at all monitoring stations during restricted hours (2300-0700 hours next day) - night. All measured noise levels, however, were within the baseline noise levels. Details of the monitoring exceedances are presented in Appendix Q. The ET’s investigation reports were verified by the IEC.
Marine Water Quality Monitoring There were two Action-level suspended solids exceedances recorded on 18 April 2003. The exceedances were recorded at SR4 during mid-ebb tide and at SR6 during mid-flood tide. However, both exceedances were considered not project related by the ET. An investigation report submitted by the ET is awaiting verification by the IEC.
7.2 SUMMARY OF ENVIRONMENTAL COMPLAINTS
One environmental complaint for dark smoke was lodged by EPD on 28 March 2003 and received by the ET on 2 April 2003. ET investigation revealed that the incident probably took place on 22 March 2003, when an excavator was stopped from operation by CSCE near the Penny’s Bay Gas Turbine Power Station due to emissions of dark smoke. The responsible sub-contractor was prevented from using that excavator until proper maintenance was completed. The ET submitted an investigation report on 4 April 2003 and the IEC closed the complaint on 10 April 2003. A statistical summary of environmental complaints since project commencement is presented in Table 7-1.

Contract No. CV/2000/09 Infrastructure for Penny’s Bay Development – Contract 1 Impact Environmental Monitoring & Audit Report April 2003 Rev. A
K:\2001\014 (Penny Bay Phase I)\Electronic Reporting\2003\Apr 03\R2296 (Apr 03 Rev. A).doc Action-United Environmental Services and Consulting
Table 7-1 Statistical Summary of Environmental Complaints Complaint Statistics Reporting Month Frequency Cumulative Complaint Nature
December 2001 0 0 NA January 2002 0 0 NA February 2002 0 0 NA
March 2002 0 0 NA April 2002 0 0 NA May 2002 0 0 NA June 2002 0 0 NA July 2002 0 0 NA
August 2002 0 0 NA September 2002 0 0 NA
October 2002 1 1 Noise November 2002 2 3 Water Pollution December 2002 0 3 NA January 2003 1 4 Air Pollution February 2003 0 4 NA
March 2003 0 4 NA April 2003 1 5 Air Pollution
7.3 ENVIRONMENTAL SUMMONS
No summon was received in this reporting month. A statistical summary of legal proceedings since project commencement is presented in Table 7-2.
Table 7-2 Statistical Summary of Environmental Summons Summon Statistics Reporting Month
Frequency Cumulative Nature of Summons December 2001 0 0 NA January 2002 0 0 NA February 2002 0 0 NA
March 2002 0 0 NA April 2002 0 0 NA May 2002 0 0 NA June 2002 0 0 NA July 2002 0 0 NA
August 2002 0 0 NA September 2002 0 0 NA
October 2002 0 0 NA November 2002 0 0 NA December 2002 0 0 NA January 2003 0 0 NA February 2003 0 0 NA
March 2003 0 0 NA April 2003 0 0 NA

Contract No. CV/2000/09 Infrastructure for Penny’s Bay Development – Contract 1 Impact Environmental Monitoring & Audit Report April 2003 Rev. A
K:\2001\014 (Penny Bay Phase I)\Electronic Reporting\2003\Apr 03\R2296 (Apr 03 Rev. A).doc Action-United Environmental Services and Consulting
8.0 WASTE MANAGEMENT Waste management audit was carried out by the ET on 15 April 2003 on a monthly basis. The weekly joint site inspections attended by representatives of the IEC, the Engineer, the CSCE and the ET also covered general waste management issues on site. The audit findings were recorded and some key observations were presented as follows: ET’s Waste Audit Findings:
Oil drums were not in drip trays and might lead to soil contamination from spillage of fuel;
Licensed waste haulers were used for waste collection; General refuse was disposed of at licensed sites; 1,400L of chemical waste was recorded; Recycling of construction and demolition waste has not been implemented; and 679.3 Kg of metal and paper were collected for recycling in this reporting month.
Joint Inspection Findings:
No drip trays were used for some oil drums stored within workshop areas; Oil contaminated soil found in workshop areas; Chemical waste drums were not properly labelled; Discharge of excavation water directly into adjacent seawall and; Chemical waste storage area is needed at each workshop.
Records of Waste Quantities
All types of waste arising from the construction work are classified into the following
Excavated material; Construction & demolition (C&D) material; Chemical waste; Dredged materials; and General refuse.
The quantities of waste for disposal in this reporting month are summarized in Tables 8-1 and 8-2. Over half of the materials were reused on-site as far as practicable. Table 8.1 Summary of Quantities of Waste for Disposal
Type of Waste Quantity Disposal Location
Excavated Material (Spent lube oil contaminated soil) (m3) 0 Collected by World Environmental Services Ltd
Excavated Material (Uncontaminated) (m3) NA# No Off-site Disposal Broken Rock (m3) NA# No Off-site Disposal Construction & Demolition Material (Inert) (m3) NA# No Off-site Disposal Construction & Demolition Material (Non-inert) (m3) Nil NA Asbestos C&D Materials (m3)* Nil SENT Landfill Chemical Waste (Litres) 1400 Collected by Enviropace Limited Waste Water Collected for Off-site Treatment (m3) 276 Pillar Point Sewage Screening Plant General Refuse (m3) 54 SENT Landfill Dredged Materials (m3) Nil South Cheung Chau # Any excavated materials generated were reused on site.

Contract No. CV/2000/09 Infrastructure for Penny’s Bay Development – Contract 1 Impact Environmental Monitoring & Audit Report April 2003 Rev. A
K:\2001\014 (Penny Bay Phase I)\Electronic Reporting\2003\Apr 03\R2296 (Apr 03 Rev. A).doc Action-United Environmental Services and Consulting
Table 8.2 Summary of Quantities of Recycling Materials Type of Waste Quantity Disposal Location
Recycled Metal (Kg) 9.3 Collected by Tin Wai Environmental Services
Recycled Paper (kg) 670 Collected by Tin Wai Environmental Services
9.0 CULTURAL HERITAGE
Major construction of the catchment pit in Wan Tuk Archaeological Site was completed. No deficiencies were identified.
10.0 LANDSCAPE AND VISUAL
During the weekly site inspections, it was observed that hydroseeding and slope works were being carried out at the cut-slope near Ngong Shuen Au and on various berms along haul roads for landscape and visual enhancement. No deficiencies were identified.
11.0 SITE INSPECTION
Weekly site inspections were carried out by the representatives of the IEC, the Engineer, the CSCE and the ET. Five site inspections were undertaken in this reporting month. Details of the site inspection records are attached in Appendix R and summarised in Appendix U. Based on the site inspection findings, the following recommendations are pertinent: Provide regular and proper silt curtain maintenance at Yam O; Provide sufficient drip trays and remove used oil drums/containers to minimize potential
land contamination; Waste engine oil should be stored properly or disposed according to Waste Disposal
(Chemical Waste)(General) Regulation; Waste lubricating oil should be collected by a license collector. All disposal records
should be kept in the site office for the RE, IEC and ET to check; Instruct operators to ensure that no discharging of any muddy water directly into the sea
is allowed; Apply water spraying frequently on temporary haul roads to avoid fugitive dust emission by
vehicles during dry weather; Proper collection and disposal of site canteen wastewater; Regular cleaning of mud from paved haul roads; Regular removal of refuse to prevent dumping in WDC if necessary; and Instruct all sub-contractors to properly maintain and repair their mobile plants regularly.
12.0 WESTERN DRAINAGE CHANNEL (WDC)
No environmental deficiencies were noted in the Western Drainage Channel in this reporting month.
Contract No. CV/2000/09 Infrastructure for Penny’s Bay Development – Contract 1 Impact Environmental Monitoring & Audit Report April 2003 Rev. A
K:\2001\014 (Penny Bay Phase I)\Electronic Reporting\2003\Apr 03\R2296 (Apr 03 Rev. A).doc Action-United Environmental Services and Consulting
13.0 IMPLEMENTATION STATUS OF MITIGATION MEASURES CSCE has been implementing the required environmental mitigation measures according to the Implementation Schedule. A summary of the implementation status of the mitigation measures is presented in Appendix S. In addition to the mitigation measures required under the Implementation Schedule, the following mitigation measures were implemented by CSCE: Ecology No construction work was carried out within the area where rare/protected/restricted plant species had been identified in the Revised Detailed Vegetation Survey Final Report (Revision A) of June 2002. Water Quality The silt curtain system of Yam O reclamation site was established and maintained regularly. Sand filling of the sea wall construction works is ongoing. Wastewater/Ground Water Treatment De-silting tanks and soak away system have been built for the wastewater generated from piling and excavation works. Chemical Waste Chemical waste storage facilities will be constructed and maintained on site.
14.0 IMPACT FORECAST AND MONITORING SCHEDULE FOR MAY 2003 14.1 KEY ISSUES FOR THE COMING MONTH
The sand filling works for seawall construction at Yam O will continue in the coming months. It is expected that the potential marine water quality impact will be of particular concern. Key issues to be considered in the coming month include:
Potential marine water quality impact due to sand filling at Yam O; Maintenance of silt curtains at Yam O; Disposal of empty engine oil containers within site area; Ensure that no surface run off discharge into WDC; Removal of any rubbish accumulated upstream of WDC; Ensure dust suppression measures are implemented properly; Maintain the cleanliness of paved haul roads and remove mud off them; Management of chemical wastes; and Follow-up of improvement on general waste management issues.
14.2 MONITORING SCHEDULE FOR THE NEXT 3 MONTHS
The EM&A schedules for the coming 3 reporting months (from May to July 2003) are presented in Appendix E.
14.3 CONSTRUCTION PROGRAM FOR THE NEXT 3 MONTHS The construction program for the next 3 months is included in Appendix T.

Contract No. CV/2000/09 Infrastructure for Penny’s Bay Development – Contract 1 Impact Environmental Monitoring & Audit Report April 2003 Rev. A
K:\2001\014 (Penny Bay Phase I)\Electronic Reporting\2003\Apr 03\R2296 (Apr 03 Rev. A).doc Action-United Environmental Services and Consulting
15.0 CONCLUSIONS AND RECOMMENDATIONS The EM&A program in April 2003 was undertaken based on the EM&A manual for the Infrastructure for Penny’s Bay Development – Contract 1. A summary of environmental compliance for air, noise and water quality in this reporting month is presented as follows: Summary of Environmental Compliance
Env. Quality Parameters Compliance % Investigation & Corrective Actions Air Quality 24-hr TSP 100 Not Required for 100% Compliance
Leq (30min) Daytime 100 Not Required for 100% Compliance Noise Leq (5min) Restricted Hours 48.9 ET’s Investigation Completed# Suspended Solids 98.1 ET’s Investigation Completed# Turbidity 100 Not Required for 100% Compliance Water Quality Dissolved Oxygen 100 Not Required for 100% Compliance
# Details of the monitoring exceedances recorded by ET and actions taken by CSCE are presented in Appendix Q. Air Quality All 24-hr TSP measurement results were below the Action and Limit Levels. All previous exceedances from January and February 2003 onwards have not been verified by the IEC and are still outstanding.
The air quality complaint received on 24 January 2003 has not been closed by the IEC and is still outstanding.
Construction Noise Daytime Noise Monitoring All daytime noise measurement results were below the Action and Limit Levels.
Restricted-hours Noise Monitoring (1900-2300 hours) - Evening Two limit level exceedances were recorded at NM3 on 28 March and 9 April 2003. Site observations indicated that the most noticeable noise sources at the time of monitoring emanated from MTR Airport Express trains and aircrafts.
Restricted-hours Noise Monitoring (2300-0700 hours next day) - Night Fifteen Limit-level exceedances in total were recorded at all 3 noise monitoring stations on 22 March, 3, 9, 15 and 21 April 2003. Site records during the noise exceedances recorded at NM1, NM2 and NM3, indicated that the dominant noise sources were mostly background noise e.g. traffic flows, aircrafts, ferry, sea waves and vegetation rustling. All noise levels measured at the three locations were within the range of baseline levels; between 47.3 dB(A) and 77.7 dB(A) for NM1; between 42.8 dB(A) and 69.6 dB(A) for NM2 and between 41.1 dB(A) and 73.9 dB(A) for NM3. The ET’s investigation reports confirmed that the exceedances were unlikely to be due to the Project and were all verified and closed by the IEC.

Contract No. CV/2000/09 Infrastructure for Penny’s Bay Development – Contract 1 Impact Environmental Monitoring & Audit Report April 2003 Rev. A
K:\2001\014 (Penny Bay Phase I)\Electronic Reporting\2003\Apr 03\R2296 (Apr 03 Rev. A).doc Action-United Environmental Services and Consulting
Water Quality There were two Action-level suspended solids (SS) exceedances recorded on 18 April 2003. The exceedances were recorded at SR4 during mid-ebb tide and at SR6 during mid-flood tide.
The water flow during mid-flood tide was from SR6 to the works area. Therefore, the mid-flood exceedance is not likely to be due to the Project. The water flow during mid-ebb was from the works area to SR4. However, Gradient Stations G7, G5 and G6, which are in the immediate vicinity of the works area, recorded no exceedances and had values lower than that recorded at SR4. Therefore, the mid-ebb exceedance at SR4 is unlikely to be caused by the Project. No further exceedance was recorded and subsequent SS results were all below the Action Level. An investigation report submitted by the ET has not yet been verified.
Ecology
Marine mammal surveys were conducted on 2 and 16 April 2003. On effort monitoring on 2 April 2003 was eventually abandoned due to unstable weather conditions. The survey team then decided to maximise the search effort in key areas, which included the vicinity of the work site, the area around the Brothers' Island and along the coast between Siu Ho and Tung Chung. No sighting was recorded on 2 April 2003. An on-effort survey was conducted on 16 April 2003 and no sighting was recorded for that day either. No direct impacts on the marine mammals attributable to the Project were observed.
Monitoring of the White-Bellied Sea Eagle (WBSE) Haliaeetus leucogaster was undertaken at Pa Tau Kwu, Lantau Island on 3 and 15 April 2003. Both male and female birds were present at the monitoring site during the two surveys. No incubation, chick feeding activity or juvenile WBSEs were observed during this month. This would suggest that the breeding of the WBSEs has been unsuccessful this season. No noticeable disturbance to the WBSEs was observed during the survey. All the transplanted individuals of Schoenus falcatus and Eriocaulon merrilli were still alive during the third monitoring period from 15 March 2003 to 15 April 2003. Most of the transplanted Schoenus falcatus individuals showed improvement from the previous monitoring session. Thirteen transplanted Schoenus falcatus individuals were recorded to have flowers with new roots and strong rhizomes observed indicating self-regeneration of the plants. The overall condition of the transplanted Schoenus falcatus was noted as good and the Eriocaulon merrilli acceptable. Environmental Complaint/Summons One environmental complaint was recorded by the ET on 2 April 2003. The complaint was probably related to dark smoke emissions from an excavator operating near the Penny’s Bay Gas Turbine Power Station on 22 March 2003. Immediate action was undertaken by CSCE on 22 March 2003 to stop the use of that excavator until proper maintenance was completed. The ET submitted an investigation report on 4 April 2003 and the IEC closed the complaint on 10 April 2003. No summonses were received during the reporting month. Marine Works
Dredging at the Yam O reclamation site was completed on 3 October 2002. Sand filling activities were carried out everyday this month. The daily sand filling quantities were all below the maximum limit of 14,000 m3/day for Yam O reclamation. No fill import from Tseung Kwan O was recorded.

Contract No. CV/2000/09 Infrastructure for Penny’s Bay Development – Contract 1 Impact Environmental Monitoring & Audit Report April 2003 Rev. A
K:\2001\014 (Penny Bay Phase I)\Electronic Reporting\2003\Apr 03\R2296 (Apr 03 Rev. A).doc Action-United Environmental Services and Consulting
Recommendations Based on the joint site inspection records, the following key recommendations are pertinent: Exercise water spraying more frequently in all temporary roads to avoid fugitive dust
emission by vehicles during dry weather; Unloading/loading of CDG material should be done carefully to stop unintentional
dropping into the sea to cause water pollution; Provide sufficient drip trays and remove used oil drums/containers to minimize potential
land contamination; Waste engine oil should be stored properly or disposed according to Waste Disposal
(Chemical Waste)(General) Regulation; Provide regular and proper silt curtain maintenance and arrange repair if necessary; Regularly check and ensure effectiveness of the wheel washing facility; Instruct operators to ensure that no discharge of muddy water is allowed into the sea; Clearance of mud within the catchment pit if necessary; Regular cleaning of mud from paved haul roads; Provide dust suppression measures to reduce dust emission from stockpile; and Follow-up of improvement on general waste management issues.
The ET will continue to implement the EM&A program and audit the implementation of the environmental mitigation measures.