CityofPhiladelphia Municipal - Retirement System
94
. . City of Philadelphia Municipal Retirement System - July1,1998 Actuarial Valuation Report William M. Mercer,. L1corporated 1120 20th Street, ~JW Suite 800 Washington, DC 20036 2027859080 #.
Transcript of CityofPhiladelphia Municipal - Retirement System

.
.
City of Philadelphia
Municipal Retirement System-July 1,1998
Actuarial Valuation Report
William M. Mercer,. L1corporated1120 20th Street, ~JWSuite 800Washington, DC 20036
2027859080
#.

l •
--WILLIAMM.MERCER
April 9, 1999
Board of Pensions and RetirementCity of PhiladelphiaTwo Penn Center, 20th FloorPhiladelphia, PA 19102
Dear Ladies and Gentlemen:
Enclosed are 16 bound and ten additional copies of our July 1, 1998 actuarial valuation ofthe City of Philadelphia Municipal Retirement System.
The employee data and the financial information used in this report were provided by theCity and the Board of Pensions and Retirement. The actuarial valuation report may beused 19 support contributions to the Retirement System for the fiscal year ending June 30,2000.
A summary of the results from the actuarial valuation is as sho\Vll in the table below.
Summary of actuarial valuation results as of June II 1998 (dollars in thousands)
;.~'. ,
Actuarial accrued liability as of July 1, 1998
Assets as of July 1, 1998 for valuation purposes
Unfunded actuarial accrued liability as of July 1, 1998
City normal cost as a percent of payroll for the year, assumingpayment is made at the beginning of year:
1967 Plan
Municipal divisionPolice divisionFire division
Plan 87
Municipal division (Plan M)Municipal division (Plan Y)Elected officialsPolice divisionFire division
Combined plans
$ 5,586,134
$ 2,921,358
$ 2,664,776
4.687%7.306%7.128%
5.014%5.060%5.464%5.594%6.018%
5.380%
•
William M. Mercer, IrlcorporaledOrle lafayette Cerllre1120 20th Street, NWSwite 800Washirlglorl, DC 20036
A Marsh & McLerlrlarl COmpilrlY
Phorle 202 785 9080Fax 202 331 0486

~~-.,.-
..
,. , .' ,,WILLlAMMMERCER
Board of Pensions and RetirementApril 9,1999Page 2
The actuarial assumptions underlying the results are our best estimate of anticipated futureexperience of the Retirement System .
The City's funding policy provides for payment of the normal cost in accordance with thecalculations made by the actuary plus level dollar payments toward amortization of theDombrowski unfunded actuarial accrued liabilities plus payments increasing 5.0% peryear toward amortization of the unfunded actuarial accrued liability established on July 1,1985 plus level dollar payments toward amortization of any plan changes or actuarialgains and losses which occur after July 1, 1985.
For the year beginning July 1, 1999 and ending June 30, 2000, policy requirements call foran amortization payment of$198,415,000, assuming payment is made at the beginning ofthe year. This payment is reduced to $105,342,000 after the effects of the pensionobligation bond are applied.
The calculation and amortization schedule for determining the City's minimum municipalobligation for the fiscal year ending June 30, 2000 are in Tables 45 and 46 of this report.
Disclosure requirements for the Governmental Accounting Standard Board StatementNumbers 25 and 27 have been incOIporated at the end of this report.
Supporting data and background material pertinent determining the normal cost andaccrued liabilities of the Retirement System is also in the report.
Sincerely,
~a~Kenneth A. Kent, FSA, FCA
KAK:rk\lwlISnvfs03ldalJlldbldj\pcylll hI 19991doc:sl""L IIr.doc
Enclosures

CONTENTS
Executive summary I
Cost derivation 10
Plan membership 28
Financial experience of fund 46
Major features of the Retirement System 54
Actuarial cost method, factors, and assumptions 75
Minimum municipal obligation 83
Post Pension Obligation Bond (POB) Cost Derivation 87
Governmental Accounting Standards Board (GASB) 88
Wiliiam M. Mercer, Incorporated

-. """-~
EXECUTIVE SUMMARY
This report presents the actuarial valuation and the costs and liabilities for the City ofPhiladelphia Municipal Retirement System as of July 1, 1998 for the fiscal year endingJune 30, 2000. This section summarizes the valuation results and discusses changes inthe System's costs and liability arising from experience for the year ending June 30,1998.
1
During the plan year the System received $1.250 billion in proceeds from the PensionObligation Bond (P.O.B.). Because the report valuation date precedes the receipt of theseproceeds, the results do not reflect their impact. We have, however, added a section atthe back of the report to identify the P.O.B. impact on the Minimum MunicipalObligation to contribute and the City's funding policy contribution. Our understandingof Act 205 is that the City may reduce its obligation as a reflection of the p.O.B. for the,fiscal year covered by this report (fiscal year ending June 30, 2000).
Findings summary
Table 1 shows actuarial valuation results for all divisions as of July 1, 1998.
1. July 1, 1998 actuarial valuation (dollars in thousands)
ParticipantsActiveRetiredBeneficiariesDisabledTerminated vestedTotal
Total annual salariesNet actuarial accrued liabilityUnfunded actuarial accrued liabilityAssets for valuation purposes
City normal cost as percent of payroll (beginning-of.year payment)
30,93518,1828,5005,016~63,422
$ 1,128,225$ 5,586,134$ 2,664,776$ 2,921,358
5.380%
Fiscal 2000 funding requirements (begirming-of-year payments) (Before bond impact)City's funding policy $
Minimum municipal obligation (July 1, 1998 valuation) $
259,119 •.b
194,138a
a. The City may use general state aid and state cost.of.living reimbursements to meet this commitment.For fiscal 1999, these totaled $35,679 (thousands).
b. Based on July 1, 1998 payroll, Final contribution will be based on actual fisca12000 payroll.
William M. Mercer, Incorporated

e',.
EXECUTIVE SUMMARY
Normal cost
The total normal cost is the cost of benefits accruing during the year. The City's normalcost equals the total normal cost less expected employee contributions. The Systemexperience has resulted in a decline in the normal cost rate. The following graph is athree-year history of the total normal cost with employee and City components as apercent afpay.
2. Total normal cost. percent of pay
Percent of Pay
2
li96
Unfunded actuarial accrued liability
""IDeily .Employee I
1996
From June 30, 1997 through June 30, 1998, the unfunded actuarial accrued liabilityincreased $7,545,000, from $2,657,231,000 to $2,664,776,000 because:
• The June 3D, 1985 unfunded liability is being amortized with payments increasing5.0% per year. Because the payments in earlier years are less than the interest, theamortization schedule causes increases in this unfunded liability each year through
2002; after then it will decrease.
VVilliam M. Mercer, Incorporated

.
•••
EXECUTIVE SUMMARY
• Salary increases were more than anticipated, resulting in a loss .
• Investment return on an adjusted market basis was 13.1%. Because this is more thanthe assumed 9% rate, the gain reduced the unfunded actuarial accrued liability .
• Other non-economic plan experience resulted in a net loss .
These factors are illustrated in Table 3(A).
3(A). Unfunded liability (thousands)
3
1997 unfunded liability
Change due to:Payment scheduleSalary increasesChange in assumptionsInvestment returnOther actuarial experience
1998 unfunded liability
$2,657,231
38,8834,818
o(103,861)67705
$2.664.776
Because the June 30, 1985 unfunded liability is being amortized with paymentsincreasing 5.0% per year, the amortization payment is scheduled to increase until 2019and then drop to zero. The total unfunded liability is scheduled to increase each yearuntil 2002, and then decrease to zero by 2019. With the 1997 change in Act 205, oncethe funding ratio reaches 70% the City may shift to a 10 year rolling level amortizationschedule. Assuming no future gains or losses, and before recognition of the P.D,B. thefund is projected to first be 70% funded in 2011, The alternative amortization schedulewill first be beneficial in 2012,
William M. Mercer, Incorporated

EXECUTIVE SUMMARY 4
1I
Graph 3(B) illustrates changes in the amortization payment through 2019. Graph 3(C),tracks the unfunded liability through 2019. The bold and circle-marked lines (beforeand after the P.Q.B., respectively) indicate actual changes in the amortization payment orunfunded liability and includes scheduled increases and changes because of planamendments, assumption changes, and gains, and losses. The dotted and x-marked lines(before and after the P.O.B., respectively) reflect projected changes under the 10 yearamortization schedule assuming no future gains or losses.
3(8). Amortization schedule
Amortlutlon Schedule (BOY)
$500,000
$450,000
$400,000
$350,000
$300,000
$250,000
$200,000
$150,000
$100,000
$50,000
SO
,,,,' ",',
,,,,, ,,
I-projected" •• 10 yea, amortization_Projectod wi POB_10 yell' llmOf!lUlticn wi poe I
William M. Mercer. Incorporated

--.""-
EXECUTIVE SUMMARY
3(C). Unfunded actuarial accrued liability
Unfunded Aetuarial Accrued Liability
$3,000,000
5
12,500.000
~2.000,OOO
11,500,000
$'.000,000
1500,000
•
"#~#~#~~~##~##~~~~~#~~I-UAI\L. • 10year amortization _UAAl wi POB__ 10yea'lmOrtlUl,onwl rOBI
City funding policy
The report shows the recommended City contributions, assuming they're paid at thebeginning of the fiscal year (July 1, 1999). Ifpaid after July I the City's funding policyhas been to pay interest at 9% from July 1,1999 to the date paid.
The resulting estimated City contributions for fiscal years 1999 and 2000 are shown inTable 4(A). We also demonstrate the estimated City obligation reflecting the P.O.B.which the City can adopt for fiscal 2000.
4(A). Estimated City contributions (thousands) - beginnlng-of-year payment
Normal costAmortization paymentTotal City cost
Fiscal 1999
$ 60,293193 595
$ 253,888
Pre-POBFiscal 2000
$ 60,704'198415
S259,ll9b
Post-POBFiscal 2000
$ 60,704"105 342
S166,046b
a. Based on July 1. 1998 payroll. Actual normal cost will be based on actual fiscal 2000 payroll.b. The City may use general state aid and state cost-of-living reimbursements to meet this conunitment.
For fiscal 1999. they totaled $35,679 (thousands).
VViliiam M. Mercer. Incorporated

, ',
EXECUTIVE SUMMARY
The P.O.B.'s impact on the City's funding policy mirrors the required application ofthese additional assets in the calculation of the Minimum Municipal Obligation (MMO).The bond proceeds are ratioed over the unfunded actuarial accrued liability at thebeginning of the plan year in which the bonds are sold (July 1, 1998). This ratio isapplied to reduce.all past service amortization bases reflecting a pro. rata retirement ofthese bases by the proceeds.
Table 4(B) shows July 1, 1999 employee contribution rates.
4(8). Employee contribution rates effective July 1. 1999
6
Municipal Elected
1967 Plan 3.75%" N/APlan 87 2.15% (Plan M) 8.23%
2.17% (Plan Y)
Police
6.00%5.00%
Fire
6.00%5.00%
a. 6.00% on wages overthe Social Security maximum taxable wage base - $72,600 in 1999.
Quasi agency funding
Table 4(C) shows the quasi agencies funding rate for fiscal years 1999 and 2000 and theParking Authority's additional contribution for their early retirement window. Thisspecial amortization charge must be made through fiscal 2004.
4(C). Quasi agency funding rate
Valuation date
Normal cost rate
Amortization rate
Total, year.end rate
Total, adjusted for quarterly payments
Parking Authority special amortization payment
Annual year-end payment
Quarterly payment
a. Nonnal cost rate, page 12.b. ($110,410. $78) -;-$534,641, see pages 16 and 12.c. .97546 (quarterly adjustment factor) x 25.746%.d. $78,000 -;-4 x .97546.
William M. Mercer, Incorporated
Fiscal 1999
July 1, 1997
5.602%"
l.2...li2..8. %
25.230%
24.611%<
$78,000
$19,021d
Fiscal 2000
July 1, 1998
5.109%"
2.Q.6.31%b
25.746%
25.114%"
$78,000
$19,021d

-EXECUTIVE SUMMARY
Minimum municipal obligation
The minimum municipal obligation (MMO) is the minimum required City contribution
under state law (Acts 205 and 189).
The City's funding policy differs from the MMO. The most significant differences are:
• The City uses a 34-year increasing amortization of its July 1, 1985 unfunded actuarialaccrued liability, while Act 205 allows a 40.year increasing amortization schedule .
7
• The City applies the nonnal cost rates to the fiscal year's actual payroll. The MMO isbased on the prior year's estimated payroll .
• No interest accumulates on the MMO if the payment is made by year-end.
• The City's funding policy uses a one-year delay in applying actuarial valuation resultsto fiscal years. The MMO also reflects a one-year delay to comply with state auditors'recommendations. As a result, this July 1, 1998 valuation report determines the City'sfiscal 2000 MMO contribution .
• The MMO reflects amortization of prior years' City contributions above past MMOs asactuarial gains.
Table 86 of this report summarizes the City's unfunded liability payment for its' fiscal2000 MMO. These payments reflect the 40-year funding from July 1, 1985 withincreasing payments at 5.0%.
The resulting fiscal 2000 MMO is summarized in Table 4(D).
William M. Mercer, Incorporated

'.. '
EXECUTIVE SUMMARY
4(0). Fiscal 2000 minimum municipal obligation (thousands)
Post-POB
8
~,
Valuation report
Normal costAmortization paymentExpected administrative expenseSubtotal
Expected member contributionsMinimum municipal obligationInterestTotal
a. Assumes the MMO will be paid before December 31, 1999.
July 1, 1998
S 103,847132.361
4600
S 240,808(46,670)
$ 194,138Q'
$ 194,138'
July 1, 1998
S 103.84770.273
4600
S 178,720(46670)
$ 132,0500'
S 132,050"
b. The City may use general state aid and state COLA reimbursement, estimated al $36 million, 10 meetthis commibnent.
Funding status
The plan's funding status is measured by the ratio of the actuarial value of assets to theactuarial accrued liability. A comparison of this ratio as of July 1, 1997 and July 1, 1998is shown in Table 4(E).
4(E). Funding status comparison (dollars in thousands)
Certification
Actuarial value of assetsActuarial accrued liabilityFunding ratio
1997
$2,660,886$5,318,117
50.0%
1998
$2,921,358$5,586,134
52.3%
We have prepared an actuarial valuation of the City of Philadelphia Municipal RetirementSystem as of July I, 1998 for fiscal year ending June 3D, 2000. The valuation is based onemployee and financial data which were provided by the City and trustee, respectively,and which are sununarized in this report.
William M. Mercer, Incorporated

-. ',
EXECUTIVE SUMMARY 9
All costs, liabilities and other factors under the Plan were determined in accordance withgenerally accepted actuarial principles and procedures, in accordance with the provisionsof current state statutes and regulations issued thereunder. In our opinion, the actuarialassumptions are reasonable and represent our best estimate of the anticipated experienceunder the Plan. This report fully and fairly discloses the actuarial present position of thePlan on an ongoing basis.
There have been no changes in valuation procedures, actuarial assumptions, actuarial costmethod or plan provisions since the last valuation of the Plan as of July 1, 1997.
We are available to answer any questions on the material contained in the report, or toprovide explanations or further details as may be appropriate.
,~.~Kenneth A. Kent, FSA, FCA Date
~~•Thomas Skiavo
William M. Mercer, Incorporated1120 20th Street, NW, Suite 800Washington, DC 20036
(202) 785-9080
William M. Mercer, Incorporated

; i .
COST DERIVATION 10
This section explains the Retirement System's costs. Costs are determined using the entryage actuarial cost method. The cost estimates derived in this actuarial valuation will bethe basis for determining pension costs for the fiscal year ending June 30, 2009. Pensioncosts consist of the normal cost and the unfunded liability amortization payment.
Derivation of normal cost
The normal cost is the total of the individual normal costs for all members assuming theplan always existed and the underlying actuarial assumptions are exactly realized.Benefits payable under every circumstance (retirement, death, disability, and termination)are included in the calculations. Employee contributions expected to be made during theyear are subtracted from the total normal cost to determine the City's normal cost. TheCity's normal cost is divided by total payroll to determine the normal cost as a percent ofpay for each division and the entire Retirement System.
Derivation of the unfunded actuarial accrued liability
The actuarial accrued liability is the total of the actuarial present value of all accumulatedpast normal costs assuming the normal cost had always been contributed and actuarialassumptions had been exactly realized.
The valuation assets are determined as of July 1, 1998, using an actuarial asset methodthat spreads investment experience over a five-year period to minimize the impact ofinvestment volatility on the Retirement System's costs. The method measures gains orlosses against the assumed 9% investment yield, recognizing one~fifth of the gain or lossover the current and each of the next four years.
The unfunded actuarial accrued liability is the accrued liability less the fund's assets onthe valuation date.
Experience gains and losses are the difference between the expected and actual unfundedactuarial accrued liability (see the preceding paragraphs) on the valuation date.
The portion ofthe unfunded actuarial accrued liability attributable to the Dombrowskiclass action suit is amortized in level dollar payments over 40 years ending June 30,2009. The remaining July 1, 1985 unfunded actuarial accrued liability is amortized over34 years ending June 30, 2019 in annual payments increasing 5.0% per year. Changes inthe actuarial accrued liability realized after July 1, 1985 are amortized in level dollar
payments over the following years according to Act 205:William M. Mercer, Incorporated

, .•
COST DERIVATION
• Changes in actuarial assumptions - 20 years
• Experience gains and losses - 15 years
• Active members' benefit modifications - 20 years
• Nonactive members' benefit modifications - 10 years.
For a detailed analysis of the derivation of plan costs, see Tables 5 through 16.
The resulting contribution reflects the City's funding policy which results in a largercontribution than the MMO determined under Act 205.
11
Table 46 shows the annual unfunded liability payments needed to satisfy the City's MMOfor fiscal year ending June 30, 2000.
Table 17 shows the annual payments needed to fund plan liabilities through fiscal yearending June 30, 2020.
William M. Mercer. Incorporated

COST DERIVATION 12--
5. July 1, 1998 derivation of normal cost (dollars in thousands)
1967 Plan Plan 87
Municipal Poliee Fire l\Iullicillnl (1\1) Municipal (V) F.lcdi'd I'olicl' Fire Tolal
I. Number of active members
•• Vested 10,0[2 3,247 1,592 202 152 14 10 7 15,236b. Non.vested 4266 53 -" -<i81 (1,244 ---'.l 3623 ---'QI 1569'1,. Total 14,278 ],300 I,MIO 88' 6,396 " 3,6]] Sl4 ]0/)35
2. TOlal nomlal cnst.. $elVice retirement S 25,530 , 14,069 , 6.667 , 1,539 , 8,277 , 178 , 9,344 , 2.143 , 67,747b. Preretirement death 3,36) 1,041 534 20' 1,214 [(, 666 177 7.21'),. Disability relirement 4,1?1 1,809 8?1 208 1,2(,8 13 1,521 lSI 10.282,. Vested terminatiOIl 6,793 867 4)4 307 1,750 17 1,47R 340 11,?R2,. Refund ofnoDvesled rncmbers'
contributions 2,675 284 136 95 510 14 411 ')5 4,26llr. [Iealth care beDelll 0 58 2? 0 0 0 50 14 ISOg. Administrative expenses 2.468 920 ____1" ----'i1 465 ---' --",. ----<ill ~.6illlh. Total S 45,020 $ 19,047 $ 9,041 , 2,425 $ 13,504 $ 241 S 13,754 , 3,208 , I06,24(J
3. Expecled employee contributions , 19,960 $ 8,580 S 4,126 , '" I 4,051 I 14' , 6,491 I 1,456 I 45,5.1(,
4. Cily normal cost (1h) - (3) S 25,060 I 10,467 I 4,915 I 1,698 I 9,453 , '" I 7,262 $ 1,752 I ('0,74)4
,. Currenl tOlal annual payroll S 534,641 S 143,277 S 68,953 S 33,858 S 186,799 S U5B S 129,824 S 29,115 S 1,121U25
6. City normal cost as a percent orpay assuming beginning-or-yearpayment (4)';' (5) 4,687% 7.306% 7,128% 5.014% 5.060% 5.4(04% 5,594% (,,(118% .'U80%
7. City normal cost as a pen;cnl orI"ay assuming end-or-yearpayment (6).lJ.09 5.109% 7.964% 7.770% 5.465% 5.515% 5.956% (d)?7% (,.5(,0% 5,8(,4%
Nole: Numbers may not add because orroundillg.
Wiili,fln M. Mcn:er, Incorporated

COST DERIVATION 14
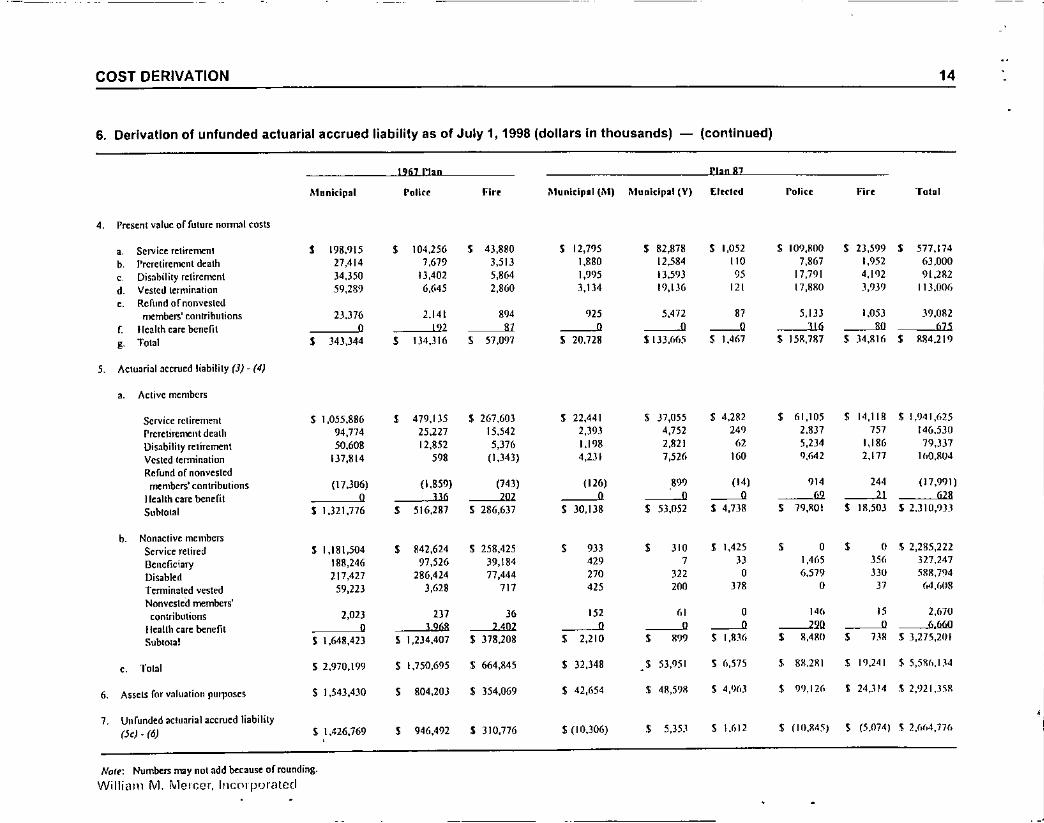
6. Derivation of unfunded actuarial accrued liability as of July 1, 1998 (dollars in thousands) - (continued)
ll61..tlaD rlan 87
Municipal roller Firr Municipal (!\I) Municipal (V) Eleeled Policc Fire Total
,. Present value of future normal cosls
, Service retirement • 198,915 • 104,256 • 43,880 S 12,195 S 82,878 S 1,052 $ 109,llOQ $ 23,599 • 577,174
b Preretirement death 27,414 7,679 3,513 1,880 12,584 110 7.867 1,952 63,000, Disability retirement 34,350 13,402 5,864 1,995 13,593 95 17,791 4,1 'l2 91,2112d Vested termination 59,289 6,(.45 2,860 3,134 19,136 121 17,8110 3,93') 113,006
,. Refund of nonvestedmember.;' contributions 23.376 2.141 '04 '" 5,472 87 5,IJJ 1,053 39,01\2
r. Health care benefit 0 192 87 0 0 -" 316 80 675, Tolal • 343,344 • 04,316 • 57,097 S 20,728 S lJJ,6<,j S 1,467 S 151\,787 S 34,1\16 • 884.219
5. Actuarial accrued liability (3) - (oS)
,. Active members
Service retirement S 1,055,886 • 479,135 $ 267.603 $ 22,441 $ )7,055 S 4,282 • 61,105 S 14,118 $ 1,')4t,625
Preretirement death 94,774 25,227 15,542 2,)93 4,752 249 2,837 757 146530
Disability retirement 50,608 12,852 5,376 1.198 2,821 (,2 5,234 1,186 79,337
Vested termination 137,814 '98 (1,343) 4,231 7,526 160 9,M2 2,177 lhO.R04
Refund of nOrlvestedmembers' contributions (17,J06) (1,859) (743) (126) '99 (14) 93' 24' (17,991)
llealth care benefit 0 336 202 0 0 -" 62 21 628
Subtotal S 1,321,776 , 516,287 S 286,637 S 30,138 S 53,052 S 4,738 , 19,1lOI S Ill,50) S 2,31ll,93J
b. Nonactive membersService relired S 1,181,504 , 842,624 $ 258,425 • 933 • 310 J 1,425 • 0 • 0 $ 2,285,222
I3clleficiary 188,246 97,526 39,184 429 7 3J 1,4(,5 35(, 3l7.247
Disabled 217,427 286,424 71,444 270 J22 0 6,579 3JO 588,7<}4
Tcrminated vested 59,223 3,628 717 425 200 J78 0 37 (,4,(,U8
NOrlvcsted members'contributions 2,023 2J7 J6 152 (,1 0 14(, 15 2,670
Health care benefit 0 1968 2402 0 0 -" -220 0 ----6.rruoSubtotal S 1,648,423 S 1,234,407 S 378,208 • 2,210 • '99 S I,lm, • 8,480 • BR S 3,275,201
,. Total S 2,970,199 S 1,750,695 S 664,845 S 32,348 $ 53,951 $ 6,575 • 81Ulll $ 19,241 $ 5,511h,I,'4
6. Assets for valuation purposes S 1,543,430 • 804,203 $ 354,069 S 42,654 $ 48,5')8 $ 4,%J • 9'),12(, $ 24,314 .$ 2,'>21.J5R
7. Unfunded actuarial accrued liability(jc) . (6) S 1,426,769 • 946,492 S 310,776 S (10,)06) • 5,35.' S \l,12 $ (1(},84.~J S (5.074) .$ 2,(0(,4,7](,
,
Nofe: Numbers may not add because of rounding.
Willia1l1 rvl. fII1CIccr, IllCnrprJrated

NOfe: Numbers may noladd bccause of rounding.
WiliiiHll M. Mercer, Incorporated

------------ --------
COST DERIVATION
8. Development of municipal division (1967 Plan) annual payment toward the unfunded actuarial accrued liabilityfor fiscal year ending June 3D, 2000 (thousands)
-Eisql vue E:ndjn~ .June 30. 20QO
16
Outslaoding nataneeJuly I, 1998
F.l(lHted lIalancl'Jul}'1,1999
AmortizationPeriod Remaining
Annualll<,ginniug-of-Yruraymcnt
Allllual End-of-YearPa)'mtnl'
I. Expected July 1, 1998 unfunded aCluarialaccrued liability based on July I, 1997 valuation
" Dombrowski , 13,6% , 12.916 10 , 1,846 , 2,013
b Rcomining 1415278 .-L<.lK.ill J!.lll" lOS (,'16"
, Subtolal S 1,428,975 S 1,451,874 $101,568 , IIO,7()'l
2. Changes in unfunded actuarial accrued liability.July I, 1998
, Experience (gains)/losses , (2,206) , (2,404) 15 , (274) , (298)
b. Assumption change 0 0 ------" Q
,. Sublotal , (2,206) , (2,404) , (274) , (21)1l)
,- Tolal (Ie) + (lc) S 1,426,769 S 1,449,470 $101,294 , 110,410
NOIC: Numbers may not add because of rounding.
a. Includes interest 319% \0 year-end.b. raymenl~ toward unfunded liability as of July 1, 1985, increasing at 5.0% per year. All other payments are level dO)l1aramounts,
William M. Mercer, Incorporated
COST DERIVATION
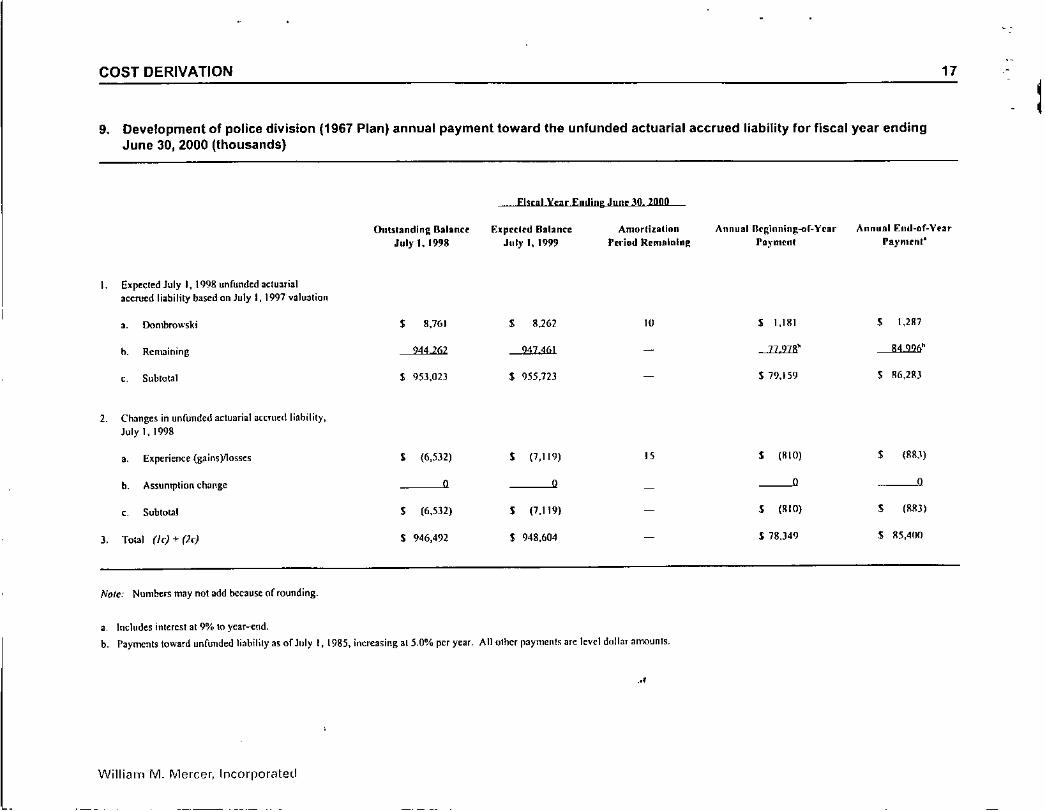
9. Development of police division (1967 Plan) annual payment toward the unfunded actuarial accrued liability for fiscal year endingJune 30, 2000 (thousands)
_ ...Elscal Vue Endin~ ,lURe30. 2000
17
l
Outstanding BalanceJul)' 1. 1998
Expccltd BalanceJuly I, 1999
AmortiutlonPeriod RemainED!:
Annual Ilclllnning-af-YrarPayment
Annualli:ntl-nf-YnrPaymcnt'
J. Expected July I, 1998 unfunded aclunialaccrued liability based on July I, 1997 valuation
,. Dombrowski , 8,761 , 8,262 10 , 1,181 , 1,287
h. Remaining 944262 9474(,1 - ...IL'llJ,' 84 92(}h
, Subtotal $ 953,023 $ 955,723 $ 79,159 , 86,28)2. Changes in unfunded actuarial accrued liability,
July 1, 1998
, Experience (gains)f1osses , (6,532) , (7,119) 15 , (RIO) , (RS.')
h. Assumption change 0 0 --" 0
, Subtotal , (6,5]2) , (7.119) , (KIO) , eRR])
3. Total (Ie) + (2e) $ 946,492 $ 948,604 $ 78,349 , KS,400
Nore: NumbefS may not add because of rounding.
a, lndudes interest at9% 10 year-end.
b. Payments toward unfunded liability a~ of July I, 1985, increasing at 5.0% per year. All olher payments are level dollar amounts .
..•
Willi<Ull M. I'vlercer, Incorporated

COST DERIVATION 18
10. Development of fire division (1967 Plan) annual payment toward the unfunded actuarial accrued liability for fiscal year ending June30,2000 (thousands)
FiScal )'cat..Endi01: Jugr 30. 2000
OutslllndinR B;fllnce F.lprctcd Balance Amortization Annualllrginninl:-of-Vrar Annual End-nT-YtltJuly 1, 1998 July 1.1999 r.ri •.•d Remaining "a)'mcnl T'll)'rnrnt"
I Elf'Ccted July I, 1998 unfunded actuarialaccrued liability based on July 1, 1991 ~alualion
.. Dombrowski , 3,489 , 3.290 10 , 470 , 5IJ
b. Remaining UO 52! 325816 -- 22782' 24832"
, Sublotal S 324,00,) S 329,106 - S 23,252 , 25.345
2 Changes in unfunded actuarial accrued liability,July 1, 19')8
, [xperience {gain.yJnss •• , (13,233) , (l4,424) " , (1.<>42) , (1,75<)
b. Assumption change Q 0 Q ()
,. Subtotal , (1],233) S (14,424) - , (I,(2) , (1,7IN)
J. Total (lc) + (2c) S 310,776 S 314,682 - S 21,610 , 2J,.'i55
Nor~: Numbers ITl3Y not add because of rounding.
a. Includes interest at 9% to year-end.
b. Payments toward unfunded liability as or July I, 1985, increasing at 5.0% per year. All other payments are level dollar amounts.
WillilH11 M. Mercer, lncorpur<tlvd

COST DERIVATION 19
~
11. Development of municipal division (Plan 87) annual payment toward the unfunded actuarial accrued liability for fiscal year endingJune 3D, 2000 (thousands)
-fuul Yur Endinr JUDI: 30.2000
I. E~pecled July I, 1998 unfunded actuarialaccrued liability based on July I, 1991valualion
2. Changes in unfunded acll,arial Berrucd liability,Juty I. 1998
a. (;~perience(gainsYlosses
h. ASSUI111'liunChange
c, Subtotal
3. Tolal (I) + (lc)
Nott: Numbers may nol add becaus~ orrounding.
a. Includes intcrest al 9% to ycar--end.
Willl<lll1 M. fV1erc~cl.. Incorporated
Outstanding HubnerJuly I, 1998
S (8,270)
$ (2,0]7)
--"$ (2,037)
$(10,306)
E~p(ft~d BalanerJuly I. 1999
S (7,7S7)
.$ (2,220)
--".$ (2,220)
$(10,007)
Amorlizationreriod Remaining
15
Annual Brrinninf{-or-Vnrrayment
S (1,126)
S (253)
--"$ (253)
S (1,J711)
Annual End-of-Vearrayment'
S (1,227)
.$ (275)
__ 0
.$ (275)
$ (1,502)
COST DERIVATION
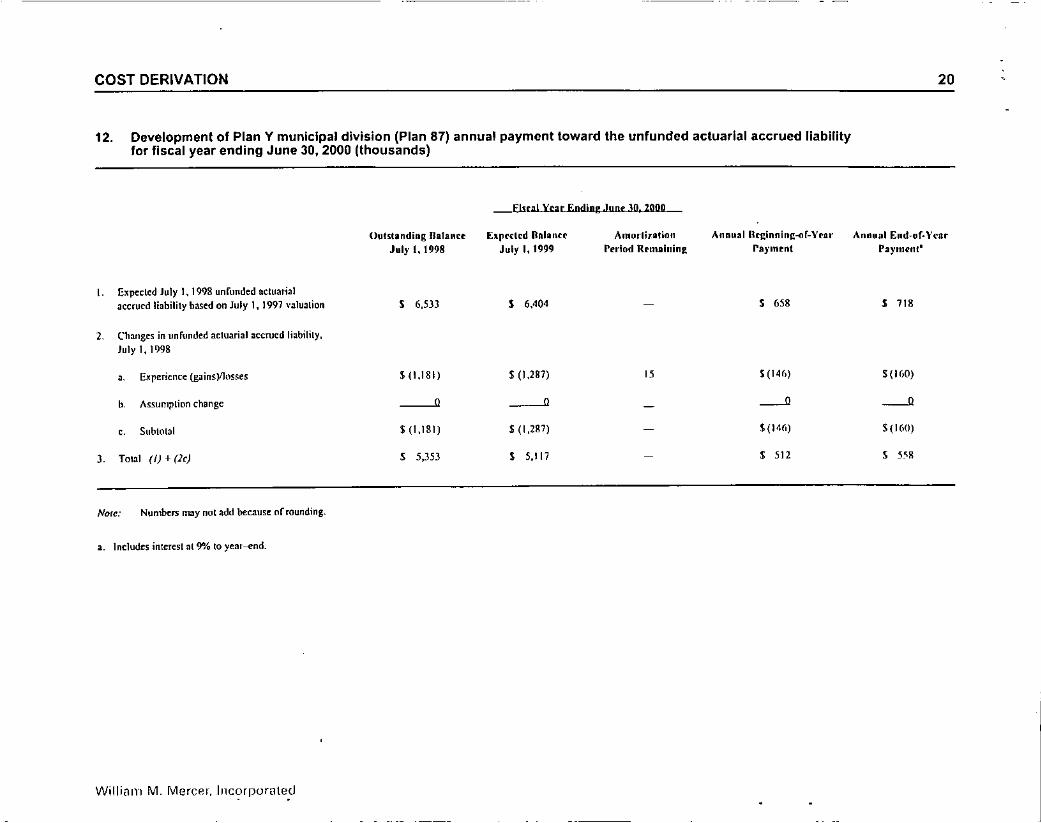
12. Development of Plan Y municipal division (Plan 87) annual payment toward the unfunded actuarial accrued liabilityfor fiscal year ending June 3D,2000 (thousands)
_Els.[Ill~t..Ending JUDe 3D.2000
20
()lIt~tandingBalanceJul)'1,1998
El(lcclcd DalunJuly I. 1999
AmorliutinnPeriod Remllillin~
Annllalllcginning-of-Yrarra)'ment
Annual End~or'YfatPaymenl'
I. E~pecled July I, 1998 unfunded actuarialaccrued liability based on July I, 1997 valuation S 6,533 S 6,404 S 658 S 718
2. Changes in unFunded actuarial accrued liability.July 1, 1998
• Experience (gainsYJlls;es $ (1,181) $ (1,287) 15 S (146) $(H,O)
b Assumption change ---" ---" - ---" ---",. Subtotal $ (1,181) $ (1,287) $ {l4('1 $(160)
J. Total (I) + (lr) , 5,353 , 5,117 $ 512 $ 55!!
NOfe: Number.; may lIot add becaus~ IIrrounding.
a. Includes interest at 9"10 to y~ar~nd.
Willi;:llll M. MerC8r, Illcorpomted. .

COST DERIVATION
13. Development of elected division (Plan 87) annual payment toward the unfunded actuarial accrued liabilityfor fiscal year ending June 30, 2000 (thousands)
21
--EIscalXtar Eodinl! JUlie 30.2000
Outstanding BallOu E~prflrd Balance Arnortiution Annual Reginning-<>r-Y('Dr Annual End-or-YurJuly 1, 1998 July 1,1999 Period Remaining ra)'IlIt'nt raYlllen'"
L E~pecled July 1, 1998 unfunded actuarialaccrued liability based on July 1, 1997 ltalll:Uion S 2,143 S 1,954 - S 351 $ )82
2. Changes in unfunded actuarial accrued liability,July 1.1998
.. bpericncc (gains)l1osses S (532) S (580) 15 S (66) S (n)
b. Assumption change --"' --"' - -" -", Subtotal $ (532) $ (5110) $ (66) S (72)
J. Tolal (I) + (2(;) $ 1,612 $ 1,374 - S 21\5 S 310
NOle: Numbers may nol add bcrause of rounding.
a. Intludes interesl at 9% 10 year---end.
Willi<llll J'vl.Mercer, Incorpc)I<lted

COST DERIVATION
14. Development of police division (Plan 87) annual payment toward the unfunded actuarial accrued liabilityfor fiscal year ending June 3D, 2000 (thousands)
22
Hual Year Endw.e:Junc 30. 2000.
()Ill~landing Balance E1fl('cled Iialanee Amorlization Annnalllcl:inninR-or-Vcar Annual End-of-VrnrJuly 1,1998 July I, 1999 Puiod Remaining Payment Paymen"
I. Expected July 1, 19Q8 unfunded actuarialaccrued liability based on July I, 1997 valuation S (6,934) S (>,363) !(1,097) S (1.196)
2 Changes in unfunded actuarial accrued liability,July 1.1?98
.. Experience (gainsYlosses $ (3,910) S (4,262) 15 , (485) , (529)
b Assumption change -----" -----" --" ---", Sllblot~l $ (3,910) S (4,2(,2) , (485) , (52?)
J. Tolal (/) + (2c) $(10,845) $(10,625) - $(1,582) $ (1,724)
NOle: Numbers may not add because of rounding.
3. Includes interest at 9% to year-end.
Willi81tl M. Mercer, Incorpor<ltcd

COST DERIVATION
15. Development of fire division (Plan 87) annual payment toward the unfunded actuarial accrued liabilityfor fiscal year ending June 30, 2000 (thousands)
-llitaLYuLEnding.J.UDC 3D. 2000
23
\
1. Elp«lcd July I, 1998 unfunded actuarialDeemed liability based on July 1, 1997 valuation
2. Changes illuofundcd actuarial accrued liability,July 1. 1998
a. Elpericnce (gainsVlosses
h. Assumption change
c. Subtotal
3. Tolal (f) + (2c)
NOli!: Numbers may nol add because oFtounding.
a. Includes interesl at 9% 10 year-end.
Willirlill I'vl.Mercer, Incorporated
Oulslanding Balan~l'July t, 1998
S (3,365)
$ (1,709)
-----"$ (1,709)
$ (5,074)
Elprell'd BalanccJuly I. 1999
S (J,l64)
$ (I,Rli2)
-----"$ (1,862)
$ (5,026)
Amortization"nin" Rrmllinin~
15
Anollllllcl:inning-of-VcarrayrnC'nl
S (4(,1)
$ (212)
----"$ (212)
S (674)
Annual End ..nr.Yurraymcnt'
S (504)
$ (231)
----"$ (2.11)
$ (7J.'i)

COST DERIVATION
16. Development of total division annual payment toward the unfunded actuarial accrued liabilityfOf fiscal year ending June 3D, 2000 (thousands)
fiScal Vear Ending ,hIDe 30. 2000
24
Outstanding Balane,"July 1. 199&
Elpccted BalanceJuly I, 1999
AmortizationPeriod Remaining
Annullillegiuuing-of-YearPayrl1ent
Annual End-of-YearPayment'
1. Expeded July I, 1998 unFundedactuarialaccrued liability based on July 1, 1997 valuation
II. Dombrowski
b. Remaining
, 25,946
2,670,168
, 24,46')
2703277
10 S 3,491\
L2JUillj"
S 3,8rJ
--=.",,"c. Subtotal
2, Changes in unfunded actuarial accrued liabilily,July I, 1998
a. Experience (gains)/losses
b, Assumption change
c. Sublotal
3. Total (Ie) + (le)
Note: Numbers may not add because of rounding.
S 2,6%.115
S (31,338)
•S (31,338)
$ 2,664,176
S 2,727,746
S (34,159)
•S (34,159)
S 2,693,588
15
.OS2U2,30J
S (3,888)
•.1: (3,1\88)
$ 1')8,415
S 120,511
S (4,BR)
•S (4,2JR)
$ 21(',21.'
a. [ndudcs interest al 9% 10 year-end.b. l'aymenllowards unfunded liability as o( July I, 1985, increasing 3t5.0% pcr year. All olherpayments arc level dollar amounts
Willialll M. MerGer,Incorporated

COST DERIVATION 25
\17. Schedule of annual payments to fund the anticipated July 1, 1998 unfunded actuarial accrued liability (dollars in thousands)
Prngr«< AnnualPIDOVur AnnUli Bcginuinlt=(lbYrDr ra)'lUtQ1 orllnrundcd Estimatrd ra~'mcnl asIkglnnlng 1961 Plan rlan 111 Acluniat Aurucd Annnal I rercenlJuly I Municipal Polj"t Fir •• Municipal (i\l) Municipal (Y) El"ded Polier Fire Tolal Uabllity I'alroll of rll~'roll
1998 NfA NfA NfA NfA NfA NfA NfA NfA NfA 1,664,776 1.l28,225 NfA1999 101,294 78,349 11,610 (1,378) 512 2S5 (1.582) (674) 198,415 1,(9).588 1.184,6)6 16.1%2000 106,110 76.672 20,')20 ([,378) 512 28' (1,582) «(74) 200,865 2,719,738 1.243.868 16,1%
2001 111,168 19,920 22,215 (1.378) 512 '" (1,582) «(74) 210,466 2,745.572 1,306,061 1('.1%
2002 124,705 87,019 25,518 (1,378) 512 '" (l,582; (674) 234,415 2,76.1,266 l,J71,J65 171%200) 130,235 88,603 26,546 (1,378) 512 285 (1,589) (691 ) 242,522 2,751i,44R 1,43",933 1(,.8%
2004 129,922 86,828 27,374 (1,287) 512 149 ( 1,529) (6(8) 241,302 2,74,1791 1,511,929 1(0.1)%
2005 136.685 87,432 27,850 (1,224) 512 159 (1,485) «41) 249,289 2,723,77(, 1,587,526 15.7%
2006 14R,937 83,178 27,843 (1,049) 512 160 (1,014) (574) 257,994 2,6')7,1<)1 1,(,(,Ii,<)02 15,5%
2007 154,193 88,947 30,039 (934) 512 7) (881) {553) 271,395 2,658,725 1,750,247 155%
2008 148,871 93,525 31,848 (I, 121) 512 (31 ) (7')7) (4911) 272,308 2,602,190 1,1l37,1(,O 14,1l%
2009 160,368 101,084 34,893 (990) 51' (13) (659) (484) 294,712 2,53",571 1,929,648 15.3%
2010 168,327 105,680 37,825 (702) 620 (162) (909) (405) 310,274 2,446,896 2,026.130 15,3%
2011 172,221 109,665 40,028 (680) '75 (132) (854) (349) 320,374 2,328,918 2,127,437 15.1%
2012 177,059 113.130 42,038 (722) 607 (51 ) (659) (233) 331,170 2.18'"1.313 2,233,808 14.11%
2013 196,531 122.230 47,082 ( 43) '49 {52) 29 (119) 366,106 2,025,375 2,345,499 15.6%
2014 209,692 129,374 51,741 190 59' IJ 485 82 392,173 1,808,604 2,462,774 15.9"/.2015 219,705 135.804 54,306 190 '95 IJ 485 82 411.182 1,543,910 2,585,912 15.9%
2016 230,219 142,557 57,000 OJ '95 IJ 485 82 431,043 1,234,674 2,715,2011 15.9"/.
2017 241,258 149,647 59,828 9J 59' IJ 485 82 452,001 875,957 2,1150,%8 15.9%
2018 243,418 156,337 62,357 ... ... ... 462,ll2 462,112 2.')93517 15.4%
Note: Numbers may not add be~au;e or rounding.
Willialll 1\.-1.Melcer. lnC(llpOr,ltfl(i

, "
COST DERIVATION
Estimated pension fund progress
26
Table 18 shows the pension fund's estimated progress for fiscal years 1999 through 2018.The July 1, 1998 adjusted market value of fund assets is the starting point. This projectionshows the emerging benefit payments of the fund and the concurrent fund growth. Theprojection is based on the same assumptions used to determine the Retirement System'sannual cost and related liabilities.
The City contribution of normal cost plus the scheduled payments toward amortizing theunfunded actuarial accrued liability is used in the projection. The first year of theprojection reflects the anticipated City contribution as of the July 1, 1997 valuation.Subsequent contributions are based on the July 1, 1998 valuation. The contribution'snormal cost component increases 5.0% annually, reflecting anticipated increases incovered payroll. The projected employee contributions also increase annually, reflectingassumed salary increases at 5.0%.
The fund projection is limited to the period with the fiscal year ending June 30, 2018.Fluctuations from the figures shown in this 20-year period are to be expected.
The fund's underlying growth trend tends to follow that shown in Table 18, even thoughthe actual numbers vary. While the projection shows that City and employee combinedfund contributions do not exceed the benefits paid, when combined with expectedinvestment earnings, the cash flow requirements meet benefit payments and allow forcontinued fund growth.
G:; •

COST DERIVATION
18. Estimated progress of City of Philadelphia Municipal Retirement System Fund for July 1, 1998 through June 30, 2018(dollars in thousands)
Fund at
Flscul y~u Orginninll Cily Empl11}'("C nenefit In~c~lrncnl N•• Fund at ~:nd
Ending June 30 nrvur (:onlributions' C:ontrllmtlons' rs}'mcnls' Income Increase nfYcar
'99' 2,921,358 245.143 45,737 410,662 268,617 14'),436 3,070.7\)4
2000 3,070,794 262,154 47,936 424,199 Z8J,OJJ Ili8,925 .1,13'1,719
2001 3,239,719 267,791) 50,333 440,075 2'J8.1.17 176,186 3,415.905
2002 3,415,905 280,738 52,850 458,172 314,458 189,1\74 3,605,779
2003 3,605.779 308,20t 55,492 479,577 JJ3,174 217,290 .'.llD,mil)
2004 3,823,069 319,997 58,2(,7 505,892 352,7.13 225,105 4Jl48,174
1005 4,048.174 322,650 (,1,180 536,115 372.002 219,718 4,267,11')2
2006 4,267,892 3)4,705 M,239 567,940 3')) ,567 222,571 4,490,4(,3
2007 4,490,463 347,6110 67,451 602,726 41l.J45 223,751 4,714,214
2008 4,714,214 365,566 70,825 639,0115 431,(,08 2U,914 4,943,128
200' 4,943,128 371,188 74,365 676,217 451,202 220,4711 5,1(,3,606
2010 5,16),606 398,536 78,083 712,578 472,040 236,081 S,YJ'J,(,88
2011 5,399,688 419,289 81,987 750,2(,8 4'lJ,6]5 244,(,44 5,(,44,331
2012 5,644,331 434,839 86,087 789,679 515,4(,] 14(,,711 5,R'lL042
2013 5,891.042 451,359 90,391 818,792 537,588 150,545 6,141,5R7
2014 6,141,587 492,]05 94,9)1 8611,076 5(,2,2511 2111J'17 6.422,'l!l1
2015 6,422,981 514,681 99,656 90(,,622 5118,')7(, JO(,/,')) (,,72'J,i,72
2016 6,729,672 550,315 104,639 ')41,406 617,544 3.ll,On 7,ll/,ll,7M
2017 7,060,764 577,134 109,87) 972,5?R 6411,5118 3(,2,')')5 7,42.1,75')
2018 7,423,759 605,396 115,365 1,001,08? 682,7(,6 401,4311 7,1126,1')1
NOll': Numbers may nol add because of rounding.a. City contributions are assumed to be made atth/; beginning of the year. Employee contributions and bcnelit payments are assumed I" 1><;maoJe IHi,I'ycar.
WillicHlt 1\'1.Merce!", IIlCOIporilteri
27-l

...
PLAN MEMBERSHIP
Data for active, retired, disabled, and terminated vested members as of July 1, 1998 wasprovided by the Philadelphia Board of Pensions and Retirement.
The active member data, supplied on tape and list, contained information for allRetirement System members as of July 1, 1998. The data contained basic identifyinginformation on each employee in addition to the annual rate of base compensation,overtime pay, longevity payments, and employee contribution totals. We reviewed thedata for consistency and completeness and verified it against the July 1, 1997 data forcontinued active member coverage.
The nonactive member data, also supplied on tape and list, contained information for allretired, beneficiary, disabled, and terminated vested members as of July 1, 1998.
Table 19 illustrates a net increase in total plan membership during the period.
19. Total plan membership net change
Number of PercentageMembers Increase (Decrease)
Active + 408 + 1.3%Retired + 152 + 0.8%Surviving spouses + 37 + 0.5%Other beneficiaries + 59 + 5.0%Disabled 81 1.6%Terminated vested '---.iQ + 68%Total + 625 + 1.0%
Table 20 summarizes the changes in plan membership between valuations. Using theinformation provided, we identified changes in status due to retirement, disablement,death, and new entrants. However, no information regarding transfers, return toemployment, and data corrections was available. Net Other Terminations consists of:
• Actives" Terminated and left member contributions on deposit" Died during the period" Returned to employment" Transferred from one division to another
• Retired or disabled" Died during the period" Returned to employment
William M. Mercer. Incorporated
28

PLAN MEMBERSHIP
• Terrninated vested•. Retired or died during the period•. Returned to employment
29
Table 21 breaks down active members' payroll and nonactive members' benefit payments.
William M. Mercer, Incorporated

----------------------- ----~
PLAN MEMBERSHIP
20. Reconciliation of included members
Munitlpal
Acllvc tn,mbus
1967 Plan
Police Fire Munidroal (1\1) Mnllidpal (Y)
rlan 87
Elccled rolice Fire Tnlal
30
Active, July I, 1997
New cnlr:mls nnd rehiresScp~r3lions from active service
Refunded contributions
Terminated vestedIlccame disabled
Retired
Nel Olher terminations'
Active, July 1, 1998
Rtlited members
Retired, July I, [997
New retireesNel other terminationsRetired, July I, 1998
Sunh'lnj: spouses
Receiving benefit, July 1, 1997New spousesNel other terminations
Receiving benefit, July 1, 1998
15.188 3,511 1,646 9" 5.339 25 J,OS6 774 30,527
• 107 • 7 • 2 • 6 + 1,573 • 0 .. 573 • GO 2,J2R
150 0 0 24 2(,5 0 26 3 '6829 3 0 , 0 0 0 0 J4
4J , ] 0 0 0 5 I "454 191 36 6 ] 0 0 0 (,'lO
'---'l1 '----'2 '---' '---'l '--"" '----" L-.5 e-1J> '---"1lI[4,278 3,300 1,600 889 6,3% 25 3,633 81' 30,935
11,453 4,900 1,656 " , 7 1 0 lR,OJO
• 484 • '01 + 38 • 6 • ] • 0 • 0 0 , m'----'.lJl ~ '----'" --" --" ~ '-----' ----" '----""
11,519 5,004 1,630 17 5 7 (I (I 18,IIU
4,325 1,930 959 5 (I 1 5 , 7,227
• 249 • 92 + 61 • 2 • 1 • 0 ., , 0 , <07
'----'lli '---"!l '---'-' --" --" ~ '---" ~ '----'1JJ4,358 1,923 965 7 1 1 7 , 7,2M
a. Includes lemlinated employees who len contributions on deposit, deaths, and transfers among plans_
Willi:1Il1 M. Mercer, IncurporClteri

PLAN MEMBERSHIP
20. Reconciliation of included members (continued)
1967 PIDn Plan 117
-.;
31
Municipal
Olher brncficlarin
Police Fire Municipal (1\1) Municipal (Y) E1eeletl Police Fin' Total
Rcreiving benefit, July I, [997
New [,c,neficiariesNet olm:r terminations
Rcrciving benefit, July I, 1998
1)lsablcd mcmbers
lJisabled, July I, 1997
New disabilities
Net olher terminations
Disabled. July I, 1998
Termlnall'd veslm members
Terminated vested, July I, 1997
New vested terminations
Net other terminations
Terminated vested, July I, 1998
Willimn I\rl. MerCDr, Incorp0l'<lted
934 164 48 9 0 0 17 , 1,177
• 57 • 6 • II • 0 • 0 I 0 • 7 • I • "'II '------' -'-' '----" '--" o.-Jl ~ o.-Jl "----'-'976 163 " 0 0 0 24 I, 1.23(,
2,191 2,303 '"' 2 2 0 IS I 5,0'17
• 47 • 2 • 4 I 0 + 0 • 0 + 5 + I + 59
'-----"- '---'" '-'l '----" '--" o.-Jl L-.l _-_0 '----'All2,166 2,255 563 2 2 0 26 2 5,1)1(;
678 46 7 , 0 2 0 I 7J9
• 29 + 3 + 0 • 2 + 0 • 0 + 0 • 0 • )4
+ 25 '-----'-' L-1 '----' ..::~o.-Jl ~ _-_0 + 16
7)2 J9 8 I, I 2 0 I "0

PLAN MEMBERSHIP
21. Summary of annual payroll and annual benefits (thousands)
1967 Plan Plan 117
Municipal rolin' Fire Municipal (M) Municipal (V) f:ll.'ctcd Police Fire Tolal
Arlin nll'mbHS
Active as of July J. 1997 S 538,161 S 146,260 S 68,080 S 34,082 S 147.939 S 1,740 S 105,445 S 25,942 S 1.Q(,7,M'>
New erlltanls and pay increases (351?) (] 984) 873 £2(4) 38860 -l& 24 379 3 174 60 576
Active as of July I, 1998 , 5)4,641 S 143,277 $ 68,953 S 33,858 S 186,799 S 1,7S!! $129,824 $ 29,115 S 1,12R,225
Retired members
Retired as of July 1, 1997 , 144,649 , 90,520 S 30,680 , 85 , 10 , 17') , 7 , , , 2M,131
Net new retirees (, 421 4280 IR? 42 27 -" (7) , -"'.201Retired as of July I, 1998 , 151,070 , 94,800 S 30,869 I 127 , 17 , '" , , , , $ 2n,082
Survh'ing spouses
Receiving benefit as of July I, 1997 , 19.825 , 11,182 , 4,950 , 6 S " , , S 29 , II , )(,,(107
Net new spouses 931 331 243 J3 I -" 10 0 I 528
Receiving benefit as of July I, 1998 , 20,756 , 11,513 , 5,193 , 19 S I ., 4 I J9 , " , J7,SJS
Othrr brnrl1darirs
Receiving benefil as or July I, 1997 , 3,9'18 , 852 , 272 , 28 , " , " I "" , 2) , S.2B
Net new beneFiciaries 333 J3 75 0 0 -" 15 5 460
Receiving beneFit as of July I, 1998 • 4,331 , 865 , )47 I 28 , 0 , " , liS • 2R , 5,713
NOfC: Numbers may not add because ofrounding.
William M. Mercer, Incorporated
32

PLAN MEMBERSHIP
21. Summary of annual payroll and annual benefits (thousands) - (continued)
1967 Plan Plall 87
Munifi"al Polite Fire Municipal (1\1) l\Iunicil'al (V) t:lrded Police Fire "I"olal
Disabled members
Oisablcd as of July I. 1997 , 25,840 S 33.644 S 9,285 , 30 , 34 , 0 S 437 S 6 $ 69,277
Net new disabilities 201 (4m --lilll --'l ----" ----" --ill ~ (52)
Disabled as of July I, 1998 , 26,041 $ 33,217 $ 9,134 S )0 , )4 , 0 , 629 , J3 S 69,111\
Terminated Hsled members
Terminated vested as of July I, 1997 , 7,854 , 479 , 53 , 44 , 0 , 51 $ 0 $ 8 $ SAlI'}
Net new vested lenninations ! 543 C7) ----'-l ----ll -'" --" ------" ----" _l.fill
Terminated vested as of July I, 1998 $ 9,397 $ 472 , 80 , 77 $ 41 $ 51 $ 0 , , ~ 10.126
NOll'; Numbers may not add because of rounding.
Willi<illl M. Mercer, Illcorporillcd
33

PLAN MEMBERSHIP
A distribution of the active employees' annual earnings for each division by age andservice group as of July 1, 1998 appears in Tables 22 through 28.
34
A distribution of inactive members by age and monthly pension is shown in Tables 29-32.
William M. Mercer, Incorporated

PLAN MEMBERSHIP 35
22. Municipal (1967 Plan) annual average earnings and counts: service groups by age groups
A" S •• rvlce G r 0 U I'Group 04 5-9 10-14 15-19 20-24 25-29 30-34 35-39 ." Total
0-19 1 0 0 0 0 0 0 0 0 226,19) 0 0 0 0 0 0 " 0 26,19J
20-24 5 2 0 0 0 0 0 0 0 726,306 32,536 0 0 0 0 0 0 0 28,086
25-29 25 148 14 0 0 0 0 0 0 18728,55) J2.6M 31,959 0 0 0 0 0 0 32,IWJ
30-34 JO '84 '"' JJ 0 0 0 0 0 8],)0,106 33,609 34,007 36,080 0 0 0 0 0 ]J,lIS
35-39 Jl 619 844 ]26 2J 0 0 " 0 1,84428,047 32,567 )7,568 38,608 ]9,038 0 0 " 0 35,926
40-44 28 609 855 676 446 50 0 0 0 2,67035,437 ]2.000 37,527 41,508 39,48') 311,648 0 " 0 37,60J
45-4' 18 40' 699 521 794 6J9 75 , 0 ],20845,102 ]1,924 )4,953 39,397 42,403 40,769 41,172 ]7,759 0 ]8,445
50-54 18 J09 494 405 5J8 808 J98 4(, 0 ],016JJ,O]O 31,488 ]5,162 39,666 39,981 42,734 41,6'JO 41,647 0 ]9,226
55-59 7 194 272 220 221 249 225 108 " 1,50738,0]2 )1,631 34,]03 36,012 36,999 41,]79 42,169 40,0(,1 35,263 37,385
60-64 2 '26 Il5 '16 99 92 55 J8 J9 70228,300 29,671 35,286 ]5,863 40,244 37,289 41,440 42,')83 41,lI10 36,5J2
65-69 ) 45 46 27 2S 22 " 4 18 20141,547 26,040 Jl,887 38,229 30,528 4J,J04 33,1(,') 47,,~15 43/,54 ]4,OR9
70-74 0 9 19 14 10 4 ) 2 7 '"0 17,649 27,545 29,579 39,060 17,789 45,6R] 46.'),\2 42,')32 JO,725,.. 0 2 ) 9 4 " ) 0 5 ]20 8,962 26,586 36,199 39,483 30,768 41,5R9 0 35,231 33,342
TOTAL 170 3,008 3,668 2,347 2,160 1,876 770 199 80 14,27B32 642 32075 35978 39 316 40352 41 403 41 655 41 195 411622 37445
NQle: Age represents attained age
Willimn M. Mercer, Incorpor<lted
-- .----

PLAN MEMBERSHIP 36
23. Police (1967 Plan) annual average earnings and counts: service groups by age groups
A,. Ser\'lcl' G r n " p(;rOlip 0-4 So, 10_]4 15-19 20-24 25-29 .JO-~4 35-39 ." Tou'!
0-19 0 0 0 0 0 0 0 0 0 00 0 0 0 0 0 0 0 0 0
20-14 0 0 0 0 0 0 0 0 0 00 0 0 0 0 0 0 0 U 0
25-29 l , , 0 0 0 0 0 0 ,35,285 39,295 39,295 0 0 0 0 0 0 37.290
30-34 0 lJ 75 , 0 0 0 0 0 990 39,073 415M 39,995 0 0 0 0 0 40,985
35-39 l " JJS '90 0 0 0 0 0 SJ838,276 39,575 41,)34 44,015 0 0 0 0 0 42.233
40-44 0 7 l8S 347 280 • 0 0 0 9130 39,933 40,811 43,522 44,919 45,172 0 0 0 43,088
45-49 0 3 1S7 143 345 26S , 0 0 9140 )(;,091 40,616 42,224 43,692 45,819 4(,,127 0 0 4),528
50-54 0 , 31 " ''I lSJ " l 0 5690 )9,295 40,341 40,557 42.228 44,742 47,819 64,293 0 44,114
55-59 0 0 0 0 33 " •• lS 0 70S0 0 0 0 41,891 43,262 47,431 49.112 " 45,567
60-64 0 0 0 , 0 14 " 9 3 J80 0 0 37,688 0 41,154 42,21U 57,904 73,292 47,1\94
6<-<;' 0 0 0 0 0 0 l " , r,0 0 0 0 0 0 45,359 0 5(',1'14 52 ,SRI
70-74 0 0 0 0 0 0 , 0 3 ,0 0 0 0 0 0 40,145 0 5R,2J7 53.8M
75+ 0 0 0 0 0 0 U 0 " 00 0 0 0 0 U " " " "
TOTAL , " '84 128 799 59' 19" 36 1<, J,JOO)678t 3? 139 41 022 43195 43789 44996 47213 52 154 61936 '.!.ill
NOfe: Age represents al1ained age
Willitltn M. Mercer, Incorporated

PLAN MEMBERSHIP 37
24. Fire (1967 Plan) annual average earnings and counts: service groups by age groups
A,. Service G rOil pGroup 0-4 ,-, 10-14 15-19 20-24 25-29 30-34 35-39 40> Total
0-19 0 0 0 0 0 0 0 0 0 00 0 0 0 0 0 0 0 0 0
20-24 0 0 0 0 0 0 0 0 0 00 0 0 0 0 0 0 0 0 0
25-29 0 0 0 0 0 0 U U 0 00 0 0 0 0 0 0 0 0 0
30-34 0 J 10 0 0 0 0 0 0 130 )(',988 40,574 0 0 0 U 0 0 ]'),74(,
35-39 0 , I2J 7 0 0 0 0 0 13'0 36,499 40,492 40,984 0 0 0 0 U 40,)?!!
40-44 0 I 147 26 " , II 0 0 2770 )4,682 40,620 42,267 44,545 4J,052 0 0 0 42,191
45-49 0 2 57 44 Jl7 110 6 0 0 5420 39,645 40,323 41,G05 42,927 46,516 43,478 0 0 43,389
50-54 0 0 I 15 132 187 107 I 0 44J0 0 45,027 40,69] 41.978 4),440 46,198 59,2511 0 43,617
55-59 0 0 0 0 J 58 6B J5 0 1640 0 0 0 40,245 42,126 44,164 49.255 0 44,45R
60-64 0 0 0 0 0 0 II 12 I 240 0 0 0 0 0 4),2(,0 45,521 46,127 44,510
65,(;9 0 0 0 0 0 0 0 2 0 20 0 0 0 0 0 0 42.667 0 42,(,(,7
70-74 0 0 0 0 0 0 II 0 I I0 0 0 0 0 0 0 II 52,2(,3 52)(,]
75+ 0 0 0 0 0 0 0 0 0 00 0 0 0 0 0 0 0 " 0
TOTAL 0 10 JJ8 92 551 365 In 50 2 1,6000 F021 40535 42074 4291$ 44204 45125 48 225 49195 '.lll26
Nore: Age represents attained age
William Nl. Mercer, Iilcorpol'atcd
-~--

PLAN MEMBERSHIP 38
25. Municipal Plans M & Y (Plan 87) service groups by age groups
Ag. Sl'rvlcc GroupGroup 04 So, 10-14 15-19 20-24 25-29 30-34 ;ls-39 40' Tolal
0-19 4 0 0 0 0 0 0 0 0 412,608 0 0 0 II 0 0 0 0 12,608
20-24 334 16 0 0 0 0 0 0 0 35024,495 26,268 0 0 0 0 0 0 0 24,576
25-29 1,176 102 4 0 0 0 0 0 0 1,28229,755 30,140 28,048 0 0 0 0 0 0 29,781
30-34 1,081 22B 49 I 0 0 0 0 0 1,36029,927 36.575 31,738 32,641 0 0 0 0 0 31,117
35-39 '48 209 71 4 0 0 0 0 0 1,23229,656 35,060 40,006 35,5]1 0 0 0 0 0 ]1,189
40-44 81' 170 78 12 8 0 I 0 0 1,08328,978 ]6,822 ]8,809 32,000 ]2,82] 0 26,001 0 0 ]0,977
45-49 S7J 148 49 3 8 12 0 0 0 7?728,618 38,114 37,249 ]0,288 51,9l5 )4,539 0 0 0 31,241
SO-54 3SS 105 64 5 4 4 4 0 0 54129,917 36,490 33,718 66,570 32,246 45,510 40,IUZ 0 0 ]2,166
55-59 204 " 28 4 S 2 I J 0 31227,537 )4,740 44,698 30,585 42,683 ]7,184 21'1,21\1 .30,864 0 ]0,956
60-64 9? 54 17 I I I 0 2 0 17523,875 ]5,887 34,521 ]],480 26,440 9,209 0 2R,940 0 28,(,60
65-69 47 28 7 0 0 2 0 0 2 ""14,319 27,105 31,862 0 0 34,051 0 II 3ll,J63 20,928
70.74 21 14 2 0 0 0 n 0 0 3710,542 11,985 .20,063 0 0 0 n 0 n 11,60.1
15+ II 14 I 0 0 0 0 0 n 266,440 15,900 29,182 0 0 0 0 0 n 12.401l
TOTAL 5,672 ],153 370 30 " 21 6 5 2 7,285288Q6 14 899 36889 37 943 40259 35628 36 554 3Q1l'!4 38.163 30289
Nule: Age represents allainedage
William M. Mercer, Incorporated

PLAN MEMBERSHIP 3926. Elected (Plan 87) service groups by age groups
Ag. Scr,'lce G r n II f1Group 0-4 ,., 10.14 15-19 20-24 25-29 30-.14 35-39 ••• Total
0-19 0 0 0 0 0 0 0 0 0 00 0 0 0 0 0 0 0 0 0
20-24 0 0 0 0 0 0 0 0 0 00 0 0 0 0 0 0 0 0 0
15.19 0 0 0 0 0 0 0 0 0 00 0 0 0 0 0 0 0 0 0
30.34 0 0 0 0 0 0 0 0 0 00 0 0 0 0 0 0 0 0 0
.15-39 0 , 0 0 0 0 0 0 0 ,0 65,000 0 0 0 0 0 0 0 (,5,000
40-44 0 I I 0 0 0 0 0 0 ,0 65,000 65,000 0 0 0 0 0 0 65,000
45-49 0 I 0 0 0 I 0 0 0 ,0 85.000 0 0 0 67,000 0 0 0 76.000
50.54 I I 0 ) I I 0 0 0 765,000 65,000 0 70,000 110,000 65,000 " 0 0 73,571
55-59 , , 0 0 0 0 0 0 0 465,000 86,686 0 0 0 0 0 0 " 75,R4J
60-64 0 I I I 0 0 0 0 0 )
0 65,000 65,000 65,000 " 0 0 0 0 6S,DOO
65-69 0 0 0 I I 0 " 0 I .J0 0 0 67,000 67,500 0 0 0 GR,flnO 67,500
70-74 0 0 0 0 0 0 0 0 0 00 0 0 0 0 0 0 0 0 0
75' 0 0 I I 0 0 " 0 " 20 0 65,000 65,000 0 0 0 0 0 6S,O(J()
TOTAL 3 8 3 6 , , 0 0 I 1565000 jZ972 65000 67833 8a 750 66 QQQ 0 0 f>8 000 70315
Nole: Age represents attained age
WilliflTll 1\:1.Mercer, Im.:orporiltcd

PLAN MEMBERSHIP 40
27. Police (Plan 87) service groups by age groups
Ag' S l' r v I c l' G r I) \I fIGroup 0-4 5-' 10-14 15-19 20-24 25-29 30-)4 35-39 ". Total
0-19 , 0 0 0 0 0 0 0 0 928,19) 0 0 0 0 0 0 0 0 28,193
2(1.24 412 2 0 0 0 0 0 0 0 42'30,756 31,525 0 0 0 0 0 0 0 30,160
25-29 788 )00 2 0 0 0 0 0 0 1,0')032,822 39,5(,) 36,865 0 0 0 0 0 0 34,684
30-34 4J2 665 2 I 2 0 0 0 0 1,14233,598 39,713 34,088 39,295 38,101 0 0 0 0 37,178
35-39 212 165 , ) 0 0 0 0 0 5"3J,4B 39,444 ]7,765 38,104 0 0 0 0 0 37,502
40-44 JO m I 4 0 0 0 0 0 )0032.857 39,444 )9,645 39,948 0 0 0 0 0 37,914
45-49 17 J8 I 0 0 0 0 0 0 7631,898 39,218 39,295 0 0 0 0 0 0 35.656
50-54 , 0 0 0 I 0 0 0 0 5JJ.255 0 0 0 40,245 0 0 0 0 34,653
55-59 2 I 0 0 0 0 0 0 0 )
34,257 36,988 0 0 0 0 0 0 0 35,167
6O~' 0 0 0 0 0 0 0 0 0 00 0 0 0 0 0 0 0 0 0
65-69 0 0 0 0 0 0 () 0 0 ()
0 0 0 0 0 0 () 0 0 ()
70-74 0 0 0 0 0 0 () 0 () 00 0 0 0 0 0 0 0 () ()
", 0 0 0 0 0 0 0 0 () 00 0 0 0 0 0 0 0 () 0
TOTAL 2,016 1,596 10 8 ) 0 () 0 () 3,r,J332 603 39 661 37,120 39176 38/l16 0 0 0 () J 5.1.l.S.
NOi/!: Age represents atl.:lined age
William M. Mercer, Incorp0I'<JLcd

PLAN MEMBERSHIP 41
28. FIre (Plan 87) service groups by age groups
Ag. S~r •. lte G r (l U I'Group 0-4 5-9 10-14 15-19 20-24 2S-29 30.34 35-39 40+ Tolal
0-19 0 0 0 0 0 0 0 0 0 00 0 0 0 0 0 0 0 0 0
20-24 )] 0 0 0 0 0 0 0 0 )]29,674 0 0 0 0 0 0 0 0 29,674
25-29 15' 14 0 0 0 0 0 0 0 16531.991 40,044 0 0 0 0 0 0 0 31,674
30-34 15' 102 I 0 0 0 0 0 0 2M33,082 40,165 )0,0)4 0 0 0 0 0 0 35,11)')
35-J9 100 125 I , 0 0 0 0 0 22733,982 40,301 39,295 39,295 0 0 0 0 0 37,508
40-44 25 70 0 0 0 0 0 0 0 9533,820 39,9')11 0 0 0 0 0 0 0 38,372
45-49 II 19 0 0 I 0 0 0 0 )]
31,790 39,504 0 0 39,645 0 0 0 0 36,771
50-54 I I 0 0 0 0 I 0 0 334,678 43,140 0 0 0 0 43.840 0 0 40,553
55-59 I 0 0 0 0 0 0 0 0 I28,834 0 0 0 0 0 0 0 0 211,1134
60-64 0 0 0 0 0 0 0 0 0 "0 0 0 0 0 0 0 0 0 "65-<>9 0 0 0 0 0 0 " 0 0 0
0 0 0 0 0 0 11 0 0 0
70-74 0 0 0 0 0 0 0 0 11 110 0 0 0 0 0 0 0 " 11
'" 0 0 0 0 0 0 0 0 0 00 0 0 0 0 0 0 " 0 0
-TOTAL 478 3)] 2 I I 0 I 0 11 '14
32 708 40147 34 665 39295 39 645 0 4] 840 0 " ]5768
Note; Age represents altained age
Willii'lrn M. Mercer. Incorpomted
--_.-

PLAN MEMBERSHIP
29. Terminated vested (1967 Plan and Plan 87) members, July 1, 1998
.M.u.n.irlpall\1cmbrn Police '\Jembc[s Fire Mrmlll:n
l\1onlhlr Monthly MoolhlyA,. People rcn~loQ I'[oplc Pcnsh'll PCQplc rcnsill"
UNDER 40 " S 14,896.42 11 SI0,975.08 2 S 1,386.6740-44 120 110,450.50 24 25599.58 5 4,248,0045-49 2" 300,195.50 2 1,106.83 I 1,205,8)50-54 '" 329,175.42 0 0.00 0 00055-59 J4 27,372.15 I 594,00 0 0,0060-64 g 4,440.58 0 0.00 I 502.n
OVER 64 IJ 10,623.17 I 1,069.58 0 0.00TOTAL 741 5797,154.17 J9 $39,345.00 9 $7,342.75
Average Monthly Pension
42
Nole: Numbers rruJ)'nol add because of rounding.
Willi<llll M. Mercer, Incorpor<lted
Municipal
l'olice
fire
$1,076
$1,009
S BI6

PLAN MEMBERSHIP
30. Disabled (1967 Plan and Plan 87) members, July 1, 1998
1\Iunkinall\lcmbu5 rolicr Members Fjre I\1tUlb.cLS.-
Monlllt~. Monthly MnnlhtyAg. rcol'll' rl'n~inn Propll' rension P""ple rension
UNDER 40 J9 , 54,480.25 65 , 123,681.41 5 , 7,367.4240-44 89 113.819.92 119 226,966.67 14 25,396.5845-49 200 252.892.83 294 474,333.50 63 1(1(',849,67
50-54 302 407,894.92 47J 703,20125 1IJ IM,149.2455-59 365 419.839.25 J77 448,884.83 115 180,885.50
1><''' '" 300,195.50 253 254,(,41.1" 58 83,234.92
65-69 285 232,344.83 287 248,249.08 4(, 61,J<J4.n
70-74 2J5 203.653.17 2J7 206,391.75 48 52,769,0075-79 190 119,282.00 "' 74,275.67 57 52,708.08
80-84 93 50,299.33 " 50,164.17 21 17.283.33
OVER 84 34 20,695.00 14 9,746.08 15 11,816.08
TOTAL 2,170 12,175,397.08 2,281 $2,820,541.50 565 5763,854.11.1
Average 1\Innlhly Pension
43
Municipal
Police
Fire
Nole: Numbers !Ny nol add because of rounding.
WilliiJlll IV1.Mercer, Incorpol'<ltcd
SI,002
$1,237
$1,352

PLAN MEMBERSHIP
31. Retired (1967 Plan and Plan 87) members, July 1, 1998
Mllnlcipall\lcmbtrS- PnliCJ: I\1l'00bcn Fire I\Iclllhm
Monthl)' Monthl}' MonlhlyA,_ Prop! •.• Pension Proplr rension Pfillllr Pension
UNDER 40 0 • 0.0{) 0 • 00{) 0 • 00040-44 1 700 0 0.00 0 0,00
45-49 4 24,25 405 735,143.83 " IOJ,131UU
50-54 4 4,216.50 '.l611 1,808,537.67 241 475,624.50
55-59 1,189 2,016,536.17 1,139 1,925,685.J] 311 (,13,917.08
60.64 1,878 2,820.686.33 '" 1,3('0,707-)) 262 475,649.67
65-69 2,454 3,018,085.92 732 1,047,635.50 151 239,2R5.1770-74 2,335 2,399,899.08 456 (,39,0)4,33 167 239,356.17
75-79 1,805 1,364,108.75 143 163,376.42 191 207,783.08
80-84 1,093 639,508.00 164 142,610.75 154 142,105.51\OVERS4 785 354,678.75 10' 77,273.33 91 74.967.67
TOTAL 11,548 $12,611,750.67 5,004 $7,'JOO,OO4.3J 1,630 $2,572,427.75
Average 1\1l1lllhly "elision
44
Note: Numbers may nol add because orrounding.
William IV1.Mercer, Incorporated
Municipal
rolice
Fire
$1,093
$1,579
$1,57R

PLAN MEMBERSHIP
32. Beneficiaries (1967 Plan and Plan 87) members, July 1, 1998
.M.u.ukip.t Members !'olirr Members fjrl' I\1crnhm
Monthly Montbly Monthly
A" Proptt' r ••n~ion Profll •• rl'n~lon I'l"O[llc rcn5ion
UNDER 40 33' , 129,95R.SR 115 , 52,843,59 4l $ 21,267.0040-44 45 19,562.00 13 13,106.75 2 2,679.6745-49 174 87,523.92 7l 57,192.58 27 23,205.6750-54 198 106,547,00 154 117,251.92 38 2/i,324.5855-59 J22 183,396.33 JR' [26,117 .92 4) 36,255.5960-64 456 252,024.42 214 127,455,00 42 27,396.2565-69 '49 396,198.00 m 179,907.84 117 65,701.7570-74 799 310,496.42 254 I24,RJ 1.75 148 71,621.5075-79 839 279,737.50 247 91,351.58 161 58.849.5180-84 671 187,117.00 256 79,3 15.75 243 80.806.67OVER 84 665 142,274.33 280 74,930.67 167 50,774.42
TOTAL 5,352 $2,094,835,)3 2,117 $1,044,305.50 1,031 $4(,4,882.58
A\'cngc Monthly Pendon
45
NOfe: Numbers may not add because of rounding.
William M. Mercer, Incorporated
Municipal
Police
Fire
$ J?l
S 4?J
$ 451

FINANCIAL EXPERIENCE OF FUND 46
The July 1,1998 Retirement System net assets are $3,248,877,534 on a market valuebasis and $2,840,546,660 on a cost value basis. Financial experience is reportedthrough the following tables:
• Table 33 contains a summary of assets and liabilities• Table 34 shows receipts and disbursements• Table 35 itemizes City contributions for the year ending June 30, 1998• Table 36 summarizes 1998 fiscal year administrative expenses• Table 37 shows July 1, 1998 adjusted market value of assets under the five-year
spread gain asset valuation method• Table 38 shows the July 1,1998 allocation of adjusted assets among all divisions.
Table 34, showing the fund's receipts and disbursements during the fiscal year endingJune 30,1998, also notes that employee, City, and state contributions areapproximately 45% of the yearly receipts on a market value basis. On the dis-bursement side, benefit payments were approximately 96% of all disbursements.
Below is a summary of the approximate rates of return for this fiscal year compared tolast year.
Rates of return comparison
Fiscal Year EndjngJune 30,1997 June 30, 1998
Cost valueMarket valueAdjusted market value
13.3%18.3%12.2%
14.1%14.3%13.1%
Table 37 shows the adjusted market value of assets used in the cost calculations. Allassets are valued each year at market value and compared to the expected value of assetsbased on a 9% return assumption. The difference is spread equally over the current yearand the next four years.
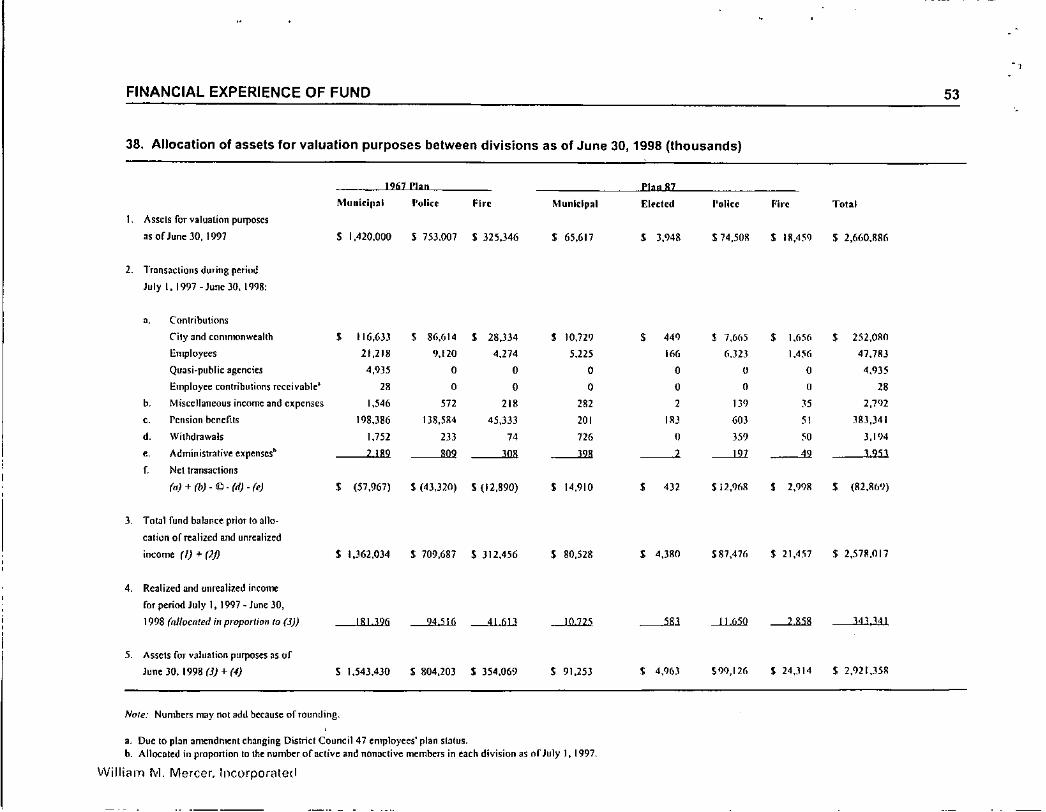
As required under Act 205, amortization payments, such as experience gains/losses, mustbe reported separately for each participating division. For the valuation, assets must beallocated among divisions (Table 38). This allocation does not constitute a legalseparation of the assets, however.
William M. Mercer, Incorporated

FINANCIAL EXPERIENCE OF FUND 47
,
Table 38 begins with July 1, 1997 valuation assets. The noninvestment transactions (item2), other than administrative expenses attributable to each division, were provided by theCity of Philadelphia's Finance Department. Administrative expenses were allocatedaccording to the member count of each division at the beginning of the fiscal year.Investment income (after investment expenses) was allocated in proportion to the fundbalance of each division before investment income.
William M. Mercer, Incorporated

'",'
FINANCIAL EXPERIENCE OF FUND
33. Statement of assets and liabilities (fiscal year ending June 30, 199B)
Cost Value
Assets
48
Market Value
CashInvestment accountsAccounts receivableInterest and dividends receivableDue from other fundsDue from other goverrunental unitsOther assets
Total assels
Liabilities
$ 182,667,881 $ 182.667.8812,727,112,384 3,135.443,258
6,960,946 6,960,94619,661,551 19,661,5512,046.447 2,046.4471,085,505 1,085,505
11 220 11 2?0
$2,939,545,934 S 3,347.876,808
Vouchers payableAccounts payableSalaries and wages payableAccrued expensesFunds held in escrowDeferred revenueOther liabilities
Total liabilities
$ 41,0813,006,765
96,797463,398
4,783,92790607306
$ 98,999,274
$
$
41,0813,006,765
96,797463,398
4,783,92790607 306
98,999,274
Fund balance
William M. Mercer, Incorporated
$ 2,840,546,660 $ 3,248,877,534

" .
FINANCIAL EXPERIENCE OF FUND
34. Statement of receipts and disbursements
49
Cost Value J\.larket Value
Balance as of July 1, 1997 $ 2,566,957,614 $ 2,921,182,544
Receipts
Contributions:Commonwealth of Perm sylvaniaSupplemental State Assistance (Act 205) 5 0 5 0City of Phil adelphia' 252,079,988 252.079,988Employees 47,811,748 47,811,748Quasi-public agencies 4,935,212 4,935,212
Interest and dividends 115,263,336 115,263,336Gain from sale of investtnents 254,262,614 254,262,614Miscellaneous operating revenues 2 79') 368 ') 79" 368
Total receipts $ 677,145,266 I 677,145,266
Disbursements
Withdrawals I 3,193,824 $ 3,193,824Benefit payments 383,340,814 383,340,814Administrative expenses 3,953,359 3,953,359Investment manager fees J'1; 068 223 13068223
Total disbursements $ 403,556,220 $ 403,556,220
Change in unrealized appreciation/(depreciation) $ I 54,105,944
Balance as of July 1, 1998 I 2,840,546,660 I 3,248,877,534
Approximate return on investments during year 14.1% 14.3%
a_ Includes Commonwealth of Pennsylvania general Slate assistance ($32.877.029) and COLA reimbursemenl ($3,579,560).
William M. Mercer, Incorporated

" "
FINANCIAL EXPERIENCE OF FUND
35. Fiscal 1998 City contributions
50
Date
July 3, 1997
August I, 1997
June 30,1998
Various (Quasi-public agencies)
Accrued
Total
Amount
$190,200,000
51,350,000
10,529,988
3,849,707
1 085 'OS"
$257,015,200
a. City-accrued contributions are $0; qU:l5i-public agencies accrued
conlT'ibutions are $1,085,505.
William M, Mercer, Incorporated

;.
FINANCIAL EXPERIENCE OF FUND
36. Statement of administrative expenses foryear ending June 30, 1998
51
Personal services
Purchase of services
Materials and supplies
Employer's share of fringe benefits
Miscellaneous
Total
William M. Mercer, Incorporated
$ 2.216.764
711,565
78,640
857,017
89 '37'3
S 3,953,359

FINANCIAL EXPERIENCE OF FUND 52
37. Derivation of assets for valuation purposes as of July 1, 19985-year spread gain method
llnrrc0ll.niud
Amount2002200119991998
______________ ~yu,rQ(RrcoJ.:uiljoll
2000Total Gainor (Lo~!)July I
1994 $(157,677,827) S{3I,535,5(6) - , "1995 55,532,304 11,10(',4(,1 11,106,460 11,106,460
1996 138,209,192 27,641,838 17,641,839 27,MI,I'09 55,283,(,78
1997 233,367,648 46,613,530 46,673,530 4(',67),529 46,673.529 - 140,fJ211,5l\R
1998 151,386,333 30,277,267 )0,277,261 )0,217,267 )0,271,266 30,277.266 --l21J.ll2JlM
Tolat 84,163,530 115,699,096 104,592,635 76,950,795 )O,277,26/i $ 327,51<),7'J2
I. July t, 1998 market value :53,248.877,534
2 Unrecognized gain/Closs) 327 519,792
J. July I, 1998 adjusted market (I) - (2) $2,921,357,742
•• Appro'tmate return 011Illvestments during year 13.1%
Willialll M. Mercer. IncorpOr8ted
FINANCIAL EXPERIENCE OF FUND
38. Allocation of assets for valuation purposes between divisions as of June 30, 1998 (thousands)
1967 Plan Plan..8l.Munirlpal "olin Fire Municipal Eluted "olicc Fire Total
1. Assets for valuation purposes
as of June 30, 1997 S 1,420,000 S 753,007 S 325,346 S 65,617 S 3,948 $ 74.50~ .$ IR,4YJ $ 2,660,88(,
2. Transactions during periudJuly I. 1997 - June )0, 1998:
.. Contributions
Cily and commonwealth S 116,6J3 S 86,614 • 28,334 • 10,729 • 440 .$ 7,665 • 1,(,56 S 252,OllO
Employees 21,218 9,120 4,274 5,225 166 6,323 1,4% 47,7113
Quasi-public agencies 4,935 0 0 0 0 U 0 4,935
Employee contributions receivable' " 0 0 0 0 0 " 28
b. Miscellaneous income and expenses 1,546 572 218 282 2 JJ9 )5 2,7<)2
,. Pension benefits 198,386 138,584 45,333 201 I8J 60J " 383,)41
d. Withdrawals 1,752 lJJ 74 126 " 35? 5? 3,1<)4, Admi[listraliv~ expenses. 2 189 809 30R 328 ----.l ----"U 49 3953
r. Ncllransacl;ons
(n)+(b)-~.(tI)-M S (57,967) S (4J,J20) S (12,H20) S 14,910 S 4Jl 512,%8 • 1,998 S (1l2.l16'J)
J. Total fund balance prior to al1o-
calion of realizcd and unrealiled
income (IJ + (2j) S 1,362.034 S 709,687 S 312,456 S 80,528 • 4,380 587,476 $ 21,4.~7 $ 2,578,017
4. Realized and unrealized income
for period July I, 1997 - June 30,
1998 (nlfocnted illproportirm /0 (3» 181 396 94516 41 613 1072S -----", --'.Lf.>jj} ---".ill ----"l.l.J;l
5. Assets for valuation purposes as of
June )0, 1998 (JJ + (4) S 1,543.430 S 804,203 S 354,069 $ 91,253 • 4,96.1 $99,126 S 24,.114 S 2,921,358
Nole: Numbers may not add because of rounding.
a. Due to plan ameTldtnent changing District Council 47 employees' plan stah/s.b. Alll)(:aled in proponion to the number ofaclive and nonactive members in cack division as of July I, 1997.
Williilln 1\01.Mercer, Incorponlted
53

,, .'
MAJOR FEATURES OF THE RETIREMENT SYSTEM
1967 PLA.,'>;
54
MUNICIPAL (PLANJ) UNIFORMED (PUNS D AND X)
PartIcipation Full-lime employeesp:micipateon their dale of Same as municipal.
employment. Temporary employees participate after
completing 5i);;months employment. Participation is
limited \0 employees hired beforc January 8. 1987.
District Council 33 members continue to be Planparticipants regardless of hire date. Current District
Counci147 members hired afler January 8. 1987 were
switched from Plan 87 \0 1967 Plan dfeclive on their
hire dales.
Total compensation
Final comptnulion
Credited service means the period of employment
with the Cil}' during which the employee makes
contributions to the Retirement System. Certain
leaves of absence may also be credited.
Total compensation means:
• For members represented by AFSCME District
Council 33, AFL-CIO or District Council 47,
AFL-CIO or employees of the Common Pleas
Coun. the basc rlttC of pay, longevity payments,
and ovcnime received during a 12-month period.
• For members who hold an elected office, exempt
position or other position not represented by a
union, the base TfIleof pay and longevilY
payments received during 12-monlh period.
Final compensation means whichever is greater:
annual base rale of pay at the time of termination or
the tOlal compensation received during the 12 months
immediately preceding lermination.
Same as municipaL
Towl compensation means the base rote of pay
and longevity payments received during a 12-
month period.
Same as municipal.
William M. Mercer, Incorporated

MAJOR FEATURES OF THE RETIREMENT SYSTEM
MUNICIPAL (PLAN i)
1967 PLA;o;
Wi/FORMED (PLANS D AND X)
55
Ay~rage finll compensation
Employee conlribulions
Servke retirement
Eligibility
William M. Mercer. Incorporated
Average final compensation means:
• For members represented by
AFSCME District Council 33,
AFL-CIO or District Cciuncil47,
AFl-elO or employees of the
Common Pleas Court, Municipal
Coun, or Traffic Coun, thearithmetic average orlhe IOIlII
compensation received during the
three calendar or anniversary years
that produces the highest average
• For members who hold an elected
office, exempt poshion or otherpositions nOI represented by a
union, the arithmelic average of the
101alcompensation received during
the three calendar or anniversary
years that produces the highesl
average.
Each employee who panicipates in the
Social Security System, contributes
3''.4% oftolal compensation up to the
taxable wage base ($65,400 in 1997 and
$68,400 in 1998) and 6% of total
compensation above Ihe taxable wage
base 10 the Retirement System.
Each employee who does nOI panicipate
in Ihe Social Security SYStem
contributes 6% of his 10lal
compensation to Ihe Retiremenl System.
Each municipal employee is eligible to
retire and receive a service pension at
age 55 with one year of service.
Average finol compensation means the
highest of;
• The tOlal compensation received during
the 12.month period; or
• The annual base rate of pay, excluding
longevi!)' paymc-nts, calculated from
the final pay period; or
• The arilhmetic average of the total
compensation received during five
calendar years of employment.
Same as municipal.
Each uniformed employee is eligible 10
retire and receive a service pension at age
45.

, , "
MAJOR FEATURES OF THE RETIREMENT SYSTEM
1961 PLA."
56
MUNICIPAL (PLAN)) UNIFORMED (PLANS D AND XI
Benefit amount
Deferred vested retircmenl
The service pension equals 2Y,% of the The service pension equals a 2Y,~oof theemployee's average final compensation employee's average final compensation
multiplied by years credited service to a mulliplied by years credited service. subject
maximum of 20 years plus 2% of the to a maximum of 100% of average finol
employee's average final compenslltion compenslltion.
multiplied by years credited service
abOl'e :20, to a maximum of 80% of the
employee's average final compensation.
Eligibility
Benefit alJlount
Withdrawal benefit
William M. Mercer, Incorporated
A terminating employee who has
completed 10 or more years credited
,: service is eligible for a deferred vested
retirement benefit.
The annual deferred vested benefit is
determined the same as service
pensions, using averuge final
compensation and credited service at
termination. This benefit begins at
service retirement date. Jf the member
dies before the deferred vested benefit
begins, an ordinary death benefit is
payable (see Ordinary Death below).
AS an alternative before benefits begin,
a plan member who is terminating
employment may ask to have employee
contributions returned (without intell:st)
instead of receiving the deferred vested
benefit.
Each employee terminating who has
completed less than \0 years credited
service will receive a withdl'llwlli benefit
equ.alto his or her employee
contributions (without imerest).
Same as municipaL
Same as municipal.

MAJOR FEATURES OF THE RETIREMENT SYSTEM
1~67PLAl\'
57
Ser\'lce-conneded death
MUNIOPAL (PLAN J) UNIFORMED (PLANS D AND X)
Eligibility
Benefit amoum
Ordinary dealh
The beneficiary of each active employee Same as municipal.
who dies solely from the pcrformnnee of
duties of the employee's position wilh
the City is eligible fOT an immediate
death~efi\.
The death benefit equals total employee Same as municipal.
contributions paid 10 the Retirement
System, plus a yearly payment of 60%
of the employ~'s final compensation
reduced by any death benefits payable
under the Workers' Compensation Ac~.
This benefit is payable to the spouse
until his or her death or remarriage. The
spouse is entitled to an additional yearly
payment of 10% cffinal compenslItion
for each dependent child (up 10 twO
children) unlillhe child reaches age 18.
If there is no spouse, or if the spouse
dies or remarries, each dependent child
(up 10 three children) is entitled to
receive a yearly payment of 25% of
final compensalion until the child
reaches age 18. Iflhere is no spouse or
dependent children. each dependent
parent is entilled to receive a yearly
payment ofa 15% of final compensation
for life.
Eligibility
William M. Mercer, Incorporated
The beneficiary of an active employee
(or a terminated vested employee who
did not withdraw employee
contribulions) who dies after compleling
10 years crediled service or reaehing
age 55 is eligible for an immediale
death benefit equal to a yearly pension
or a lump sum payment.
The beneficiary of any employee who dies
while aetively employed (or a terminated
vesled employee who did nOI withdraw
employee contributions) is eligible for a
death benefit equal 10 a yearly pension or a
lump sum payment.

MAJOR FEATURES OF THE RETIREMENT SYSTEM
1967PLA~
58
AnnuafpcnsiOfl
MUNiCIPAL (PLAN J)
The beneficiary of an active employee
who dies before completing 10 years
credited service and rcaching age 55 is
eligible for a lump sum payment
The beneficiary may be any relative b>'
blood or marriage.
The annual ordinary death pension,
payable for life, is equal 10 the regular
service pension the employee would
have received if eligible 10 Il:lire on the
day before he died and had elected
option 2, joint and 100% contingent
annuiunl (see Survivor Benefits below).
UNIFORMED (PLANS D AND Xi
The beneficiary may be any 'relative II)'
blood or marriage.
The annual ordinary death pension, payable
for life, is equal to the regular service
pension the employee would M'"C received
(based on a minimum of 10 years ser..•.ice)
had the person been eligible 10 ~tire on the
day before dying and had elecled option 2,
joif1land 100% contingentannuiwnl(see
Survivor Benefits below).
Lump sum payment
Servke-connected disabilily
Eligibility
William M, Mercer, Incorporated
The lump sum pa}ment is equal 10 10% Same as municipal.
of the deceased employee's averalle
final compensation multiplied by years
of credited service to a maximum of 10,
plus the deceased employee's
contributions 10 the Retirement System,
minus the tOla\ amount of Ihe deceased
employee's City-paid life insurance,
An active employee found by the Board Same as munidpal.
of Pensions and Retirement 10 be
mental1y or physically permanently
incapacitated (unable 10 perform dUlies)
solely as the resull of accident or injury
during the performance of duties is
eligible for an immediate service-
connected disability pension.

;, .'
MAJOR FEATURES OF THE RETIREMENT SYSTEM
1967 PLA'"
59
MUNICiPAL (PUN J) UNIFORMED (PLANS D AND XI
Benefitllnrount The service-connectcd disability benefit Same as municipal.
is equal to the employcc's Retirement
System conllibutions, plus a yearly
benefit of70% of the employee's final
compensation, reduced by any disability
benefits payable under the Workers'
Compensation Act.
Ifhe or she withdraws contributions, the
benefit is payable for his or her litbtime
only.
If the employee leaves employee
contributions with the Rerircment
System, he or she may choose a survivor
benefit option (see Survivor Benefit
below) and the beneficiary will continue
reeeiving bellefit p.aymeniS after his or
her death.
Benefit offset
William M. Mercer, Incorporated
[fthe employee eollects his or her
disability benefit and subsequently
beeomes employed, the disability
benefit will be reduced $1 for eveT)' $3
earned in outside wages until age 65.
If the employee collects his or her disability
benefit and subsequently becomes
employed, the disability benefit will be
redueed $] for every $2 earned in outside
wages unlil age 45. The earned income
offset docs not apply 10 fire employCi:s.

MAJOR FEATURES OF THE RETIREMENT SYSTEM
1967PLA~
60
OrdinlIIJ'disabllil)'
M(ffi'ICIPAL (PUN J) UN/FORA/ED (PLANS D AND Xl
Eligibility An active employee found by the board Same as municipal.
to be mentally or physically
permanently incapacitated from the
further performance of dUlies due to nn
accident or illness nOl caused by the
perfomumce of dUlies is eligible for an
immediate ordinary disabiliry ~nefil.
Benefit omoum
Benefit off SCI
Sen'ice-connecti'd disabilityperiodit adjustrntJlI
EJigibJ'lil)'
The annual ordinary disability benefit is
equal to the benefit determined under
the service pension formula using
average final compensation and
credited service as of the date of
disablement.
If the employee collects his or her
disability benefit and subsequently
becomes employed, the disability
benefit will be reduced Sl for every $2
earned in outside wages until age 55.
An employee who is receiving a
service-connected disability henefit
who is IOwJly disabled and does not
collect Social Security disability
insurance benefits is eligible for a
periodic adjustment.
Same as municipal. except each eligible
employee is aUlOmatical1y credited with a
minimum of 10 years service for purposes
of calculating the annual benefit.
If the employee collects his or her disability
benefitllnd subsequently becomes
employed, the disability benefit will be
reduced Sl for every 52 earned in outside
wages until age 45. The earned income
offset does not apply 10 fire employees.
Not applicable.
Benefit anrallm
William M. Mercer, Incorporated
The disabled employee's pension will Not applicable.
be increased in the eighth year after
separation by the peTCentage raise given
in the previous year to active employees
in his or her job class. The adjustment
will continue each year thereafter
until the employee's 601h binhday.

MAJOR FEATURES OF THE RETIREMENT SYSTEM
1967 rLA!'i
61
MUNICIPAL (PLAN J) UNIFORMED (PLANS DAND Xi
Sur\'i\'or benefit
William M. Mercer, Incorporated
Service pensions, deferred vested Same as municipal.
benefits, service-connecled disability
benefits (if employee contributions are
left on deposit), and ordinary disability
benefits arc payable under 4 optionn\
forms, Options 1,2, and 3 provide
benefits ac!uarial1y equivalent (0 a
lifetime only pension while option 4 has
no reduction.
Option J - A benefit is payable 10 the
employee with the provision that upon
death. the beneficiary will receive a
lump sum equal to the excess, if any, of
the employee's contributions over Ihe
sum of the payments received.
Option 1- A reduced benefit payable to
the employee with the provision that
100% of the reduced benefit will be paid
to the designated beneficiary for life
after the death of the employee.
Option 3 - Same as option 2 except only
50% of the reduced benefit is continued
to the designated beneficia!)'.
OpTion <I- Upon the employee's death,
50% of the benefit will continue to be
paid to the surviving spouse for life,
provided the employee and spouse were
married for two years before retirement
and at death. If there is no eligible
spouse at the time the employee dies, or
the spouse dies before the full amount of
the eontrihutions have been returned,
50"/0 of the benefit is eontinued to
dependent children until age 18, or if no
dependent children, payments are given
to dependent parents for the remainder
of their lives. In addition, option 4
provides for a guaranteed return of
employee contributions as described in
option I above.
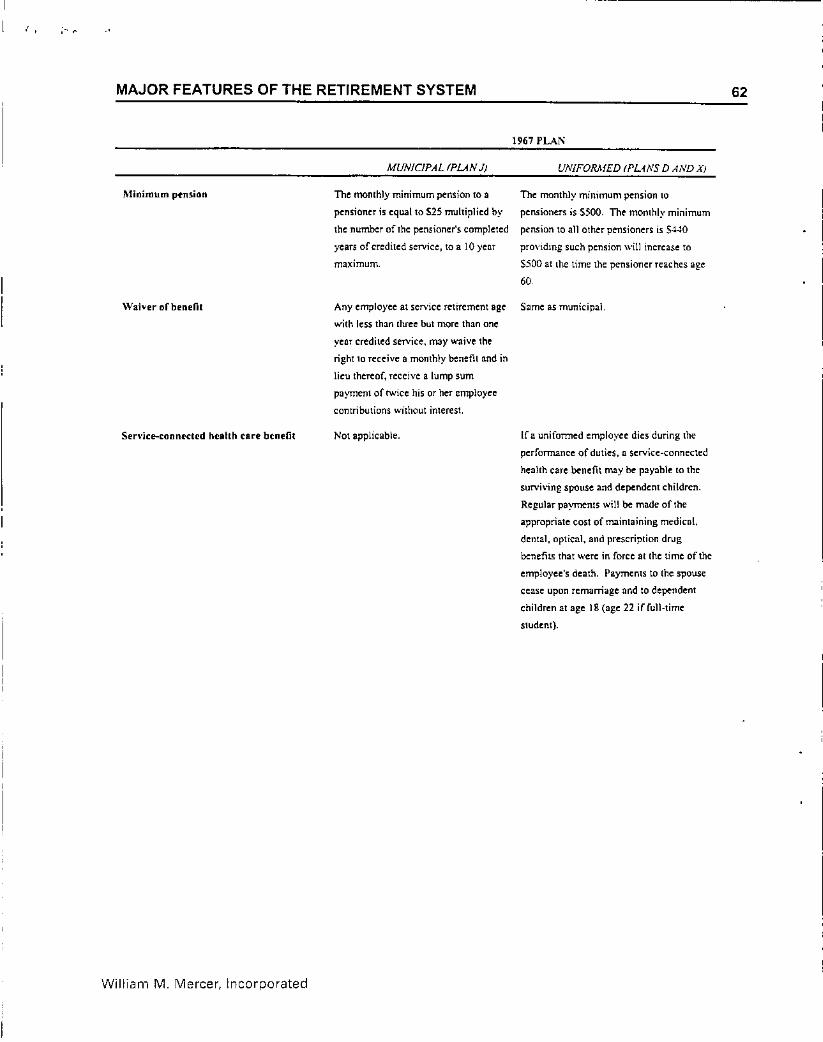
, ,
MAJOR FEATURES OF THE RETIREMENT SYSTEM
1967 fLAil'
62
Minimum pension
MUNICIPAL (PLAN J)
The monthly minimum pension 10 II
pensioner is cqualto 525 multiplied by
the number of the pensioner's completed
years of credited service, 10 a 10 yenrmaximum.
UNIFORMED (I'L~NS D AND Xi
The monthly minimum pension 10
pensioners is 5500. The momhly minimum
pension to all otller pensioners is $.140
providing such pension will increase to
$500 al lhe time the pensioner reaches age
60
Waiver of benefit Any employee al service retirement age S~me as municipal.
with less than three bUI more than one
yenr credited service, may waive the
right 10 receive IImonthly benefit and in
lieu thereof, receive a lump sum
payment of twice his or her employee
contributions without interest.
Sen'lce-connected health Cllre benefit
William M. Mercer, Incorporated
Not applicable. If a unifonned employee dies during the
performance of duties, a service-connected
heallh elIre benefit may be payable to the
survi\-ing spouse and dependent children.
Regular paymems will be made of the
appropriate cost of maintaining medical.
dental, optical, and prescription drug
benefits that were in force ntthe time of the
employee's death. Payments to the spouse
cease upon remarriage and to dependent
children at age 18 (age 22 if full-time
student).

'-,
MAJOR FEATURES OF THE RETIREMENT SYSTEM
PLAN 87
63
MUNICIPAL (Pl.ANS M AND n UNIFORMED (PLANS A AND Bi
Total compensation
Full-time employees participate on their date Same a. municipal.
of employment. Temporary employees
participate after completing six momhs
employment. Plan M participation is limited
to employees hired on or afler January 8.
1987 and before October 2, 1992, Municipal
members hired on or after OClOber 2, 1992
will participate in Plan Y. Any member of
the 1967 Plan may irrevocably elect to
participate in Plan 87.
Credited serviee means the period of Same as municipal.
employment "';th the City during which the
employee makes contributions 10 the
Retirement System. Certain leaves of
absence may also be credited.
Toml compensation mcans the base rate of Same as municipal.
pay lind longevity payments received during a
12-month period. For Plan Y municipal
members, total compensation shall include
overtime or holiday overtime.
Final compensation
Average final compensation
Employee contributions
William M. Mercer, Incorporated
Final compensation means the annual base
rale of pay at the time of termination,
including supplementary compensation
received under Civil Service Regulation No.
32.
Average final compensation means the
arithmetic average of the IOlal compensation
received during the three calendar or
anniversary years producing the highest
average.
TOlal employee contributions eGual30% of
the gross normal cost for all members in the
municipal division.
Same as municipal.
Average final compensation means the
arithmetic average of the total compensation
received during the \wo calendar or
anniversary years producing the highest
average.
Total employee contributions equal S% of
total compensation. but not less tlmn 30% or
greater than 50"10 of gross normal cost for
members in the uniformed division. !•

;",' "
MAJOR FEATURES OF THE RETIREMENT SYSTEM
PLAN 87
MUNICIPAL (PUNS M AND n
Sen-ite rellrement
UNIFORMED (PUNS A AND Bi
64
Eligibility Each municipal employee is eligible to retire Each uniformed employee is eligible to retireand receive a service pension at age 60 nnd if and receive a service pension llpon reachinghe or she hns 10or more years of credited age 50 and 10or more years of credited
Benefit amounl
Early retirement
service.
The service pension equals 2.2% of theemployee's average final compensation forthe first 10years of credited service, plus 2%of the employee's average final compensationmultiplied by years of service over 10.
service,
The service pension equals 2.2% of theemployee's average final compensationmultiplied by years of credited service to amaximum of 20 years, plus 2% of theemployee's average final compensationmultiplied by years of credited service over
20
Eligibility Each municipal employ~ is eligible to retire Each unifo~d employee is eligible to retire
Benefit omQunl
Deferred vCSledrelirement
Eligibility
and receive a reduced service pension at age52 ifhe has 10 or more years credited service.As an alternative, a member is eligible ifhe
or she has 33 yeaTScredited service,regardless of age,
The annual amount is calculated the same asservice retirement. reduced by Y,of I% foreach month the employee is younger thanminimum retirement age. Benefits are notreduced if the employee has 33 or more yearsof credited service.
A employee terminating employment andwho completed 10 or more years creditedservice is eligible for a deferred vestedretirement benefit if his or her contributionshave not been withdrnv.'ll.
and receive a reduced service pension at age
40 ifhe or she has 10or more yeaTSofcredited service. Alternatively. a member iseligible if he has 25 years credited service.regardless of age.
The annual amount is calculated the same asservice retirement, reduced by Y,of 1% foreach month the employee is younger than hisminimum retirement age. Benefits are notreduced ifthe employee has 25 or more yearsof credited service.
Same as municipal.
William M. Mercer, Incorporated

MAJOR FEATURES OF THE RETIREMENT SYSTEM
PLAN 87
65
Bellefil amounr
Withdrawal benefit
Sf'f\'icc-connctlcd death
MUNICIPAL (PLANS /If AND lj
The annual deferred vested benefit isdetermined the same as serviee pensions,based on average final compensation and
credited sen'ice allerminalion. This benefit
begins althe service retirement dale. If a
member dies before the deferred vested
benefit begins, an ordinary death benefit is
payable (see Ordinary Death below).
As an aliemalive, the person terminating
employment may request at any lime before
benefits begin a return of employee
contributions (without imercst) instead oflhe
deferred vested benefit.
Each terminating employee who has
completed fewer than 10 years of credited
service will receive a withdrawal benefit
equal to employee contributions (without
interest).
UNIFORMED {PUNS II AND 8J
Same as municipal.
Eligibility
Benefil amoulll
William M. Mercer, Incorporated
The beneficiary of each active employee who Same as municipal.
dies solely from the performance of duties of
the employee's position with the City is
eligible fOf an immediate death benefit.
The death benefit equals the sum of the total Same as municipal.
employee contributions paid to the
Retirement System (without interest), plus a
yearly payment of 60% of the employee's
final compensation reduced by any death
henefits payable under the Workers'
CompeMation Act.
This benefit is payable to the spouse until his
or her death or remarriage, whichever occurs
first. The spouse is entitled to an additional
10% of final compensation yearly payment
for each dependent child (up to two children)
until the child reaches age 18. This total
benefit shall not exceed 80% affinal
compensation.

(, ' "
MAJOR FEATURES OF THE RETIREMENT SYSTEM
PLAN 87
MUNICIPAL (PLANS M AND Y)
lflhere is no spollSe, or if the spouse dies or
remarries. each dependent child (up 10 three
children) is eligible for a yearly payment of
25% of final compensation until the child
reaches age 18, If there is no spOllse or
dependent children, each dependent parent is
entitled to a 15% of final compensation
~arly payment for life.
Ordinal')' dultl
66
UNIFORMED (PLANS A AND B)
Eligibility
Annual pension
Lump sum payment
William M. Mercer, Incorporated
The \>end'iciary of an aClive employee (or 1I
terminated vested employee who did not
withdraw his employee contributions) who
dies after completing 10 years credited
service or who has reached 60 is eligible for
an immediate death benefit equal to an annual
pension or a lump sum payment, whichever
the beneficiary chooses.
The beneficiary of an aClive employee who
dies before completing 10 years credited
service or reaching age 60 is eligible for a
lump sum payment.
The beneficiary may be any relative by blood
or mamage.
The annllal ordinary death pension, payable
for life, is equal to the regular service pension
the employee would have received hod he or
she been eligible to retire on the day before
death and had elected option 2, joint and
100% contingent annuitant (see Ordinary
Disability below).
The lump sum payment is equal to 10% of the
deceased employee's average final
compensation multiplied by years credited
service to a maximum of 10, plus the
deceased employee's contributions to the
Retirement System (without interest), minus
the total amount of the deceased employee's
life inSlirance which was paid by the City.
The beneficiary of any employee who dies
while actively employed (or a terminated
vested employee who did not withdraw
employee contributions) is eligible for a death
benefit equal to an annual pension or a lump
sum payment, whichever the beneficiary
chooses.
The beneficiary may be nny relative by blood
or marriage.
The annual ordinary death pension, payable
for life, is equal to the regular service pension
the employee would have received (based on
a minimum of 10 years service) had he been
eligible to retire on the day before death and'
had elected option 2, joint and 100%
contingent annuitant (see Ordinary Disability
below).
Same as municipal.

;",.
MAJOR FEATURES OF THE RETIREMENT SYSTEM
PLAN 87
MUNICIPAL (PLANS M AND n
Servic<'-':onneCled diubllil)"
UNIFORMED (PL-JA'S A AND B)
67
Efigibi/iO'
Benefit amount
An active employee found by the Board of
Pensions and Retirement to be mentally or
physically permanently incapacitated from
any funner performance of duties due solely
10 the result oftne perfonnance of duties is
eligible for an immediate service-connected
disnbilily pension. The application for
benefit must be made "..itnin one year after
termination of employment.
The service-connected disability 'Jenefit is
equal to the employee's contributions to the
Retirement System, plus a yearly benefit of
70% of the employee's final compensation,
reduced by any disabilily benefits payable
under lhe Workers' Compensation Act.
Same as municipaL
Same as municipal.
Benefit ojjset
William M. Mercer, Incorporated
If the employee collects his or her disability If the employee collects his or her disability
benefit and subsequently becomes employed, benefit and subsequently becomes employed,
the disabilily benefit will be reduced $1 for the disability benefit will be reduced $1 for
every $3 earned in outside wages until age 65. every $2 earned in outside wages until age
50. The earned income offset does not apply
to fire employees.

MAJOR FEATURES OF THE RETIREMENT SYSTEM
PLA:"i 87
MUNICIPAL (PLANS M AND Y)
Ordinary disability
68
UNIFORMED (PL4NS A AND 8)
Eligibilil)'
Benefit mnow,1
Benefit Offsel
William M. Mercer, Incorporated
An active employee found by the board 10be
mentally or physically permanently
incapacitated from the funher performance of
duties due to an accident or illness nOl caused
by the performance of duties is e\i~ible for an
immediau: ordinary disability benefit
provided he or she has completed aileasl 10
years credited service.
The application for benefit!; "11usl be made
within one year after termination.
The annual ordinary disability benefit is equal
10 the benefit determined under the service
pension formula using lIver:age final
compensation and credited service as of/hedate of disablement.
If the employee collects his or her disability
benefit and subsequenlly becomes employed,
the disability benefil will be n:duced $1 for
every $2 earned in outside wages until age 60.
An active employee !bund by the Board to be
mentally or physically permanently
incapacitated from the further performance of
duties due 10 an accident or illness not caused
by the.performance of duties tS eligible for an
immediate ordinal)' disability bendit
provided he has compleled at least five years
of credited sen'ice nnd is a fin:man. If the
disabilily is permanent nnd partial and Ihe
employee is a policeman. he or she must have
completed at least 10 years credited service.
If the disabilily is permanent and total and the
employee is a policeman. there is no service
n:quin:menl. The application for benefits
must be made within one year after
lermination.
Same as municipal, except each eligible
employee is automatically credited with a
minimum of 10 years service to calculate the
annual benefit.
[fthe employee collects his or her disability
benefil and subsequently becomes employed.
the disability benefit will be reduced 51 for
every 52 earned in oUlside wnges until age
50. The earned income offset does not apply
!O fire employees.

>, '
MAJOR FEATURES OF THE RETIREMENT SYSTEM
PLAN 117
69
Sen'lel'-Connutfil disabililyperiodk adju~lment
MUNICIPAL (PLANS M AND Y) UNIFORMED (PLANS..! AND B)
Eligibility
Benefit amollnl
Sun'ivor benefits
William M, Mercer, Incorporated
An employee who is receiving a service- Not applicable.
connected disability benefit who is to/(l/ly
disabled and does no! collect Social Security
disability insurance benefits is eligible far a
periodic adjustment.
The disabled employee's pension •••.ill be Not applicable.
increased in the eighth year after separation
by the percentage raise given in the previous
year to~active employees in his or hcr job
class. The adjustment will continue each year
until the employee's 65th binhday.
Service pensions. deferred vested benefits, Same as municipal.
service-connected disability benefits. and
ordinary disability benefits are payable under
three optional forms. Options 2 and 3 provide
henefits actuariany equivalent 10 a lifellme
only pension while option 1 has no redutlion.
Option J - A benefit is payable to Ihe
employee providing on his death, the
beneficiary will receive a lump sum equal to
the e~eess, if any. of the employee's
conlributions over the sum of the payments
received,
Option}. - A reduced benefit payable 10 the
employee providing 100% of the reduced
benefit will continue to be paid to the
designated beneficiary for life after the death
of the employee.
OptiOn J - The same as option 2 except only
50"10 oflhe reduced benefit is continued to the
designated beneficiary.

. ,
MAJOR FEATURES OF THE RETIREMENT SYSTEM
PLA."'187
MUNICIPAL (PLANS M AND Y!
70
U'v'JFORMED (PLANS A AND 8J
Strvlee-conneeted health care benefit
William M. Mercer, Incorporated
N01l1pplicable. In the event of the death of II uniformed
employee during the performllnce of his or
her duties. a service"connecled hellllh clIre
benefit may be payable 10 the surviving
spouse and dependent children. Regular
payments will be made of the appropriate
COS1of maintaining medical. dental. optical
and pharmaceutical prescription bffiefils in
force lit the lime of the emplOYl'e's death.
Payments \0 the SPOllSIi'cease upon
remarriage and to dependent children at age
18 (age 22 ira full-lime student).

MAJOR FEATURES OF THE RETIREMENT SYSTEM
PLAN 87
ElcCII;:d Plan
71
Participation
Creditl'd sen'ice
Total compensation
Final compenslltion
Averlll:c linal compensation
Emplo~'~e contribulions
S~rvlce r~tlrement
Eligibl/i(y
Benefi( IImoum
Eotly rftir~m~nt
Eligibili(y
Benefi( amOUIJ(
Deferred vested rflir ••m ••nl
Eligibili(y
William M. Mercer, Incorporated
Any City ~mployteelected on or after January S, 198i. in any
~eneral, municipal, or special election, participate, in [his Plan,
Credited service means the period of employment wilh the Cily
during which the employee makes contributions 10 the Retirement
Systems. Certain leaves of absence may also be credited.
TOlal compensation means the base rate of pay and longev;ty
payments received during a l1-month period,
Final compensation mellns the annual base role oipo)' Blthe lime of
tennination, including supplementary compensation received under
Civil Service Regulation No. 32.
Average final compensation means the arithmetic avcrllge of the total
compensation received duling the three calendar or anniversary years
that produce the highest average.
Total ~mployee contributions equnl30"1o of the gross normal COStfor
all members in the elected division calculated under the municipal
plan plus 100% of the gross normal cost that exceeds the cost for the
municipal plan.
Each elected official is eligible to retire and receive n service pension
at age 55 ifhe or she has 10 or more years credited service.
The service pension equals 3.5% of the employee's avcrage finnl
compensation multiplied by years credited service.
Each elected official is eligible to retire if he or she has 33 years
credited service, regardless of age.
Benefits are not reduced if the employee has 33 or more years
credited service.
A person terminating employment and who has completed 10 or more
years credited service is eligible for a deferred vested retirement
benefit provided he or she has not withdrawn contributions.

'. "
------------------------------------------------------------
MAJOR FEATURES OF THE RETIREMENT SYSTEM
PLAN 87
Elected Plan
72
Bcneftl amaUni
Withdrawal benefit
Service-connected death
Eligibility
Benefit (I"'Ql1nt
The annual deferred vested benefit is determined in the same manner
as service pensions. based on 3vCrog:Clinal compensation and credited
service althe lime of termination. This benefit beg:ins at the ser..•.iceretirement dale. If the member dies before beginning his or her
deferred vesled benefit. an ordinary death benefit is paynble (see
Ordinary Death below).
As an alternative, the person terminating employment may request at
any time before beginning benefits to receive a return of employee
contributions (without interest) in lieu of the deferred vested benefit,
Each terminating employee who completed fewer than 10 years
credited service will receive a withdrawal benefit equal to employee
contributions (without interest).
The beneficiary of each active employee who dies solely from
performing duties of the employee's position with the City is eligible
for an immediate death benefit.
The death benefit equals the sum of the total employee contributions
paid to the Retirement System (without interest), plus a yearly
payment of 60"-1.of the employee's final compensation reduced by any
death benefits payable under the Workers' Compensation Ac\.
This benefit is payable to the spouse until death or remarriage,
whichever occun; fin;l. The spouse is entitled to on additional yearly
payment of 10% of final compensation for each dependent child (up
to two children) until the child reaches age 18. This total benefit shall
not exceed 80% of final compensation.
If there is no spouse, or if the spouse dies or remarries each dependent
child (up to three children) is eligible for a 25% affinal compensation
yearly payment until the child reaches age 18. If there is no spouse Or
dependent children, each dependent parent is entitled to a 15% of
final compensation yearly payment for the remainder of his lifetime.
William M. Mercer, Incorporated

! . ..
MAJOR FEATURES OF THE RETIREMENT SYSTEM
PLAJ'" 87
Ordinal')' death
ElcClfxi Plnn
73
•
EligibUily
"
Annual~mio"
Lump sum payment
Eligibiliry
Benefir amOUnT
Benefir offser
Ordinary disability
The beneficiary of an active employee {Of3 lenninaled vested
employee who did nOIWilhdl'llw employee contributions) who diesafter completing ]0 years credited ser .•.ice or reaching 3ge 55 is
eligible for an immediate death benefit cquallO an annual pension or
a lump sum pa)'!I1cnt, whicheVer the beneficiary chooses.
The beneficiary of an active employee who dies before completing 10
years credited service or reaching age 55 is eligible for a lump sum
payment.
The beneficiary may be any relative by blood or marriage.
The annual ordinary death pension. payable for life. is equal 10 the
regular services pension the employee would have received had he or
she been eligible 10 retire on the day before death and had elected
option 2, joint and 100"10 contingent annuitant (see Sun'ivor Benefits
below).
The lump sum payment is equal 10 10% of the deceased employee's
average final compensation multiplied by years crediled service to a
maximum of 10, plus the deceased employee's contribulions to the
Retirement System (without interest); minus the lolal amount of lhe
dcccased employ~'s lifc insunlncc which was paid by the City,
An active employee found by the Boord of Pensions and Retirement
to be mentally or physically permanently incapacitated from any
further performance of dutics due solely to the result oflhe
performance of dutics is eligible for an immediate selVice-connected
disability pension.
Thc service-eonnected disability ~nefit is equal to the employec's
contributions 10 the Retirement System, plus a yearly benefit of 700/•
of the employee's final compensation; reduced by any disability
benefits payablc under the Workers' Compensation Act-
If the employee collects his or hcr disability benefit and subsequently
becomes employed, the disability ~nefit will be reduced $1 for every
$3 earned in outside wages until age 65.
William M, Mercer, Incorporated

{ ~,'
MAJOR FEATURES OF THE RETIREMENT SYSTEM
PLAN 87
Elected Pilln
74
Eligibility
Benefit amount
Benefit offset
ServiCf-COnneCled disabilityperiodic adjustment
Eligibility
Benefit amaunt
Survivor benefits
Servlee--copnected health cart btntfit
William M. Mercer, Incorporated
An active employee found by the Board to be mentally or physicall}'
permanently incapacit:lled from the funher performance of duties due
to an accident or illness not caused by the performance of duties is
eligible for an immediate ordinal')' disability benefit provided he or
she has completed at least 10 years credited service,
The annual ordinary disability benefit is equal to the benefit
determined under the service pension formula using average final
compensation and credited service as of the date of disablement.
If the employee collects his or her disa.bility benefit and subsequently
becomes employed, their disability benefit will be reduced SI for
every S2 earned in outside wages. The offset will continue until a[:e
60.
An employee who is receiving a service-connected disability benefit
who is IOwlly disabled and does not collect Social Security disability
insurance benefits is eligible for a periodic adjustment.
The disabled employee's pension will be increased in the eighth year
after separation by the percentage raise given in the previous year to
active employees in his or her job class. The adjustment will continue
each year until the employee's 65th binhday.
Service pensions, deferred vested benefits, service-connected
disability benefits, and ordinary disability benefits are payable under
three optional forms, Options 2 and 3 provide benefits actuarially
equivalent to a lifetime only pension while option 1 has no reduction,
Option I - A benefit is payable to the employee providing upon death,
the beneficiary will receive a lump sum equal to the excess, if any, of
the employee's contributions over the sum of the payments received.
Oplion} - A reduced benefit payable to the employee providing
100"/0 of the reduced benefit will continue 10 be paid 10 the designated
beneficiary for life after the dealh of the employee.
Option 3 ~ Same as option 2 except only 50% of the reduced benefit is
continued to the designated beneficiary.
Not applicable.

"
ACTUARIAL COST METHOD, FACTORS, AND ASSUMPTIONS 75
The actuarial cost method, factors, and assumptions used in determining cost estimates aredescribed below.
Member data
The member data used to determine cost estimates is pertinent information on active,retired, disabled, and deferred vested municipal and uniformed members of the City ofPhiladelphia Municipal Retirement System as supplied by the Philadelphia Board ofPensions and Retirement to the actuary. Data that was missing or inconsistent wasreplaced with each plan's average.
Valuation date
The plans were valued as of July 1, 1998.
Actuarial cost method
Costs were determined according to the individual entry age actuarial cost method. TheDombrowski unfunded actuarial accrued liability is amortized in level dollar paymentsover 40 years ending June 30, 2009, as ordered by the Court of Common Pleas ofPhiladelphia County. Effective July 1, 1998, the remaining July 1, 1985 unfundedactuarial accrued liability is amortized over 34 years ending June 30, 2019, with paymentsincreasing 5.0% per year. Changes in the actuarial accrued liability realized after July 1,1985 are amortized in level dollar payments:
• Changes in actuarial assumptions - 20 years
• Experience gains and losses - IS years
• Active members' benefit modifications - 20 years
• Nonactive members' benefit modifications - lO years.
For Act 205's MMO the July I, 1985 unfunded actuarial accrued liability is amortizedover 40 years ending June 30, 2025, with payments increasing 5.0% per year.
Annual rate of withdrawal prior to retirement
The assumed annual rates of withdrawal are shown in Table 39.
William M. Mercer, Incorporated

-"
ACTUARIAL COST METHOD, FACTORS. AND ASSUMPTIONS
39. Withdrawal probabilities at 5.year intervals
Municipal andAttained Elected Qfficials Uniformed
Age Males Females Males and Females
20 .100818 .105319 .02205025 ,085911 .096000 .01114830 ,045189 ,071562 ,01715935 ,038436 .056170 ,014063
40 ,034679 .043754 .01059345 ,031105 .035597 .00691350 ,028145 .032000 .00000055 .000000 .000000 ,000000
76
In addition, we assumed that a vested employee terminating employment (with 10 years ofservice) will elect an employee contributions refund unless his or her age plus years ofservice at termination equal 55 or more (rule of 55) [rule of 45 for 1967 Police and Fire].Otherwise, we assumed the person would elect a deferred pension beginning at serviceretirement age.
Annual rate of disability prior to retirement
The assumed annual disability rates appear on Table 40.
40. Disability probabilities at 5-year intervals
Municipal andAttained EJected Officials lIojformed
Age Males Females Males and Females
20 .000025 .000043 .00079525 ,000070 .000061 .00087030 .000557 .000263 .00141835 .001514 .000620 .002250
40 .003274 .001314 .00332145 .005485 .002359 ,00489550 .009550 .003571 ,00691855 .000000 ,000000 ,000000
In addition, we asswned that 70% of all disabilities among municipal and elected membersare ordinary (30% are service-cOlUlected) and 50% of all disabilities among uniformedmembers are ordinary (50% are service-cOIUlected).
William M. Mercer, Incorporated

.,
ACTUARIAL COST METHOD, FACTORS, AND ASSUMPTIONS
Annual rate of mortality prior to retirement
77
We assumed that deaths of active municipal and elected male members would be at 80%of the UP-84 Mortality Table with ages set forward one year and deaths ofmunicipa! andelected female members at 80% of the UP-84 Mortality Table with ages set back fouryears. In addition, we assumed that 97.5% of all deaths of active municipal and electedmembers are ordinary (2.5% are service-connected).
We assumed that deaths of active uniformed male members would be at 80% of the UP-84Mortality Table with ages set forward one year and deaths of uniformed female memberswould be at 80% of the UP-84 Mortality Table with ages set back four years. In addition,we assumed that 95% of all deaths of active uniformed members are ordinary (5% areservice-connected).
Service retirement
We assumed that active members in the 1967 Plan will retire according to the rates inTable 41.
William M. Mercer, Incorporated

"
ACTUARIAL COST METHOD. FACTORS. AND ASSUMPTIONS
41. 1967 plan service retirement rates
Municipal andElected Officials ]Jnjformed
Age Males Females Males and Females
45 .15046 .07747 .07748 .08449 .084
50 ,08451 .08852 .10253 .11254 .112
55 .270 .226 .11956 .092 .076 .14057 .092 ,077 ,140
58 .077 .077 ,140
59 .085 .070 .168
60 .085 .081 .16861 .100 .081 .16862 .23] .175 .19663 .139 .126 .19664 .162 .126 .224
65 .246 .196 .24566 .154 ,161 .24567 .193 .161 .24568 .154 .161 .24569 .154 .175 .245
70+ 1.000 1.000 1.000
The corresponding rates for members under Plan 87 are in Table 42.
William M. Mercer, Incorporated
78

"
ACTUARIAL COST METHOD, FACTORS, AND ASSUMPTIONS 79
42. Plan 87 service retirement rates
Municipal and Flected Qfficials Ilnjformed
FuJI Benefits Full BenefitsReduced First Year Subsequent Reduced First Year Subsequent
Age Benefitsb Eligible' Years Benefitsb Eligible" Years
40 .028 ,500 .12541 .028 .500 .12542 .028 .500 .i2543 .028 .500 .12544 .028 .500 .125
45 .028 .500 .12546 .028 .480 .12547 .028 .460 .12548 .028 .440 .12549 .028 .420 .125
50 .028 .400 .12551 .028 .400 .12552 .0264 .450 .060 .028 .400 .14053 .0264 .410 .060 .028 .400 .15054 ,0264 .390 .060 .028 ADO .170
55 .0264 .360 .060 .028 .400 .19056 .0264 .330 .060 .028 .400 .21557 .0264 .300 .060 .028 .400 .22558 .0264 .300 .060 .028 .400 .22559 ,0264 .300 .080 .028 ADO .230
60 .0264 .300 .100 .028 .400 .23061 .0264 .350 .150 .028 .400 .24562 .0264 .430 .300 .028 0400 .2956J .0264 .500 .187 .028 .400 .26564 ,0264 .500 .199 .028 .400 .260
65 .0264 .600 .309 1.000 .400 1.00066 ,0264 .600 .23267 .0264 .600 .21468 .0264 .600 .21469 .0264 .600 .23870 1.000 .600 1.000
a. Earlier of age 60 and lO years of service or 33 years of service for municipal; earlier of age 50 and 10
years of setvice or 25 years of setvice for police and ftre; and 33 years of setvice for elected officials.
b. We assume the participant defers receipt of the benefit until their service retirement age.
William M. Mercer, Incorporated

, ," ..
ACTUARIAL COST METHOD, FACTORS, AND ASSUMPTIONS
Annual rate of mortality after retirement
80
We assumed that postretirement mortality will be 95% of the UP-84 Mortality Table withages set forward one year for males and 95% of the UP-84 Mortality Table with ages setback four years for females. We assumed that post-disablement mortality will follow100% of the UP-84 Mortality Table (set fOIV.'ard one year for males, set back four yearsfor females) with the adjustment factors in Table 43 applied at each age for municipal andthe adjustment factors in Table 44 for police and fire.
43, Post-disablement mortality adjustment factors (municipal)
Adjustment Factor Adjustment FactorAg. Male Female Ag. Male Female
47 and earlier 4.86 6,52 62 1.47 1.8948 4.38 5,85 63 1.41 1.8049 3,93 5,30 64 1.35 1.7550 3,60 4.82 65 1.29 1.70
51 3.28 4.30 66 1.24 1.65
52 3.01 3.84 67 1.21 1.5853 2.75 3.49 68 1.16 1.5154 2.51 3,20 69 l.ll 1.47
55 2.30 2,90 70 1.08 1.4256 2.10 2,61 71 1.04 1.37
57 1.94 2.34 72 1.00 1.3158 1.81 2.23 73 1.00 1.2859 1.71 2,13 74 1.00 1.2460 1.61 2,05 75 1.00 1.2161 1.52 1.96 76 1.00 1.17
77 1.00 1.1478 1.00 t.tl79 LOa l.08
80 and later 1.00 1.05
William M. Mercer. Incorporated
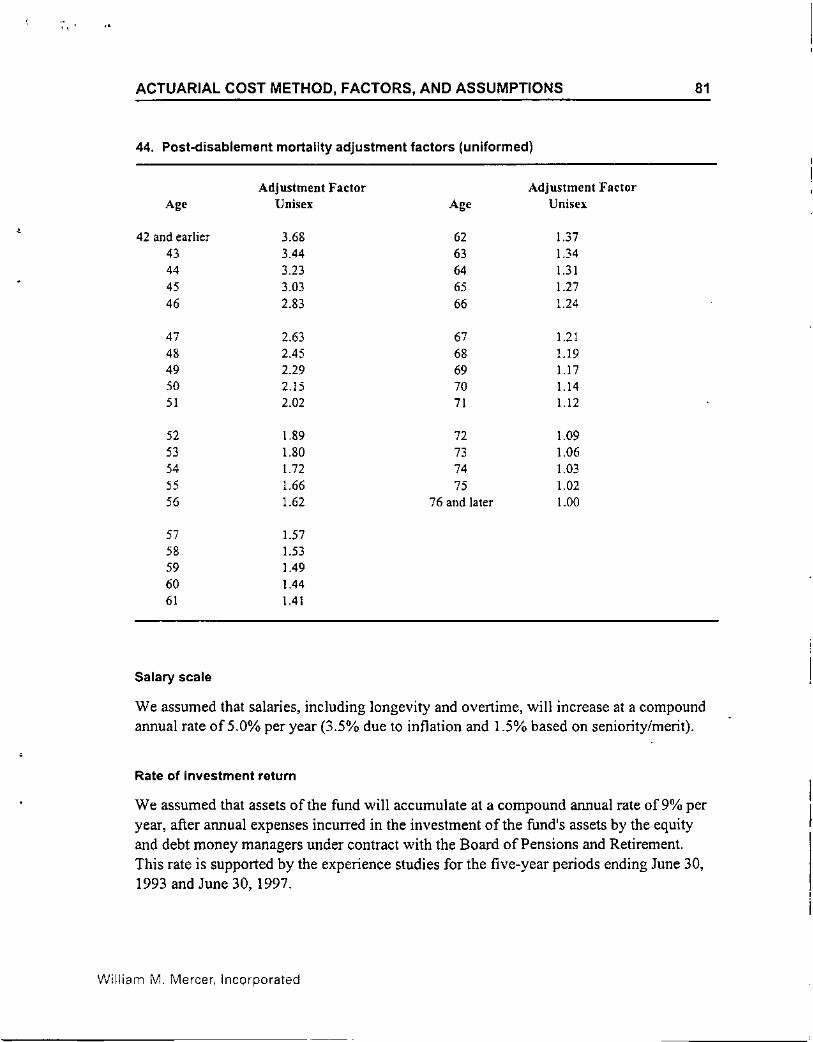
"
ACTUARIAL COST METHOD, FACTORS, AND ASSUMPTIONS
44. Post-disablement mortality adjustment factors (uniformed)
81
Adjustment Factor Adjustment FactorAg' Unisex Ag' Uniscl:
,42 and earlier 3.68 62 1.37
43 3.44 63 1.3444 3.23 64 1.3145 3.03 65 1.2746 2.83 66 1.24
47 2.63 67 1.2148 2.45 68 1.1949 2.29 69 1.1750 2.15 70 1.1451 2.02 71 1.12
52 1.89 72 1.0953 1.80 73 1.0654 1.72 74 1.0355 1.66 75 1.0256 1.62 76 and later 1.00
57 1.5758 1.5359 1.4960 1.4461 1.41
Salary scale
We assumed that salaries, including longevity and overtime, will increase at a compoundannual rate of 5.0% per year (3.5% due to inflation and 1.5% based on seniority/merit).
Rate of investment return
We assumed that assets of the fund will accumulate at a compound annual rate of9% peryear, after annual expenses incurred in the investment of the fund's assets by the equityand debt money managers under contract with the Board of Pensions and Retirement.This rate is supported by the experience studies for the five-year periods ending June 30,1993 and June 30,1997.
William M. Mercer, Incorporated

ACTUARIAL COST METHOD, FACTORS, AND ASSUMPTIONS
Expenses
82
The administrative expenses of operating the Retirement System are based on the previousyear's actual expenses increased by the average salary increase for continuing actives.Administrative expenses exclude the fees of the money managers hired to invest the fund'sassets.
Value of investments
Assets held by the fund are valued at market value as reported by the City. The actuarialvalue of assets is the difference between the market value of the assets reported and lastyear's assets projected forward at the rate of investment return. One-fifth of this differenceis recognized immediately and four-fifths is deferred and recognized over the next fouryears, one-fifth at a time.
Family composition
We assumed that 70% of all active members and 60% of all nonactive members will besurvived by a spouse and that female (male) spouses are four years younger (older) thanmembers.
Form of annuity
We assumed that all Plan '67 members will elect Option 4 and Plan '87 members willelect Option 1 unless otherwise indicated in the participant's data.
Rate of covered payroll growth
We assume that the annual rate of gmwth oftota1 covered payroll is 5.0% per year. This issupported by the actuarial experience studies for the five-year periods ending June 30,1993 and June 30, 1997, which showed that the adjusted growth rate of covered payrollaveraged 4.7% and 3.2%, respectively.
William M. Mercer, Incorporated
,

MINIMUM MUNICIPAL OBLIGATION 83
The minimum municipal obligation (MMO) is the minimum required City contributionunder state law (Acts 205 and 189). The City's:MMO for the year ending June 30, 2000 is$194,138,000. This amount is summarized by division in Table 45 and is based on theJuly 1, 1998 actuarial valuation report.
The City receives general pension state aid and cost-of-living adjustment reimbursementfrom the state. The MMO includes these amounts. For fiscal 1999, the total statepayments are $35,679,000. Amounts received during fiscal 2000 may be used to meet the$194,138,000 obligation. Supplemental State Assistance (SSA), if any, may not be usedto offset this commitment.
The City's funding policy differs from the MMO. The most significant differences are:
• The City uses a 34-year increasing amortization of its July 1, 1985 unfundedactuarial accrued liability, while Act 205 allows a 40-year increasing amortizationschedule. The City chose to amortize the July I, 1985 unfunded actuarial accruedliability over the 34 years remaining in their then-existing schedule, rather thanadopting the 40-year phased-in schedule permitted under Act 205. The City's moreaggressive funding policy has resulted in larger contributions than Act 205 requires.
• The City applies the normal cost rates to the fiscal year's actual payrolL The MMOuses the prior year's estimated payroll.
• The City's actual contribution includes interest at 9% from July 1 to the paymentdate. However, no interest accumulates on the MMO if the payment is made byyear-end (December 31).
• The MMO reflects amortization of prior years' City contributions above past MMOsas actuarial gains.
William M. Mercer, Incorporated

MINIMUM MUNICIPAL OBLIGATION 84
The City's unfunded liability payments towards the MMO are summarized in Table 46.These payments reflect the 40-year funding of the July 1, 1985 unfunded actuarial accruedliability with increasing payments at 5.0%, but do not reflect the IS-year phase-in allowedin Act 205.
45. MMOcalculation for fiscal 2000 (July 1,1998 valuation report)
Fiscal 2000 (dollars in thousands)
Non-Uniformed Police Fire Total
Estimated FY 1999 payroll $ 771,109 $ 278.978 $ 99.568 $ 1.149.655
Nonnal cost percent 7.686% 11.576% 12.072% 9.009%
Normal cost $ 59,391 $ 32,410 $ 12,046 $ 103,847
Amortization paymenr- 66,573 54.554 11,234 132,361
Administrative expense 3003 I 187 410 4600
Subtotal $ 128,967 $ 88,151 $ 23,690 $ 240,808
Expected member contributions (25 542) (15446) (5 682) (46670)
MMO. (Pre-POal $ 103,425 $ 72,70$ $ IS,008 $ 194,138
MMO • (Post.POB)' $ 72,196 $ 47,115 $ 12,739 $ 132,050
•• The portion of the unfunded actuarial accrued liability attributable to the Dombrowski class action suit isincluded in the initial unfunded liability that was established July 1, 1985. For MMO calculations, it isamortized over 40 years ending June 30, 2025 in annual payments increasing 5.0% per year. The City'sfunding policy, however, amortizes the original Dombrowski liability in level dollar payments over 40years ending June 30. 2009.
b. Includes general pension state aid and state cost-of-living adjustment reimbursement. For fiscal 1999,the total is $35,679 (thousands). Also includes quasi agencies.
C. The Pension Obligation Bond of $1 ,250,000,000 reduces the $2,664,776,245 July I, 1998 actuarialaccrued liability to $1,414,776,246. The lower actuarial accrued liability results in the amortizationpayments being reduced by 46.91% (the amount of the P.D.B. relative to the umeduced actuarialaccrued liability.)
William M. Mercer, Incorporated

,
ij
,N
,N
••
."
••
,I,"
••~
N'
•
.,".
•
co

~l
zo~Cl:;tilo-'i1:uZ::J:;;:;;::J:;;Z:;;
•~-,'•, _'':C",<
"'. 1i-,'~~
N
• N
--,-
••
.-
••
•
Gu

POST PENSION OBLIGATION BOND (POB) COST DERIVATION
47. Estimated FY 2000 City contributions post Pension Obligation Bond (thousands)
,-
87
'.<,'
1967 rlan £IWl.l
Municipal rolleI' Fire Municipal (M) Municipal IV) Elcdl'd rolier Fire Total
Nomlal cost
Percentage (beginning of year payment) 4.687% 7.306% 7.128% 5,014% 5.060% 5.4f>4% 5.594% 6.018% 5.)80%Estimated cost' , 25,060 , 10,461 , 4.915 , t .698 , 9,45) , 9G , 7,262 , 1,752 , 60,704
Amortization payment , 53 779 , 41 597 '-1.Lill '---1lJ2J .$ 272 '-ill , (840l '--illJ!J S 105342
Total , 78,839 , 52,064 S 16,388 , 966 , 9,725 , 147 , (',422 , 1,394 , 166,04(,
a. Based on July 1, 1998 payroll. Actual normal cost will be based on actual fiscal 2000 payroll,
No/I': Numbers may 1101add due In rounding.
1\c1~.pcyalh\19991docs\98 _val(wp6.1)
William M. Mcrcer, Incorporated

i"
GOVERNMENTAL ACCOUNTING STANDARDS BOARD (GAS B) 88
Statement Number 25 of the Governmental Accounting Standards Board (GASB 25) iseffective for plan years beginning after June 15, 1996 and supersedes Statement Number 5(GASB 5).
The objective of GASB 25 is to provide a standard for disclosing pension information forthe financial reports of governmental pension plans. The financial report should includetwo financial statements and two required schedules ofhistdrical information. Thefinancial statements and required schedules are:
• A statement of plan net assets including information about plan assets and liabilities atthe reporting date. This information is shown in the Financial Experience of the Fundsection of the report.
• A statement of changes in plan net assets including receipts and disbursements. Thisinformation is also contained in the Financial Experience of the Fund section of thereport. '.
• A schedule of funding progress including historical information about the actuariallydetermined funded status of the plan and the progress made in accumulating sufficientassets. This information should be provided for each of the past six plan years. For thetransition year and the following five years the schedules should show information forthe current year and as many prior years as available. This schedule is shown in Table48 below.
• A schedule of employer contributions including historical trend information about theAnnual Required Contributions (ARC) and the contributions made by the employer inrelation to the ARC. This information is shown in Table 49.
48. Schedule of funding progress (dollars in millions)
Actuarial VAAL as aActuarial Accrued Unfunded Percentage of
Actuarial Value Liability (AAL) AAL Funded Covered CoveredValuation of Assets Entry Age (VAAL) Ratio Payroll Payroll
Date (a) (b) (b-a) (a/b) (c) «b-a)/c)
7/1/92 $1,981.8 $4,425.5 $ 2,443.7 44.78% $ 993.3 246.02%711/93 2,113.9 4,502.1 2,388.2 46.95% 975.0 244.94%7/1194 2,225.2 4,662.6 2,437.4 47.72% 974.3 250.17%7/1195 2,312.1 4,850.8 2,538.7 47.66% 1,006.4 252.26%711196 2.457.2 5,098.1 2,640.9 48.20% 1,068.3 247.21%7/1/97 2,660.9 5,318.1 2,657.2 50.03% 1,067.7 248.87%7/1/98 2,921.3 5,586.1 2,664.8 52.30% 1,128.2 236.19%
William M. Mercer, Incorporated

'\ 'f
i(.1, ....
GOVERNMENTAL ACCOUNTING STANDARDS BOARD (GASB)
49. Schedule of contributions from the employer and other contributing entities
89
Annual PercentageFiscal Year Required Contributions' Contributed
1993 $209,352 100.0l}'o, 1994 $223,750 104.5%
1995 $212,838 100.0%]996 $222,482 100.0%1997 5237,016 100.0%1998 $252,080 100.0%
3. Doll3rs in thousands. For eaeh fise~l year, the actuarial valuation pro\;des the City ofPhiladelphi3 with the unfunded ~ctu~rial
accrued liability amortization payment ~s a dollar 3mount and the nonnal cOSt3S 3 perCent3ge of payroll. The City of
Philadelphia then multiplies their actual fiscal year p3yroll with that pertenlage to get the normal COStpayment. We determined
the annual required contribution as the greater of {il the resulting amount or (ii) the nortl1a\ cost plus a 40-year amortization of
the unfunded actuarial accrued liability with amortization p~yments increasing 5% per year.
Statement No. 27 disclosure
Under the Government Accounting Standards Board (GASB) Statement No. 27 for theperiod beginning after June 15, 1997 financial statements must include new standardreporting for pension expenditures/expenses. This section summarizes our valuation as weunderstand Statement No. 27. Because these are financial statement disclosures, ourinterpretation of the statements are subject to your auditor's review.
The new reporting elements are:
• Annual required contributions or ARC - this is the anticipated required contributionbased on statement specific valuation methods, valuation assumptions and unfundedliability amortization over a period, not to exceed forty years as a level payment orlevel percent of pay, and amortization of contribution deficiencies or excesses.
Your valuation method conforms to the entry age cost method as defined in Section Bof Statement 27. Unfunded actuarial accrued liabilities arefunded on average over19 years from July 1, 1998. Assets are valued as afive~year smoothing of gains andlosses on the market value. All assumptions used in the calculation are the valuationreflect our long term expectations.
• Net Pension Obligation or NPO - is made up of a transition liability or asset equal tothe accumulated value of contribution deficiencies or excesses over requiredcontributions from July 1, 1987 to Statement effective date (July 1, 1997) between theannual pension cost (discussed below) and the employer's contribution.
William M. Mercer, Incorporated