Citygen: An Interactive System for Procedural City Generation · allowing the user to directly...
9
Abstract Contemporary 3D games are often situated within large urban environments. This necessitates a time-consuming and expensive content creation process involving the modelling of vast amounts of geometric detail: including terrain, roads, buildings, and other associated features. We present a system called Citygen that aims to automate as much of this as possible by employing procedural generation methods to rapidly create the urban geometry typical of a modern city. Procedural methods have long been used within the graphics and game development communities to generate natural phenomena such as plants and trees. We employ these methods to generate the underlying road networks that form the structure of cities and urban neighbourhoods. These road networks are automatically mapped to any supplied terrain model, and adapt themselves to the specific geometry of the underlying terrain. Building footprints are automatically extracted from the resulting model and buildings can then be inserted either procedurally or by hand. Our system is unique in that it is designed to allow developers hands-on interactive control over the generation process. We achieve this by providing an interface allowing the user to directly manipulate geometric elements such as road intersection nodes, and to directly control and specify many aspects of the procedural generation. The results are updated in real time, thus facilitating an interactive design process. 1 Introduction Continuing improvements in technology and computing power mean that more and more detail, realism and scale are possible in games and other interactive graphics applications. The game industry is presented with a major challenge to create content that matches the expanded parameters of what is now possible on the latest hardware. This problem is exacerbated by consumers demanding a quality of content that reaches the bar set by the largest projects and the result is that everyday production costs are spiralling out of control. Related industries that also employ computer generated graphical content, such as the film industry, face similar challenges. A common approach to the content creation problem is to simply increase the number of artists working on a project to produce larger, more detailed and more realistic content. However, increasingly the artistic pipeline is not scaling, meaning that additional artist numbers do not generate a proportional yield of content. The result of this is that time and money that could have been allocated to improving game play or adding innovative features are lost on content creation. A potential solution is the application of procedural techniques. These methods employ algorithms to automatically generate assets and have been used for over 20 years in the field of computer graphics [12]. A wide range of applications exist: adding noise to existing textures [18], creating 3D textures of natural materials such as marble and wood [16], visualising life- like models of various tree and plant species [17] and generating detailed cellular textures such as skin or bark [12]. Recently procedural techniques have been expanded to construct geometric assets[4][17][6] and entire procedural worlds are now possible[3]. Existing procedural solutions primarily focus on the generation of natural phenomena[4]. Our work aims to apply similar methods to the generation of man-made phenomena, and focuses in particular on the creation of procedurally generated cities for use in games and graphical applications. Cityscapes are rich in visual and functional complexity and are a result of evolution over hundreds of years under the influence of countless factors. Some of the major influential factors affecting cities include population, transport, environment, elevation, vegetation, geology and cultural influence.[21][20] It is a difficult challenge for researchers and developers to create a realistic model of such a large and complex system. We aim to develop an accessible interactive software system that can automatically generate realistic, detailed and varied models of a city suitable for use in real-time rendering. 1.1 Citygen System We present a system called Citygen that employs procedural techniques to generate cityscapes for use in games and other graphics applications. A key design goal of the system was that it would allow the user close control over the generation process by means of direct manipulation of generation algorithm parameters via an accessible and intuitive visual interface. Furthermore it was regarded as crucial that the results of these manipulations would be computed and rendered in real time so that the user gets immediate feedback on their effect. This is what we mean when we state that Citygen is an interactive procedural city generation system. The motivation for this is so that an iterative design approach can be followed. The user can engage with the system by tweaking parameters, see their effect immediately, tweak again, and so on. This process can be continued as long as necessary until the desired results are obtained. We divide the city generation problem into three stages: 1. Primary Road Generation 2. Secondary Road Generation 3. Building Generation Citygen: An Interactive System for Procedural City Generation George Kelly [email protected] Department of Informatics Institute of Technology Blanchardstown, Ireland Hugh McCabe [email protected] Department of Informatics Institute of Technology Blanchardstown, Ireland
Transcript of Citygen: An Interactive System for Procedural City Generation · allowing the user to directly...

AbstractContemporary 3D games are often situated within large urban environments. This necessitates a time-consuming and expensive content creation process involving the modelling of vast amounts of geometric detail: including terrain, roads, buildings, and other associated features. We present a system called Citygen that aims to automate as much of this as possible by employing procedural generation methods to rapidly create the urban geometry typical of a modern city. Procedural methods have long been used within the graphics and game development communities to generate natural phenomena such as plants and trees. We employ these methods to generate the underlying road networks that form the structure of cities and urban neighbourhoods. These road networks are automatically mapped to any supplied terrain model, and adapt themselves to the specific geometry of the underlying terrain. Building footprints are automatically extracted from the resulting model and buildings can then be inserted either procedurally or by hand. Our system is unique in that it is designed to allow developers hands-on interactive control over the generation process. We achieve this by providing an interface allowing the user to directly manipulate geometric elements such as road intersection nodes, and to directly control and specify many aspects of the procedural generation. The results are updated in real time, thus facilitating an interactive design process.
1 IntroductionContinuing improvements in technology and computing power mean that more and more detail, realism and scale are possible in games and other interactive graphics applications. The game industry is presented with a major challenge to create content that matches the expanded parameters of what is now possible on the latest hardware. This problem is exacerbated by consumers demanding a quality of content that reaches the bar set by the largest projects and the result is that everyday production costs are spiralling out of control. Related industries that also employ computer generated graphical content, such as the film industry, face similar challenges.
A common approach to the content creation problem is to simply increase the number of artists working on a project to produce larger, more detailed and more realistic content. However, increasingly the artistic pipeline is not scaling, meaning that
additional artist numbers do not generate a proportional yield of content. The result of this is that time and money that could have been allocated to improving game play or adding innovative features are lost on content creation.
A potential solution is the application of procedural techniques. These methods employ algorithms to automatically generate assets and have been used for over 20 years in the field of computer graphics [12]. A wide range of applications exist: adding noise to existing textures [18], creating 3D textures of natural materials such as marble and wood [16], visualising life-like models of various tree and plant species [17] and generating detailed cellular textures such as skin or bark [12]. Recently procedural techniques have been expanded to construct geometric assets[4][17][6] and entire procedural worlds are now possible[3].
Existing procedural solutions primarily focus on the generation of natural phenomena[4]. Our work aims to apply similar methods to the generation of man-made phenomena, and focuses in particular on the creation of procedurally generated cities for use in games and graphical applications.
Cityscapes are rich in visual and functional complexity and are a result of evolution over hundreds of years under the influence of countless factors. Some of the major influential factors affecting cities include population, transport, environment, elevation, vegetation, geology and cultural influence.[21][20] It is a difficult challenge for researchers and developers to create a realistic model of such a large and complex system. We aim to develop an accessible interactive software system that can automatically generate realistic, detailed and varied models of a city suitable for use in real-time rendering.
1.1 Citygen SystemWe present a system called Citygen that employs procedural techniques to generate cityscapes for use in games and other graphics applications. A key design goal of the system was that it would allow the user close control over the generation process by means of direct manipulation of generation algorithm parameters via an accessible and intuitive visual interface. Furthermore it was regarded as crucial that the results of these manipulations would be computed and rendered in real time so that the user gets immediate feedback on their effect. This is what we mean when we state that Citygen is an interactive procedural city generation system. The motivation for this is so that an iterative design approach can be followed. The user can engage with the system by tweaking parameters, see their effect immediately, tweak again, and so on. This process can be continued as long as necessary until the desired results are obtained.
We divide the city generation problem into three stages:
1. Primary Road Generation
2. Secondary Road Generation
3. Building Generation
Citygen: An Interactive System for Procedural City GenerationGeorge Kelly
[email protected] of Informatics
Institute of Technology Blanchardstown, Ireland
Hugh [email protected]
Department of InformaticsInstitute of Technology Blanchardstown, Ireland
Primary roads are the main traffic flow arteries of the city whose function it is to transport people around the city and from one district to another (e.g. main roads, motorways etc). Secondary roads are the roads inside the areas enclosed by primary roads and their function is to service districts. Buildings are situated on the areas enclosed within secondary roads.
The essential character of a city is often dictated by the pattern of the primary road network (grid-like, radial etc..) and therefore Citygen uses this as the starting point of the generation process. The user can create, and manipulate, a graphical representation of a primary road network. Vertices of the primary road graph are called nodes and act as control points, they can be added, moved, deleted and so on. The roads which connect these nodes are procedurally generated by the system, mapped to the underlying terrain model, and rendered in real time.
Once a region is enclosed the secondary road network generation process is initiated automatically. Our system contains a variety of road network patterns and the user can choose which road network pattern to use based on the results desired (for example, grid-like streets or meandering suburban roads) and assign different patterns to different parts of the city. Several pattern presets are defined for convenience and each can be easily modified to alter the efficiency, connectivity, scale and flow of the resulting road network. Once again, the results are computed and rendered in real time allowing direct interactive manipulation of the process.
The final stage of generation is the construction of buildings. In order to accomplish this it is necessary to compute building footprints onto which the buildings should be placed. This is done by calculating all the enclosed areas between secondary roads and then subdividing them into lots. The buildings are then placed within the lots and the relevant materials are applied to the generated geometry. During the generation process the user can make changes to any stage and see the result of the changes propagated through in real-time.
1.2 Related ResearchOther researchers have tackled this problem with varying degrees of success. The most well known and perhaps most significant research has been carried out by Parish, Müller and colleagues on the CityEngine[15], a system that is capable of producing realistic and detailed models. The generation algorithms are inspired from the modelling of natural phenomena with string grammars[17][4] and L-systems are applied with geo-statistical image maps to construct road networks and buildings[15]. Our work is strongly influenced by the CityEngine, although we do not use string grammars or image maps our secondary road generation is based on parallel growth and our lot division employs a similar subdivision technique.
Procedural building generation has focused on the application of grammars to describe structure, like the Shape Grammars original proposed by Stiny[19]. These have been applied in various guises to the construction of building geometry[11]. In [3], Müller and Wonka define a specific grammar to characterize building structure. This system defines rules to operate on shapes and is applied to create a range of detailed buildings in several architectural styles. Recently this approach has been extended to employ imaging techniques to aid in the acquisition of generation rules from existing building façades [2].
Other approaches include the application of intelligent agents, real-time frustum filling and template based generation. Ben Watson et al. to simulate the evolution of cities by modeling land
use and evolving a city usage map over time that can be used later to create a city scape[8][10]. Real-time city generation has also been attempted, Greuter et al. implement a city generation system that fills the view frustum rapidly with buildings of shape combinations but placement is restricted to a road network consisting of a regular grid[14][7][9]. Sun et al.[13] propose the application of templates that encapsulate patterns such as raster radial to generate road networks.
Urban Design and Architecture authors have discussed the patterns, constituent components and perception of cities. In [21], Lynch writes about the image of the city and human perception, he itemises constituent elements of cities such as paths, edges, landmarks, nodes and regions. Alexander et al. document a number of patterns found in neighbourhoods, public areas and buildings [20]. The principles discussed provide an insight into the design of urban spaces and have direct applications for the generation of cities.
1.3 OverviewThe rest of this paper is structured as follows. In Section 2 we describe the algorithms and techniques involved in representing, generating and manipulating primary road networks. This includes an efficient graph data structure for encoding the network, and a set of sampling algorithms for computing road trajectories that follow underlying terrain in a natural and convincing way. Section 3 deals with the generation of the secondary roads. This involves the use of a Minimum Cycle Basis (MCB) algorithm to compute cells in the primary road graph and a set of generation algorithms for filling these cells with realistic looking secondary roads. In Section 4 we deal with the issues involved in building generation, focussing on how to solve the problem of computing lots and building footprints in an efficient manner. Section 5 presents some results and analyses the output of the Citygen system. Section 6 concludes and suggests some directions for further development.
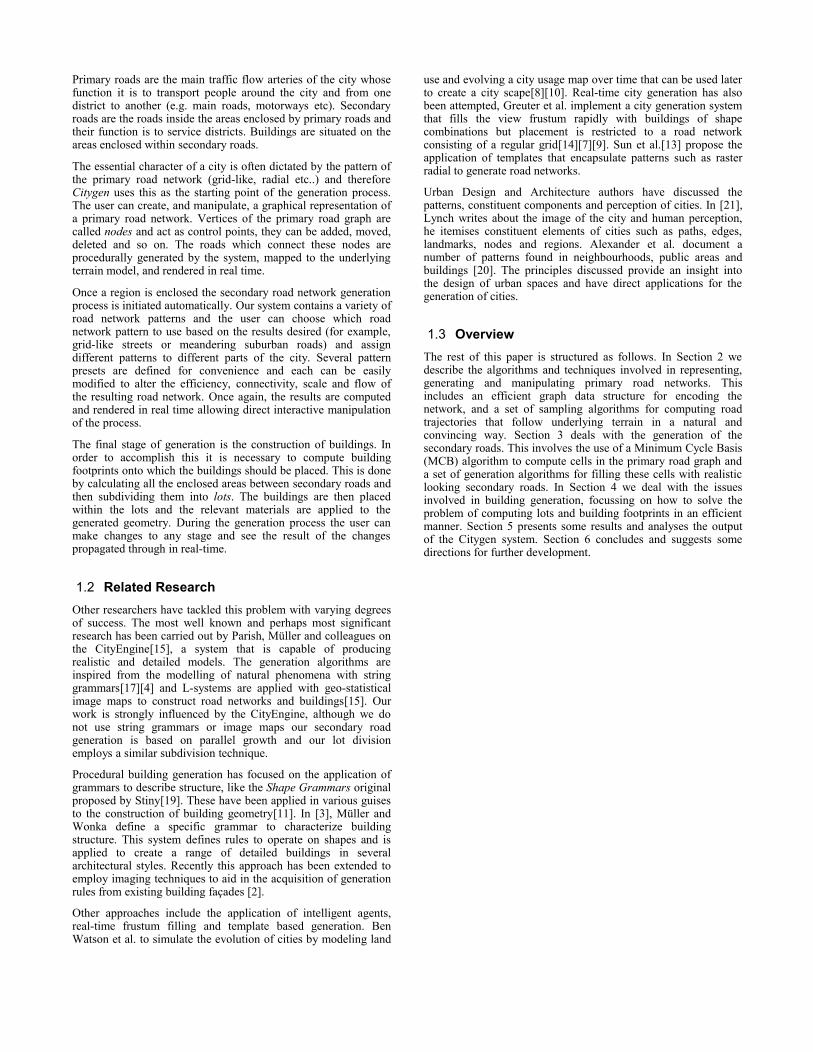
2 Primary Road NetworkRoad networks are represented as undirected planar graphs and are implemented as adjacency lists. An adjacency list contains an entry for each node and each of these entries comprises of a list of nodes that this node is directly connected to (see Figure 1). This data structure provides an efficient way to store, edit and perform operations on graph representations of road networks.
Figure 1 Adjacency List
These structures form the basis for all of our road network graphs, including both primary and secondary roads. We use two different graphs to store data solely for the primary road network and each neighbourhood region also uses an additional graph to store data for it’s secondary road network.
We call the two primary road network graphs, the high level graph, and the low level graph. The nodes of the high level graph correspond directly to primary road intersections and an edge between two nodes indicates that these nodes are connected together with a primary road. So, in other words it stores the topological structure of the primary road network. The low level graph defines the actual path each road takes across the terrain. It will also have nodes corresponding to primary nodes but also many more nodes between these indicating points on the terrain through which the road passes. By keeping the high level topological road graph separate from the low level graph, we minimise the data set for processing and provide a means for the efficient extraction of connectivity information.
Figure 2 Primary road network graphs, Yellow: High level graph, Red: Low-level graph, Orange: Plot samples and interpolation spline.
Nodes of the high level graph function as control nodes and can be interactively manipulated within the application in order to to adjust the topography of the primary road network. The nodes and edges of the low level graph are then computed by the system using the sampling, plotting and interpolation processes to construct the actual road routes through the terrain. We call these adaptive roads. After each manipulation the low level road graph contains the data required to render the roads. The manipulations of control nodes in the topological graph take place in a graphical interface with a real-time display of the final adaptive roads.
2.1 Adaptive RoadsThe concept behind adaptive roads is to fit road segments into the surrounding environment and ensure that the roads reflect the world in which they occupy. This is accomplished by plotting the road automatically using a sampling technique and various plotting strategies to adapt the roads to the terrain. In practice, to use adaptive roads, the user simply positions the source node and destination node of the road. These nodes correspond to the control nodes of the high level graph. The system then plots the path in real-time, providing immediate feedback and tactile control for the user to fine tune each segment. In addition constraints are employed to maintain the integrity of the road graph. Each proposed segment is automatically snapped to existing infrastructure whenever possible. Aside from aiding the user to rapidly create a road graph, these constraints ensure that the user cannot create an invalid road segment or leave the road graph in an unusable state. By fitting each road to the environment a sense of cohesiveness is achieved in the resulting road network, along with increased realism and character.
2.2 SamplingRoads are plotted by starting from a source point and sampling a set of points at regular intervals to define a set of possible paths to the destination. The road graph is stored as an undirected graph and the plotting operation is designed to be commutative (i.e. plot(a→b) == plot(b→a) ). The algorithm operates bidirectionally with sampling starting simultaneously from both the source node and the destination node and then finally terminates by meeting in the middle.
Parameters used to control the size of the samples, the number of samples taken and the maximum deviation allowed from the target direction.
dSAMPLE : sample sizenSAMPLE : number of samplesθDEV : angle of deviation
Each control point travels a distance dSAMPLE and deviates from the direction of the destination point less than an angle θDEV. A set of possible control points is obtained from a fan of nSAMPLE evenly spaced samples which are evenly distributed over an arc of degree 2θDEV .
Figure 3 Road interval sampling
The road plotting process is complete when a sample is within a constant dSNAP of the destination point, this is guaranteed by ensuring θDEV < 45o and dSNAP > dSTEP*cos(θDEV). By limiting the deviance angle of the road samples the resulting roads are free to meander when necessary but not without purpose as they are bounded to travel towards their goal.
When the sampling is complete and the path has been plotted, the selected samples are inserted into a Catmull Rom spline where fine grained segments can be interpolated and extracted for insertion into the low level road network graph for final rendering.
src
dstDEVθDSTdPROGRESSd
DSTd
0 1
2 3
4
5
0
1
2
3
4
5
3
3
3
0
3
4
1 2 4
52
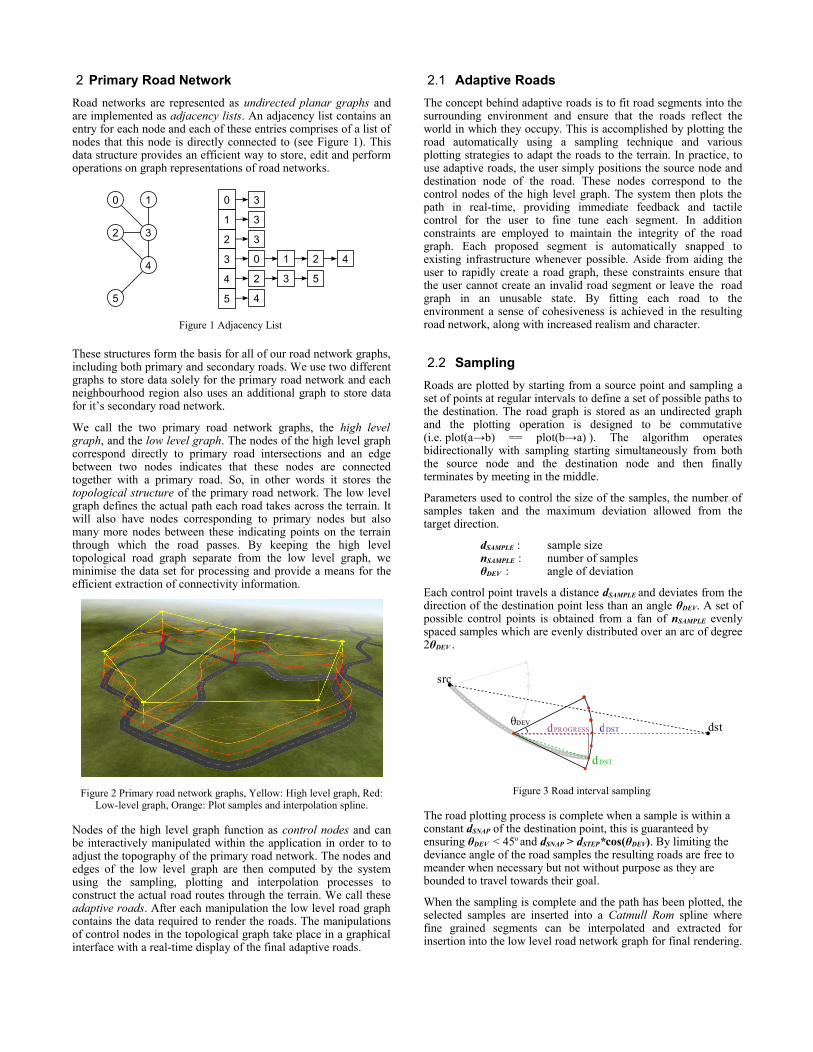
2.3 Sample Selection StrategiesDifferent selection strategies are employed to choose the samples acquired in the sampling process. Samples are primarily selected from the elevation difference between the sample and the previous plot point. In some strategies additional measurements are taken into account. A number of these different sample selection strategies are shown in action in Figure 4 and explained below.
Figure 4 Adaptive roads in Citygen. Blue - Minimum Elevation, Red - Least Elevation Difference, Green - Even Elevation Difference.
Minimum Elevation Strategy: This is the most basic strategy in which the sample with the lowest elevation is selected resulting in a road path similar to the route a river or a stream would take.
Minimum Elevation Difference: A more competent strategy than the first, this strategy avoids elevation drops or rises, and seeks to maintain an even elevation for the complete road segment. However a problem can occur when constructing roads between a source and destination node with a large elevation difference. In this case the Minimum Elevation Difference strategy will avoid the required ascent and descent until the last step when it has to join in the middle. On certain terrains this can result in a road with two smooth road sections and a steep section joining the two.
Even Elevation Difference: To improve on the Minimum Elevation Difference strategy a technique with some more foresight was required. This is the impetus for the Even Elevation Difference strategy which aims to plot an even and smooth path for the road by looking ahead and re-evaluating the elevation goal as it progresses. This strategy operates by calculating the elevation difference between the current position and goal position. Based on the progress being made towards the goal, the algorithm seeks to ascend or descend its even portion of elevation for each plot point.
The Even Elevation Difference strategy selects the sample which has the minimum difference between distance covered and elevation ratio, and the goal distance and elevation ratio.
MinAbs(elevationSTEP / dPROGRESS - elevationDEST / dDST)
Each sample aims to cover an even portion of the total road elevation. The resulting roads are smooth curves that meander when necessary weaving through hilly terrain and searching for even paths to ascend or descend large elevation differences.
3 Secondary Road GenerationSecondary roads service the local area within districts by providing access to and from the primary road network. In our system, districts are the regions of the terrain enclosed by primary roads. We call these city cells and they form the basic units upon which the secondary road generation process operates. The generation of the secondary road network within cells is accomplished using a growth based algorithm similar to the L-systems technique applied extensively to the generation of natural phenomena. There are important aspects to this process that will be described:
City Cell Extraction: How do we extract the city cells from the primary road network graph?
Secondary Road Growth: How do we generate a range of road patterns in the secondary road network within these cells?
Snap Algorithm: How do we obtain information on the intersection status and proximity to existing roads from the network in an efficient manner.
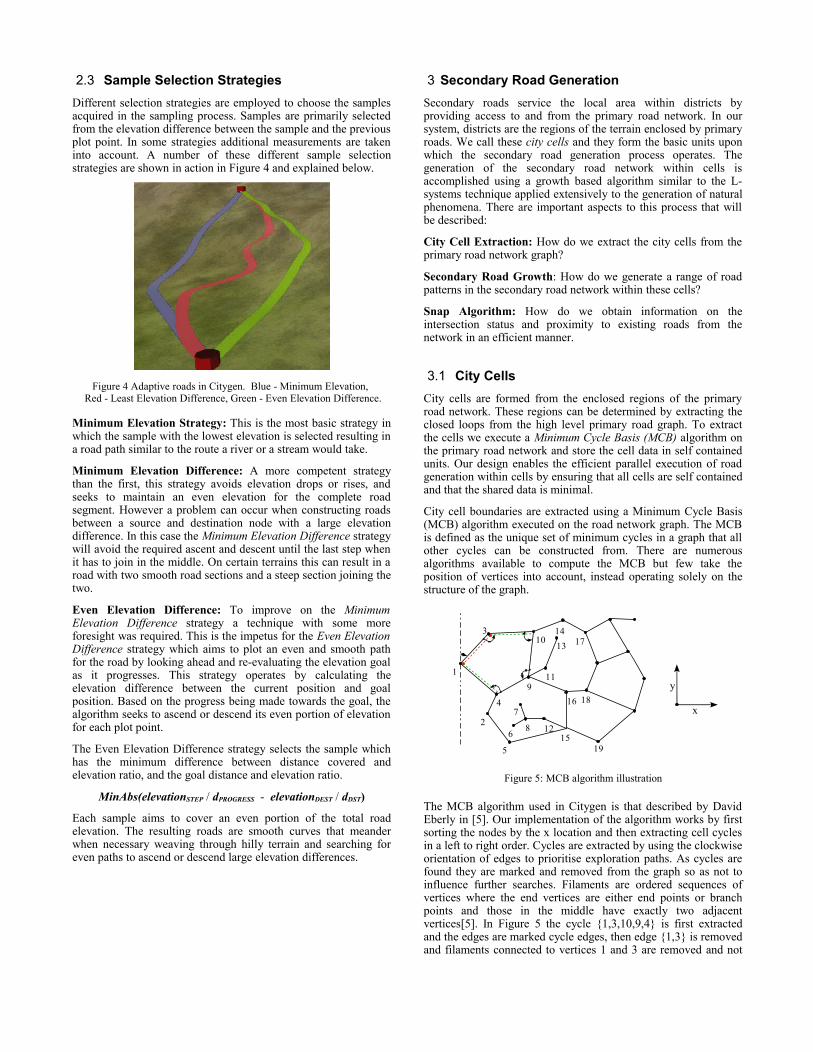
3.1 City CellsCity cells are formed from the enclosed regions of the primary road network. These regions can be determined by extracting the closed loops from the high level primary road graph. To extract the cells we execute a Minimum Cycle Basis (MCB) algorithm on the primary road network and store the cell data in self contained units. Our design enables the efficient parallel execution of road generation within cells by ensuring that all cells are self contained and that the shared data is minimal.
City cell boundaries are extracted using a Minimum Cycle Basis (MCB) algorithm executed on the road network graph. The MCB is defined as the unique set of minimum cycles in a graph that all other cycles can be constructed from. There are numerous algorithms available to compute the MCB but few take the position of vertices into account, instead operating solely on the structure of the graph.
Figure 5: MCB algorithm illustration
The MCB algorithm used in Citygen is that described by David Eberly in [5]. Our implementation of the algorithm works by first sorting the nodes by the x location and then extracting cell cycles in a left to right order. Cycles are extracted by using the clockwise orientation of edges to prioritise exploration paths. As cycles are found they are marked and removed from the graph so as not to influence further searches. Filaments are ordered sequences of vertices where the end vertices are either end points or branch points and those in the middle have exactly two adjacent vertices[5]. In Figure 5 the cycle {1,3,10,9,4} is first extracted and the edges are marked cycle edges, then edge {1,3} is removed and filaments connected to vertices 1 and 3 are removed and not
y
x
1
2
3
4
5
6
7
8
9
10
11
12
1314
15
16
17
18
19
stored as they part of a cycle. This brief outline is included to provide an insight into the operation of the algorithm, for a detailed explanation of the algorithms operation see [5].
After the cycles and filaments have been extracted, their containing cycles are determined and the data is grouped and then stored in a cell data structure. Each cell is self-contained and consists of a private road graph with the boundary cycle, filament roads and a small set of parameters to control road generation. As a result of this self contained design, it is possible for secondary road generation to be executed efficiently in parallel. Parallel generation of cells is currently implemented for multi-core systems running Citygen, but has a clear path to be extended further to use GPGPU programming.
3.2 Secondary Road GrowthOnce a city cell is created, the generation of secondary roads is initiated within it using a growth based algorithm. The choice of using a growth based algorithm was based on success of the prior L-system work of Prusinkiewicz on plants[17] and Müller on city generation[15]. Although our application does use L-systems it shares the concept of parallel growth. Our generation algorithm is distinct in that it is computationally efficient and contains a number of optimisation to enable it to run in real-time. The generation is flexible producing a wide range of output and functions by adding road segments in a parallel fashion similar to organic growth.
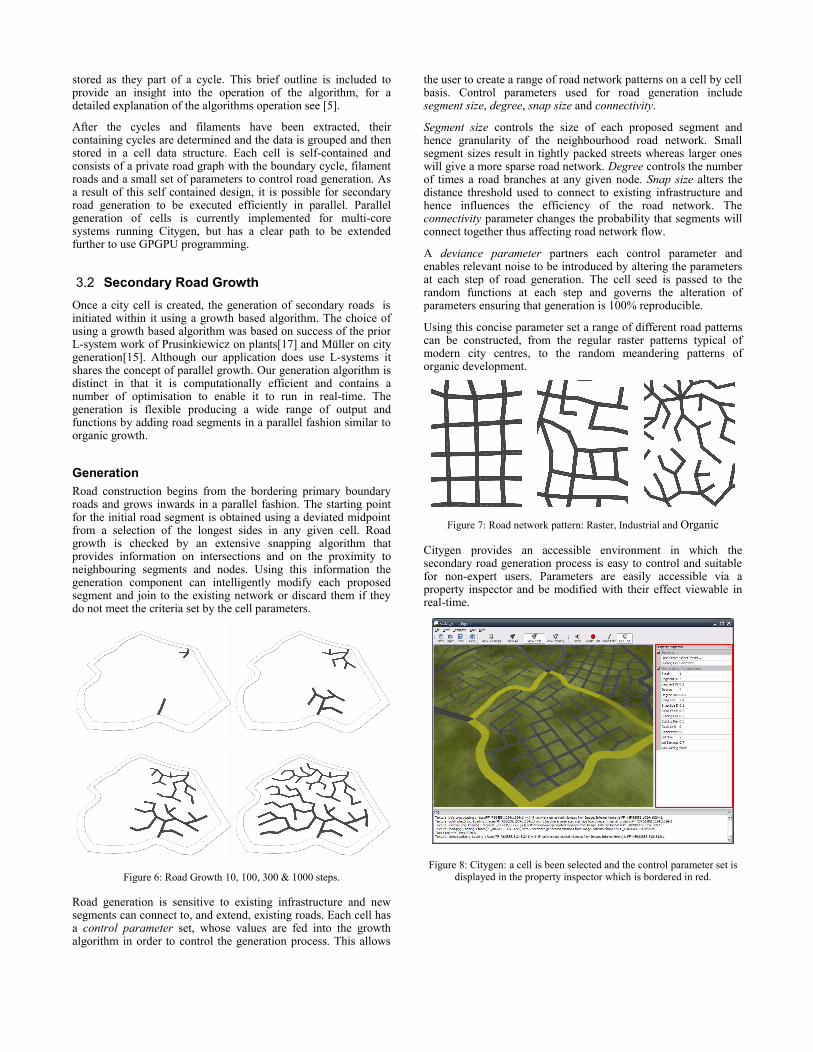
GenerationRoad construction begins from the bordering primary boundary roads and grows inwards in a parallel fashion. The starting point for the initial road segment is obtained using a deviated midpoint from a selection of the longest sides in any given cell. Road growth is checked by an extensive snapping algorithm that provides information on intersections and on the proximity to neighbouring segments and nodes. Using this information the generation component can intelligently modify each proposed segment and join to the existing network or discard them if they do not meet the criteria set by the cell parameters.
Figure 6: Road Growth 10, 100, 300 & 1000 steps.
Road generation is sensitive to existing infrastructure and new segments can connect to, and extend, existing roads. Each cell has a control parameter set, whose values are fed into the growth algorithm in order to control the generation process. This allows
the user to create a range of road network patterns on a cell by cell basis. Control parameters used for road generation include segment size, degree, snap size and connectivity.
Segment size controls the size of each proposed segment and hence granularity of the neighbourhood road network. Small segment sizes result in tightly packed streets whereas larger ones will give a more sparse road network. Degree controls the number of times a road branches at any given node. Snap size alters the distance threshold used to connect to existing infrastructure and hence influences the efficiency of the road network. The connectivity parameter changes the probability that segments will connect together thus affecting road network flow.
A deviance parameter partners each control parameter and enables relevant noise to be introduced by altering the parameters at each step of road generation. The cell seed is passed to the random functions at each step and governs the alteration of parameters ensuring that generation is 100% reproducible.
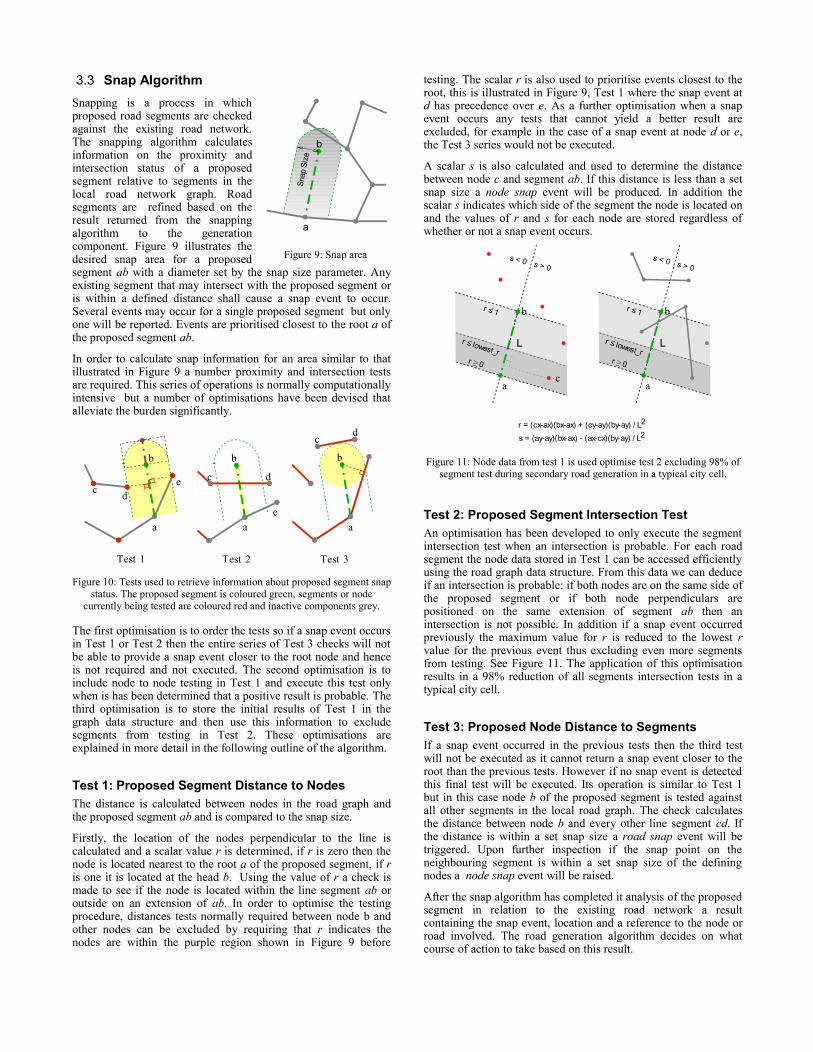
Using this concise parameter set a range of different road patterns can be constructed, from the regular raster patterns typical of modern city centres, to the random meandering patterns of organic development.
Figure 7: Road network pattern: Raster, Industrial and Organic
Citygen provides an accessible environment in which the secondary road generation process is easy to control and suitable for non-expert users. Parameters are easily accessible via a property inspector and be modified with their effect viewable in real-time.
Figure 8: Citygen: a cell is been selected and the control parameter set is displayed in the property inspector which is bordered in red.
3.3 Snap Algorithm Snapping is a process in which proposed road segments are checked against the existing road network. The snapping algorithm calculates information on the proximity and intersection status of a proposed segment relative to segments in the local road network graph. Road segments are refined based on the result returned from the snapping algorithm to the generation component. Figure 9 illustrates the desired snap area for a proposed segment ab with a diameter set by the snap size parameter. Any existing segment that may intersect with the proposed segment or is within a defined distance shall cause a snap event to occur. Several events may occur for a single proposed segment but only one will be reported. Events are prioritised closest to the root a of the proposed segment ab.
In order to calculate snap information for an area similar to that illustrated in Figure 9 a number proximity and intersection tests are required. This series of operations is normally computationally intensive but a number of optimisations have been devised that alleviate the burden significantly.
Figure 10: Tests used to retrieve information about proposed segment snap status. The proposed segment is coloured green, segments or node
currently being tested are coloured red and inactive components grey.
The first optimisation is to order the tests so if a snap event occurs in Test 1 or Test 2 then the entire series of Test 3 checks will not be able to provide a snap event closer to the root node and hence is not required and not executed. The second optimisation is to include node to node testing in Test 1 and execute this test only when is has been determined that a positive result is probable. The third optimisation is to store the initial results of Test 1 in the graph data structure and then use this information to exclude segments from testing in Test 2. These optimisations are explained in more detail in the following outline of the algorithm.
Test 1: Proposed Segment Distance to NodesThe distance is calculated between nodes in the road graph and the proposed segment ab and is compared to the snap size.
Firstly, the location of the nodes perpendicular to the line is calculated and a scalar value r is determined, if r is zero then the node is located nearest to the root a of the proposed segment, if r is one it is located at the head b. Using the value of r a check is made to see if the node is located within the line segment ab or outside on an extension of ab. In order to optimise the testing procedure, distances tests normally required between node b and other nodes can be excluded by requiring that r indicates the nodes are within the purple region shown in Figure 9 before
testing. The scalar r is also used to prioritise events closest to the root, this is illustrated in Figure 9, Test 1 where the snap event at d has precedence over e. As a further optimisation when a snap event occurs any tests that cannot yield a better result are excluded, for example in the case of a snap event at node d or e, the Test 3 series would not be executed.
A scalar s is also calculated and used to determine the distance between node c and segment ab. If this distance is less than a set snap size a node snap event will be produced. In addition the scalar s indicates which side of the segment the node is located on and the values of r and s for each node are stored regardless of whether or not a snap event occurs.
Figure 11: Node data from test 1 is used optimise test 2 excluding 98% of segment test during secondary road generation in a typical city cell.
Test 2: Proposed Segment Intersection TestAn optimisation has been developed to only execute the segment intersection test when an intersection is probable. For each road segment the node data stored in Test 1 can be accessed efficiently using the road graph data structure. From this data we can deduce if an intersection is probable: if both nodes are on the same side of the proposed segment or if both node perpendiculars are positioned on the same extension of segment ab then an intersection is not possible. In addition if a snap event occurred previously the maximum value for r is reduced to the lowest r value for the previous event thus excluding even more segments from testing. See Figure 11. The application of this optimisation results in a 98% reduction of all segments intersection tests in a typical city cell.
Test 3: Proposed Node Distance to SegmentsIf a snap event occurred in the previous tests then the third test will not be executed as it cannot return a snap event closer to the root than the previous tests. However if no snap event is detected this final test will be executed. Its operation is similar to Test 1 but in this case node b of the proposed segment is tested against all other segments in the local road graph. The check calculates the distance between node b and every other line segment cd. If the distance is within a set snap size a road snap event will be triggered. Upon further inspection if the snap point on the neighbouring segment is within a set snap size of the defining nodes a node snap event will be raised.
After the snap algorithm has completed it analysis of the proposed segment in relation to the existing road network a result containing the snap event, location and a reference to the node or road involved. The road generation algorithm decides on what course of action to take based on this result.
Figure 9: Snap area
b
Snap
Siz
e
a
a
c d
c d
b
a
e
b
a
c d
b
e
Test 1 Test 2 Test 3
b
a
r ≤ 1
r ≥ 0
r = (cx-ax)(bx-ax) + (cy-ay)(by-ay) / L2
s = (ay-ay)(bx-ax) - (ax-cx)(by-ay) / L2
L
c
b
a
r ≤ 1
r ≥ 0
s < 0 s > 0s < 0 s > 0
r ≤ lowest_rr ≤ lowest_r
L

4 Building ConstructionThe building construction stage of Citygen is accomplished in three stages. Firstly the enclosed regions are extracted from the secondary road graph by applying the Minimum Cycle Basis algorithm as described previously in Section 2. Secondly the lots are identified by splitting the regions into minimal tracts or parcels of land suitable for development. Thirdly and finally the buildings are selected based on their control parameters and constructed in the boundaries of the lots and textured accordingly.
4.1 BlocksBlocks represent the enclosed regions of the secondary road network. The role of the block is to add any extra geometry such as footpaths, signposts, traffic lights or post boxes onto the region before lot subdivision occurs. Currently only footpaths are implemented by applying a simple inset to the boundary polygon.
4.2 Lot SubdivisionThe lot division process operates on the region boundary deifned in the city block. A subdivision algorithm is applied based on that described by Mueller et al. in [15] but without the requirement for regions to be convex. Both concave and convex boundaries are supported in our implementation and as a result it is possible to extract valid lots from complex regions and even facilitate the presence of filament roads. This enables us to apply the technique to suburban areas and support filament roads.
Figure 12: Lot Division Algorithm
The algorithm works by subdividing each region and operates recursively until a target lot size is reached. Each split operation is executed using the perpendicular of the longest side. Steps required to complete a single region split are as follows:
1. Identify the longest side beyond the target lot size and calculate the perpendicular from a deviated midpoint to split the polygon. The deviation introduces reproducible noise for more natural looking lots.
2. Calculate the intersection points between the line and the boundary and store them in the order encountered with each polygon index included. {a:2, b:7, c:9, d:14}
3. Process the intersection segments excluding those outside the polygon and construct a data structure to provide a graph for the polygon. {c→b, a→d}.
4. Merge the intersection graph with the polygon and extract the cycles from the graph.
The lot division algorithm works fine for Manhattan like regions where the input data is generally regular and block shaped. However when the algorithm was initially tested on suburban road networks the resulting lots were angular and irregular. To combat
this and provide realistic lots for suburban networks a modification was made to the lot division process in which division was first prioritised along sides with road access. As a result of this change almost all lots were oriented perpendicular to their access road reflecting the conditions found in the real world. In a similar fashion the value of lots for development is calculated taking appurtenances into account as used in the real-estate industry. Lots without road access are not considered suitable for building development and are discarded or destined for green space.
Figure 13: Down-town and Suburban lots in Debug View
4.3 Building GenerationBuildings are generated on the lots created by the lot subdivision process. Hints are attached to each neighbourhood as part of the control parameter set and advise the building generation algorithm on what class of building to be generated and how it should be positioned on the lot. Down-town buildings attempt to make maximum use of lot space while suburban buildings retreat in from their road access side and also from each other to make room for a garden area. Industrial building retreat in from their boundaries to emulate the green space found in industrial estates.
Building construction begins with the positioning of the building footprint on the lot by in-setting the polygon boundary of the lot. After the footprint has been calculated is is then extruded upwards to produce a solid object. The geometry of the buildings is very basic but with the aid of normal maps we can simulate extra geometry on the building. Figure 14 shows a typical texture tile and associated normal map for a building.
Figure 14: Building Texture, Normal Map and the resulting building after the material has been applied.
0
3
45
6
7
9
10
11
14
abcd
8 2 1
12 13

5 ResultsIn this section we show Citygen in action and introduce the user interface. We also present several screenshot images displaying generated cities that were created in Citygen being rendered in real-time within the application.
InterfaceCitygen is an interactive application that provides a complete integrated workspace for city generation. The application is designed to be accessible and easy to use, expert knowledge is not required and it is suitable for artists and non-technical staff. Cities are edited and view using a point and click interface similar to a 3D editor and the application interface is structured simply with three main editing modes: node, road and cell. Each mode has an associated set of tools and property inspector to view and modify parameter values. There is no need for a preview mode as the application provides a live real-time 3D view of the world using the built-in game engine[1] which is used throughout the generation process.
OutputFigure 16 displays a screenshot of a generated test city. The city model shown contains over 24,000 buildings and the complete generation time for the city including adaptive roads, secondary roads and buildings is only 3.5 seconds. The buildings are currently textured using only a small number of materials. Further building textures have not been added due to time constraints, however the application does provide a facility for the user to add their own materials.
Even with this amount of geometry the city is navigable at frame rates and can be still be edited interactively.Note: Metrics were taken from Citygen running on a laptop with the following specifications: Intel Core Duo @
2.33Ghz, ATI X1600, 1GB RAM.
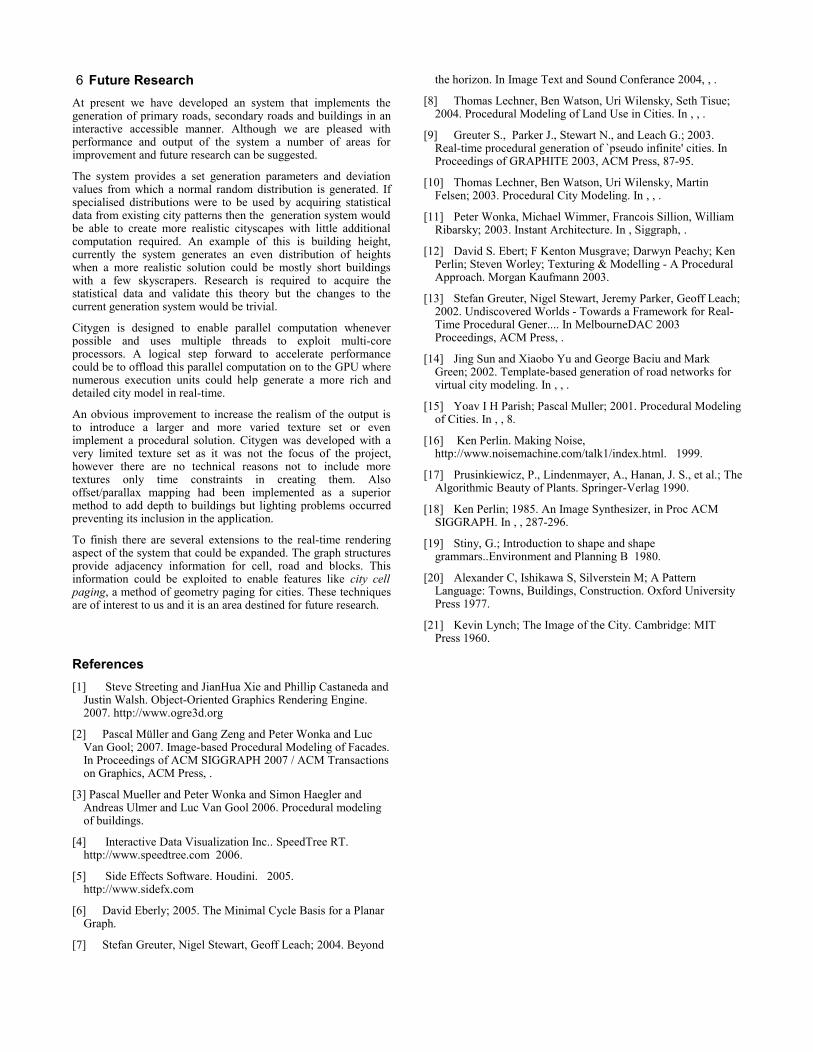
6 Future ResearchAt present we have developed an system that implements the generation of primary roads, secondary roads and buildings in an interactive accessible manner. Although we are pleased with performance and output of the system a number of areas for improvement and future research can be suggested.
The system provides a set generation parameters and deviation values from which a normal random distribution is generated. If specialised distributions were to be used by acquiring statistical data from existing city patterns then the generation system would be able to create more realistic cityscapes with little additional computation required. An example of this is building height, currently the system generates an even distribution of heights when a more realistic solution could be mostly short buildings with a few skyscrapers. Research is required to acquire the statistical data and validate this theory but the changes to the current generation system would be trivial.
Citygen is designed to enable parallel computation whenever possible and uses multiple threads to exploit multi-core processors. A logical step forward to accelerate performance could be to offload this parallel computation on to the GPU where numerous execution units could help generate a more rich and detailed city model in real-time.
An obvious improvement to increase the realism of the output is to introduce a larger and more varied texture set or even implement a procedural solution. Citygen was developed with a very limited texture set as it was not the focus of the project, however there are no technical reasons not to include more textures only time constraints in creating them. Also offset/parallax mapping had been implemented as a superior method to add depth to buildings but lighting problems occurred preventing its inclusion in the application.
To finish there are several extensions to the real-time rendering aspect of the system that could be expanded. The graph structures provide adjacency information for cell, road and blocks. This information could be exploited to enable features like city cell paging, a method of geometry paging for cities. These techniques are of interest to us and it is an area destined for future research.
References[1] Steve Streeting and JianHua Xie and Phillip Castaneda and
Justin Walsh. Object-Oriented Graphics Rendering Engine. 2007. http://www.ogre3d.org
[2] Pascal Müller and Gang Zeng and Peter Wonka and Luc Van Gool; 2007. Image-based Procedural Modeling of Facades. In Proceedings of ACM SIGGRAPH 2007 / ACM Transactions on Graphics, ACM Press, .
[3] Pascal Mueller and Peter Wonka and Simon Haegler and Andreas Ulmer and Luc Van Gool 2006. Procedural modeling of buildings.
[4] Interactive Data Visualization Inc.. SpeedTree RT. http://www.speedtree.com 2006.
[5] Side Effects Software. Houdini. 2005. http://www.sidefx.com
[6] David Eberly; 2005. The Minimal Cycle Basis for a Planar Graph.
[7] Stefan Greuter, Nigel Stewart, Geoff Leach; 2004. Beyond
the horizon. In Image Text and Sound Conferance 2004, , .
[8] Thomas Lechner, Ben Watson, Uri Wilensky, Seth Tisue; 2004. Procedural Modeling of Land Use in Cities. In , , .
[9] Greuter S., Parker J., Stewart N., and Leach G.; 2003. Real-time procedural generation of `pseudo infinite' cities. In Proceedings of GRAPHITE 2003, ACM Press, 87-95.
[10] Thomas Lechner, Ben Watson, Uri Wilensky, Martin Felsen; 2003. Procedural City Modeling. In , , .
[11] Peter Wonka, Michael Wimmer, Francois Sillion, William Ribarsky; 2003. Instant Architecture. In , Siggraph, .
[12] David S. Ebert; F Kenton Musgrave; Darwyn Peachy; Ken Perlin; Steven Worley; Texturing & Modelling - A Procedural Approach. Morgan Kaufmann 2003.
[13] Stefan Greuter, Nigel Stewart, Jeremy Parker, Geoff Leach; 2002. Undiscovered Worlds - Towards a Framework for Real-Time Procedural Gener.... In MelbourneDAC 2003 Proceedings, ACM Press, .
[14] Jing Sun and Xiaobo Yu and George Baciu and Mark Green; 2002. Template-based generation of road networks for virtual city modeling. In , , .
[15] Yoav I H Parish; Pascal Muller; 2001. Procedural Modeling of Cities. In , , 8.
[16] Ken Perlin. Making Noise, http://www.noisemachine.com/talk1/index.html. 1999.
[17] Prusinkiewicz, P., Lindenmayer, A., Hanan, J. S., et al.; The Algorithmic Beauty of Plants. Springer-Verlag 1990.
[18] Ken Perlin; 1985. An Image Synthesizer, in Proc ACM SIGGRAPH. In , , 287-296.
[19] Stiny, G.; Introduction to shape and shape grammars..Environment and Planning B 1980.
[20] Alexander C, Ishikawa S, Silverstein M; A Pattern Language: Towns, Buildings, Construction. Oxford University Press 1977.
[21] Kevin Lynch; The Image of the City. Cambridge: MIT Press 1960.