Managing Floodplain Development Through The National Flood ...

CITY OF VIRGINIA BEACH,
VIRGINIA INDEPENDENT CITY
VOLUME 1 OF 1
REVISED: MAY 4, 2009
Federal Emergency Management Agency FLOOD INSURANCE STUDY NUMBER
515531V000A

NOTICE TO
FLOOD INSURANCE STUDY USERS
Communities participating in the National Flood Insurance Program have established
repositories of flood hazard data for floodplain management and flood insurance
purposes. This Flood Insurance Study (FIS) may not contain all data available within the
repository. It is advisable to contact the community repository for any additional data.
Part or all of this FIS may be revised and republished at any time. In addition, part of this
FIS may be revised by the Letter of Map Revision process, which does not involve
republication or redistribution of the FIS. It is, therefore, the responsibility of the user to
consult with community officials and to check the community repository to obtain the
most current FIS components.
Initial FIS Effective Date: October 3, 1970
Revised FIS Dates: July 1, 1974
October 8, 1976
July 17, 1984 (FIS report); January 17, 1985 (Flood
Insurance Rate Map)
December 5, 1990
August 18, 1992
December 5, 1996
May 4, 2009

i
TABLE OF CONTENTS
Page
1.0 INTRODUCTION ......................................................................................................1
1.1 Purpose of Study..............................................................................................1
1.2 Authority and Acknowledgments ....................................................................1
1.3 Coordination ....................................................................................................2
2.0 AREA STUDIED .......................................................................................................2
2.1 Scope of Study .................................................................................................2
2.2 Community Description...................................................................................3
2.3 Principle Flood Problems.................................................................................4
2.4 Flood Protection Measures ..............................................................................7
3.0 ENGINEERING METHODS.....................................................................................8
3.1 Hydrologic Analyses........................................................................................8
3.2 Hydraulic Analyses........................................................................................12
3.3 Vertical Datum...............................................................................................21
4.0 FLOODPLAIN MANAGEMENT APPLICATIONS ..............................................22
4.1 Floodplain Boundaries...................................................................................22
4.2 Floodways......................................................................................................23
5.0 INSURANCE APPLICATIONS ..............................................................................42
6.0 FLOOD INSURANCE RATE MAP ........................................................................43
7.0 OTHER STUDIES....................................................................................................43
8.0 LOCATION OF DATA............................................................................................43
9.0 BIBLIOGRAPHY AND REFERENCES........................................................... 44-45

ii
TABLE OF CONTENTS - continued
Page
FIGURES
Figure 1 Transect Location Map ....................................................................................15
Figure 2 Beach Erosion Control & Hurricane Protection Project: Transect Locations...16
Figure 3 Typical Transect Schematic.............................................................................17
Figure 4 Floodway Schematic........................................................................................24
TABLES
Table 1 Summary of Discharges................................................................................9-10
Table 2 Summary of Stillwater Elevations ...................................................................11
Table 3 Transect Descriptions ......................................................................................18
Table 4 Transect Data ...................................................................................................19
Table 5 New Transect Data...........................................................................................20
Table 6 Vertical Datum Conversion Values .................................................................21
Table 7 Floodway Data............................................................................................25-41
EXHIBITS
Exhibit 1 – Flood Profiles
Canal No. 1 North Panel 01P
Canal No. 2 London Bridge Creek Panel 02P-04P
Canal No. 2 West Neck Creek Panel 05P-08P
Canal No. 4 Panel 09P
Cedar Hill Canal Panel 10P-11P
Colony Acres Canal Panel 12P
Fox Run Canal Panel 13P
Green Run Canal Panel 14P
Holland Road Corridor System Panel 15P
Holland Road Tributary to Thalia Creek Panel 16P
Lake Banbury Panel 17P
Lake Pembroke Panel 18P
Lake Smith Tributary Panel 19P
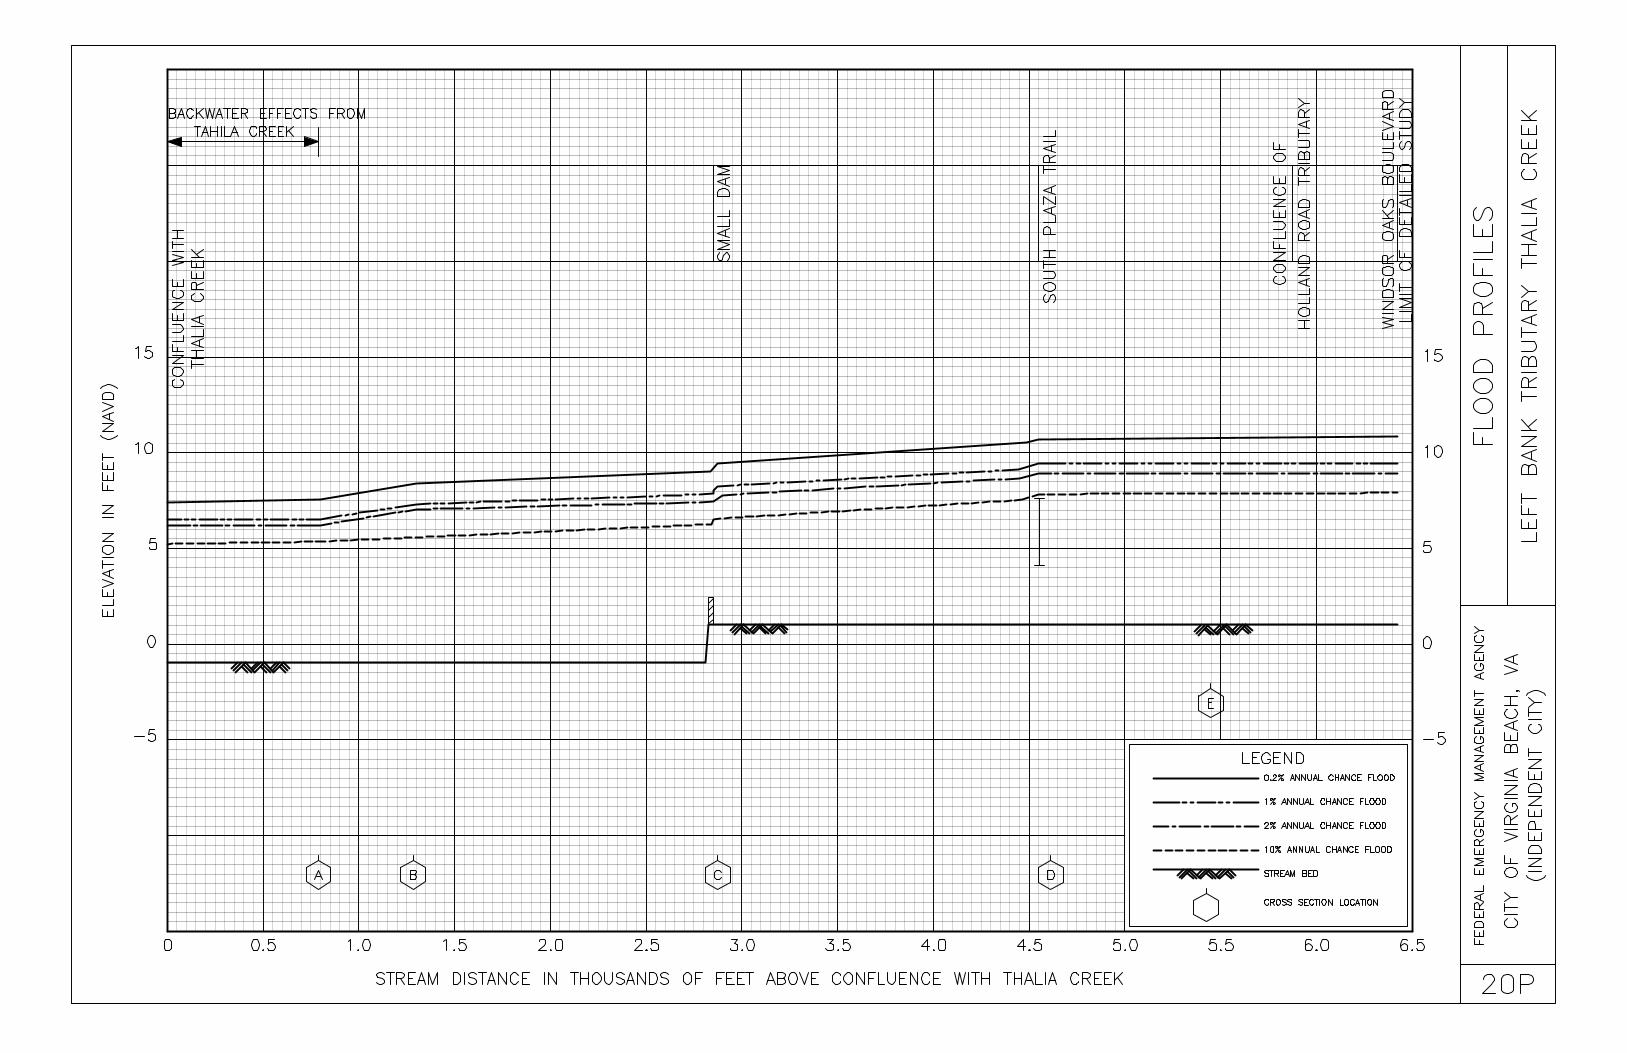
Left Bank Tributary to Thalia Creek Panel 20P
Mill Dam Creek Panel 21P-22P
Pine Tree Branch Panel 23P
Salem Canal Panel 24P-25P
Thalia Creek Panel 26P
Exhibit 2 – Digital Flood Insurance Rate Map Index
Digital Flood Insurance Rate Map

1
FLOOD INSURANCE STUDY
CITY OF VIRGINIA BEACH, INDEPENDENT CITY, VIRGINIA
1.0 INTRODUCTION
1.1 Purpose of Study
This Flood Insurance Study (FIS) revises and updates a previous FIS/Flood Insurance Rate Map
(FIRM) for the City of Virginia Beach, Independent City, Virginia. This new product is in digital
format and is now considered a Digital Flood Insurance Rate Map (DFIRM). This information
will be used by the City of Virginia Beach to update existing floodplain regulations as part of the
Regular Phase of the National Flood Insurance Program (NFIP). The information will also be
used by local and regional planners to further promote sound land use and floodplain
development.
In some States or communities, floodplain management criteria or regulations may exist that are
more restrictive or comprehensive than the minimum Federal requirements. In such cases, the
more restrictive criteria take precedence and the State (or other jurisdictional agency) will be able
to explain them.
1.2 Authority and Acknowledgments
The sources of authority for this FIS are the National Flood Insurance Act of 1968 and the Flood
Disaster Protection Act of 1973.
The hydrologic and hydraulic analyses for the FIS report dated July 17, 1984, and the FIRM
dated January 17, 1985, (hereinafter referred to collectively as the 1985 revision) were prepared
by the U.S. Army Corp of Engineers (USACE), Norfolk District, for the Federal Emergency
Management Agency (FEMA), under Inter-Agency Agreement No. EMW-E-0105, Project Order
No. 10. That work was completed in February 1983. The FIS report was created in the 1985
revision.
In the December 5, 1990 revision, updated topographic information for the Stumpy Lake
watershed was prepared by the City of Virginia Beach, under agreement with FEMA. Undated
topographic information for the Charlestowne Lake South area was also included in the revision.
That work was completed in December 1989.
In the August 18, 1992 revision, the hydrologic and hydraulic analyses were prepared by the
USACE, Norfolk District. That work was completed in April 1991.
In the 1996 revision, the hydraulic analyses were prepared by the USACE, Norfolk District, for
FEMA under Inter-Agency Agreement No. EMW-91-E-3525, Project Order No. 1. This work
was completed in March 1993. The City of Virginia Beach provided the digital base map. The
coordinate system used for production of the 1996 digital FIRM was Universal Transverse
Mercator, North American Datum of 1927, and Clarke 1866 spheroid.
In this revision, Michael Baker Jr. completed the digital conversion and redelineation under
contract agreement HSFEHQ-04-D-0025, and the work was completed in December 2007. Base
mapping was provided by The City of Virginia Beach, including planimetric and terrain data
from aerial survey data captured in March of 2004, at a scale of 1” =600’, prepared by Sanborn,

2
Colorado Springs, Colorado, June 2005. The Sanborn aerial survey also captured LiDAR,
from which was derived the bare-earth LiDAR, DTMs, and 2 foot contours. The special flood
hazards were redelineated on this new terrain data. At the request of the City, the horizontal
coordinate system was changed to Virginia State Plane Coordinate System South Zone, North
American Datum of 1983, HARN, for this update in order to match the City’s planimetric base
layer coordinate system.
1.3 Coordination
The purpose of an initial Consultation Coordination Officer’s (CCO) meeting is to discuss the
scope of the FIS. A final CCO meeting is held to review the results of the study.
For the 1985 revision, an initial CCO meeting was held on May 12, 1980 and was attended by
representatives from FEMA, the city, the Virginia State Water Control Board, and the USACE.
A search for basic data was made at all levels of government. A final CCO meeting was held on
February 3, 1984.
For the 1996 revision, an initial CCO meeting was held on April 11, 1990 with representatives
from the City of Virginia Beach, the USACE and FEMA. On July 18, 1990, a meeting was held
with representatives from the city, USACE and FEMA to review FEMA standards for GIS
computer mapping and to compare FEMA standards with the computer mapping system presently
used by the City of Virginia Beach. A coordination meeting was held with representatives from
the City of Virginia Beach and the USACE on August 15, 1990. On May 16, 1991 an inter-
agency meeting was held with representatives from the City of Virginia Beach, the USACE, and
FEMA to review objectives of the study, schedules and standards and specifications regarding
digital FIRMs. Various coordination meetings were held with the Department of Public Works,
Surveys and Mapping Bureau, and the City of Virginia Beach regarding the digital mapping
products.
For this revision, an initial CCO meeting was held on January 25, 2006 with representatives from
FEMA and the USACE Norfolk District along with the City of Virginia Beach Department of
Public Works, Department of Communications, and the Virginia Beach Center for GIS.
The results of this study were reviewed at the final CCO meeting held on February 19, 2008, and
attended by representatives of FEMA, the City of Virginia Beach, and Michael Baker Jr. Inc. All
problems raised at that meeting have been addressed in this study.
2.0 AREA STUDIED
2.1 Scope of Study
This FIS covers the incorporated area of the City of Virginia Beach, Independent City,
Virginia.
The following flooding sources were studied by detailed methods: Lake Smith Tributary, Lake
Pembroke, Thalia Creek, Left Bank Tributary Tahlia Creek, Holland Road Tributary Thalia
Creek, Pine Tree Branch, Canal No. 2 London Bridge Creek, Canal No. 2 West Neck Creek,
Holland Road Corridor System, Green Run Canal, Mill Dam Creek, Canal No. 1 North, Fox Run
Canal, Lake Banbury, Cedar Hill Canal, Salem Canal, Canal No. 4, and Colony Acres Canal.
Tidal flooding from the Atlantic Ocean and the Chesapeake Bay and their adjoining estuaries,
including the effects of high-velocity wave action that accompanies severe storms such as
hurricanes and northeasters, was also studies by detailed methods.

3
Limits of detailed study are indicated on the Flood Profiles (Exhibit 1) and on the DFIRM
(Exhibit 2). The areas studied by detailed methods were selected with priority given to all known
flood hazard areas and areas of projected development and proposed construction.
The December 5, 1990 revision incorporated updated topographic information and flood plain
boundaries for areas of approximate study known as Stumpy Lake Watershed and Charlestowne
Lakes South, located immediately west of Stumpy Lake.
For the August 18, 1992 revision, Canal No. 2 London Bridge Creek, was revised from Virginia
Beach Boulevard to a point approximately 0.8 mile upstream of Shipps Corner Road. Canal No.
2, West Neck Creek, was revised from West Neck Road to a point approximately 1.7 miles
upstream of the confluence of Colony Acres Canal. This revision was performed to reflect the
completion of a channelization project for Canal No. 2, London Bridge Creek, and Canal No 2,
West Neck Creek. The project provided a new canal for a length of 2.6 miles and channelization
of the existing canal for a length of 1.1 miles. The Canal No. 2 watershed has a drainage area of
approximately 37 square miles. In addition, Holland Road Corridor System, Green Run Canal,
and Colony Acres Canal were revised to reflect the changes in backwater from Canal No. 2 and to
reflect updated topographic information.
For the 1996 revision, 28 miles of shoreline along the Atlantic Ocean and 10 miles of shoreline
on the Chesapeake Bay were restudied, including all military and Federal installations, state parks
and wildlife refuges. The coastal analyses in this revision were based on the stillwater elevations
used in the previously printed FIS for the City of Virginia Beach (Reference 1). Fox Run Canal
and Left Bank Tributary Thalia Creek were restudied for their entire lengths within the
community. Lake Smith and Lake Smith Tributary have been changed from Zone AE (EL 7) to
approximate Zone A because the normal pool elevation is 7.3 feet and a 1% annual chance flood
elevation has not been established. Flood boundaries for all remaining tidal areas and fluvial
streams studied in detail were redelineated using the latest topographic data. As a result of the
filling of Kings Point System, flood hazards no longer exist for that stream.
All or portions of the following streams were studied by approximate methods: Pleasure House
Lake, Lake Edward, Thalia Creek, Holland Road Tributary Tahlia Creek, Lake Christopher,
Stumpy Lake, Lake Smith, Lake Smith Tributary, Lake Lawson, Green Run Canal, and several
small areas with unknown sources. Approximate analyses were used to study those areas having
a low development potential or minimal flood hazards. The scope and methods of study were
proposed to, and agreed upon, by FEMA and the City of Virginia Beach.
For this revision Letters of Map Revision (LOMR) 00-03-083P and 06-03-B810 were
incorporated, datum conversion to NAVD was applied, and partial foot BFEs placed and
delineated for coastal stillwater areas.
2.2 Community Description
The City of Virginia Beach is located in the southeastern corner of Virginia. It is bordered by the
Atlantic Ocean to the east; the Chesapeake Bay to the north; the cities of Norfolk and Chesapeake
to the west; and the Unincorporated Areas of Currituck County, North Carolina to the south. The
2000 census places the population of Virginia Beach at 425,257.
The city has a total land area of 258.7 square miles. Within the city are thousands of acres of
farmland, five military installation, 28 miles of oceanfront, 10 miles of bay front, and 51.3 square
miles of inland water. Agriculture, Federal installations and tourism are the mainstays of the
city’s economy.

4
Princess Anne County, which was named for the daughter of James II who later became Queen
Anne, was formed in 1691 from lower Norfolk County. Although the first English settlers in the
New World landed at Cape Henry in 1607, they later sailed up the James River to form the
Jamestown Colony. The first settlement in what is now Virginia Beach was established in 1621,
on Lynnhaven Bay. In 1822, the county seat of Princess Anne County was moved from
Kempsville to Princess Anne, which is the present site of the Municipal Center Complex of
Virginia Beach (Reference 2).
Virginia Beach was incorporated as a town in 1906 and became an independent city in 1952. In
1963, the city was greatly enlarged by a merger with Princess Anne County.
An arm of the Eastern Branch Elizabeth River enters the city from the west. In the southern part
of the city are the broad expanses of Back Bay and Broad Bay. Important inland waterways
include Rudee Inlet and Lake Holly, which are tidal inlets of the
Atlantic Ocean, and Lynnhaven Bay, Broad Bay, Linkhorn Bay, and Like Creek, which are tidal
estuaries of the Chesapeake Bay. Lake Smith and Stumpy Lake are sizable landlocked bodies of
water within the city.
The floodplains of Virginia Beach abound with commercial, industrial and residential
developments and public utilities. Most of the development in Virginia Beach has taken place in
the northern half of the city. The southern half remains essentially rural, with farming the
principal occupation. There is some manufacturing within the city, but most of the residents find
employment in manufacturing industries in surrounding cities or in Federal installations. In
addition, many people are engaged in the tourist industry.
Virginia Beach is situated in the Coastal Plain province and is underlain primarily by
unconsolidated sand and clay strata. The terrain is essentially flat, with ground elevations
averaging approximately 12 feet. Small areas, mostly in the form of sand dunes, rise about 15
feet. Shallow waters of less than 20 feet fringe the coastal shoreline, and depths in the inland
bays and connecting waters are generally less than 10 feet.
The city enjoys a temperate climate with moderate seasonal changes. The climate is
characterized by moderately warm summers with temperatures averaging 78 degrees Fahrenheit
(ºF) in July, the warmest month. The winters are cool with temperatures averaging 41ºF in
January, the coolest month. The average annual precipitation is approximately 45 inches. There
is some variation in the monthly averages; however, rainfall is distributed evenly throughout the
year. Snowfall is infrequent, generally occurring in light amounts which normally melt within 24
hours (Reference 2).
A drainage divide represents the upstream limit of two distinct hydrologic subareas within the
area of interest. For Canal No. 2, London Bridge Creek, and Canal No. 2, West Neck Creek, the
drainage divide is located at the cross section labeled Q and L on the respective streams. The
riverine discharges during a 100-year riverine flood event will flow away from this point in
opposite directions through each of the above referenced bodies of water.
2.3 Principal Flood Problems
The coastal areas of Virginia Beach are vulnerable to tidal flooding from major storms commonly
referred to as hurricanes and northeasters. Both types of storms produce winds that push large
volumes of water against the shore.
Hurricanes, with their high winds and heavy rainfalls, are the most severe storms that hit the area.
The term “hurricane” is applied to an intense cyclonic storm originating in tropical or subtropical

5
latitudes in the Atlantic Ocean just north of the equator. A study of the tracks of all tropical
storms for which there is a record indicates that, on an average of once a year, a tropical storm of
hurricane force passes within 250 miles of the area and poses a threat to Virginia Beach. While
hurricanes can affect the area from May through November, nearly 80 percent occur in the
months of August, September and October, with approximately 40 percent occurring in
September. The most severe hurricanes to strike the area occurred in August 1933. Other notable
hurricanes that caused significant flooding in Virginia Beach were those of September 1933,
September 1936 and September 1960 (Reference 3).
Another type of storm that can cause severe damage to the city is the northeaster. This is also a
cyclonic-type storm and originates with little or no warning along the middle and northern
Atlantic Coast. Northeasters occur most frequently in the winter, but can occur at any time.
Accompanying winds are not of hurricane force, but are persistent, causing above-normal tides
for long periods of time. March 1962 northeaster was the worst to hit the study area. Other
northeasters that caused significant flooding in Virginia Beach included those of March 1927,
October 1948 and April 1956 (Reference 3).
The depth of flooding during hurricanes and northeasters depends upon the velocity, direction and
duration of the wind, the size and depth of the body of water over which the wind is acting, and
the astronomical tide. For instance, strong and persistent northerly and easterly winds will cause
flooding of the shorelines of the Chesapeake Bay, the Atlantic Ocean and their connecting inland
waterways. Flooding in the Back Bay and North Landing River areas is caused by strong winds
from a southerly direction. As would be expected, because of the larger size of the water bodies
involved, flooding along the shorelines of the Chesapeake Bay, the Atlantic Ocean, and the
Elizabeth River occurs in greater depth than flooding in the southern portion of the city.
Simultaneous flooding of both the outer coastal areas and southern bay areas of the city is not
possible, except in rare events where the surge-producing forces cause either the destruction or
overtopping of the barrier dunes that separate the Atlantic Ocean from the inland waters in the
southern portion of the city. The duration of the flooding depends upon the duration of the tide-
producing forces. Floods caused by a hurricane are usually of much shorter duration than the
ones caused by a northeaster. Flooding from hurricanes rarely lasts more than one tidal cycle,
whereas flooding caused by northeasters can last several days, during which the most severe
flooding takes place at the time of the peak astronomical tide.
The timing or coincidence of the maximum storm surge with the normal high tide is an important
factor in the consideration of flooding from tidal sources. Tidal waters in the study area normally
fluctuate twice daily from an elevation of 1.7 feet to -1.7 feet in the Atlantic Ocean and from 1.4
to -1.4 feet in the Chesapeake Bay and the Elizabeth River. The range of fluctuations is
somewhat less in most of the connecting interior waterways. There are no measurable
astronomical tides in Back Bay or the North Landing River.
The study area also contains numerous estuaries of the Atlantic Ocean and the Chesapeake Bay
that are subject to tidal flooding in their lower reaches. Flooding in the upper reaches of these
streams can be caused by heavy rains occurring anytime throughout the year. Flooding can also
occur as a result of an intense rainfall produced by local summer thunderstorms, or tropical
disturbances, such as hurricanes, that move into the area from the Gulf of Mexico or Atlantic
Coast. Flood heights on these streams can rise from normal to extreme flood peaks in a
relatively short period of time. The duration of flooding depends on the duration of runoff-
producing rainfall. In some cases, floods may last for a couple of days, whereas floods occurring
as a result of short duration summer thunderstorms usually rise to a maximum peak stage and
subside to near normal levels in less than a day.

6
All development in the floodplains is subject to water damage, Additionally, some areas,
depending on exposure, are subject to high velocity wave action, which can cause structural
damage and severe erosion along beaches. Waves are generated by the action of wind on the
surface of water, The entire Virginia Beach shoreline is vulnerable to wave damage because of
its vast exposure afforded by the Chesapeake Bay and the Atlantic Ocean.
Virginia Beach has experienced major storms since the early settlement of the area. Historical
accounts of severe storms in the area date back several hundred years. The following paragraphs
discuss some of the larger known floods that have occurred. This information is based on
newspaper accounts, historic records, field investigations and routing data collection programs
normally carried out by the Norfolk District of USACE.
The earliest storm of record causing extensive damage in the Virginia Beach area occurred on
March 2-3, 1927. Practically all damage inflicted on the city resulted from the high tide of
Wednesday night, March 2. This storm undermined or flanked most of the protective structures
in existence and severely damaged or destroyed the majority of them. The beaches were almost
completely denuded of the overlying sand. All along the beach, the sea washed the sand away,
leaving the clay undersoil exposed. The greatest damage was in the vicinity of the main resort
area where a large hotel and many other structures were severely damaged.
The eye of the August 1933 hurricane passed directly over Virginia Beach, and the storm surge
caused the most extensive flooding in the city in the past 200 years or more. In most parts of the
city, the maximum storm surge was the greatest of record and occurred about 3 hours before, but
persisted throughout the peak of the astronomical tide. Maximum tidal elevations, either
estimated or observed, were 8.6 feet for the Atlantic Coast and Lynnhaven Bay, 8.0 feet for the
Eastern Branch Elizabeth River, approximately 5.3 feet for Broad and Linkhorn Bays, and
approximately 3.8 feet in the Back Bay and North Landing River areas. Extensive damage to
waterfront property and low-lying buildings occurred during this storm. High waves caused
much of the structural damage in exposed areas along the open coast. In addition to damage from
tidal flooding, much damage was caused to roofs, communication lines and other structures by
the high winds.
A northeaster struck the Virginia coastline on October 4, 1948 and continued for several days. It
reached maximum intensity on October 5 with tide elevations reaching 5.1 feet in nearby Norfolk.
Wind velocities at Cape Henry varied from 30 to 45 miles per hour, with gusts up to 60 miles per
hour from the northeast. The boardwalk was severely buffeted for its entire length, and the
greatest damage was sustained between 17th Street and 7
th Street. This storm also moved a
considerable amount of sand from the beach, creating conditions similar to those caused by the
March 1927 storm.
Another flood occurred on April 11, 1956 as a result of another northeaster. The storm produced
a steady northeast wind in the Virginia Beach area for approximately 30 hours. The tides were
approximately 4 feet above normal for 12 hours and produced the maximum tidal crest on the
morning of the 11th. Damage to structures were light; however, a considerable amount of sand
eroded from the beaches.

7
A tidal stage of major proportions occurred during the northeaster of March 6-8, 1962.
Disastrous flooding and high waves occurred along the Atlantic Seaboard from New York to
Florida. This flood was unusual even for a northeaster, since it was caused by a low pressure cell
that moved from south to north past Virginia Beach, and then reversed its course, moving again to
the south. Huge volumes of water and high waves battered the mid-Atlantic coastline for several
days.
The maximum flood height at Virginia Beach associated with this northeaster occurred on the
morning of March 7 and reached approximately 5.7 feet on the Atlantic coast. Extensive flooding
and much damage resulted along the Atlantic Ocean, the Chesapeake Bay and their connecting
waterways. The hardest hit sections of the city were Sandbridge Beach, the area from Rudee Inlet
to 49th Street, North Virginia Beach above 57
th Street, and Ocean Park on the Chesapeake Bay.
Tidal heights reached during this storm were the second highest of record in the area, but were
almost 2 feet lower than those reached in the August 1933 hurricane. The damage; however, was
the greatest of any storm in the area due to the increased development along the shoreline since
1933. Another contributing factor was that tides during this storm remained above normal for 4
days. High waves added to the structural damage caused by the high water. Severe eroding of
the beaches and shorefront also occurred. The seawall fronting the main resort area in the city
was seriously damaged. Estimates of damage in Virginia Beach were more than 8 million
dollars. The aforementioned water levels are indicative of stages experienced in the eastern and
northern sections of the city. Stages in Back Bay and the North Landing River tend to be lowered
by northeast winds, and thus, were inconsequential during the 1962 storm.
2.4 Flood Protection Measures
There are a number of measures that have afforded some protection against minor flooding.
These include a concrete bulkhead and promenade, stone, steel and wooden bulkheads, sand
dunes, and non-structural measures for floodplain management, such as zoning and building
codes.
The VA Beach Erosion Control and Hurricane Protection Project created a structure that affords
140-year level of protection from coastal storms between Rudee Inlet and 89th Street. The sea
wall structure was certified by the USACE as noted in documentation dated 10/18/2006.
A concrete bulkhead and promenade was constructed by local interested in 1927. It extends from
7th Street to 35
th Street and consists essentially of a vertical-faced wall and a concrete deck that is
approximately 20 feet wide at an elevation of 11.4 feet. At various times during the period from
1938 to 1952, the structure suffered severe storm damage. In 1953 and 1954, the wall was
restored by the Virginia Beach Erosion Commission. During the March 1962 storm, the wall was
again severely damaged and emergency repairs were made by the USACE.
Wood and steel bulkheads, which were also constructed by local interests, extend from 35th Street
to 49th Street. Light wooden bulkheads have been built along portions of the Chesapeake Bay,
but have proven ineffective as flood protection measures.
Within the 28 miles of ocean shoreline, there are approximately 20 miles of sand dunes that vary
in height from 12 feet to 25 feet. These dunes afford considerable protection to adjoining
property.

8
The city has passed ordinances as required by FEMA to qualify for the Regular Program of the
NFIP. These measures are found in Article 12 of the city’s Comprehensive Zoning Ordinance –
Flood Plain Regulations. These requirements, along with others such as, Article 16, the Coastal
Primary Sand Dune Zoning Ordinance, have been beneficial in reducing the risk of future flood
damage in the community.
3.0 ENGINEERING METHODS
For the flooding sources studied in detail in the community, standard hydrologic and hydraulic study methods
were used to determine the flood hazard data required for this study. Flood evens of a magnitude which are
expected to be equaled or exceeded once on the average during any 10-, 50-, 100-, or 500-year period
(recurrence interval) have been selected as having special significance for floodplain management and for
flood insurance rates. These events, commonly termed the 10-, 50-. 100- and 500-year floods, have a 10, 2, 1
and 0.2 percent chance, respectively of being equaled or exceeded during any year. Although the recurrence
interval represents the long term average period between floods of an specific magnitude, rare floods could
occur at short intervals, or even within the same year. The risk of experiencing a rare flood increase when
periods greater than 1 year are considered. For example, the risk of having a flood which equals or exceeds
the 100-year flood (1 percent chance of annual exceedance) in any 50-year period is approximately 40% (4 in
10), and for any 90-year period is approximately 60 percent (6 in 10). The analyses reported herein show
flooding potentials based on conditions existing in the community at the time of completion of this study.
Maps and flood elevations will be amended periodically to reflect future changes.
3.1 Hydrologic Analyses
Hydrologic analyses were carried out to establish the peak discharge-frequency and peak
elevation-frequency relationships for each flooding source studied in detail affecting the
community.
For the streams studied by detailed methods, it was necessary to develop flood frequencies by
synthetic means because there are no records of streamflow and no available high-water data to
permit development of flood-stage frequency relationships. The lack of adequate streamflow
records required an analysis of rainfall and runoff characteristics of the watersheds in determining
frequency estimates. These analyses involved the application of rainfall-runoff amounts to a
synthetic graph (unit hydrograph). Based on hydraulic parameters (slope, length, drainage areas,
channel “n” values and time of concentration) determined for the streams, unit graphs were
developed for several locations on each stream using the Clark method. Rainfall-frequency
values selected from Technical Paper No. 40 were then applied to the unit graphs to obtain the
desired discharge frequencies (Reference 4). In the August 18, 1992 revision, the hydraulic
parameters used were based on a fully developed and completely sewered Canal No. 2 watershed.
A summary of the drainage area-peak discharge relationships for the streams studied by detailed
methods is shown in Table 1, “Summary of Discharges”.

9
TABLE 1 – SUMMARY OF DISCHARGES
PEAK DISCHARGES (cfs)
FLOOD SOURCE
AND LOCATION
DRAINAGE AREA
(sq. miles)
10 Percent-
Annual-
Chance
2 Percent-
Annual-
Chance
1 Percent-
Annual-
Chance
0.2 Percent-
Annual-
Chance
CANAL NO. 1 NORTH
At Virginia Beach Boulevard 3.5 230 300 330 390
At a point approximately 850 feet
upstream of Norfolk Southern
Railroad
0.9
360
520
610
820
CANAL NO. 2
LONDON BRIDGE CREEK
At Virginia Beach Boulevard 13.7 2,140 3,120 3,960 5,970
CANAL NO 2.
WEST NECK CREEK
At Indian River Road 19.0 2,470 3,670 4,380 6,730
CANAL NO. 4
At its confluence with Salem Canal 5.9 1,420 2,080 2,420 3,260
CEDAR HILL CANAL
At its confluence with The Eastern
Branch Elizabeth River
3.2
170
270
330
470
COLONY ACRES CANAL
At its confluence with Canal No.2
West Neck Creek
5.7
950
1,400
1,630
2,200
FOX RUN CANAL
At Lord Dunsmore Drive 1.5 620 890 1,030 1,390
At Brandywine Drive 0.5 320 460 530 720
GREEN RUN CANAL
At its confluence with Canal No. 2
West Neck Creek
1.5
340
480
570
760
HOLLAND ROAD CORRIDOR
SYSTEM
At its confluence with Green Run
Canal
1.4
230
340
390
530
HOLLAND ROAD TRIBUTARY
THALIA CREEK
At its confluence with Left Bank
Tributary Thalia Creek
1.3
640
910
1,050
1,420
LAKE BANBURY
At its confluence with Eastern Branch
Elizabeth River
1.2
750
1,060
1,210
1,640
At Indian River Road 0.5 470 660 750 1,010
LEFT BANK TRIBUTARY
THALIA CREEK
At its confluence with Thalia Creek 2.5 990 1,430 1,650 2,230

10
TABLE 1 – SUMMARY OF DISCHARGES - continued
PEAK DISCHARGES (cfs)
FLOOD SOURCE
AND LOCATION
DRAINAGE AREA
(sq. miles)
10 Percent-
Annual-
Chance
2 Percent-
Annual-
Chance
1 Percent-
Annual-
Chance
0.2 Percent-
Annual-
Chance
LAKE PEMBROKE
Upstream side of Independence
Boulevard
1.6
1,050
1,440
1,640
2,160
Downstream side of Independence
Boulevard
1.6
550
780
900
1,190
LAKE SMITH TRIBUTARY
At its confluence with Lake Smith 1.8 340 520 610 820
MILL DAM CREEK
At a point approximately 2,500 feet
Downstream of Mill Dam Road
1.1
510
740
850
1,150
PINE TREE BRANCH
At its confluence with the Eastern
Branch Lynnhaven River
0.9
170
200
230
320
SALEM CANAL
At the confluence of Canal No. 4 5.0 1,270 1,850 2,140 2,890
At Recreation Drive 1.4 370 530 620 840
THALIA CREEK
At the Norfolk Southern Railroad
Crossing
5.7
900
1,220
1,290
1,490
Tide records at Virginia Beach are inadequate to establish a tide-frequency relationship. Records
of tide elevations are available for intermittent or short periods at a number of locations in and
near the city. The adopted tide frequency was obtained by a correlation of the tide frequency
curve that was developed for Norfolk Harbor, located approximately 10 miles inside the
Chesapeake Bay, with available tide records and high-water marks at Virginia Beach. The
frequency curve for Norfolk Harbor was developed using a Pearson Type III analysis without
logs for the selected point of record from 1928 through 1978. The data were stage-related to
Virginia Beach using high-water marks.
The Stillwater elevation is the elevation of the water due solely to the effects of the astronomical
tide, storm surge, and wave setup on the water surface. The inclusion of wave heights, which is
the distance from the trough to the crest of the wave, increases the water-surface elevations. The
height of a wave is dependent upon wind speed and its duration, depth of water and length of
fetch. The wave crest elevation is the sum of the stillwater elevation and the portion of the wave
height above the stillwater elevation.

11
Wave heights and corresponding wave crest elevations were determined using the National
Academy of Sciences (NAS) methodology (Reference 5). The stillwater elevations have been
determined and are summarized in Table 2, “Summary of Stillwater Elevations”.
TABLE 2 – SUMMARY OF STILLWATER ELEVATIONS
ELEVATION (feet NAVD*)
FLOOD SOURCE
AND LOCATION
10 Percent-
Annual-
Chance
2 Percent-
Annual-
Chance
1 Percent-
Annual-
Chance
0.2 Percent-
Annual-
Chance
ATLANTIC OCEAN
Entire shoreline with community 5.5 7.1 7.7 9.1
BACK BAY
Entire shoreline 2.3 3.5 4.0 5.5
BRADFORD LAKE
Entire shoreline 4.5 6.0 7.0 8.0
BROAD BAY
Entire shoreline 4.3 5.4 5.9 7.1
CHESAPEAKE BAY
Entire shoreline within commmunity 5.5 7.1 7.7 9.1
CHUBB LAKE
Entire shoreline 4.5 6.0 7.0 8.0
EASTERN BRANCH ELIZABETH
RIVER
Entire shoreline within community 5.4 6.8 7.5 8.8
LAKE CHRISTINE
Entire shoreline 4.5 6.0 7.0 8.0
LAKE HOLLY
North of Norfolk Avenue 3.5 5.0 6.0 7.0
South of Norfolk Avenue 4.5 6.0 7.0 9.1
LAKE TAYLOR
Entire shoreline 5.4 6.8 7.5 8.8
LINKHORN BAY
Entire shoreline 4.3 5.4 5.9 7.1
LYNNHAVEN BAY
Entire shoreline 4.9 6.2 6.8 8.2
LYNNHAVEN RIVER
Entire shoreline 4.9 6.2 6.8 8.2
RUDEE INLET
Entire shoreline 5.5 7.1 7.7 9.1
*North American Vertical Datum 1988

12
For this revision no new Hydrologic or tidal analysis were completed for the completion of the
Virginia Beach, Virginia, Beach Erosion Control and Hurricane Protection Project . The
Stillwater elevations were taken from the 1996 FIS and adjusted for a datum conversion between
NGVD and NAVD. The adjustment used for the Virginia Beach, Virginia, Beach Erosion
Control and Hurricane Protection Project was -0.8, which calculated for the locality of the
project. Please note that this conversion factor differs form the county wide conversion factor
discussed in section 3.3 of this report (Reference 30).
Areas of the City of Virginia Beach were delineated based on the 1 and 0.2 percent annual chance
flood elevations shown in Table 2. Those areas are labeled with BFE notations which are to the
nearest tenth of a foot, and are referred to as “Partial foot BFE’s”. The elevation listed on the
DFIRM and in Table 2 should match and are to be used for all flood hazard determinations.
3.2 Hydraulic Analyses
Analyses of the hydraulic characteristics of flooding from the sources studied were carried out to
provide estimates of the elevations of floods of the selected recurrence intervals.
Cross sections and bridge data used in the backwater computations for the riverine flooding
sources were obtained from field surveys, “as-built” subdivision plans, Virginia Department of
Highways drawings and topographic maps (References 6-7).
Due to the drainage divide located at cross section L on Canal No. 2 West Neck Creek and, at the
same location, cross section Q on Canal No. 2 London Bridge Creek, the computed water-surface
elevations are not in agreement. This cross section represents the meeting point of the analyses
for Canal No. 2 London Bridge and Canal No. 2 West Neck Creeks.
Locations of selected cross sections used in the hydraulic analyses are on the Flood Profiles
(Exhibit 1) and are also shown on the DFIRM (Exhibit 2). For stream segments for which a
floodway was computed (Section 4.2), selected cross-section locations and modeling information
is shown on the Floodway Data Tables (Table 7).
Water-surface elevations of floods of the selected recurrence intervals were computed using the
USACE HEC-2 step-backwater computer program (Reference 8). Starting water-surface
elevations were calculated using the slope/area method. Flood profiles were drawn showing
computed water-surface elevations for floods of the selected recurrence intervals.
Roughness factors (Manning’s “n”) used in the hydraulic computations were determined on the
basis of field inspection of the streams and floodplains areas and engineering judgment. The
channel “n” values for all the riverine flooding sources, except Canal No. 2 London Bridge Creek
and Canal No. 2 West Neck Creek, ranged from 0.025 to 0.045, and the overbank “n” values
ranged from 0.045 to 0.100. For Canal No. 2 London Bridge Creek and Canal No. 2 West Neck
Creek, the channel “n” value was 0.040, and the overbank “n” value was 0.100.
For the 1996 revision, Fox Run Canal and Left Bank Tributary Thalia Creek were restudied to
eliminate discrepancies in the base map topography. The cross sections and bridges were field
surveyed to obtain elevation data and structural geometry. Channel roughness factors were
assigned based on field inspection and engineering judgment. In addition, the 1 and 0.2 percent
annual chance SFHA boundaries for all riverine flooding sources were revised based on updated
topographic maps (Reference 6).

13
The hydraulic analyses for this study were based on unobstructed flow. The flood elevations
shown on the profiles are thus considered valid only if hydraulic structures remain unobstructed,
operate properly, and do not fail.
Hydraulic analyses considering storm characteristics and the shoreline and bathymetric
characteristics of tidal flooding of the flooding sources studied, were completed to provide
estimates of the elevations of floods of the selected recurrence intervals along the shorelines.
The vulnerability of Virginia Beach to wave attack was given special consideration. During
severe storms, such as the March 1962 northeaster or the August 1933 hurricane, wave attack
produced breaching and failure of bulkheads and dunes. The intruding waters caused structural
damage to buildings behind the bulkheads and dunes. Much of the damage was due to the
collapse of structures on undermined footings.
Areas of coastline subject to significant wave attack are referred to as coastal high hazard zones.
The USACE has established the 3-foot breaking wave as the criterion for identifying the limit of
coastal high hazard zones (Reference 9). The 3-foot wave has been determined to be the
minimum size wave capable of causing major damage to conventional wood frame or brick
veneer structures. This criterion has been adopted by FEMA for the determination of V Zones.
By definition, all primary frontal dunes are also V Zones.
The methodology for analyzing wave heights and corresponding wave crest elevations was
developed by the NAS (Reference 5). This methodology is based on three major concepts.
First, a storm surge on the open coast is accompanied by waves. The maximum heights of these
waves is related to the depth of water by the following equation:
Hb = 0.78d
where Hb is the crest to trough height of the maximum or breaking wave, and d is the stillwater
depth. The elevation of the crest of an unimpeded wave is determined using the equation:
Zw = S* + 0.7H* = S* + 0.55d
where Zw is the wave crest elevation, S* is the stillwater elevation at the site, H* is the wave
height at the site, and d is the stillwater depth. The 0.7 coefficient is the portion of the wave
height that reaches above the stillwater elevation. Hb is the upper limit for H*.
The second major concept is that the breaking wave height may be diminished by dissipation of
energy by natural or man-made obstructions. The wave height transmitted past a given
obstruction is determined by the following equation:
Ht = BHi
where Ht is a transmitted wave height, Hi is the incident wave height, and B is a transmission
coefficient ranging from 0.0 to 1.0. The coefficient is a function of the physical characteristics of
the obstruction. Equations have been developed by the NAS to determine B for vegetation,
buildings, natural barriers such as dunes, and man-made barriers such as breakwaters and
seawalls (Reference 5).
The third concept deals with unimpeded reaches between obstructions. New wave generation can
result from wind action. This added energy is related to distance and mean depth over the
unimpeded reach.

14
These concepts and equations were used to compute wave heights and wave crest elevations
associated with the 100-year storm surge. Accurate topographic, land-use and land cover data are
required for the wave height analysis. Maps of the study area at a scale of 1:2,400 with a contour
interval of 2 feet were used for the topographic data (Reference 6). The land-use and land cover
data were obtained through field surveys.
Coastal flood zones and associated elevations were determined following FEMA methodologies,
including erosion, wave runup and wave height analyses (References 10-14).
Wave heights were computed along transects that were located perpendicular to the average mean
shoreline. Sixty-eight transects were located along the Atlantic Coast and Chesapeake Bay
shorelines of Virginia Beach on topographic maps (Reference 6). The transects were taken
perpendicular to the mean shoreline and located with consideration to the physical and cultural
characteristics of the land, such as changes in slope, land uses, areas of unique flooding and
where computed wave heights and runup varied significantly between adjacent transects.
Transect data seaward of the shoreline were taken from bathymetric mapping at scales of
1:40,000 and 1:80,000 and field surveyed profiles, where available (References 15-16). Figure 1
illustrates the location of the transects for the city.
The FEMA erosion model, which is a simplified version of the dune retreat model developed by
the Delft Hydraulics Laboratory of the Netherlands, was used to determine the eroded profile for
each transect. Although several areas of Sandbridge and the resort strip of Virginia Beach are
bulkheaded, these areas were treated as dunes based on the actual failure rates of these bulkheads
during coastal storms significantly smaller than the 100-year coastal storm. The results of the
FEMA erosion model were validated by historical data, where available.
The FEMA wave runup model was used to analyze wave runup. The WHAFIS model was used
to compute the 100-year storm wave heights. Both of these models used the eroded profiles
determined by the FEMA erosion model. These data were used to determine flood zones and
base (1 percent annual chance) flood elevations.
Figure 3 represents a sample transect and illustrates the relationship between the stillwater
elevation, the wave crest elevation, the ground elevation profile and the location of the A/V zone
boundary.
Table 3, “Transect Descriptions”, provides a listing of the transect locations, stillwater elevations,
and maximum wave crest (or wave runup) elevations along the shoreline.

Transects 29-44superceded bythose shownin Figure 2.

Crystal
Lake
Little Neck
Creek
Rudee Inlet
!!
!
Cape Henry
32A
30A
28A
26A
24A
22A
20A
18A
16A
14A
12A
10A
8A
6A
4A
2A
/60
/60
Atlant ic
Ocean
Fort Story
89th St.
84th St.
79th St.
73rd St.
68th St.
63rd St.
56th St.
50th St.
44th St.
39th St.
33rd St.
28th St.
23rd St.
18th St.
6th St.
12th St.
p
Vir
gin
ia B
ea
ch
, V
A B
ea
ch
Ero
sio
n C
on
tro
l a
nd
Hu
rric
an
e P
rote
ctio
n P
roje
ct:
Tra
nse
ct
Lo
ca
tio
n M
ap
FE
DE
RA
L E
ME
RG
EN
CY
MA
NA
GE
ME
NT
AG
EN
CY
CIT
Y O
F V
IRG
INIA
BE
AC
H,
VA
IND
EP
ED
EN
T C
ITY
FIGURE 2
Mile
s0
12
0.5
!
!
!

Figu
re 3

18
TABLE 3 – TRANSECT DESCRIPTIONS
Elevation (Feet NAVD¹) Maximum
Stillwater Wave Crest
Transect Location 1 percent 1 percent²
Nos. 1-12 From Little Creek to Lynnhaven
Inlet
7.7
12.0
Nos. 13-23 From Lynnhaven Inlet to Fort
Story/Cape Henry
7.7
13.0
Nos. 24-28 From Fort Story/Cape Henry to
Fort Story/Cape Henry
7.7
13.0
Nos. 32A-2A From Fort Story/Cape Henry to
Rudee Inlet
8.5 3
11.0-13.0 4
Nos. 45-54 From Rudee Inlet to the northern
limit of Sandbridge Beach
7.7
13.0
Nos. 55-63 From the northern limit of
Sandbridge Beach to the northern
limit of False Cape State Park
7.7
13.0
Nos. 64-68 From the northern limit of False
Cape State Park to the Virginia-
North Carolina border
7.7
13.0
¹ North American Vertical Datum
² Due to map scale limitations, the maximum wave elevations may not be shown on the DFIRM 3 Includes 0.6 feet of wave setup
4 See Table 5 – New Transect Data for Maximum Wave Crest for each transect
Wave envelope elevations were computed along each transect using wave height and wave crest
elevations. Each transect was extended inland to a point where wave action ceased. The
combined effects of changes in ground elevation, vegetation and physical features were
considered. Between transects, elevations were interpolated using topographic maps, land-use
and land-cover data, and engineering judgment to determine the extent of flooding. The results of
the calculations are accurate until local topography, vegetation, or cultural development within
the community undergo any major changes. The results of this analysis are summarized in Table
4, “Transect Data”.

19
TABLE 4– TRANSECT DATA
Base Flood
Stillwater Elevation Elevation
Flood Source 10 Percent 1 Percent Zone (Feet NAVD¹)
CHESAPEAKE BAY
Transects 1-12 5.5 7.7 VE 10-12
AE 7.7-10
Transects 13-23 5.5 7.7 VE 10-13
AE 6.8-10
ATLANTIC OCEAN
Transects 24-28 5.5 7.7 VE 10-13
Transects 32A-2A 5.7 8.5 2
VE 9-13
Transects 45-68 5.5 7.7 VE 10-13
AE 8-10
1 All elevations are referenced to the North American Vertical Datum of 1988.
2 Includes 0.6 feet of wave setup
For this Revision, new Hydraulic analysis were completed for the Virginia Beach, Virginia,
Beach Erosion Control and Hurricane Protection Project.
The Coastal Hazard Analysis Modeling Program (CHAMP) Version 1.2 was used to perform the
necessary coastal hazard analyses consistent with the FEMA guidelines. Approximately 16
transects were used to evaluate erosion, wave height, and runup between Rudee Inlet and 89th
Street. Please note that these new transects supercede transects 29-44 shown in Figure 1. Refer
to Figure 2 for their location and Table 5 for their associated data. The transects that were used in
the coastal hazard analysis were based on the minimum envelope elevations that were observed
based on five separate surveys between June 2003 and May 2005. These surveys reflect actual
conditions after the initial beach fill (June 2001-March 2002) underwent rapid equilibrium
adjustment and include surveys taken immediately after the effects of Hurricane Isabel in
September 2003. (Reference 30)
The wave heights and wave periods used in the Beach Erosion Control and Hurricane Protection
Project study are from the 1996 FIS for Virginia Beach, and are based on the March 1962
Northeaster. Wave runup for each transect was developed utilizing the computer program
CHAMP Version 1.2 and in accordance with Appendix D: Guidance for Coastal Flooding and
Analyses and Mapping.
A wave setup value of 0.6 feet was incorporated into the CHAMP Version 1.2 computer program.
This value is based on analyses and physical model tests by the U.S. Army Corps of Engineers’
Waterways Experiment Station - WES (now the Engineering Research and Design Center –
ERDC) (Reference 30).

Revised
Transect
Number
Superceded
Transect
Number Transect Location
Station on WS&E
Construction
Baseline
Nearest Offshore
Monitoring
Profile
Transect "0"
Offset from
Survey Baseline
WHAFIS Shoreline
"0" Offset from
Survey Baseline
Stillwater* 1
Percent
(NAVD)
Maximum
Wave Crest
(NAVD)
2A 44 230 feet north of 6th Street 19+30 20+00 3,197 255 8.5 13
4A 43 50 feet north of 12th Street 39+30 40+00 3,197 313 8.5 13
6A 42 100 feet south of 18th Street 59+30 60+00 3,105 345 8.5 13
8A 41 100 feet north of 23rd Street 79+50 80+00 3,184 369 8.5 13
10A 40 150 feet north of 28th Street 99+50 100+00 3,093 365 8.5 13
12A 39 10 feet south of 32nd Street 119+50 120+00 3,135 342 8.5 12
14A 38 180 feet south of 40th Street 139+50 140+00 3,179 345 8.5 13
16A 37 20 feet south of 45th Street 159+30 160+00 3,131 322 8.5 13
18A 36 150 feet north of 50th Street 179+30 180+00 3,166 282 8.5 13
20A 35 30 feet south of 57th Street 199+20 200+00 3,156 213 8.5 11
22A 34 100 feet north of 63rd Street 219+20 220+00 3,191 194 8.5 11
24A 33 210 feet north of 68th Street 239+20 240+00 3,201 192 8.5 11
26A 32 70 feet south of 74th Street 259+20 260+00 3,169 287 8.5 12
28A 31 80 feet south of 80th Street 279+20 280+00 3,184 417 8.5 13
30A 30 Centerline of 85th Street 299+20 300+00 3,168 508 8.5 13
32A 29 350 feet north of Ft. Story Fence 319+20 310+00 -- 503 8.5 13
TABLE 5 - NEW TRANSECT DATA
Based on the Virginia Beach, VA Beach Erosion Control and Hurricane Protection Project
*Includes 0.6 feet of wave setup
20

21
3.3 Vertical Datum
All FISs and FIRMs are referenced to a specific vertical datum. The vertical datum provides a
starting point against which flood, ground, and structure elevations can be referenced and
compared. Until recently, the standard vertical datum in use for a newly created or revised FIS
and FIRM was the National Geodetic Vertical Datum of 1929 (NGVD 29). With the finalization
of the North American Vertical Datum of 1988 (NAVD 88), many FIS reports and DFIRMs are
being prepared using NAVD 88 as the referenced vertical datum.
For this countywide FIS, all flood elevations shown in the FIS report and on the DFIRM are
referenced to NAVD 88. Structure and ground elevations in the community must, therefore, be
referenced to NAVD 88. It is important to note that adjacent communities may be referenced to
NGVD 29. This may result in differences in base flood elevations across corporate limits
between the communities.
As noted above, the elevations shown in the FIS report and on the DFIRM for Virginia Beach
County are referenced to NAVD 88. Ground, structure, and flood elevations may be compared
and/or referenced to NGVD 29 by applying a standard conversion factor. The conversion factor
from NGVD 29 to NAVD 88 for the City of Virginia Beach is -0.96 foot. The locations used to
establish the conversion factor were USGS 7.5-minute topographic quadrangle corners that fell
within the City, as well as those that were within 2.5 miles outside the County. The bench marks
are referenced to NAVD 88.
Conversion locations and values for Virginia Beach are shown below in Table 6, “Vertical Datum
Conversion Values.”
TABLE 6 – VERTICAL DATUM CONVERSION VALUES
Users that wish to convert the elevations in this FIS to NGVD 29 should apply the conversion
factor (+0.96 foot) to elevations shown on the Flood Profiles and supporting data tables in this
FIS report, which are shown at a minimum to the nearest 0.1 foot.
For more information on NAVD 88, see Converting the National Flood Insurance Program to
the North American Vertical Datum of 1988 (Reference 30) or contact the Spatial Reference
System Division, National Geodetic Survey, National Oceanic and Atmospheric Administration,
Silver Spring Metro Center 3, 1315 East-West Highway, Silver Springs, Maryland 20910, (301)
713-3191, or visit their web site at www.ngs.noaa.gov.
Quad Name Quad
Corner
Longitude Latitude Conversion from
NGVD 29 to
NAVD 88 (ft)
Vertical Variance
from the Average
Conversion
Factor
Fentress SE -76.125 36.625 -0.978 0.015
Pleasant Ridge SE -76.000 36.625 -0.997 0.034
North Bay SE -75.875 36.625 -0.942 -0.021
Kempsville SE -76.125 36.750 -1.066 0.103
Princess Anne SE -76.000 36.750 -1.099 0.136
Little Creek SE -76.125 36.875 -0.84 -0.123
Cape Henry SE -76.000 36.875 -0.817 -0.146
Average Conversion from NGVD 29 to NAVD 88 = -0.96 foot

22
4.0 FLOODPLAIN MANAGEMENT APPLICATIONS
The NFIP encourages state and local governments to adopt sound floodplain management programs.
Therefore, each FIS generally provides 100-year flood elevations and delineations of the 100- and 500-
year floodplains and 100-year floodway to assist in developing floodplain management measures.
4.1 Floodplain Boundaries
To provide a national standard without regional discrimination, the 1 percent annual chance (100-
year) flood has been adopted by FEMA as the base flood for floodplain management purposes.
The 0.2 percent annual chance (500-year) flood is employed to indicate additional areas of flood
risk in the community.
The 1 and 0.2 percent annual chance floodplain boundaries are shown on the DFIRM (Exhibit 2).
On this map, the 1 percent annual chance floodplain boundary corresponds to the boundary of the
areas of special flood hazards (Zones A, AH, AE, AO and VE), and the 0.2 percent annual chance
floodplain boundary corresponds to the boundary of areas of moderate flood hazards. In cases
where the 1 and 0.2 percent annual chance floodplain boundaries are close together, only the 1
percent annual chance floodplain boundary has been shown. Small areas within the floodplain
boundaries may lie above the flood elevations but cannot be shown due to limitations of the map
scale and/or limitations of the detailed topographic data.
For this revision, detail studied streams have the 1 and 0.2 percent annual chance floodplain
boundaries delineated using the flood elevations determined at each cross section. Between cross
sections, the boundaries were interpolated using topographic maps at a scale of 1:2400 with a
contour interval of 2 feet (Reference 28). This revision also changed a portion Canal No. 4 from
detailed AE to Approximate A zone, starting upstream of cross-section “O”. This was done to
reflect recent alteration of the streambed, not accounted for in the modeling. The revised portion
was delineated as an approximate A zone loosely based on the previous BFEs.
For areas of the City of Virginia Beach that were delineated based on the 1 and 0.2 percent annual
chance flood elevations shown in Table 2, the flood plain was delineated by generating contours
from the digital data that matched the elevation noted in the Summary of Still water elevations.
Those areas are labeled with BFE notations which are to the nearest tenth of a foot, and are
referred to as “Partial foot BFE’s”. The elevation listed on the DFIRM and in Table 2 should
match and are to be used for all flood hazard determinations. Please note that these partial foot
BFE’s do not reflect a change in the BFE from the previous studies, but rather reflect the
regulatory elevation, as shown in the FIS without rounding.
For tidal areas without wave action, the 1 and 0.2 percent annual chance boundaries were
delineated using QTT Surface Models generated from the new LIDAR data (Reference 24) using
Applied Imagery’s QT Modeler version 5.1.5. These QTT Surface Models were used to generate
flood hazard lines for areas of still water flooding for all elevations except those where the
Stillwater elevation matched an existing whole foot contour provided by The City of Virginia
Beach. In areas where the Stillwater elevation matched an existing whole foot contour, the flood
hazard areas were delineated to match the contours provided by The City of Virginia Beach
exactly.
For the tidal areas with wave action, the floodplain boundaries were delineated using the
elevations determined at each transect; between transects, boundaries were interpolated using
engineering judgment, land-cover data, and topographic maps (Reference 6). The 1 percent
annual chance floodplain was divided into whole-foot elevation zones based on the average wave

23
envelope elevation in that zone. Where the map scale did not permit these zones to be delineated
at 1-foot intervals, larger increments were used.
In the December 5, 1990 revision, the 100-year floodplain in the area known as Charlestowne
Lakes South was redelineated using updated topographic mapping and a City of Virginia Beach
flood hazard study based on a stormwater management plan (References 17-19). The 100-year
floodplain for the Stumpy Lake watershed was redelineated using the same mapping sources.
For the areas studied by approximate methods, the 1 percent annual chance floodplain boundaries
are based on normal depth calculations, storage, previous studies, and the engineer’s familiarity
and experience with similar streams in the study area. The 1 percent annual chance floodplain
boundaries were delineated based on topographic information (Reference 6).
For this revision, the approximate delineations from previous mapping efforts were revised to
better match the updated topography, and to improve tie in with the redelineated coastal and
riverine flooding. (References 28, 29)
For the areas studied by approximate methods, only the 100-year floodplain boundary is shown
on the DFIRM (Exhibit 2).
4.2 Floodways
Floodplain encroachments, such as structure placement and fill, reduce flood-carrying capacity,
increase flood heights and velocity, and increase the flood hazard in areas beyond the
encroachment itself. One aspect of floodplain management involves balancing the economic gain
from floodplain development against the resulting increase in flood hazard. For purposes of the
NFIP, a floodway is used as a tool to assist local communities in this aspect of floodplain
management. Under this concept, the area of the 1 percent annual chance floodplain is divided
into a floodway and a floodway fringe. The floodway is the channel of a stream, plus any
adjacent floodplain areas that must be kept free of encroachment so that the 1 percent annual
chance flood can be carried without substantial increases in flood heights. Minimum federal
standards limit such increases to 1.0 foot, provided that hazardous velocities are not produced.
The floodways in this study are presented to local agencies as a minimum standard that can be
adopted directly, or that can be used as a basis for additional floodway studies.
The floodways presented in this study were computed for certain stream segments on the basis of
equal conveyance reduction from each side of the floodplain. Floodway widths were computed at
cross sections. Between cross sections, the floodway boundaries were interpolated. The results of
the floodway computations are tabulated for selected cross sections in Table 7, “Floodway Data”
The computed floodways are shown on the DFIRM (Exhibit 2). In cases where the floodway and
1 percent annual chance floodplain boundaries are either close together or collinear, only the
floodway boundary is shown. Due to the unusual flooding conditions for Lake Pembroke, no
floodway was delineated.
For this revision, the floodways from the 1996 mapping were incorporated. Slight alterations
have been made to account for changes in the streambed location and floodplain geometry.
Where necessary the SFHA was widened to fully contain the modeled floodway width.
Additionally, Canal No. 4 has had its floodway trimmed to account for alteration of the stream
location in the vicinity of Recreation Drive.

24
Encroachment into areas subject to inundation by floodwaters having hazardous velocities
aggravates the risk of flood damage, and heightens potential flood hazards by further increasing
velocities. A listing of stream velocities at selected cross sections is provided in Table 7,
“Floodway Data”. In order to reduce the risk of property damage in areas where the stream
velocities are high, the community may wish to restrict development in areas outside the
floodway.
Near the mouths of streams studied in detail, floodway computations are made without regard to
flood elevations on the receiving water body. Therefore, “Without Floodway” elevations
presented in Table 7 for certain downstream cross sections of Thalia Creek, Left Bank Tributary
Thalia Creek, Holland Road Tributary Thalia Creek, Pine Tree Branch, Canal No. 2 London
Bridge Creek, Canal No. 2 West Neck Creek, Holland Road Corridor System, Green Run Canal,
Fox Run Canal, Cedar Hill Canal, and Canal No. 4 are lower than the regulatory flood elevations
in that area, which take into account the backwater 1 percent annual chance flooding from other
sources.
The area between the floodway and 100-year floodplain boundaries is termed the floodway
fringe. The floodway fringe encompasses the portion of the floodplain that could be completely
obstructed without increasing the water-surface elevation of the 100-year flood by more than 1.0
foot at any point. Typical relationships between the floodway and the floodway fringe and their
significance to floodplain development are shown in Figure 4.
Figure 4: Floodway Schematic

SECTION MEAN WITHOUT WITH
CROSS SECTION DISTANCE 1 WIDTH AREA VELOCITY REGULATORY FLOODWAY FLOODWAY INCREASE
(FT.) (SQ. FT.) (F.P.S)
CANAL NO. 1
NORTH
A 4,430 400 2 1,640 0.9 8.4 8.4 8.4 0.0
B 4,965 600 2 1,490 0.4 8.5 8.5 8.5 0.0
C 6,085 320 2 980 0.6 8.6 8.6 8.6 0.0
D 6,790 106 470 1.2 8.8 8.8 9.8 1.0
E 7,260 104 320 1.7 9.1 9.1 10.1 1.0
F 7,910 84 250 2.1 10.3 10.3 11.3 1.0
G 8,930 132 450 1.1 11.5 11.5 12.4 0.9
WATER SURFACE ELEVATION
1-PERCENT-ANNUAL-CHANCE FLOOD
(FEET NAVD)
TA
BL
E 7 (INDEPENDENT CITY)
CITY OF VIRGINIA BEACH, VA
FLOODWAY DATA
CANAL NO. 1 NORTH
FEDERAL EMERGENCY MANAGEMENT AGENCY
1 Feet above Virginia Beach Norfolk Expressway
2 Storage-type analysis
FLOODING SOURCE FLOODWAY

SECTION MEAN WITHOUT WITH
CROSS SECTION DISTANCE 1 WIDTH AREA VELOCITY REGULATORY FLOODWAY FLOODWAY INCREASE
(FT.) (SQ. FT.) (F.P.S)
CANAL NO. 2
LONDON BRIDGE
CREEK
A 405 205 2 1,565 2.5 6.8 4.1
3 5.1 1.0
B 1,455 209 2 1,685 2.4 6.8 4.4
3 5.3 0.9
C 2,500 150 1,710 2.3 6.8 4.6 3 5.5 0.9
D 3,690 172 2 1,740 2.2 6.8 4.8
3 5.7 0.9
E 4,720 150 1,795 2.0 6.8 5.0 3 5.9 0.9
F 6,660 250 1,710 0.9 6.8 5.2 3 6.1 0.9
G 7,930 150 1,225 1.2 6.8 5.3 3 6.2 0.9
H 9,335 150 1,120 1.2 6.8 5.5 3 6.3 0.8
I 10,220 100 1,105 1.2 6.8 5.5 3 6.4 0.9
J 11,490 100 1,135 1.1 6.8 5.7 3 6.5 0.8
K 13,775 100 1,155 0.8 6.8 5.8 3 6.6 0.8
L 14,450 100 1,425 0.6 6.8 5.8 3 6.6 0.8
M 16,230 100 1,270 0.6 6.8 5.8 3 6.6 0.8
N 19,840 100 920 0.4 6.8 5.9 3 6.7 0.8
O 20,885 100 750 1.7 6.8 5.9 3 6.7 0.8
P 23,540 300 1,595 0.4 6.1 6.1 9.9 0.8
Q 27,150 600 3,095 0.0 6.2 6.2 6.9 0.7
3 Elevation computed without consideration of backwater effects from Eastern Branch Lynnhaven River
1 Feet above westbound lane Virginia Beach Boulevard
2 Floodway width adjusted to updated waterlines, does not match model
FLOODING SOURCE FLOODWAY WATER SURFACE ELEVATION
1-PERCENT-ANNUAL-CHANCE FLOOD
(FEET NAVD)
TA
BL
E 7 (INDEPENDENT CITY)
CITY OF VIRGINIA BEACH, VA
FLOODWAY DATA
CANAL NO. 2 LONDON BRIDGE CREEK
FEDERAL EMERGENCY MANAGEMENT AGENCY

SECTION MEAN WITHOUT WITH
CROSS SECTION DISTANCE 1 WIDTH AREA VELOCITY REGULATORY FLOODWAY FLOODWAY INCREASE
(FT.) (SQ. FT.) (F.P.S)
CANAL NO. 2
WEST NECK CREEK
A 10,540 2200 9,075 0.5 4.0 3.5 2
4.5 1.0
B 11,400 1600 6,785 0.6 4.0 3.6 2
4.6 1.0
C 14,850 1400 6,015 0.7 4.3 4.3 5.3 1.0
D 18,470 1400 9,185 0.4 4.9 4.9 5.8 0.9
E 20,380 1400 9,025 0.4 5.0 5.0 5.9 0.9
F 22,430 1400 7,630 0.4 5.1 5.1 6.0 0.9
G 24,210 1400 7,335 0.4 5.2 5.2 6.1 0.9
H 26,720 900 5,400 0.5 5.4 5.4 6.3 0.9
I 30,350 900 5,060 0.4 5.6 5.6 6.6 1.0
J 32,970 700 3,795 0.4 5.7 5.7 6.7 1.0
K 35,380 600 2,945 0.4 5.9 5.9 6.9 1.0
L 40,040 600 3,090 0.0 5.9 5.9 6.9 1.0
1 Feet above West Neck Road
2 Elevation computed without consideration of backwater effects from Back Bay
TA
BL
E 7 (INDEPENDENT CITY)
CITY OF VIRGINIA BEACH, VA
FLOODWAY DATA
CANAL NO. 2 WEST NECK CREEK
FEDERAL EMERGENCY MANAGEMENT AGENCY
FLOODING SOURCE FLOODWAY WATER SURFACE ELEVATION
1-PERCENT-ANNUAL-CHANCE FLOOD
(FEET NAVD)

SECTION MEAN WITHOUT WITH
CROSS SECTION DISTANCE 1 WIDTH AREA VELOCITY REGULATORY FLOODWAY FLOODWAY INCREASE
(FT.) (SQ. FT.) (F.P.S)
CANAL NO. 4
A 1,560 155 600 4.1 4.1 3.0 2 3.8 0.8
B 2,295 249 1,190 2.0 4.2 4.2 5.2 1.0
C 3,130 217 1,090 2.2 4.7 4.7 5.6 0.9
D 3,600 152 860 2.8 5.1 5.1 6.0 0.9
E 3,890 180 830 2.9 5.7 5.7 6.3 0.6
F 4,175 167 990 2.4 5.9 5.9 6.6 0.7
G 4,875 112 510 1.1 6.4 6.4 7.1 0.7
H 5,500 56 260 2.1 6.5 6.5 7.2 0.7
I 5,780 50 230 2.3 6.6 6.6 7.3 0.7
J 6,200 38 250 2.0 6.9 6.9 7.5 0.6
K 6,850 53 300 1.5 7.1 7.1 7.7 0.6
L 7,020 60 300 1.5 7.2 7.2 7.8 0.6
M 7,700 41 180 2.2 7.4 7.4 7.9 0.5
N 8,440 20 120 3.0 7.9 7.9 8.3 0.4
O 9,690 43 180 1.6 8.8 8.8 9.0 0.2
FLOODING SOURCE FLOODWAY WATER SURFACE ELEVATION
1-PERCENT-ANNUAL-CHANCE FLOOD
(FEET NAVD)
1 Feet above confluence with Salem Canal
2 Elevation computed without consideration of backwater effects from Salem Canal
TA
BL
E 7 (INDEPENDENT CITY)
CITY OF VIRGINIA BEACH, VA
FLOODWAY DATA
CANAL NO. 4
FEDERAL EMERGENCY MANAGEMENT AGENCY

SECTION MEAN WITHOUT WITH
CROSS SECTION DISTANCE 1 WIDTH AREA VELOCITY REGULATORY FLOODWAY FLOODWAY INCREASE
(FT.) (SQ. FT.) (F.P.S)
CEDAR HILL
CANAL
A 3,630 52 180 1.8 7.5 5.0 2 6.0 1.0
B 4,205 52 180 1.6 7.5 5.4 2 6.1 0.7
C 4,580 27 100 3.1 7.5 5.8 2 6.4 0.6
D 4,680 33 120 2.3 7.5 6.0 2 6.5 0.5
E 5,080 40 110 2.3 7.7 7.7 8.1 0.4
F 5,680 20 80 2.7 8.2 8.2 8.5 0.3
G 6,180 23 70 2.9 8.8 8.8 9.0 0.2
H 6,970 23 50 3.2 10.1 10.1 10.1 0.0
I 7,630 30 50 2.5 11.7 11.7 11.7 0.0
J 8,280 24 50 1.9 12.6 12.6 12.6 0.0
K 8,510 31 40 2.4 12.8 12.8 12.8 0.0
L 12,200 50 300 4.8 12.8 12.8 13.8 1.0
M 13,200 65 330 3.9 14.4 14.4 14.7 0.3
N 14,200 66 340 3.5 15.7 15.7 15.9 0.2
1 Feet above confluence with Eastern Branch Elizabeth River
TA
BL
E 7 (INDEPENDENT CITY)
CITY OF VIRGINIA BEACH, VA
FLOODWAY DATA
CEDAR HILL CANAL
FEDERAL EMERGENCY MANAGEMENT AGENCY
2 Elevation computed without consideration of backwater effects from Eastern Branch Elizabeth River
FLOODING SOURCE FLOODWAY WATER SURFACE ELEVATION
1-PERCENT-ANNUAL-CHANCE FLOOD
(FEET NAVD)

SECTION MEAN WITHOUT WITH
CROSS SECTION DISTANCE 1 WIDTH AREA VELOCITY REGULATORY FLOODWAY FLOODWAY INCREASE
(FT.) (SQ. FT.) (F.P.S)
COLONY ACRES
CANAL
A 800 179 710 2.3 6.1 6.1 7.0 0.9
B 2,025 319 1,040 1.6 7.2 7.2 8.1 0.9
C 2,868 298 930 1.7 7.4 7.4 8.3 0.9
D 3,685 212 750 2.2 8.3 8.3 9.1 0.8
E 5,127 104 560 2.9 10.1 10.1 10.5 0.4
F 5,812 70 400 4.1 10.8 10.8 11.1 0.3
G 6,542 100 650 2.5 11.9 11.9 12.4 0.5
H 7,460 79 530 3.1 12.4 12.4 13.0 0.6
TA
BL
E 7 (INDEPENDENT CITY)
CITY OF VIRGINIA BEACH, VA
FLOODWAY DATA
COLONY ACRES CANAL
FEDERAL EMERGENCY MANAGEMENT AGENCY
1 Feet above confluence with Canal No. 2 West Neck Creek
FLOODING SOURCE FLOODWAY WATER SURFACE ELEVATION
1-PERCENT-ANNUAL-CHANCE FLOOD
(FEET NAVD)

SECTION MEAN WITHOUT WITH
CROSS SECTION DISTANCE 1 WIDTH AREA VELOCITY REGULATORY FLOODWAY FLOODWAY INCREASE
(FT.) (SQ. FT.) (F.P.S)
FOX RUN
CANAL
A 1,210 65 230 4.0 7.5 5.8 2 6.0 0.2
B 1,725 60 265 3.5 7.5 7.0 2 7.1 0.1
C 2,220 57 245 3.8 7.5 7.5 8.1 0.6
D 2,630 50 285 2.9 8.4 8.4 8.8 0.4
E 3,945 40 210 3.5 9.4 9.4 9.6 0.2
F 4,625 45 235 2.9 10.1 10.1 10.3 0.2
G 5,590 60 335 1.8 11.9 11.9 12.0 0.1
H 6,190 60 390 1.4 12.1 12.1 12.2 0.1
FLOODING SOURCE FLOODWAY WATER SURFACE ELEVATION
1-PERCENT-ANNUAL-CHANCE FLOOD
(FEET NAVD)
1 Feet above confluence with Eastern Branch Elizabeth River
TA
BL
E 7 (INDEPENDENT CITY)
CITY OF VIRGINIA BEACH, VA
FLOODWAY DATA
FOX RUN CANAL
FEDERAL EMERGENCY MANAGEMENT AGENCY
2 Elevation computed without consideration of backwater effects from Eastern Branch Elizabeth River

SECTION MEAN WITHOUT WITH
CROSS SECTION DISTANCE 1 WIDTH AREA VELOCITY REGULATORY FLOODWAY FLOODWAY INCREASE
(FT.) (SQ. FT.) (F.P.S)
GREEN RUN
CANAL
A 310 36 210 2.7 6.8 5.0 3 5.8 0.8
B 1,035 42 220 2.6 6.8 5.4 3 6.1 0.7
C 2,005 48 320 1.8 6.8 5.9 3 6.5 0.6
D 2,445 36 200 2.9 6.8 6.0 3 6.6 0.6
E 2,780 69 270 2.1 7.3 7.3 7.9 0.6
F 3,550 76 320 1.8 7.8 7.8 8.2 0.4
G 3,950 188 2 760 1.2 8.6 8.6 8.6 0.0
H 5,572 126 2 650 1.4 8.8 8.8 8.6 0.0
I 7,035 186 2 830 1.1 9.1 9.1 9.1 0.0
J 7,400 150 2 960 1.0 9.3 9.3 9.3 0.0
K 9,400 145 2 1010 0.9 9.5 9.5 9.5 0.0
TA
BL
E 7 (INDEPENDENT CITY)
CITY OF VIRGINIA BEACH, VA
FLOODWAY DATA
GREEN RUN CANAL
FEDERAL EMERGENCY MANAGEMENT AGENCY
3 Elevation computed without consideration of backwater effects from Eastern Branch Lynnhaven River
1 Feet above confluence with Canal No. 2 London Bridge Creek
2 Storage-type analysis
FLOODING SOURCE FLOODWAY WATER SURFACE ELEVATION
1-PERCENT-ANNUAL-CHANCE FLOOD
(FEET NAVD)

SECTION MEAN WITHOUT WITH
CROSS SECTION DISTANCE 1 WIDTH AREA VELOCITY REGULATORY FLOODWAY FLOODWAY INCREASE
(FT.) (SQ. FT.) (F.P.S)
HOLLAND ROAD
CORRIDOR SYSTEM
A 4,600 117 740 0.5 6.8 5.8 2 6.3 0.5
B 6,900 96 510 0.8 6.8 6.6 2 7.1 0.5
C 7,290 107 620 0.6 7.5 7.5 8.0 0.5
D 8,805 112 960 0.4 8.0 8.0 8.5 0.5
1 Feet above confluence with Green Run Canal
FLOODING SOURCE FLOODWAY WATER SURFACE ELEVATION
1-PERCENT-ANNUAL-CHANCE FLOOD
(FEET NAVD)
2 Elevation computed without consideration of backwater effects from Eastern Branch Lynnhaven River
TA
BL
E 7 (INDEPENDENT CITY)
CITY OF VIRGINIA BEACH, VA
FLOODWAY DATA
HOLLAND ROAD CORRIDOR SYSTEM
FEDERAL EMERGENCY MANAGEMENT AGENCY

SECTION MEAN WITHOUT WITH
CROSS SECTION DISTANCE 1 WIDTH AREA VELOCITY REGULATORY FLOODWAY FLOODWAY INCREASE
(FT.) (SQ. FT.) (F.P.S)
HOLLAND ROAD
TRIBUTARY
THALIA CREEK
A 587 30 250 4.2 9.4 6.4 2
7.1 0.8
B 1,392 40 180 5.3 9.4 7.0 2
7.6 0.6
C 1,624 60 430 2.1 10.7 10.7 10.7 0.0
D 2,860 250 1,650 0.5 10.8 10.8 10.8 0.0
E 3,284 70 430 1.7 11.7 11.7 11.7 0.0
TA
BL
E 7 (INDEPENDENT CITY)
CITY OF VIRGINIA BEACH, VA
FLOODWAY DATA
HOLLAND ROAD TRIBUTARY THALIA CREEK
FEDERAL EMERGENCY MANAGEMENT AGENCY
1 Feet above confluence with Left Bank Tributary Thalia Creek
FLOODING SOURCE FLOODWAY WATER SURFACE ELEVATION
1-PERCENT-ANNUAL-CHANCE FLOOD
(FEET NAVD)
2 Elevation computed without consideration of backwater effects from Left Bank Tributary Thalia Creek

SECTION MEAN WITHOUT WITH
CROSS SECTION DISTANCE 1
WIDTH 2 AREA VELOCITY REGULATORY FLOODWAY FLOODWAY INCREASE
(FT.) (SQ. FT.) (F.P.S)
LAKE BANBURY
A 5,545 242 1,200 0.6 7.9 7.9 7.9 0.0
B 5,953 173 850 0.6 7.9 7.9 7.9 0.0
C 6,110 124 600 0.8 8.0 8.0 8.3 0.3
D 6,650 110 609 0.0 12.6 12.6 12.6 0.0
1 Feet above confluence with Eastern Branch Elizabeth River
FLOODING SOURCE FLOODWAY WATER SURFACE ELEVATION
1-PERCENT-ANNUAL-CHANCE FLOOD
(FEET NAVD)
2 Storage-type analysis
TA
BL
E 7 (INDEPENDENT CITY)
CITY OF VIRGINIA BEACH, VA
FLOODWAY DATA
LAKE BANBURY
FEDERAL EMERGENCY MANAGEMENT AGENCY

SECTION MEAN WITHOUT WITH
CROSS SECTION DISTANCE 1 WIDTH AREA VELOCITY REGULATORY FLOODWAY FLOODWAY INCREASE
(FT.) (SQ. FT.) (F.P.S)
LAKE SMITH
TRIBUTARY
A 6,740 78 80 4.6 11.1 11.1 11.1 0.0
B 7,460 105 190 1.5 13.9 13.9 14.0 0.1
TA
BL
E 7 (INDEPENDENT CITY)
CITY OF VIRGINIA BEACH, VA
FLOODWAY DATA
LAKE SMITH TRIBUTARY
FEDERAL EMERGENCY MANAGEMENT AGENCY
1 Feet above confluence with Lake Smith
FLOODING SOURCE FLOODWAY WATER SURFACE ELEVATION
1-PERCENT-ANNUAL-CHANCE FLOOD
(FEET NAVD)

SECTION MEAN WITHOUT WITH
CROSS SECTION DISTANCE 1 WIDTH AREA VELOCITY REGULATORY FLOODWAY FLOODWAY INCREASE
(FT.) (SQ. FT.) (F.P.S)
LEFT BANK
TRIBUTARY
THALIA CREEK
A 785 62 335 4.9 6.5 6.4 7.4 2
1.0
B 1,285 60 460 3.4 7.2 7.2 7.9 0.7
C 2,870 66 350 4.1 8.1 8.1 8.6 0.5
D 4,615 100 795 1.6 9.4 9.4 9.7 0.3
E 5,445 84 445 2.7 9.4 9.4 9.7 0.3
1 Feet above confluence with Thalia Creek
FLOODING SOURCE FLOODWAY WATER SURFACE ELEVATION
1-PERCENT-ANNUAL-CHANCE FLOOD
(FEET NAVD)
2 Elevation computed without consideration of backwater effects from Thalia Creek
TA
BL
E 7 (INDEPENDENT CITY)
CITY OF VIRGINIA BEACH, VA
FLOODWAY DATA
LEFT BANK TRIBUTARY THALIA CREEK
FEDERAL EMERGENCY MANAGEMENT AGENCY

SECTION MEAN WITHOUT WITH
CROSS SECTION DISTANCE 1 WIDTH AREA VELOCITY REGULATORY FLOODWAY FLOODWAY INCREASE
(FT.) (SQ. FT.) (F.P.S)
MILL DAM CREEK
A 5,802 360 2 1,490 0.5 7.1 7.1 7.1 0.0
B 6,445 266 2 1,100 0.7 7.2 7.2 7.2 0.0
C 6,918 275 2 1,110 0.7 7.2 7.2 7.2 0.0
D 7,902 880 2 870 0.8 7.5 7.5 7.5 0.0
E 8,520 202 2 510 1.4 7.9 7.9 7.9 0.0
F 9,680 68 260 2.6 9.2 9.2 9.6 0.4
G 9,930 58 340 2.0 12.0 12.0 12.4 0.4
H 10,790 53 190 3.6 12.9 12.9 13.2 0.3
I 11,468 38 200 3.5 14.4 14.4 14.5 0.1
TA
BL
E 7 (INDEPENDENT CITY)
CITY OF VIRGINIA BEACH, VA
FLOODWAY DATA
MILL DAM CREEK
FEDERAL EMERGENCY MANAGEMENT AGENCY
1 Feet above confluence with Broad Bay
FLOODING SOURCE FLOODWAY WATER SURFACE ELEVATION
1-PERCENT-ANNUAL-CHANCE FLOOD
(FEET NAVD)
2 Storage-type analysis

SECTION MEAN WITHOUT WITH
CROSS SECTION DISTANCE 1 WIDTH AREA VELOCITY REGULATORY FLOODWAY FLOODWAY INCREASE
(FT.) (SQ. FT.) (F.P.S)
PINE TREE
BRANCH
A 2,150 186 130 1.8 6.8 3.1 3
4.1 1.0
B 2,710 180 2
990 0.4 6.8 6.8 6.8 0.0
C 3,660 188 2
700 0.6 6.9 6.9 6.9 0.0
D 4,790 209 2
480 0.9 7.2 7.2 7.2 0.0
3 Elevation computed without consideration of backwater effects from Lynnhaven River
1 Feet above confluence with Eastern Branch Lynnhaven River
2 Storage-type analysis
FLOODING SOURCE FLOODWAY WATER SURFACE ELEVATION
1-PERCENT-ANNUAL-CHANCE FLOOD
(FEET NAVD)
TA
BL
E 7 (INDEPENDENT CITY)
CITY OF VIRGINIA BEACH, VA
FLOODWAY DATA
PINE TREE BRANCH
FEDERAL EMERGENCY MANAGEMENT AGENCY

SECTION MEAN WITHOUT WITH
CROSS SECTION DISTANCE 1 WIDTH AREA VELOCITY REGULATORY FLOODWAY FLOODWAY INCREASE
(FT.) (SQ. FT.) (F.P.S)
SALEM CANAL
A 300 763 3,100 0.7 4.0 4.0 4.6 0.6
B 900 620 2,810 0.8 4.0 4.0 4.6 0.6
C 2,250 510 2,140 1.0 4.3 4.3 4.9 0.6
D 4,200 490 2,220 0.9 4.7 4.7 5.3 0.6
E 5,540 540 2,850 0.7 4.8 4.8 5.6 0.8
F 7,098 537 2,690 0.7 4.7 4.9 5.7 0.8
G 7,975 410 2,150 0.8 4.7 4.9 5.8 0.9
H 9,228 349 1,740 1.0 5.1 5.1 6.0 0.9
I 10,736 380 2,050 0.8 5.3 5.3 6.2 0.9
J 11,955 380 1,840 0.8 5.7 5.7 6.7 1.0
K 13,520 300 1,450 0.8 5.7 5.7 6.7 1.0
L 14,735 300 1,150 0.9 5.9 5.9 6.9 1.0
M 16,437 300 1,150 0.8 6.3 6.3 7.2 0.9
N 17,110 119 2 350 2.3 6.5 6.5 7.3 0.8
O 18,279 100 460 1.4 7.4 7.4 8.2 0.8
P 19,210 100 560 1.0 7.6 7.6 8.4 0.8
Q 20,200 100 610 0.9 7.7 7.7 8.5 0.8
R 21,475 100 340 1.3 8.1 8.1 8.7 0.6
S 22,480 108 2 240 1.7 8.3 8.3 9.1 0.8
T 23,304 105 2 280 1.2 8.5 8.5 9.3 0.8
U 24,075 61 320 0.9 8.6 8.6 9.4 0.8
1 Feet above Indian River Road
FLOODING SOURCE FLOODWAY WATER SURFACE ELEVATION
1-PERCENT-ANNUAL-CHANCE FLOOD
(FEET NAVD)
2 Floodway width adjusted to updated waterlines, does not match model
TA
BL
E 7 (INDEPENDENT CITY)
CITY OF VIRGINIA BEACH, VA
FLOODWAY DATA
SALEM CANAL
FEDERAL EMERGENCY MANAGEMENT AGENCY

SECTION MEAN WITHOUT WITH
CROSS SECTION DISTANCE 1 WIDTH AREA VELOCITY REGULATORY FLOODWAY FLOODWAY INCREASE
(FT.) (SQ. FT.) (F.P.S)
THALIA CREEK
A 1,900 70 470 2.8 6.8 3.6 2
4.4 0.8
B 2,795 98 560 2.3 6.8 4.1 2
5.0 0.9
C 3,840 44 290 4.5 6.8 4.9 2
5.8 0.9
D 4,515 357 1,050 1.2 6.8 6.8 6.8 0.0
E 6,695 86 566 2.0 6.9 6.9 6.9 0.0
F 8,527 98 647 1.8 7.5 7.5 7.5 0.0
2 Elevation computed without consideration of backwater effects from Lynnhaven River
1 Feet above Norfolk and Southern Railroad
FLOODING SOURCE FLOODWAY WATER SURFACE ELEVATION
1-PERCENT-ANNUAL-CHANCE FLOOD
(FEET NAVD)
TA
BL
E 7 (INDEPENDENT CITY)
CITY OF VIRGINIA BEACH, VA
FLOODWAY DATA
THALIA CREEK
FEDERAL EMERGENCY MANAGEMENT AGENCY

42
5.0 INSURANCE APPLICATIONS
For flood insurance rating purposes, flood insurance zone designations are assigned to a
community based on the results of the engineering analyses. The zones are as follows:
Zone A
Zone A is the flood insurance rate zone that corresponds to the 100-year floodplains that
are determined in the FIS by approximate methods. Because detailed hydraulic analyses
are not performed for such areas, no base flood elevations or depths are shown within this
zone.
Zone AE
Zone AE is the flood insurance rate zone that corresponds to the 100-year floodplains that
are determined in the FIS by detailed methods. In most instances, whole-foot base flood
elevations derived from the detailed hydraulic analyses are shown at selected intervals
within this zone.
Zone AH
Zone AH is the flood insurance rate zone that corresponds to the areas of 100-year
shallow flooding (usually areas of ponding) where average depths are between 1 and 3
feet. Whole-foot base flood elevations derived from the detailed hydraulic analyses are
shown at selected intervals within this zone.
Zone AO
Zone AO is the flood insurance rate zone that corresponds to the areas of 100-year
shallow flooding (usually sheet flow on sloping terrain) where average depths are
between 1 and 3 feet. Average whole-depths derived from the detailed hydraulic
analyses are shown within this zone.
Zone V
Zone V is the flood insurance rate zone that corresponds to the 100-year coastal
floodplains that have additional hazards associated with storm waves. Because
approximate hydraulic analyses are performed for such areas, no base flood elevations
are shown within this zone.
Zone VE
Zone VE is the flood insurance rate zone that corresponds to the 100-year coastal
floodplains that have additional hazards associated with storm waves. Whole-foot base
flood elevations derived from the detailed hydraulic analyses are shown at selected
intervals within this zone.

43
Zone X
Zone X is the flood insurance rate zone that corresponds to areas outside the 500-year
floodplain, areas within the 500-year floodplain, and to areas of 100-flooding where
average depths are less than 1 foot, areas of 100-year flooding where the contributing
drainage area is less than 1 square mile, and areas protected from the 100-year flood by
levees. No base flood elevations or depth are shown within this zone.
6.0 FLOOD INSURANCE RATE MAP
The DFIRM is designed for flood insurance and floodplain management applications.
For flood insurance applications, the map designates flood insurance rate zones as described in
Section 5.0, and in the 1 percent annual chance floodplains studied by detailed methods, shows
selected whole-foot, partial-foot base flood elevations, or average depths. Insurance agents use
the zones and base flood elevations in conjunction with information on structures and their
contents to assign premium rates for flood insurance policies.
For floodplain management applications, the map shows by tints, screens and symbols, the 1 and
0.2 percent annual chance floodplains. Floodways and the locations of selected cross sections
used in the hydraulic analyses and floodway computations are shown where applicable. The
DFIRM includes flood hazard information that was presented separately on the Flood Boundary
and Floodway Map in the previously printed FIS for the City of Virginia Beach.
7.0 OTHER STUDIES
A floodplain information report for Virginia Beach was prepared by the USACE in July 1969
(Reference 3). A number of other reports have been prepared by the Norfolk District of the
USACE concerning flooding in Virginia Beach, including a feasibility report for beach erosion
control and hurricane protection, a feasibility report for flood control and navigation, and a study
of Canal No. 2 (References 19-21). FEMA requested that the National Oceanic and Atmospheric
Administration study flood levels from storm tides on the open coasts of Virginia, Maryland and
Delaware. This study was completed in August 1976 (Reference 22).
Flood Insurance Studies (FIS) have been prepared for the Cities of Norfolk and Chesapeake,
Virginia; and the Unincorporated Areas of Currituck County, North Carolina (References 23-25).
Because it is based on more up-to-date analyses, this FIS supersedes the previously printed FIS
for the City of Virginia Beach (Reference 27). This FIS also supersedes the Flood Boundary and
Floodway Map for the City of Virginia Beach, which was published as part of the previously
printed FIS. The information on the Flood Boundary and Floodway Map has been added to the
DFIRM accompanying this FIS.
8.0 LOCATION OF DATA
Information concerning the pertinent data used in preparation of this study can be obtained by
contacting FEMA Region 3, 615 Chestnut Street, Philadelphia, PA 19106

44
9.0 BIBLIOGRAPHY AND REFERENCES
1. Federal Emergency Management Agency, Flood Insurance Study, City of Virginia Beach,
Independent City, Virginia, Washington, D.C., August 18, 1992.
2. State of Virginia, Division of State Planning and Community Affairs, Data Summary –
City of Virginia Beach, Richmond, Virginia, April 1973
3. U.S. Army Corps of Engineers, Norfolk District, Flood Plain Information Report,
Coastal Flooding, Virginia Beach, Virginia, Norfolk, Virginia, July 1969.
4. U.S. Department of Commerce, Weather Bureau, Technical Paper No. 40,
Rainfall Frequency Atlas of the United States, Washington, D.C., 1961, Revised 1963.
5. National Academy of Sciences, Methodology for Calculating Wave Action Effects
Associated with Storm Surges, Washington, D.C. 1977.
6. Mid States Engineering, Inc., Topographic Maps of the City of Virginia Beach, Virginia,
Scale 1:2,400, Contour Interval 2 Feet, Indianapolis, Indiana, March 1986.
7. Raytheon Company, Automertic Operation, City of Virginia Beach, Virginia Topographic
Maps, Scale 1:2,400, Contour Intervals 2 Feet, Wayland, Massachusetts.
8. U.S. Army Corps of Engineers, Hydrologic Engineering Center, HEC-2 Water Surface
Profiles, Users Manual, Davis, California, September 1990.
9. U.S. Army Corps of Engineers, Galveston District, Guidelines for Identifying Coastal
High Hazard Zones, Galveston, Texas, June 1975.
10. Federal Emergency Management Agency, Guidelines and Specifications for Wave
Elevation Determination and V zone Mapping, 3rd
Draft, July 1989.
11. Federal Insurance Administration, Office of Risk Assessment, Assessment of Current
Procedures Used for the Identification of Coastal High Hazard Areas (V Zone),
September 1986.
12. Federal Emergency Management Agency, Basis of Assessment Procedures for Dune Erosion
In Coastal Flood Insurance Studies, January 1989.
13. Federal Emergency Management Agency, Procedures for Applying Marsh Grass
Methodology, Draft, October 1984.
14. Federal Emergency Management Agency, Federal Insurance Administration, Wave Height
Analysis for Flood Insurance Studies (Technical Documentation for WHAFIS Program
Version 3.0), September 1988.
15. U.S. Department of Commerce, National Oceanic and Atmospheric Administration,
National Ocean Survey, Coast and Geodetic Survey, Nautical Chart 122222, Scale
1:40,000, and Nautical Chart 12207, Scale 1:80,000.
16. Miscellaneous Transect Data, City of Virginia Beach, Virginia.

45
17. City of Virginia Beach, Virginia, Charlestowne Lakes South Flood Study, December
1988.
18. Camp, Dresser & McKee, for the City of Virginia Beach Department of Public Works,
Stormwater Management Plan, Watershed 12 – Stumpy Lake, December 1987.
19. U.S. Army Corps of Engineers, Norfolk District, Virginia Beach, Virginia, Feasibility
Report for Beach Erosion Control and Hurricane Protection, Norfolk, Virginia,
September 1970.
20. U.S. Army Corps of Engineers, Norfolk District, Virginia Beach Streams, Feasibility
Report for Flood Control and Navigation, Virginia Beach, Virginia, Norfolk, Virginia,
July 1975.
21. U.S. Army Corps of Engineers, Norfolk District, Virginia Beach, Streams, Canal
Number Two, General Design Memorandum, Phase I, Virginia Beach, Virginia,
Norfolk, Virginia, September 1980.
22. U.S. Department of Commerce, National Oceanic and Atmospheric Administration,
NOAA Technical Memorandum NWS HYDRO-32, Storm Tide Frequency Analysis
for the Open Coast of Virginia, Maryland and Delaware, Silver Springs, Maryland,
August 1976.
23. Federal Emergency Management Agency, Flood Insurance Study, City of Norfolk,
Independent City, Virginia, Washington, D.C., July 16, 1996.
24. U.S. Department of Housing and Urban Development, Federal Insurance Administration,
Flood Insurance Study, City of Chesapeake, Independent City, Virginia, Washington,
D.C., February 2, 1997.
25. Federal Emergency Management Agency, Flood Insurance Study, Currituck County,
North Carolina (Unincorporated Areas), Washington, D.C., July 3, 1995
26. U.S. Army Corps of Engineers, Norfolk District, Hurricane Survey Report, Norfolk,
Virginia, October 1959.
27. Federal Emergency Management Agency, Flood Insurance Study, City of Virginia Beach,
Independent City, Virginia, Washington, D.C., December 5, 1996.
28. LIDAR collected for City of Virginia Beach, delivered by: SANBORN, Colorado Springs, CO,
June 2005, CGIS_OWNER.TOPO_Contours.
29. Federal Emergency Management Agency, Converting the National Flood Insurance Program
to the North American Vertical Datum of 1988, Washington D.C., 1992
30. United States Army Corp or Engineers, Norfolk District: Virginia Beach, VA Beach Erosion
Control and Hurricane Protection Project Contact (757)-201-7778