City of Santa Monica Fleet Efficiency Study - smgov.net
52
PROPRIETARY AND CONFIDENTIAL FINAL REPORT FOR CITY OF SANTA MONICA Fleet Management Efficiency Study June 6, 2018 Moss Adams 999 Third Avenue, Suite 2800 Seattle, WA 98104 (206) 302-6500
Transcript of City of Santa Monica Fleet Efficiency Study - smgov.net

PROPRIETARY AND CONFIDENTIAL
FINAL REPORT FOR
CITY OF SANTA MONICA Fleet Management Efficiency Study
June 6, 2018
Moss Adams 999 Third Avenue, Suite 2800
Seattle, WA 98104 (206) 302-6500

Fleet Management Efficiency Study Report for City of Santa Monica
Table of Contents
I. Overview 1
| A. Background, Scope, and Methodology 1
| B. Findings and Recommendations 1
II. Background, Objectives, Scope, and Methodology 6
| A. Background 6
| B. Scope and Objectives 6
| C. Methodology 7
III. Findings and Recommendations 8
| A. Organization and Facilities 8
| B. Service Delivery 12
| C. Staffing and Workload 18
| D. Procurement, Funding, and Utilization 20
| E. Costs 24
| F. Fleet Management Policies, Customer Feedback, Performance Measurement, and Reporting 29
Appendix A: Explanation of How Labor Rates and Markups Were Calculated 34
Appendix B: Sample Performance Measures 36
Attachment 1 40
| Exhibit 1: Fleet Services Cost Summary 40
| Exhibit 2: Labor Distribution by Activity Centers 41
| Exhibit 3: Maintenance & Repair Production 45
| Exhibit 4: Fleet Budget Distribution by Activity Center 47
| Exhibit 5: Fleet Labor Rate & Markups 48
Fleet Management Efficiency Study Report for City of Santa Monica 1
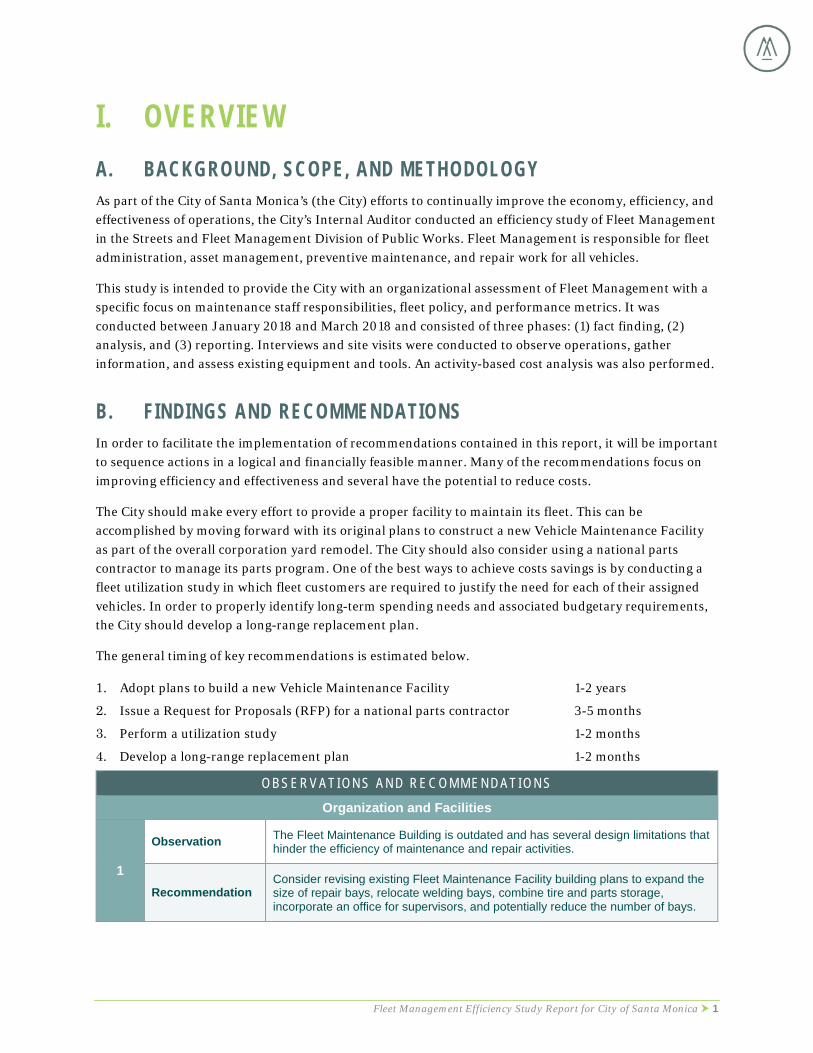
I . OVERVIEW A. BACKGROUND, SCOPE, AND METHODOLOGY As part of the City of Santa Monica’s (the City) efforts to continually improve the economy, efficiency, and effectiveness of operations, the City’s Internal Auditor conducted an efficiency study of Fleet Management in the Streets and Fleet Management Division of Public Works. Fleet Management is responsible for fleet administration, asset management, preventive maintenance, and repair work for all vehicles.
This study is intended to provide the City with an organizational assessment of Fleet Management with a specific focus on maintenance staff responsibilities, fleet policy, and performance metrics. It was conducted between January 2018 and March 2018 and consisted of three phases: (1) fact finding, (2) analysis, and (3) reporting. Interviews and site visits were conducted to observe operations, gather information, and assess existing equipment and tools. An activity-based cost analysis was also performed.
B. FINDINGS AND RECOMMENDATIONS In order to facilitate the implementation of recommendations contained in this report, it will be important to sequence actions in a logical and financially feasible manner. Many of the recommendations focus on improving efficiency and effectiveness and several have the potential to reduce costs.
The City should make every effort to provide a proper facility to maintain its fleet. This can be accomplished by moving forward with its original plans to construct a new Vehicle Maintenance Facility as part of the overall corporation yard remodel. The City should also consider using a national parts contractor to manage its parts program. One of the best ways to achieve costs savings is by conducting a fleet utilization study in which fleet customers are required to justify the need for each of their assigned vehicles. In order to properly identify long-term spending needs and associated budgetary requirements, the City should develop a long-range replacement plan.
The general timing of key recommendations is estimated below.
1. Adopt plans to build a new Vehicle Maintenance Facility 1-2 years
2. Issue a Request for Proposals (RFP) for a national parts contractor 3-5 months
3. Perform a utilization study 1-2 months
4. Develop a long-range replacement plan 1-2 months
OBSERVATIONS AND REC OMMENDATIONS Organization and Facilities
1
Observation The Fleet Maintenance Building is outdated and has several design limitations that hinder the efficiency of maintenance and repair activities.
Recommendation Consider revising existing Fleet Maintenance Facility building plans to expand the size of repair bays, relocate welding bays, combine tire and parts storage, incorporate an office for supervisors, and potentially reduce the number of bays.
Fleet Management Efficiency Study Report for City of Santa Monica 2
OBSERVATIONS AND REC OMMENDATIONS
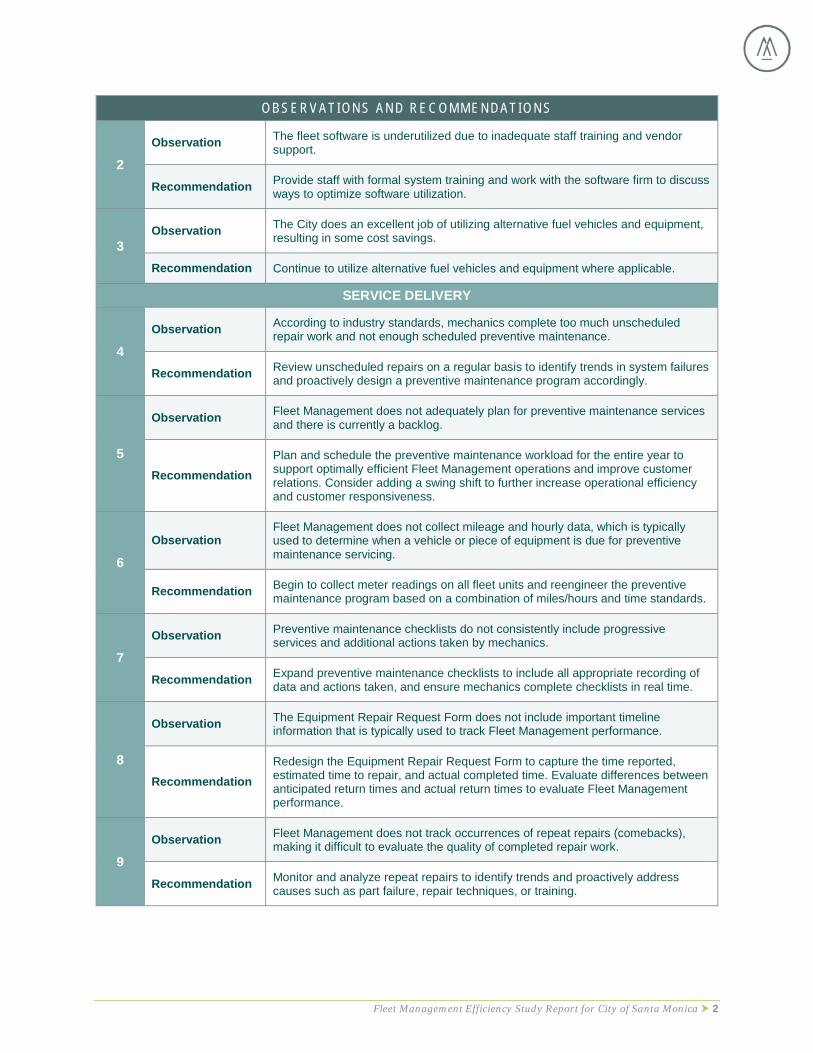
2 Observation The fleet software is underutilized due to inadequate staff training and vendor
support.
Recommendation Provide staff with formal system training and work with the software firm to discuss ways to optimize software utilization.
3 Observation The City does an excellent job of utilizing alternative fuel vehicles and equipment,
resulting in some cost savings.
Recommendation Continue to utilize alternative fuel vehicles and equipment where applicable.
SERVICE DELIVERY
4 Observation According to industry standards, mechanics complete too much unscheduled
repair work and not enough scheduled preventive maintenance.
Recommendation Review unscheduled repairs on a regular basis to identify trends in system failures and proactively design a preventive maintenance program accordingly.
5
Observation Fleet Management does not adequately plan for preventive maintenance services and there is currently a backlog.
Recommendation Plan and schedule the preventive maintenance workload for the entire year to support optimally efficient Fleet Management operations and improve customer relations. Consider adding a swing shift to further increase operational efficiency and customer responsiveness.
6 Observation
Fleet Management does not collect mileage and hourly data, which is typically used to determine when a vehicle or piece of equipment is due for preventive maintenance servicing.
Recommendation Begin to collect meter readings on all fleet units and reengineer the preventive maintenance program based on a combination of miles/hours and time standards.
7 Observation Preventive maintenance checklists do not consistently include progressive
services and additional actions taken by mechanics.
Recommendation Expand preventive maintenance checklists to include all appropriate recording of data and actions taken, and ensure mechanics complete checklists in real time.
8
Observation The Equipment Repair Request Form does not include important timeline information that is typically used to track Fleet Management performance.
Recommendation Redesign the Equipment Repair Request Form to capture the time reported, estimated time to repair, and actual completed time. Evaluate differences between anticipated return times and actual return times to evaluate Fleet Management performance.
9 Observation Fleet Management does not track occurrences of repeat repairs (comebacks),
making it difficult to evaluate the quality of completed repair work.
Recommendation Monitor and analyze repeat repairs to identify trends and proactively address causes such as part failure, repair techniques, or training.

Fleet Management Efficiency Study Report for City of Santa Monica 3
OBSERVATIONS AND REC OMMENDATIONS
10
Observation Fleet Management does not have a formal inventory monitoring system in place and has not completed a parts inventory since 2013.
Recommendation Adopt a formal inventory monitoring system, including bar coding parts to track inventory levels. In collaboration with the City’s Finance Department, conduct an annual parts audit.
11
Observation Fleet Management lacks key performance measures in repair service contracts and a method to monitor these measures.
Recommendation Where applicable, reissue RFPs and award contracts for fleet repair services to local vendors with set prices, delivery criteria, turnaround times, and warranties. Implement a process to monitor and track defined performance measures.
12 Observation
In comparison to industry standards, Fleet Management contracts a lower percentage of operational costs to commercial vendors that complete some services more economically.
Recommendation Assess what fleet services could be performed more economically by commercial vendors.
Staffing and Workload
13 Observation Mechanic productivity falls below industry standards and overall staffing levels
slightly exceed calculated staffing requirements.
Recommendation Increase mechanic productivity by analyzing non-wrenching hours and potentially distributing those tasks to other fleet employees.
14
Observation Fleet Management’s limited training budget does not permit regular mechanic training opportunities.
Recommendation In accordance with industry standards, increase the training budget to provide sufficient training opportunities for all mechanics to remain abreast of vehicle, equipment, and maintenance advancements.
Procurement, Funding, and Utilization
15 Observation The City relies on short-term fleet replacement planning and does not incorporate
miles or hours data in its replacement criteria.
Recommendation Develop a long-range fleet replacement plan, revise the replacement policy to include miles and hours data, and reevaluate replacement intervals accordingly.
16
Observation The criteria for identifying vehicles and equipment past the optimum economic life point does not take into account several key factors.
Recommendation Adopt a methodology to support the replacement of vehicles and equipment based on the “optimum economic life point” of a unit. Expand criteria to include age, miles/hours, maintenance/repair costs, condition, reliability, and downtime.
17
Observation Many vehicles and pieces of equipment have low utilization, which may indicate that the City’s fleet is too large.
Recommendation Conduct a basic utilization review of the entire fleet to identify underutilized units, evaluate underutilized units, and evaluate alternative means of transportation that may be more economical, such as mileage reimbursement or vehicle pooling.

Fleet Management Efficiency Study Report for City of Santa Monica 4
OBSERVATIONS AND REC OMMENDATIONS Costs
18
Observation The City’s financial and fleet charge-back system does not recoup its full operating costs or encourage fleet customers to modify their behavior to minimize fleet size and maximize efficiency.
Recommendation Develop and implement a more comprehensive and accountable charge-back system that incorporates fleet replacement, overhead, and all operational costs for each department’s fleet units.
19 Observation The City utilizes relatively short-term projections of fleet costs, which may not
provide enough information to adequately anticipate future replacement costs.
Recommendation Develop a 15 to 20-year long-range fleet replacement financial plan to determine future costs and reserve adequacy.
20
Observation Fleet Management’s hourly shop rate, parts markup, and commercial markup are understated and exceed market rates.
Recommendation Recompute shop labor rates and markups for commercial and parts to reflect labor and overhead costs. Consider options to reduce rates such as outsourcing some repair services, outsourcing the parts function, and increasing mechanic productivity.
21
Observation Fleet Management does not levy a markup for fuel or a charge for administration and asset management.
Recommendation To align rates with best practice, develop a markup for fuel and an annual administrative and asset management charge for each fleet unit by appropriately allocating labor and overhead costs to these activities.
FLEET MANAGEMENT
22
Observation Policies relating to fleet cost control and charge-back management and performance measurement have not been developed.
Recommendation Establish a cross-functional Vehicle and Equipment Committee designed to develop comprehensive administrative policies for vehicles and equipment and address other fleet-related concerns.
23 Observation Fleet Management does not regularly solicit customer feedback.
Recommendation Develop and implement an annual customer survey to proactively identify opportunities for improvement and promote positive customer relations.
24 Observation Fleet Management applies one Service Level Agreement to all City departments.
Recommendation Develop a customized Service Level Agreement between Fleet Management and each of its City department customers to address their specific needs.
25 Observation Fleet Management performance metrics can be better leveraged to monitor and
improve operational performance.
Recommendation Establish and monitor additional performance measures to evaluate performance against industry and shop standards.

Fleet Management Efficiency Study Report for City of Santa Monica 5
OBSERVATIONS AND REC OMMENDATIONS
26 Observation City management and fleet customers do not have access to information related to
vehicle status and cost of maintenance and repairs.
Recommendation Develop monthly management reports detailing vehicle status and costs for the Public Works Director, the City Manager, and all fleet customer departments.

Fleet Management Efficiency Study Report for City of Santa Monica 6
I I . BACKGROUND, OBJECTIVES, SCOPE, AND METHODOLOGY
A. BACKGROUND The Fleet Management Division, located within the City of Santa Monica’s Public Works Department, is responsible for fleet administration, asset management, preventive maintenance, and repair work for all City vehicles. The City’s fleet contains 923 vehicles and pieces of equipment valued at approximately $50 million, most of which are operated by the City’s police, fire, and public works departments. All maintenance and repairs are performed at two separate facilities, one at the Corporate Yard Facility and another at the beach facility. The Big Blue Bus Company maintains their own fleet as well as the City’s fire apparatus.
A summary of the fleet is reflected in Table 1 below.
TABLE 1 . FLEET INVENTORY SUMMARY Vehicle/Equipment Type No. of Units
Law Enforcement Patrol 51
Sedans (including undercover units) 178
Pickups, Vans, and SUVs 250
Other Light-Duty Trucks (class 1-5) 135
Medium- and Heavy-Duty Trucks (class 6-8) 74
Motor Driven Construction Equipment (e.g., loaders, dozers, graders, pavers) 26
Miscellaneous Equipment (e.g., trailers, compressors, landscape equipment) 209
Total Fleet Units 923
B. SCOPE AND OBJECTIVES Periodically examining fleet assets and management is a best practice and generally consists of two components: (1) a fleet management assessment, and (2) a fleet utilization review. This study assesses Fleet Management operations and identifies opportunities for improvement. It is intended to provide the City with an overall review of Fleet Management with a specific focus on maintenance staff responsibilities, fleet policy, and use of performance metrics.
This study is not a financial audit. It is not intended to be an assessment of internal controls, compensation, or compliance with regulations, policies, or procedures.

Fleet Management Efficiency Study Report for City of Santa Monica 7
C. METHODOLOGY This study was conducted between January 2018 and March 2018. The study consisted of three phases, including: (1) fact finding, (2) analysis, and (3) reporting. During the fact-finding phase, interviews and walkthroughs were conducted with Fleet Management staff. A site visit of both fleet maintenance facilities was conducted to observe day-to-day operations, gather information, and assess existing equipment and tools. The City’s largest fleet customers, including Police, Public Landscape, Water, Resource Recovery & Recycling, and Facilities Maintenance, were interviewed to obtain a customer perspective of Fleet Management. In the analysis phase, Fleet Management’s operations, policies, and procedures were evaluated against best practices associated with highly efficient and effective fleet maintenance operations. Opportunities for improvements were identified and cost savings were estimated where applicable.
Additionally, an activity-based cost analysis was conducted. All fleet-related costs were identified and distributed across the major functions that are common to most fleet organizations. Using this information, a shop labor rate for the maintenance and repair function was calculated, as well as markups for parts procurement, sublet work, administration and asset management, and fueling. The shop labor rate was compared with local independent repair shops and dealerships and markups were benchmarked against industry standards.
In evaluating key elements of a fleet services organization, we use an analytical technique based on the Vehicle Statistical Referencing System (VSRS), which was introduced several decades ago by the US Air Force. This technique allows us to compare statistics from diverse fleets by converting vehicle and equipment types to their equivalent operation in terms of the level of effort required to maintain a standard passenger sedan—which is used as a baseline and given a value of 1.0 Vehicle Equivalent Units (VEUs). By statistically reducing a fleet to its equivalent in terms of sedans, we can make reasonable, standard-based comparisons with the fleet operations.

Fleet Management Efficiency Study Report for City of Santa Monica 8
I I I. FINDINGS AND RECOMMENDATIONS A. ORGANIZATION AND FACILITIES
VEHICLE MAINTENANCE BUILDING DESIGN
1 FINDING The Fleet Maintenance Building is outdated and has several design limitations that hinder the efficiency of maintenance and repair activities.
RECOMMENDATION Consider revising existing Fleet Maintenance Facility building plans to expand the size of repair bays, relocate welding bays, combine tire and parts storage, incorporate an office for supervisors, and potentially reduce the number of bays.
The Fleet Maintenance building (the Shop) is located in the City’s Corporation Yard at 2500 Michigan Ave. Fleet Management is responsible for maintaining all of the City’s 923 light-, medium- and heavy-duty units, with the exception of eight scrubbers that are maintained by the manufacturer. The Shop operates Monday through Friday from 6:00 a.m. to 5:30 p.m.
The fleet facility is approximately 70 years old and is comprised of 18 single bays. There are no drive-thru bays, making it difficult for large equipment to enter and exit the shop. There are no overhead reels containing transmission oil, engine oil, and lube grease located in any of the shop bays. As a result, mechanics must obtain oil and transmission fluids from barrels, which is very time consuming.
The Shop’s low ceiling height limits how high many heavy equipment units can be lifted to allow mechanics to stand while working. Consequently, much of the heavy equipment is serviced in the rear of the shop under an awning and mechanics are often forced to work on their back using floor dollies. Additionally, the Shop lacks a sufficient number of heavy-duty lifts, requiring Fleet Maintenance to send out some time-sensitive heavy-equipment repairs to commercial vendors.
A parts room is centrally located in the Shop; however, it is not large enough to accommodate the entire parts inventory. As a result, some parts are stored in a container located behind the Shop and tires are stored some distance from the parts area in an adjacent unsecured room. There is a tire repair area in the corner of this room where a tire changer and tire balancer machine are located. However, in our walkthroughs, we did not see any police patrol tires mounted and ready to be installed as needed.
There is a designated area alongside the Shop where City operators can clean their vehicles and equipment by means of a manual power-washer unit. It is unknown how many units are washed at this location on an annual basis. The City also has a contract with Bonus Car Wash located at 2800 Lincoln Blvd. in Santa Monica that charges wash fees of $14.00 for sedans and $16.00 for SUVs. Last year, City operators purchased a total of 461 washes from this vendor.
The shop does not have signage directing fleet customers to the service writer area or preventing foot traffic in repair areas. Crew leaders reported that about 70% of customers enter the shop area through the service bays rather than through the front door, in part due to insufficient parking at the front of the building. Consequently, customers have a tendency to approach mechanics rather than the appropriate

Fleet Management Efficiency Study Report for City of Santa Monica 9
office staff, interrupting the workflow process. Furthermore, it presents a liability issue when non-fleet personnel subject themselves to the numerous dangers inherent to repair shops.
A second maintenance facility was recently established at the beach at 1540 Appian Way. Two mechanics have been assigned to this location and are responsible for maintaining and repairing the 36 units located at the beach. It is open Monday through Friday from 6:30 a.m. to 4:30 p.m. There are plans to use this shop to maintain other City units located in the general vicinity such as those belonging to the Pier and the Promenade.
City management plans to remodel the entire Corporation Yard soon. We reviewed the design for the remodeled fleet shop and feel that it will solve most of the facility inadequacies identified in this report. However, there are several areas of the floor plan that warrant further consideration:
• The repair bays appear to be too small to accommodate vehicles and equipment as well as mechanic tool boxes, benches, etc. Light-duty bays should be at least 24-feet wide and heavy-equipment bays should be 32-feet wide. Ceiling height should be at least 30-feet high to service some of the heavy equipment when hoisted up.
• The welding bays should be alongside the western-most heavy-equipment bay as most welding is done on heavy equipment.
• The floor plan calls for a designated room for tire storage located at the south end of the shop, similar to the arrangement that currently exists. Under this arrangement, tires are not in a secure area like the parts inventory and no one is responsible for issuing them. The City should consider placing all tires within the secured parts room where storekeepers can issue the tires as needed. The planned size of the parts room should be able to accommodate the additional inventory.
• There should be an office incorporated in the area between the heavy-equipment bays and the light duty bays where the Fleet Maintenance Supervisors reside. The office can be shared and should have one window that looks out over the heavy-equipment bays and another that overlooks the light-duty bays.
• If a swing shift arrangement is adopted as recommended in this report (Recommendation #5), the number of bays in the floor plan can be reduced due to the smaller number of mechanics on the floor at any given time.
FLEET SOFTWARE
2 FINDING The fleet software is underutilized due to inadequate staff training and vendor support.
RECOMMENDATION Provide staff with formal system training and work with the software firm to discuss ways to optimize software utilization.
Currently, Fleet Management uses FleetWave, a fleet software system developed by Chevin Fleet Management Software. There are six workstations located on the shop floor, nine located in various offices, and two in the parts room. Customers have the ability to open work orders in the system, but have limited access to other information. Although Chevin has the capability to integrate with the City’s fuel system, this feature has not been implemented.
Fleet personnel reported that FleetWave is not user-friendly and that it is difficult to navigate from one screen to another. Most personnel also reported that they had not received any formal training and were

Fleet Management Efficiency Study Report for City of Santa Monica 10
either self-taught or learned how to operate the system from fellow employees. Personnel expressed that it is difficult to obtain service from Chevin. For example, calls to the company are not readily returned.
The dissatisfaction with Chevin likely stems from inadequate training on the software and limited vendor support. Service issues are a major concern and should be addressed with Chevin directly. Before exploring other fleet software systems, Fleet Management should attempt to rectify these issues with Chevin, including their ability to integrate with the City’s fuel system.
ALTERNATIVE FUEL VEHICLES AND EQUIPMENT
3 FINDING The City does an excellent job of utilizing alternative fuel vehicles and equipment, resulting in some cost savings.
RECOMMENDATION Continue to utilize alternative fuel vehicles and equipment where applicable.
The City of Santa Monica has done an exceptional job of incorporating alternative fuel vehicles into its fleet. There are 256 units that use Compressed Natural Gas (CNG) including the City’s fleet of refuse trucks and air sweepers. Another 16 vehicles utilized propane. In addition, there are 132 electric vehicles in the fleet and eight hybrid vehicles. All told, about 45% of the City’s fleet is comprised of alternative fuel vehicles and equipment.
The corporation yard includes a Compressed Natural Gas (CNG) system that supports 245 fleet units including many refuse and water department units. The system includes two slow-fill and one fast-fill units. Electric charging stations are also located at the corporation yard and at the downtown central garage. An above-the-ground propane tank is also located at the corporation yard. It is 25 years old and is used to fuel both 16 fleet units as well as many hand-held propane tanks.
Additionally, the corporation yard includes two 2,000-gallon unleaded fuel tanks and two 1,000-gallon diesel fuel tanks. Both types of fuel tanks are in-ground tanks that are more than 22 years old but are currently in compliance with federal and state regulations. Fleet customers who use this fuel facility record their transactions using the EJ Ward-FuelView automated fuel system that was installed in 2009. The City uses Veeder-Root as their fuel monitoring system. Plans for the new corporation yard include all new fueling equipment.
The Beach Facility has one diesel tank and one small propane tank. Both tanks are above-the-ground and are about 18 years old. Both are supported by the FuelView system.
The following table reflects the types, quantities, cost, and average price per gallon of fuel used in FY 16/17.
TABLE 2 . FUEL CONSUMPTION AND COSTS FOR F ISCAL YEAR 16 /17
Type Quantity Cost Average Price Per Gallon
Unleaded 71,126.9 $155,055.33 $2.17998
Diesel 24,461.1 $61,413.77 $2.51067

Fleet Management Efficiency Study Report for City of Santa Monica 11
TABLE 2 . FUEL CONSUMPTION AND COSTS FOR F ISCAL YEAR 16 /17
Type Quantity Cost Average Price Per Gallon
CNG 289,992.01 $204,415.71 $0.70490
Other – Propane 27,115.89 $37,669.43 $1.38920
Current prices for all fuel types have risen sharply compared to the average prices paid in F16/17 as reflected in the following table.
TABLE 3 . AVERAGE FY 16 /17 FUEL PRICE PER GALLON COMPARED TO 2018 CURRENT FUEL PRICES
Type Quantity Average Price Per Gallon FY
16/17
Current Price Per Gallon (Feb
2018) Percent
difference
Unleaded 71,126.9 $2.17998 $2.53730 16%
Diesel 24,461.1 $2.51067 $3.43430 37%
CNG 289,992.01 $0.70490 $0.60202 -15%
Other – Propane 27,115.89 $1.38920 $1.6200 17%
As reflected in Table 3 above, while the average price of unleaded, diesel, and propane fuel have drastically increased between 16% and 37% since last year, CNG prices, on the other hand, have decreased by approximately 15%. The City should be proud of its commitment to use alternative fuels both now and in future years.
ELECTRIC VEHICLE CHARGING FACILITIES Currently, the City’s fleet consists of approximately 99 electric vehicles that are domiciled in 12 different locations throughout the City. There are currently four charging locations with 29 charging ports available to City employees to charge their vehicles. A fifth charging station is under construction at the Civic Center Parking Structure. It will consist of 15 dual charging ports and one single charging port allowing for a total of 31 additional dedicated charging ports available to City fleet vehicles. There are currently 32 electric vehicles domiciled in this location, including two vehicles in the Civic Auditorium surface lot, that these charging units will support.
According to the Office of Sustainability and the Environment (OSC), another charging station is due to be constructed next month at the City’s main library. The station will consist of 12 charging ports available for both public and City fleet use during certain hours.
Eventually, there will be six charging stations with 72 ports available to support 99 city-owned electric vehicles. The ratio of charging ports to electric vehicles is just shy of 1:1 which is quite remarkable given that the national average is 1:25 (includes both privately-owned and government-owned vehicles).
All six charging station locations and the number of charging ports attached to each station are listed in Table 4 below.

Fleet Management Efficiency Study Report for City of Santa Monica 12
TABLE 4 . ELECTRIC VEHICLE CHARGING STATIONS & PORTS
Charging Station Location No. of Charging Ports
City Yard 10
Colorado Yard 15
Arcadia 2
Airport 2
Civic Center Parking Structure (currently under construction) 31
Library (planned construction to begin in June 2018) 12
Total 72
According to Fleet Maintenance, there are plans to convert about 77 gasoline-powered units to electric vehicles in the near future. This correlates with the City’s goal of having 300 electric vehicles by the year 2020. This will require an assessment of the adequacy of the charging stations required to support this fleet as the City acquires these types of vehicles.
COMPRESSED NATURAL GAS FACILITIES Most of the 256 CNG vehicles and equipment in the fleet fuel at the City Yard Facility. There are 26 slow fuel stations that are primarily used by 57 refuse trucks and sweepers and two fast fuel stations used by the rest of the CNG fleet. There is also a CNG station at the Big Blue Bus Company facility that can be used.
Currently, the renovation plans for the new City Yard include the replacement of all fueling equipment. This includes the CNG facility and fueling stations as well as all unleaded, diesel, and propane fueling equipment.
B. SERVICE DELIVERY
MAINTENANCE AND REPAIR PROGRAM
PREVENTIVE MAINTENANCE VS. REPAIR WORK
4 FINDING According to industry standards, mechanics complete too much unscheduled repair work and not enough scheduled preventive maintenance.
RECOMMENDATION Review unscheduled repairs on a regular basis to identify trends in system failures and proactively design a preventive maintenance program accordingly.

Fleet Management Efficiency Study Report for City of Santa Monica 13
The centerpiece of any vehicle maintenance program is its preventive maintenance program. A good preventive maintenance program should minimize breakdowns and unscheduled repairs, allowing for vehicles and equipment to remain in service without interrupting the daily tasks of customers.
According to industry standards, municipal Fleet Management operations should spend 55% to 60% of its time on preventive maintenance (PMs) and 40% to 45% on repairs. According to data supplied by Fleet Management, the current ratio of scheduled preventive maintenance work to unscheduled repair work is 34.83% PMs to 65.17% unscheduled repairs, which is suboptimal.
Fleet Management should review its unscheduled repairs to identify trends pertaining to such things as brakes, cooling, and charging system failures and then try to determine the reason(s) for the failures. This analysis will help inform appropriate actions to prevent a reoccurrence of failures. Failures may be caused by several factors including part defects, improper repair methods, lack of mechanic training, operator misuse, or items not identified during a preventive maintenance service. For example, one best practice not currently employed by the City of Santa Monica is determining the optimal intervals to change oil for heavy equipment by using an oil-sampling program. As the City identifies repair trends, additional best practices should also be implemented.
PREVENTIVE MAINTENANCE SCHEDULING
5 FINDING Fleet Management does not adequately plan for preventative maintenance services and there is currently a backlog.
RECOMMENDATION Plan and schedule the preventive maintenance workload for the entire year to support optimally efficient Fleet Management operations and improve customer relations. Consider adding a swing shift to further increase operational efficiency and customer responsiveness.
The fleet software that Fleet Management uses (Chevin’s FleetWave) generates a weekly report identifying vehicles and equipment that are due and past due for a PM/inspection. Based on the information in this report, Fleet Management notifies customers when their units are due for servicing. However, the existing notification process only provides customers with a notice one week in advance, which does not give them sufficient time to plan and adjust their operations to accommodate missing fleet units. Fleet Management has the capability to schedule unit maintenance farther in advance using the FleetWave software system.
Contrary to industry standards, Fleet Management does not plan a yearly preventive maintenance and inspection workload. Mapping out a full year’s scheduled maintenance allows the Division to identify peaks and valleys in the number of services coming due and make adjustments to scheduling and/or staffing accordingly. It can also be used to determine the number and types of parts needed to support the servicing to ensure inventory is properly maintained.
As of February 2018, 76 units, representing 18% of the fleet, were past due for preventive maintenance. Additionally, five Biannual Inspection Terminal (BIT) inspections were also past due.
A fleet staff of this size should consider adding a swing shift to increase operational efficiency. Most well-run fleets of this size utilize a swing shift and some even work on Saturdays. A best fleet practice is to perform preventive maintenance servicing when vehicles and equipment are not being used, usually during the day. In this way, fleet customers can rely on having their fleet units available when they are needed most. For example, refuse trucks usually finish their routes early in the afternoon, leaving only a

Fleet Management Efficiency Study Report for City of Santa Monica 14
few hours for Fleet Management to work on them before the shop closes. By employing a swing shift, more hours would be available to work on these trucks which might reduce the number of spare units required to support the fleet. Similar efficiency gains would also be realized for other types of vehicles that are often using during the day.
METER READINGS
6 FINDING Fleet Management does not collect mileage and hour data, which is typically used to determine when a vehicle or piece of equipment is due for preventive maintenance servicing.
RECOMMENDATION Begin to collect meter readings on all fleet units and reengineer the preventive maintenance program based on a combination of miles/hour and time standards.
Fleet Management does not collect fleet mileage and hour data. Fleet staff report that the fuel software system is not capable of interfacing with the fleet software system, which is highly unusual. Mileage and hour data is recorded only when a vehicle or piece of equipment is in for servicing. The absence of collecting mileage and hour readings on a regular basis, either through the fueling process or by a manual process, is most unusual.
Meter readings are typically used to track when a vehicle or piece of equipment is due for preventive maintenance servicing. Additionally, meter readings are used in conjunction with fuel data to compute miles or hours per gallon. This in turn can signify whether or not an engine is attaining its optimum miles/hours per gallon according to manufacture specifications or if the unit falls outside the average miles/hours per gallon of all units in its class.
Fleet Management’s preventive maintenance program is primarily based on a time basis rather than on a mileage or hour basis, which may be due to the absence of mileage and hour data. This practice is atypical in the fleet industry. Manufacturer recommended oil servicing, for example, is based primarily on miles/hours criteria. One of the dangers of using a time-based program is that a vehicle or piece of equipment might exceed its manufacturer recommended mileage/hour threshold prior to its scheduled service, particularly if the vehicle is used extensively. This delay in maintenance could lead to more expensive repairs if not caught in a timely manner.
Most well-run fleet operations will use both a time and miles/hour standard to determine when a vehicle or piece of equipment is due for servicing. The regular collection of meter readings is a vital component of any fleet operation. Fleet Management should make every effort to find a means to regularly collect miles and hours either through its fuel system or by requesting monthly meter reading reports from user departments.

Fleet Management Efficiency Study Report for City of Santa Monica 15
PREVENTIVE MAINTENANCE CHECKLIST
7 FINDING Preventive maintenance checklists do not consistently include progressive services and additional actions taken by mechanics.
RECOMMENDATION Expand preventive maintenance checklists to include all appropriate recording of data and actions taken, and ensure mechanics complete checklists in real time.
The City follows industry best practice by using separate checklists for various vehicle and equipment classes that closely resemble manufacturer service recommendations. However, only a few pieces of equipment belonging to Refuse (backhoes, sweepers, and loaders) have checklists that contain multiple echelons of progressive services (e.g., A-Service, B-Service, C-Service, and D-Service). Fleet Management staff report that they are currently in the process of developing checklists with progressive services for the rest of the fleet classes.
The current checklists also lack a designated area to record what actions were taken by the mechanic conducting the PM. Typically, there is a space correlated with each system where the mechanic can indicate if the item was repaired, replaced, or adjusted.
EQUIPMENT REPAIR REQUEST FORM
8 FINDING The Equipment Repair Request Form does not include important timeline information that is typically used to track Fleet Management performance.
RECOMMENDATION Redesign the Equipment Repair Request Form to capture the time reported, estimated time to repair, and actual completed time. Evaluate differences between anticipated return times and actual return times to evaluate Fleet Management performance.
Fleet Management requires customers to fill out a Vehicle/Equipment Service Request form when reporting vehicle and equipment malfunctions. However, the form is missing several important elements that should be captured. For example, it does not include the time the unit was reported to Fleet Management, the estimated repair time, and the actual time until the unit was available to be picked up. The anticipated repair time compared to the actual repair time required for the unit to be released is a standard fleet performance measure that is typically tracked and monitored by well-run fleet operations.
A typical request form usually includes a list of vehicle systems (i.e., air conditioning, electrical, brakes) that the driver can easily put a check next to, indicating the system on the vehicle that is not working properly, as well as an area for operator comments. A copy of the completed form should be given to the driver for their department to track as well.

Fleet Management Efficiency Study Report for City of Santa Monica 16
REPEAT REPAIRS
9 FINDING Fleet Management does not track occurrences of repeat repairs (comebacks), making it difficult to evaluate the quality of completed repair work.
RECOMMENDATION Monitor and analyze repeat repairs to identify trends and proactively address causes such as part failure, repair techniques, or training.
Repeat repairs, commonly referred to as comebacks, occur when work has to be redone because the issue was not correctly resolved in the first repair. The City does not track comebacks, making it difficult to ascertain the quality of repair work being performed.
According to industry standards, repeat repairs should comprise 2% or less of all tasks. Fleet Management should begin tracking the number and types of comebacks that occur to identify trends of reoccurring system breakdowns. Using this information, Fleet Management should conduct an analysis to determine the causes (i.e., reoccurring part failure, improper repair technique, driver error, or lack of training on the part of the mechanic) of the comebacks. By addressing the causes of the comebacks, Fleet Management can reduce the number of repeat repairs, increasing its operational efficiency.
PARTS PROGRAM
INVENTORY CONTROL
10 FINDING Fleet Management does not have a formal inventory monitoring system in place and has not completed a parts inventory since 2013.
RECOMMENDATION Adopt a formal inventory monitoring system, including bar coding parts to track inventory levels. In collaboration with the City’s Finance Department, conduct an annual parts audit.
Inventory control involves the tracking and physical control of parts from the point of receipt through consumption. This process is important for controlling theft and damage to inventory items. Control of physical access, and the methods used to replenish and disperse these items ensure that their consumption is accounted for properly. Efficient parts supply processes allow mechanics to focus on maintaining and repairing vehicles by putting parts in their hands with minimal disruption. This, in turn, reduces turnaround time and costs, and increases mechanic productivity.
Currently, two fleet storekeepers are responsible for ordering, receiving, and issuing parts for both Vehicle Management shops. One storekeeper works from 6:30 a.m. to 4:00 p.m. The other storekeeper works from 8:00 a.m. to 5:30 p.m. The ratio of storekeepers to mechanics meets industry standards. Mechanics will obtain parts when neither storekeeper is present.
Storekeepers report that inventory levels are monitored by visual means. Typically, parts inventories are tracked via the fleet software system with established minimum and maximum criteria. Additionally, parts are not bar-coded, a feature that helps eliminate human error and reduce time and labor by replacing manual methods of data collection and entry.

Fleet Management Efficiency Study Report for City of Santa Monica 17
According to data supplied by Fleet Management, the current parts inventory value is unknown because no inventory has taken place since September 2013. The value at that time was $297,640.36. Most fleet agencies of comparable size undergo an annual parts audit that is performed by a third party, such as Finance or Central Purchasing, in collaboration with parts personnel. The City of Santa Monica does not adhere to this best practice. Instead, parts have historically been inventoried with fleet personnel.
COMMERCIAL REPAIR WORK PROGRAM
REPAIR SERVICES PROCUREMENT
11 FINDING Fleet Management lacks key performance measures in repair service contracts and a method to monitor these measures.
RECOMMENDATION Where applicable, reissue RFPs and award contracts for fleet repair services to local vendors with set prices, delivery criteria, turnaround times, and warranties. Implement a process to monitor and track defined performance measures.
The City has various formal contracts in place with vendors who provide repair work services. However, these contracts lack key performance measures such as warranties, guaranteed turnaround times, and pickup and delivery of fleet units. Additionally, Fleet Management should establish a way of monitoring these performance measures. For example, the RFQ issued by the City for towing services in 2014 indicates the need for a 30-minute response time but there is no mechanism in place to track when the call for service was placed and when the towing operator arrived at the scene.
CONTRACTED REPAIRS
12 FINDING In comparison to industry standards, Fleet Management contracts a lower percentage of operational costs to commercial vendors that complete some services more economically.
RECOMMENDATION Assess what fleet services could be performed more economically by commercial vendors.
For the most part, Fleet Management contracts out for services that are more economically done by outside vendors. This work includes glass repair and upholstery, painting, aerial tower inspections, hydraulic cylinder repairs, and wheel alignments.
In FY 17/18, Fleet Management budgeted $548,421 for maintenance and repair work performed by commercial vendors. This represents 8% of total operational costs and is lower than the 10-15% industry benchmark range for a fleet this size. Fleet Management should review the costs of the services it performs in-house and determine if some of those services (i.e., transmission repairs, engine overhauls, smog tests, upfitting) could be performed more economically by commercial repair shops.

Fleet Management Efficiency Study Report for City of Santa Monica 18
C. STAFFING AND WORKLOAD The Fleet Maintenance Superintendent is responsible for overseeing the Fleet Maintenance Division, consisting of 28 full-time positions. He reports directly to the Street and Fleet Services Manager. Two Fleet Maintenance Supervisors report to the Fleet Maintenance Superintendent as do the Staff Assistant II and the Administrative Analyst position that is currently vacant.
One Fleet Maintenance Supervisor is responsible for overseeing the heavy equipment team, consisting of one Senior Mechanic, seven Mechanic IIs, one Mechanic I, and the Welder Fabricator. The second Fleet Maintenance Supervisor oversees one Senior Mechanic, seven Mechanic IIs, two Mechanic Is, a Trades Intern, a Fleet Services Writer, one Fleet Storekeeper, and one Storekeeper I. The Supervisor to Mechanic ratios are appropriate according to industry standards and we see no need to change the Senior Mechanic positions.
The Administrative Analyst position assigned to Fleet Maintenance is currently vacant. This position supports the division by providing budget support, maintaining databases, billing departments for maintenance and fuel, applying for grants, conducting studies, tracking regulations and laws pertaining to fleet applications, etc. A Senior Administrative Analyst in the Streets and Fleet Services Division oversees the work performed by this position as well as work performed by another Administrative Analyst assigned to Streets.
The Staff Assistant III assigned to Fleet Maintenance is responsible for clerical-type duties that include filing and maintaining records, processing warrants and payment of invoices, data entry, reviewing time cards, DMV registrations, etc.
We believe that many of the duties performed by the Administrative Analyst can easily be accomplished by a Staff Assistant or Data Entry person, particularly in the areas of maintaining databases and billing for parts, fuel, labor, and fleet acquisitions. The tasks relating to budget, grant applications, and other special studies should be part of the responsibility of the Senior Administrative Analyst.
By filling the vacant Administrative Analyst with a lessor-paid position such as a Staff Assistant, Fleet Maintenance should be able to bring the administrative/asset management charge, as calculated later in the report, more in-line with industry standards.
MECHANIC WORKLOAD
13 FINDING Mechanic productivity falls below industry standards and overall staffing levels slightly exceed calculated staffing requirements.
RECOMMENDATION Increase mechanic productivity by analyzing non-wrenching hours and potentially distributing those tasks to other fleet employees.
The number of mechanics required for a maintenance and repair operation is primarily driven by the size, condition, and composition of the fleet. Because most public fleet operations maintain a wide variety of vehicles and equipment, the industry has established a relative measure that allows for the evaluation and comparison of staffing needs. A vehicle equivalent unit (VEU) calculation is used to equate the level of effort required to maintain dissimilar types of vehicles and equipment to a passenger car, which is given a baseline value of 1.0. Based on experience with other public fleets, a VEU of 1.0 is equal to between 12 and

Fleet Management Efficiency Study Report for City of Santa Monica 19
15 annual maintenance labor hours, depending on a variety of factors unique to each agency. All other types of vehicles are allocated a value relative to the value of a passenger car. For example, a patrol car requires 2.5 times the annual maintenance and repair of a passenger car, or 30 to 37.5 hours per year.
To determine the City’s staffing needs, we assigned a VEU to each fleet vehicle and piece of equipment. The VEUs were totaled and multiplied by 12 hours and 15 hours to provide a range of total annual hours required to maintain the fleet. This range was divided by the average annual wrenching hours of a mechanic as calculated in the “Activity-Based Cost Analysis” (See Attachment 1-Exhibit 3), taking into account the time all employees spend wrenching and removing time for leave and other non-wrenching tasks (i.e., parts pickup and delivery, transporting commercial repair work to vendors, meetings, and training). The result is the number of FTE’s required to maintain the fleet. These are discussed in more detail as follows.
We assigned a VEU value to all 923 fleet units maintained by Fleet Management and arrived at 1,520 VEUs. When this total was multiplied by the benchmark annual maintenance requirement of 12 to 15 hours per unit, it equates to between 18,241 and 22,801 annual hours of required maintenance. When this range of hours is divided by the average annual wrenching hours of a mechanic, calculated at 1,143 hours (53.06%), we were able to determine the staffing requirement as between 15.96 and 19.95 wrenching personnel. We estimate that the number of required wrenching personnel would fall near the top of this range at 19.55 FTEs based on the types and condition of the fleet units.
National government fleet surveys suggest that productive time for average-to-well-managed public sector fleets ranges from 70% to 75%. Some government fleets achieve 75% to 80%; in the private sector this number is estimated to be 80% to 85%. Fleet Management’s average mechanic productivity rate was calculated at 53.06%, which falls well below the average-to-well managed public fleet range.
We calculated staffing requirements to maintain all 923 units in the City’s fleet and compared them with existing staffing levels. The comparison of existing staffing levels to computed staffing levels based on VEUs is shown in Table 4.
TABLE 4 . COMPARISON OF CURRENT STAFF ING LEVELS VERSUS VEU CALCULATED STAFF ING LEVELS
No. of Units Annual Hours
Workload Range
No. of Calculated
FTEs
Recommended No. of
Wrenching FTEs
Current No. of Wrenching
FTEs Difference
923 18,241-22,801 15.96-19.95 19.55 20.55 +1.00
Fleet Management’s current staffing of 20.55 FTEs slightly exceeds the recommended staffing of 19.55 FTEs by 1.00 FTE. This additional FTE may be partially justified by the amount of work performed in-house that might otherwise be contracted out and the support required to help maintain an aging fleet.
If Fleet Management increases the wrenching productivity of its mechanics to 65%, it may be able to support the current workload with fewer mechanics. To maximize productivity, Fleet Management should track, over a six-month period, non-wrenching hours that fleet staff spend obtaining parts, shuttling units between commercial vendors, and performing other non-wrenching tasks. This data will help the City to determine the number of part-time employees required to perform these types of tasks. The addition of

Fleet Management Efficiency Study Report for City of Santa Monica 20
some part-time employees to offset the hours mechanics spend on these tasks will ultimately increase the number of wrenching hours and bring the staffing levels in-line with recommended levels.
TRAINING
14 FINDING Fleet Management’s limited training budget does not permit regular mechanic training opportunities.
RECOMMENDATION In accordance with industry standards, increase the training budget to provide sufficient training opportunities for all mechanics to remain abreast of vehicle, equipment, and maintenance advancements.
Fleet Management’s mechanics have fewer ASE certifications than typical mechanics maintaining fleets of a similar size and composition. Fleet personnel that maintain and repair vehicles and equipment have earned only 40 ASE certifications between the 20 mechanics. Typically, we find that mechanics will have anywhere from 3-7 ASE certifications. In FY 17/18, Fleet Management’s budget earmarked only $18,000 for training purposes. A common industry practice recommends that 2% of a mechanic’s annual salary and benefits (approximately $2,500 based on the average annual salary and benefits of a Santa Monica mechanic) be budgeted for training (or about 40 hours per year). Very little training has been offered to mechanics that work on CNG vehicles and equipment.
Investment in a robust training program promotes and rewards mechanics for attaining ASE certifications, enabling them to keep abreast of modern maintenance techniques. It should also make Fleet Management less dependent on certain types of work requiring commercial repair vendors.
D. PROCUREMENT, FUNDING, AND UTILIZATION
FLEET REPLACEMENT PLANNING
15 FINDING The City relies on short-term fleet replacement planning and does not incorporate miles or hours data in its replacement criteria.
RECOMMENDATION Develop a long-range fleet replacement plan, revise the replacement policy to include miles and hours data, and reevaluate replacement intervals accordingly.
The purpose of a long-range fleet replacement plan is to identify long-term spending needs and associated budgetary requirements. Santa Monica does not have a long-range fleet replacement plan that projects future costs of replacing vehicles and equipment over a 15-20 year period. Instead, the City relies on 5-7 year projections. This projection may be suitable for the short-term, but does not give a complete picture of long-term replacement costs, especially because most fleet units have life cycles ranging from 10-15 years.
Typically, public agencies establish replacement criteria that take years in service, miles, and/or hours driven into consideration. In accordance with best practice, the City has a written policy that establishes replacement criteria for vehicles and equipment. However, Fleet Management’s replacement policy states

Fleet Management Efficiency Study Report for City of Santa Monica 21
that heavy-duty trucks and equipment should be replaced between 15 and 20 years and does not include miles or hour meter criteria. As a result, the City may be keeping certain fleet units beyond their optimal life cycle, spending additional money on repairs, and experiencing more time out of service for these older vehicles.
Table 5 compares current and recommended replacement intervals, where applicable, for each class of vehicle and equipment class, or groups of vehicles that share a common use. While the City’s yearly intervals compare favorably with commonly used yearly intervals, the City lacks miles and hours criteria. Using best practice data applied to the City’s current fleet, Table 5 presents the recommended replacement intervals for vehicles and equipment.
TABLE 5 . CURRENT AND RECOMMENDED VEHICLE AND EQUIPMENT REPLACEMENT INTERVALS
Vehicle/Equipment Type
Current Replacement Intervals
Recommended Replacement Intervals
Years Miles/Hours of Use Years Miles/Hours of Use
Sedans/Vans/SUVs 12 n/a 12 100,000 miles
Light/Medium-Duty Trucks 10 n/a 10 100,000 miles
Police Patrol Units 4 n/a 4 100,000 miles
Heavy Duty Trucks1 12 n/a 12 100,000 miles
Construction Equipment 7-10 n/a 12-15 5,000 to 6,000 hours
Refuse Collection Trucks, Sweepers 7 n/a 7 n/a
1 Non-diesel trucks
As reflected in Table 6, 132 units, comprising 17.4% of the fleet, are 15 years or older. However, according to Fleet Management, there are 353 units overdue for replacement. This figure includes 165 miscellaneous, non-motorized, small equipment units that are not reflected in this table. While the City has replaced a number of fleet units over the past several years, keeping pace with the backlog of units in need of replacement has been an on-going challenge. According to Fleet Management, the City’s purchasing and legal review procedures are lengthy and affect when RFQs can be advertised. Obtaining certification from the Southern California Air Resource Board to purchase certain vehicles and equipment has also had an impact on the timely acquisition process. This delay in acquiring vehicles and equipment places a burden on Fleet Management to maintain units beyond their typical life cycle.
TABLE 6 . FLEET AGE
Fleet Age Number of Units* Percent
5 Years or Less 231 30.5%
5 to 10 Years 272 35.9%
10 to 15 Years 123 16.2%

Fleet Management Efficiency Study Report for City of Santa Monica 22
TABLE 6 . FLEET AGE
Fleet Age Number of Units* Percent
15 to 20 Years 111 14.6%
Over 20 Years Old 21 2.8%
Total 758 100%
*Does not include miscellaneous, non-motorized, or small equipment.
OPTIMAL REPLACEMENT POINT
16 FINDING The criteria for identifying vehicles and equipment past the optimum economic life point does not take into account several key factors.
RECOMMENDATION Adopt a methodology to support the replacement of vehicles and equipment based on the “optimum economic life point” of a unit. Expand criteria to include age, miles/hours, maintenance/repair costs, condition, reliability, and downtime.
Public agencies typically use criteria including age, mileage, hours of operation, condition, historical maintenance costs, and downtime to identify vehicles and equipment that need to be replaced. Santa Monica’s Fleet Management assesses age, mileage, cost per mile, and the general condition of the unit. Downtime and other elements that can play a significant role in determining whether vehicles require replacement are not included. Other influencing elements include quality of the preventive maintenance program, safety, fuel usage, driver skill level, components used, parts availability, and new technology.
Many fleet agencies use a weighted point system that takes into account a variety of factors to help establish potential candidates for replacement. This “replacement scoring system” typically applies to light-duty vehicles and takes into account a unit’s age, mileage, maintenance, and repair costs, overall condition, reliability, and downtime. Points are assigned to each set of criteria as illustrated below.
• Age: One point for each year of chronological age, based on in-service date.
• Miles/Hours: One point for each 10,000 miles or 750 hours of service.
• Maintenance/Repair Costs: A five-point scale is used, with 1 being excellent and 5 being poor, based on total life-to-date maintenance and repair costs (not including accident damage repairs) as a percentage of the vehicle’s original purchase price. For example, a vehicle whose total maintenance and repair costs equal the unit’s original purchase price would receive a score of 5 while a unit whose maintenance and repair costs equal 20% of the vehicle’s original purchase price would receive a score of 1.
• Condition: This category takes into account a unit’s body condition, interior condition, accident history, rust, and anticipated repairs. A five-point scale is used with 1 being excellent and 5 being poor condition.
• Reliability: Operators assigned to the vehicle are typically asked to assess the reliability of the various components, systems, and equipment of each vehicle. A five-point scale is used with 1 being excellent and 5 being poor. Another means to measure reliability is to assign 1, 3, or 5 points depending on the frequency the unit is in for repair. A rating of 5 would be assigned to a vehicle that is in the shop two
Fleet Management Efficiency Study Report for City of Santa Monica 23
or more times per month on average, while 1 point would be assigned to a vehicle in the shop an average of once every three months or less.
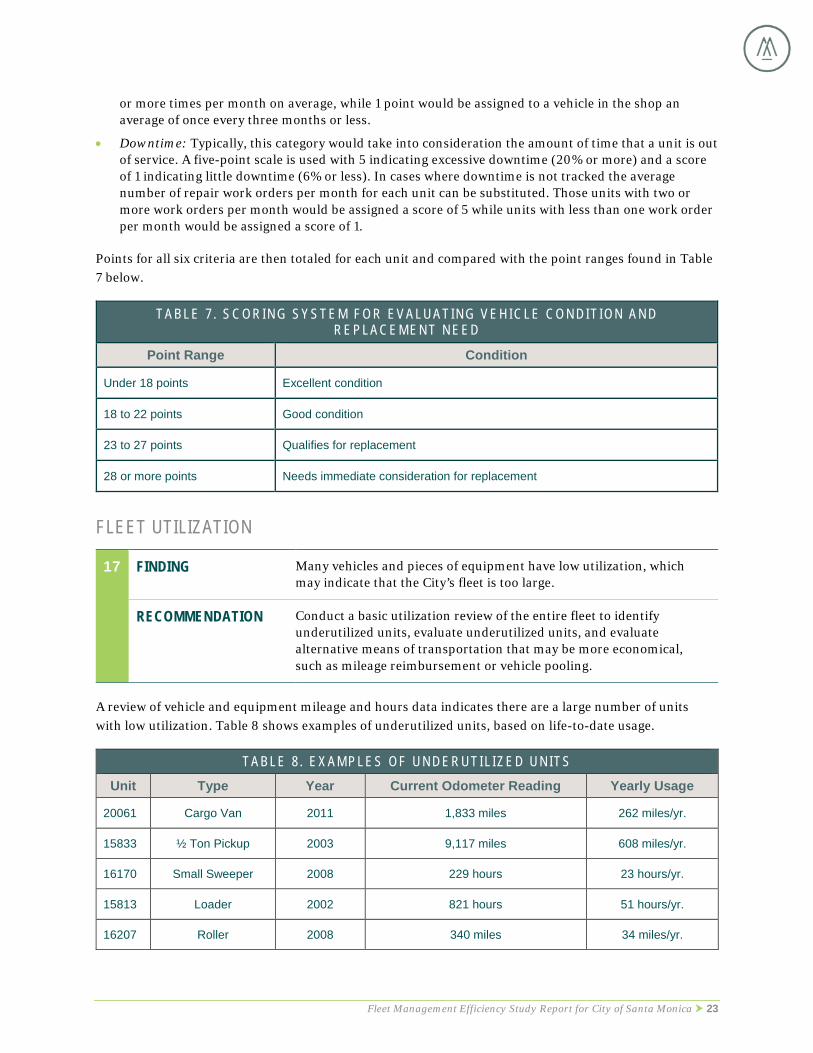
• Downtime: Typically, this category would take into consideration the amount of time that a unit is out of service. A five-point scale is used with 5 indicating excessive downtime (20% or more) and a score of 1 indicating little downtime (6% or less). In cases where downtime is not tracked the average number of repair work orders per month for each unit can be substituted. Those units with two or more work orders per month would be assigned a score of 5 while units with less than one work order per month would be assigned a score of 1.
Points for all six criteria are then totaled for each unit and compared with the point ranges found in Table 7 below.
TABLE 7 . SCORING SYSTEM FOR EVALUATING VEHICLE CONDIT ION AND REPLACEMENT NEED
Point Range Condition
Under 18 points Excellent condition
18 to 22 points Good condition
23 to 27 points Qualifies for replacement
28 or more points Needs immediate consideration for replacement
FLEET UTILIZATION
17 FINDING Many vehicles and pieces of equipment have low utilization, which may indicate that the City’s fleet is too large.
RECOMMENDATION Conduct a basic utilization review of the entire fleet to identify underutilized units, evaluate underutilized units, and evaluate alternative means of transportation that may be more economical, such as mileage reimbursement or vehicle pooling.
A review of vehicle and equipment mileage and hours data indicates there are a large number of units with low utilization. Table 8 shows examples of underutilized units, based on life-to-date usage.
TABLE 8 . EXAMPLES OF UNDERUTI L IZED UNITS Unit Type Year Current Odometer Reading Yearly Usage
20061 Cargo Van 2011 1,833 miles 262 miles/yr.
15833 ½ Ton Pickup 2003 9,117 miles 608 miles/yr.
16170 Small Sweeper 2008 229 hours 23 hours/yr.
15813 Loader 2002 821 hours 51 hours/yr.
16207 Roller 2008 340 miles 34 miles/yr.

Fleet Management Efficiency Study Report for City of Santa Monica 24
TABLE 8 . EXAMPLES OF UNDERUTI L IZED UNITS Unit Type Year Current Odometer Reading Yearly Usage
15439 Dump Truck 1999 7,002 miles 368 miles/yr.
Low utilization often indicates there are more vehicles and pieces of equipment in the fleet than are needed. In many cases, vehicles and equipment with low utilization were not released when they were replaced, but rather have stayed in service with limited or no use. This practice contributes to fleet growth over time and is referred to in the industry as “fleet creep.” Low utilization might also occur because low mileage units are not being rotated with higher use units.
It is unclear when a fleet utilization study was last performed or when the last physical inventory of fleet units was conducted. Therefore, it is highly probable that the City’s fleet may be “over fleeted” and underutilized. In interviews, most fleet customers admitted that there are probably a number of units in their departments that are underutilized. The objective of a utilization study is not only to identify underutilized units, but also to offer alternative means of transportation, such as mileage reimbursement, downsizing to less expensive and more economical units, centralized and departmental pooling, sharing equipment with other public agencies, leasing equipment, and the use of commercial car rental companies. The use of hybrid or electric vehicles can also be evaluated in a fleet utilization study.
It is important to note that if fleet size is reduced, the City’s operating services are not adversely impacted. Typically, a fleet that has not been subjected to close utilization scrutiny can be downsized 5% to 15%. The benefits to be derived from such a study include:
• A reduction in the size of the fleet;
• One-time income generated with the sale of surplus vehicles and equipment; and
• Ongoing savings in the annual operating costs associated with the surplus units.
E. COSTS
CHARGE-BACK RATES
18 FINDING The City’s financial and fleet charge-back system does not recoup its full operating costs or encourage fleet customers to modify their behavior to minimize fleet size and maximize efficiency.
RECOMMENDATION Develop and implement a more comprehensive and accountable charge-back system that incorporates fleet replacement, overhead, and all operational costs for each department’s fleet units.
Fleet Management budgeted costs are intended to be fully recouped through charges to City departments. However, in each of the past three years, the operational expenses relating to Fleet Management exceeded the amount budgeted in department budgets. Expenses exceeded revenues by $395,359 in FY 14/15, by $604,187 in FY 15/16 and by $766,833 in FY16/17. This is mainly attributable to the process Fleet Management uses to calculate its operational costs, which fleet customers, in turn, use for budgeting purposes.

Fleet Management Efficiency Study Report for City of Santa Monica 25
Each year during the budget process, Fleet Management calculates the total operational costs (i.e., services and supplies, labor, parts, fuel & commercial work) for all vehicles and equipment and provides each department with a total cost for their upcoming year’s budget. These costs are based on previous years’ operational costs, not the current year’s costs, because budget preparation takes place six months prior to the end of the fiscal year. As a result, the costs to support a vehicle in the following year are based on historical costs that are two years old, which makes it difficult to balance expenses with revenues. Additionally, under this process, fleet customers continue to pay for a vehicle’s maintenance several years after the unit has been surplused.
Fleet Management does not request any utilization information, such as changes in the number of miles or driving hours anticipated, from departments during the budget process. This information should be requested because it has implications on the workload and costs of the fleet operation. Additionally, fleet customers should be made aware of the maintenance and replacement costs for each of their fleet units. Fleet Management tracks these costs but does not share them unless a customer requests it. When costs are identified and visible to the customer, they tend to economize.
As indicated above, there should be a more accurate way to forecast fleet operational costs for budgetary purposes. Public agencies utilize various charge-back structures to recoup their fleet costs. One structure that has helped control fleet size is a three-tiered system that incorporates: (1) a monthly flat fee that recoups the replacement costs over the life of the unit; (2) a standing or flat fee that captures the administrative overhead cost of the unit; and (3) a direct charge or cost per mile rate that recovers the operational costs of the unit (e.g., costs associated with fuel, parts, tires and labor).
The purpose of a charge-back rate system is to recover the ownership and operational costs of vehicles and equipment. A properly designed charge-back rate system should recoup and differentiate among the actual costs of goods and services, such as maintenance and repair, fuel, and parts and commercial repair work services provided by the fleet organization. The charge-back rate system should promote the equitable treatment of fleet customers based on the concept that they should pay only for the resources they consume, with no cross-subsidization of fleet costs and no subsidies from the General Fund.
FUNDING VEHICLE REPLACEMENT
19 FINDING The City utilizes relatively short-term projections of fleet costs, which may not provide enough information to adequately anticipate future replacement costs.
RECOMMENDATION Develop a 15 to 20-year long-range fleet replacement financial plan to determine future costs and reserve adequacy.
Currently, the City uses a fleet reserve fund and a charge-back system in which cash reserves are accumulated in a revolving sinking fund (Fund 54) to ensure that funds are available to purchase vehicles when they have reached the end of their useful life. Under this system, fleet customers are annually charged for a prorated portion of each vehicle’s replacement cost. These funds are then put into the sinking fund designed to offset the future cost of a replacement vehicle. The City’s replacement fund has a total fund balance of approximately $23.4M. The only fleet units not included in the replacement funds are those costing $10,000 or less. These smaller units are typically bought from individual departmental budgets.

Fleet Management Efficiency Study Report for City of Santa Monica 26
For planning purposes, the City uses a 5 to 7-year projection of fleet costs. This plan takes into account inflation, set at 3.50%, but does not calculate surplus values or fund interest earned. However, when the City actually receives auction revenue and interest earned revenue, they are credited back into Fund 54 and allocated to their respective functional funds. As indicated earlier, there are 353 units that are overdue for replacement at an estimated cost of $20M. Based on this and the City’s relatively short-term projections, there may not be sufficient funds to support the future replacement of the City’s fleet. By developing a 15 to 20-year long-range replacement plan, the City will be able to identify any negative fund balances that might occur in future years and take appropriate actions to rectify them.
SHOP LABOR RATES AND MARKUPS
20 FINDING Fleet Management’s hourly shop rate, parts markup, and commercial markup are understated and exceed market rates.
RECOMMENDATION Recompute shop labor rates and markups for commercial and parts to reflect labor and overhead costs. Consider options to reduce rates such as outsourcing some repair services, outsourcing the parts function, and increasing mechanic productivity.
Fleet Management applies one shop labor rate of $130/hour to both light-duty units and heavy-duty fleet units. There are markups for parts (35%) and sublet (35%) work as well as for any body, paint, or fabrication work done in-house. Fleet Management does not mark up its fuel repair work or its administrative and asset management overhead.
As part of this study an activity-based cost analysis (See Attachment 1 Exhibits 1-5) of the City’s Fleet Management operation was conducted to identify all fleet-related labor and overhead costs associated with each major fleet activity. These activities include administration/asset management, maintenance/repair, fuel, parts, and commercial repair work.
SHOP LABOR RATE We identified all fleet-related costs and distributed them across the major functions that are common to most fleet organizations. We then calculated a shop labor rate for the maintenance/repair function as well as markups for parts procurement, sublet work, and fueling. An annual administration/asset management charge was also calculated. This enabled us to compare the shop labor rate with local independent repair shops and dealerships and benchmark the markups/charges against industry standards. A more detailed explanation of the process to develop rates and markup calculations can be found in Appendix A of this report.
As previously mentioned, Fleet Management currently uses a $130.00 per hour shop labor rate. The following table compares the City’s Fully Burdened Rates with our Calculated Rates and Market Rates.

Fleet Management Efficiency Study Report for City of Santa Monica 27
TABLE 9 . FULLY BURDENED RATE COMPARISON WITH CALCULATED RATES AND MARKET RATES
Shop Labor Rate Current Shop Labor Rate
Calculation of City Shop Labor Rate
Local Market Shop Labor Rates
Shop Labor Rate1 $130.00/hr. $182.16/hr. $100.00-$148.00/hr.
1Shop labor rate calculation assumes that shop overhead will be recouped through a combination of a shop labor rate and applying markups to parts and commercial costs.
The current Fleet Management labor rate used to bill work orders is $130.00 per hour. This rate falls below the $182.16 per hour labor rate for both light-duty and heavy-duty units computed in this study. At $182.16/hour, Fleet Management is not competitive with dealerships that range from $126.00/hour to $148.00/hour nor with independent shops charge for services that range from $100/hour to $135/hour.
As noted previously, Fleet Management was unaware of the labor rates that local repair shops were charging to perform work outsourced by the City. It is critical that Fleet Management fully understands its costs relative to the local marketplace to determine the most economical means of accomplishing repair work and other service delivery options.
PARTS AND COMMERCIAL MARKUPS Fleet Management applies a 35% markup to its parts purchases and the same markup for commercial work. Moss Adams calculated a markup for parts and commercial work that were compared with the City’s current markups and markups typically found in well-run government agencies.
TABLE 10 . PARTS AND COMMERCIAL MARKUPS COMPARISON WITH CALCULATED RATES AND INDUSTRY STANDARDS
Fleet Management Markups
Current City Shop Markups
Calculation of City Markups
Industry Standard Markups
Parts Markup 35% 81.54% 25-35%
Commercial (Sublet) Markup 35% 67.83% 10-15%
The parts markup of 35% used by Fleet Management is understated when compared with the markup of 81.54% that we calculated. This may be due to the methodology that Fleet Management uses to compute the markup; however, it is also notable that a great deal of time is being spent by mechanics and supervisors in sourcing, picking up, and delivering parts. Aside from the two storekeepers, more than $400,000 is spent in support of this function by other fleet employees. Given the high parts overhead costs, the City should consider whether using a national parts vendor to provide on-site fleet parts and inventory programs would be cost-effective.
The commercial (sublet) markup was calculated at 67.83% for work sent out by Fleet Management. This markup is greater than the City’s current markup of 35% and exceeds the industry range of between 10% and 15%. Part of this is due to the small, about 8%, amount of work being contracted out. As mentioned earlier, 8% is lower than the typical target for outsourcing at between 10% and 15% of the total maintenance and repair costs. Another factor contributing to the high markup is the number of FTEs that support this function, namely, mechanics, who each spend an average of 78 hours per year transporting

Fleet Management Efficiency Study Report for City of Santa Monica 28
fleet units to and from commercial repair shops. To reduce costs and increase efficiency, the City should consider using lesser-paid employees to transport units rather than mechanics.
FUEL MARKUP AND ADMINISTRATION/ASSET MANAGEMENT CHARGE
21 FINDING Fleet Management does not levy a markup for fuel or a charge for administration and asset management.
RECOMMENDATION To align rates with best practice, develop a markup for fuel and an annual administrative and asset management charge for each fleet unit by appropriately allocating labor and overhead costs to these activities.
The Fleet Management division does not mark up its fuel, nor does it charge a fee to cover the overhead associated with administration and asset management. The formulation of these and other markups, such as parts and commercial work is considered a best fleet practice. Regardless of whether Fleet Management intends to apply these markups and charges to work orders or not, they are an important tool to gauge the efficiency of their service compared to industry standard markups.
A fuel markup and an administration/asset management fee were calculated and compared with markups and charges typically found in well-run government agencies. The results are reflected in Table 11 below.
TABLE 11 . FUEL AND ADMIN ISTRAT ION/ASSET MANAGEMENT CALCULATED RATES/CHARGES COMPARISON WITH INDUSTRY STANDARDS
Service Markup/Charge Current City Shop Markups
Calculation of City Markups/Charges
Industry Standard Markups
Fuel Markup N/A 12.89% 3-5%
Administration/Asset Management Charge
N/A $570.78/unit/yr. $400-$500/unit/yr.
The calculated fuel markup for city vehicles that fuel at commercial fuel sites was 12.89%, or about $0.33 per gallon based on the current cost of unleaded fuel ($2.5373/gallon) at the time of this report. This rate exceeds industry fuel markups that typically range from 3-5%. The markups associated with commercial fueling reflect overhead costs associated with administering the fuel contract, including billing, reconciliation of quantities and associated odometer readings, reporting, data entry, etc.
An administration and asset management fee is designed to reflect the salaries and benefits of those who manage and support fleet operations, assets, and overhead. This fee includes some of the support from City departments (i.e., Finance, IT, Legal, Purchasing). We computed a charge of $570.78 per year for each vehicle and piece of equipment maintained by Fleet Management. This exceeds the industry norm of $400-$500 annually, per unit.
It is important to note that the overhead costs associated with fuel and administration/asset management are recovered in the shop labor rate under Fleet Management’s current methodology. By assessing a markup and charge for these services, the shop labor rate is no longer burdened with these overhead costs and therefore the shop labor rate would be reduced. Exhibit 5 in both activity-based analyses reflect the

Fleet Management Efficiency Study Report for City of Santa Monica 29
reduced shop labor rate if all markups and charges were in place for parts, commercial repair work, fuel, and administrative/asset management.
Based on these calculations, Fleet Management should reconsider its internal costs relative to the local marketplace and industry standards relating to parts, fuel, and commercial work. Without a good understanding of these differences, Fleet Management will likely struggle to determine the most economical means of accomplishing repair work and other service delivery options until it adopts more accurate labor rates and markups.
F. FLEET MANAGEMENT POLICIES, CUSTOMER FEEDBACK, PERFORMANCE MEASUREMENT, AND REPORTING
MANAGEMENT POLICIES
22 FINDING Policies relating to fleet cost control and charge-back management and performance measurement have not been developed.
RECOMMENDATION Establish a cross-functional Vehicle and Equipment Committee designed to develop comprehensive administrative policies for vehicles and equipment and address other fleet-related concerns.
Policies that govern how vehicles are assigned as well as how they are to be utilized and maintained are a best practice in local government agencies. This should include guidelines relating to vehicle assignment criteria, motor pool criteria and rates, responsibilities of fleet staff, internal procedures for routine maintenance, performance measures, and fueling procedures. The most important policy management functions for any successful fleet governing organization should include:
• Fleet Policy and Financial Management
• Customer Services Management
• Fleet Cost Control and Charge-Back Management
• Assignment and Fleet Size Management
• Fleet Replacement (Cycling) Management
• Fleet Service Delivery Management
The City of Santa Monica recently obtained an American Public Works Accreditation that has helped the City develop various fleet policies and addresses matters such as vehicle and equipment operating and safety procedures, preventive maintenance servicing, specification development, sustainability goals, and idling. However, we did not see any evidence of a policy related to fleet cost control and charge-back management or performance measurement.
Public Works meets with individual fleet customers every month to discuss fleet acquisitions as well as other fleet-related issues. While this is considered a best fleet practice, a more appropriate method to consider would be to form a Vehicle and Equipment Committee designed to address fleet needs and develop comprehensive policies. This committee should be comprised of representatives from the various departments who utilize Fleet Management. A committee chair, preferably a manager from the City

Fleet Management Efficiency Study Report for City of Santa Monica 30
Manager’s Office, should lead the group. The Fleet Manager would staff the committee and bring topics and analysis to the Committee for discussion. The Committee’s purpose should be to address fleet-related issues, such as developing fleet policies and guidelines, resolving fleet service-related issues, and evaluating requests for additions to the fleet.
CUSTOMER FEEDBACK
23 FINDING Fleet Management does not regularly solicit customer feedback.
RECOMMENDATION Develop and implement an annual customer survey to proactively identify opportunities for improvement and promote positive customer relations.
Fleet Management does not conduct regular customer surveys. Customer surveys are a best fleet practice and are an easy mechanism to obtain feedback on the quality of work performed by the fleet operation.
Representatives from Police, Public Landscape, Water Resources, Resource Recovery and Recycling and Facilities Maintenance Departments, were interviewed to obtain feedback on the level of service they receive from Fleet Management. Additionally, each representative was asked to fill out a brief “Fleet Customer Service Survey” prior to the interview. The survey asked them to rate various Fleet Management services ranging from “Very Satisfied to Dissatisfied.” After completing the survey, interviewees were invited to discuss their responses.
Fleet Management received very favorable scores from some departments while other departments expressed dissatisfaction with the level of service being offered. A common complaint was that vehicles and equipment were not being replaced on a timely basis. Because users are reliant on older vehicles that take more effort to repair, Fleet Management’s ability to keep fleet units on the road is hindered.
Another common complaint from customers with CNG vehicles related to CNG canisters. CNG canisters have a life cycle of about 7 years. Customers reported that Fleet Management did not plan for canister replacement, which requires the vehicle to be out of service for a period of 2-3 weeks. As a result, some departments were forced to rent vehicles while their units’ canisters were replaced.
Many customers thought that the turnaround time for repairs could be improved. Communication between Fleet Management and its customers was another area that customers thought could be improved. For example, several interviewees commented that they would like to be notified when their units are completed and what work was done.
To help evaluate their performance, Fleet Management should develop and conduct an annual customer survey. This survey can help inform opportunities for improvement and promote optimal service to user departments. Based on the results from the survey conducted in this study, Fleet Management should also consider strategies to improve customer communications, particularly regarding repair and maintenance timelines.

Fleet Management Efficiency Study Report for City of Santa Monica 31
SERVICE LEVEL AGREEMENTS
24 FINDING Fleet Management applies one Service Level Agreement applies to all City departments.
RECOMMENDATION Develop a customized Service Level Agreement between Fleet Management and each of its City department customers to address their specific needs.
Fleet Management has developed a Service Level Agreement that applies to all fleet customers. While the use of service level agreements aligns with industry best practice, a customized Service Level Agreement between Fleet Management and each of its largest customers should be developed.
City fleet customers commonly have different fleet-related requirements. For example, one department may want their fleet units picked up and delivered for maintenance and repairs, while another department might use their own personnel to transport their units to the shop. Each agreement should outline the services provided, as well as the charges and responsibilities of both parties. Performance standards and reporting requirements should also be included in each agreement.
PERFORMANCE MEASUREMENT
25 FINDING Fleet Management performance metrics can be better leveraged to monitor and improve operational performance.
RECOMMENDATION Establish and monitor additional performance measures to evaluate performance against industry and shop standards.
Performance measurement is the process of identifying indicators that demonstrate an organization’s efficiency and effectiveness in delivering a program or service. A performance measurement system relies on regular data collection and analysis to assess program performance. These measures identify successes, needed improvements, and gauge customer satisfaction.
Tracking key indicators and analyzing performance are the foundations of process improvement. Regular analysis of performance metrics enables managers to make informed decisions about how to improve the delivery of services. Best management practices include the use of metrics in:
• Making resource allocation decisions;
• Evaluating service effectiveness (quality and efficiency);
• Assessing and improving customer satisfaction;
• Focusing on and increasing accountability;
• Identifying emerging issues and problems;
• Tracking positive or negative trends;
• Serving as the basis for policy and practice changes;
• Comparing and benchmarking with other agencies; and
• Educating, informing, and communicating improvements and successes.

Fleet Management Efficiency Study Report for City of Santa Monica 32
There is little evidence that Fleet Management uses performance metrics to evaluate its fleet operations. One performance measure, fleet availability, was posted on the City’s website. This metric uses preventive maintenance and repair hours to calculate the amount of time a vehicle or piece of equipment is out of service. However, this measure does not currently include the time between the fleet customer dropping off the unit for servicing and work beginning. This time should be accounted for and added to the time taken to perform a service in order to get a complete out-of-service time frame. The Equipment Repair Request form that fleet customers are required to complete contains a place to enter the date in which the unit was turned in but no place to record the time. Recommendation #8 addresses revisions to the Equipment Repair Request.
Fleet Management, through its fleet software system, does an excellent job of tracking resources (i.e. labor hours, fleet downtime, comebacks, parts costs) but has not developed ratio analysis, a common technique designed to evaluate an organization’s performance in terms of established or recognized standards. Some examples of critical shop metrics that should be adopted include:
MEASURE TARGET
Fleet Availability 95%
Turnaround Time 70-80% in 24 hours
Preventive Maintenance Compliance 95%
Repeat repairs 2% or less
Road Calls 2%
Please see Appendix D for additional examples of performance measures.
MANAGEMENT REPORTS
26 FINDING City management and fleet customers do not have access to information related to vehicle status and cost of maintenance and repairs.
RECOMMENDATION Develop monthly management reports detailing vehicle status and costs for the Public Works Director, the City Manager, and all fleet customer departments.
Fleet Management does not provide reports detailing vehicle status and cost of maintenance and repairs to management or fleet customers. Fleet customers are not able to look up the status of a job or view a work order in the FleetWave system, nor do they receive reports detailing the status of vehicles at the shop, the time and reason(s) the unit has been out-of-service, and the anticipated time that repairs will be completed. Furthermore, customers are not made aware of the maintenance and repair costs for each of their units.
Fleet Management Efficiency Study Report for City of Santa Monica 33
Managers of well-run fleets remain aware of certain fleet activities to properly assess fleet operations. Typical reports should, at a minimum, address the following activities:
• Number of repeat repairs;
• Percentage of preventative maintenance work completed compared with those that were scheduled;
• Fleet availability rate;
• Operational costs vs. budgeted costs; and
• Shop productivity (percent of wrenching hours).

Fleet Management Efficiency Study Report for City of Santa Monica 34
APPENDIX A: EXPLANATION OF HOW LABOR RATES AND MARKUPS WERE CALCULATED In Section E of the Findings and Recommendations portion of this report, we calculated a fully burdened labor rate, a markup for parts, and another for commercial (sublet) work. These types of rates and markups reflect the current charge-back system that the City uses. As a basis for these calculations we performed an activity-based cost analysis that contains five exhibits that are linked together and can be found in Attachment 1. Each exhibit is explained as follows.
Exhibit 1-Fleet Cost Summary. This exhibit is designed to capture all budgeted fleet costs and any indirect support costs not accounted for in the fleet budget. Typical costs include salaries, wages, and employee benefits, overtime, services and supplies, parts, commercial repair work (sublet), fuel, and capital costs.
Exhibit 2-Labor Distribution. This exhibit identifies all fleet employees and distributes their time and corresponding salaries/benefits among the major fleet functions. The net available hours for personnel who perform wrenching tasks (bold red print) reflect the balance of hours after leave hours have been subtracted. This balance of hours comes from a calculation in Exhibit 3.
Exhibit 3-Fleet Maintenance & Repair Production. There are several purposes to this exhibit. First, it is used to identify the average non-productive leave time of all mechanics (and others who are responsible for wrenching). When subtracted from the total working hours in a year (including overtime), it leaves the net available hours per mechanic that are allocated to each activity.
The second purpose is to summarize the average, non-wrenching hours found in Exhibit 2 on a per mechanic basis. These are hours that mechanics spend in activities such as parts, fuel, commercial work as well as hours spent in shop/safety meetings, training, cleanup, etc. and hours spent on non-fleet activities. When these hours are subtracted from the net available hours, it leaves a balance of hours that the average mechanic spends wrenching. Some refer to this as “billable hours” and when expressed as a % of total hours produces a wrenching productivity rate that can be benchmarked with other governmental organizations and private sector fleet repair firms.
Note: As part of this exhibit, it was necessary to estimate some of the indirect and direct hours that fleet staff spend due to the lack of available data. For the most part, fleet staff does a good job of posting their time to work orders. On close examination, we discovered that the time mechanics and other fleet personnel responsible for maintenance and repairs spend on other non-wrenching work, such as parts ordering, part runs and delivering and picking up units from commercial repair shops, are not tracked separately. Instead, they are included in direct time, most likely for billing purposes. These non-wrenching tasks, along with indirect time (i.e., safety and training, cleanup, repairing shop equipment, waiting for assignment), need to be tracked more accurately in order to determine where fleet personnel are spending their time. Once these hours are identified, they can be plotted against the various functional programs (parts, maintenance/repair, fueling, administration/asset management and commercial repair).
The third purpose of this exhibit is to determine the total number of annual wrenching hours of all mechanics. This includes hours from the maintenance and repair activity as well as hours spent in other activities such as painting and fabrication and making newly-acquired vehicles and equipment ready for

Fleet Management Efficiency Study Report for City of Santa Monica 35
use. These hours are indicated in bold black print in Exhibit 2 and totaled. These annual hours are used in Exhibit 5 to eventually calculate a shop labor rate.
Exhibit 4-Fleet Cost Distribution. This exhibit distributes all the fleet costs found into the various activity centers. The labor costs that were distributed into activity centers as reflected in Exhibit 2 are entered here. The cost of services and supplies is distributed based on the number of FTEs allocated to each activity as a percentage of total employees as calculated in Exhibit 2. Capital costs are distributed based on the activity it is intended to support. The result is a total cost of overhead (less the cost of parts, fuel, and sublet work) for each activity.
Exhibit 5-Fleet Labor Rate and Markups. This exhibit is used to calculate a fully burdened shop labor rate and percentage markups for parts, sublet work and fuel, as well as an administrative/asset management charge expressed as an annual fee per fleet unit. Two separate shop labor rates are computed-one which reflects the markups that Fleet Management presently uses in conjunction with their shop labor rate and another that reflects the shop labor rate when all markups and charges are utilized.
The shop labor rate is calculated by subtracting the costs directly charged to fleet customers for sublet, parts, and fuel from the total annual fleet operating costs as well as subtracting any overhead associated with any of the activity centers from Exhibit 4. These would normally be recouped by assessing markups to the costs of parts, fuel, and sublet work and by assessing a flat annual fee for administrative/asset management overhead. The balance to be recovered is then calculated and divided by the total annual maintenance and repair wrenching hours to produce a shop labor rate.

Fleet Management Efficiency Study Report for City of Santa Monica 36
APPENDIX B: SAMPLE PERFORMANCE MEASURES Maintenance and Repair Performance Measures
• Ratio of direct technician labor hours to indirect technician labor hours
• Percentage of all PM inspections and annual state emissions inspections performed of those scheduled over a designated period
• Percentage of PM inspections performed within (XX) hours of presentation (by shop)
• Ratio of scheduled maintenance (PM) work orders to unscheduled repair work orders
• Downtime (or uptime) percentage by class of vehicle (excludes accidents)
o Administrative vehicles and trucks
o Medium/heavy trucks
o Construction equipment
o Sheriff patrol vehicles
o Fire apparatus
o Transit busses
• Percentage repairs that have a turnaround time within one day; percentage repairs within two days; percentage greater than two days
• Number of unscheduled repairs per vehicle maintained
• Percentage of breakdowns per 100 vehicle repairs and miles/hours between breakdowns (such as tires)
• Percentage repairs that are repeat repairs (comebacks by shop)
• Fully burdened labor rate
o Light duty
o Medium/heavy duty
o Miscellaneous equipment
• Burdened labor rate
o Light duty
o Medium/heavy duty
o Miscellaneous equipment
• Average time to respond to road call
• Turnaround time to respond to road calls by towing service
Performance Measures that Monitor PM Compliance
• Technician Performance: Measures technician performance against time standard for each PM service (A, B, C, D) for each class of vehicle over a given period.
• PM Compliance: Measures the percentage (%) of PM inspections performed against PMs due and scheduled on a monthly basis. PM labor hours backlogged at month-end.

Fleet Management Efficiency Study Report for City of Santa Monica 37
• PM Turnaround Time: Measures the percentage of all PM inspections performed within (XX) hours of presentation (by shop).
• PM Effectiveness: Ratio of scheduled maintenance (PM) work orders to unscheduled repair work orders over a given period.
Commercial Repairs (Sublet) Performance Measures
• Total value of repairs recovered under warranty
• Total cost of commercial work
o By class
o By repair task
o By vendor
• Percentage charge or markup on commercial repairs
• Turnaround time of commercial work performed by vendor
Parts Services Performance Measures
• Downtime due to parts
• Vehicle-hours (or days) lost waiting for parts
• Percentage of repairs delayed due to stock outages/lack of parts
• Percentage charge or markup on the price of parts
• Parts turnover ratio (total number of parts used during a specified period divided by the average number of parts on hand at any given time)
• Total annual value of stock lost due to theft, loss, deterioration, or obsolescence (shrinkage)
• Average cost to process a purchase order
• Inventory adjustments (by line and value)
• Number of lines (and dollar value) of parts inactive in past six months
• Parts service level or the percentage of time that parts requests are filled from inventory on demand, within (XX) hours
• Number of open backorders by line, value, and age
• Ratio of the request fill rate to the level of investment in inventory
• Ratio of inventory volume to inventory value
Fuel Services Performance Measures
• Fully burdened rate per gallon of fuel
• Cost of gallon of fuel from area private providers, adjacent cities, and counties
• Average fuel consumption (miles per gallon) by vehicle and class
• Fuel cost per mile by vehicle and class
• Average total fuel cost by class
Central Motor Pool/Heavy Equipment Pool/Shop Loaner Pool Performance Measures
• Average number of pool units rented per day by reason

Fleet Management Efficiency Study Report for City of Santa Monica 38
• Number of times pool units not available by type
• Number of pool units available per day but not rented by type
• Pool revenues vs. pool costs
o By class
o By vehicle
• Ratio of shop loaner units dispatched to customers who are having units repaired/maintained to total number of shop loaner units
Acquisition Performance Measures
• Percentage of specifications prepared within four weeks of request
• Proportion of vehicle replacements funded from annual contributions to replacement funds
• Turnaround time from vehicle ordering to receipt of the unit
• Turnaround time from receipt of the unit to in-service date
Replacement Performance Measures
• Proportion of vehicles driven below minimum miles/hours criteria
• Average annual utilization (miles, hours) by vehicle class and type of assignment; ratio of annual utilization (miles, hours) by vehicle class to capacity (or output available)
• Number and percentage of vehicles by total lifetime mileage grouping (to review age of fleet in miles/hours); percentage of lightly, heavily-used vehicles
• Ratio of vehicles identified at the optimum replacement point (age and/or mileage replacement policy threshold) to vehicles actually being replaced
• Average actual vehicle retention period by class
• Number and percentage of vehicles exceeding standards on number of repairs, cost of repairs, road calls, downtime, utilization, oil consumption, cost per mile
• Number of qualifying vehicles that have planned replacement funding
Disposition Performance Measures
• Average salvage value per class by method of disposition
• Average number of days from out-of-service to disposition
• Ratio of salvage value to original purchase price
Agency Profit/Loss
• Net annual revenues vs. operating expenditures (profit/loss) by fleet by class and by vehicle
Operating Budget
• Total actual operating costs vs. budgeted costs
• Ratio of administrative overhead costs to total operating costs
• Ratio of maintenance and repair costs to total operating costs
• Ratio of parts costs to total operating costs
Fleet Management Efficiency Study Report for City of Santa Monica 39
• Ratio of fueling costs to total operating costs
• Ratio of motor pool costs to total operating costs
• Ratio of indirect cost allocation to total operating costs
Replacement Reserve Fund
• Ratio of funds allocated for annual replacement to the estimated value of the current fleet (or class) (replacement cost method)
• Number of units to be replaced in the next year as a percentage of the fleet
• Number of units to be replaced in the next year as compared to the agency’s replacement criteria guideline
Fleet Costs
• Total vehicle cost per mile/hour by fleet, by department, by class, by vehicle function
• Capital cost per mile/hour by fleet, by department, by class, by vehicle function
• Annual unit cost of each vehicle by class
• Operating and maintenance cost per vehicle by class
• Administrative overhead and replacement cost per vehicle by class

Fleet Management Efficiency Study Report for City of Santa Monica 40
ATTACHMENT 1 EXHIBIT 1: FLEET SERVICES COST SUMMARY
FLEET MAINTENANCE BUDGETED ACCOUNTS
TOTAL COSTS COST SOURCE
Salaries, Wages, Employee Benefits
$3,651,727 Current salaries/benefits of all fleet employees from Exhibit II
Overtime $83,381 FY 17/18 Budget
Materials & Services $1,769,266 FY 17/18 Budget
Parts $1,047,065 FY 17/18 Budget
Contracted Maintenance & Repair Work
$548,421 FY 17/18 Budget
Fuel $697,316 FY 17/18 Budget
Indirect Cost Allocation $925,022 -
Total Costs $7,797,176 -

Fleet Management Efficiency Study Report for City of Santa Monica 41
EXHIBIT 2: LABOR DISTRIBUTION BY ACTIVITY CENTERS LABOR COST D ISTRIBUT ION
Fleet Maintenance Labor FY 17/18 Salary & Benefits
OT Total Salary/
Benefits/OT
FLEET MANAGEMENT ACT IV ITY CENTERS
Budgeted Classifications No. Admin. & Asset Mgmt.
Maintenance & Repair
Parts Procurement
Fueling Function
Sublet Function
Painting/ Fabrication
Build-Up Make Ready
Non-Fleet Work
Other
Fleet Maintenance Superintendent (Step 5) - (Craig Van Item) 1.00 $200,125 $200,125 $200,125 $100,063 $20,013 $10,006 $10,006 $20,013 $20,013 $20,013
Fleet Maint Supervisor (Step 5) - (Marc Zamora) 1.00 $164,530 $164,530 $164,530 $32,906 $44,423 $41,133 $16,453 $3,291 $8,227 $18,098
Fleet Maint Supervisor (S4, 15PP / S5, 11PP) - (Sam Mesa) 1.00 $159,789 $159,789 $159,789 $31,958 $43,143 $39,947 $15,979 $3,196 $7,989 $17,577
Administrative Analyst (S4, 15.5PP / S5, 10.5PP) - (Heidi Duran) 1.00 $151,718 $151,718 $151,718 $98,617 $22,758 $15,172 $15,172
Staff Assistant III (S1, 3PP / S2, 23PP) – (Rachel Munoz) 1.00 $89,759 $89,759 $89,759 $4,488 $35,903 $4,488 $31,416 $4,488 $8,976
Storekeeper I (Step 5) - (Paul Kleinman) 1.00 $100,378 $100,378 $100,378 $5,019 $72,272 $10,038 $2,008 $11,042
Fleet Storekeeper (S1, 11PP / S2, 15PP) - (Anteus Fisher) 1.00 $89,860 $89,860 $89,860 $4,493 $64,700 $8,986 $1,797 $9,885
Fleet Services Writer (Step 2) 1.00 $91,693 $91,693 $91,693 $4,585 $54,099 $4,585 $18,339 $10,086
Senior Mechanic (Step 5) - (Anthony Maxwell) 1.00 $143,133 $4,169 $147,302 $147,302 $7,365 $79,543 $22,095 $2,946 $7,365 $11,784 $16,203
Senior Mechanic (Step 5) - (Ghulam Nathoo) 1.00 $143,133 $4,169 $147,302 $147,302 $7,365 $79,543 $22,095 $2,946 $7,365 $11,784 $16,203
Mechanic II (Step 5) - (Martin Barba) 1.00 $133,064 $4,169 $137,233 $137,233 $83,712 $13,723 $6,862 $6,862 $10,979 $15,096
Mechanic II (Step 5) - (James Bevardos) 1.00 $133,064 $4,169 $137,233 $137,233 $83,712 $13,723 $6,862 $6,862 $10,979 $15,096
Mechanic II (Step 5) - (Ching Cheung) 1.00 $133,064 $4,169 $137,233 $137,233 $83,712 $13,723 $6,862 $6,862 $10,979 $15,096
Mechanic II (Step 5) - (Anthony Edney) 1.00 $133,064 $4,169 $137,233 $137,233 $83,712 $13,723 $6,862 $6,862 $10,979 $15,096
Mechanic II (Step 5) - (Charles Goodwin) 1.00 $133,064 $4,169 $137,233 $137,233 $83,712 $13,723 $6,862 $6,862 $10,979 $15,096
Mechanic II (Step 5) - (David Hernandez) 1.00 $133,064 $4,169 $137,233 $137,233 $83,712 $13,723 $6,862 $6,862 $10,979 $15,096
Mechanic II (Step 5) - (Tzeyang Jao) 1.00 $133,064 $4,169 $137,233 $137,233 $83,712 $13,723 $6,862 $6,862 $10,979 $15,096
Mechanic II (Step 5) - (Abdul Khan) 1.00 $133,064 $4,169 $137,233 $137,233 $83,712 $13,723 $6,862 $6,862 $10,979 $15,096
Mechanic II (Step 5) - (Bryant Lopez) 1.00 $133,064 $4,169 $137,233 $137,233 $83,712 $13,723 $6,862 $6,862 $10,979 $15,096
Mechanic II (Step 5) - (Julian Ortiz) 1.00 $133,064 $4,169 $137,233 $137,233 $83,712 $13,723 $6,862 $6,862 $10,979 $15,096

Fleet Management Efficiency Study Report for City of Santa Monica 42
LABOR COST D ISTRIBUT ION
Fleet Maintenance Labor FY 17/18 Salary & Benefits
OT Total Salary/
Benefits/OT
FLEET MANAGEMENT ACT IV ITY CENTERS
Budgeted Classifications No. Admin. & Asset Mgmt.
Maintenance & Repair
Parts Procurement
Fueling Function
Sublet Function
Painting/ Fabrication
Build-Up Make Ready
Non-Fleet Work
Other
Mechanic II (Step 5) - (Salvador Ramirez) 1.00 $133,064 $4,169 $137,233 $137,233 $83,712 $13,723 $6,862 $6,862 $10,979 $15,096
Mechanic II (Step 5) - (David Randall) 1.00 $133,064 $4,169 $137,233 $137,233 $83,712 $13,723 $6,862 $6,862 $10,979 $15,096
Mechanic II (Step 5) - (Manuel Rodriguez) 1.00 $133,064 $4,169 $137,233 $137,233 $83,712 $13,723 $6,862 $6,862 $10,979 $15,096
Mechanic II (S4, 21PP / S5, 5PP) - (Pedro Lara) 1.00 $127,693 $4,169 $131,862 $131,862 $80,436 $13,186 $6,593 $6,593 $10,549 $14,505
Mechanic I (S2, 18PP / S3, 8PP) - (Sean Murray) 1.00 $103,642 $4,169 $107,811 $107,811 $65,765 $10,781 $5,391 $5,391 $8,625 $11,859
Mechanic I (S1, 25PP) - (Fernando Cuevas) 1.00 $97,001 $4,169 $101,170 $101,170 $61,714 $10,117 $5,059 $5,059 $8,094 $11,129
Mechanic I (S1, 23PP) - (Steve Quintana) 1.00 $97,001 $4,169 $101,170 $101,170 $61,714 $10,117 $5,059 $5,059 $8,094 $11,129
Welder/Fabricator (S2, 9PP / S3, 17PP) - (Gregory Ross) 1.00 $106,483 $4,169 $110,652 $110,652 $16,598 $8,852 $47,580 $8,852 $16,598 $12,172
Trades Intern (Step 1) - (Javarro Spinks) 1.00 $55,952 $55,952 $55,952 $30,774 $5,595 $8,393 $11,190
Total 29.00 $3,651,727 $83,380 $3,735,107 $3,735,107 $296,858 $1,726,023 $549,788 $56,276 $242,958 $180,099 $255,025 $16,598 $411,481

Fleet Management Efficiency Study Report for City of Santa Monica 43
LABOR HOUR D ISTRIBUT ION
Fleet Maintenance Labor FY 17/18 Annual Hours
OT Total Annual Hours
Available Hours*
FLEET MANAGEMENT ACT IV ITY CENTERS
Budgeted Classifications No. Admin. & Asset Mgmt.
Maintenance & Repair
Parts Procurement
Fueling Function
Sublet Function
Painting/ Fabrication
Build-Up Make Ready
Non-Fleet Work
Other
2.24 12.62 4.98 0.55 2.11 1.31 1.82 .014 3.24
Fleet Maintenance Superintendent (Step 5) - (Craig Van Item) 1.00 2,080 2,080 1,040 208 104 104 208 208 208
Fleet Maint Supervisor (Step 5) - (Marc Zamora) 1.00 2,080 2,080 416 562 520 208 42 104 229
Fleet Maint Supervisor (S4, 15PP / S5, 11PP) - (Sam Mesa) 1.00 2,080 2,080 416 562 520 208 42 104 229
Administrative Analyst (S4, 15.5PP / S5, 10.5PP) - (Heidi Duran) 1.00 2,080 2,080 1,352 312 208 208
Staff Assistant III (S1, 3PP / S2, 23PP) - Rachel Munoz) 1.00 2,080 2,080 104 832 104 728 104 208
Storekeeper I (Step 5) - (Paul Kleinman) 1.00 2,080 2,080 104 1,498 208 42 229
Fleet Storekeeper (S1, 11PP / S2, 15PP) - (Anteus Fisher) 1.00 2,080 2,080 104 1,498 208 42 229
Fleet Services Writer (Step 2) - (Now Vacant) 1.00 2,080 2,080 104 1,227 104 416 229
Senior Mechanic (Step 5) - (Anthony Maxwell) 1.00 2,080 73.78 2,154 1,552.50 78 838 233 31 78 124 171
Senior Mechanic (Step 5) - (Ghulam Nathoo) 1.00 2,080 73.78 2,154 1,552.50 78 838 233 31 78 124 171
Mechanic II (Step 5) - (Martin Barba) 1.00 2,080 73.78 2,154 1,552.50 947 155 78 78 124 171
Mechanic II (Step 5) - (James Bevardos) 1.00 2,080 73.78 2,154 1,552.50 947 155 78 78 124 171
Mechanic II (Step 5) - (Ching Cheung) 1.00 2,080 73.78 2,154 1,552.50 947 155 78 78 124 171
Mechanic II (Step 5) - (Anthony Edney) 1.00 2,080 73.78 2,154 1,552.50 947 155 78 78 124 171
Mechanic II (Step 5) - (Charles Goodwin) 1.00 2,080 73.78 2,154 1,552.50 947 155 78 78 124 171
Mechanic II (Step 5) - (David Hernandez) 1.00 2,080 73.78 2,154 1,552.50 947 155 78 78 124 171
Mechanic II (Step 5) - (Tzeyang Jao) 1.00 2,080 73.78 2,154 1,552.50 947 155 78 78 124 171
Mechanic II (Step 5) - (Abdul Khan) 1.00 2,080 73.78 2,154 1,552.50 947 155 78 78 124 171
Mechanic II (Step 5) - (Bryant Lopez) 1.00 2,080 73.78 2,154 1,552.50 947 155 78 78 124 171
Mechanic II (Step 5) - (Julian Ortiz) 1.00 2,080 73.78 2,154 1,552.50 947 155 78 78 124 171

Fleet Management Efficiency Study Report for City of Santa Monica 44
LABOR HOUR D ISTRIBUT ION
Fleet Maintenance Labor FY 17/18 Annual Hours
OT Total Annual Hours
Available Hours*
FLEET MANAGEMENT ACT IV ITY CENTERS
Budgeted Classifications No. Admin. & Asset Mgmt.
Maintenance & Repair
Parts Procurement
Fueling Function
Sublet Function
Painting/ Fabrication
Build-Up Make Ready
Non-Fleet Work
Other
2.24 12.62 4.98 0.55 2.11 1.31 1.82 .014 3.24
Mechanic II (Step 5) - (Salvador Ramirez) 1.00 2,080 73.78 2,154 1,552.50 947 155 78 78 124 171
Mechanic II (Step 5) - (David Randall) 1.00 2,080 73.78 2,154 1,552.50 947 155 78 78 124 171
Mechanic II (Step 5) - (Manuel Rodriguez) 1.00 2,080 73.78 2,154 1,552.50 947 155 78 78 124 171
Mechanic II (S4, 21PP / S5, 5PP) - (Pedro Lara) 1.00 2,080 73.78 2,154 1,552.50 947 155 78 78 124 171
Mechanic I (S2, 18PP / S3, 8PP) - (Sean Murray) 1.00 2,080 73.78 2,154 1,552.50 947 155 78 78 124 171
Mechanic I (S1, 25PP) - (Fernando Cuevas) 1.00 2,080 73.78 2,154 1,552.50 947 155 78 78 124 171
Mechanic I (S1, 23PP) - (Steve Quintana) 1.00 2,080 73.78 2,154 1,552.50 947 155 78 78 124 171
Welder/Fabricator (S2, 9PP / S3, 17PP) - (Gregory Ross) 1.00 2,080 73.78 2,154 1,552.50 233 124 668 124 233 171
Trades Intern (Step 1) - (Javarro Spinks) 1.00 2,080 2,080 1,552.50 854 155 233 311
Total 29.00 1,476 61,796 32,603 3,795 21,421 8,460 936 3,591 2,226 3,087 233 5,494
*Reflects adjusted net costs/hours after leave time has been subtracted. Pertains only to fleet staff responsible for wrenching.

Fleet Management Efficiency Study Report for City of Santa Monica 45
EXHIBIT 3: MAINTENANCE & REPAIR PRODUCTION AVERAGE YEARLY
HOURS/EMPLOYEE SOURCE
TOTAL ANNUAL HOURS 2,154 Includes overtime
Less Non-Productive Leave Hours Per Employee
Vacation time (160.00) Estimate based on Fleet Management FY 16/17 data
Holidays (12) (96.00) Annual paid holidays
Average sick leave (85.00) Estimate based on Fleet Management FY 16/17 data
Personal leave time (i.e., jury, school, comp time, personal leave, funeral) (157.00)
Estimate based on Fleet Management FY 16/17 data
Subtotal 1,656.00
Less break time (103.50)
Annual Net Available Hours Per Employee 1,552.50
Percent of Total Hours 72.08%
Non-Wrenching Hours Per Employee
Other-Shop/safety meetings, training, shop repairs, cleanup, start shift, etc. 177.43
Estimate based on data supplied by Fleet Management
Hours spent on other non-wrenching fleet activities (i.e., parts, sublet) 241.89
Estimate based on data supplied by Fleet Management
Annual Non-Wrenching Hours Per Employee 419.32
Percent of Total Hours 19.47%
Total Wrenching Hours 23,489.00
Arrived at by totaling all wrenching hours indicated in bold, black print from Exhibit 2.
Annual Wrenching Hours Per Employee 1,143.02
Divide total wrenching hours (23,489) by number of employees who wrench (20.55 FTEs).
Percent of Total Hours 53.06% Divide total wrenching hours (23,489) by total available hours (20.55.0 FTEs x 2,154 hrs)

Fleet Management Efficiency Study Report for City of Santa Monica 46
BILLABLE EMPLOYEES
CURRENT WRENCHING HOURS WRENCHING HOURS GOAL
Employee Title
No. of Employees
Per Employee @ 53.06% Wrenching Productivity
Per Employee Class @ 53.06% Wrenching Productivity
Per Employee @ 65.00% Wrenching Productivity
Per Employee Class @ 65.00% Wrenching Productivity
Senior Mechanic 2.00 1,143.02 2,286.03 1,400 2,800
Mechanic II 14.00 1,143.02 16,002.24 1,400 19,601
Mechanic I 3.00 1,143.02 3,429.05 1,400 4,200
Welder/ Fabricator 1.00 1,143.02 1,143.02 1,400 1,400
Trades Intern 0.55 1,143.02 628.66 1,400 770
Totals 20.55 23,489.00 28,772.06

Fleet Management Efficiency Study Report for City of Santa Monica 47
EXHIBIT 4: FLEET BUDGET DISTRIBUTION BY ACTIVITY CENTER FLEET MANAGEMENT BUDGETED COSTS FY 16 /17 FLEET MANAGEMENT ACT IV ITY CENTERS
Fleet Maintenance Account Total
Administration/Set Mgmt. Function
Maintenance Repair Function
Parts Function Fuel Function Sublet Function Painting/ Fabrication
Build-Up Make Ready
Non-Fleet Work Other
Annual Distribution of Costs ($) & FTE’s
2.24 12.62 4.98 0.55 2.11 1.31 1.82 0.14 3.24
Salaries, Wages, Employee Benefits $3,651,727 $296,858 $1,726,023 $549,788 $56,276 $242,958 $180,099 $255,025 $16,598 $411,481
Overtime $83,381 $83,381
Services and Supplies $1,769,266 $136,362 $769,659 $303,952 $33,630 $129,009 $79,967 $110,922 $8,367 $197,398
Parts $1,047,065 $1,047,065
Outside Services (Repairs and Maintenance-Vehicles/Equipment) $548,421 $548,421
Fuel $697,316 $697,316
Total Costs $7,797,176 $433,220 $2,579,063 $1,900,806 $787,222 $920,388 $260,066 $365,947 $24,965 $608,879

Fleet Management Efficiency Study Report for City of Santa Monica 48
EXHIBIT 5: FLEET LABOR RATE & MARKUPS LABOR RATE CALCULAT I ONS FULLY BURDENED
RATE WITH PARTS & SUBLET MARKUP
FULLY BURDENED RATE INCLUDING ALL
MARKUPS
Total Annual Operating Costs $7,797,176 $7,797,176
Less Costs Directly Charged
Sublet ($548,421) ($548,421)
Parts ($1,047,065) ($1,047,065)
Fuel ($697,316) ($697,316)
Less Overhead Costs Captured in Markups/Charges
Parts ($853,741) ($853,741)
Sublet ($371,967) ($371,967)
Admin/Asset Mgmt. $0 ($433,220)
Fuel $0 ($89,906)
Balance to be recovered in hourly rate $4,278,666 $3,755,541
Divide by total maintenance/repair hours 23,489 23,489
Labor Rate $182.16 $159.89

Fleet Management Efficiency Study Report for City of Santa Monica 49
MARKUP/CHARGE CALCULAT IONS FULLY BURDENED RATE WITH PARTS &
SUBLET MARKUP
FULLY BURDENED RATE INCLUDING ALL
MARKUPS Parts Markup
Parts overhead costs $853,741 $853,741
Divide by annual cost of parts $1,047,065 $1,047,065
Parts Markup 81.54% 81.54%
Sublet Markup
Sublet overhead costs $371,967 $371,967
Divide by annual cost of sublet costs $548,421 $548,421
Sublet Markup 67.83% 67.83%
Administration/Asset Management Charge
Asset/Admin overhead costs $433,220
Divide by total fleet units 759
Annual Admin./Asset Mgmt. Charge Per Unit $570.78
Fuel Markup
Fuel overhead costs $89,906
Divide by annual cost of fuel $697,316
Fuel Markup 12.89%