City of Salem, Oregon · A financial forecast is a widely accepted best practice to evaluate...
75
City of Salem, Oregon FY 2020 – 2024 Five-Year Forecasts Realizing Progress and Preparing for the Future
Transcript of City of Salem, Oregon · A financial forecast is a widely accepted best practice to evaluate...
City of Salem, Oregon
FY 2020 – 2024
Five-Year
Forecasts
Realizing Progress and Preparing for the Future

FY 2020-2024 Forecast Opportunity Compassion Responsiveness Accessibility
City of Salem Oregon Five-Year Financial Forecasts
Fiscal Year 2020 through 2024
General Fund
Transportation Services Fund Utility Fund WVCC Fund Airport Fund
Building and Safety Fund Cultural and Tourism (TOT) Fund
Document Services, City Services Fund Emergency Services Fund
Fleet Services, City Services Fund Radio Communications, City Services Fund
Self Insurance Fund, Benefits Self Insurance Fund, Risk
Streetlight Fund
Steve Powers, City Manager
City of Salem Budget Office
December 2018
1

FY 2020-2024 Forecast Opportunity Compassion Responsiveness Accessibility
2

FY 2020-2024 Forecast Opportunity Compassion Responsiveness Accessibility
Table of Contents
Why We Forecast __________________________________________________________________________ 5
How to Use This Document _______________________________________________________________ 6
Forecast Snapshot _________________________________________________________________________ 7
General Fund ______________________________________________________________________________ 8
Transportation Services Fund_____________________________________________________________ 19
Utility Fund _______________________________________________________________________________ 27
Willamette Valley Communication Center (WVCC) Fund _________________________________ 35
Airport Fund ______________________________________________________________________________ 43
Building and Safety Fund _________________________________________________________________ 44
Cultural and Tourism (TOT) Fund _________________________________________________________ 45
Document Services, City Services Fund ___________________________________________________ 46
Emergency Services Fund ________________________________________________________________ 47
Fleet Services, City Services Fund _________________________________________________________ 48
Radio Communications, City Services Fund ______________________________________________ 49
Self Insurance Fund, Benefits _____________________________________________________________ 50
Self Insurance Fund, Risk _________________________________________________________________ 51
Streetlight Fund __________________________________________________________________________ 52
Economic Outlook, Tim Duy Economic Consulting _______________________________________ 53
Citywide Expenditure Financial Forecast Risks and Rankings _____________________________ 57
Appendix
A – Assumptions for Forecast ____________________________________________________________ A1 – A4
B – Property Tax Tables ___________________________________________________________________ A5 – A8
C – Other Background Information ________________________________________________________ A9 – A14
3
FY 2020-2024 Forecast Opportunity Compassion Responsiveness Accessibility
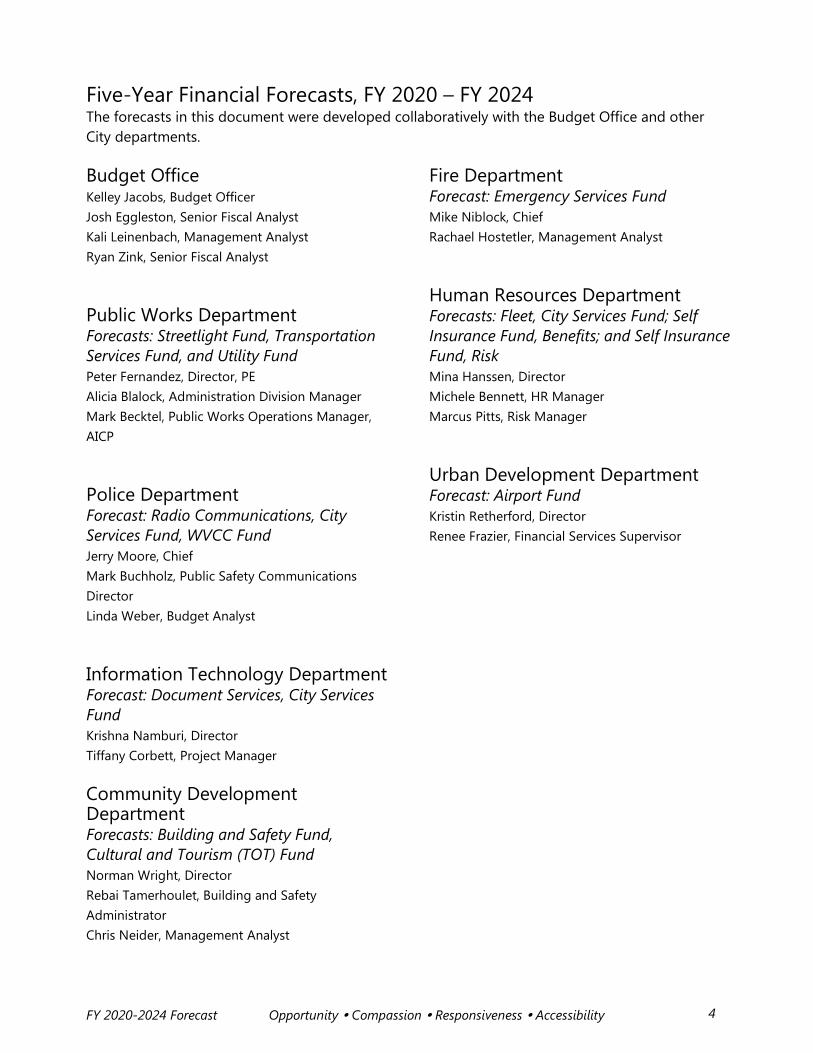
Five-Year Financial Forecasts, FY 2020 – FY 2024 The forecasts in this document were developed collaboratively with the Budget Office and other City departments. Budget Office Kelley Jacobs, Budget Officer Josh Eggleston, Senior Fiscal Analyst Kali Leinenbach, Management Analyst Ryan Zink, Senior Fiscal Analyst Public Works Department Forecasts: Streetlight Fund, Transportation Services Fund, and Utility Fund Peter Fernandez, Director, PE Alicia Blalock, Administration Division Manager Mark Becktel, Public Works Operations Manager, AICP Police Department Forecast: Radio Communications, City Services Fund, WVCC Fund Jerry Moore, Chief Mark Buchholz, Public Safety Communications Director Linda Weber, Budget Analyst Information Technology Department Forecast: Document Services, City Services Fund Krishna Namburi, Director Tiffany Corbett, Project Manager Community Development Department Forecasts: Building and Safety Fund, Cultural and Tourism (TOT) Fund Norman Wright, Director Rebai Tamerhoulet, Building and Safety Administrator Chris Neider, Management Analyst
Fire Department Forecast: Emergency Services Fund Mike Niblock, Chief Rachael Hostetler, Management Analyst Human Resources Department Forecasts: Fleet, City Services Fund; Self Insurance Fund, Benefits; and Self Insurance Fund, Risk Mina Hanssen, Director Michele Bennett, HR Manager Marcus Pitts, Risk Manager Urban Development Department Forecast: Airport Fund Kristin Retherford, Director Renee Frazier, Financial Services Supervisor
4

FY 2020-2024 Forecast Opportunity Compassion Responsiveness Accessibility
City of Salem, Oregon Vision
A safe and livable capital city with a sustainable economy and environment that is open to all.
Mission The City of Salem provides fiscally sustainable and quality services to enrich the lives of present and future residents, the quality of the environment and neighborhoods, and the vitality of our economy.
Why We ForecastA forecast is a planning tool to aid the City Council and Salem’s executive management team in maintaining consistent service delivery to the community within available resources. The financial forecasts presented in this document represent one of many tools employed by staff to support the provision of services in the community through sound financial management. City staff access a variety of costing models, plans, and analyses, and use assumptions to project anticipated Citywide revenues and expenditures for the current year and the forecast period.
The mission of the City is to provide fiscally sustainable and quality services to enrich the lives of present and future residents, the quality of our environment and neighborhoods and the vitality of the economy. Fiscal sustainability – framed as Sustainable Service Delivery – is one of seven goal areas in the City Council’s strategic plan.
The intended outcome of this goal is alignment of City services and resources and maintenance of working capital for the future through redesign of the budget process, identification of the desired level of services that can be sustained with existing revenues, and exploration of alternate ways to deliver services, realize revenues, and generate cost savings. The information presented in the forecasts exemplifies City Council’s commitment to the goal of Sustainable Service Delivery and the associated actions.
A financial forecast is a widely accepted best practice to evaluate current and future fiscal conditions. The Government Financial Officer’s Association recommends that governments at all levels forecast major revenues and expenditures and that the forecast extend several years into the future. It is important to note that to realize the outcome illustrated in the forecast document, all revenue, expense, and savings assumptions would need to be experienced exactly as predicted. The General Fund section of the document includes a demonstration of variability with the forecast assumptions (page 16).
In addition to the General Fund, this document includes forecasts for 13 funds. It highlights in greater detail four of the forecasts prepared by City staff – General Fund, Transportation Services Fund, Utility Fund, and the WVCC* Fund. The forecasts are developed within the framework of City Council goals, fiscal responsibility, and continuity of City services.
*Willamette Valley Communication Center, 9-1-1 services
5
FY 2020-2024 Forecast Opportunity Compassion Responsiveness Accessibility
How To Use This Document
The General Fund, Transportation Services Fund, Utility Fund, and WVCC Fund each have a section in the document, which includes:
• a brief summary and additional information about forecast results,• a schedule demonstrating the result of revenue and expenditure assumptions for
the five-year forecast period,• revenue and expenditure detail, and• revenue risk factors and rankings.
The remaining 10 fund forecasts are presented next in the document with a one-page summary for each fund. The page includes a numeric table with the five-year result, a brief narrative explanation, highlighted risk factors, and graphic displays of historical and projected revenues and expenditures.
To provide additional context for the forecasts presented in this document, a brief national, state, and local economic outlook by the City’s economic consultant, Dr. Tim Duy, follows the fund forecast sections.
An analysis of Citywide expenditure risk factors and rankings closes the document. The appendices focus primarily on the General Fund and property tax, but also provide additional detail on assumptions employed in developing the forecasts.
6

FY 2020-2024 Forecast Opportunity Compassion Responsiveness Accessibility
Forecast Snapshot The forecast for the General Fund demonstrates a structural imbalance between current, available revenue and the cost of providing services. Relieving this imbalance over the forecast period may require new, additional revenue sources to prevent significant service reductions. (More detail on page 8.)
The Transportation Services Fund forecast reflects cost savings as the result of shifting the operation and maintenance of the streetlight system to the Streetlight Fund (forecast on page 52) and anticipated increases in state highway fund revenues. However, these two contributions are not sufficient to stall an imbalance between current revenues and the expense of transportation services. (More detail on page 19.)
Consistent rate increases are modeled in the forecast for the Utility Fund and provide sufficient resources to operate and maintain the water, wastewater, and stormwater utility systems over the five-year period. In addition, the forecast demonstrates an approximate $40 million annual contribution through debt service payments and pay-as-you-go funding for Utility capital improvements. (More detail on page 27.)
In the past few years, the WVCC Fund transitioned from a period of financial stress to improved fiscal health due to the willingness of member agencies to align the rates they pay to the cost of service. This forecast includes the addition of a capital project to replace the CADD system. (More detail on page 35.)
$100.0
$120.0
$140.0
$160.0
$180.0
FY 19 YEE FY 20 F FY 21 F FY 22 F FY 23 F FY 24 F
G E N E R A L F U N DF I V E - Y E A R F O R E C A S T
Revenues Net Expenditures
$12.0
$14.0
$16.0
$18.0
$20.0
FY 19 YEE FY 20 F FY 21 F FY 22 F FY 23 F FY 24 F
T R A N S P O R T A T I O N S E R V I C E S F U N D F I V E - Y E A R F O R E C A S T
Revenues Net Expenditures
$90.0
$110.0
$130.0
$150.0
$170.0
FY 19 YEE FY 20 F FY 21 F FY 22 F FY 23 F FY 24 F
U T I L I T Y F U N D F I V E - Y E A R F O R E C A S T
Revenues Net Expenditures
$10.0
$11.0
$12.0
$13.0
$14.0
FY 19 YEE FY 20 F FY 21 F FY 22 F FY 23 F FY 24 F
W V C C , 9 - 1 - 1 S E R V I C E SF I V E - Y E A R F O R E C A S T
Revenues Net Expenditures
7

FY 2020-2024 Forecast Opportunity Compassion Responsiveness Accessibility
General Fund
Summary The City’s General Fund supports operations in the areas of public safety, planning, code enforcement, public library, municipal court, parks and recreation, urban development, and support services that provide a Citywide benefit. The General Fund five-year forecast is built with a baseline set of assumptions that represents a reasonable level of consistency with current service delivery.
The forecast is an objective proposal that seeks to estimate revenues and expenditures as accurately as possible. There are bound to be variations from the estimates. However, major drivers of expenditures and revenues are analyzed and evaluated at a very granular level. For example, property tax information is received from the counties and individual properties are compared year-over-year. This level of analysis has produced highly accurate estimates in the City’s budget. Personnel costs, the major expense associated with delivering services, are calculated at the position level to afford accuracy in future year projections.
The General Fund forecast for FY 2020 – 2024 continues the trend experienced with the two most recently completed fiscal years where expenditures exceed revenues. The gap widens in the forecast with the costs of services escalating more steeply.
Community Dev, $4.5
Facilities Services, $4.4
Fire, $36.1 Info Technology,
$8.6
Library, $5.2
Municipal Court, $2.1
Non Dept, $7.8
Parks, $7.1 Police, $46.9 Recreation, $2.5
Support Services, $10.0
Urban Dev, $5.3
General Fund FY 2020 – FY 2024 Forecast, Year 1 Total Expenditures: $140.5M
Support Services include forecasts for City Manager’s Office, Finance, Budget, Purchasing, Legal, Human Resources, and Mayor and Council. All values in millions.
8

FY 2020-2024 Forecast Opportunity Compassion Responsiveness Accessibility
Current Status The City’s strong financial management practices have helped to maintain General Fund working capital at a level that exceeds the City Council’s policy of 15 percent of budget revenues. Ensuring fiscal sustainability of City services – aligning revenues with the cost of services and maintaining sufficient working capital – is a goal area of the Council’s strategic plan. Fiscal sustainability in the General Fund allows for the continuity of services valued by the community, supports a favorable credit rating and reduces borrowing costs for capital improvements, and provides resources to manage the cyclical nature of revenue receipts. The City needs approximately $22 million in available cash or working capital to avoid borrowing and interest costs from July through November each fiscal year in the General Fund.
FY 2019 began with working capital of $25 million. The change to this balance from July 2016 to June 2018 – the span of two fiscal years – was a decrease of $3.1 million. The year-end outlook for FY 2019 continues the use of working capital, or one-time funds, to balance anticipated expenditures. It is currently projected working capital will be depleted to $19.6 million, a reduction of $5.4 million, by the end of the fiscal year.
Future Outlook The outlook for the next five years is a continued widening of the gap between General Fund revenues and expenditures as demonstrated in the prior two forecasts. The City’s actual experience for use of working capital was less than the amount documented in those forecasts. This is partly due to purchases and projects carried over from one year to the next, an assumption demonstrated in the forecast display in Table 3. While the exact prediction for use of working capital in FY 2018 was not realized, the resource was accessed to balance expenditures. This trend is anticipated to continue.
Factors contributing to the use of working capital to balance General Fund expenditures include:
• FY 2020 is the first year of a biennium with employer rates for PERS Tiers 1 / 2 at 25.49 percent, an increase of 21.0 percent from the FY 2019 rate. The impact of rate increases for all PERS tiers calculated against higher salary costs is anticipated to inflate the year-over-year expense for PERS in the General Fund by $2.8 million.
•
The benefit of the 3 percent statutory limit on property tax growth is the consistent source of revenue it provides. At an estimate of $71.4 million for FY 2020, representing 56 percent of all General Fund revenues, the disadvantage of the consistent rate of growth for property tax is its insufficiency relative to the rate of cost increases for General Fund services. The forecast for FY 2020 through FY 2024 anticipates property valuation gains of approximately 4 percent, the statutory limit and an estimated increase due to new growth.
9

FY 2020-2024 Forecast Opportunity Compassion Responsiveness Accessibility
Forecasted costs for the General Fund’s two largest departments – Police and Fire – equate to $82.9 million for FY 2020, 60 percent of the fund’s budget (without contingency). The FY 2020 forecast expense for the two public safety departments exceeds the current year base budget (without carryovers) by $4.04 million or 5.1 percent.
Forecast Result The outlook for the next five years, which incorporates the conditions noted above, as well as dozens of assumptions for both revenues and expenses, provides ongoing evidence of a structural imbalance between the proposed cost of General Fund services and anticipated revenues.
The fund is predicted to realize increases in almost every revenue type with an aggregate increase of 2.1 percent to 4.2 percent through the forecast period. This projected growth is not sufficient to meet the increasing costs for providing services, which are anticipated to grow by a range of 2.9 percent to 7.6 percent year-over-year. The primary drivers of expense increases for the fund remain those associated with the cost of employees.
The graph below illustrates recent revenue and expenditure history in the General Fund with projections for the current fiscal year and the five-year forecast period. A high-level summary of the five-year forecast with indicators of working capital status appears on the next page.
General Fund Revenue and Expenditure History and Forecast
$90.00
$110.00
$130.00
$150.00
$170.00
In Millions
Revenues ExpendituresContinued impact of prior year position reductions.
Reduction of approximately 40 positions; closure of 2 fire stations.
Four years of PERS rate relief and ongoing impact of position reductions. Property tax re-set. Use of $1.3M working capital to balance in FY 2017.
Use of $1.8M working capital to balance in FY 2018. Anticipate using $5.4M of working capital to balance in FY 2019.
10

FY 2020-2024 Forecast Opportunity Compassion Responsiveness Accessibility
General Fund Table 1, FY 2020 – FY 2024 Forecast Summary (Values in Millions, YEE = Year-End Estimate, F = Forecast, WC = Working Capital)
FY 2019YEE FY 2020F FY 2021F FY 2022F FY 2023F FY 2024F Beginning Working Capital $ 25.02 $ 19.59 $ 12.37 $ 5.67 $ 0.00 $ 0.00
Revenues 125.42 128.11 133.47 137.60 142.69 147.72
Total Resources $ 150.44 $ 147.70 $ 145.84 $ 143.27 $ 142.69 $ 147.72
Net Expenditures $ 130.85 $ 135.33 $ 140.17 $ 149.64 $ 154.03 $ 163.65 Ending Working Capital $ 19.59 $ 12.37 $ 5.67 $ (6.37) $ (11.34) $ (15.94)
Change to WC $ (5.43) $ (7.22) $ (6.70) $ (12.04) $ (11.34) $ (15.94)
WC Council Policy at 15% Revenues $ 18.81 $ 19.22 $ 20.02 $ 20.64 $ 21.40 $ 22.16
Policy Compliance Status of this Forecast
Forecast Result – General Fund Current Service Level Detail The forecast expenditure base is adjusted for all known and projected service level costs. This includes market adjustments or cost-of-living increases for all represented work units, as well as non-represented staff. These increases are held at 2.0 percent in the forecast for any year not included within a current labor contract. The expenditure base also includes known PERS rate escalations for FY 2020 and estimates for FY 2022 and FY 2024. Health benefits rate increases align with actuarial guidance. Most materials and services category items (professional services, supplies, equipment) have a 3.0 percent inflation during the five-year period.
Despite increases, which align with a five-year (FY 2014 – FY 2018) compounded rate of growth, the forecast demonstrates a level of projected revenues lower than the anticipated gain in service delivery costs. It also displays savings derived from unspent fund contingencies and a level of naturally occurring savings from employee attrition and other unanticipated economies ranging from 3.7 percent in FY 2020 to 3.4 percent in FY 2024. As context, the level of aggregate savings realized in FY 2018 was 4.7 percent and FY 2019 year-end savings are estimated at 4.0 percent.
$14.35 $0.78 $27.01 $32.74 $38.09 $6.85
11

FY 2020-2024 Forecast Opportunity Compassion Responsiveness Accessibility
General Fund Table 2, FY 2020 – FY 2024 Forecast The assumptions in the forecast lead to the depletion of working capital with it falling well below the minimum in the City’s financial policies by year-end FY 2020. In all forecast years, net expenditures exceed revenues by a range of $5.4 million to $15.9 million. This imbalance is illustrated in Table 1 on the preceding page and with additional detail in Table 2 below.
(Values in Millions, YE = Year-End)
FY 2019 YE Estimate
FY 2020 Forecast
FY 2021 Forecast
FY 2022 Forecast
FY 2023 Forecast
FY 2024 Forecast
Working Capital $ 25.02 $ 19.59 $ 12.37 $ 5.67 $ 0.00 $ 0.00 Revenues 125.42 128.11 133.47 137.60 142.69 147.72
TOTAL RESOURCES $ 150.44 $ 147.70 $ 145.84 $ 143.27 $ 142.69 $ 147.72
TOTAL EXPENDITURES $ 130.85 $ 140.48 $ 145.42 $ 155.09 $ 159.56 $ 169.38
Unspent Contingency (2.50) (2.50) (2.50) (2.50) (2.50) 2% Savings (2.65) (2.75) (2.94) (3.04) (3.23)
NET EXPENDITURES $ 130.85 $ 135.33 $ 140.17 $ 149.64 $ 154.03 $ 163.65
ENDING WORKING CAPITAL
$ 19.59 $ 12.37 $ 5.67 $ (6.37) $ (11.34) $ (15.94)
Chg to Working Capital (5.43) (7.22) (6.70) (12.04) (11.34) (15.94)
12
FY 2020-2024 Forecast Opportunity Compassion Responsiveness Accessibility
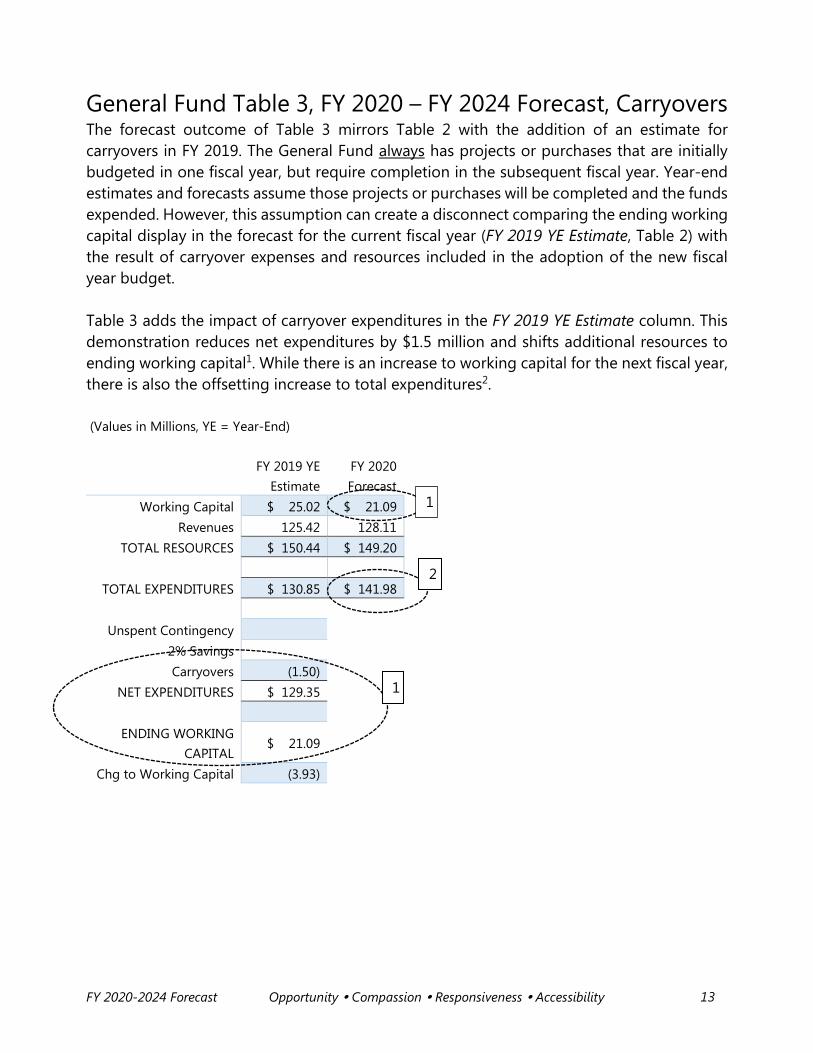
General Fund Table 3, FY 2020 – FY 2024 Forecast, Carryovers The forecast outcome of Table 3 mirrors Table 2 with the addition of an estimate for carryovers in FY 2019. The General Fund always has projects or purchases that are initially budgeted in one fiscal year, but require completion in the subsequent fiscal year. Year-end estimates and forecasts assume those projects or purchases will be completed and the funds expended. However, this assumption can create a disconnect comparing the ending working capital display in the forecast for the current fiscal year (FY 2019 YE Estimate, Table 2) with the result of carryover expenses and resources included in the adoption of the new fiscal year budget.
Table 3 adds the impact of carryover expenditures in the FY 2019 YE Estimate column. This demonstration reduces net expenditures by $1.5 million and shifts additional resources to ending working capital1. While there is an increase to working capital for the next fiscal year, there is also the offsetting increase to total expenditures2.
(Values in Millions, YE = Year-End)
FY 2019 YE Estimate
FY 2020 Forecast
Working Capital $ 25.02 $ 21.09 Revenues 125.42 128.11
TOTAL RESOURCES $ 150.44 $ 149.20
TOTAL EXPENDITURES $ 130.85 $ 141.98
Unspent Contingency 2% Savings Carryovers (1.50)
NET EXPENDITURES $ 129.35
ENDING WORKING CAPITAL
$ 21.09
Chg to Working Capital (3.93)
2
1
1
13
FY 2020-2024 Forecast Opportunity Compassion Responsiveness Accessibility
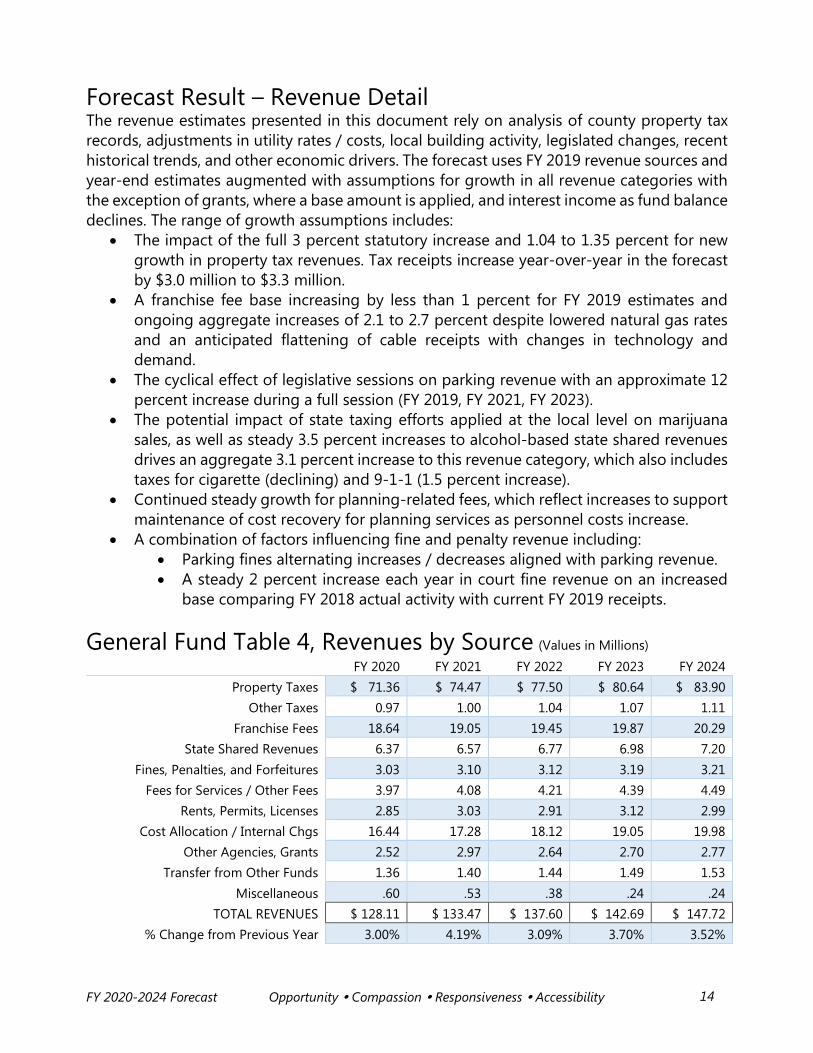
Forecast Result – Revenue Detail The revenue estimates presented in this document rely on analysis of county property tax records, adjustments in utility rates / costs, local building activity, legislated changes, recent historical trends, and other economic drivers. The forecast uses FY 2019 revenue sources and year-end estimates augmented with assumptions for growth in all revenue categories with the exception of grants, where a base amount is applied, and interest income as fund balance declines. The range of growth assumptions includes:
• The impact of the full 3 percent statutory increase and 1.04 to 1.35 percent for newgrowth in property tax revenues. Tax receipts increase year-over-year in the forecastby $3.0 million to $3.3 million.
• A franchise fee base increasing by less than 1 percent for FY 2019 estimates andongoing aggregate increases of 2.1 to 2.7 percent despite lowered natural gas ratesand an anticipated flattening of cable receipts with changes in technology anddemand.
• The cyclical effect of legislative sessions on parking revenue with an approximate 12percent increase during a full session (FY 2019, FY 2021, FY 2023).
• The potential impact of state taxing efforts applied at the local level on marijuanasales, as well as steady 3.5 percent increases to alcohol-based state shared revenuesdrives an aggregate 3.1 percent increase to this revenue category, which also includestaxes for cigarette (declining) and 9-1-1 (1.5 percent increase).
• Continued steady growth for planning-related fees, which reflect increases to supportmaintenance of cost recovery for planning services as personnel costs increase.
• A combination of factors influencing fine and penalty revenue including:• Parking fines alternating increases / decreases aligned with parking revenue.• A steady 2 percent increase each year in court fine revenue on an increased
base comparing FY 2018 actual activity with current FY 2019 receipts.
General Fund Table 4, Revenues by Source (Values in Millions)FY 2020 FY 2021 FY 2022 FY 2023 FY 2024
Property Taxes $ 71.36 $ 74.47 $ 77.50 $ 80.64 $ 83.90 Other Taxes 0.97 1.00 1.04 1.07 1.11
Franchise Fees 18.64 19.05 19.45 19.87 20.29 State Shared Revenues 6.37 6.57 6.77 6.98 7.20
Fines, Penalties, and Forfeitures 3.03 3.10 3.12 3.19 3.21 Fees for Services / Other Fees 3.97 4.08 4.21 4.39 4.49
Rents, Permits, Licenses 2.85 3.03 2.91 3.12 2.99 Cost Allocation / Internal Chgs 16.44 17.28 18.12 19.05 19.98
Other Agencies, Grants 2.52 2.97 2.64 2.70 2.77 Transfer from Other Funds 1.36 1.40 1.44 1.49 1.53
Miscellaneous .60 .53 .38 .24 .24 TOTAL REVENUES $ 128.11 $ 133.47 $ 137.60 $ 142.69 $ 147.72
% Change from Previous Year 3.00% 4.19% 3.09% 3.70% 3.52%
14

FY 2020-2024 Forecast Opportunity Compassion Responsiveness Accessibility
Forecast Result – Expenditure Detail The base forecast for the General Fund is developed using cost escalation information from labor agreements, health insurance consultant analysis, up-to-date PERS rate information and estimates for future years, vendor contracts, the Consumer Price Index, and other research to inform five years of expense inflation factors. The assumption tables used for expenditures are included in the appendix. The forecast includes a general inflationary increase of 3 percent to expenses in the materials and services category.
General Fund Table 5 summarizes the five-year expenditure forecast by expense category. Increased rates for compensation market adjustments, PERS obligations, and health insurances for current employees prompt increases in personal services. The area of the table with italicized text demonstrates the effect on base expenditures of anticipated savings and unspent contingencies to provide the calculation in the Total Net Expenditures row. In the FY 2020 column, the percent change from the previous year (bottom row) is based on the comparison of FY 2019 year-end estimates and the FY 2020 forecast.
General Fund Table 5, Expenditures by Category (Values in Millions)
FY 2020 FY 2021 FY 2022 FY 2023 FY 2024 Personal Services $ 109.09 $ 113.20 $ 121.58 $ 125.47 $ 134.34
Materials and Services 26.78 27.54 28.79 29.61 30.52 Capital Outlay 0.35 0.36 0.37 0.38 0.39
Debt Service 0.28 0.28 0.28 - - Transfers* 1.01 1.04 1.07 1.10 1.13
Contingency 3.00 3.00 3.00 3.00 3.00 TOTAL EXPENDITURES $ 140.48 $ 145.42 $ 155.09 $ 159.56 $ 169.38
Less: Unspent Contingency (2.50) (2.50) (2.50) (2.50) (2.50)
Anticipated Savings (2%) (2.65) (2.75) (2.94) (3.04) (3.23) TOTAL NET EXPENDITURES $ 135.33 $ 140.17 $ 149.64 $ 154.03 $ 163.65
% Change from Previous Year 3.42% 3.58% 6.76% 2.93% 6.25%
*Transfers include funding for information technology and facilities asset maintenance projects.
15

FY 2020-2024 Forecast Opportunity Compassion Responsiveness Accessibility
Forecast Variability – Working Capital Scenarios The graph below demonstrates variable results of the FY 2020 – FY 2024 forecast through the display of working capital - the difference between resources and expenditures for each fiscal year. There are three scenarios presented.
Scenario 1, Probable Scenario. The blue bar at the center of each grouping represents the result reflected in the numeric tables on the preceding pages of this document. The values reflect the forecasted levels of working capital. This result is compared against the gold horizontal line representing the dollar equivalent of City Council policy for General Fund working capital.
Scenario 2, Higher Revenue / Lower Expenses. The green bar in each fiscal year grouping represents the forecast result augmented by an additional 1 percent of revenue growth and an additional 1 percent of expenditure savings. The outcome of these variables does not prevent a decline in working capital. FY 2019 working capital remains in compliance with policy, and the forecast for the following year, FY 2020, is $1.7 million below policy.
Scenario 3, Lower Revenue / Higher Expenses. The red bar uses the forecast working capital as the base for assuming 1 percent lower revenues and 1 percent higher expense for each fiscal year. The result falls well below City Council policy as early as year-end FY 2019.
16
FY 2020-2024 Forecast Opportunity Compassion Responsiveness Accessibility
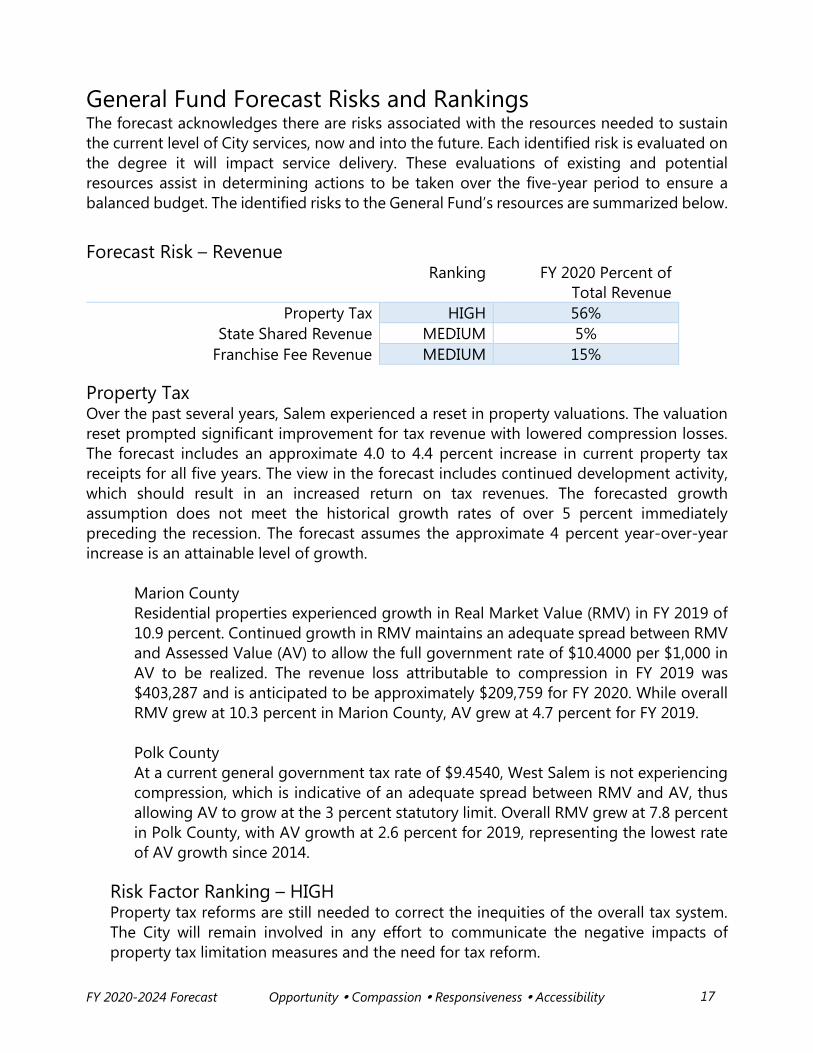
General Fund Forecast Risks and Rankings The forecast acknowledges there are risks associated with the resources needed to sustain the current level of City services, now and into the future. Each identified risk is evaluated on the degree it will impact service delivery. These evaluations of existing and potential resources assist in determining actions to be taken over the five-year period to ensure a balanced budget. The identified risks to the General Fund’s resources are summarized below.
Forecast Risk – Revenue Ranking FY 2020 Percent of
Total Revenue Property Tax HIGH 56%
State Shared Revenue MEDIUM 5% Franchise Fee Revenue MEDIUM 15%
Property Tax Over the past several years, Salem experienced a reset in property valuations. The valuation reset prompted significant improvement for tax revenue with lowered compression losses. The forecast includes an approximate 4.0 to 4.4 percent increase in current property tax receipts for all five years. The view in the forecast includes continued development activity, which should result in an increased return on tax revenues. The forecasted growth assumption does not meet the historical growth rates of over 5 percent immediately preceding the recession. The forecast assumes the approximate 4 percent year-over-year increase is an attainable level of growth.
Marion County Residential properties experienced growth in Real Market Value (RMV) in FY 2019 of 10.9 percent. Continued growth in RMV maintains an adequate spread between RMV and Assessed Value (AV) to allow the full government rate of $10.4000 per $1,000 in AV to be realized. The revenue loss attributable to compression in FY 2019 was $403,287 and is anticipated to be approximately $209,759 for FY 2020. While overall RMV grew at 10.3 percent in Marion County, AV grew at 4.7 percent for FY 2019.
Polk County At a current general government tax rate of $9.4540, West Salem is not experiencing compression, which is indicative of an adequate spread between RMV and AV, thus allowing AV to grow at the 3 percent statutory limit. Overall RMV grew at 7.8 percent in Polk County, with AV growth at 2.6 percent for 2019, representing the lowest rate of AV growth since 2014.
Risk Factor Ranking – HIGH Property tax reforms are still needed to correct the inequities of the overall tax system. The City will remain involved in any effort to communicate the negative impacts of property tax limitation measures and the need for tax reform.
17
FY 2020-2024 Forecast Opportunity Compassion Responsiveness Accessibility
State Shared Revenues Receipts from two of four shared revenues – liquor tax and revenue sharing from the sale of alcoholic beverages – are expected to experience an approximate 3.5 percent annual increase during the forecast period. Shared cigarette tax revenues are expected to decline over the five-year period. The forecast assumes the 9-1-1 tax revenue will experience growth at approximately 1.5 percent each year. The forecast also assumes a 3.5 percent rate of increase for state marijuana tax revenues over a much improved base as compared to original FY 2018 estimates.
Risk Factor Ranking – MEDIUM Policy changes are needed for the 9-1-1 system to be adequately funded for the emergency services it provides. State shared revenue sources must be defended against legislation that may divert portions of these revenues to resolving state budget challenges.
Franchise Fee Revenues Franchise fee revenue for energy utility providers is projected to remain flat for natural gas and increase by 2.5 percent for electricity over the estimated FY 2019 base for both franchise types. PGE’s electricity rate request to the Public Utility Commission is pending. A 2 percent increase in franchise revenue is anticipated for Salem Electric resulting from anticipated growth in the customer base.
An approximate aggregate reduction of 2 percent for Northwest Natural Gas franchise fees offset with the potential for increased usage prompted the neutral forecast. The FY 2019 base for this franchise fee is 8 percent lower than actual receipts for FY 2018.
The City’s water and wastewater franchise fee anticipated growth is based upon projections from the City’s internal rate modeling with 2.8 to 3.0 percent rate of growth for years two through five of the forecast. Cable franchise revenue is anticipated to remain flat for the forecast period due to predicted changes in demand and options for consumers. Refuse hauler franchise fees are projected to grow by 3 percent in each year of the forecast period due to anticipated cost-of-service increases. Three percent growth is forecast for Telecommunications for FY 2020 and FY 2021 based on current trending with 2 percent increases forecast beginning in year three.
Risk Factor Ranking – MEDIUM Growth in this revenue is difficult to predict as it is influenced by the provider’s billing rate, customer growth, technological changes, conservation, legislation, and weather. These fees are one of the three primary, external revenue sources in the General Fund. Potential changes need to be monitored and, in the case of legislative challenges, defended.
18
FY 2020-2024 Forecast Opportunity Compassion Responsiveness Accessibility
Transportation Services Fund Summary The Public Works Department’s Transportation Services Fund (Fund 155) supports the operation and maintenance of the City’s streets, traffic signals, and sidewalks. The Transportation Services Fund provides the financial structure for the department to respond to City Council goals that address public safety, livability, environmental health, and economic development.
Current Status Adoption of the streetlight fee and creation of the Streetlight Fund (Fund 156), effective in FY 2016, relieved the Transportation Services Fund of about $1.3 million in electricity expenses and costs to install, maintain, and replace light poles. Creating the Streetlight Fund provided immediate stabilization to the Transportation Services Fund, which had experienced an ongoing imbalance between current revenue sources and the cost of providing transportation services. In 2017, the Oregon State Legislature passed HB 2017, Keep Oregon Moving, providing increases in state highway revenue for the purpose of making a significant investment in transportation. State highway revenue, distributed by formula to local jurisdictions, is anticipated to increase over the next five years. Based on the relief from streetlight expenses and the anticipated increase in revenues from the state, an annual $400,000 General Fund contribution to the Transportation Services Fund was eliminated beginning in FY 2019.
Based on the state revenue projections, the Transportation Services Fund will be able to sustain basic operations but will be unable to support any significant structural pavement maintenance and reconstruction activities. The FY 2019 forecast and budget added a small annual allocation for safe crossings, transportation opportunity grants, and limited preventive pavement maintenance. The FY 2019 budget also included two paving projects totaling $1.2 million, one on Orchard Heights Road NW and the other on Market Street NE. FY 2019 began with working capital of $3.92 million, and year-end estimates reflect use of approximately $1.80 million to balance expenditures. The decline in fund balance is the result of greater investment in one-time pavement rehabilitation activities and special projects. This level of investment is not sustainable.
Future Outlook This five-year forecast is an analysis of the Transportation Services Fund based upon current and reasonable economic assumptions. It provides a view of the financial impacts of the City’s services, priorities, and policies within the context of national, state, and local economic factors; emerging vehicle technologies; worldwide and regional petroleum supplies and prices; consumer behavior; and growth in primary revenue sources. The forecast includes a variety of assumptions for expenditure activity over five years. The primary drivers increasing expenditures include: wages, Public Employees Retirement System (PERS), health care,
19

FY 2020-2024 Forecast Opportunity Compassion Responsiveness Accessibility
energy, and inflation on contracted goods and services. The tables for the expenditure assumptions are included in the appendix.
The primary funding source for Transportation Services is the City’s monthly allocation of state highway fund revenues, which includes motor vehicle fuel taxes; heavy commercial vehicle weight / mile taxes; and title, licensing, and registration fees.
The Oregon Department of Transportation (ODOT) provides a forecast of state highway fund revenue twice a year in June and December. This forecast is based on the ODOT forecast published in June 2018 with anticipated increases as a result of new legislation. The 2018 forecast is more conservative than in 2017. Many factors impact fuel usage trends including changes in the consumers’ fleet (fuel efficient, hybrid, and electric vehicles) and the effect of retail fuel prices on consumption. The most recent ODOT forecast for Salem reflects a 4.45 percent increase from FY 2019 to FY 2020 and assumes conditional increases in January of 2020, 2022, and 2024 based on accountability requirements in the legislation. If the accountability requirements are not met, there is a risk that revenue forecasts will be reduced in 2020 and beyond.
Expenditures in the City’s forecast are proposed to include minimal asphalt paving using in-house City resources to complete a combination of maintenance overlays as well as mill and inlay repairs. Preventive pavement maintenance, including crack seal and slurry seal treatments, will also continue on residential and higher traffic volume streets. The forecast includes the addition of one street maintenance position to support pavement maintenance activities with the cost partially offset by a reduction to seasonal labor. Available funding is not sufficient to support ongoing structural pavement rehabilitation projects beyond this limited in-house maintenance program.
In compliance with the Americans with Disabilities Act (ADA), whenever a street surface is altered, all necessary ADA facilities are installed or upgraded. Accessibility improvements represent about 30 percent of the current street overlay program expenditures. The City will continue a sidewalk repair program along ADA prioritized pedestrian routes with the Sidewalk Rehabilitation Team. The Sidewalk Response Team will conduct smaller planned improvements as well as respond to identified hazards in neighborhoods. The City will also continue important routine maintenance activities such as signs, markings, striping, right-of-way landscape and tree maintenance, snow and ice response, shoulder / alley grading, pedestrian and bicycle safety improvements, and traffic signal operations and maintenance.
The forecast employs a 3 percent savings rate, commensurate with recent experience, which supports the assumption that ongoing efforts to reduce costs will have a corresponding impact on the capacity to save. Values in the forecast are represented in millions and have been rounded to the nearest ten thousand.
20

FY 2020-2024 Forecast Opportunity Compassion Responsiveness Accessibility
Forecast Result Transportation Services Fund Current Service Level Detail The forecast is based on the service level represented by Transportation Services’ FY 2019 budget and maintains the $1 million annual program for sidewalk maintenance and replacement, including the priority response team, during the five years of the forecast. The forecast also maintains $3 million for pavement maintenance activities annually that include trench patching, asphalt and concrete road surface maintenance, and preventive crack seal or slurry seal contracts. Legislated gas tax increases will provide an increase to state highway revenue - the primary revenue source for the Transportation Services Fund. Routine activities such as signs, markings, striping, right-of-way landscape and tree maintenance, snow and ice response, shoulder / alley grading, pedestrian and bicycle safety improvements, and traffic signal operations and maintenance are included throughout the forecast period. Available revenue is not sufficient to fund an ongoing structural pavement rehabilitation program. Large capital investments in the transportation system will require supplemental funding through future bond measures.
A greater level of pavement maintenance and sidewalk replacement is desired over time. The Sustainable Services Revenue Task Force recommended City Council explore a local option gas tax. If enacted at a rate of $0.06 per gallon, a local option gas tax is anticipated to provide $4.8 million in annual resources. A portion of these resources could be directed to maintaining existing programs at current levels, as costs continue to escalate, and a portion could be directed to capital projects for pavement and sidewalk rehabilitation and replacement. A local option gas tax requires voter approval. The local tax allows all who benefit from the transportation system – residents, workers, and visitors – to contribute to its maintenance.
The City will continue to monitor revenue and expenditures to balance resources with the escalating cost of providing desired services. The City will annually review the fiscal health of the fund and reevaluate program priorities should the current levels of service become unsustainable.
21

FY 2020-2024 Forecast Opportunity Compassion Responsiveness Accessibility
TS Fund Table 1, FY 2020 – FY 2024 Forecast Summary (Values in Millions, YEE = Year-End Estimate, F = Forecast)
FY 2019YEE FY 2020F FY 2021F FY 2022F FY 2023F FY 2024F Beginning Working Capital $ 3.92 $ 2.12 $ 1.90 $ 1.97 $ 1.43 $ 1.10
Revenues 15.04 15.47 16.44 17.18 17.77 17.99
Total Resources $ 18.96 $ 17.59 $ 18.33 $ 19.15 $ 19.20 $ 19.09
Net Expenditures $ 16.84 $ 15.70 $ 16.36 $ 17.72 $ 18.10 $ 18.38 Ending Working Capital $ 2.12 $ 1.90 $ 1.97 $ 1.43 $ 1.10 $ 0.71
Change to Working Capital
Table 2 is the full summary of the Transportation Services Fund forecast, including the components of Net Expenditures. Personal services costs in this forecast are based on current labor contracts, and in the later years of the forecast, annual adjustments to salary are 2.0 percent.
TS Fund Table 2, FY 2020 – FY 2024 Forecast Summary (Values in Millions, YE = Year-End)
FY 2019 YE Estimate
FY 2020 Forecast
FY 2021 Forecast
FY 2022 Forecast
FY 2023 Forecast
FY 2024 Forecast
Working Capital $ 3.92 $ 2.12 $ 1.90 $ 1.97 $ 1.43 $ 1.10 Revenues 15.04 15.47 16.44 17.18 17.77 17.99
TOTAL RESOURCES $ 18.96 $ 17.59 $ 18.33 $ 19.15 $ 19.20 $ 19.09
TOTAL EXPENDITURES $ 16.84 $ 16.66 $ 17.34 $ 18.74 $ 19.13 $ 19.42
Unspent Contingency (0.50) (0.50) (0.50) (0.50) (0.50) 3% Savings (0.47) (0.48) (0.52) (0.53) (0.54)
NET EXPENDITURES $ 16.84 $ 15.70 $ 16.36 $ 17.72 $ 18.10 $ 18.38
ENDING WORKING CAPITAL
$ 2.12 $ 1.90 $ 1.97 $ 1.43 $ 1.10 $ 0.71
Chg to Working Capital (1.80) (0.22) 0.08 (0.55) (0.33) (0.39)
$0.55 $0.33 $0.39 $0.22 $0.08 $1.80
22
FY 2020-2024 Forecast Opportunity Compassion Responsiveness Accessibility
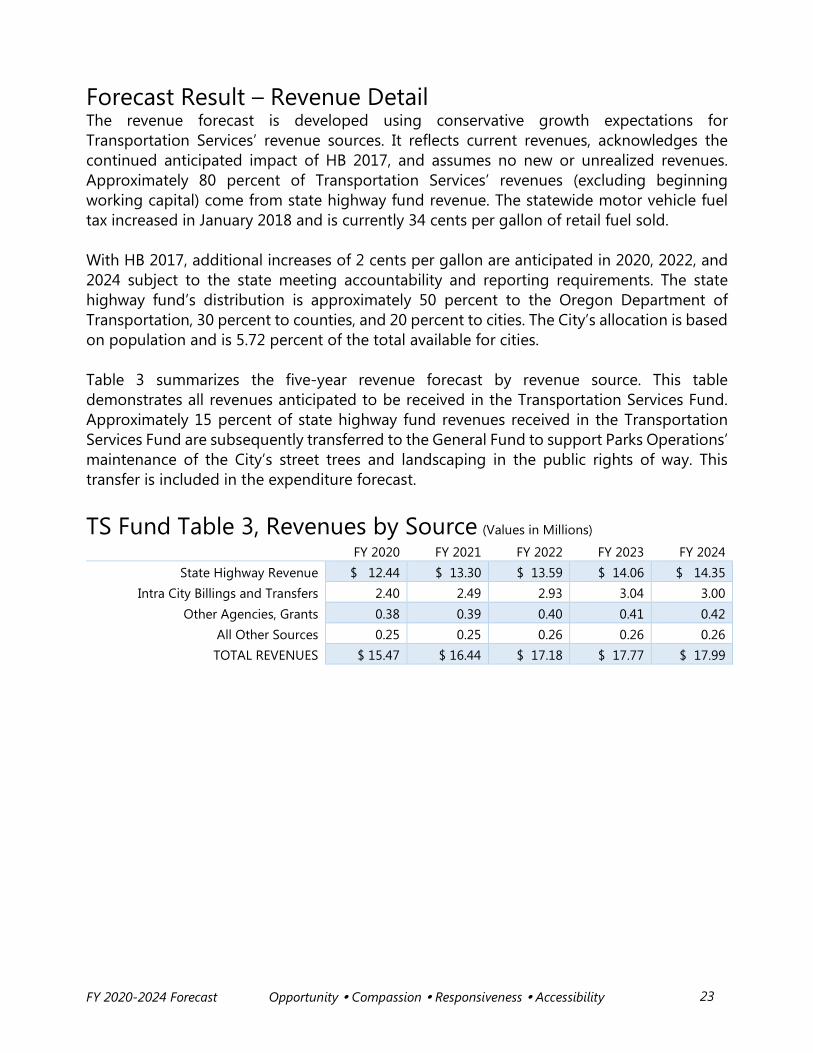
Forecast Result – Revenue Detail The revenue forecast is developed using conservative growth expectations for Transportation Services’ revenue sources. It reflects current revenues, acknowledges the continued anticipated impact of HB 2017, and assumes no new or unrealized revenues. Approximately 80 percent of Transportation Services’ revenues (excluding beginning working capital) come from state highway fund revenue. The statewide motor vehicle fuel tax increased in January 2018 and is currently 34 cents per gallon of retail fuel sold.
With HB 2017, additional increases of 2 cents per gallon are anticipated in 2020, 2022, and 2024 subject to the state meeting accountability and reporting requirements. The state highway fund’s distribution is approximately 50 percent to the Oregon Department of Transportation, 30 percent to counties, and 20 percent to cities. The City’s allocation is based on population and is 5.72 percent of the total available for cities.
Table 3 summarizes the five-year revenue forecast by revenue source. This table demonstrates all revenues anticipated to be received in the Transportation Services Fund. Approximately 15 percent of state highway fund revenues received in the Transportation Services Fund are subsequently transferred to the General Fund to support Parks Operations’ maintenance of the City’s street trees and landscaping in the public rights of way. This transfer is included in the expenditure forecast.
TS Fund Table 3, Revenues by Source (Values in Millions)
FY 2020 FY 2021 FY 2022 FY 2023 FY 2024 State Highway Revenue $ 12.44 $ 13.30 $ 13.59 $ 14.06 $ 14.35
Intra City Billings and Transfers 2.40 2.49 2.93 3.04 3.00 Other Agencies, Grants 0.38 0.39 0.40 0.41 0.42
All Other Sources 0.25 0.25 0.26 0.26 0.26 TOTAL REVENUES $ 15.47 $ 16.44 $ 17.18 $ 17.77 $ 17.99
23

FY 2020-2024 Forecast Opportunity Compassion Responsiveness Accessibility
Forecast Result – Expenditure Detail The expenditure forecast is developed based on anticipated increases in the cost of labor, materials, and capital. When available, it uses known expenditure information such as labor agreements, vendor contracts, PERS rates, health care cost increases, and inflation factors.
Table 4 summarizes the five-year expenditure forecast by expense category. The forecast assumes $1 million for sidewalk maintenance programs and $3 million for pavement maintenance activities annually. City crews will undertake the majority of this work through utility trench patching, pothole repair, skin patching, focused mill and inlay repair, and overlays. Approximately $200,000 is planned for annual preventive pavement maintenance contracts. Revenue is not sufficient to sustain a pavement rehabilitation and construction program. Expenditure assumption tables are included in the appendix. Projected growth in service delivery costs is anticipated to result in a decline in working capital of $1.4 million by the end of the forecast period (see Table 2, Ending Working Capital row), even with the elimination of pavement rehabilitation contracts.
TS Fund Table 4, Expenditures by Category (Values in Millions)
FY 2020 FY 2021 FY 2022 FY 2023 FY 2024 Personal Services $ 6.66 $ 6.92 $ 7.39 $ 7.62 $ 8.14
Materials and Services 8.88 9.21 9.88 10.19 9.93 Capital Outlay 0.17 0.08 0.31 0.14 0.14
Transfers 0.45 0.63 0.65 0.68 0.71 Contingency 0.50 0.50 0.50 0.50 0.50
TOTAL EXPENDITURES $ 16.66 $ 17.34 $ 18.74 $ 19.13 $ 19.42 Less:
Unspent Contingency (0.50) (0.50) (0.50) (0.50) (0.50) Anticipated Savings (8%) (0.47) (0.48) (0.52) (0.53) (0.54)
TOTAL NET EXPENDITURES $ 15.70 $ 16.36 $ 17.72 $ 18.10 $ 18.38
24

FY 2020-2024 Forecast Opportunity Compassion Responsiveness Accessibility
Forecast Variability – Working Capital Scenarios (Values in Millions) The graph below demonstrates variable results of the FY 2020 – FY 2024 forecast through the display of working capital - the difference between resources and expenditures for each fiscal year. There are three scenarios presented.
Scenario 1, Probable Scenario. The blue bar at the center of each grouping represents the result reflected in the numeric tables on the preceding pages of this document. The values reflect the forecasted levels of working capital.
Scenario 2, Higher Revenue / Lower Expenses. The green bar in each fiscal year grouping represents the forecast result to working capital augmented by an additional 1 percent of revenue growth and an additional 1 percent of expenditure savings. For the Transportation Services Fund, these changes represent increases to working capital of $311,700 to $363,680 each year of the forecast.
Scenario 3, Lower Revenue / Higher Expenses. The red bar uses the forecast working capital as the base for assuming 1 percent lower revenues and 1 percent higher expense for each fiscal year. By year-end FY 2022, this demonstration reflects working capital being depleted by 93 percent, a loss of $1.68 million, as compared to year-end FY 2019.
-$2.00
-$1.50
-$1.00
-$0.50
$0.00
$0.50
$1.00
$1.50
$2.00
$2.50
$3.00
$3.50
+1% Probable -1%
25

FY 2020-2024 Forecast Opportunity Compassion Responsiveness Accessibility
Transportation Services Fund Forecast Risks and Rankings Transportation Services will be able to sustain the current level of services during the five-year period. Each identified forecast risk is evaluated on the degree it will impact service delivery. These evaluations of existing and potential resources assist in determining actions to be taken over the five-year period to ensure a balanced budget. The most significant risk to Transportation Services’ resources is a reduction in state highway fund revenue, which is summarized below.
Forecast Risk – Revenue Ranking Percent Total Revenue
State Highway Revenue MEDIUM 80%
State Highway Fund Revenue Transportation Services’ primary revenue source is the City’s allocation of state highway fund revenues – a revenue source over which the City has little or no control. Revenues are impacted by worldwide, national, and regional factors including the availability of fuels, prices, transport costs, refinery capacity, vehicle technology, and consumer behavior. The amount and allocation of motor vehicle fuel taxes and DMV fees is determined by the state legislature. The ongoing risk to the City is that any loss between forecasted revenues and actual receipts will require a corresponding reduction in City services.
Risk Factor Ranking – MEDIUM State highway fund revenue can be subject to changes in legislation, technology, petroleum supplies, prices, and consumer behavior. As the primary revenue source for the City’s transportation services, potential changes need to be monitored and, in the case of legislative challenges, defended.
26

FY 2020-2024 Forecast Opportunity Compassion Responsiveness Accessibility
Utility Fund Summary The City manages its utility services in a fiscally responsible manner to ensure ongoing day-to-day operations and provide capital funding for infrastructure. The Utility Fund (Fund 310) supports:
• Treatment, storage, and delivery of drinking water to residents, businesses, and industries;
• Collection, conveyance, and treatment of wastewater before it returns to the Willamette River; and
• Collection and conveyance of stormwater runoff from streets, buildings, and other hard surfaces to reduce risks of flooding and protect the environment.
Current Status The Utility Fund is in excellent financial shape. City Council has adopted prudent rate increases and staff has worked effectively to manage expenses, allowing the City to operate, maintain, and modernize the utility’s infrastructure as well as service and reduce the debt load incurred from prior large capital programs. When the water advisory occurred in summer 2018, the City was able to navigate the financial challenge and plan for investments without an immediate rate impact.
Salem’s Utility is the community’s most valuable asset, with an estimated facility value of about $4 billion. Over $300 million was invested at the turn of the century to modernize and expand the system. Many of these improvements were related to the Willow Lake Water Pollution Control Facility. As a result of the recent water advisory event, the FY 2020 forecast anticipates a $50 million debt issuance in February 2020 for projects focused on water treatment and supplemental supply. Continued improvements must be made to the Utility at a sustainable pace, balancing rate impacts with the rehabilitation, expansion, resiliency, and modernization needs of the systems.
FY 2019 began with working capital of $46.3 million. The change to this balance from the prior fiscal year was a decrease of $3.5 million. The City supported its response to the recent water advisory event with increased use of working capital.
Future Outlook The forecast presented this year continues to demonstrate conservative, but adequate spending, resulting in the maintenance of an ending working capital balance of $41 to $44 million throughout the five-year period. This balance meets the requirement of a 120-day
27
FY 2020-2024 Forecast Opportunity Compassion Responsiveness Accessibility
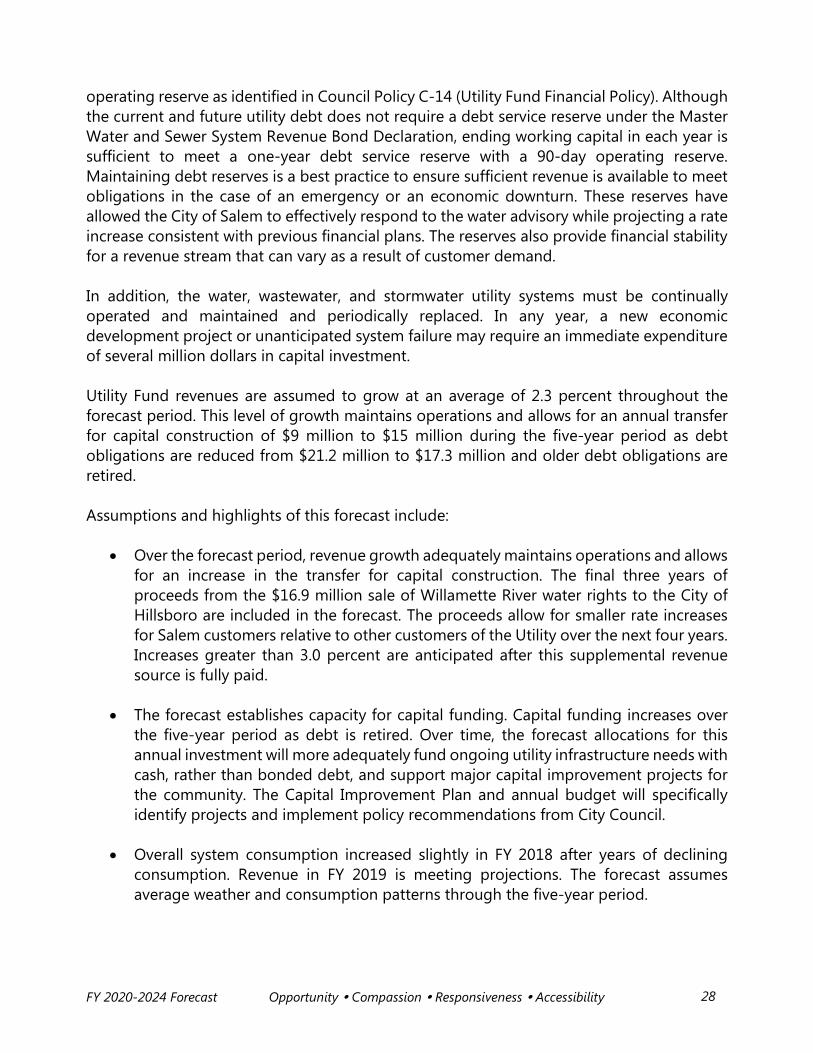
operating reserve as identified in Council Policy C-14 (Utility Fund Financial Policy). Although the current and future utility debt does not require a debt service reserve under the Master Water and Sewer System Revenue Bond Declaration, ending working capital in each year is sufficient to meet a one-year debt service reserve with a 90-day operating reserve. Maintaining debt reserves is a best practice to ensure sufficient revenue is available to meet obligations in the case of an emergency or an economic downturn. These reserves have allowed the City of Salem to effectively respond to the water advisory while projecting a rate increase consistent with previous financial plans. The reserves also provide financial stability for a revenue stream that can vary as a result of customer demand.
In addition, the water, wastewater, and stormwater utility systems must be continually operated and maintained and periodically replaced. In any year, a new economic development project or unanticipated system failure may require an immediate expenditure of several million dollars in capital investment.
Utility Fund revenues are assumed to grow at an average of 2.3 percent throughout the forecast period. This level of growth maintains operations and allows for an annual transfer for capital construction of $9 million to $15 million during the five-year period as debt obligations are reduced from $21.2 million to $17.3 million and older debt obligations are retired.
Assumptions and highlights of this forecast include:
• Over the forecast period, revenue growth adequately maintains operations and allowsfor an increase in the transfer for capital construction. The final three years ofproceeds from the $16.9 million sale of Willamette River water rights to the City ofHillsboro are included in the forecast. The proceeds allow for smaller rate increasesfor Salem customers relative to other customers of the Utility over the next four years.Increases greater than 3.0 percent are anticipated after this supplemental revenuesource is fully paid.
• The forecast establishes capacity for capital funding. Capital funding increases overthe five-year period as debt is retired. Over time, the forecast allocations for thisannual investment will more adequately fund ongoing utility infrastructure needs withcash, rather than bonded debt, and support major capital improvement projects forthe community. The Capital Improvement Plan and annual budget will specificallyidentify projects and implement policy recommendations from City Council.
• Overall system consumption increased slightly in FY 2018 after years of decliningconsumption. Revenue in FY 2019 is meeting projections. The forecast assumesaverage weather and consumption patterns through the five-year period.
28

FY 2020-2024 Forecast Opportunity Compassion Responsiveness Accessibility
Forecast Result Utility Fund Current Service Level Detail The Utility Fund forecast provides a view of the financial impact on the City’s utilities services, priorities, and policies in relation to projected economic activity through FY 2024. This view is influenced by federal and state economic factors and trends, local business activity and property development, and growth in primary revenue sources. Water, wastewater, and stormwater rate revenues are anticipated to provide approximately 83 percent of the fund’s total new revenue in FY 2020. Additionally, the forecast includes a variety of assumptions for expenditure activity over five years. The primary drivers of expense increases include labor agreements, PERS and health care costs, energy costs, and inflationary increases on contracted goods and services. The tables for expenditure assumptions are included in the appendix section of this document.
Developing a forecast for water, wastewater, and stormwater utilities requires establishing specific assumptions regarding the customer base, growth, consumption, economic trends, operating needs, and capital requirements. All assumptions have been reviewed based on historical data through FY 2018 and in the context of current economic trends and industry standards. Each assumption about economic variables can have a restrictive or expansive effect on projected cash flow. The goal is to be realistically conservative while not overly restricting financial capacity for operations, maintenance, and capital improvements.
The values in the Utility Fund forecast are expressed in millions of dollars and have been rounded to the nearest ten thousand. The forecast builds out the five years using the FY 2019 Year End (YE) Estimate column as the base year. The base year uses current information to update revenue trends and adjust the expenditure base for any ongoing service level changes. The October 2018 City Council-adopted rate adjustments are reflected for calendar years 2019 and 2020: 3 percent for water, 2.5 percent for wastewater, and 5 percent for stormwater. The remaining years of the forecast assume a 3 percent revenue slope for water and wastewater and 5 percent for stormwater. The fund maintains an adequate level of working capital throughout the forecast period.
29

FY 2020-2024 Forecast Opportunity Compassion Responsiveness Accessibility
Utility Fund Table 1, FY 2020 – FY 2024 Forecast Summary (Values in Millions, YEE = Year-End Estimate, F = Forecast)
FY 2019YEE FY 2020F FY 2021F FY 2022F FY 2023F FY 2024F Beginning Working Capital $ 46.25 $ 37.66 $ 42.23 $ 44.03 $ 43.88 $ 41.46
Revenues 103.49 106.95 109.85 112.04 112.55 115.88
Total Resources $ 149.74 $ 144.61 $ 152.09 $ 156.06 $ 156.43 $ 157.35
Net Expenditures $ 112.09 $ 102.38 $ 108.06 $ 112.18 $ 114.97 $ 116.52 Ending Working Capital $ 37.66 $ 42.23 $ 44.03 $ 43.88 $ 41.46 $ 40.82
Change to Working Capital
Table 2 on the next page is the full summary of the Utility Fund forecast, including the components of Net Expenditures. Personal services costs in this forecast are based on current labor contracts, and in the later years of the forecast, annual adjustments to salary at 2.0 percent.
$4.58 $(2.42) $(0.64) $(8.59) $1.79 $(0.15)
30
FY 2020-2024 Forecast Opportunity Compassion Responsiveness Accessibility
Utility Fund Table 2, FY 2020 – FY 2024 Forecast Summary (Valuesin Millions)
FY 2019 YE Estimate
FY 2020 Forecast
FY 2021 Forecast
FY 2022 Forecast
FY 2023 Forecast
FY 2024 Forecast
Working Capital $ 46.25 $ 37.66 $ 42.23 $ 44.03 $ 43.88 $ 41.46 Revenues 103.49 106.95 109.85 112.04 112.55 115.88
TOTAL RESOURCES $ 149.74 $ 144.61 $ 152.09 $ 156.06 $ 156.43 $ 157.35
TOTAL EXPENDITURES $ 112.09 $ 111.52 $ 117.44 $ 121.93 $ 124.87 $ 126.72
Unspent Contingency (3.00) (3.00) (3.00) (3.00) (3.00) 8% Savings (6.15) (6.38) (6.75) (6.90) (7.20)
NET EXPENDITURES $ 112.09 $ 102.38 $ 108.06 $ 112.18 $ 114.97 $ 116.52
ENDING WORKING CAPITAL
$ 37.66 $ 42.23 $ 44.03 $ 43.88 $ 41.46 $ 40.82
Chg to Working Capital (8.59) 4.58 1.79 (0.15) (2.42) (0.64)
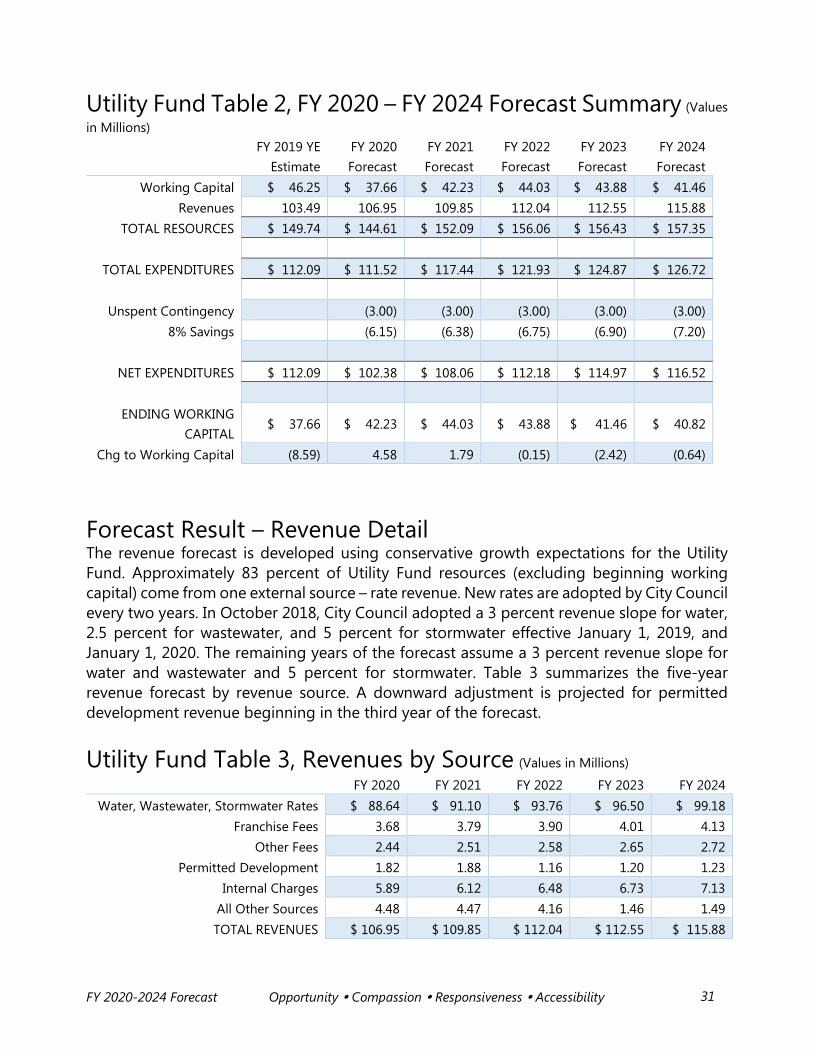
Forecast Result – Revenue Detail The revenue forecast is developed using conservative growth expectations for the Utility Fund. Approximately 83 percent of Utility Fund resources (excluding beginning working capital) come from one external source – rate revenue. New rates are adopted by City Council every two years. In October 2018, City Council adopted a 3 percent revenue slope for water, 2.5 percent for wastewater, and 5 percent for stormwater effective January 1, 2019, and January 1, 2020. The remaining years of the forecast assume a 3 percent revenue slope for water and wastewater and 5 percent for stormwater. Table 3 summarizes the five-year revenue forecast by revenue source. A downward adjustment is projected for permitted development revenue beginning in the third year of the forecast.
Utility Fund Table 3, Revenues by Source (Values in Millions)
FY 2020 FY 2021 FY 2022 FY 2023 FY 2024 Water, Wastewater, Stormwater Rates $ 88.64 $ 91.10 $ 93.76 $ 96.50 $ 99.18
Franchise Fees 3.68 3.79 3.90 4.01 4.13 Other Fees 2.44 2.51 2.58 2.65 2.72
Permitted Development 1.82 1.88 1.16 1.20 1.23 Internal Charges 5.89 6.12 6.48 6.73 7.13
All Other Sources 4.48 4.47 4.16 1.46 1.49 TOTAL REVENUES $ 106.95 $ 109.85 $ 112.04 $ 112.55 $ 115.88
31

FY 2020-2024 Forecast Opportunity Compassion Responsiveness Accessibility
Forecast Result – Expenditure Detail The expenditure forecast is developed based on anticipated increases in the costs of labor, materials, and capital, and generally agrees with assumptions used across all City funds. When available, it uses known expenditure information such as labor agreements, vendor contracts, the most recent information for PERS rates and health care cost increases, and inflation factors. Future costs associated with higher PERS obligations for current employees are included. Table 4 summarizes the five-year expenditure forecast by category. Three new positions are included in the forecast: two water treatment operators and a wastewater facility maintenance operator. Costs for these positions are reflected in all five years of the forecast.
Transfers are anticipated annually from the Utility Fund to the Capital Improvements Fund for utility construction projects. During the forecast period, transfers are projected to increase from $9 million in the first year to $15 million in the fifth year. The peak represents less than a 0.5 percent annual investment in the utility’s infrastructure, but when combined with annual debt service, the investment is maintained throughout the forecast period at $30 to $34 million annually. The City’s goal is continual increases in the annual capital construction transfers, as debt is retired, until the transfers equal $40 million – or 1 percent – of the asset’s $4 billion value. This goal will allow the City to address new capitalimprovements and replace aging infrastructure, and is based on the assumption that, onaverage, infrastructure lasts 100 years.
Utility Fund Table 4, Expenditures by Category (Values in Millions)
FY 2020 FY 2021 FY 2022 FY 2023 FY 2024 Personal Services $ 39.63 $ 41.23 $ 44.11 $ 45.59 $ 48.67
Materials and Services 37.19 38.53 40.21 40.72 41.27 Capital Outlay 1.52 1.52 1.52 1.52 1.52
Debt Service 21.19 19.16 19.10 19.05 17.26 Transfers 9.00 14.00 14.00 15.00 15.00
Contingency 3.00 3.00 3.00 3.00 3.00 TOTAL EXPENDITURES $ 111.52 $ 117.44 $ 121.93 $ 124.87 $ 126.72
Less: Unspent Contingency (3.00) (3.00) (3.00) (3.00) (3.00)
Anticipated Savings (8%) (6.15) (6.38) (6.75) (6.90) (7.20) TOTAL NET EXPENDITURES $ 102.38 $ 108.06 $ 112.18 $ 114.97 $ 116.52
32
FY 2020-2024 Forecast Opportunity Compassion Responsiveness Accessibility
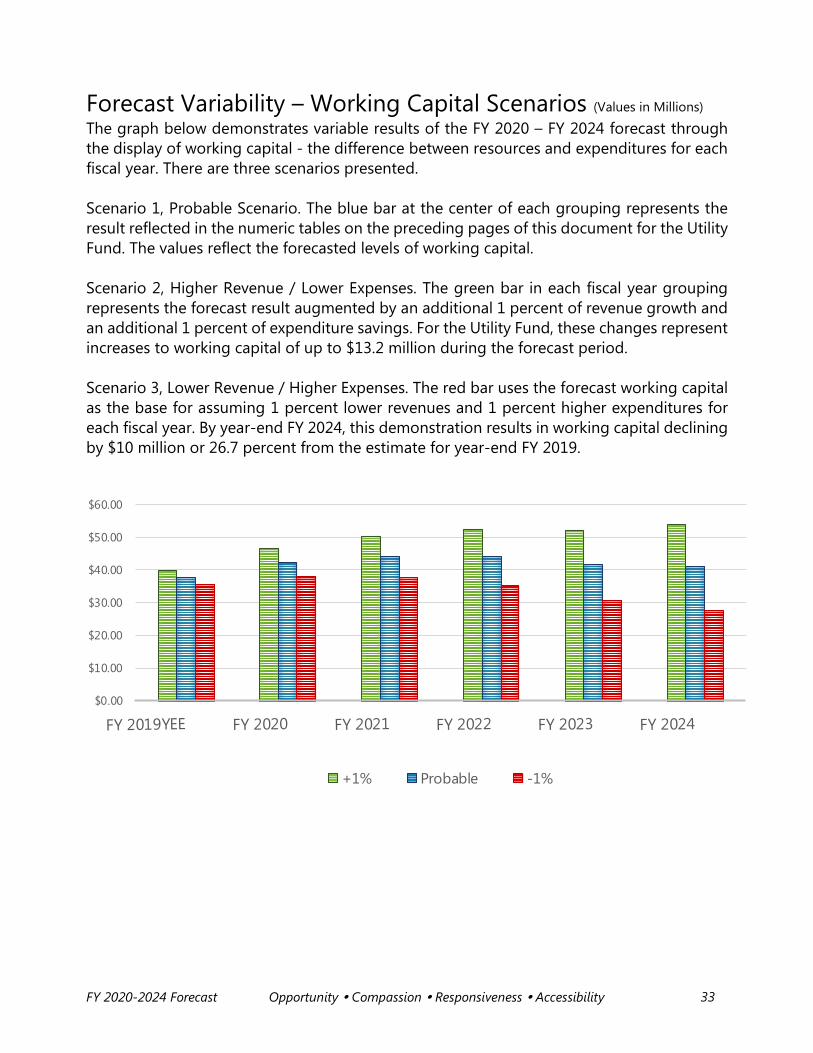
Forecast Variability – Working Capital Scenarios (Values in Millions)
The graph below demonstrates variable results of the FY 2020 – FY 2024 forecast through the display of working capital - the difference between resources and expenditures for each fiscal year. There are three scenarios presented.
Scenario 1, Probable Scenario. The blue bar at the center of each grouping represents the result reflected in the numeric tables on the preceding pages of this document for the Utility Fund. The values reflect the forecasted levels of working capital.
Scenario 2, Higher Revenue / Lower Expenses. The green bar in each fiscal year grouping represents the forecast result augmented by an additional 1 percent of revenue growth and an additional 1 percent of expenditure savings. For the Utility Fund, these changes represent increases to working capital of up to $13.2 million during the forecast period.
Scenario 3, Lower Revenue / Higher Expenses. The red bar uses the forecast working capital as the base for assuming 1 percent lower revenues and 1 percent higher expenditures for each fiscal year. By year-end FY 2024, this demonstration results in working capital declining by $10 million or 26.7 percent from the estimate for year-end FY 2019.
$0.00
$10.00
$20.00
$30.00
$40.00
$50.00
$60.00
+1% Probable -1%
33

FY 2020-2024 Forecast Opportunity Compassion Responsiveness Accessibility
Utility Fund Forecast Risks and Rankings The forecast acknowledges that there are risks associated with sustaining the resources needed to fund current and future City utility services. Each identified risk is evaluated on the degree it will impact service delivery and assists in determining courses of action to be taken over the five year period.
Forecast Risk – Revenue Ranking Percent Total Revenue
Water, Wastewater, Stormwater Revenue LOW 83%
Water and Wastewater Rate Revenue Decreasing water consumption is a national trend and Salem is not unique in facing this challenge. Most of the costs to provide utility services to customers are fixed. A very small percentage of costs are related to the volume of water produced or wastewater accepted. When consumption declines and revenue is adversely impacted, water utilities must increase rates to maintain operations. After declining for several years, FY 2018 represented a 1.8 percent increase in water consumption. A small decline in consumption is anticipated to occur in Salem throughout the forecast period but it will be offset by a very small growth in customer accounts.
Risk Factor Ranking – LOW One way utility systems have attempted to stabilize revenue is to recover more costs through fixed rates rather than volume / consumption. The 2018 Cost of Service Analysis and rate proposal included shifting cost recovery from variable to fixed rates in an effort to more appropriately assign costs of operating the system.
34

FY 2020-2024 Forecast Opportunity Compassion Responsiveness Accessibility
WVCC Fund Summary The City’s Willamette Valley Communication Center (WVCC) Fund supports the provision of 911 call taking and emergency dispatch services to 29 police, fire, and emergency medical services agencies in Marion, Polk, and Lincoln counties.
Current Status FY 2020 represents the continuation of a multi-year strategy to stabilize the WVCC Fund, sufficiently staff operations, and reduce the impact of overtime. As part of this strategy, efforts are ongoing to hire and train staff to meet the current turnover rate. Hiring frequency is expected to remain at 90-day intervals through FY 2020.
While overtime expense posted a record high for FY 2018, the strategy to reduce dependency on overtime is having a positive impact with overtime expense estimated to be reduced by more than $100,000 in FY 2019. The staff retention rate has remained at 80 percent in the past year. In order to maintain sufficient staffing levels, resources are being focused towards recruitment.
The five-year forecast plans for rate increases to be maintained at 4.7 percent until sufficient working capital and equipment reserves are established, at which time the annual rate increases may be reduced.
Future Outlook The forecast for the WVCC Fund demonstrates the successful implementation of the multi-year strategy. Restoration of working capital, which provides the opportunity to plan for equipment reserves, is an outcome achieved in this forecast.
One of the capital needs WVCC is facing in the near future is the replacement of the Computer-Aided Dispatch (CAD) system. The division is actively researching multiple options for this system, each of which will likely have significant capital costs. Estimated capital expenditures of $2.4 million for the CAD system replacement is included in the forecast.
The forecast includes a variety of assumptions for expenditure activity over five years. The primary drivers of expense increases are the cost of personnel in this service-oriented fund. The forecast reflects wage adjustments and other provisions in the current labor contract, estimates for overtime use, as well as escalators for PERS, and health care costs. The tables for the expenditure assumptions are included in the appendix.
One area of risk for WVCC is the possible withdrawal of one of its largest member agencies, the Marion County Sheriff’s Office (MCSO). Currently MSCO has placed this action on hold while evaluating all possible options and associated costs.
35
FY 2020-2024 Forecast Opportunity Compassion Responsiveness Accessibility
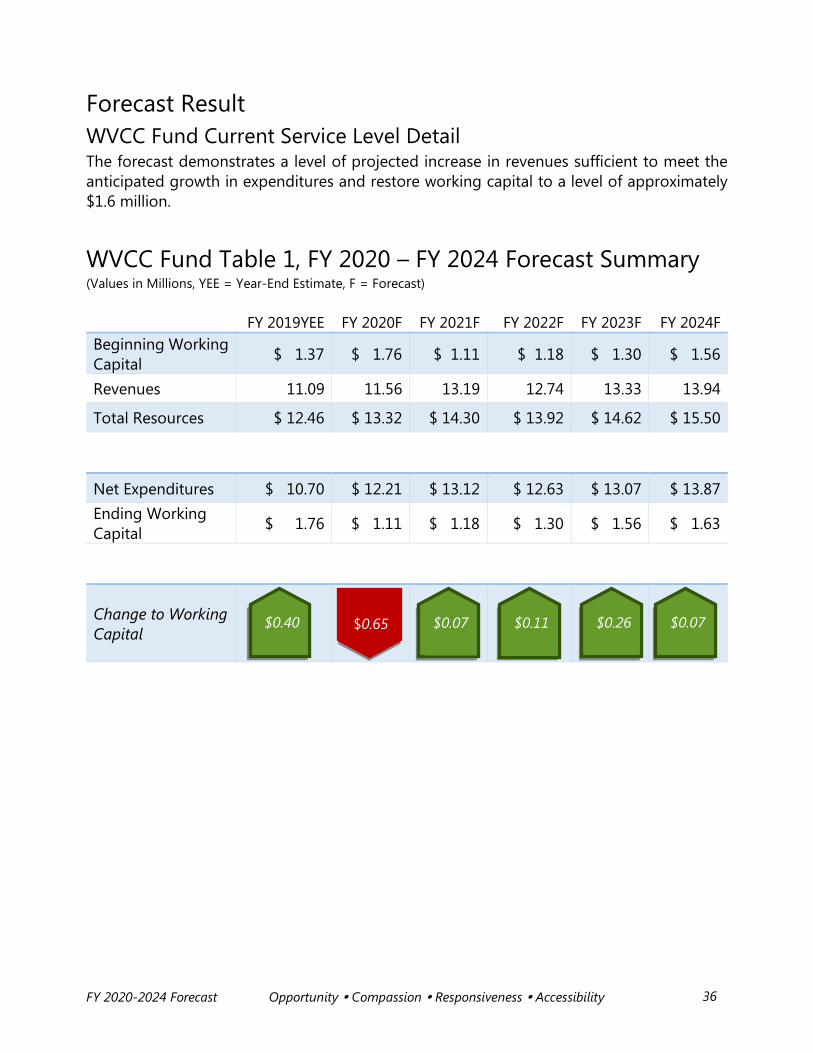
Forecast Result WVCC Fund Current Service Level Detail The forecast demonstrates a level of projected increase in revenues sufficient to meet the anticipated growth in expenditures and restore working capital to a level of approximately $1.6 million.
WVCC Fund Table 1, FY 2020 – FY 2024 Forecast Summary (Values in Millions, YEE = Year-End Estimate, F = Forecast)
FY 2019YEE FY 2020F FY 2021F FY 2022F FY 2023F FY 2024F Beginning Working Capital $ 1.37 $ 1.76 $ 1.11 $ 1.18 $ 1.30 $ 1.56
Revenues 11.09 11.56 13.19 12.74 13.33 13.94
Total Resources $ 12.46 $ 13.32 $ 14.30 $ 13.92 $ 14.62 $ 15.50
Net Expenditures $ 10.70 $ 12.21 $ 13.12 $ 12.63 $ 13.07 $ 13.87 Ending Working Capital $ 1.76 $ 1.11 $ 1.18 $ 1.30 $ 1.56 $ 1.63
Change to Working Capital
$0.40 $0.07 $0.11 $0.07 $0.65 $0.26
36

FY 2020-2024 Forecast Opportunity Compassion Responsiveness Accessibility
Table 2 is the full summary of the WVCC Fund forecast. As the current labor contract expires on June 30, 2019, personal services costs in this forecast are based on annual adjustments to salary at 2 percent. Table 2 also displays savings derived from unspent fund contingencies and a level of naturally occurring savings from employee attrition and other unanticipated economies. This level of savings is anticipated at 2 percent.
WVCCF Table 2, FY 2019 – FY 2024 Forecast Summary(Values in Millions)
FY 2019 YE Estimate
FY 2020 Forecast
FY 2021 Forecast
FY 2022 Forecast
FY 2023 Forecast
FY 2024 Forecast
Working Capital $ 1.37 $ 1.76 $ 1.11 $ 1.18 $ 1.30 $ 1.56 Revenues 11.09 11.56 13.19 12.74 13.33 13.94
TOTAL RESOURCES $ 12.46 $ 13.32 $ 14.30 $13.92 $ 14.62 $ 15.50
TOTAL EXPENDITURES $ 10.70 $ 12.94 $ 13.86 $ 13.38 $13.83 $ 14.65
Unspent Contingency (0.50) (0.50) (0.50) (0.50) (0.50) 2% Savings (0.23) (0.24) (0.25) (0.26) (0.28)
NET EXPENDITURES $ 10.70 $ 12.21 $ 13.12 $ 12.63 $ 13.07 $ 13.87
ENDING WORKING CAPITAL
$ 1.76 $ 1.11 $ 1.18 $ 1.30 $ 1.56 $ 1.63
Chg to Working Capital 0.40 (0.65) 0.07 0.11 0.26 0.07
37

FY 2020-2024 Forecast Opportunity Compassion Responsiveness Accessibility
Forecast Result – Revenue Detail The primary revenue source for the WVCC Fund is member agency rates. The graphic below demonstrates a multiple-year history of rate increases and projected increases for the forecast period. Other revenue estimates presented in this forecast use current sources augmented with assumptions for growth based on available information and historic trends.
Table 4 displays all fund revenues by source.
WVCCF Table 4, Revenues by Source (Values in Millions)
FY 2020 FY 2021 FY 2022 FY 2023 FY 2024 Member Agencies $ 6.42 $ 6.72 $ 7.03 $ 7.36 $ 7.71
Other Fees 0.04 0.03 0.02 0.02 0.02 Internal Charges* 4.90 5.23 5.48 5.74 6.01 All Other Sources 0.21 0.21 0.21 0.21 0.21
Loan Proceeds 0.00 1.00 0.00 0.00 0.00 TOTAL REVENUES $ 11.56 $ 13.19 $ 12.74 $ 13.33 $ 13.94
*Charges to the Salem Police Department and Salem Fire Department for dispatch services.
00.020.040.060.080.1
Agency Fee Increases
38

FY 2020-2024 Forecast Opportunity Compassion Responsiveness Accessibility
Forecast Result – Expenditure Detail The forecast for the WVCC Fund is developed using a base cost escalation for compensation, health insurance consultant analysis, and up-to-date PERS rate information and estimates for future years. The forecast demonstrates full staffing and a reduction to overtime expense throughout the forecast to a base of $500,000 annually. The assumption tables used for expenditures are included in the appendix. The forecast includes a general inflationary increase of 3 percent to expenses in the materials and services category.
WVCC Fund Table 5 summarizes the five-year expenditure forecast by expense category. Increased rates for compensation market adjustments, PERS obligations, and health insurances for current employees prompt increases in personal services. The area of the table with italicized text demonstrates the effect on base expenditures of anticipated savings and unspent contingencies to provide the calculation in the “Total Net Expenditures” row.
WVCCF Table 5, Expenditures by Category (Values in Millions)
FY 2020 FY 2021 FY 2022 FY 2023 FY 2024 Personal Services $ 9.59 $ 9.95 $ 10.62 $ 10.99 $ 11.73
Materials and Services 1.86 1.94 2.01 2.10 2.17 Capital Outlay 0.99 1.47 0.04 0.04 0.04
Debt Service 0.00 0.00 0.21 0.21 0.21 Contingency 0.50 0.50 0.50 0.50 0.50
TOTAL EXPENDITURES $ 12.94 $ 13.86 $ 13.38 $ 13.83 $ 14.65 Less:
Unspent Contingency (0.50) (0.50) (0.50) (0.50) (0.50) Anticipated Savings (2%) (0.23) (0.24) (0.25) (0.26) (0.28)
TOTAL NET EXPENDITURES $ 12.21 $ 13.12 $ 12.63 $ 13.07 $ 13.87
39
FY 2020-2024 Forecast Opportunity Compassion Responsiveness Accessibility
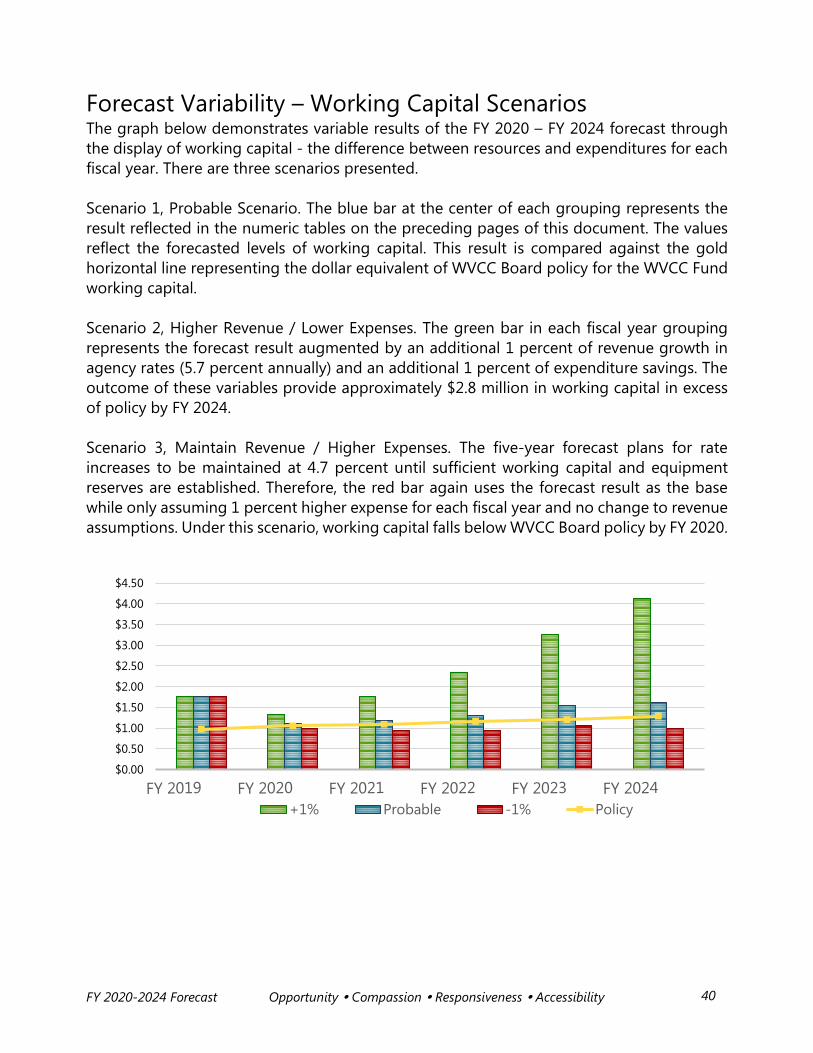
Forecast Variability – Working Capital Scenarios The graph below demonstrates variable results of the FY 2020 – FY 2024 forecast through the display of working capital - the difference between resources and expenditures for each fiscal year. There are three scenarios presented.
Scenario 1, Probable Scenario. The blue bar at the center of each grouping represents the result reflected in the numeric tables on the preceding pages of this document. The values reflect the forecasted levels of working capital. This result is compared against the gold horizontal line representing the dollar equivalent of WVCC Board policy for the WVCC Fund working capital.
Scenario 2, Higher Revenue / Lower Expenses. The green bar in each fiscal year grouping represents the forecast result augmented by an additional 1 percent of revenue growth in agency rates (5.7 percent annually) and an additional 1 percent of expenditure savings. The outcome of these variables provide approximately $2.8 million in working capital in excess of policy by FY 2024.
Scenario 3, Maintain Revenue / Higher Expenses. The five-year forecast plans for rate increases to be maintained at 4.7 percent until sufficient working capital and equipment reserves are established. Therefore, the red bar again uses the forecast result as the base while only assuming 1 percent higher expense for each fiscal year and no change to revenue assumptions. Under this scenario, working capital falls below WVCC Board policy by FY 2020.
$0.00
$0.50
$1.00
$1.50
$2.00
$2.50
$3.00
$3.50
$4.00
$4.50
+1% Probable -1% Policy
40

FY 2020-2024 Forecast Opportunity Compassion Responsiveness Accessibility
WVCC Fund Forecast Risks and Rankings Each identified forecast risk is evaluated on the degree it will impact service delivery. These evaluations of existing and potential resources assist in determining actions to be taken over the five-year period to ensure a balanced budget. The most significant risk to the WVCC Fund’s resources is summarized below.
Forecast Risk – Revenue Ranking Percent Total Revenue
Member Agency Rates LOW / MEDIUM 97.6%
Member Agency Rates Annual charges to the 29 WVCC member agencies are compounded by a growth rate (4.7 percent in the forecast) and distributed based on the agencies’ percentage of population and the percentage of emergency call volume (9-1-1 calls received) and dispatch call volume (9-1-1 operator calls to public safety / emergency responders).
Risk Factor Ranking – LOW / MEDIUM Member agency rate revenues can be subject to changing priorities for the member agency or its city or county government. As the primary revenue source for the City’s emergency dispatch services, potential changes are reviewed with a budget committee comprised of agency representatives followed by review from the full complement of member agencies.
Forecast Risk – Expenditures Ranking
Overtime Expense MEDIUM 4.1% of Total Expense
Salary Expense MEDIUM 41.6% of Total Expense
CAD System Replacement MEDIUM $2.4 Million (est.)
Overtime Expense Significant overtime expense is one reason why forecasting was initiated for the WVCC Fund several years ago. The variability of this expense is heavily dependent upon staffing levels and availability of existing staff for shift coverage. The division’s vacation calendar is covered using overtime, as is a considerable amount of training. All new hires require six months of training prior to working solo. During this time trainees are paid, and existing staff are paid overtime to provide the training.
Personal Services Expense Starting in FY 2020 of the forecast, a 2.0 percent annual market adjustment is applied to salary expense. Any amount above 2.0 percent, without an offsetting increase to member
41
FY 2020-2024 Forecast Opportunity Compassion Responsiveness Accessibility
agency rates, will negatively impact ending working capital as demonstrated above in the forecast variability graph.
CAD System Replacement The forecast presented in this document includes an estimated $2.4 million capital expenditure to pay for the Computer-Aided Dispatch (CAD) system replacement. Project expenditures are expected to begin during the second half of FY 2020 following the selection process. In order to meet this level of capital expenditure, a $1.0 million loan from another City fund is anticipated during FY 2021. Annual debt service payments of approximately $212,000, for a period of 5 years, would begin FY 2022. The division is researching multiple options for system replacement, which could result in widely varying short-term and long-term costs.
42

FY 2020-2024 Forecast Opportunity Compassion Responsiveness Accessibility
FY 19 YE Est FY 20 F FY 21 F FY 22 F FY 23 F FY 24 FWorking Capital 1.35$ 1.22$ 1.21$ 1.00$ 0.56$ 0.02$ Revenues 1.25 1.19 1.21 1.23 1.25 1.17 TOTAL RESOURCES 2.60$ 2.41$ 2.43$ 2.23$ 1.82$ 1.19$
TOTAL EXPENDITURES 1.39$ 2.41$ 2.43$ 2.23$ 1.84$ 1.80$
Unspent Contingency (1.18) (0.96) (0.53) - - 5% Savings on M&S (0.03) (0.04) (0.04) (0.04) (0.04)
NET EXPENDITURES 1.20$ 1.43$ 1.67$ 1.80$ 1.77$
ENDING WORKING CAPITAL 1.22$ 1.21$ 1.00$ 0.56$ 0.02$ (0.58)$
FY 2020 - FY 2024 SUMMARY (in millions)
Airport Fund Revenues, Expenditures and Working Capital
$-
$0.6
$1.2
$1.8
Revenues Net Expenditures Working Capital
The financial forecast for the Airport Fund provides continuation of current service levels with assumptions for inflationary factors to increase service costs and estimates for revenue growth. The forecast demonstrates a level of projected increase in revenues lower than the anticipated growth in expenditures in the final 3 years of the forecast period. It also displays savings derived from unspent fund contingencies (FY 2020 – FY 2022) and a level of naturally occurring savings through unanticipated economies. This level of savings is anticipated at 5 percent on materials and services.
To fund capital improvement projects, Federal Aviation Administration (FAA) grant matching funds of $0.5 million over the forecast period are included. Over $1 million for building improvement projects, not eligible for FAA grant funding, is needed. The forecast demonstrates depletion of working capital for these projects.
The assumptions in the forecast lead to the decline of beginning working capital. The $1.22 million estimated at the end of FY 2019 is almost fully expended by the end of FY 2023.
Forecast Risk factors are evaluated on the degree of impact to continued service delivery and fund fiscal health.
Forecast Risk Ranking
Working Capital Medium
Land / Building Rent High
Parking Rent Medium
Operational Expenses High
Match for Federal Grants Medium
Building Improvement Project Funding
High
Airport Fund FY 2020 – FY 2024 Five-Year Forecast
A federal grant match for the taxiway realignment and funding for building improvement projects significantly increase total expenditures in the last three years of the forecast.
43

FY 2020-2024 Forecast Opportunity Compassion Responsiveness Accessibility
The City’s annual financial forecast for the Building and Safety Fund provides continuation of current service levels with assumptions for inflationary factors to increase service costs and estimates for revenue growth. In addition, the forecast includes two new positions to increase capacity for permit processing and plan review. The forecast demonstrates a level of projected increase in revenues greater than the anticipated growth in expenditures. It also displays savings derived from unspent fund contingencies and a level of naturally occurring savings from other unanticipated economies. This level of savings is anticipated at 3.5 percent of material and services expenses.
Building and Safety Fund Revenues, Expenditures and Working Capital
Building and Safety Fund FY 2020 – FY 2024 Five-Year Forecast
FY 19 YE Est FY 20 F FY 21 F FY 22 F FY 23 F FY 24 FWorking Capital 7.69$ 8.64$ 10.33$ 10.94$ 11.51$ 12.04$ Revenues 5.81 7.31 6.53 6.22 6.36 6.10 TOTAL RESOURCES 13.50$ 15.95$ 16.86$ 17.16$ 17.87$ 18.14$
TOTAL EXPENDITURES 4.85$ 5.97$ 6.27$ 6.00$ 6.19$ 6.54$ Unspent Contingency (0.30) (0.30) (0.30) (0.30) (0.30) 3.5% Savings on M&S (0.05) (0.05) (0.05) (0.06) (0.06) NET EXPENDITURES 5.62$ 5.92$ 5.64$ 5.83$ 6.18$
ENDING WORKING CAPITAL 8.64$ 10.33$ 10.94$ 11.51$ 12.04$ 11.95$
FY 2020 - FY 2024 Summary (in millions)
Forecast Risk factors are evaluated on the degree of impact to continued service delivery and fund fiscal health.
Forecast Risk Ranking
Working Capital Low
Permit Revenue Medium
PERS Rates High
Health Benefits Medium
Other Labor Factors High
44

FY 2020-2024 Forecast Opportunity Compassion Responsiveness Accessibility
FY 19 YE Est FY 20 F FY 21 F FY 22 F FY 23 F FY 24 FWorking Capital 0.79$ 0.45$ 0.57$ 0.40$ 0.46$ 0.50$ Revenues 4.00 4.11 4.23 4.36 4.49 4.63 TOTAL RESOURCES 4.79$ 4.57$ 4.81$ 4.76$ 4.95$ 5.12$
TOTAL EXPENDITURES 4.33$ 4.11$ 4.53$ 4.42$ 4.58$ 4.89$
Unspent Contingency (0.12) (0.12) (0.12) (0.12) (0.12)
NET EXPENDITURES 4.33 3.99$ 4.41$ 4.30$ 4.46$ 4.77$
ENDING WORKING CAPITAL 0.45$ 0.57$ 0.40$ 0.46$ 0.50$ 0.35$
FY 2020 - FY 2024 SUMMARY (in millions)
The City’s annual financial forecast for the Cultural and Tourism (TOT) Fund provides continuation of services supported by funding allocations consistent with current code and policy guidance.
The forecast demonstrates a lowered expectation for projected increases in transient occupancy tax revenues as compared to the prior year forecast. With tax receipts in FY 2017 and FY 2018 at $3.9 million, and little evidence in the current fiscal year of a change in this trend, the forecast rate of increase is 3 percent beginning in FY 2020.
The forecast also includes continued investment in Wallace Sports Complex as well as Minto Brown Island and Riverfront parks. The project plan from the prior year forecast is modified in this version to ensure retention of sufficient working capital for the fund.
The forecast demonstrates a 25 percent allocation of tax revenues to support tourism promotion.
TOT Fund Revenues, Expenditures, and Working Capital (in millions)
Forecast Risk factors are evaluated on the degree of impact to continued service delivery and fund fiscal health.
Forecast Risk Ranking
Resources: Working Capital High
Resources: Tax Revenue High
Expense: Parks Transfer High
Expense: Capital Projects (CIP) Medium
Expense: Tourism Promotion Allocation
High
Cultural and Tourism (TOT) Fund FY 2020 – FY 2024 Five-Year Forecast
$-
$1.00
$2.00
$3.00
$4.00
$5.00
$6.00
FY 15 A FY 16 A FY 17 A FY 19 EE FY 20 F FY 21 F FY 22 F FY 232 F FY 24 F
Revenues Working Capital Net Expenditures
45
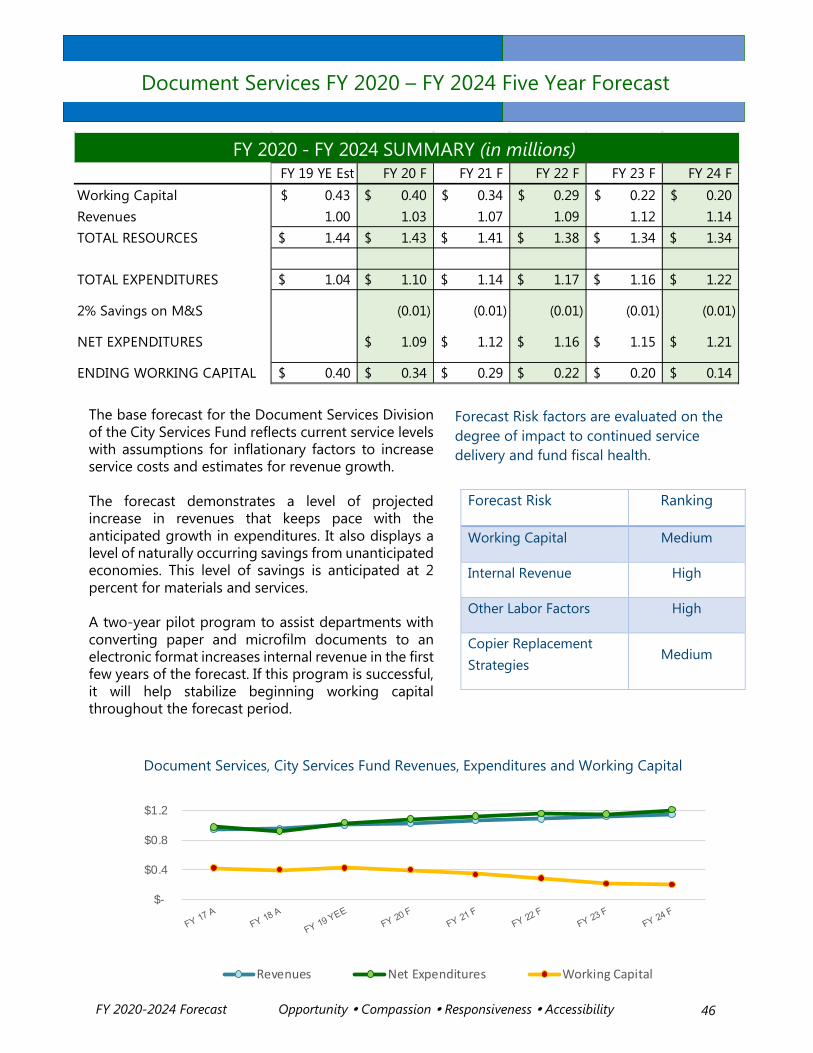
FY 2020-2024 Forecast Opportunity Compassion Responsiveness Accessibility
The base forecast for the Document Services Division of the City Services Fund reflects current service levels with assumptions for inflationary factors to increase service costs and estimates for revenue growth. The forecast demonstrates a level of projected increase in revenues that keeps pace with the anticipated growth in expenditures. It also displays a level of naturally occurring savings from unanticipated economies. This level of savings is anticipated at 2 percent for materials and services. A two-year pilot program to assist departments with converting paper and microfilm documents to an electronic format increases internal revenue in the first few years of the forecast. If this program is successful, it will help stabilize beginning working capital throughout the forecast period.
Forecast Risk factors are evaluated on the degree of impact to continued service delivery and fund fiscal health.
Forecast Risk Ranking
Working Capital Medium
Internal Revenue High
Other Labor Factors High
Copier Replacement Strategies
Medium
Document Services FY 2020 – FY 2024 Five Year Forecast
$-
$0.4
$0.8
$1.2
Revenues Net Expenditures Working Capital
Document Services, City Services Fund Revenues, Expenditures and Working Capital
FY 19 YE Est FY 20 F FY 21 F FY 22 F FY 23 F FY 24 FWorking Capital 0.43$ 0.40$ 0.34$ 0.29$ 0.22$ 0.20$ Revenues 1.00 1.03 1.07 1.09 1.12 1.14 TOTAL RESOURCES 1.44$ 1.43$ 1.41$ 1.38$ 1.34$ 1.34$
TOTAL EXPENDITURES 1.04$ 1.10$ 1.14$ 1.17$ 1.16$ 1.22$
2% Savings on M&S (0.01) (0.01) (0.01) (0.01) (0.01)
NET EXPENDITURES 1.09$ 1.12$ 1.16$ 1.15$ 1.21$
ENDING WORKING CAPITAL 0.40$ 0.34$ 0.29$ 0.22$ 0.20$ 0.14$
FY 2020 - FY 2024 SUMMARY (in millions)
46

FY 2020-2024 Forecast Opportunity Compassion Responsiveness Accessibility
$2.00
$2.50
$3.00
$3.50
$-
$0.50
$1.00
$1.50
FY 17 A FY 18 A FY 19 YEE FY 20 F FY 21 F FY 22 F FY 23 F FY 24 F
Expenditures Revenues Working Capital
The City’s annual financial forecast for the Emergency Services (EMS) Fund provides for the continuation of current service levels with assumptions for inflationary factors to increase service costs and estimates for revenue growth.
The forecast demonstrates a level of projected increases in revenues that allows the EMS Fund to remain balanced with anticipated growth of on-going expenditures. It also displays savings derived from unspent fund contingencies and a level of naturally occurring savings from unanticipated economies. This level of savings is anticipated at 3 percent in the materials and services category.
The EMS Fund is required to maintain a working capital that provides resources for six months of immediate and uninterrupted ambulance transport services. The fund is anticipated to reach this level of working capital at the end of the current fiscal year, but will drop below in FY 2020 due to proposed new cardiac intervention equipment.
Future capital equipment needs account for the highest risk factor for the health of the EMS Fund. Starting in FY 2019, this forecast includes an annual transfer to the Capital Reserve Fund to provide funding for required capital equipment purchases. The Fire Department is continually looking for new funding sources as the anticipated annual transfer to the Capital Reserve Fund is insufficient to provide for future equipment needs.
Forecast Risk factors are evaluated on the degree of impact to continued service delivery and fund fiscal health.
Forecast Risk Ranking
Working Capital Low
Ambulance Service Revenue Low
Medicare / Medicaid Reimbursement
Medium
General Materials / Services Medium
Capital Equipment Needs High
FY 19 YE Est FY 20 F FY 21 F FY 22 F FY 23 F FY 24 FWorking Capital 3.19$ 3.24$ 3.05$ 3.11$ 3.08$ 3.13$ Revenues 0.87 0.89 0.91 0.93 0.95 0.98 TOTAL RESOURCES 4.06$ 4.12$ 3.96$ 4.04$ 4.03$ 4.10$
TOTAL EXPENDITURES 0.82$ 1.15$ 0.92$ 1.04$ 0.98$ 0.99$
Unspent Contingency (0.06) (0.06) (0.06) (0.06) (0.06) 3% Savings on M&S (0.02) (0.01) (0.01) (0.01) (0.01)
NET EXPENDITURES 0.82$ 1.07$ 0.85$ 0.97$ 0.90$ 0.92$
ENDING WORKING CAPITAL 3.24$ 3.05$ 3.11$ 3.08$ 3.13$ 3.19$
FY 2020 - FY 2024 SUMMARY (in millions)
EMS Fund Revenues, Expenditures and Working Capital (in millions)
Emergency Services Fund FY 2020 – FY 2024 Five-Year Forecast
47

FY 2020-2024 Forecast Opportunity Compassion Responsiveness Accessibility
The City’s annual financial forecast for Fleet Services in the City Services Fund provides continuation of current service levels with assumptions for inflationary factors to increase service costs and estimates for revenue growth. The forecast demonstrates a level of projected increase in revenues slightly higher than the anticipated growth in expenditures. It also displays a level of naturally occurring savings. This level of savings is anticipated at 3.5 percent of material and services expenses. It is anticipated that the fleet management software will be upgraded / replaced within this five-year forecast. The amount designated for this purpose is included in the FY 2021 costs.
Fleet, City Services Fund Revenues, Expenditures and Working Capital
City Services Fund, Fleet FY 2020 – FY 2024 Five-Year Forecast
FY 19 YE Est FY 20 F FY 21 F FY 22 F FY 23 F FY 24 FWorking Capital 2.14$ 2.38$ 2.40$ 2.26$ 2.27$ 2.28$ Revenues 4.06 4.06 4.14 4.34 4.50 4.73 TOTAL RESOURCES 6.21$ 6.45$ 6.53$ 6.60$ 6.77$ 7.02$
TOTAL EXPENDITURES 3.82$ 4.13$ 4.36$ 4.42$ 4.58$ 4.81$ Unspent Contingency - - - - - 3.5% Savings on M&S (0.09) (0.09) (0.09) (0.09) (0.09) NET EXPENDITURES 4.05$ 4.28$ 4.33$ 4.49$ 4.72$
ENDING WORKING CAPITAL 2.38$ 2.40$ 2.26$ 2.27$ 2.28$ 2.30$
FY 2020 - FY 2024 Summary (in millions)
Forecast Risk factors are evaluated on the degree of impact to continued service delivery and fund fiscal health.
Forecast Risk Ranking
Working Capital Low
Permit Revenue Medium
PERS Rates High
Health Benefits Medium
Other Labor Factors High
Forecast Risk factors are evaluated on the degree of impact to continued service deliver and fund fiscal health.
Forecast Risk Ranking
Working Capital Medium
Internal Charge Revenue Medium
PERS Rates High
Health Benefits Medium
Other Labor Factors High
48

FY 2020-2024 Forecast Opportunity Compassion Responsiveness Accessibility
Radio Communications FY 2020 – FY 2024 Five-Year Forecast
FY 19 YE Est FY 20 F FY 21 F FY 22 F FY 23 F FY 24 FWorking Capital 2.05$ 2.49$ 3.04$ 3.63$ 4.20$ 4.77$ Revenues 1.97 1.98 1.98 2.01 2.04 2.07 TOTAL RESOURCES 4.02$ 4.46$ 5.02$ 5.64$ 6.24$ 6.84$
TOTAL EXPENDITURES 1.53$ 1.60$ 1.55$ 1.60$ 1.64$ 1.70$
10% Savings on M&S (0.10) (0.10) (0.10) (0.10) (0.10) 70% Savings on Capital (0.07) (0.07) (0.07) (0.07) (0.07)
NET EXPENDITURES 1.42$ 1.39$ 1.43$ 1.47$ 1.53$
ENDING WORKING CAPITAL 2.49$ 3.04$ 3.63$ 4.20$ 4.77$ 5.32$
FY 2020 - FY 2024 SUMMARY (in millions)
The City’s annual financial forecast for Radio Communications provides for the continuation of current service levels with assumptions for inflationary factors to increase service costs and estimates for revenue growth.
The forecast demonstrates a stable revenue stream with moderate growth in ending working capital as funds are set aside for the future replacement of equipment. It also displays naturally occurring savings through unanticipated economies and a lower ongoing need for equipment maintenance and replacement. This level of savings is anticipated at 10 percent in the materials and services category and 70 percent in capital expenditures. General Fund departments account for approximately 80 percent of participating agency rate revenue.
Forecast Risk Ranking
Working Capital Low
Agency Rates Medium
Operational Expenses Low / Medium
Capital Equipment Needs Low
Forecast Risk factors are evaluated on the degree of impact to continued service delivery and fund fiscal health.
Most large, long-term expenses for the new radio system are fixed costs beyond the forecast period. The new radio system will be installed and functioning this fiscal year, with training expenses and continued operation of the old system occurring through December 2019. With new equipment and radios, replacement expenses are expected to be relatively low and stable. Planning for future system needs includes developing capital reserve accounts with the participating agencies and planned, structured savings for the next system replacement.
Radio Communications, City Services Fund Revenues, Expenditures and Working Capital (in millions)
$-
$2.00
$4.00
$6.00
FY 17 A FY 18 A FY 19 YEE FY 20 F FY 21 F FY 22 F FY 23 F FY 24 F
Revenues Expenditures Working Capital
49
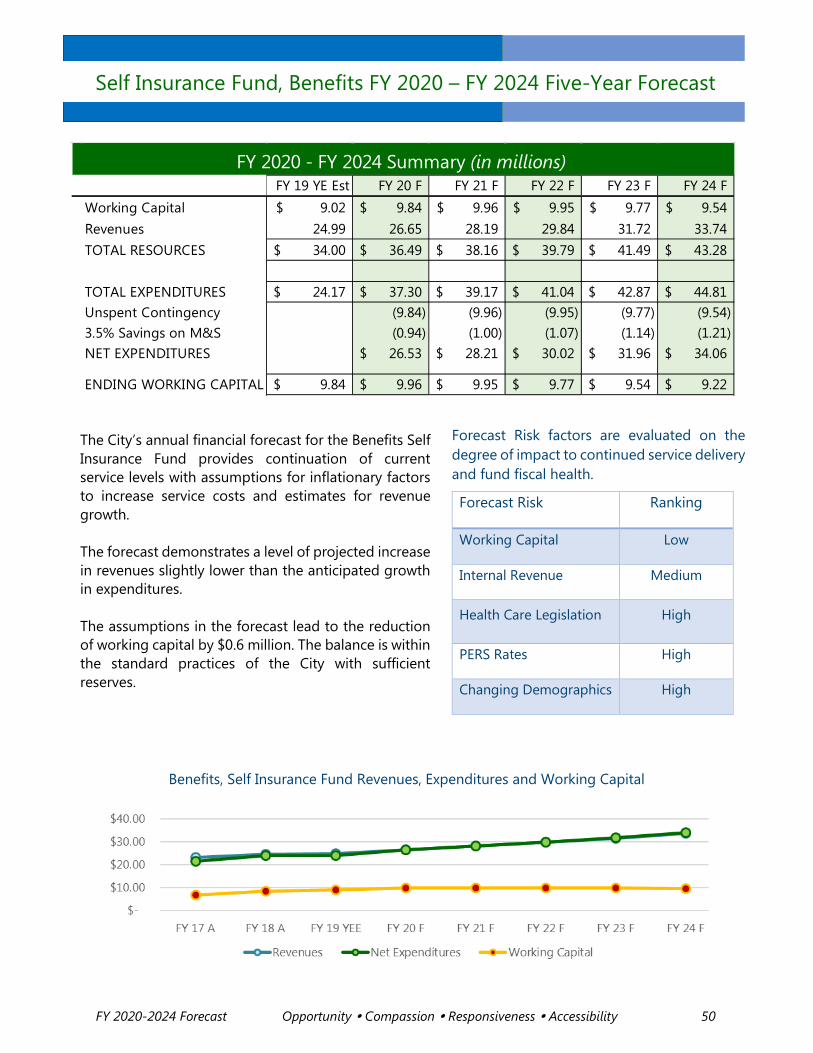
FY 2020-2024 Forecast Opportunity Compassion Responsiveness Accessibility
The City’s annual financial forecast for the Benefits Self Insurance Fund provides continuation of current service levels with assumptions for inflationary factors to increase service costs and estimates for revenue growth. The forecast demonstrates a level of projected increase in revenues slightly lower than the anticipated growth in expenditures. The assumptions in the forecast lead to the reduction of working capital by $0.6 million. The balance is within the standard practices of the City with sufficient reserves.
Benefits, Self Insurance Fund Revenues, Expenditures and Working Capital
Self Insurance Fund, Benefits FY 2020 – FY 2024 Five-Year Forecast
FY 19 YE Est FY 20 F FY 21 F FY 22 F FY 23 F FY 24 FWorking Capital 9.02$ 9.84$ 9.96$ 9.95$ 9.77$ 9.54$ Revenues 24.99 26.65 28.19 29.84 31.72 33.74 TOTAL RESOURCES 34.00$ 36.49$ 38.16$ 39.79$ 41.49$ 43.28$
TOTAL EXPENDITURES 24.17$ 37.30$ 39.17$ 41.04$ 42.87$ 44.81$ Unspent Contingency (9.84) (9.96) (9.95) (9.77) (9.54) 3.5% Savings on M&S (0.94) (1.00) (1.07) (1.14) (1.21) NET EXPENDITURES 26.53$ 28.21$ 30.02$ 31.96$ 34.06$
ENDING WORKING CAPITAL 9.84$ 9.96$ 9.95$ 9.77$ 9.54$ 9.22$
FY 2020 - FY 2024 Summary (in millions)
Forecast Risk factors are evaluated on the degree of impact to continued service delivery and fund fiscal health.
Forecast Risk Ranking
Working Capital Low
Permit Revenue Medium
PERS Rates High
Health Benefits Medium
Other Labor Factors High
Forecast Risk factors are evaluated on the degree of impact to continued service delivery and fund fiscal health.
Forecast Risk Ranking
Working Capital Low
Internal Revenue Medium
Health Care Legislation High
PERS Rates High
Changing Demographics High
50

FY 2020-2024 Forecast Opportunity Compassion Responsiveness Accessibility
The City’s annual financial forecast for the Risk Self Insurance Fund provides continuation of current service levels with assumptions for inflationary factors to increase service costs and estimates for revenue growth.
The forecast demonstrates a slight decrease in working capital over the five-year period that is still within actuarial guidelines for the fund balance.
Claims experience has been more favorable than projected in recent years and is anticipated to remain at that level or improve. This would result in a higher working capital than forecasted and lower internal rates.
Risk, Self Insurance Fund Revenues, Expenditures and Working Capital
Forecast Risk factors are evaluated on the degree of impact to continued service delivery and fund fiscal health.
Forecast Risk Ranking
Working Capital Medium
Internal Revenue Low
Liability Claims High
$-
$5.00
$10.00
$15.00
FY 17 A FY 18 A FY 19 YEE FY 20 F FY 21 F FY 22 F FY 23 F FY 24 F
Revenues Net Expenditures Working Capital
Self Insurance Fund, Risk FY 2020 – FY 2024 Five-Year Forecast
FY 19 YE Est FY 20 F FY 21 F FY 22 F FY 23 F FY 24 FWorking Capital 8.60$ 9.33$ 9.64$ 9.71$ 9.66$ 9.50$ Revenues 4.04 4.04 4.04 4.04 4.04 4.04 TOTAL RESOURCES 12.64$ 13.38$ 13.68$ 13.75$ 13.70$ 13.55$
TOTAL EXPENDITURES 3.31$ 12.44$ 13.74$ 13.92$ 13.98$ 13.95$ Unspent Contingency (8.60) (9.64) (9.71) (9.66) (9.50) 3.5% Savings on M&S (0.11) (0.12) (0.12) (0.12) (0.13) NET EXPENDITURES 3.73$ 3.98$ 4.09$ 4.20$ 4.32$
ENDING WORKING CAPITAL 9.33$ 9.64$ 9.71$ 9.66$ 9.50$ 9.22$
FY 2020 - FY 2024 Summary (in millions)
51
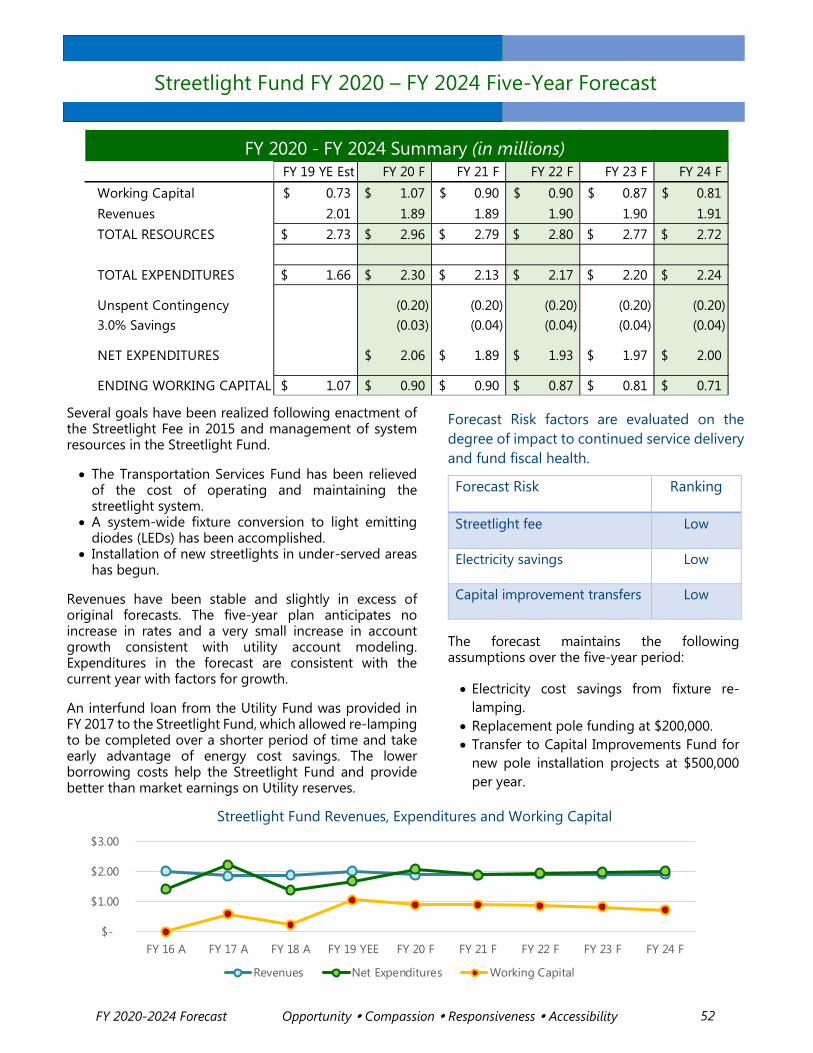
FY 2020-2024 Forecast Opportunity Compassion Responsiveness Accessibility 52
Several goals have been realized following enactment of the Streetlight Fee in 2015 and management of system resources in the Streetlight Fund.
• The Transportation Services Fund has been relievedof the cost of operating and maintaining thestreetlight system.
• A system-wide fixture conversion to light emittingdiodes (LEDs) has been accomplished.
• Installation of new streetlights in under-served areashas begun.
Revenues have been stable and slightly in excess of original forecasts. The five-year plan anticipates no increase in rates and a very small increase in account growth consistent with utility account modeling. Expenditures in the forecast are consistent with the current year with factors for growth.
An interfund loan from the Utility Fund was provided in FY 2017 to the Streetlight Fund, which allowed re-lamping to be completed over a shorter period of time and take early advantage of energy cost savings. The lower borrowing costs help the Streetlight Fund and provide better than market earnings on Utility reserves.
Streetlight Fund Revenues, Expenditures and Working Capital
Forecast Risk factors are evaluated on the degree of impact to continued service delivery and fund fiscal health.
Forecast Risk Ranking
Streetlight fee Low
Electricity savings Low
Capital improvement transfers Low
$-
$1.00
$2.00
$3.00
FY 16 A FY 17 A FY 18 A FY 19 YEE FY 20 F FY 21 F FY 22 F FY 23 F FY 24 F
Revenues Net Expenditures Working Capital
Streetlight Fund FY 2020 – FY 2024 Five-Year Forecast
FY 19 YE Est FY 20 F FY 21 F FY 22 F FY 23 F FY 24 FWorking Capital 0.73$ 1.07$ 0.90$ 0.90$ 0.87$ 0.81$ Revenues 2.01 1.89 1.89 1.90 1.90 1.91 TOTAL RESOURCES 2.73$ 2.96$ 2.79$ 2.80$ 2.77$ 2.72$
TOTAL EXPENDITURES 1.66$ 2.30$ 2.13$ 2.17$ 2.20$ 2.24$
Unspent Contingency (0.20) (0.20) (0.20) (0.20) (0.20) 3.0% Savings (0.03) (0.04) (0.04) (0.04) (0.04)
NET EXPENDITURES 2.06$ 1.89$ 1.93$ 1.97$ 2.00$
ENDING WORKING CAPITAL 1.07$ 0.90$ 0.90$ 0.87$ 0.81$ 0.71$
FY 2020 - FY 2024 Summary (in millions)
The forecast maintains the following assumptions over the five-year period:
• Electricity cost savings from fixture re-lamping.
• Replacement pole funding at $200,000.• Transfer to Capital Improvements Fund for
new pole installation projects at $500,000per year.

FY 2020-2024 Forecast Opportunity Compassion Responsiveness Accessibility
Salem Economic Outlook 2019 Prepared by Tim Duy Economic Consulting LLC December 2018
Summary of Findings
National Summary The national economy built on the momentum of 2017, in part due to the fiscal stimulus from Washington D.C. in the form of tax cuts and spending increases. National job growth accelerated, reversing the slow deceleration that began in 2015. The unemployment rate fell to 3.7%, a level not seen since the late 1960’s. Consumer confidence rose to levels last experienced during the 1990’s technology boom, wage growth accelerated, and consumer spending held strong. During the year, inflation remained soft, with core inflation holding at or below the Federal Reserve’s 2% target. Commentators have described the current environment as a “Goldilocks” economy.
That said, the economy appears likely to be at an inflection point, transitioning down from the rapid pace of 4.2% and 3.5%, respectively, in the second and third quarters of this year to something that is likely under 3% in the final quarter of the year. A number of factors are expected to weigh on growth in the upcoming year. First, the initial impact of fiscal stimulus will fade. Second, the economy will increasingly feel the lagged impact of past interest rate hikes. Third, the tariffs enacted by the Trump Administration act as tariffs on the US economy and, if continued or increased, will be increasingly disruptive for the economy.
Some slowing of economic activity is already evident. Notably, after years of rapid home price appreciation and, recently, higher mortgage rates, buyers are pushing back. New home sales have fallen 24% from their peak last November. In a sense, this is arguably good news. In the 2000s, when home prices exceeded affordability, lenders delivered new mortgage products and weaker underwriting conditions to keep the housing boom alive. This does not appear to be occurring today. Moreover, any housing downturn is not likely to be as severe as the last. The recovery simply never matched the downturn; new home sales only briefly returned to the pre-bubble zone.
There are also concerns that the fall in the price of oil and the rise in the value of the dollar is the same one-two punch that sent shock waves through the manufacturing sector in 2015-16. But here again those fears look overblown as hiring and capital investment never strongly rebounded.
The Federal Reserve expects growth to slow to 2.5% in 2019, down from 3.1% in 2018. The expected pace of growth remains high enough, however, to continue to place downward pressure on unemployment and upward pressure on inflation. However, during any transition from high to low growth there is a chance that growth decelerates more than expected. Consequently, we should be watchful of signs that the economy is weakening faster than expected, something that could be revealed in manufacturing data over the next several months.
53
FY 2020-2024 Forecast Opportunity Compassion Responsiveness Accessibility
In my opinion, the odds of recession in 2019 are very small if not essentially zero given the current momentum of the US economy. Recession indicators such as manufacturing measures and initial unemployment claims have not yet signaled an imminent problem. And the yield curve – the difference between long- and short-term interest rates, remains upward sloping. A downward sloping, or inverted yield curve is a long leading indicator of recession. The lack of any inversion to date suggests no recession in at least the next year. At this point, I do not believe that the monetary tightening since the Federal Reserve began raising interest rates is sufficient to cause a recession. Importantly, next year the Federal Reserve will move into a more data-dependent phase of monetary policy.
Although the Federal Reserve believes some additional interest rate hikes will be required next year, still low inflation allows central bankers to move patiently. If the economy slows more than anticipated while inflation remains low, they would be willing to forego higher interest rates – or even cut rates - to sustain the expansion. The biggest risks of policy error (interest rates too high for too long) would arise if central bankers perceived inflationary pressures were rising significantly.
Oregon Summary The pace of job growth in Oregon continues the deceleration that began in 2015; Oregon job growth is now roughly the same as US job growth in percentage terms. This slowing was anticipated. As an expansion ages, the unemployment rate falls and eventually slack in the labor market declines sufficiently to slow the pace of hiring. In addition, earlier in the expansion firms were quickly rebuilding from the job cuts of the recession. Job growth slows after that rebuilding period ends.
Housing activity overall weakened over the past year. Building permits fell, largely reflecting a pause in the multi-family construction frenzy that was particularly evident in the Portland region. Falling rents in some cases, higher construction costs, and higher interest rates have quelled the demand for new projects. Single family housing construction is so far moving sideways, but certain markets like Portland in particular experienced waning demand this fall for home purchases, again attributable to buyers pushing back against high prices and rising interest rates.
That said, the Oregon economy continues to grow as the expansion heads into its tenth year next summer. Most Oregon economic indicators remain healthy, and the combination of low initial unemployment claims and rising employment services payrolls (largely temporary help firms) point toward continued job growth. Weekly hours worked in manufacturing have fallen sharply, but this appears to be a very narrow shock associated with the food manufacturing industry. This could reflect shifting seasonal factors due to early harvest, or might reflect the impact of new workweek regulations. Either way, it is inconsistent with broader trends in manufacturing at this point.
The University of Oregon Index of Economic Indicators slipped this year, but remains consistent with continued economic expansion in Oregon. The declines are largely related to the manufacturing hours and housing issues mentioned above. The Oregon Measure of Economic Activity indicates the pace of growth exceeds the long run average. The overall economic picture does not point to a recession in 2019.
54

FY 2020-2024 Forecast Opportunity Compassion Responsiveness Accessibility
Salem Summary Job growth in the Salem area exceeded my expectations in 2017. In fact, the area bucked statewide trends and experienced an acceleration in job growth in 2018. I expected a more subdued pace of job growth this year now that the US economy is transitioning to slower growth and Oregon’s growth has slowed as well, but I believe the risks are to the upside. The ultimate outcome will depend on the ability of the local economy to supply additional labor via existing or new residents to meet the demand of expanding and new employers (such as Amazon).
The housing market remained solid through September; residential permitting numbers and value have been highly variable due to the more volatile multifamily components. Given the trends experienced this year nationwide and in some Oregon markets, it would not be surprising to see some pushback from buyers locally in response to higher housing prices and interest rates.
Overall, the region’s economy continues to look healthy. The Salem Measure of Economic Activity indicates that regional growth remained above normal in 2018 and with the rebound in job growth is at levels consistent with that experienced prior to the 2007 recession.
Forecast Summary To generate forecasts, I began with an unrestricted multiple equation model of Oregon nonfarm payrolls to create a baseline forecast. I simulated the model 1,000 times to create a 90% confidence interval, illustrating the potential outcomes within that interval. I then restricted the model to approximate growth assumptions used by the Oregon Office of Economic Analysis (OEA) to generate the Oregon revenue forecast. Like last year, my expectations for Oregon job growth closely align with those of the state’s economist.
I used my forecast of Oregon job growth as the principle driver of the Salem job forecast. I compare this with the forecast of a model estimated using data prior to the last recession to forecast the path of job growth as might have been expected prior to the recession (a historical simulation). In recent years, job growth in Salem has outperformed pre-recession expectations. Consequently, I focus on post-recession data when creating forecasts. I anticipate that growth will slow in 2019, but this forecast has upside risk due to factors listed above. Actual percentage changes realized are also sensitive to employment data revisions.
Nonfarm Payroll Growth Forecasts OR* OR (OEA)* Salem MSA**
2018 (last) 2.0% 1.9% 1.6% 2018 (current) 1.9% 2.0% 3.2% 2019 1.9% 2.0% 1.7%
(OR refer to outcomes using my model loosely conditioned on forecasts of national variables from the Oregon Department of Economic Analysis. OR (OEA) refers to the official state forecast (dated
55

FY 2020-2024 Forecast Opportunity Compassion Responsiveness Accessibility
November 2018). * indicates fourth quarter to fourth quarter % change, ** December to December % change.)
Uncertainty/Risks As noted earlier, even though the national economy is likely decelerating, I don’t think the economy enters recession in 2019. Monetary policy remains accommodative, and the Fed is likely to respond to slower economic growth by easing the pace of rate hikes or even, if needed, lowering interest rates as long as inflation remains under control.
National policy has both upside and downside risks. Trade policy remains in flux; a substantial deterioration of trade relations could accelerate a costly restructuring of supply chains in the United States. Trade tensions could also ease, reducing uncertainty in the economy. Likewise, while fiscal stimulus is expected to ease in 2019, divided government in Washington D.C. opens up the possibility that continued spending is the path of least resistance in future policy debates. In Oregon, the Democrats now control a supermajority in the state legislature and as such could increase taxes to support additional spending. The ultimate impacts would depend on the structure of any tax changes and the spending priorities.
Local Revenue Implications Staff’s expectations for city revenue growth are consistent with the area’s likely path of economic activity this year. The largest portion of revenues, property taxes, is also the most stable. The volatility in this revenue stream associated with the Great Recession was most likely an outlier. In the absence of such a particularly large housing induced shock, property taxes are likely to grow steadily (but at a modest pace). The remaining revenue sources are volatile and do not track the economy very well. The region currently does not have many sources of revenue directly tied to the business cycle such as income and sales taxes.
Risks on the cost side of the economy remain the same as last year. A tight labor market puts upward pressure on wages, which then impacts the salary demands from employees and prices of contractors. Likewise, healthcare costs continue to rise, placing upward pressure on benefits costs. And as of yet the State has not found a mechanism to dramatically change the outlook for retirement costs. Moreover, investment returns over time are not likely to resolve Oregon’s retirement benefits challenges due to low global rates of investment returns. This also creates risk that the assumed returns in the Oregon PERS system will be revised lower and thus raise the unfunded liability. All told, the risk remains that pension costs continue to rise as predicted by City of Salem staff.
Note Data used in this analysis, particularly the employment data, is subject to future revisions.
56

FY 2020-2024 Forecast Opportunity Compassion Responsiveness Accessibility
Citywide Financial Forecast Risks and Rankings Risks to Expenditure Forecast
This summary presents risks to the expenditure forecast by evaluating the degree by which each identified risk will impact service delivery. This assessment assists in determining actions to be taken over the five-year period.
PERS Costs and Employer Rate Increases Through its most recent Actuarial Valuation Report for the PERS system (as of December 31, 2017), the PERS Board provided the City with employer contribution rates for July 1, 2019 through June 30, 2021. The rates, which are used in the forecast, appear in Table 1 below. Rates for the two-year periods beginning July 1, 2021 and July 1, 2023 were developed using the following key assumptions:
• The funded percentage will remain above 70 percent the remaining biennia,which is single rate collar range;
• Top of collar rate increases will occur for the next two biennia;• Side account relief rate expected to stabilize at 7 percent; and• OPSRP replacement percentage will continue to increase as Tier 1 and 2
employees retire.
Expenditures Risks, Table 1 PERS Employer Contribution Rates
PERS Type FY 2014 FY 2016 FY 2018 FY 2020 FY 2022 FY 2024 Tier 1 and 2 14.66% 15.82% 21.07% 25.49% 32.48% 40.48%
OPSRP General Service 10.28% 8.62% 11.97% 16.41% 21.42% 27.25% OPSRP Fire and Police 13.01% 12.73% 16.74% 21.04% 26.97% 33.91%
See Appendix A for a complete table of PERS related expenses.
Risk Factor Ranking – HIGH Accelerating PERS rates are a significant factor in year-over-year forecast cost increases, particularly in the General Fund. It is unknown whether the Oregon Legislature will undertake any type of PERS reform during upcoming legislative sessions.
57

FY 2020-2024 Forecast Opportunity Compassion Responsiveness Accessibility
Health Care Costs The City’s rates are developed annually with the assistance of a consultant knowledgeable in the industry. The rate analysis is based on a review of national and statewide health care cost trends, legislated health care reforms, the required cash reserves to meet obligations year-over-year and the City’s claims activity from previous years. The rate of increase for health benefits premium costs is assumed to increase over the five-year period with PPO medical premiums escalating by 6.0 percent for the first 3 years of the forecast and 6.5 percent for the remaining 2 years. See Appendix A for the detailed assumption table.
Risk Factor Ranking – MEDIUM Health care costs could be higher or lower depending on a variety of factors, which are difficult to predict, including increased costs in the health care industry, the amount of filed claims, and the mix of enrollees.
Labor Agreements Approximately 75 percent of the City’s workforce is represented by one of five unions–SPEU (Police), IAFF (firefighters and battalion chiefs), PCEA (911 Communications), and AFSCME (general unit), and SCABU (City attorneys). For the more in-depth fund forecasts in this document, compensation expense equates to a significant percentage of total operating (personal services, materials / services, capital outlay) costs – General Fund, 48 percent; Transportation Fund, 25 percent; Utility Fund, 30 percent; and WVCC Fund, 47 percent. Labor agreements are a significant cost driver. Wage increases associated with the most recent agreements are incorporated in the forecast. For the years beyond the term of these agreements an assumed 2.0 percent wage increase is used.
Risk Factor Ranking – MEDIUM Negotiations are underway with two labor unions – IAFF and PCEA – during the current fiscal year. The risks associated with increased costs from future labor negotiations beyond FY 2019 are difficult to measure at this time.
Inflation The Bureau of Labor Statistics reported for October 2018 that the Consumer Price Index, Western Region, CPI-U increased 3.5 percent from October 2017. Over the measurement period, the index for all items less food and energy advanced 3.0 percent. Volatility with fuel prices offset by decreases in natural gas and a small rate of change for electricity translated to a 12.8 percent increase year-over-year in the category of fuels and utilities. Goods and services increased by 2.5 percent. For purposes of this forecast, a 3.0 percent inflation factor is used on general goods and services. Inflation factors for internal City services such as motor pool, radio communications, and 9-1-1 call-taking and dispatch are tied to the projected cost of providing the service during the forecast period.
58
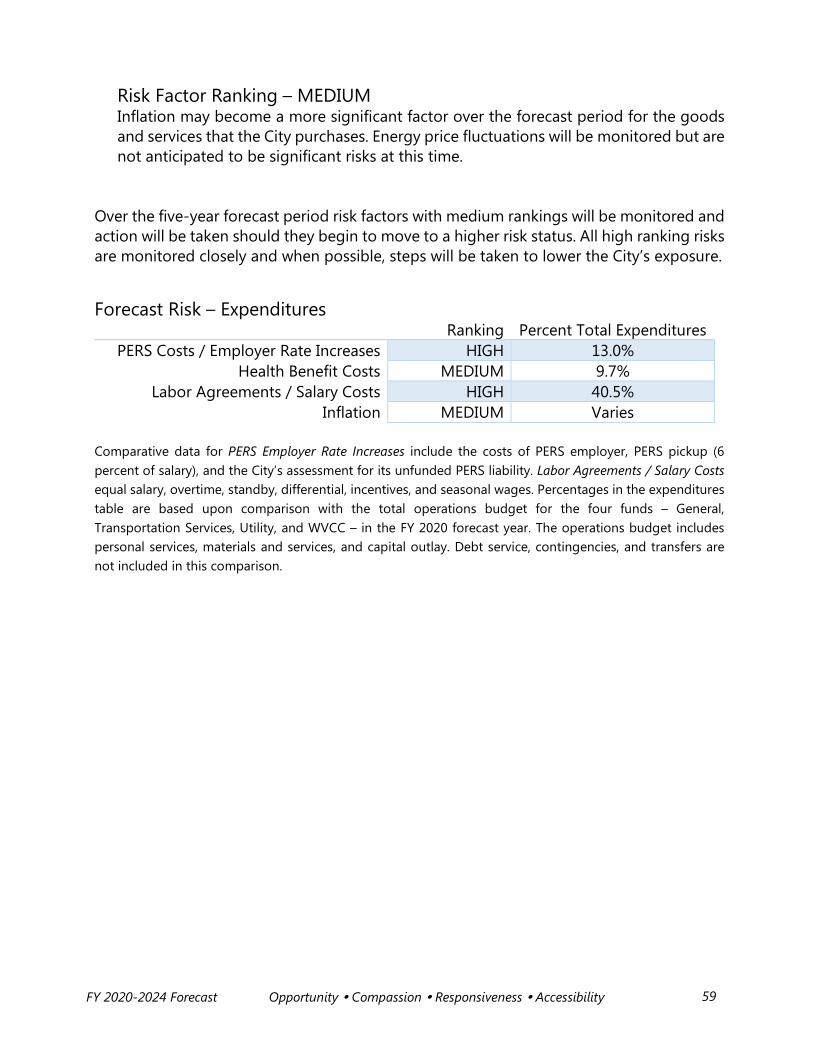
FY 2020-2024 Forecast Opportunity Compassion Responsiveness Accessibility
Risk Factor Ranking – MEDIUM Inflation may become a more significant factor over the forecast period for the goods and services that the City purchases. Energy price fluctuations will be monitored but are not anticipated to be significant risks at this time.
Over the five-year forecast period risk factors with medium rankings will be monitored and action will be taken should they begin to move to a higher risk status. All high ranking risks are monitored closely and when possible, steps will be taken to lower the City’s exposure.
Forecast Risk – Expenditures Ranking Percent Total Expenditures
PERS Costs / Employer Rate Increases HIGH 13.0% Health Benefit Costs MEDIUM 9.7%
Labor Agreements / Salary Costs HIGH 40.5% Inflation MEDIUM Varies
Comparative data for PERS Employer Rate Increases include the costs of PERS employer, PERS pickup (6 percent of salary), and the City’s assessment for its unfunded PERS liability. Labor Agreements / Salary Costs equal salary, overtime, standby, differential, incentives, and seasonal wages. Percentages in the expenditures table are based upon comparison with the total operations budget for the four funds – General, Transportation Services, Utility, and WVCC – in the FY 2020 forecast year. The operations budget includes personal services, materials and services, and capital outlay. Debt service, contingencies, and transfers are not included in this comparison.
59

FY 2020-2024 Forecast Opportunity Compassion Responsiveness Accessibility 60
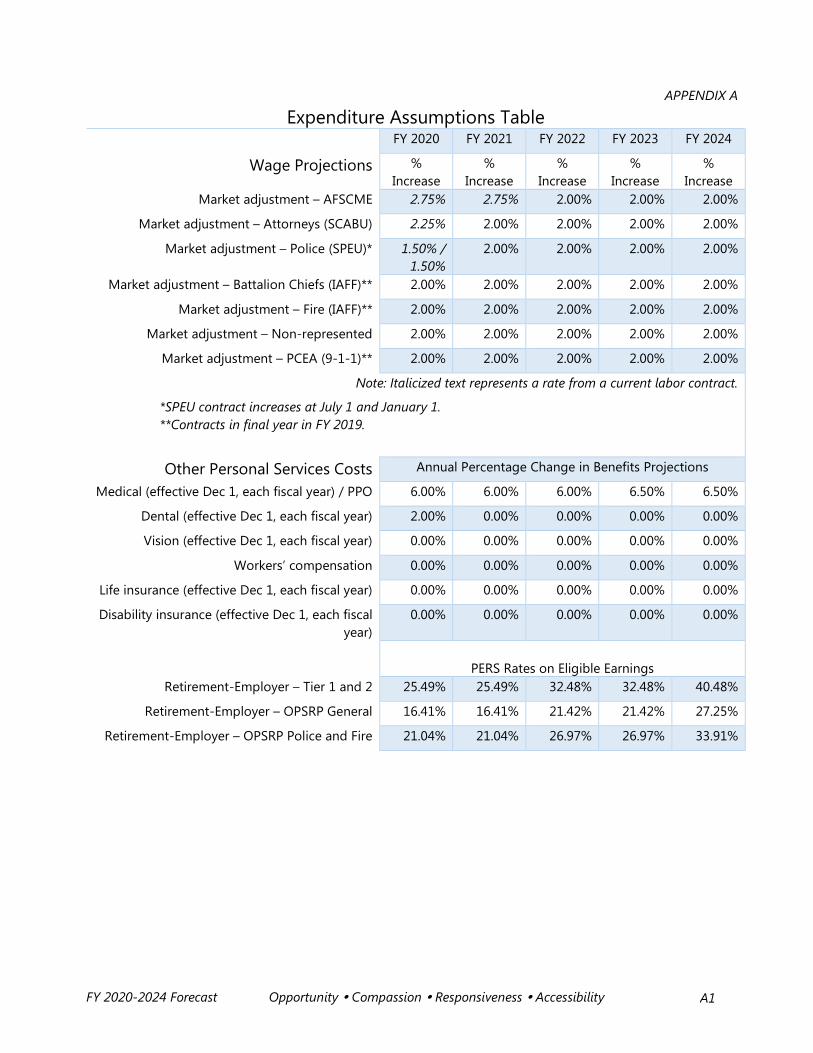
FY 2020-2024 Forecast Opportunity Compassion Responsiveness Accessibility
APPENDIX A
Expenditure Assumptions Table FY 2020 FY 2021 FY 2022 FY 2023 FY 2024
Wage Projections % Increase
% Increase
% Increase
% Increase
% Increase
Market adjustment – AFSCME 2.75% 2.75% 2.00% 2.00% 2.00%
Market adjustment – Attorneys (SCABU) 2.25% 2.00% 2.00% 2.00% 2.00%
Market adjustment – Police (SPEU)* 1.50% / 1.50%
2.00% 2.00% 2.00% 2.00%
Market adjustment – Battalion Chiefs (IAFF)** 2.00% 2.00% 2.00% 2.00% 2.00%
Market adjustment – Fire (IAFF)** 2.00% 2.00% 2.00% 2.00% 2.00%
Market adjustment – Non-represented 2.00% 2.00% 2.00% 2.00% 2.00%
Market adjustment – PCEA (9-1-1)** 2.00% 2.00% 2.00% 2.00% 2.00%
Note: Italicized text represents a rate from a current labor contract.
*SPEU contract increases at July 1 and January 1. **Contracts in final year in FY 2019.
Other Personal Services Costs Annual Percentage Change in Benefits Projections
Medical (effective Dec 1, each fiscal year) / PPO 6.00% 6.00% 6.00% 6.50% 6.50%
Dental (effective Dec 1, each fiscal year) 2.00% 0.00% 0.00% 0.00% 0.00%
Vision (effective Dec 1, each fiscal year) 0.00% 0.00% 0.00% 0.00% 0.00%
Workers’ compensation 0.00% 0.00% 0.00% 0.00% 0.00%
Life insurance (effective Dec 1, each fiscal year) 0.00% 0.00% 0.00% 0.00% 0.00%
Disability insurance (effective Dec 1, each fiscal year)
0.00% 0.00% 0.00% 0.00% 0.00%
PERS Rates on Eligible Earnings
Retirement-Employer – Tier 1 and 2 25.49% 25.49% 32.48% 32.48% 40.48%
Retirement-Employer – OPSRP General 16.41% 16.41% 21.42% 21.42% 27.25%
Retirement-Employer – OPSRP Police and Fire 21.04% 21.04% 26.97% 26.97% 33.91%
A1

FY 2020-2024 Forecast Opportunity Compassion Responsiveness Accessibility
FY 2020 FY 2021 FY 2022 FY 2023 FY 2024
Materials and Services % Increase % Increase % Increase % Increase % Increase
General inflation factor 3.00% 3.00% 3.00% 3.00% 3.00%
Gasoline / Diesel May vary by
department, overall 0.00%
2.00% 2.00% 2.00% 2.00%
Internal charges 6.00% 4.00% 6.00% 4.00% 6.00%
Liability insurance May vary by
department, overall 0.00%
0.00% 0.00% 0.00% 0.00%
Motor pool (Fleet Services) May vary by
department, overall 2.00%
4.00% 6.00% 4.00% 6.00%
Radio communications May vary by
department, overall 2.00%
2.00% 2.00% 2.00% 2.00%
Support services (ICAP) May vary by
department, overall 6.57%
6.00% 4.00% 6.00% 4.00%
9-1-1 services* 4.70% 4.70% 4.70% 4.70% 4.70%
*Escalators for 9-1-1 services reflect the rates charged to all member agencies. The City’s rate will be slightly lower than those anticipated for the first year of the forecast period for other member agencies. The lowered rates comply with the plan initiated in 2015 to help the Willamette Valley Communication Center (WVCC) Fund maintain financial stability. The plan included a pre-payment of $250,000 from the City of Salem, which was managed through lowered rates for a few years.
A2

FY 2020-2024 Forecast Opportunity Compassion Responsiveness Accessibility
General Fund Revenues Assumptions Table FY 2020 FY 2021 FY 2022 FY 2023 FY 2024
Revenue % Increase
% Increase
% Increase
% Increase
% Increase
Current year property tax 4.12% 4.35% 4.08% 4.05% 4.04%
Electric franchise 2.50% 2.50% 2.50% 2.50% 2.50%
Telecommunications franchise 3.00% 3.00% 2.00% 2.00% 2.00%
Natural gas franchise 0.00% 0.00% 0.00% 0.00% 0.00%
Cable franchise 0.00% 0.00% 0.00% 0.00% 0.00%
Refuse (solid waste) franchise 6.00% 3.00% 3.00% 3.00% 3.00%
Fees for service 2.52% 2.71% 2.80% 2.97% 3.03% Planning, site, dwelling review fees 6.00% 4.00% 6.00% 4.00% 6.00%
Other fees, licenses, permits 1.86% 2.30% 2.38% 2.80% 2.83%
Rents (parking, building)* -6.24% 8.23% -7.47% 9.44% -8.65%
Support services charge** 6.57% 6.00% 4.00% 6.00% 4.00%
Other internal charges 6.00% 4.00% 6.00% 4.00% 6.00%
State shared revenue 3.12% 3.10% 3.11% 3.12% 3.12%
Other agencies -23.92% 23.03% -13.70% 2.59% 3.56%
Grants*** 0.00% 0.00% 0.00% 0.00% 0.00%
Fines, penalties 0.00% 2.20% 0.72% 2.21% 0.73%
FY 2020 escalators or de-escalators are calculated against the FY 2019 estimates for year-end revenue totals by type.
*The pattern of escalation and de-escalation for rent revenues reflects the impact of biennial full legislative sessions.
**Support services charge is also known as the indirect cost allocation or ICAP
***FY 2020 assumption is a base amount of approximately $567,000, no increase in forecast years.
A3

FY 2020-2024 Forecast Opportunity Compassion Responsiveness Accessibility
$0
$5
$10
$15
$20
$25
$30M
illion
sCity of Salem General Fund PERS Expense by Type
Pension Bond Debt Service 6% Pickup for Employees Employer Contribution
A4
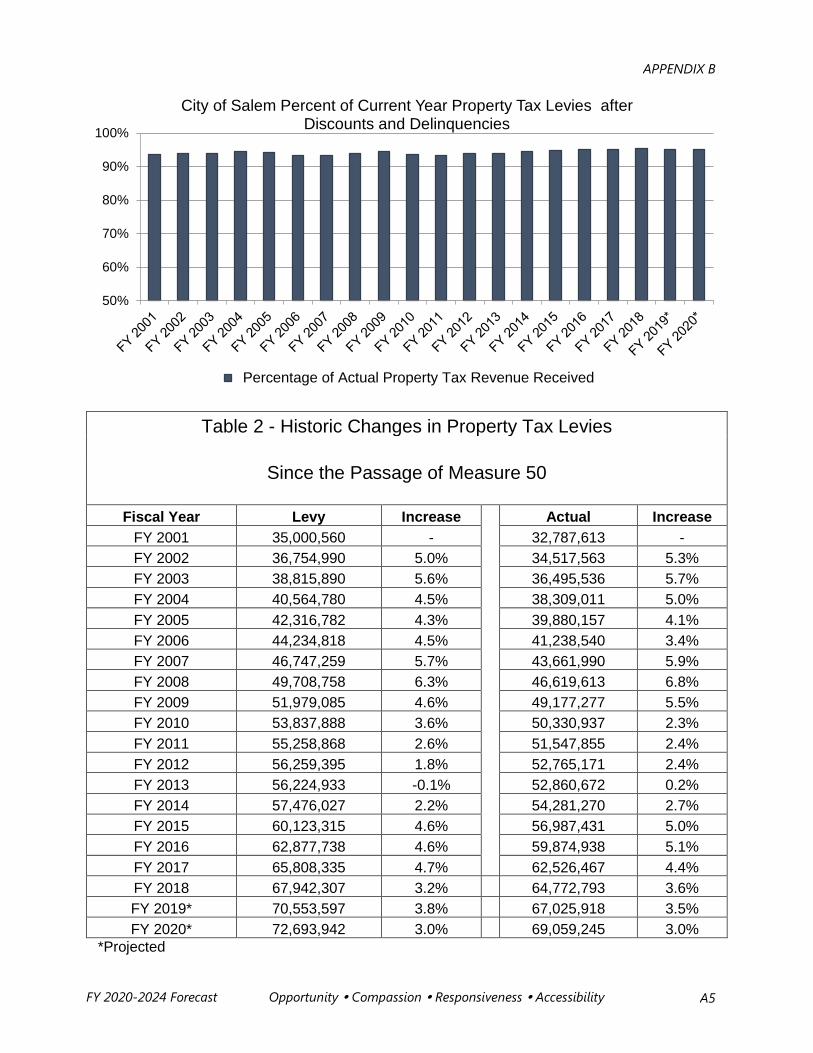
FY 2020-2024 Forecast Opportunity Compassion Responsiveness Accessibility
Table 2 - Historic Changes in Property Tax Levies
Since the Passage of Measure 50
Fiscal Year Levy Increase Actual Increase FY 2001 35,000,560 - 32,787,613 - FY 2002 36,754,990 5.0% 34,517,563 5.3% FY 2003 38,815,890 5.6% 36,495,536 5.7% FY 2004 40,564,780 4.5% 38,309,011 5.0% FY 2005 42,316,782 4.3% 39,880,157 4.1% FY 2006 44,234,818 4.5% 41,238,540 3.4% FY 2007 46,747,259 5.7% 43,661,990 5.9% FY 2008 49,708,758 6.3% 46,619,613 6.8% FY 2009 51,979,085 4.6% 49,177,277 5.5% FY 2010 53,837,888 3.6% 50,330,937 2.3% FY 2011 55,258,868 2.6% 51,547,855 2.4% FY 2012 56,259,395 1.8% 52,765,171 2.4% FY 2013 56,224,933 -0.1% 52,860,672 0.2% FY 2014 57,476,027 2.2% 54,281,270 2.7% FY 2015 60,123,315 4.6% 56,987,431 5.0% FY 2016 62,877,738 4.6% 59,874,938 5.1% FY 2017 65,808,335 4.7% 62,526,467 4.4% FY 2018 67,942,307 3.2% 64,772,793 3.6% FY 2019* 70,553,597 3.8% 67,025,918 3.5% FY 2020* 72,693,942 3.0% 69,059,245 3.0%
*Projected
50%
60%
70%
80%
90%
100%
City of Salem Percent of Current Year Property Tax Levies after Discounts and Delinquencies
Percentage of Actual Property Tax Revenue Received
APPENDIX B
A5
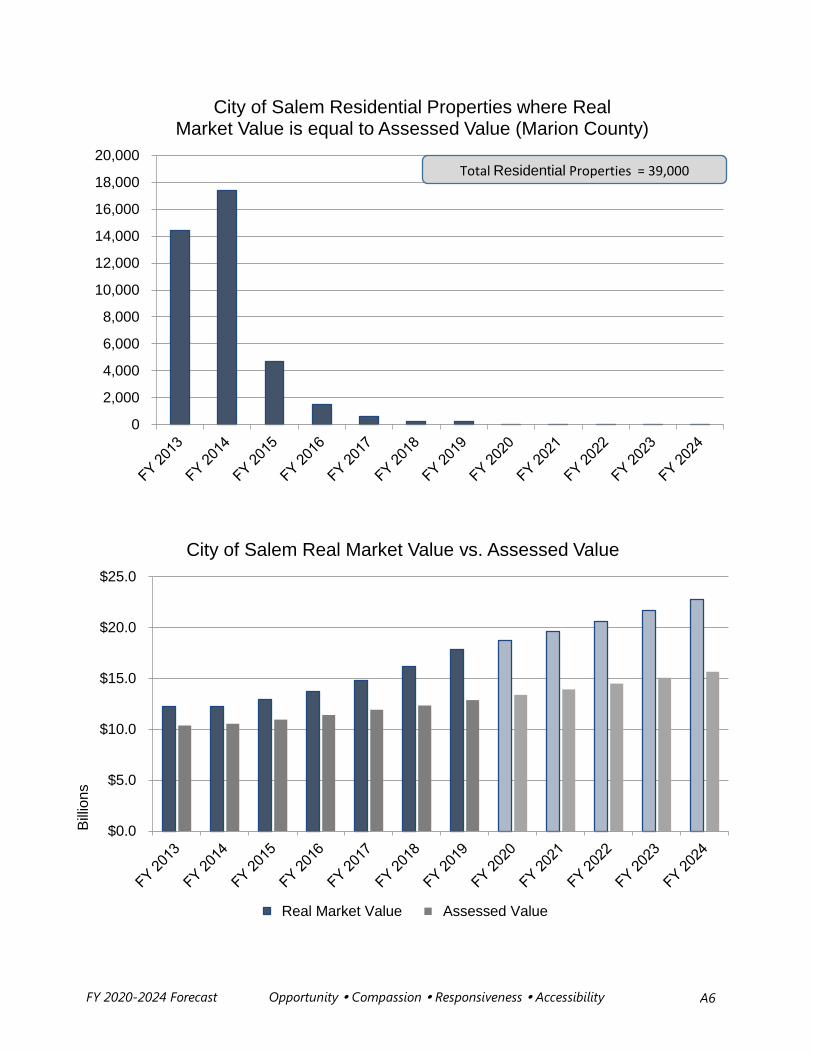
FY 2020-2024 Forecast Opportunity Compassion Responsiveness Accessibility
0
2,000
4,000
6,000
8,000
10,000
12,000
14,000
16,000
18,000
20,000
City of Salem Residential Properties where RealMarket Value is equal to Assessed Value (Marion County)
Total Residential Properties = 39,000
$0.0
$5.0
$10.0
$15.0
$20.0
$25.0
Billio
ns
City of Salem Real Market Value vs. Assessed Value
Real Market Value Assessed Value
A6
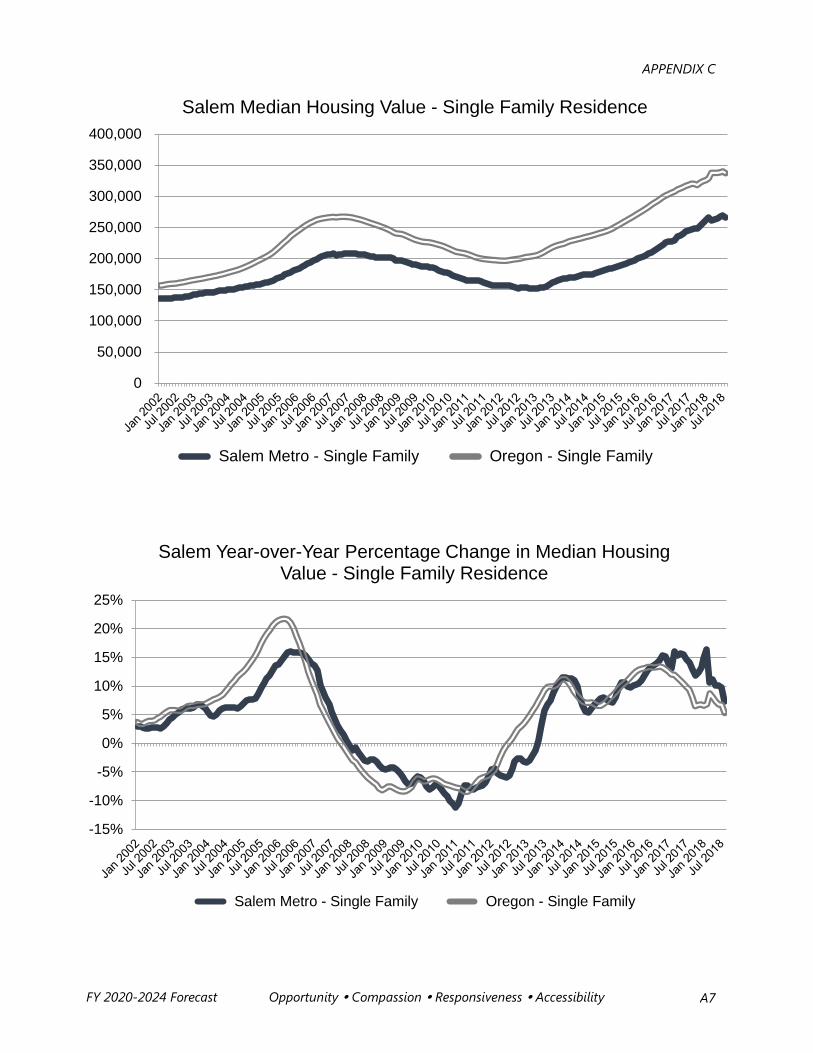
FY 2020-2024 Forecast Opportunity Compassion Responsiveness Accessibility
0
50,000
100,000
150,000
200,000
250,000
300,000
350,000
400,000
Salem Median Housing Value - Single Family Residence
Salem Metro - Single Family Oregon - Single Family
-15%
-10%
-5%
0%
5%
10%
15%
20%
25%
Salem Year-over-Year Percentage Change in Median Housing Value - Single Family Residence
Salem Metro - Single Family Oregon - Single Family
APPENDIX C
A7

FY 2020-2024 Forecast Opportunity Compassion Responsiveness Accessibility
($1.2)
($1.0)
($0.8)
($0.6)
($0.4)
($0.2)
$0.0
$0.2
Milli
ons
City of Salem Property Tax Revenue Loss due to Compression
Actual Forecast
$50
$55
$60
$65
$70
$75
$80
$85
$90
Milli
ons
City of Salem Total Property Tax Revenue
Actual Forecast
A8

FY 2020-2024 Forecast Opportunity Compassion Responsiveness Accessibility
Oregon Indicators Generally Solid
A9

FY 2020-2024 Forecast Opportunity Compassion Responsiveness Accessibility
Dip Not Indicative of Recession
Oregon Growth Remains Above Average
A10
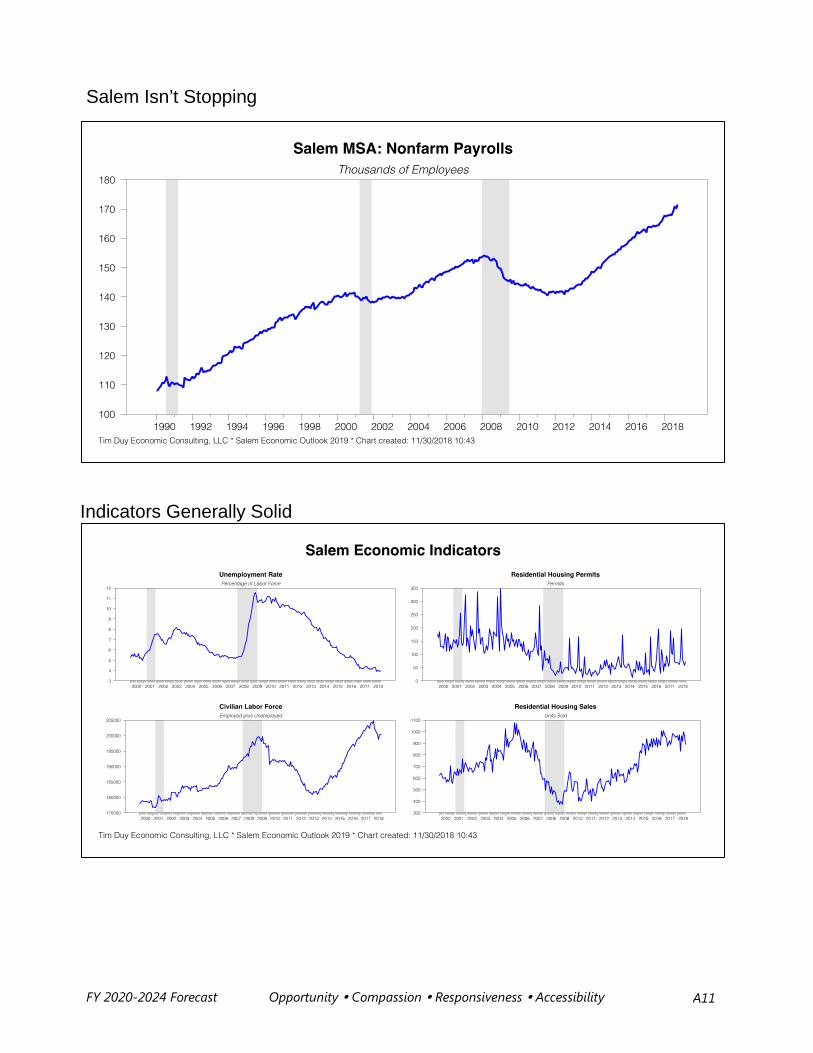
FY 2020-2024 Forecast Opportunity Compassion Responsiveness Accessibility
Salem Isn’t Stopping
Indicators Generally Solid
A11

FY 2020-2024 Forecast Opportunity Compassion Responsiveness Accessibility
Indicators Generally Solid
Indicators Generally Solid
A12

FY 2020-2024 Forecast Opportunity Compassion Responsiveness Accessibility
Indicators Generally Solid
After a Dip Early 2018, Back on Track
A13

FY 2020-2024 Forecast Opportunity Compassion Responsiveness Accessibility
Upside Risk to Job Growth
A14
![RESEARCHARTICLE … · undercurrent andfuture climates. Thisisparticularlyimportantfordeveloping forecasting toolsforbiological invasions [4,5].Indeed, itremainsunclear whether, overshorttime](https://static.fdocuments.in/doc/165x107/5ad9c8387f8b9afc0f8b9cd9/researcharticle-andfuture-climates-thisisparticularlyimportantfordeveloping.jpg)