CITY OF ROUND ROCK · PDF fileBrad Lonberger Thomas Havel ... Present a cohesive vision and...
26
CITY OF ROUND ROCK DOWNTOWN MASTER PLAN CITY OF ROUND ROCK
Transcript of CITY OF ROUND ROCK · PDF fileBrad Lonberger Thomas Havel ... Present a cohesive vision and...
CITY OF ROUND ROCK
DOWNTOWN MASTER PLAN
CITY OF ROUND ROCKCITY OF ROUND ROCK

CITY OF ROUND ROCKDOWNTOWN MASTER PLANJANUARY 2010
ii
CONSULTANT TEAM
Urban Design, Public Involvement, Project ManagementTorti Gallas and PartnersNeal Payton, Principal in ChargeAmber Hawkes, Project ManagerMyranda SimsHao HeBrad LonbergerThomas HavelGeorgia SheridanBonnie Gonzalez523 W. 6th Street, Suite 212Los Angeles, CA 90014213.607.0070
Market / Economic AnalysisEconomics Research AssociatesTom Moriarity, Vice PresidentPatty Folan, Senior AssociateMichelle Bowen, Associate1101 Connecticut AveNW Suite 750Washington DC, 20036202.448.1421
Circulation / TransportationWalter P MooreGary W. Schatz, P.E., PTOESenior Engineer1301 McKinney, Suite 1100Houston, Texas 77010713.630.7455
PROJECT ACKNOWLEDGEMENTS
CITY OF ROUND ROCK
Mayor Alan McGrawMayor Pro-Tem Joe CliffordCouncilmember Rufus HoneycuttCouncilmember George WhiteCouncilmember Carlos SalinasCouncilmember Scott RhodeCouncilmember Kris Whitfi eldCouncilmember John Moman
Jim Nuse, City Manager
David Kautz, Assistant City Manager/CFO
Cindy Demers, Assistant City Manager
Project Manager Will Hampton, Communications Director
Project Team MembersTom Word, Chief of Public Works OperationsJim Stendebach, Director of Planning and Community DevelopmentAlysha Girard, Assistant City EngineerSusan Brennan, Planning CoordinatorDavid Buzzell, Parks Development ManagerJoelle Jordan, Senior Planner Randy Barker, Purchasing SupervisorBrooks Bennett, Technology SpecialistAneil Naik, Engineering Assistant
Special thanks to Monique Adams, Administrative Support Coordinator, and Saridon Chambless, Administrative Technician, for their invaluable contributions to the project.
Special thanks to the citizens of the community that turned out and contributed to the charrette.
Historic PreservationLimbacher and Godfrey ArchitectsLaurie Limbacher, Principal3406 Glenview Ave., Suite 200Austin, Texas 78703512.450.1518
Landscape / Open SpaceMelendrezScott D. Baker, Principal/Director Darren Shirai, Associate Valerie Watson, Urban Planner617 South Olive Street, 11th FloorLos Angeles, California 90014213.673.4400
BWM GroupTim Bargainer, Landscape DesignerSallie Burchett, Landscape DesignerBrandon Hay102 E. Main, Suite 200Round Rock, Texas 78664512.238.8912
Civil Engineering / InfrastructureUrban Design GroupLaura Toups, P.E., Managing PartnerJohn Noell, P.E., PartnerJeremy McCartha, P.E., Engineer3660 Stoneridge Road, Suite E101Austin, Texas 78746512.347.0040
JANUARY, 2010

CITY OF ROUND ROCKDOWNTOWN MASTER PLAN
JANUARY 2010
iii
EXECUTIVE SUMMARY .........................................1
INTRODUCTION ...................................................3Introduction ..........................................................................................5Community Visioning Process ..................................................................7Background Analysis
Planning Analysis Diagrams .................................................................8Historic Preservation Overview ..........................................................17Market Analysis Overview .................................................................19Traffi c and Parking Analysis Overview .................................................21
VISION MASTER PLAN .......................................23Vision Statement .................................................................................25Master Vision Plan ...............................................................................26Transforming the Public Realm ..............................................................28Plan Areas
Town Center ....................................................................................30Southwest Downtown .......................................................................32Creekside District ............................................................................34Highway 79, Alternative A .................................................................36
Plan ComponentsGateways .......................................................................................37Circulation and Street Network ..........................................................40Green and Open Space Network ........................................................42A Sustainable Approach ....................................................................47 An Activated Downtown Core .............................................................48Historic Preservation ........................................................................50Branding the City .............................................................................51Infrastructure ..................................................................................52Program Data ..................................................................................55
IMPLEMENTATION POLICIES & STRATEGIES .....57Implementation Strategy ......................................................................59Summary Table of Recommended Action Items ........................................60Catalytic Projects
Main Street Bridge ...........................................................................68Town Green ....................................................................................69Main Street Historic Core Streetscaping ..............................................70Mays Streetscaping ..........................................................................71Round Rock Avenue Streetscaping ......................................................72Georgetown Streetscaping ................................................................73Heritage Trail ..................................................................................74
Form Based Code ................................................................................75Plan-Wide Policy Initiatives ...................................................................76
DESIGN GUIDE ..................................................85Purpose and Applicability ......................................................................88Transect Zones ....................................................................................91Regulating Plan ...................................................................................74Building Guidelines Building Density and Height ............................................................96 Grand Floor Land Use ......................................................................97 Land Uses .....................................................................................98 Build-To Line ..................................................................................99 Frontage Occupancy .......................................................................99 Frontage Types ............................................................................. 100 Building Types .............................................................................. 103 Yards .......................................................................................... 111 Historic Preservation Guidelines ...................................................... 112 General Architecture Guidelines ...................................................... 114 Parking and Service ...................................................................... 116 Residential Architecture Guidelines .................................................. 118 Signage ...................................................................................... 117 Utilities, Storage Areas & Trash ....................................................... 120 Fences, Walls, & Hedges ................................................................ 121
Urban Form Guidelines Critical Urban Design Features ........................................................ 124 Block Network & Circulation ........................................................... 125 Streets ........................................................................................ 126 Street Sections for Key Streets ....................................................... 127 Intersections & Sidewalks .............................................................. 131 Sustainability and Green Space ...................................................... 132 Trees and Landscaping .................................................................. 134 Street Furniture and Lighting ......................................................... 138
APPENDIX .......................................................1411. Market Analysis ............................................................................. 1422. Traffi c Analysis .............................................................................. 1473. Recommended Plants ..................................................................... 1584. Glossary of Terms .......................................................................... 159
TABLE OF CONTENTS
1
2
3
4
A

CITY OF ROUND ROCKDOWNTOWN MASTER PLANJANUARY 2010
iv
The Downtown Master Plan recognizes the inevitability of growth and the imperative to get ahead of that growth and infl uence it rather than react to it and regret.

CITY OF ROUND ROCKDOWNTOWN MASTER PLAN
JANUARY 2010
1
EXECUTIVE SUMMARY
Mission StatementThe goal of this Master Plan is to create a design and policy strategy for a thriving town center featuring a viable mix of retail, dining, entertainment, residential and public spaces, in a walkable and historically-sensitive environment to enhance our sense of place, economy and quality of life.
The Master Plan AreaThe Master Plan area includes all of historic downtown Round Rock, from Interstate 35 on the west, the Union Pacifi c railway line on the south, and Brushy Creek on the north and east. A portion of the site also extends north of the creek along Mays Street to just north of Palm Valley Boulevard (Highway 79).
ProcessFrom Fall 2008 to Spring 2009, the design team undertook an iterative community visioning process to create the Master Plan. Community members participated in a public design charrette, which was an intensive series of meetings, design working sessions, round tables, and presentations, to gather feedback and conceptualize the future of downtown. The feedback was consolidated and refi ned into the Master Plan.
GoalsThe primary goal of the Master Plan is to describe how Round Rock can create a bustling town center beyond its two-block historic area, which features a viable mix of uses in a walkable environment, in order to enhance the community’s economy, quality of life, and sense of place.
The visions articulated in this Plan should be solidifi ed through the implementation of a future Form Based Code. Visions and policy recommendations presented here can be synthesized and spliced into the future Code, which would include design guidelines, use regulations, and standards for building form and placement within the downtown area. The Code would encourage quality development that is compatible with the Master Plan’s urbane and pedestrian-friendly vision for downtown, which includes ground fl oor retail, mixed-uses, and activated public spaces.
The Plan aims to:Accentuate the area’s assets and build upon past planning effortsPresent a cohesive vision and identity for the areaDescribe place-making concepts to achieve an activated and attractive downtownProvide strategies to implement the urban design conceptsStimulate responsible and foresighted growth in downtown
How to Use the PlanThis Plan can be used as a development guide for downtown, informing decisions about building styles, locations, uses, and forms that are compatible with the vision articulated by the community. The Plan can also be used to understand what sorts of policy changes should be pursued to encourage appropriate development patterns and what public works projects are prioritized.
Planning PrinciplesThe planning principles emphasized include:
Community-based design for contextually-appropriate planningHuman-scale urban designWalkability and transit-orientationRespect for historic architecture and the urban block networkResponsibility to the environmentEmphasis on enduring design and quality materialsInnovation to uncover new programs, policies, and designs
The VisionThe primary strategies of the Plan include:
Defi ning a series of walkable streets and neighborhoods that are hierarchically differentiated one from the other through streetscaping, building form, and program Viewing the street as an outdoor roomPreserving the Main Street historic area and extending the downtown building fabric in terms of scale and architectureTraffi c calming / balancing all modes of travelIdentifying and programming a series of greens / public spacesIncorporating sustainable urban design
•
•
•
•
•
•
•••
••
•
•
••
••
•
Key Opportunities and ConstraintsDowntown Round Rock has a tight and walkable street grid with a signifi cant number of historical buildings. Lot sizes are small and the Main Street retail area is compact and built out. Together these characteristics make the area attractive for redevelopment and infi ll development that is pedestrian-oriented and “small town” in character. The location of downtown along the Interstate and adjacency to a rail line offer other opportunities for the study area. Both Brushy Creek and Lake Creek are other amenities that should be capitalized upon. Interstate 35, Mays, and Palm Valley Boulevard (Highway 79) are currently barriers to development since they are wide, noisy, and hard for pedestrians and bicycles to cross, but at the same time they bring a lot of people to the area. Round Rock’s position as the “Sports Capital of Texas” is another opportunity for downtown as its future is visualized.
Key Implementation and StrategiesChapter 3 presents a multi-pronged implementation framework of recommendations that includes:
Identifi cation of Seven “Catalytic Projects.” These projects are critical to the success of downtown Round Rock and have the potential to activate key areas with dynamic designs and uses. The catalytic site areas include:
New Main Street bridgeNew town greenMain Street historic core streetscapingMays streetscapingRound Rock Avenue streetscapingGeorgetown streetscapingHeritage Trail
Development/Implementation of a Form Based CodeThis Master Plan lays a strong foundation of visions, design guidelines, and policy recommendations that can later be refi ned and integrated into the city’s regulatory framework through a Form Based Code. The Code will be the tool through which the vision for downtown, articulated by the City Council, will be achieved.
•••••••
Recommendation of Policy Initiatives New policy recommendations include:
Adaptive reuse and historic preservationParking reformPublic fi nancing mechanismsRetail development tools and leasing strategiesVacant lots and infi llQuality-of-life performance standardsIncentives for green buildingRe-platting
A Design GuideA design guide is presented in Chapter 4 for urban design and architecture to guide developers, architects, and residents through standards that ensure development in downtown Round Rock is consistent with the goals presented in the Master Plan.
Organization of the documentThe Master Plan is arranged with analyses of existing conditions presented fi rst, followed by Plan visions and concepts, and then more detailed policies, implementation strategies, and studies.
The Introduction, Chapter 1, situates the Plan amongst existing documents, describes the visioning process, and presents background planning analysis for the Plan area.
Chapter 2, the Master Vision Plan, presents the vision statement and Master Plan and then goes on to describe the Plan in detail, including its open space and circulation components, historic preservation concepts, economic plan, and sustainability concepts.
Chapter 3, Implementation Policies and Strategies, describes the catalytic site areas, the options for adopting a Form Based Code, and the policy initiatives recommended for downtown.
Chapter 4 presents the design guide with both urban design and architectural guidelines for development.The Chapter provides the basis for a future Form-Based Code.
••••
••••

CITY OF ROUND ROCKDOWNTOWN MASTER PLANJANUARY 2010
2

CITY OF ROUND ROCKDOWNTOWN MASTER PLAN
JANUARY 2010
3
INTRODUCTIONProject Description

CITY OF ROUND ROCKDOWNTOWN MASTER PLANJANUARY 2010
4
CITY OF ROUND ROCKDOWNTOWN MASTER PLAN
JANUARY 2010
5
INTRODUCTIONDowntown Round Rock has the potential to become a thriving area drawing locals and visitors to shop, eat, work, visit, recreate, people-watch, and stroll; it has both the “bones” (the walkable street grid, the historic buildings) and the drive (the people, the activities, the ideas). The Master Plan puts forth a vision for an activated downtown Round Rock, consolidating community input, city goals, and planning expertise into a series of physical design concepts, social and community-oriented use-based strategies, policies, and implementation systems.
The primary goal of the Master Plan is to describe how Downtown Round Rock can become a thriving town center featuring a viable mix of residential, commercial, retail, dining, entertainment and public space uses in a walkable and historically-sensitive environment to enhance Round Rock’s economy, quality of life, and sense of place.
The pedestrian-oriented style of development supported by this Master Plan is part of a push by forward-thinking municipalities around the nation to rethink their “street spaces” and their public realm. For the past century, street design has been geared towards the automobile. Design regulations have prioritized uniformity and speed over character and livability, leaving pedestrians, bicyclists, and transit users competing for the residual space. With this Master Plan, the City of Round Rock acknowledges the potential of good urban design to improve not only the physical appearance of the community, but also the health of our residents, the environment, the strength of our social connections, and critically, our economy.
The Commission for Architecture and the Built Environment explains that good urban design adds economic value to an economy by: producing higher returns on investment; producing local competitive advantages; raising prestige; responding to demand of local businesses; providing benefi ts to local workers (through productivity gains and the like); and reducing management, maintenance, energy, and security costs.
Suburban type development typically performs well fi nancially in the short term because development costs are oftentimes less than that for urban downtown redevelopment, with anticipated peak performance in the fi rst fi ve to ten years. Investment in the suburban areas is also more cyclical as sprawl continues to push demand in to further outlying areas. Conversely, downtown redevelopment can typically achieve higher returns in the long term due to higher quality construction and investment in the early years. Moreover, studies show that suburban development is often subsidized due to the cost of extending roads and other infrastructure improvements and providing new services in the outlying regions.
Cities that have invested in their public realm and encouraged urban-style redevelopment are seeing improved property values and increased retail sales. For instance, typical suburban property values are $5-15 per square foot while mixed-use urban values are $25-30 per square foot. Appropriately-placed pedestrian zones in city centers boosted foot traffi c by 20-40% and retail sales by 10-25% in the UK. A nationwide study in the US reported a property value increase of 30% after new traffi c
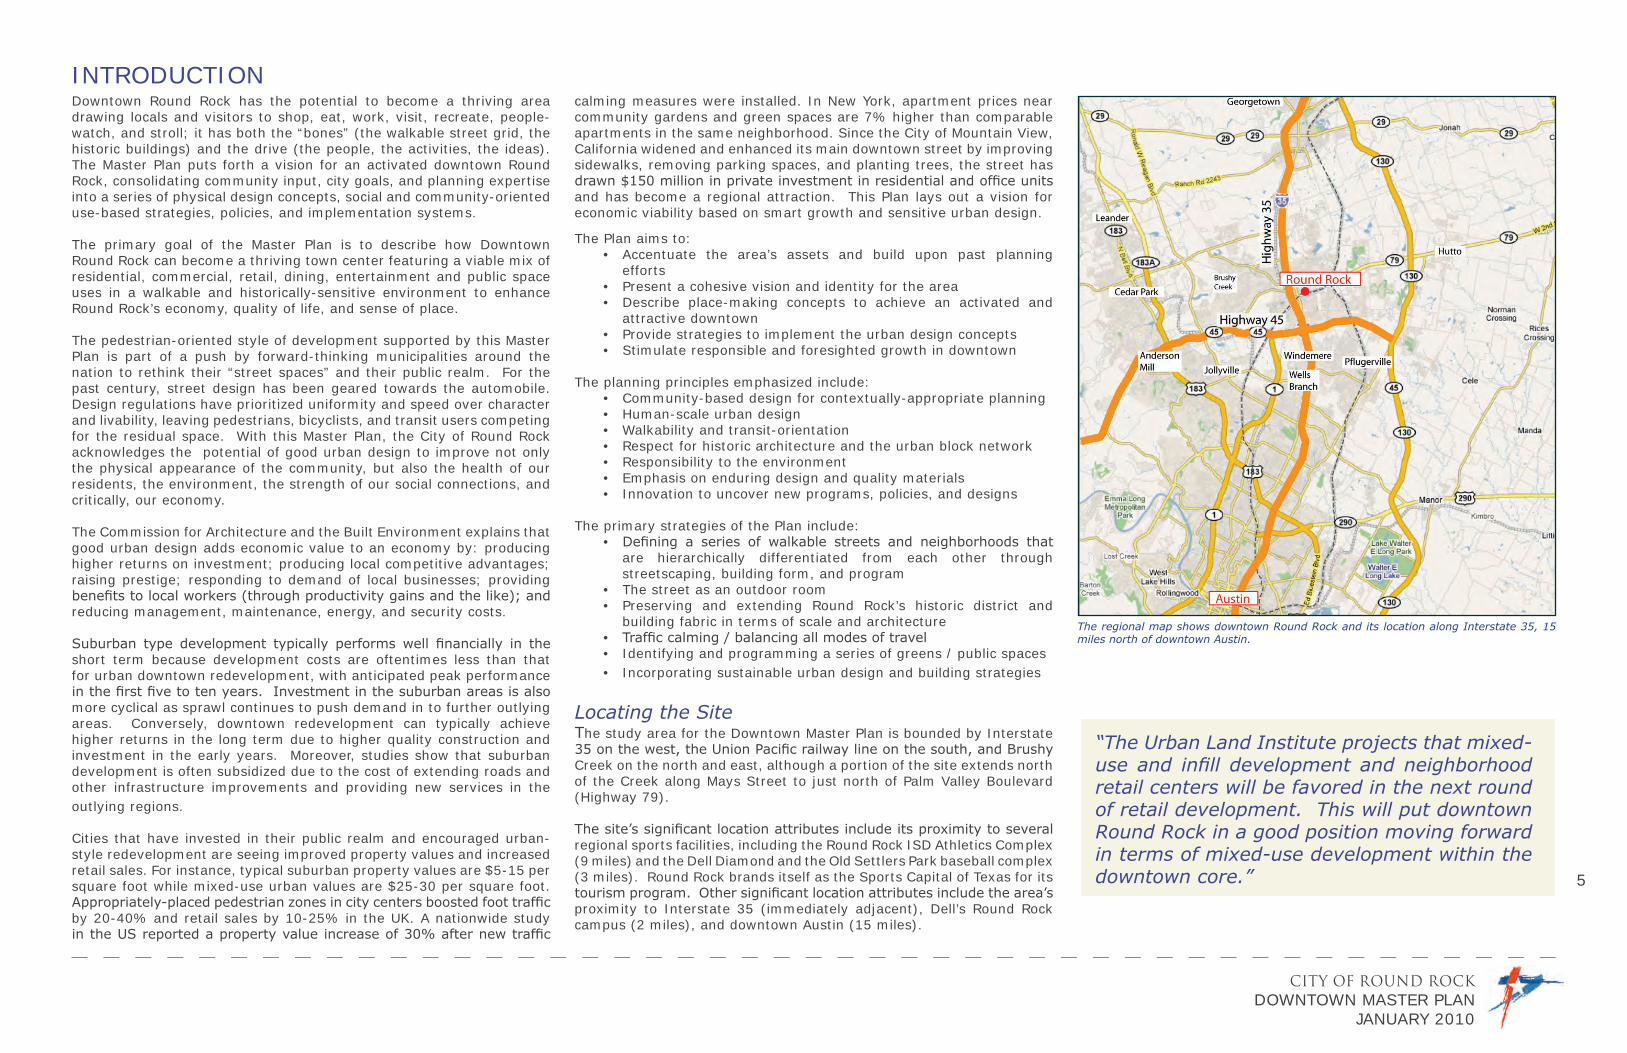
The regional map shows downtown Round Rock and its location along Interstate 35, 15 miles north of downtown Austin.
calming measures were installed. In New York, apartment prices near community gardens and green spaces are 7% higher than comparable apartments in the same neighborhood. Since the City of Mountain View, California widened and enhanced its main downtown street by improving sidewalks, removing parking spaces, and planting trees, the street has drawn $150 million in private investment in residential and offi ce units and has become a regional attraction. This Plan lays out a vision for economic viability based on smart growth and sensitive urban design.
The Plan aims to:Accentuate the area’s assets and build upon past planning effortsPresent a cohesive vision and identity for the areaDescribe place-making concepts to achieve an activated and attractive downtownProvide strategies to implement the urban design conceptsStimulate responsible and foresighted growth in downtown
The planning principles emphasized include:Community-based design for contextually-appropriate planningHuman-scale urban designWalkability and transit-orientationRespect for historic architecture and the urban block network Responsibility to the environmentEmphasis on enduring design and quality materialsInnovation to uncover new programs, policies, and designs
The primary strategies of the Plan include:Defi ning a series of walkable streets and neighborhoods that are hierarchically differentiated from each other through streetscaping, building form, and programThe street as an outdoor roomPreserving and extending Round Rock’s historic district and building fabric in terms of scale and architectureTraffi c calming / balancing all modes of travelIdentifying and programming a series of greens / public spacesIncorporating sustainable urban design and building strategies
Locating the SiteThe study area for the Downtown Master Plan is bounded by Interstate 35 on the west, the Union Pacifi c railway line on the south, and Brushy Creek on the north and east, although a portion of the site extends north of the Creek along Mays Street to just north of Palm Valley Boulevard (Highway 79).
The site’s signifi cant location attributes include its proximity to several regional sports facilities, including the Round Rock ISD Athletics Complex (9 miles) and the Dell Diamond and the Old Settlers Park baseball complex (3 miles). Round Rock brands itself as the Sports Capital of Texas for its tourism program. Other signifi cant location attributes include the area’s proximity to Interstate 35 (immediately adjacent), Dell’s Round Rock campus (2 miles), and downtown Austin (15 miles).
•
••
••
•••••••
•
••
•••
“The Urban Land Institute projects that mixed-use and infi ll development and neighborhood retail centers will be favored in the next round of retail development. This will put downtown Round Rock in a good position moving forward in terms of mixed-use development within the downtown core.”

CITY OF ROUND ROCKDOWNTOWN MASTER PLANJANUARY 2010
611
Best of Round Rock
Main Street
The two blocks of Main Street east of Mays, which cons tute the core of the tradi onal downtown, drew praise as a place whose character can be capitalized on in future development ac vi es.
Brushy Creek
Par cipants iden ed the western two-thirds of Brushy Creek, from Memorial Park to Veterans Park, as an underu lized gem of a natural space.
Civic Complex
The Baca Center and the McConico Building, along with the future City Hall site, were iden ed as part of the Best of Round Rock.
Goodrich Estate
Many mee ng par cipants looked favorably on the historic home and well-kept gardens and landscape of the Goodrich Estate as an asset to downtown.
§̈¦35
§̈¦35
E MAIN ST
E AUSTIN AVE
E LIBERTY AVE
PARK LN
SST
NIH
35FRN
NLEWIS
ST
ROUNDROCK AVE
PECAN AVE
NGEORGETOWNST
W MAIN ST
NLEEST
E MILAM AVE
FANNIN AVE
SIH
35FRN
SMAYSST
MCNEIL
RD
NRYEST
NLAMPASASST
W ANDERSON AVE
W AUSTIN AVE
SPRINGST
NBLACKST
SBURNETST
SBLAIR
ST
E ANDERSON AVE
E BAGDAD AVE
W BAGDAD AVE
CIRCLEAVE
W LIBERTY AVE
NSTONEST
SBROWNST
NSHEPPARDST
NBLAIR
ST
BRUSHY CREEK DR
NNELSONST
NCOLLEGEST
SHEPPARDST
DEERFOOT DR
NIH
35FRS
TIMBERWOOD DR
PECANLN
FLORENCE ST
SANSABA
SSTONEST
SBLACKST
PARKWAY
NHARRIS
ST
SANSABAST
SHARRIS
ST
NBURNETST
LAKE CREEK CIR
NBROWNST
SSHEPPARDST
SLAMPASASST
SGEORGETOWNST
W MILAM AVE
TRAILWAYST
EERFOOTCIR
NBURNETST
W LIBERTY AVE
NBLAIR
ST
E BAGDAD AVE
NBROWNST
:1 " equals 100 ft
MAP DISCLAIMER:Though care has been taken to produce this map, the City of Round Rock makes no claimas to the accuracy or completeness of these maps or the data contained within.Parcel data is for informational purposes and does not constitute a legal land boundary survey.Flood plain data may not represent the true and accurate location of the 100 year flood plain.Always consult the Planning and Public Works Departments at the City of Round Rock regardingbuilding-zoning-utility information.
DDA
RAILROADS
PARCELS
STREETS
Interstate
US Highway
State Highway
FM Highway
County Road
Local Street
Private
State Hwy (not open)
FM Hwy (not open)
Local Street (not open)
0 200 400100Feet
“Best of Round Rock” Mee ng Par cipant Responses
Goodrich Estate
Brushy Creek
Main Street
“An Eye Toward the Future”For several years, urban life has been making a strong resurgence. People are turning to previously neglected downtowns and town centers as sources of nightlife, civic activity, workspace, and shopping. Auto-oriented development is more unpopular while pedestrian-oriented and multi-modal patterns of growth are growing in prevalence. The preservation of historic districts is coupled with a search for new sustainable growth strategies. This Downtown Plan for Round Rock is positioned amongst these national trends. The Plan is based on the community’s increasing belief in the potential downtown has to blossom along with the community’s recognition of the inevitability of growth and the imperative to get ahead of that growth.
Building on What Has Come BeforeThe Master Plan (2010) is the result of an intensive community design process (Winter 2008), a walkability study (June 2007), a City Council Retreat (August 2007), a series of focus groups, interviews, public meetings and surveys (November 2007), a series of city tours by the City Council to learn fi rst-hand about redevelopment and a Southwest Downtown Plan (2005). Together these activities helped frame and guide the Master Plan process.
Policy FrameworkThe City’s General Plan (2000) and the Downtown Neighborhood Plan (1994, reviewed 2002) are the two policy documents that guide growth in the study area. The Neighborhood Plan provides a set of recommendations aimed at improving property values, assuring that new development is sensitive to existing development, and promoting the positive aspects of the neighborhood. The Plan focuses on business promotion, code enforcement, street clean-up and maintenance, landscaping, sidewalk improvement, lighting installation, increase of park space, public safety programs, and parking and circulation improvements.
Visioning MeetingsThe 140 participants in the November (2007) visioning meetings included residents, business and property owners, elected offi cials, community representatives, developers, and other stakeholders. The community identifi ed the area’s assets on which the Master Plan should capitalize, such as the two-block historic core on Main Street, the unique architectural quality of many historic buildings, Brushy Creek, the walkability of the urban street grid, and the small-town feel of the area. Constraints such as the barrier presented by Mays Street, perceptions of parking shortages, insuffi cient infrastructure, speeding traffi c, and too few restaurants, businesses, and other downtown attractions, were also identifi ed during the meetings.
City Council RetreatDuring the City Council Retreat, the Mayor and Council members visited Silicon Valley, the Denver Metroplex, and Scottsdale, Arizona to get ideas about how Round Rock should grow and what role the Council should take in supervising this growth. Planning concepts identifi ed include: a 24 hour activation of downtown, walkability, a sensitive increase of density, the use of incentives to spur development, the enhancement of public spaces, and the creation of a “sense of place.”
Walkability StudyThe Walkability Study highlighted some of the issues facing future development in downtown and it described the opportunity for placemaking in downtown. The report acknowledged the well-laid out
Chart from the Downtown Walkability Report, 2007. “Best of Round Rock” page from the Scoping Report, 2007.
street grid, historic buildings, and location as keys that can help Round Rock become a “model walkable community.” The Plan looked at the realignment of Round Rock Avenue and the introduction of roundabouts to slow traffi c and increase walkability. A comprehensive Master Plan for downtown was recommended.
Master PlanThis Master Plan develops the comments and feedback from the walkability study, council retreat, and community meeting through a visioning process described on the facing page.

CITY OF ROUND ROCKDOWNTOWN MASTER PLAN
JANUARY 2010
7
COMMUNITY VISIONING PROCESS
...a summary of the actions which will implement an effective long-term plan for Downtown
City Posts Informationand Sends Mailers to Community
Visit the Site
Kick-off Meeting
Discuss Opportunities
Discuss Challenges
Discuss Approach
Brainstorm
Propose Ideas
Present InformationGathered
Get Feedback from Cityand CommunityMembers
Refine Goals
PHASES
TIMELINE
Meet
Oct.08 Nov/Dec.08 Jan 12 - 16 .09 Winter/Spring.09 Spring.09
Learn Engage Design Refine
In this phase the design team and the City refines the goals and methods and set up the framework for the project.
City of Round Rock | Torti Gallas and Partners
Downtown Round Rock
Summary
Master Plan
Planning Process
Gather Data
Study Precedents
Analyze the Study Area
The Team is Open to all Suggestions
City Sets Up Meetingswith Community Members for the Charrette
In this phase the design team studies every-thing available about what makes Round Rock what it is. We look at examples of what other cities are doing that can inform planning here and we analyze the site with diagrams and studies.
Community Charrette
One-on-One Meetings
Focus Design Sessions
From the Block tothe City
Iterative Design Process
Design Interventions Based on Community’sInput
Integrate Feedback
Make Changes
Finalize Plan
Present Final PlanExpected June 09
In this critical phase the community works directly with the design team to express their visions and ideas for the Downtown area. Through design sessions and meetings programmed over an intensive week, the charrette focuses the design process in a “fish-bowl-planning” type of format.
In this phase we refine the ideas arrived at during the charrette and bring them together into a plan, which is then reviewed by the City and by stakeholders.
Dow
ntown
Round RockM
aster Plan
From Fall 2008 to Spring 2009, the design team undertook an iterative community visioning process to create the Master Plan.
In this phase the design team visited and documented the site, met with city offi cials, and discussed opportunities, challenges, approaches, and goals for the Master Plan. The methods and framework for the project were established.
In this phase the design team studied reports, policies, past plans and meeting minutes, and newspaper articles, to understand what makes Round Rock tick. The team looked at planning precedents from towns around the United States.
In the third phase of visioning, the design team and the city led a week-long community “charrette.” A charrette is an intensive series of meetings, public design sessions, presentations, and focus sessions involving the public and the design team, the goal of which is to arrive at a Master Vision Plan and preliminary planning strategies.
The community worked together with the design team to identify priorities and evaluate strategies. Ideas for streetscape improvements, urban design, circulation and traffi c, architecture, open space, economic development, infrastructure, sustainability, and historic preservation were crafted, vetted and refi ned. After the charrette, the design team refi ned the vision.
An Open House was conducted for the public to review and comment on a Draft of the Plan.
...a summary of the actions which will implement an effective long-term plan for Downtown
City Posts Informationand Sends Mailers to Community
Visit the Site
Kick-off Meeting
Discuss Opportunities
Discuss Challenges
Discuss Approach
Brainstorm
Propose Ideas
Present InformationGathered
Get Feedback from Cityand CommunityMembers
Refine Goals
PHASES
TIMELINE
Meet
Oct.08 Nov/Dec.08 Jan 12 - 16 .09 Winter/Spring.09 Spring.09
Learn Engage Design Refine
In this phase the design team and the City refines the goals and methods and set up the framework for the project.
City of Round Rock | Torti Gallas and Partners
Downtown Round Rock
Summary
Master Plan
Planning Process
Gather Data
Study Precedents
Analyze the Study Area
The Team is Open to all Suggestions
City Sets Up Meetingswith Community Members for the Charrette
In this phase the design team studies every-thing available about what makes Round Rock what it is. We look at examples of what other cities are doing that can inform planning here and we analyze the site with diagrams and studies.
Community Charrette
One-on-One Meetings
Focus Design Sessions
From the Block tothe City
Iterative Design Process
Design Interventions Based on Community’sInput
Integrate Feedback
Make Changes
Finalize Plan
Present Final PlanExpected June 09
In this critical phase the community works directly with the design team to express their visions and ideas for the Downtown area. Through design sessions and meetings programmed over an intensive week, the charrette focuses the design process in a “fish-bowl-planning” type of format.
In this phase we refine the ideas arrived at during the charrette and bring them together into a plan, which is then reviewed by the City and by stakeholders.
Dow
ntown
Round RockM
aster Plan
Assessing the existing conditions Community design charrette Refi ning charrette concepts into a PlanDefi ning goals, issues, and opportunities
The fi nal draft Plan was presented to the public in Fall 2009.
Approve
City Council meeting approving Plan
Step 1 Step 2 Step 3 Step 4 Step 5
...a summary of the actions which will implement an effective long-term plan for Downtown
City Posts Informationand Sends Mailers to Community
Visit the Site
Kick-off Meeting
Discuss Opportunities
Discuss Challenges
Discuss Approach
Brainstorm
Propose Ideas
Present InformationGathered
Get Feedback from Cityand CommunityMembers
Refine Goals
PHASES
TIMELINE
Meet
Oct.08 Nov/Dec.08 Jan 12 - 16 .09 Winter/Spring.09 Spring.09
Learn Engage Design Refine
In this phase the design team and the City refines the goals and methods and set up the framework for the project.
City of Round Rock | Torti Gallas and Partners
Downtown Round Rock
Summary
Master Plan
Planning Process
Gather Data
Study Precedents
Analyze the Study Area
The Team is Open to all Suggestions
City Sets Up Meetingswith Community Members for the Charrette
In this phase the design team studies every-thing available about what makes Round Rock what it is. We look at examples of what other cities are doing that can inform planning here and we analyze the site with diagrams and studies.
Community Charrette
One-on-One Meetings
Focus Design Sessions
From the Block tothe City
Iterative Design Process
Design Interventions Based on Community’sInput
Integrate Feedback
Make Changes
Finalize Plan
Present Final PlanExpected June 09
In this critical phase the community works directly with the design team to express their visions and ideas for the Downtown area. Through design sessions and meetings programmed over an intensive week, the charrette focuses the design process in a “fish-bowl-planning” type of format.
In this phase we refine the ideas arrived at during the charrette and bring them together into a plan, which is then reviewed by the City and by stakeholders.
Dow
ntown
Round RockM
aster Plan
&
CITY OF ROUND ROCKDOWNTOWN MASTER PLANJANUARY 2010
8
BACKGROUND ANALYSIS
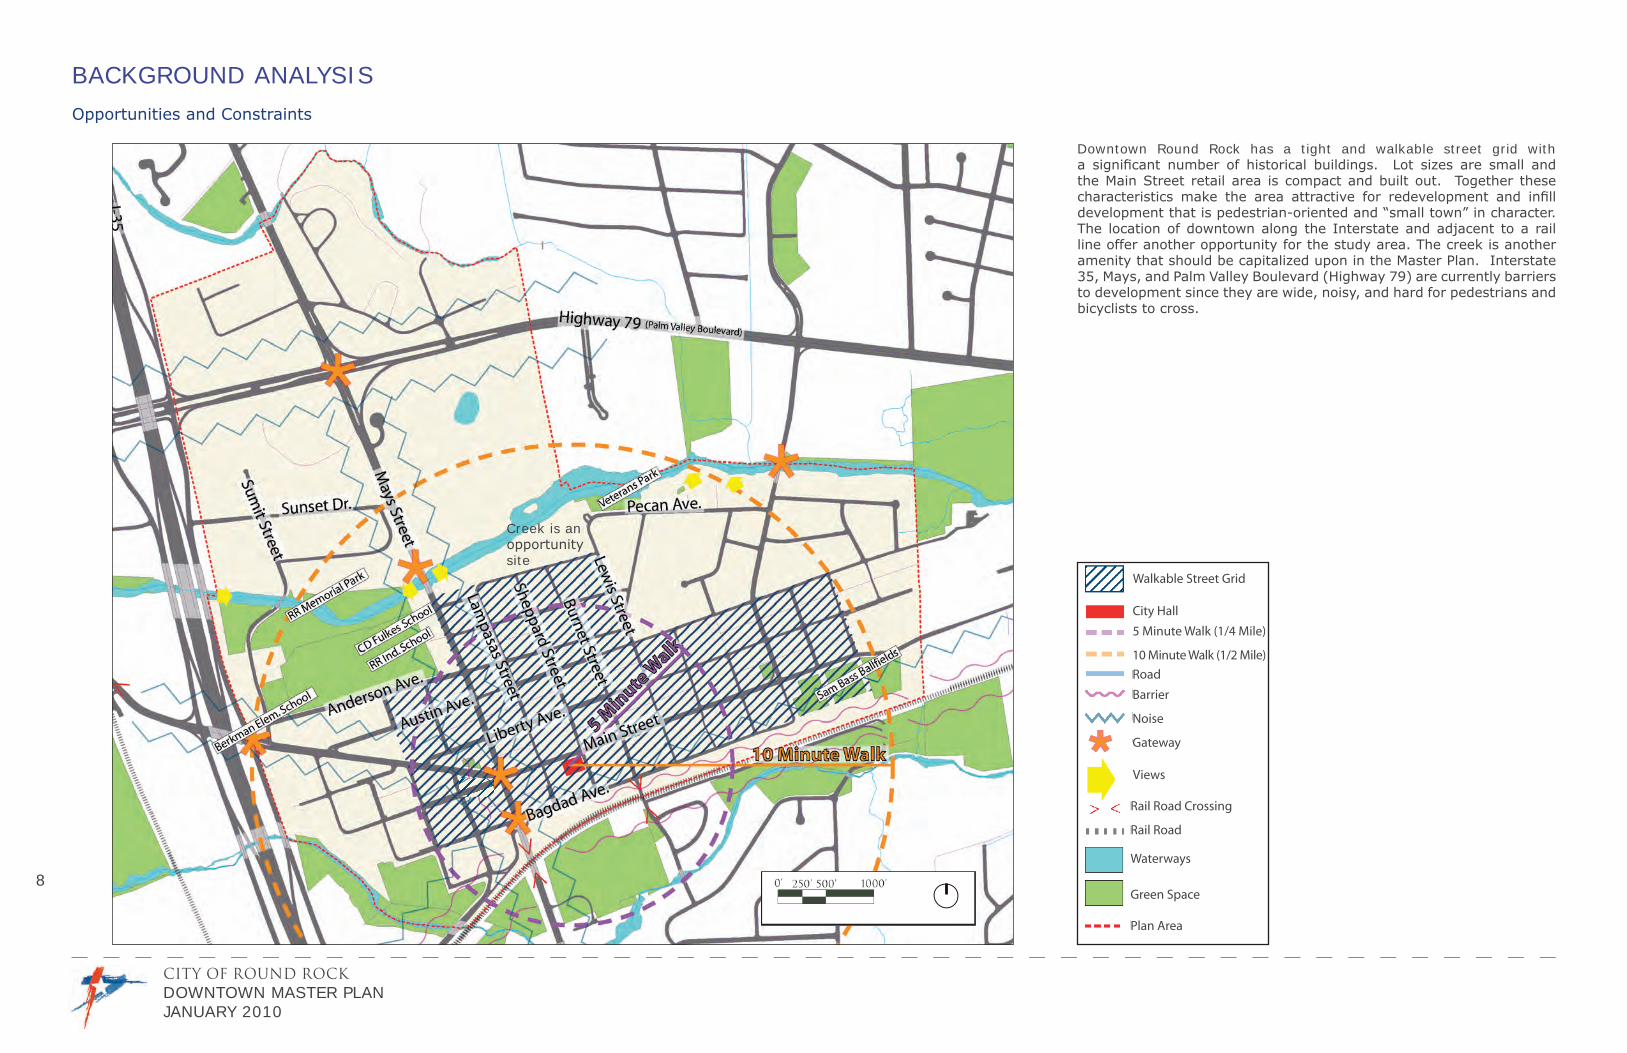
Downtown Round Rock has a tight and walkable street grid with a signifi cant number of historical buildings. Lot sizes are small and the Main Street retail area is compact and built out. Together these characteristics make the area attractive for redevelopment and infi ll development that is pedestrian-oriented and “small town” in character. The location of downtown along the Interstate and adjacent to a rail line offer another opportunity for the study area. The creek is another amenity that should be capitalized upon in the Master Plan. Interstate 35, Mays, and Palm Valley Boulevard (Highway 79) are currently barriers to development since they are wide, noisy, and hard for pedestrians and bicyclists to cross.
Opportunities and Constraints
Walkable Street Grid
City Hall
5 Minute Walk (1/4 Mile)
10 Minute Walk (1/2 Mile)
Road
Barrier
Noise
Gateway
Views
Rail Road Crossing
Rail Road
Waterways
Green Space
Plan Area
Creek is an opportunity site

CITY OF ROUND ROCKDOWNTOWN MASTER PLAN
JANUARY 2010
9
Retail uses are clustered along the two blocks of Main Street between Mays and Sheppard, the historical downtown. Commercial uses exist along Mays and Round Rock Avenue and within southwest downtown, south of Mays and east of the Interstate. Most of the residential development within the study area is single-family on small lots. Governmental/ institutional uses are located around the central downtown area.
Land Use
Single-Family
Two Family
Multi-Family
Multi FamilyAgriculture
Commercial
Offi ce
Industrial
Government / Institutional
Educational
Recreational
Utilities
Waterways
Plan Area
(Land Use, 2008)

CITY OF ROUND ROCKDOWNTOWN MASTER PLANJANUARY 2010
10
Main Street is the area’s main east/west street and the historical heart of downtown. Mays Street is the primary north/south connector. Mays is used by many drivers as an Interstate bypass and accommodates traffi c in four lanes. Round Rock Avenue connects downtown to the Interstate and is quite wide. Many of the smaller residential streets are narrow without sidewalks. There are few cul-de-sacs and dead-end streets in downtown; most streets connect in a tight grid formation.
Circulation
Primary Road
Secondary Road
Rail Road
Waterways
Plan Area

CITY OF ROUND ROCKDOWNTOWN MASTER PLAN
JANUARY 2010
11
The fi gure / ground diagram shows buildings in black placed on a white background. The diagram helps to isolate development patterns that can help inform planning and design concepts. Within the study area, buildings are small scale and dense, compared to the auto-oriented buildings along the Interstate. Likewise houses within the study area are generally smaller than houses within the surrounding suburban areas. Larger building grain along Round Rock and Main attest to the commercial-orientation of these two streets.
Figure Ground
Buildings
Waterways
Plan Area

CITY OF ROUND ROCKDOWNTOWN MASTER PLANJANUARY 2010
12
The area is differentiated from its surroundings because of its historical block street grid; much of the development around the study area is suburban in scale and layout with large blocks, cul-de-sacs, and curvilinear roads. Most of the blocks in downtown are approximately 275 feet long. The small scale of the blocks is conducive to walking and to alternate forms of transportation.
Block Network
Blocks
Open Space
Waterways
Plan Area
CITY OF ROUND ROCKDOWNTOWN MASTER PLAN
JANUARY 2010
13
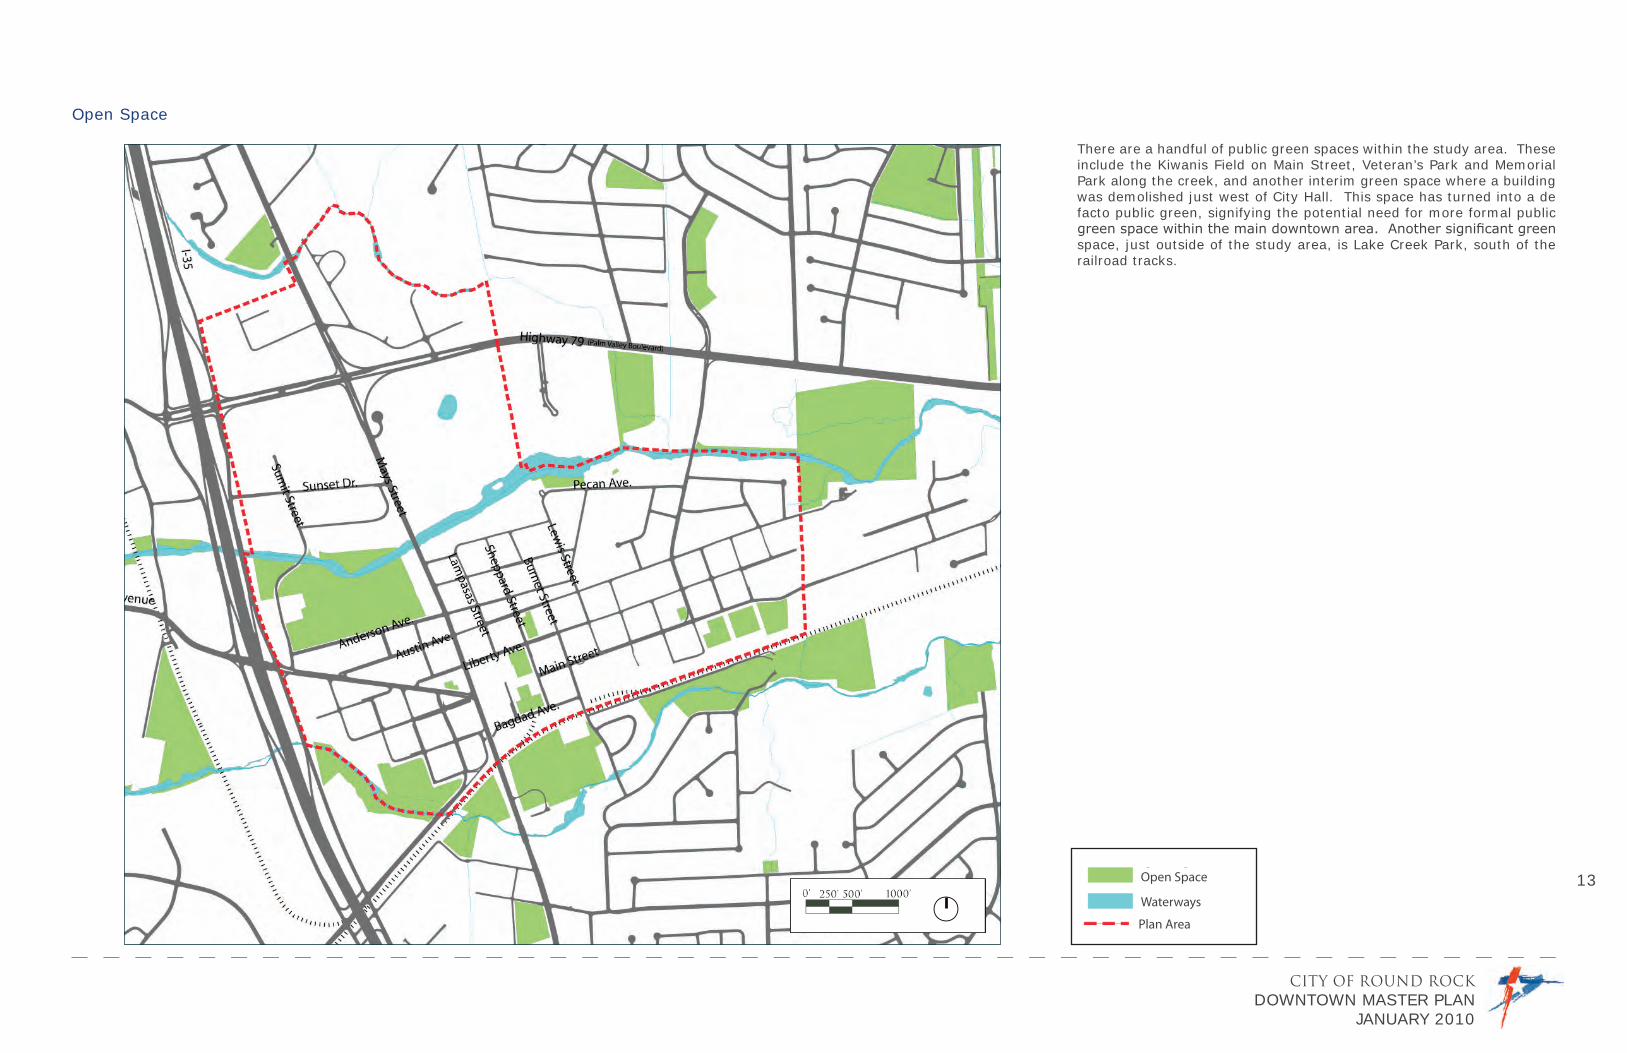
There are a handful of public green spaces within the study area. These include the Kiwanis Field on Main Street, Veteran’s Park and Memorial Park along the creek, and another interim green space where a building was demolished just west of City Hall. This space has turned into a de facto public green, signifying the potential need for more formal public green space within the main downtown area. Another signifi cant green space, just outside of the study area, is Lake Creek Park, south of the railroad tracks.
Open Space
Open Space
Waterways
Plan Area
CITY OF ROUND ROCKDOWNTOWN MASTER PLANJANUARY 2010
14
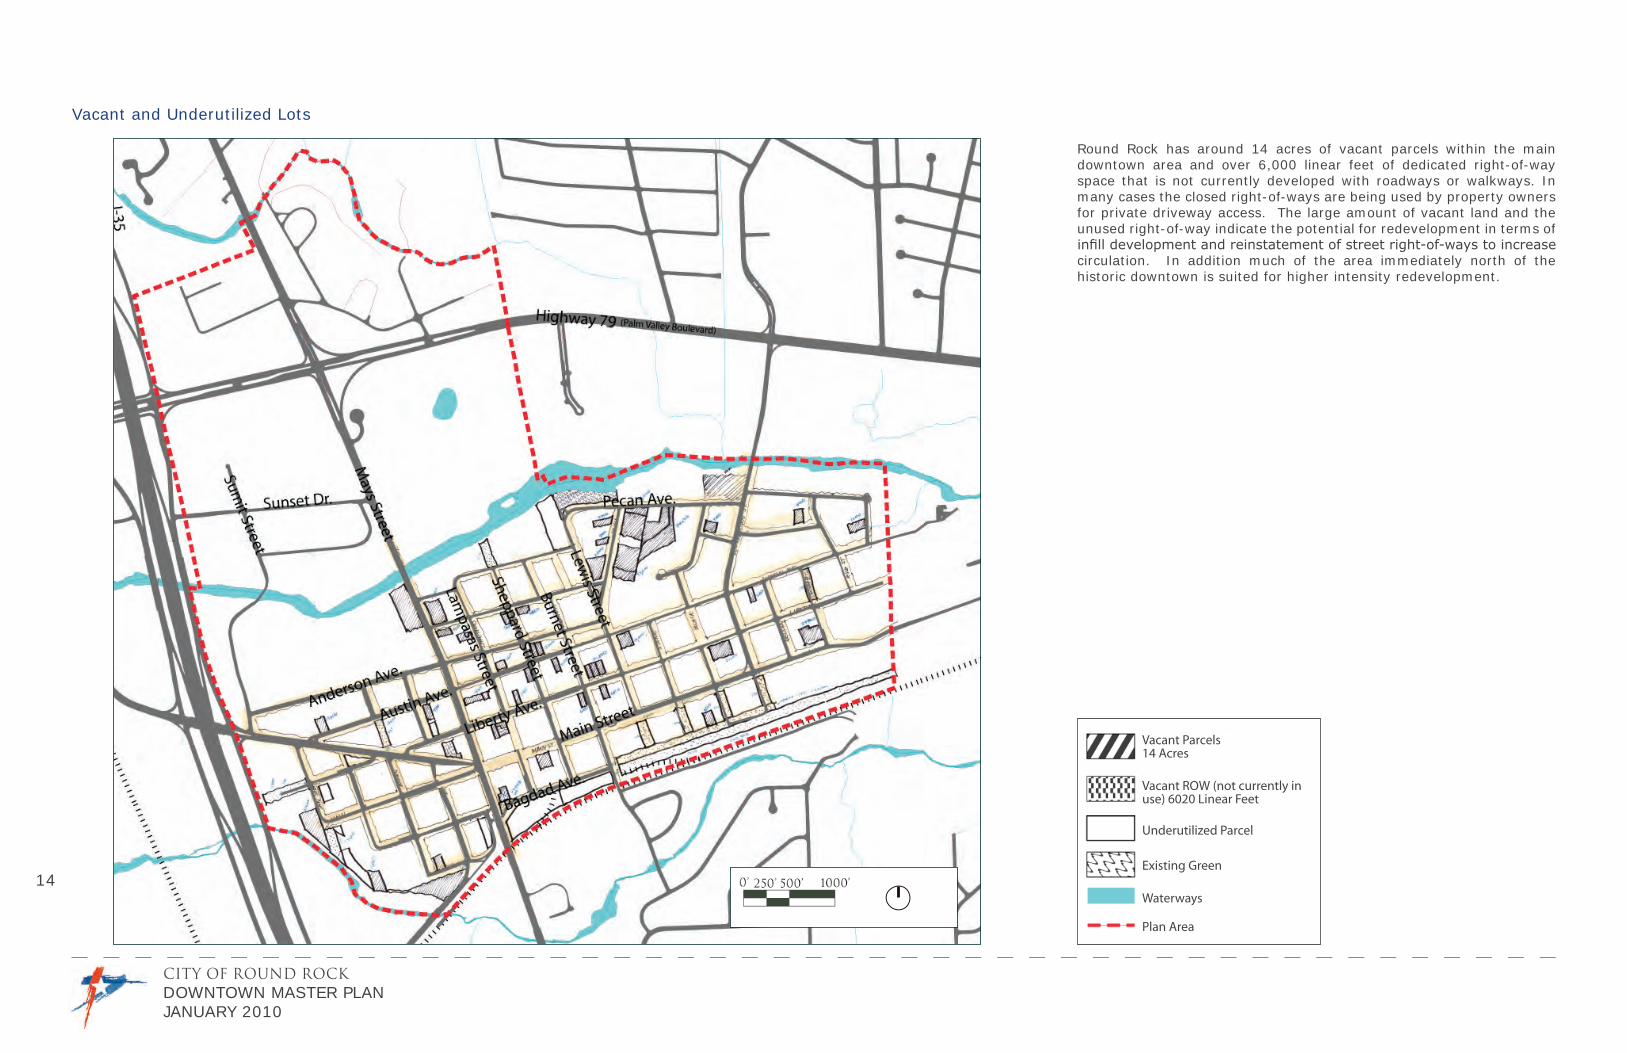
Round Rock has around 14 acres of vacant parcels within the main downtown area and over 6,000 linear feet of dedicated right-of-way space that is not currently developed with roadways or walkways. In many cases the closed right-of-ways are being used by property owners for private driveway access. The large amount of vacant land and the unused right-of-way indicate the potential for redevelopment in terms of infi ll development and reinstatement of street right-of-ways to increase circulation. In addition much of the area immediately north of the historic downtown is suited for higher intensity redevelopment.
Vacant and Underutilized Lots
Vacant Parcels14 Acres
Vacant ROW (not currently in use) 6020 Linear Feet
Underutilized Parcel
Existing Green
Waterways
Plan Area

CITY OF ROUND ROCKDOWNTOWN MASTER PLAN
JANUARY 2010
15
Current infrastructure in portions of the study area is insuffi cient to serve future demand. There is a water distribution pipeline network consisting of mostly six inch lines with some two inch and eight inch lines. The main feed is a 12 inch line on the 890 pressure level. To accommodate redevelopment and serve existing development under current codes, water system improvements are needed. The wastewater system in the downtown study area consists primarily of six and eight inch lines which tie into 18 inch and ten inch lines, extending from the treatment facility on the east side of downtown west into the downtown area. With respect to stormwater conveyance, the existing system varies substantially in character. The Round Rock Avenue and Mays Street systems include a robust storm sewer system whereas parts of the eastern downtown area rely on surface drainage with few storm sewers. There is a lack of water quality infrastructure in the southeast portion of the plan area.
Infrastructure
I-35
(Palm Valley Boulevard)Highway 79Highway 79Highway 79Highway 79
Round Rock AvenueRound Rock AvenueRound Rock AvenueRound Rock AvenueRound Rock AvenueRound Rock AvenueRound Rock AvenueRound Rock AvenueRound Rock AvenueRound Rock AvenueRound Rock AvenueRound Rock AvenueRound Rock Avenue
Mays Street
Mays Street
Mays Street
Mays Street
Mays Street
Mays Street
Mays Street
Mays Street
Mays Street
Mays Street
Mays Street
Mays Street
Mays Street
Mays Street
Mays Street
Mays Street
Mays Street
Mays Street
Mays Street
Mays Street
Mays Street
Mays Street
Mays Street
Mays Street
Mays Street
Mays Street
Mays Street
Mays Street
Mays Street
Mays Street
Mays Street
Mays Street
Mays Street
Mays Street
Mays Street
Mays Street
Mays Street
Mays Street
Mays Street
Mays Street
Mays Street
Mays Street
Mays Street
Mays Street
Mays Street
Mays Street
Mays Street
Mays Street
Mays Street
Mays Street
Burnet Street
Burnet Street
Burnet Street
Burnet Street
Burnet Street
Burnet Street
Burnet Street
Burnet Street
Burnet Street
Burnet Street
Burnet Street
Burnet Street
Burnet Street
Burnet Street
Burnet Street
Burnet Street
Burnet Street
Burnet Street
Burnet Street
Burnet Street
Burnet Street
Burnet Street
Burnet Street
Burnet Street
Burnet Street
Burnet Street
Burnet Street
Burnet Street
Burnet Street
Burnet Street
Burnet Street
Burnet Street
Burnet Street
Burnet Street
Burnet Street
Burnet Street
Burnet Street
Burnet Street
Burnet Street
Burnet Street
Burnet Street
Burnet Street
Burnet Street
Burnet Street
Main Street
Main Street
Main Street
Main Street
Main Street
Main Street
Main Street
Bagdad Ave.
Bagdad Ave.
Bagdad Ave.
Bagdad Ave.
Bagdad Ave.
Bagdad Ave.
Bagdad Ave.
Bagdad Ave.
Bagdad Ave.
Bagdad Ave.
Bagdad Ave.
Bagdad Ave.
Bagdad Ave.
Bagdad Ave.
Bagdad Ave.
Bagdad Ave.
Bagdad Ave.
Bagdad Ave.
Bagdad Ave.
Bagdad Ave.
Bagdad Ave.
Bagdad Ave.
Bagdad Ave.
Bagdad Ave.
Bagdad Ave.
Bagdad Ave.
Bagdad Ave.
Bagdad Ave.
Bagdad Ave.
Bagdad Ave.
Bagdad Ave.
Bagdad Ave.
Bagdad Ave.
Bagdad Ave.
Bagdad Ave.
Bagdad Ave.
Bagdad Ave.
Bagdad Ave.
Bagdad Ave.
Bagdad Ave.
Bagdad Ave.
Bagdad Ave.
Bagdad Ave.
Bagdad Ave.
Bagdad Ave.
Bagdad Ave.
Bagdad Ave.
Bagdad Ave.
Bagdad Ave.
Bagdad Ave.
Bagdad Ave.
Bagdad Ave.
Bagdad Ave.
Bagdad Ave.
Bagdad Ave.
Bagdad Ave.
Bagdad Ave.
Bagdad Ave.
Bagdad Ave.
Bagdad Ave.
Bagdad Ave.
Bagdad Ave.
Bagdad Ave.
Bagdad Ave.
Bagdad Ave.
Bagdad Ave.
Bagdad Ave.
Bagdad Ave.
Bagdad Ave.
Bagdad Ave.
Bagdad Ave.
Bagdad Ave.
Bagdad Ave.
Bagdad Ave.
Bagdad Ave.
Bagdad Ave.
Bagdad Ave.
Bagdad Ave.
Bagdad Ave.
Bagdad Ave.
Bagdad Ave.
Bagdad Ave.
Bagdad Ave.
Bagdad Ave.
Bagdad Ave.
Bagdad Ave.
Bagdad Ave.
Bagdad Ave.
Bagdad Ave.
Bagdad Ave.
Bagdad Ave.
Bagdad Ave.
Bagdad Ave.
Bagdad Ave.
Bagdad Ave.
Bagdad Ave.
Bagdad Ave.
Bagdad Ave.
Bagdad Ave.
Bagdad Ave.
Bagdad Ave.
Bagdad Ave.
Bagdad Ave.
Bagdad Ave.
Bagdad Ave.
Bagdad Ave.
Bagdad Ave.
Bagdad Ave.
Bagdad Ave.
Bagdad Ave.
Bagdad Ave.
Bagdad Ave.
Bagdad Ave.
Bagdad Ave.
Bagdad Ave.
Bagdad Ave.
Bagdad Ave.
Bagdad Ave.
Bagdad Ave.
Bagdad Ave.
Bagdad Ave.
Bagdad Ave.
Bagdad Ave.
Bagdad Ave.
Bagdad Ave.
Bagdad Ave.
Bagdad Ave.
Bagdad Ave.
Bagdad Ave.
Bagdad Ave.
Bagdad Ave.
Bagdad Ave.
Bagdad Ave.
Bagdad Ave.
Bagdad Ave.
Bagdad Ave.
Bagdad Ave.
Bagdad Ave.
Bagdad Ave.
Bagdad Ave.
Bagdad Ave.
Bagdad Ave.
Bagdad Ave.
Bagdad Ave.
Bagdad Ave.
Bagdad Ave.
Bagdad Ave.
Bagdad Ave.
Bagdad Ave.
Bagdad Ave.
Bagdad Ave.
Bagdad Ave.
Bagdad Ave.
Bagdad Ave.
Bagdad Ave.
Bagdad Ave.
Bagdad Ave.
Bagdad Ave.
Bagdad Ave.
Bagdad Ave.
Bagdad Ave.
Bagdad Ave.
Bagdad Ave.
Bagdad Ave.
Bagdad Ave.
Bagdad Ave.
Bagdad Ave.
Bagdad Ave.
Bagdad Ave.
Bagdad Ave.
Bagdad Ave.
Liberty Ave.
Liberty Ave.
Liberty Ave.
Liberty Ave.
Liberty Ave.
Liberty Ave.
Liberty Ave.
Liberty Ave.
Liberty Ave.
Liberty Ave.
Liberty Ave.
Liberty Ave.
Liberty Ave.
Liberty Ave.
Liberty Ave.
Liberty Ave.
Liberty Ave.
Liberty Ave.
Liberty Ave.
Liberty Ave.
Liberty Ave.
Liberty Ave.
Liberty Ave.
Liberty Ave.
Liberty Ave.
Liberty Ave.
Liberty Ave.
Liberty Ave.
Liberty Ave.
Austin Ave.
Austin Ave.
Austin Ave.
Austin Ave.
Austin Ave.
Austin Ave.
Austin Ave.
Austin Ave.
Austin Ave.
Austin Ave.
Austin Ave.
Austin Ave.
Austin Ave.
Austin Ave.
Austin Ave.
Austin Ave.
Austin Ave.
Austin Ave.
Austin Ave.
Austin Ave.
Austin Ave.
Austin Ave.
Austin Ave.
Austin Ave.
Austin Ave.
Austin Ave.
Austin Ave.
Austin Ave.
Austin Ave.
DOWNTOWN STUDY AREA
CREEK / STREAM
RAILROAD
EXISTING WATER LINE
EXISTING FIRE HYDRANT
EXISTING WATER VALVE
AUSTIN AVE./LIBERTY AVE.STREET IMPROVEMENTS (8”WL)
FLOOD PLAINFloodway
100 Year Flood
DOWNTOWN STUDY AREA
CREEK / STREAM
RAILROAD
EXISTING WATER LINE
EXISTING FIRE HYDRANT
EXISTING WATER VALVE
AUSTIN AVE./LIBERTY AVE.STREET IMPROVEMENTS (8”WL)
FLOOD PLAINFloodway
100 Year Flood
DOWNTOWN STUDY AREA
CREEK / STREAM
RAILROAD
EXISTING WATER LINE
EXISTING FIRE HYDRANT
EXISTING WATER VALVE
AUSTIN AVE./LIBERTY AVE.STREET IMPROVEMENTS (8”WL)
FLOOD PLAINFloodway
100 Year Flood
CITY OF ROUND ROCKDOWNTOWN MASTER PLANJANUARY 2010
16
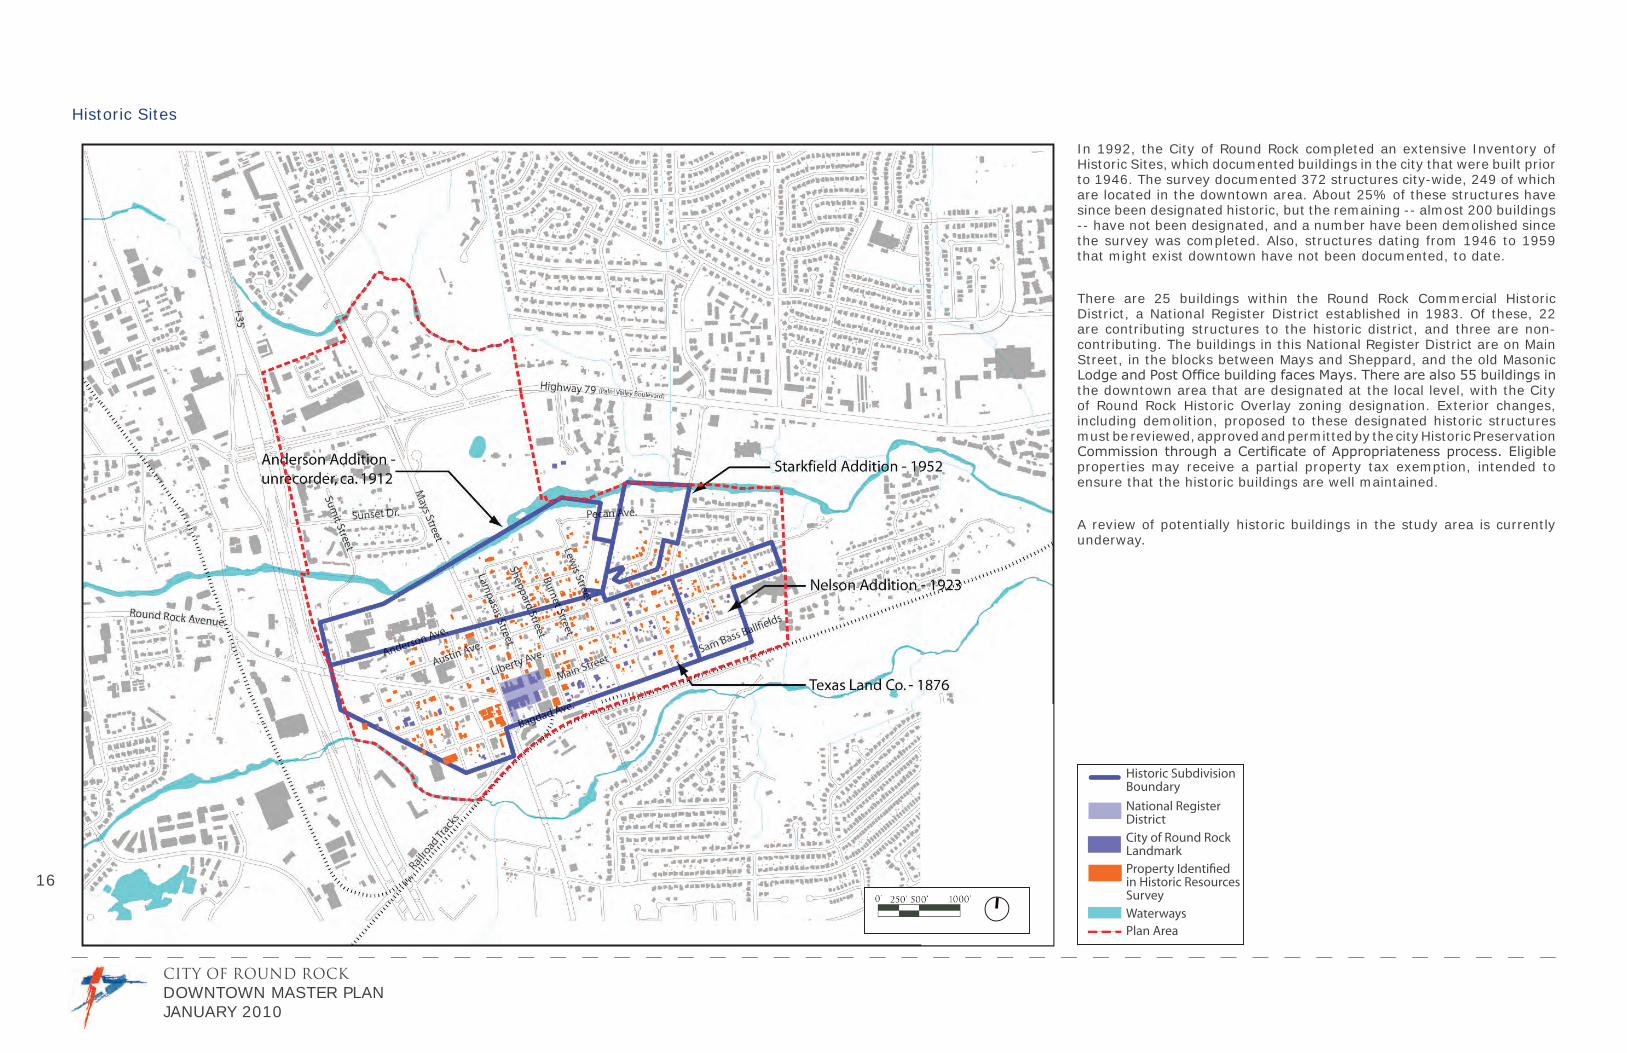
In 1992, the City of Round Rock completed an extensive Inventory of Historic Sites, which documented buildings in the city that were built prior to 1946. The survey docu mented 372 structures city-wide, 249 of which are located in the downtown area. About 25% of these structures have since been designated historic, but the remaining -- almost 200 buildings -- have not been designated, and a number have been demolished since the survey was completed. Also, structures dating from 1946 to 1959 that might exist downtown have not been documented, to date.
There are 25 buildings within the Round Rock Commercial Historic District, a National Register District established in 1983. Of these, 22 are contributing structures to the his toric district, and three are non-contributing. The buildings in this National Register District are on Main Street, in the blocks between Mays and Sheppard, and the old Masonic Lodge and Post Offi ce building faces Mays. There are also 55 buildings in the downtown area that are designated at the local level, with the City of Round Rock Historic Overlay zoning designation. Exterior changes, including demolition, proposed to these designated historic structures must be reviewed, approved and permitted by the city Historic Preservation Commission through a Certifi cate of Appropriateness process. Eligible properties may receive a partial property tax exemption, intended to ensure that the historic buildings are well maintained.
A review of potentially historic buildings in the study area is currently underway.
Historic Sites
Historic Subdivision Boundary
National Register District
City of Round Rock LandmarkProperty Identifi ed in Historic Resources Survey
WaterwaysPlan Area
CITY OF ROUND ROCKDOWNTOWN MASTER PLAN
JANUARY 2010
17
What is the historical character and how is it respected and enhanced?The Round Rock community values its historical resources. In the General Plan 2020 Survey conducted in 2008 by the city, 90% of respondents said that they agreed or strongly agreed that historic, older properties are a signifi cant benefi t to the city and 87% agreed or strongly agreed that the city should use ordinances and regulations to encourage historic preservation and maintenance. 79% of people disagreed or strongly disagreed with the idea of removing historic properties to redevelop sites with more profi table uses.
Although the area was known to native Americans for thousands of years before, the fi rst permanent settlement of Round Rock occurred in the late 1830s along Brushy Creek. A small community formed at the crossing of the Military Road at the creek, marked by a natural “round rock” formation in the creek bed.
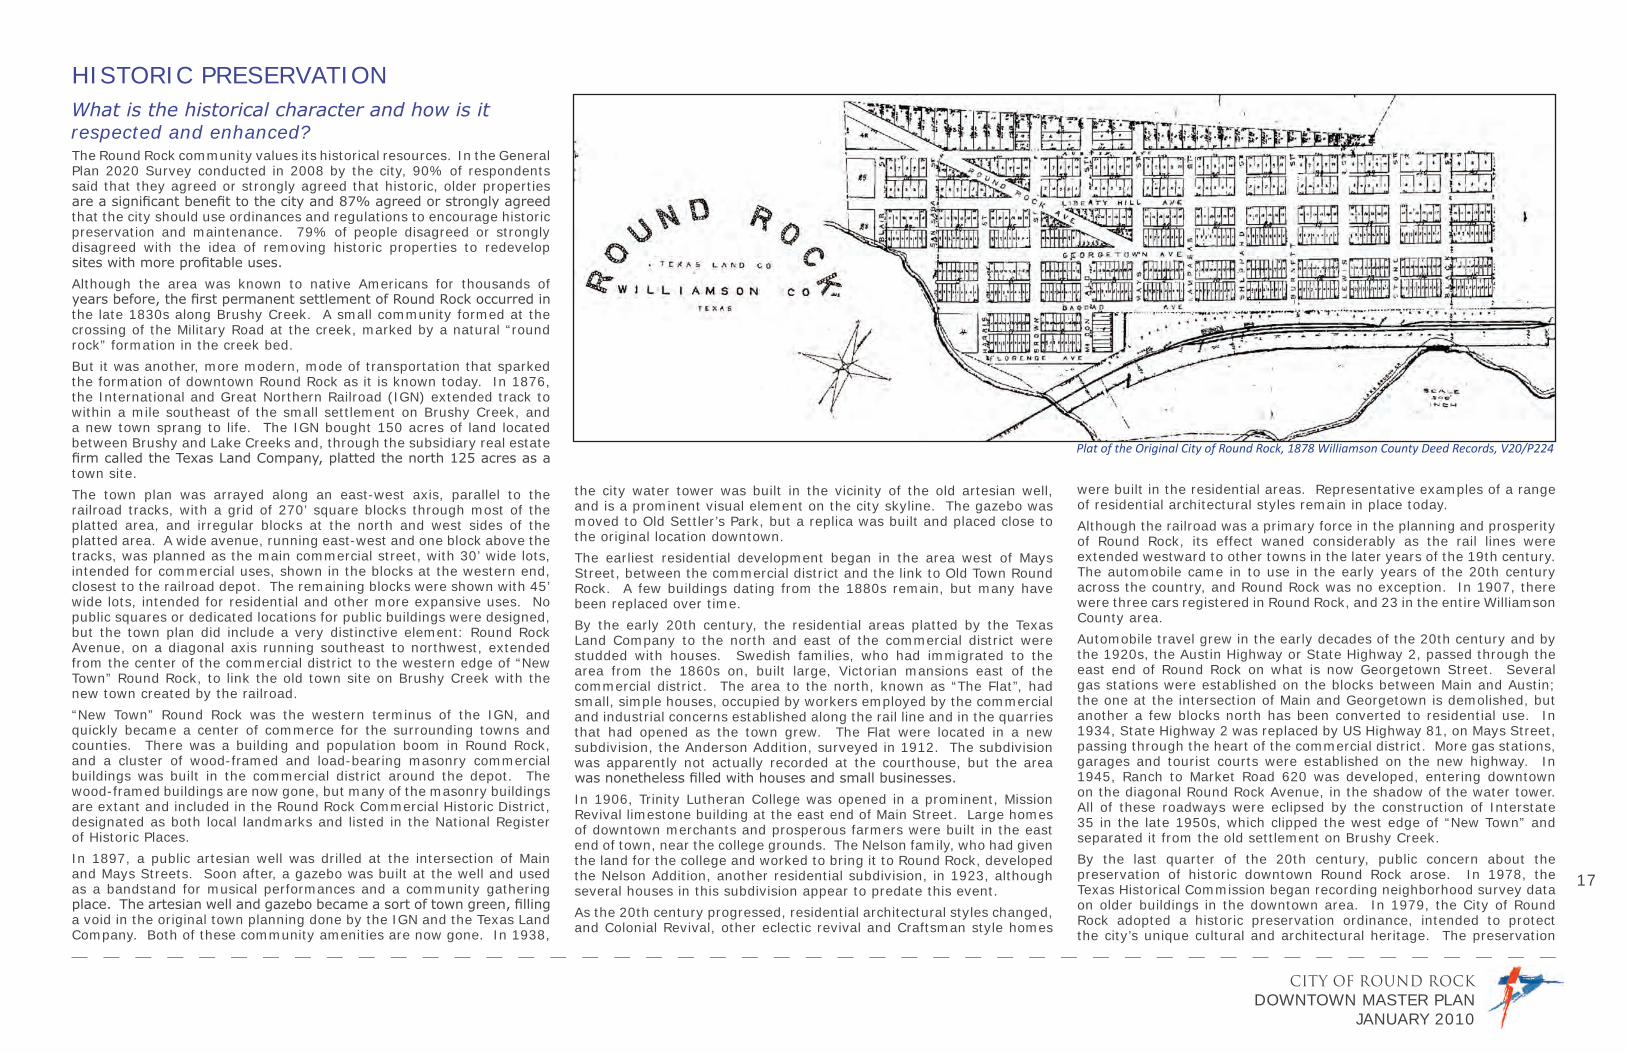
But it was another, more modern, mode of transportation that sparked the formation of downtown Round Rock as it is known today. In 1876, the International and Great Northern Railroad (IGN) extended track to within a mile southeast of the small settlement on Brushy Creek, and a new town sprang to life. The IGN bought 150 acres of land located between Brushy and Lake Creeks and, through the subsidiary real estate fi rm called the Texas Land Company, platted the north 125 acres as a town site.
The town plan was arrayed along an east-west axis, parallel to the railroad tracks, with a grid of 270’ square blocks through most of the platted area, and irregular blocks at the north and west sides of the platted area. A wide avenue, running east-west and one block above the tracks, was planned as the main commercial street, with 30’ wide lots, intended for commercial uses, shown in the blocks at the western end, closest to the railroad depot. The remaining blocks were shown with 45’ wide lots, intended for residential and other more expansive uses. No public squares or dedicated locations for public buildings were designed, but the town plan did include a very distinctive element: Round Rock Avenue, on a diagonal axis running southeast to northwest, extended from the center of the commercial district to the western edge of “New Town” Round Rock, to link the old town site on Brushy Creek with the new town created by the railroad.
“New Town” Round Rock was the western terminus of the IGN, and quickly became a center of commerce for the surrounding towns and counties. There was a building and population boom in Round Rock, and a cluster of wood-framed and load-bearing masonry commercial buildings was built in the commercial district around the depot. The wood-framed buildings are now gone, but many of the masonry buildings are extant and included in the Round Rock Commercial Historic District, designated as both local landmarks and listed in the National Register of Historic Places.
In 1897, a public artesian well was drilled at the intersection of Main and Mays Streets. Soon after, a gazebo was built at the well and used as a bandstand for musical performances and a community gathering place. The artesian well and gazebo became a sort of town green, fi lling a void in the original town planning done by the IGN and the Texas Land Company. Both of these community amenities are now gone. In 1938,
the city water tower was built in the vicinity of the old artesian well, and is a prominent visual element on the city skyline. The gazebo was moved to Old Settler’s Park, but a replica was built and placed close to the original location downtown.
The earliest residential development began in the area west of Mays Street, between the commercial district and the link to Old Town Round Rock. A few buildings dating from the 1880s remain, but many have been replaced over time.
By the early 20th century, the residential areas platted by the Texas Land Company to the north and east of the commercial district were studded with houses. Swedish families, who had immigrated to the area from the 1860s on, built large, Victorian mansions east of the commercial district. The area to the north, known as “The Flat”, had small, simple houses, occupied by workers employed by the commercial and industrial concerns established along the rail line and in the quarries that had opened as the town grew. The Flat were located in a new subdivision, the Anderson Addition, surveyed in 1912. The subdivision was apparently not actually recorded at the courthouse, but the area was nonetheless fi lled with houses and small businesses.
In 1906, Trinity Lutheran College was opened in a prominent, Mission Revival limestone building at the east end of Main Street. Large homes of downtown merchants and prosperous farmers were built in the east end of town, near the college grounds. The Nelson family, who had given the land for the college and worked to bring it to Round Rock, developed the Nelson Addition, another residential subdivision, in 1923, although several houses in this subdivision appear to predate this event.
As the 20th century progressed, residential architectural styles changed, and Colonial Revival, other eclectic revival and Craftsman style homes
Plat of the Original City of Round Rock, 1878 Williamson County Deed Records, V20/P224
were built in the residential areas. Representative examples of a range of residential architectural styles remain in place today.
Although the railroad was a primary force in the planning and prosperity of Round Rock, its effect waned considerably as the rail lines were extended westward to other towns in the later years of the 19th century. The automobile came in to use in the early years of the 20th century across the country, and Round Rock was no exception. In 1907, there were three cars registered in Round Rock, and 23 in the entire Williamson County area.
Automobile travel grew in the early decades of the 20th century and by the 1920s, the Austin Highway or State Highway 2, passed through the east end of Round Rock on what is now Georgetown Street. Several gas stations were established on the blocks between Main and Austin; the one at the intersection of Main and Georgetown is demolished, but another a few blocks north has been converted to residential use. In 1934, State Highway 2 was replaced by US Highway 81, on Mays Street, passing through the heart of the commercial district. More gas stations, garages and tourist courts were established on the new highway. In 1945, Ranch to Market Road 620 was developed, entering downtown on the diagonal Round Rock Avenue, in the shadow of the water tower. All of these roadways were eclipsed by the construction of Interstate 35 in the late 1950s, which clipped the west edge of “New Town” and separated it from the old settlement on Brushy Creek.
By the last quarter of the 20th century, public concern about the preservation of historic downtown Round Rock arose. In 1978, the Texas Historical Commission began recording neighborhood survey data on older buildings in the downtown area. In 1979, the City of Round Rock adopted a historic preservation ordinance, intended to protect the city’s unique cultural and architectural heritage. The preservation
HISTORIC PRESERVATION

CITY OF ROUND ROCKDOWNTOWN MASTER PLANJANUARY 2010
18
Downtown Round Rock, around 1920Image courtesy of City of Round Rock
Postcard view of Main Street, looking east, around 1908UTSA’s Insti tute of Texan Cultures, No.90-165
Main Street, looking west from Trinity College, around 1908UTSA’s Insti tute of Texan Cultures, No.097-0778
Adolph Engstrand House, 207 N. Stone Street, around 1907UTSA’s Insti tute of Texan Cultures, No.096-1366
ordinance added a Historic Overlay District zoning category to the city code and created the Historic Preservation Commission to administer the historic designation process. The zoning is applicable to both individual properties and groups of properties, or districts.
To ensure that designated historic structures are properly preserved, properties with the Historic Overlay District zoning must participate in the Certifi cate of Appropriateness review process. Exterior changes proposed to historic structures must be reviewed, approved and permitted by the Historic Preservation Commission. To encourage ongoing maintenance and care of historic properties, a partial property tax exemption program was added to the preservation program in 1988. Eligible properties receive a 75% exemption of the municipal property taxes, a benefi t that must be applied for each year.
In 1983, the Round Rock Commercial Historic District was listed on the National Register of Historic Places. The district is in the 100 and 200 blocks of East Main Street and includes 22 contributing and 3 non-contributing buildings. The buildings are one and two-story commercial structures, built during the last quarter of the 19th century and the early years of the 20th century. Masonry is the predominant building
material in the district, generally local limestone, sometimes dressed with handsome ornament. There are also examples of iron, sheet metal and brick masonry building fronts in the district.
In 1992, the City of Round Rock completed an extensive Inventory of Historic Sites, a cultural resources survey. The survey documented buildings within the city limits and the ETJ that were built prior to 1946. Each building documented in the survey was classifi ed as a high, medium or low priority ranking, based on the historical and cultural signifi cance and architectural integrity of the building. High and medium priority buildings were assessed as meeting National Register standards for contributing resources, potentially eligible for National Register listing as individual landmarks or as part of a larger neighborhood-based district. In cases where a medium or low priority rating was applied due to alterations made, completion of an appropriate restoration or rehabilitation project may justify re-prioritizing to a higher category. The survey documented 372 structures, two-thirds of which are located in the downtown area. Based on the survey fi ndings, all of the sites identifi ed as Priority 1 have been zoned historic. A few buildings documented in the survey have been demolished, including some identifi ed as Priority 1 structures.
In 1997, the City of Round Rock completed the fi nal portion of the inventory and cultural resources survey process by linking the 1992 survey data to the city Atlas Geographic Information System (GIS) database. The project was called the GIS Inventory of Historic Sites. Priority ranking, photographs, historical and architectural survey data and geographic location information for each of the 372 survey sites. Maps of portions of downtown, showing the locations of the buildings documented in the Historic Sites Inventory and their priority rating, were also prepared as part of this effort.
Design Guidelines for Historic Commercial and Residential Districts and Properties were adopted by the City Council. The document is a guide for property owners, civic appointees, and offi cials to assist in both the preservation of historic properties and the development of compatible infi ll or new construction adjacent to historic properties. The guidelines include general principles, consistent with the Secretary of the Interior’s Standards, to retain historic fabric whenever possible, replace in kind when necessary, and make compatible, reversible additions or exterior alterations. The guidelines are illustrated with diagrams and photographs and address both commercial and residential buildings and sites.
During the community design charrette, stakeholders offered suggestions, thoughts, and comments on the historic character of Round Rock. As cited previously, the community highly values the historic character of the city, and there was overwhelming support for preserving historic districts and buildings in the context of this Master Plan. Stakeholders representing the commercial district expressed an interest in maintaining a mix of uses to provide vitality, streetscape improvements to enhance appeal and access, and provision of parking within easy access. The notion of patio or outdoor dining was appealing, as were opportunities for community gatherings and events, provisions for galleries, exhibits, theatre, dance, and children’s activities downtown. Some expressed concern that things not be “frozen in time”, others offered specifi c suggestions to retain or add canopies to the commercial streetscape.
Stakeholders representing the residential district of downtown expressed an interest in preserving the historic context and visual character of the old neighborhoods, perhaps through a residential historic district. Commercial or offi ce uses in the transition zone between the commercial district and the residential district should retain the existing residential building type and scale, as opposed to demolishing existing buildings. They also expressed quality of life issues, including concerns about traffi c speeds through the neighborhoods, a need for crosswalks at the Georgetown and Main intersection, and improvements in sidewalks, and lighting in the neighborhoods. They expressed an interest in new amenities, including more park space, a corner grocery store, and live music and coffee venues downtown.
To date, the City of Round Rock has shown great foresight with regard to historic preservation issues. The preservation ordinance, inventory of historic sites, and preservation design guidelines are useful tools to inform this Master Plan process. The historic designations in place have effectively preserved the most signifi cant resources, but those sites identifi ed as Priority 2 and 3 should be reviewed, in the course of this plan, for possible inclusion in historic overlay districts.

CITY OF ROUND ROCKDOWNTOWN MASTER PLAN
JANUARY 2010
19
The following summarizes the fi ndings of the market analysis (March 2009). For the detailed study, see the Appendix.
IntroductionThe economic analysis by Economics Research Associates (ERA), informs design decisions incorporated into the Master Plan. The analysis looks at general demographic and real estate trends in the Round Rock area, and potential demand for retail, residential, and offi ce space in the downtown area.
Market Overview of the Austin RegionAccording to a recent overview by Wells Fargo Economics (June-July 2008), the national downturn is hitting the Austin region harder than other Texas metropolitan areas. The employment growth rate is slowing and unemployment is increasing, although the unemployment rate for the Metropolitan Statistical Area (MSA) remains relatively low. While median home prices have decreased in the region, the decline has not been as drastic as that experienced in other parts of the country.
The biggest risk to the regional housing market is the rate of infl ation. If interest rates are increased too aggressively by the Federal Reserve, it is anticipated that the housing market will remain fl at through 2009. It appears that housing permit issues are close to the bottom of the cycle in the housing market. As a further indication of the weak housing market, the months in inventory index for housing is expected to increase (the month in inventory index increased to 5.3 months in April, up from 3.1 months in early 2007).
Offi ce MarketRecently, slowing job growth and new empty buildings have contributed to an overall vacancy rate of 17.2% within the Austin-Round Rock offi ce market - the highest recorded vacancy rate since early 2005. As a result, some landlords are offering free rent and other incentives in order to attract tenants. Rents fell in the third quarter across all classes of offi ce space. An estimated 2.0 million square feet of new offi ce space is currently under construction as a result of more favorable job growth conditions forecast during the planning stages for the projects. Vacancy rates are expected to continue to increase across the region as the area absorbs the signifi cant amount of new offi ce space currently under construction.
The construction of regional toll roads such as State Highway 45 and the development of La Frontera, with over one million square feet of retail space, have helped to increase the viability of Round Rock as an attractive offi ce market.
As of third quarter 2008, the Round Rock submarket recorded a relatively high vacancy rate of 37.0% in 1.7 million square feet of space. The high vacancy rate is due in part to the signifi cant offi ce inventory which came on line during the third quarter in Round
•
•
•
•
•
Rock – 439,852 square feet of new space was added. As might be expected, overall Class A rent levels are currently relatively low in Round Rock - $26.78 per square foot/year versus $31.10 for the entire Austin regional market. An additional 270,000 square feet of offi ce space is listed as under construction within the Round Rock submarket.
While total jobs increased over the past year within the Austin-Round Rock MSA, the rate of job growth has declined and it is expected that offi ce leasing activity in the region will not rebound until there is a rebound in the local job market. The national credit crisis and uncertainty on Wall Street are further hampering the local offi ce market.
Projected offi ce demand in downtown Round Rock is based in part on forecast employment growth within the Austin-Round Rock MSA. Based on projections provided by TXP (an economic and policy consulting group based in Austin) in April of 2008, the strong appeal of the region for expansion by both residents and fi rms has allowed Austin to perform better than many other regions across the country.
We have estimated that new employment growth in the area between 2007 and 2023 (it is assumed that offi ce space recently built/under construction accounts for some of the recent employment growth) will generate offi ce space demand for 1.7 million square feet of new offi ce space in the area. Given just over 900,000 square feet of space which is vacant (newly constructed) or under construction, new offi ce space demand is likely satisfi ed for the next several years. Small-scale, niche offi ce space (live/work) may be a possibility in the downtown area for those tenants looking for non-traditional offi ce space. It is estimated that the downtown district could reasonably capture 8 to 10% of total offi ce market demand, or long term demand of approximately 73,000 to 91,000 square feet of new offi ce space.
Housing MarketBuilding permits issued in Williamson County refl ect the ongoing downturn, with a drop in permits issued of just over 50% from 2007 (through October) to 2008 (through October). The county also experienced a notable drop from 2006 to 2007 in total permits issued, with a year end decrease of about 24% reported.
Data through November of 2008, compared to the previous time frame one year ago, reveals that total certifi cates of occupancy issued within the city have decreased by 42%.
Total home sales in the Austin MSA are estimated to drop by about 15% from 2007 to 2008, with the average sales price decreasing only slightly to $244,900. Total listings have also reached a relatively high 11,806.
Housing market demand is based on projected population growth for the region (Austin-Round Rock MSA) and the downtown’s
•
•
•
•
•
•
•
relative fair share capture of new growth. The analysis also assumes that new downtown residential development will include a mix of housing types, potentially including attached ownership, rental, live-work, and mixed-use development (e.g. combining housing with offi ce and/or retail) units.
It is likely that new housing development will be restricted by available space for construction rather than market demand. Based on estimates, 207 new residential units are supportable between 2009 and 2013, 240 units between 2013 and 2018, and 257 new units between 2018 and 2023.
Retail MarketOccupancy rates for retail space range from 73 percent to 97 percent across all Austin-Round Rock MSA districts. In Round Rock, 91 percent of the retail space was occupied, leaving approximately 245,000 square feet vacant.
The top ten retail centers (in terms of size) located close to the City of Round Rock account for approximately 4.7 million square feet of retail – a signifi cant existing supply.
Due to the existing pedestrian environment, the 100 block of East Main Street is the primary opportunity and the 200 block is the secondary opportunity for retail improvements in downtown Round Rock. ERA recommends and supports urban planning initiatives to reconfi gure or enhance (from the pedestrian’s perspective) the intersection of Main and Mays Street.
ERA estimated the amount of square feet of retail in different usage categories to better understand the balance of retail to offi ce to consumer service in the downtown core (the area of downtown south of the creek). It should be noted that these estimates are not exact and are based on limited available building dimensions and current tenant listings. We have estimated that there is approximately 10,000 square feet of retail space and 25,000 square feet of restaurant/food oriented space, and 83,000 square feet of “other” (civic, offi ce, vacant) located in the downtown core area.
ERA assessed market demand for retail in downtown Round Rock. The retail demand analysis is based upon the identifi cation of potential key markets that will likely generate sales in downtown Round Rock (provided the right retail environment is present) and their purchasing power. People who live in the Round Rock area will be downtown’s major customers, however, it is important to differentiate residents based on their proximity to downtown. For this reason ERA defi ned Primary and Secondary Trade Areas from which downtown Round Rock could potentially draw customers.
Only a portion of household expenditures will occur in downtown Round Rock. This is largely dependent on the quality of the tenant mix as a whole and individual retailers, as well as market factors. Several variables impact market penetration including: (1) proximity to downtown Round Rock, (2) access to downtown,
•
•
•
•
•
•
•
MARKET ANALYSIS

CITY OF ROUND ROCKDOWNTOWN MASTER PLANJANUARY 2010
20
Hotel and Tourism MarketMost major chains already have a presence in the Round Rock area, refl ecting in part the population and employment growth that has occurred in the area over the past several years.
The only full-service hotel in the area, Marriott North, is located near Dell Headquarters. Other hotels in the area are primarily limited service, located along Interstate 35, the main access route through the region.
Currently, the Austin-Round Rock market offers a limited-service focused series of lodging options with price points and average daily rates (ADR’s) generally falling below $100 per day
Most of the hotel products are concentrated along Interstate 35 at the Round Rock exits. The exception is the full-service Marriott located near the Dell Headquarters offi ces just south of the Downtown Master Plan study area.
The greater Austin area follows the pattern in many Metropolitan Statistical Areas (MSA’s), with higher price levels and occupancies occurring in the Central Business Districts (CBD’s) and more budget prices properties locating in the outer areas. Round Rock falls within this price and performance range.
Visitation to the greater Austin market is strong and growing.
Tourism is predominantly leisure travel.
Business travel produced 36 percent of person-days to the Austin MSA.
The patterns of visitation to the Austin area indicate a strong drive-to orientation, with 72 percent of travelers arriving by automobile. Traffi c counts along Interstate 35 at Round Rock support this pattern, with an estimated 50,000 cars per day (or
•
•
•
•
•
•
•
•
•
ERA Project No.18054 Page 7
Figure 1: Area Hotel Occupancies
ERA also reviewed hotel trend indicators for the Round Rock area based on information provided
locally. As reflected below, occupancy for the 2nd quarter 2008 was down just over five percentage
points from 2nd quarter 2007, with the average daily room rate increasing from $93.92 to $95.86. It
is worth noting that performance in first and second quarter 2007 was relatively strong compared
to the previous two years. Total room revenues have continued to grow over the past few years,
although the effects of the economic downturn in late 2008-early 2009 may alter this pattern while
the national and regional economies recover. In general, Texas has not seen as deep a downturn as
have other states due to energy production and a diverse state economy. This suggests that there
could be an opportunity to provide another hotel product as part of the revitalization of downtown,
particularly if located with easy access off I-35 and proximity to the retail core. Also, a hotel
product that is somewhat differentiated in character, but still preserving a low to mid-level price
point could be competitive with the exclusively highway-oriented lodging properties.
Area hotel occupancies
ERA Project No.18054 Page 6
Hotel Supply Market Overview
There are currently 26,000 hotel rooms in the greater Austin market area, with 5,000 of these
located in Austin’s Central Business District (CBD); these rooms serve the Austin Convention Center,
the State Capitol complex, the downtown business community and sports events at the University
of Texas and other area schools. As seen below in Table 1, as classified based on service levels
provided by Smith Travel Research, a leading hospitality industry database, almost half (48
percent) of these Austin CBD rooms are high end properties, 32 percent are mid-price levels, and
20 percent are economy brands. In contrast, most of the room supply is in the limited service price
level.
Table 1: Current Hotel Supply
Current Market Performance
As seen below, the CBD performs favorably in comparison to the overall Austin area, and has for
some time. The Austin-Round Rock market performs favorably compared to the Texas market
overall. Over the last five years, the CBD has experienced an average occupancy of approximately
71 percent, with Austin overall averaging approximately 67 percent, and Texas at approximately 66
percent. The ADR over this same time period in the CBD has been $137, while Austin’s ADR is
around $104, and that of Texas overall is $93.
Nu
Percent of Market
High End ### 48%Mid-Level ### 32%Economy ### 20%
Total ### 100%Source: Smith Travel Research, Economics Research Associates, 2008.
Current hotel supply
ERA Project No.18054 Page 8
Table 2: Hotel Performance Trends, Round Rock
Round RockRoom Ave.
% Nights Daily Revenue Occupancy Sold Rate
20082nd Q $12,519,000 69.4% 130,600 $95.861st Q $12,045,000 72.1% 134,300 $89.69
20074th Q $10,772,000 66.8% 127,100 $84.753rd Q $11,890,000 70.3% 133,700 $88.932nd Q $13,186,000 74.6% 140,400 $93.921st Q $11,957,000 76.5% 142,500 $83.91
20064th Q $10,317,000 69.1% 131,600 $78.403rd Q $11,338,000 72.6% 138,100 $82.102nd Q $11,786,000 73.0% 137,400 $85.781st Q $9,570,000 69.9% 130,300 $73.45
20054th Q $8,362,000 63.8% 121,500 $68.823rd Q $8,827,000 63.7% 121,200 $72.832nd Q $9,419,000 68.0% 131,600 $71.571st Q $7,873,000 64.0% 122,600 $64.22Note: Average daily rate calculated as room revenue divided by rooms sold.
Based on sample of 20 hotels.
Source: City of Round Rock, Economics Research Associates
Current Supply
ERA examined the current hotel supply in the Round Rock area in order to better understand
potential candidate hotels for the study area. As reflected below, most major chains already have
a presence in the Round Rock area, reflecting in part the population and employment growth that
has occurred in the area over the past several years. The only full-service hotel in the area,
Marriott North, is located near Dell Headquarters. Other hotels in the area are primarily limited-
service (under 150 keys, more affordable ADR’s) products and are located along I-35, the main
access route through the region.
Hotel performance trends in Round Rock
ERA Project No.18054 Page 9
Table 3: Hotel Inventory, Round Rock
Property Total RoomsAust in Marriot t at Round Rock 295Best Western Executive Inn 70Candlewood Suites 98Comf ort Suites 63Count ry Inn and Suit es 61Courtyard by Marriott 113Days Inn and Suit es 49Extended St ay America North 138Hampton Inn-Aust in Round Rock 94Hil ton Garden Inn 122Holiday Inn Hot el & Suit es 91La Quint a Inn Nort h 116La Quint a Inn Sout h 86Residence Inn - Round Rock 96Round Rock Inn 60Springhil l Suites 104St aybridge Suit es 81Value Place 120Wingat e by Wyndham 100TOTAL 1,957 Source: Round Rock Convention & Visitors Bureau, Economics Research Associat es
The opportunity may exist for a newer concept, modern limited service hotel within the study
area. As examples of the types of hotel product that would complement the Master Plan
objectives, three relatively new lower price-point concept hotels are highlighted below. While the
current market offers financing challenges, it may be beneficial to discuss future long-term
expansion plans with desired operators. It should be noted that NYLO is a relatively new concept
with few existing locations, but one of the first was located near Dallas, indicating receptiveness to
Texas locations.
Hyatt Place
Hyatt Place is a relatively new updated concept by Hyatt Hotels; the concept includes spacious
modern guestrooms with complimentary Wi-Fi and a 42” flat panel HDTV that can be integrated
with laptops and MP3 players. The hotel also offers a 24-hour guest kitchen with made-to-order
meals and a complimentary continental breakfast. There are currently nineteen Hyatt Place hotels
in Texas, including two in Austin (at the Arboretum and at I-35 and Highway 290), so the company
is very familiar with the Round Rock area.
Hotel inventory in Round Rock
(3) market characteristics and typical expenditure patterns, (4) proximity to competitive offerings. ERA included an estimated range of potential captured expenditures.
We estimate that the downtown core (the downtown area south of the creek) could support between 107,000 and 145,000 square feet of active retail space, thereby creating a downtown destination core of retail space.
As a true main street in the midst of big-box centers, strip malls, and indoor malls, downtown Round Rock can offer a different product. The balance of retail types and sizes is critical to the overall success of a project. Furthermore, downtown Round Rock increases its successes for making deals if it does not compete with the mega shopping centers for their national chain oriented tenants.
Currently Round Rock has approximately 120,000 square feet of ground level street-oriented space in its downtown core (the downtown area south of the creek). ERA recommends that retail recruitment efforts take advantage of this space. Round Rock should fulfi ll retail demand by fi rst fi lling existing ground level space with retail before building more space.
•
•
•
about 18 million vehicles per year in both directions). Sixty-four percent of person-days were generated by travelers from 250 miles or less (one-way).
There are currently 26,000 hotel rooms in the greater Austin market area.
The Austin-Round Rock market performs favorably compared to the Texas market overall.
Round Rock’s hotel occupancy for the 2nd quarter 2008 was down just over fi ve percentage points from 2nd quarter 2007, with the average daily room rate increasing from $93.92 to $95.86.
•
•
•

CITY OF ROUND ROCKDOWNTOWN MASTER PLAN
JANUARY 2010
21
The following describes the existing conditions of circulation and traffi c in downtown, as included in the Traffi c Analysis, March 2009. For the detailed study, see Appendix.
IntroductionExisting conditions capacity analyses were conducted for AM and PM peak hours for various intersections using Synchro, software developed to automate procedures found in the Highway Capacity Manual. Results of the capacity analysis are reported in Level of Service (LOS) format, with the most favorable conditions designated as LOS A and the poorest conditions indicated by LOS F. Level of service is based on the amount of delay each vehicle encounters at the intersection.
Typically, for densely developed urban environments, LOS D or better in a typical peak hour is considered acceptable from the standpoint of motor vehicle mobility. The level of service criteria for signalized intersections, along with a brief description of the conditions experienced for each level of service grade, can be seen in Table 1 in the Appendix. The level of service criteria for non-signaled intersections can be seen in Table 2 in the Appendix.
Existing ConditionsIn order to look at the existing conditions of the circulation systems in downtown, the operational concerns and functionality gaps were identifi ed. Currently, there are numerous operational issues within the study area:
KEY INTERSECTIONS (See Key on right)
• Main / Round Rock / Mays. Signifi cant delays occur at this intersection. Overall, the intersection has LOS E during the peak hours with major approaches at LOS F. To provide for the heavy left turn demands, the signals are confi gured to serve only one direction at a time, which is referred to as “split phasing.” While an appropriate strategy for the existing confi guration of this intersection, it is one of the most ineffi cient methods of traffi c signal timing because intersection movements which do not confl ict can not be served simultaneously. From a walkability perspective, this intersection presents signifi cant challenges: crossing distances are relatively long; some of the existing curb ramps are not ADA compliant; the angled intersection of Round Rock Avenue causes pedestrians to look far over their shoulder to determine if approaching traffi c is yielding; and the relatively heavy eastbound to southbound right turns create challenges for pedestrians wishing to cross the street. Because of the heavy left turn demands along Mays, the inside through lanes function as de facto left turn lanes.
• Georgetown and Palm Valley Boulevard (Highway 79). The northbound and southbound approaches are split phased due to a lack of separate left turn lanes. While there are pedestrian signals, there are no curb ramps or crosswalks which results in signifi cant challenges for pedestrians to cross.
• Mays and Palm Valley Boulevard (Highway 79). There are no pedestrian signals, curb ramps or crosswalks at this intersection. Coupled with the dedicated right turn lanes and right turn slip ramps, this intersection is especially hazardous for use by pedestrians.
• Bagdad under Mays. The Bagdad underpass of Mays is not in compliance with currently accepted geometric design standards. Horizontal curves do not accommodate a large vehicle to turn and remain within its marked lane, and the vertical clearance does not accommodate fi re apparatus or other road-legal trucks. Pedestrian facilities are not ADA compliant and pass though an area where bat guano accumulations are notable. There is no roadway or pedestrian lighting. The stub connection of Bagdad to Mays just north of the bridge structure serves as a barrier to walkability along the Mays Street corridor.
KEY ROADS
• Mays from Brushy Creek bridge to Lake Creek bridge. Mays is the challenging street for the study area. At present, the north/south approaches to the intersection of Main Street/Round Rock and Mays are over-capacity during the peak hours, thus throughput along Mays is limited to the capacity of this signalized intersection. Other intersections have reserve capacity.
The sidewalks along this roadway are typically four feet wide and are not ADA compliant; some portions do not have sidewalks. Parking is prohibited and the inside lanes tend to function as de facto left turn lanes.
• Round Rock from Interstate 35 to Brown. While not specifi cally modeled, fi eld observations suggest the intersections along this street have reserve capacity.
• Main from San Saba to Brown. While not specifi cally modeled, fi eld observations suggest the intersections along this portion of the Round Rock/Main Street corridor are under-capacity.
• Main from Brown to Burnet. At present, the east/west approaches to the intersection of Main/Round Rock and Mays are over-capacity during the peak hours.
• Main from Burnet to Georgetown. At present, the intersections along this portion of Main Street are under-capacity.
• Georgetown from Main to Palm Valley Boulevard (Highway 79). Although Georgetown is a four lane roadway, the bridge crossing Brushy Creek is only two lanes wide. Sidewalks along the corridor are not contiguous. At present the street has reserve capacity.
• Liberty from Brown to Burnet. At present, the east/west approaches to the intersection of Liberty and Mays has reserve capacity during the peak hours.
• Palm Valley Boulevard (Highway 79) from Interstate 35 to Georgetown. This corridor provides critical regional connectivity to communities east of Round Rock. It also creates
KEY INTERSECTIONSMain / Round Rock / Mays Georgetown and Palm Valley Boulevard (Highway 79) Mays and Palm Valley Boulevard (Highway 79)Bagdad under Mays KEY ROADSMays from Brushy Creek bridge to Lake Creek bridge Round Rock from Interstate 35 to BrownMain from San Saba to Brown Main from Brown to Burnet Main from Burnet to Georgetown Georgetown from Main to Palm Valley Boulevard (Highway 79)Liberty from Brown to Burnet Palm Valley Boulevard (Highway 79) from Interstate 35 to Georgetown
1234
Key for existi ng circulati on conditi ons
32
41
TRAFFIC ANALYSIS
CITY OF ROUND ROCKDOWNTOWN MASTER PLANJANUARY 2010
22
a linear obstacle to walkability between the north and south sides of the corridor. According to various sources, a variety of future concepts for the corridor have been considered from a vehicular mobility standpoint:
• Grade-separated direct-connector ramps between US 79 and Interstate 35. This facility would be similar to the existing interchange between the Interstate and State Highway 45 toll road along the southern limits of Round Rock. Vertical clearance requirements would likely dictate elevated roadways along Palm Valley Boulevard (Highway 79) to some point east of Mays. There would likely be signifi cant right-of-way impacts in the vicinity ofPalm Valley Boulevard (Highway 79) and the Interstate. Walkability and enhanced redevelopment potential of adjacent properties are not supported by this option. This option is not included in regional modeling by Capitol Area Metropolitan Planning Organization (CAMPO) through 2030.
• Extension of Palm Valley Boulevard (Highway 79)westward to RM 620 . This concept would provide linkage between the two roadways and would eliminate the need to utilize Interstate 35 to travel between the two routes. The intersection of Palm Valley Boulevard (Highway 79) and Interstate 35 could be either at-grade or grade-separated. The alignment would travel along a portion of Sam Bass Road and cross Brushy Creek near the historic Chisholm Trial crossing. Concerns regarding historical and environmental impacts are anticipated to be associated with this concept. This option is not included in CAMPO’s regional modeling through 2030.
• Palm Valley Boulevard (Highway 79) elevated main lanes. Similar to the reconstructed portion of US 183 west of Interstate 35 in Austin, this concept would provide four or more lanes on an elevated structure and multi-lane frontage roads at grade for local access. This concept is supported by the grade-separated direct-connector ramps presented previously. This concept would likely require additional right-of-way along the length of the elevated portion of roadway. Walkability and enhanced development potential of adjacent properties are not supported by this option. This option is not included in CAMPO’s regional modeling through 2030.
• Widening of Palm Valley Boulevard (Highway 79) to provide additional lanes. Regional modeling by CAMPO for 2030 anticipates Palm Valley Boulevard (Highway 79) being widened from four lanes to six lanes. While providing no additional details, the concept is assumed to preserve at-grade signalized intersections. This option could be designed to remain within existing right-of-way. While the redevelopment potential of the adjacent properties remains unchanged, walkability is not improved by this option due to the additional width of roadway.