City of Port Lincoln Infrastructure & Asset Management Plan · City of Port Lincoln Infrastructure...
84
City of Port Lincoln Infrastructure & Asset Management Plan Document Control Version 1.0 Infrastructure & Asset Management Plan 2019 – 2028 Version: 1 Adopted by Council 18 June 2018 RM: FINAL201810 7.7.1.8 Infrastructure & Asset Management Plan 2020 – 2029 Adopted by Council 15 July 2019 RM: FINAL201942 7.7.1.8
Transcript of City of Port Lincoln Infrastructure & Asset Management Plan · City of Port Lincoln Infrastructure...

City of Port Lincoln Infrastructure & Asset Management Plan
Document Control Version 1.0
Infrastructure & Asset
Management Plan
2019 – 2028
Version: 1 Adopted by Council 18 June 2018 RM: FINAL201810 7.7.1.8
Infrastructure & Asset
Management Plan
2020 – 2029
Adopted by Council 15 July 2019 RM: FINAL201942 7.7.1.8

City of Port Lincoln
Infrastructure & Asset Management Plan Document Control Version 1.0
2 | P a g e
Version Control
Date References Council Resolution & Meeting Date
Author Comments
1 11 July 2019 7.7.1.8 CO19/142 15 July 2019 MCFS Adopted by Council

City of Port Lincoln
Infrastructure & Asset Management Plan Document Control Version 1.0
3 | P a g e
Table of Contents
1. EXECUTIVE SUMMARY ............................................................................................................................... 6
1.1. Overview ............................................................................................................................................ 6
1.1.1. Extent and value ........................................................................................................................ 6
1.2. Expenditure Summary ....................................................................................................................... 7
1.2.1. Capital Renewal Expenditure..................................................................................................... 7
1.2.2. Projected New/Upgrade Capital Expenditure ........................................................................... 8
1.3. Performance Measures ..................................................................................................................... 8
2. STRATEGIC INFRASTRUCTURE AND ASSET MANAGEMENT PLANNING .................................................... 9
2.1. Background ........................................................................................................................................ 9
2.2. Key stakeholders .............................................................................................................................. 11
2.3. Goals and Objectives of Infrastructure and Asset Management .................................................... 12
2.4. Integrated Strategic Management Planning ................................................................................... 13
2.4.1. Strategic Directions Plan Key Areas, Goals and Objectives ..................................................... 13
Goal 1: Economic Growth and Vitality ............................................................................................................ 13
Goal 2: LIVEABLE and ACTIVE COMMUNITIES ................................................................................................. 13
Goal 3: ACCOUNTABLE GOVERNANCE AND LEADERSHIP ............................................................................... 13
Goal 4: A CLEAN GREEN RESILIENT ENVIRONMENT ........................................................................................ 13
Goal 5: Sustainable Service Delivery and Productive Community Assets ....................................................... 13
2.5. Plan Framework ............................................................................................................................... 14
3. LEVELS OF SERVICE .................................................................................................................................. 15
3.1. Customer Research and Expectations ............................................................................................. 15
3.2. Current Levels of Service ................................................................................................................. 15
3.3. Desired Levels of Service ................................................................................................................. 16
4. Asset management STRATEGY ................................................................................................................ 17
4.1. Asset Condition ................................................................................................................................ 17
4.2. Asset Valuations .............................................................................................................................. 20
4.3. Asset Risk Management .................................................................................................................. 22
4.3.1. Council’s risk framework ......................................................................................................... 22
4.4. Maintenance Plan ............................................................................................................................ 23
4.5. Renewal/Replacement Plan ............................................................................................................ 23
4.5.1. Renewal Plan ........................................................................................................................... 24
4.5.2. Renewal standards .................................................................................................................. 24
4.5.3. Summary of future renewal expenditure ................................................................................ 24
4.6. Acquisition and Upgrades of Infrastructure and Assets .................................................................. 25
4.6.1. Selection criteria ...................................................................................................................... 25

City of Port Lincoln
Infrastructure & Asset Management Plan Document Control Version 1.0
4 | P a g e
4.6.2. Standards and specifications ................................................................................................... 25
4.7. Financial Summary .......................................................................................................................... 25
4.7.1. Sustainability of Service Delivery ............................................................................................. 25
4.7.2. Asset Sustainability Ratio ........................................................................................................ 26
4.8. Funding Strategy .............................................................................................................................. 26
4.9. Valuation Forecasts ......................................................................................................................... 27
4.10. Key Assumptions made in Financial Forecasts ............................................................................ 27
5. GLOSSARY ................................................................................................................................................ 28
6. ABREVIATIONS ......................................................................................................................................... 31
7. REFERENCES, STANDARDS & GUIDELINES ............................................................................................... 32
PART 1 BUILDINGS .......................................................................................................................................... 33
8. BUILDING ASSETS..................................................................................................................................... 34
8.1. Standard Service Levels ................................................................................................................... 35
8.2. Maintenance Expenditure ............................................................................................................... 36
8.3. Capital Projects and Forecasts ......................................................................................................... 37
PART 2 OTHER COMMUNITY ASSETS AND FILTRATION ................................................................................. 39
9. OTHER COMMUNITY ASSETS & FILTRATION ASSETS ............................................................................... 40
9.1. Standard Service Levels ................................................................................................................... 41
9.2. Maintenance Expenditure ............................................................................................................... 43
9.3. Capital Projects and Forecasts ......................................................................................................... 45
PART 3 ROADS AND BRIDGES ....................................................................................................................... 47
10. ROADS AND BRIDGES ASSETS .............................................................................................................. 48
10.1. Standard Service Levels ............................................................................................................... 49
10.2. Maintenance Expenditure - Roads .............................................................................................. 51
10.3. Capital Projects and Forecasts ..................................................................................................... 52
PART 4 KERBING AND FOOTPATHS ............................................................................................................... 54
11. FOOTPATHS & KERBING INFRASTRUCTURE ASSETS ............................................................................ 55
11.1. Standard Service Levels ............................................................................................................... 56
11.2. Maintenance Expenditure - Footpaths ........................................................................................ 57
11.3. Maintenance Expenditure - Kerbing ............................................................................................ 58
11.4. Capital Projects and Forecasts ..................................................................................................... 59
PART 5 STORMWATER .................................................................................................................................... 61
12. STORMWATER INFRASTRUCTURE ASSETS ........................................................................................... 62
12.1. Standard Service Levels ............................................................................................................... 63
12.2. Maintenance Expenditure ........................................................................................................... 65
12.3. Capital Projects and Forecasts ..................................................................................................... 66

City of Port Lincoln
Infrastructure & Asset Management Plan Document Control Version 1.0
5 | P a g e
PART 6 PLANT & EQUIPMENT ......................................................................................................................... 68
13. PLANT AND EQUIPMENT ASSETS ......................................................................................................... 69
13.1. Standard Service Levels ............................................................................................................... 70
13.2. Maintenance Expenditure ........................................................................................................... 71
13.1. Capital Projects and Forecasts ..................................................................................................... 72
PART 7 FURNITURE & FITTINGS ...................................................................................................................... 74
14. FURNITURE & FITTINGS ASSETS........................................................................................................... 75
14.1. Standard Service Levels ............................................................................................................... 76
14.1. Capital Projects and Forecasts ..................................................................................................... 78
APPENDIX A ..................................................................................................................................................... 80
INDEX ............................................................................................................................................................... 82

City of Port Lincoln
Infrastructure & Asset Management Plan Document Control Version 1.0
6 | P a g e
1. EXECUTIVE SUMMARY
1.1. Overview
The City of Port Lincoln owns and is responsible for the management, operation and maintenance of a diverse asset portfolio that provides services to all city users with a total replacement value of some $246 million. This Infrastructure and Asset Management Plan has been developed to ensure that Council continues to provide effective, comprehensive and sustainable management of its infrastructure and asset portfolios.
Council plans to operate and maintain its asset portfolio to achieve the following objectives: • Ensure the Council’s asset base contributes to the Strategic Direction Plan Goals and Objectives
by providing the required levels of service
• Ensure the Council’s assets are maintained at a financially sustainable, safe and functional standard
• Ensure that inspection and maintenance for all Council assets is sufficient to meet the legislative and operational requirements to deliver the required levels of service to the community.
The Infrastructure and Asset Management Plan is one of three plans that comprise Council’s Strategic Management Plans. The other two plans are the overarching Strategic Directions Plan and the Long Term Financial Plan. These plans are updated annually and integrated with the Annual Business Plan and Budget process. A comprehensive review of the Strategic Management Plans is required within two years of a general local government election and will be undertaken during the 2019/2020 financial year.
1.1.1. Extent and value
The City of Port Lincoln currently owns a significant and diverse portfolio of infrastructure and assets. The investment in creating and acquiring many of these assets has occurred over numerous previous generations, resulting in an infrastructure and asset base with a current value in excess of $246 million. The allocation of values to asset classes is indicated in the table below.
Note: those Infrastructure and Asset Classes marked with a * are not included in the Infrastructure and Asset Management Plan.

City of Port Lincoln
Infrastructure & Asset Management Plan Document Control Version 1.0
7 | P a g e
Table 1: Asset valuations by Asset Class as at 30 June 2018
IAMP Part Asset Class Value at 30 June 2018
Accumulated Depreciation at 30 June
2018 Written Down Value at
30 June 2018 1 Buildings $ 44,348,683 -$ 18,241,287 $ 26,107,396 2 Filtration (Recycled Water) $ 3,792,746 -$ 1,134,404 $ 2,658,342 2 Other community Assets $ 23,134,261 -$ 9,003,388 $ 14,130,873
3 Roads (Pavement & Surfaces) $ 36,318,816 -$ 11,456,048 $ 24,862,768
3 Bridges $ 5,189,845 -$ 233,117 $ 4,956,728 4 Kerbing $ 22,309,883 -$ 6,177,404 $ 16,132,479 4 Footpaths $ 13,755,012 -$ 2,133,354 $ 11,621,658 5 Stormwater $ 25,199,974 -$ 8,320,587 $ 16,879,387 6 Plant & Equipment $ 2,138,198 -$ 1,147,422 $ 990,776 7 Furniture & Fittings $ 1,717,541 -$ 1,029,930 $ 687,611 Library Books* $ 1,375,590 -$ 1,001,168 $ 374,422 Land* $ 63,595,394 $ - $ 63,595,394 RRC - Landfill Cell 4* $ 3,559,648 -$ 1,156,824 $ 2,402,824
$ 246,435,591 -$ 61,034,933 $ 185,400,658
1.2. Expenditure Summary
1.2.1. Capital Renewal Expenditure
Projected capital renewal expenditure is the amount required to maintain and renew assets to provide the present level of service over the next ten years, based on the evaluated ‘useful life’ estimate of asset classes (and also using ‘Road Surface Manager’ software forecast of required road re-seal forecasts for Road Surface).
Planned expenditure is the amount that is currently accommodated in Council’s Long Term Financial Plan, 2020-2029 to renew assets.
The Long Term Financial Plan 2020-2029 is aligned to the IAMP 2020-2029, resulting in no disparity between Projected and Planned Capital Renewal across all asset classes over the next ten years.
Table 2: Ten Year Projected Capital Renewal Expenditure vs. Planned Capital Renewal Expenditure
Asset Classes Projected Capital
Renewal Expenditure $,000
Planned Capital Renewal Expenditure included in LTFP
$,000
Shortfall/Surplus Projected
$,000 Buildings 7,024 7,024 0
OCA and Filtration 4,232 4,232 0
Roads and Bridges 5,512 5,512 0
Footpaths/Kerbing 301 301 0

City of Port Lincoln
Infrastructure & Asset Management Plan Document Control Version 1.0
8 | P a g e
1.2.2. Projected New/Upgrade Capital Expenditure
During the 2019/20 financial year, Council will be undertaking an extensive review of its Strategic Plan including its relationship with the Infrastructure and Asset Management Plan and the Long Term Financial Plan.
As the strategic direction of the current Council is yet to be set, this Infrastructure and Asset Management Plan does not include projected new and upgraded assets. This is based on the presumption that services levels will remain unchanged for the period covered in the IAMP.
Council’s process of reviewing the strategic direction of the city into the future will determine the key priorities for the next five years and to a lesser extent 10 years.
1.3. Performance Measures
The effectiveness of the Infrastructure and Asset Management Plan can be measured in the following ways:
• The degree to which the required cashflows identified in this Infrastructure and Asset Management Plan are incorporated into Council’s Long Term Financial Plan and aligned to the Strategic Directions Plan; and
• The degree to which 1-5 year detailed works programs, budgets, business plans and organisational structures take into account the ‘global’ works program trends provided by the Infrastructure and Asset Management Plan.
• The measure of performance of assets will be included as part of the strategic review to be undertaken in 2019/20, with performance measures being directly linked to defined service levels.
Stormwater 362 362 0 Total 17,431 17,431 0
Plant & Equipment 1,941 1,941 0 Furniture & Fittings 1,552 1,552 0
Total (including P&E) 20,924 20,924 0

City of Port Lincoln
Infrastructure & Asset Management Plan Document Control Version 1.0
9 | P a g e
2. STRATEGIC INFRASTRUCTURE AND ASSET MANAGEMENT PLANNING 2.1. Background
The purpose of this Infrastructure and Asset Management Plan is to demonstrate responsive management of assets (and services provided implicitly from assets) in compliance with regulatory requirements, and to communicate funding required to provide and maintain the required levels of service.
The Infrastructure and Asset Management Plan is to be read with the following associated planning documents:
• City of Port Lincoln Strategic Directions Plan 2016-2026 “Strategic Actions.”
• City of Port Lincoln Long Term Financial Plan 2020-2029.
• City of Port Lincoln Asset Management Policy Document 7.63.10.
.

City of Port Lincoln
Infrastructure & Asset Management Plan Document Control Version 1.0
10 | P a g e
This Infrastructure and Asset Management Plan covers the following types of assets:
Table 3: Type of Assets covered by this Plan BUILDINGS: OTHER COMMUNITY ASSETS: Building fitout BBQ facilities Building – structure Bike tracks Building – services Boat ramps Building – Roofing Bus shelter Shed Carparks Toilets Hockey Water tanks Irrigation Jetty BRIDGES: Lighting structure Bridge Monument Footbridge Netball courts Oval FILTRATION: Playground Irrigation systems Shelter Pipework Signage Pump Sporting – miscellaneous Shedding Street furniture Water tank Tennis court Trail KERBING: Kerbing and guttering STORMWATER: Drainage ROADS: Junction box Road base Lighting structures Road surface Pump shed Unsealed roads
FURNITURE & FITTINGS: PLANT & EQUIPMENT: IT Equipment Heavy Machinery Photocopiers Minor Machinery Audio Visual Equipment Utilities Major Furniture
* NOTES:
1. Other Community Assets
This class includes community assets that are not defined within the other classes of assets such as retaining and revetment walls, paving along Tasman Terrace, trails, swimming enclosure, electrical works, CCTV Cameras and decking on the foreshore.
2. Ovals
The oval represented within this report is Ravendale as it is on land that is owned by Council. Other ovals (Centenary, Poole, Kirton) are located on Crown Land and do not come within the scope of this Asset Management Plan.
3. Land under roads is not recognised for accounting purposes and is therefore not included in this Plan.

City of Port Lincoln Infrastructure & Asset Management Plan
Document Control Version 1.0
11 | P a g e
\\coplccfp01\data$\nap\manager corporate & financial services\reports as requested\draft plans\7.7.1.8 final201942 infrastructure & asset management plan 2020_2029.docx
2.2. Key stakeholders
Stakeholders include any person, agency, body or group that have any interest or that are affected by the infrastructure and assets owned by Council.
Stakeholder Reference Definition Details
Residents All people resident within the local government area Businesses All businesses located within the local government area and any
businesses undertaking business within the district from time to time Ratepayers All individuals, businesses or agencies required to pay rates Property owners All owners of property including residential, commercial, rural or
industrial Community groups All community organisations within the City including clubs, special
purpose or interest groups, forum and working parties Visitors and Tourists Any short or long term visitor to the area Other government agencies and tiers of government
Any government department or agency that is a customer of Council or requires specific information or outputs from Council
Other agencies and community groups
Any other group or agency that is a customer of Council or requires specific information or outputs from Council
Specific stakeholders for the current infrastructure and asset portfolio include: Stakeholder Reference Definition details
City of Port Lincoln The legal owner and custodian of the assets Elected Members of Council The Elected Members have a stewardship responsibility for the care and
control of the assets Operations Manager and Manager Community Infrastructure
Responsible for development and implementation of the capital works program and maintenance programs Assists with the delivery and maintenance of building, recreation and other community assets
External Stakeholders Council recognises there are many varied external stakeholders. These include but are not limited to:
• EPLGA and LGA • EPNRM Board • Sporting Communities of interest
• General Community Groups • Government departments and agencies - Department of
Planning, Transport & Infrastructure, Environment Protection Authority (EPA), South Australia Fire and Emergency Commission, Department for Water, Environment and Natural Resources
• Regional Development Australia Whyalla and Eyre Peninsula • Small business operators (such as personal trainers, dog
trainers etc.) who are licensed to use some of Council’s recreation assets in the course of their business
Ratepayers Council recognises that Ratepayers are a stakeholder as primary users of the buildings, recreation and other community assets portfolio.

City of Port Lincoln
Infrastructure & Asset Management Plan Document Control Version 1.0
12 | P a g e
\\coplccfp01\data$\nap\manager corporate & financial services\reports as requested\draft plans\7.7.1.8 final201942 infrastructure & asset management plan 2020_2029.docx
2.3. Goals and Objectives of Infrastructure and Asset Management
Council exists to provide services to its community. Many of these services are supported by the provision of infrastructure, (roads, bridges, stormwater etc.) and assets (buildings, recreational facilities and other community assets). Council has acquired these community assets by ‘purchase’ – by contract, construction by Council staff and by transfer of assets constructed by developers.
Council’s goal in managing infrastructure and assets is to
“meet the planned levels of service in the most cost effective manner for
present and future consumers”.
Council plans to operate and maintain its asset portfolio to achieve the following objectives: • Ensure the Council’s asset base contributes to the Strategic Direction Plan Goals and
Objectives by providing the required levels of service
• Ensure the Council’s assets are maintained at a financially sustainable, safe and functional standard
• Ensure that inspection and maintenance for all Council assets is sufficient to meet the legislative and operational requirements in order to deliver the required levels of service to the community.
To achieve the Goal and Objectives Council will: • Take a whole of life cycle approach
• Develop cost-effective management strategies for the long term
• Provide and managing defined levels of service and monitoring of asset management performance
• Understand and meet the demands of growth through demand management and infrastructure investment
• Manage risks associated with asset failures
• Use physical resources sustainably
• Guide sustainable long term financial planning for future management of existing and planned assets
• Continually improve asset management practices
• Provide safe open spaces to meet community needs.

City of Port Lincoln
Infrastructure & Asset Management Plan Document Control Version 1.0
13 | P a g e
\\coplccfp01\data$\nap\manager corporate & financial services\reports as requested\draft plans\7.7.1.8 final201942 infrastructure & asset management plan 2020_2029.docx
2.4. Integrated Strategic Management Planning
Strategic Management Planning is vital for Council to ensure it remains financially sustainable into the future. The success of these planning processes is dependent upon clear and consistent strategically based direction by management and the elected Council. Integrated Strategic Management Planning, including the Infrastructure and Asset Management Plan, that inform Council’s financial budgets and Long Term Financial Plans (LTFP), gives the community and ratepayers confidence that decision-making is based on a clear pathway to achieving Council’s community vision.
This Infrastructure and Asset Management Plan is prepared under the direction of Council’s Vision, Goals and Objectives as set out in the document Strategic Directions Plan 2016-2026 and the Sustainable Projects Delivery Plan 2018- 2027.
Council’s Vision, which informs and guides all aspects of the Council’s work through the Strategic Directions Plan’s Goals, Objectives and Strategic Actions as set out in the Strategic Directions Plan 2016-2026 is:
‘A progressive, vibrant and safe coastal city that is an attractive place in which to live, work & grow”
2.4.1. Strategic Directions Plan Key Areas, Goals and Objectives
The Key Areas and Goals, identified within Council’s Strategic Directions Plan are as follows:
GOAL 1: ECONOMIC GROWTH AND VITALITY
A dynamic local economy that is sustainable and supported to respond to opportunities and attract new investment.
GOAL 2: LIVEABLE AND ACTIVE COMMUNITIES
A community supported to be healthy, active and involved.
GOAL 3: ACCOUNTABLE GOVERNANCE AND LEADERSHIP
Council values effective community advocacy and partnerships.
GOAL 4: A CLEAN GREEN RESILIENT ENVIRONMENT
An environment managed now and into the future.
GOAL 5: SUSTAINABLE SERVICE DELIVERY AND PRODUCTIVE COMMUNITY ASSETS
A customer focused, equitable and sustainable services to the community

City of Port Lincoln
Infrastructure & Asset Management Plan Document Control Version 1.0
14 | P a g e
\\coplccfp01\data$\nap\manager corporate & financial services\reports as requested\draft plans\7.7.1.8 final201942 infrastructure & asset management plan 2020_2029.docx
2.5. Plan Framework
Key elements of this Infrastructure and Asset Management Plan are: • Levels of service – specifies the services and levels of service to be provided by Council
• Future demand – how this will impact on future service delivery and how this is to be met
• Life cycle management – how Council will manage its existing and future assets to provide the required services
• Financial summary – what funds are required to provide the required services
• Asset management practices
• Monitoring – how the plan will be monitored to ensure it is meeting Council’s objectives
City of Port Lincoln
Infrastructure & Asset Management Plan Document Control Version 1.0
15 | P a g e
\\coplccfp01\data$\nap\manager corporate & financial services\reports as requested\draft plans\7.7.1.8 final201942 infrastructure & asset management plan 2020_2029.docx
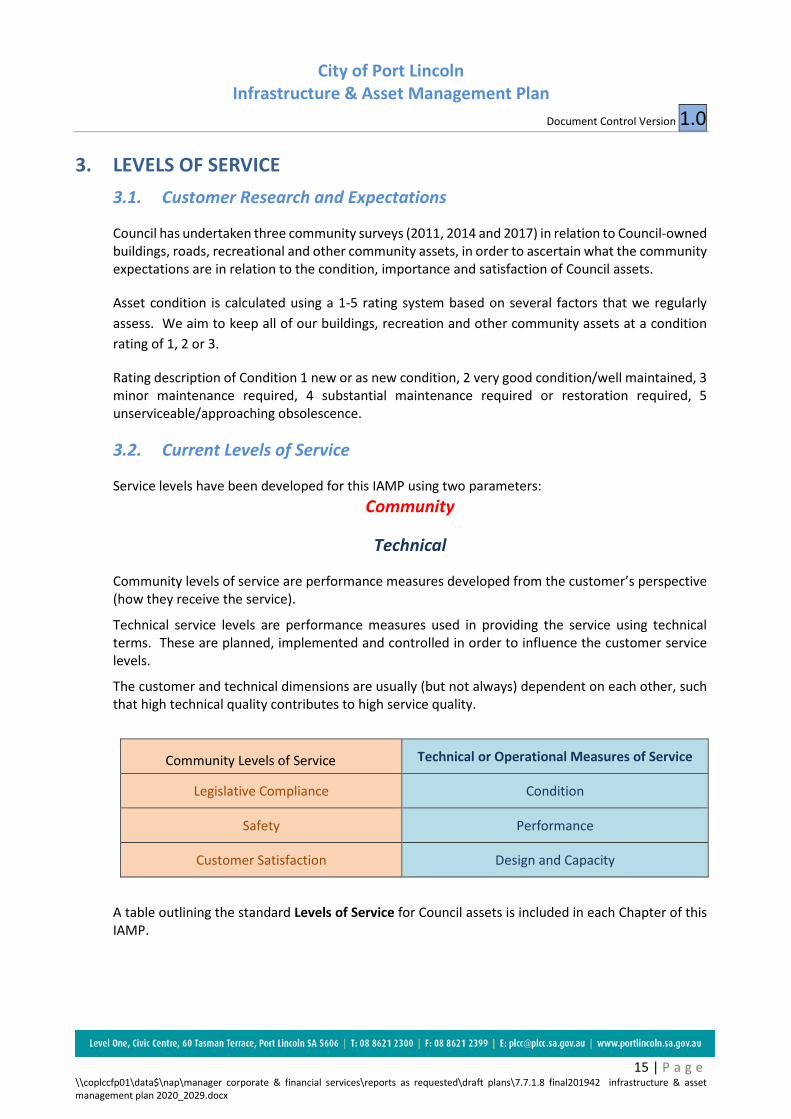
3. LEVELS OF SERVICE 3.1. Customer Research and Expectations
Council has undertaken three community surveys (2011, 2014 and 2017) in relation to Council-owned buildings, roads, recreational and other community assets, in order to ascertain what the community expectations are in relation to the condition, importance and satisfaction of Council assets.
Asset condition is calculated using a 1-5 rating system based on several factors that we regularly assess. We aim to keep all of our buildings, recreation and other community assets at a condition rating of 1, 2 or 3.
Rating description of Condition 1 new or as new condition, 2 very good condition/well maintained, 3 minor maintenance required, 4 substantial maintenance required or restoration required, 5 unserviceable/approaching obsolescence.
3.2. Current Levels of Service
Service levels have been developed for this IAMP using two parameters: Community
Technical
Community levels of service are performance measures developed from the customer’s perspective (how they receive the service).
Technical service levels are performance measures used in providing the service using technical terms. These are planned, implemented and controlled in order to influence the customer service levels.
The customer and technical dimensions are usually (but not always) dependent on each other, such that high technical quality contributes to high service quality.
Community Levels of Service Technical or Operational Measures of Service
Legislative Compliance Condition
Safety Performance
Customer Satisfaction Design and Capacity
A table outlining the standard Levels of Service for Council assets is included in each Chapter of this IAMP.

City of Port Lincoln
Infrastructure & Asset Management Plan Document Control Version 1.0
16 | P a g e
\\coplccfp01\data$\nap\manager corporate & financial services\reports as requested\draft plans\7.7.1.8 final201942 infrastructure & asset management plan 2020_2029.docx
3.3. Desired Levels of Service
Indications of desired levels of service are obtained from various sources including the City of Port Lincoln Community surveys undertaken in 2011, 2014 and 2017, public consultation relating to specific projects, residents’ feedback to Elected Members and Council employees, service requests and correspondence. Council has also adopted the Service and Program Reviews Policy 18.63.7.

City of Port Lincoln
Infrastructure & Asset Management Plan Document Control Version 1.0
17 | P a g e
\\coplccfp01\data$\nap\manager corporate & financial services\reports as requested\draft plans\7.7.1.8 final201942 infrastructure & asset management plan 2020_2029.docx
4. ASSET MANAGEMENT STRATEGY
The following section details how Council proposes to manage and operate the assets at the planned levels of service while optimising life cycle costs.
4.1. Asset Condition
Asset Condition is a measure of the health of an asset and is a key parameter in determining remaining useful life and predicting when an asset needs to be repaired or renewed. Condition rating is also an indicator of how well the asset is able to perform its function.
Measuring, recording and understanding asset condition is a key to successful Asset Management and good Asset Management Practice.
There are many factors that affect an asset’s condition:
• Age
• Environment
• Maintenance history
• How well it is treated by the community
• How much use it gets
It is important to regularly assess asset condition to identify those assets that are not performing satisfactorily and the reasons why; to help predict when an asset will reach the end of its useful life; to determine what remedial works need to be performed to return an asset to satisfactory condition; and to gather information to predict potential future asset failures.
Asset condition is calculated using a 1 – 5 rating system. The condition rating is based on remaining useful life and condition as a measurement. To reduce the requirement for regular capital upgrades, Council aims to maintain its building, recreation and other community assets to a condition rating of 1, 2 or 3 through long term planning and proactive maintenance.
Table 4: Condition Rate Scale
Rating Description of Condition
1 New or as new condition
2 Very good condition / well maintained / minor deterioration
3 Minor maintenance required / Fair condition
4 Substantial maintenance or restoration required / Poor condition
5 Unserviceable / approaching obsolescence / Replace or renew. Also reflects assets which are approaching technical, functional, style or legal obsolescence.

City of Port Lincoln
Infrastructure & Asset Management Plan Document Control Version 1.0
18 | P a g e
\\coplccfp01\data$\nap\manager corporate & financial services\reports as requested\draft plans\7.7.1.8 final201942 infrastructure & asset management plan 2020_2029.docx
The condition of most assets will deteriorate over time, with a corresponding reduction in the level of service that they provide to the community. The timing of planned renewal works to any asset to return it to a satisfactory condition depends on the acceptable level of risk, serviceability and community expectations.
Some assets, although they remain serviceable and are in reasonably good physical condition, may be outdated from an economic development or tourism perspective, and therefore the desired service level may cause the asset to be prioritised for renewal earlier than the useful life or the condition may warrant.
The condition assessment of Council’s Roads and Footpaths assets and Stormwater assets for this Plan are based on the condition rating as reflected in the Conquest Asset Register. The condition assessment of Council’s building, recreation and Other Community Assets for this Plan are based on the Residual Life / Estimated Useful Life remaining as reflected in the Synergysoft Asset Register.
The following table provides a breakdown of the condition of Council’s road seals, building, and recreation assets by category.
Condition rating in this manner is not shown in this IAMP for the following asset groups:
• Bridges
• Historic Buildings
• Water Reuse system
• Stormwater Infrastructure
• Road Bases
• Kerbing
• Other – Other Community Assets
City of Port Lincoln
Infrastructure & Asset Management Plan Document Control Version 1.0
19 | P a g e
\\coplccfp01\data$\nap\manager corporate & financial services\reports as requested\draft plans\7.7.1.8 final201942 infrastructure & asset management plan 2020_2029.docx
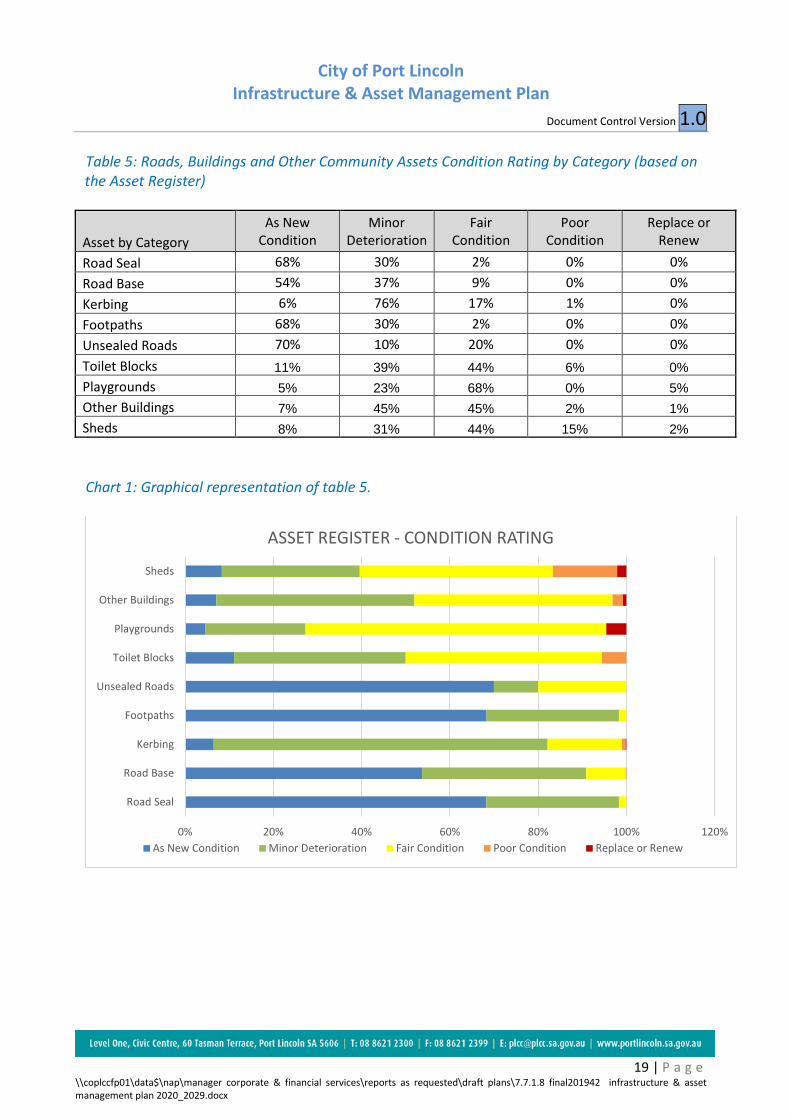
Table 5: Roads, Buildings and Other Community Assets Condition Rating by Category (based on the Asset Register)
Asset by Category As New
Condition Minor
Deterioration Fair
Condition Poor
Condition Replace or
Renew Road Seal 68% 30% 2% 0% 0% Road Base 54% 37% 9% 0% 0% Kerbing 6% 76% 17% 1% 0% Footpaths 68% 30% 2% 0% 0% Unsealed Roads 70% 10% 20% 0% 0% Toilet Blocks 11% 39% 44% 6% 0% Playgrounds 5% 23% 68% 0% 5% Other Buildings 7% 45% 45% 2% 1% Sheds 8% 31% 44% 15% 2% Chart 1: Graphical representation of table 5.
0% 20% 40% 60% 80% 100% 120%
Road Seal
Road Base
Kerbing
Footpaths
Unsealed Roads
Toilet Blocks
Playgrounds
Other Buildings
Sheds
ASSET REGISTER - CONDITION RATING
As New Condition Minor Deterioration Fair Condition Poor Condition Replace or Renew

City of Port Lincoln
Infrastructure & Asset Management Plan Document Control Version 1.0
20 | P a g e
\\coplccfp01\data$\nap\manager corporate & financial services\reports as requested\draft plans\7.7.1.8 final201942 infrastructure & asset management plan 2020_2029.docx
4.2. Asset Valuations
Land, Buildings, Other Community Assets and Filtration classes of assets were re-valued by Liquid Pacific as at 1 July 2014 and are planned to be re-valued effective 1 July 2019. Roads, Kerbing and Footpaths were re-valued by Tonkin Consulting as at 1 July 2017. Stormwater assets were re-valued by Tonkin Consulting as at 1 July 2016. Furniture & Fittings, Plant & Equipment and Library Books are valued under the cost model and therefore are not required to be revalued. The value of assets as at 30 June 2018 covered by this Asset Management Plan is summarised below which is an extract from Council’s Annual Financial Statements 2017-18 (Note 7).
Council’s 2019/20 Annual Business Plan includes an allocation for the revaluation of Council’s land, buildings, other community assets and filtration classes during the year. These revaluations are to be effective 1 July 2019.

City of Port Lincoln Infrastructure & Asset Management Plan
Document Control Version 1.0
21 | P a g e
\\coplccfp01\data$\nap\manager corporate & financial services\reports as requested\draft plans\7.7.1.8 final201942 infrastructure & asset management plan 2020_2029.docx
Table 6: Asset Register Values for Assets and Infrastructure, 2018

City of Port Lincoln Infrastructure & Asset Management Plan
Document Control Version 1.0
22 | P a g e
4.3. Asset Risk Management
4.3.1. Council’s risk framework
Principles used in association with managing assets and determining service levels and future upgrades.
Risk has been considered in the context of the Infrastructure and Asset Management Plan for the following reasons:
• To target maintenance plans, capital plans and investigations
• To enable condition assessment to be focused on the critical mode of failure
• To recognise the reduction or avoidance of risk needs as a benefit when making
decisions
• To balance the cost of actions to reduce risk against benefits achieved.
A risk is defined as:
• any threat that can potentially prevent us from meeting our objectives
• any opportunity that is not being maximised to meet our objectives.
Council is developing an Enterprise Risk Management Implementation Program as per the Annual Business Plan. This will develop a risk strategy for Council that will integrate with ongoing asset management.

City of Port Lincoln
Infrastructure & Asset Management Plan Document Control Version 1.0
23 | P a g e
4.4. Maintenance Plan
Routine maintenance is the regular on-going work that is necessary to keep assets operating, including instances where portions of the asset fail and need immediate repair to make the asset operational again. Maintenance includes all actions necessary for retaining an asset as near as practicable to an appropriate service condition.
Council owned Buildings, Recreation and other Community Assets that are leased to third parties include a provision that the occupant is responsible for ongoing maintenance.
Maintenance includes reactive, planned and cyclic maintenance work activities.
Reactive Is unplanned repair work carried out in response to service requests and
management/supervisory directions
Planned Is repair work that is identified and managed through a maintenance program. Maintenance activities include inspection, assessing the condition against failure/breakdown experience, prioritising, scheduling, actioning the work and reporting what was done to develop a maintenance history and improve maintenance and service delivery performance
Cyclic Is replacement of higher value components/sub-components of assets that is undertaken on a regular cycle including repainting, building roof replacement, etc. This work generally falls below the capital/maintenance threshold
Maintenance expenditure levels are considered to be adequate to meet Council’s planned service levels. Assessment and prioritisation of reactive maintenance is undertaken by qualified and experienced Council staff based on the asset’s service level standards.
Cost estimates for Maintenance are shown for the group of assets in each Part.
Deferred maintenance, i.e. works that are identified for maintenance and unable to be funded are to be included in the risk assessment process.
Maintenance is funded from Council’s operating budget.
4.5. Renewal/Replacement Plan
Renewal expenditure is major work which does not increase the asset’s design capacity but restores, rehabilitates, replaces or renews an existing asset to its original service potential. Work over and above restoring an asset to original service potential is defined as upgrade/expansion or new works expenditure and should be considered, funded and reported separately from renewal works.

City of Port Lincoln
Infrastructure & Asset Management Plan Document Control Version 1.0
24 | P a g e
4.5.1. Renewal Plan
The asset renewal works program is fundamentally formed by the Asset Management Plan Projected Capital Renewal Works Program, which is then refined and prioritised based on community feedback and staff assessment. Renewal projects are prioritised having regard to available funds and considered in Council’s strategic planning and Annual Business Plan and budget preparations.
The required level of expenditure for groups of Assets will vary from year to year and will reflect:
• Age of assets
• Condition of assets
• Ongoing maintenance requirements and economic viability of continuing to maintain the asset(s)
• Risk of failure and probable loss or damage as a result of inaction
• Potential alignment to the renewal or upgrade of other assets in the same location.
4.5.2. Renewal standards
All materials used in the maintenance and repair of buildings, recreation and other community assets will comply with relevant standards, legislation and guidelines. All maintenance and work will be carried out in accordance with the applicable Australian Standards, Building Codes and Work Health and Safety legislation, regulation and guidance notes.
4.5.3. Summary of future renewal expenditure
Projected capital renewal expenditures are based on Remaining Useful Life as of 30 June 2018 and all costs are shown in present dollar values. Remaining useful life of Building, Recreation and Other Community Assets was assessed during the revaluations undertaken by Liquid Pacific in July 2014 and is determined according to asset condition. Remaining useful life of Roads, Footpaths, Kerbing and Stormwater Assets was assessed during the revaluations undertaken by Tonkin Consulting in October 2016 and June 2017 respectively, and is determined according to asset condition. Council staff have also reviewed the useful life of a number of assets in preparing this plan and made adjustments accordingly.
Projected capital renewal expenditures are forecast to increase over time as the asset stock ages.
It is evident that projected renewal expenditure has peak periods where either a large volume of assets, and/or individual high value assets are forecast for renewal. These forecast asset renewal peaks will need to be considered in the context of Council’s adopted Long Term Financial Plan at any time with the objective of ensuring sustainable funding of asset renewal requirements, ideally on a predictable and annually consistent basis.

City of Port Lincoln
Infrastructure & Asset Management Plan Document Control Version 1.0
25 | P a g e
The practical projection of asset renewal programs aligned to a financially sustainable LTFP may lead to refinement of this Asset Management Plan’s projected renewal program, however it should not reduce the total projected renewal investments over a medium term rolling cycle.
Renewals are to be funded primarily from Council’s capital works program and supplemented by grants and funding. The Projected Capital Renewal Program for each Asset Class is summarised in the applicable Chapter with details in the relevant Appendix.
4.6. Acquisition and Upgrades of Infrastructure and Assets
New and upgrade works are those works that create new infrastructure and assets that did not previously exist, or works which upgrade or improve an existing asset beyond its existing capacity. New infrastructure, assets or services or service levels may result from growth, social or environmental needs and should be carefully considered in the context of community need, strategic purpose, planned service levels and financial sustainability. Some infrastructure and assets may also be acquired at no initial capital cost to the Council in particular through the land development process.
4.6.1. Selection criteria
Projects for new infrastructure and assets and upgrade/expansion of existing infrastructure and assets are identified primarily from proposals identified in the Strategic Directions Plan and Council’s other strategic plans. Community requests, Council decisions and partnerships with other organisations may also lead to the acquisition or creation of new or upgraded assets. Potential new capital projects will be prioritised through alignment with Council’s Strategic Directions Plan for consideration in Annual Business Plan and Budget formulation, with reference to Council’s Community policies; Asset Management 7.63.10, Prudential Management 9.63.24 and Treasury Management 7.63.9, and to Long Term Financial Plan capacity.
4.6.2. Standards and specifications
Standards and specifications for new assets and for upgrade/expansion of existing assets will be within the specific Council standard or required Australian Standards.
4.7. Financial Summary
This section summarises the financial implications resulting from all the planned asset actions presented in the previous sections of this Infrastructure and Asset Management Plan. The financial projections will be refined in response to updated condition rating, useful life and replacement value data, as planned service levels change and when new assets are created or received for Council’s future operation.
4.7.1. Sustainability of Service Delivery
There are two key indicators for financial sustainability that have been considered in the analysis of the services provided by this asset category:
long term life cycle costs

City of Port Lincoln
Infrastructure & Asset Management Plan Document Control Version 1.0
26 | P a g e
medium term costs over the 10 year financial planning period.
4.7.2. Asset Sustainability Ratio
Calculated as Expenditure on Renewal and Replacement of Assets (refer to Cash Flow Statement) relative to Council’s Asset Management Plan (IAMP) – “Is Council replacing its assets at the same rate as the assets are wearing out?”
• Suggested target ratio: between 90% and 110% (Financial Indicators 2015 (LGA SA Information Paper 9),p. 9). Council Target Range is 90% to 100%.
• A result within this Target Range indicates that sufficient funds have been allocated to replace Council assets.
• Council’s Asset Sustainability Ratio outlined in its Long Term Financial Plan meets agreed targets.
This may be compared to existing or planned expenditures in the period to identify any gap. In the Infrastructure and Asset Management Plan, a gap will generally reflect asset renewal costs that are not adequately funded.
Planned capital renewal expenditure is based on the renewal expenditure amounts provided in the LTFP 20120-2029. The tables in each Asset Class chapter are shown in present value dollars with an annual indexation of 1.5%. The current LTFP 2020-2029 (Version 1) is currently fully aligned to reflect the asset expenditures projected in this IAMP.
The projected asset renewal expenditure required compared to planned renewal expenditure in the planning period is shown by Asset Class in the relevant Chapter.
Delivery of sustainable services at planned service levels will require the projected asset renewals to be funded annually by the planned renewal capital works programs.
Council will manage any ‘gap’ between IAMP projected expenditures and LTFP planned expenditures by reviewing and revising the Infrastructure and Asset Management Plan to provide guidance on future service levels and the resources required, together with consideration of planned operating expenditures and revenues.
4.8. Funding Strategy Projected expenditure identified throughout the plan, is to be funded from Council’s operating and capital budgets. The annual funding strategy will be detailed in Council’s Annual Business Plan each year.
Major projects may attract external funding from other levels of Government or partnerships opportunities. Generally the revenue from these sources is budgeted when the funding is approved or reasonably guaranteed, but the LTFP contains some assumptions on partner and grant revenue linked to identified projects. This will require careful review to confirm the project-linked revenues prior to budget commitments.
Review and consolidation of Council assets may also provide a funding source for new and upgrade infrastructure projects. Sale of assets as funding for renewals works is not sustainable.

City of Port Lincoln
Infrastructure & Asset Management Plan Document Control Version 1.0
27 | P a g e
4.9. Valuation Forecasts Asset values are forecast to increase as additional assets are added to the asset stock from creation and acquisition by Council and from assets constructed by developers and others and donated to Council.
4.10. Key Assumptions made in Financial Forecasts This section details the key assumptions made in presenting the information contained in this Infrastructure and Asset Management Plan and in preparing forecasts of required operating and capital expenditure and asset values, depreciation expense and carrying amount estimates. It is presented to enable readers to gain an understanding of the levels of confidence in the data behind the financial forecasts.
Key assumptions made in this Infrastructure and Asset Management Plan are:
• Used 1.5% for all indexations on maintenance and renewal expenditure.
• These indexations are consistent with the LTFP 2020-2029 and are linked to forecast changes in CPI.
• Present service levels as set out in this plan will remain constant over the life of the IAMP.
• Expenditure figures for Actual Capital Renewal for years 2017-18 and 2018-19 are reflective of the Annual Financial Statements for 2017-18 and the latest budget review of the 2018-19 financial year, being the March 2019 budget review. From 2019-20 onwards the data is based on Council’s Asset Register renewal data. Some additional data is included in these figures dependent on what assumptions have been included in the latest iteration of the Long Term Financial Plan.
• Expenditure figures for Actual Capital Upgrade and New Capital Expenditure for years 2017-18 and 2018-19 are reflective of the Annual Financial Statements for 2017-18 and the latest budget review of the 2018-19 financial year, being the March 2019 budget review.
• All new assets will require maintenance from day one. However, this is not normally the case as maintenance costs are not normally incurred until a couple of years into the life of assets.
• All assets are to be replaced at the end of their useful life, as estimated in the Asset Register, with two exceptions:
• The road reseal program is determined by condition – based assessment using the Road Surface Manager software (rather than using financial data to determine the road reseal program) and
• Assets identified for non-renewal where there is no planned alternate community asset identified, are not included in the “planned for renewal” tables.

City of Port Lincoln
Infrastructure & Asset Management Plan Document Control Version 1.0
28 | P a g e
Accuracy of future financial forecasts may be improved in future revisions of this Infrastructure and Asset Management Plan by the actions identified within the Improvement Plan section.
5. GLOSSARY Annual service cost (ASC) An estimate of the cost that would be tendered, per annum, if tenders were called for the supply of a service to a performance specification for a fixed term. The Annual Service Cost includes operating, maintenance, depreciation, finance/ opportunity and disposal costs, less revenue.
Asset class Grouping of assets of a similar nature and use in an entity's operations (AASB 166.37).
Asset condition assessment The process of continuous or periodic inspection, assessment, measurement and interpretation of the resultant data to indicate the condition of a specific asset so as to determine the need for some preventative or remedial action.
Asset management The combination of management, financial, economic, engineering and other practices applied to physical assets with the objective of providing the required level of service in the most cost effective manner.
Assets Future economic benefits controlled by the entity as a result of past transactions or other past events (AAS27.12).
Property, plant and equipment including infrastructure and other assets (such as furniture and fittings) with benefits expected to last more than 12 month.
Average annual asset consumption (AAAC)* The amount of a local government’s asset base consumed during a year. This may be calculated by dividing the Depreciable Amount (DA) by the Useful Life and totalled for each and every asset OR by dividing the Fair Value (Depreciated Replacement Cost) by the Remaining Life and totalled for each and every asset in an asset category or class.
Brownfield asset values** Asset (re)valuation values based on the cost to replace the asset including demolition and restoration costs.
Capital expansion expenditure Expenditure that extends an existing asset, at the same standard as is currently enjoyed by residents, to a new group of users. It is discretional expenditure, which increases future operating, and maintenance costs, because it increases council’s asset base, but may be associated with additional revenue from the new user group, eg. extending a drainage or road network, the provision of an oval or park in a new suburb for new residents.
Capital expenditure Relatively large (material) expenditure, which has benefits, expected to last for more than 12 months. Capital expenditure includes renewal, expansion and upgrade.
Where capital projects involve a combination of renewal, expansion and/or upgrade expenditures, the total project cost needs to be allocated accordingly.
Capital funding Funding to pay for capital expenditure.
Capital grants Monies received generally tied to the specific projects for which they are granted, which are often upgrade and/or expansion or new investment proposals.
Capital investment expenditure See capital expenditure definition
Capital new expenditure Expenditure which creates a new asset providing a new service to the community that did not exist beforehand. As it increases service potential it may impact revenue and will increase future operating and maintenance expenditure.
Capital renewal expenditure Expenditure on an existing asset, which returns the service potential or the life of the asset up to that which it had originally. It is periodically required expenditure, relatively large (material) in value compared with the value of the components or sub-components of the asset being renewed. As it reinstates existing service potential, it has no impact on revenue, but may reduce future operating and maintenance expenditure if completed at the optimum time, eg. resurfacing or resheeting a material part of a road network, replacing a material section of a drainage network with pipes of the same capacity, resurfacing an oval. Where capital projects involve a combination of renewal, expansion and/or upgrade expenditures, the total project cost needs to be allocated accordingly.
Capital upgrade expenditure Expenditure, which enhances an existing asset to provide a higher level of service or expenditure that will increase the life of the asset beyond that which it had originally. Upgrade expenditure is discretional and often does not result in additional revenue unless direct user charges apply. It will increase operating and maintenance expenditure in the future because of the increase in the council’s asset base, eg. widening the sealed area of an existing road, replacing drainage pipes with pipes of a greater capacity, enlarging a grandstand at a sporting facility. Where capital projects involve a combination of renewal, expansion and/or upgrade expenditures, the total project cost needs to be allocated accordingly.
Carrying amount The amount at which an asset is recognised after deducting any accumulated depreciation / amortisation and accumulated impairment losses thereon.

City of Port Lincoln
Infrastructure & Asset Management Plan Document Control Version 1.0
29 | P a g e
Class of assets See asset class definition
Component An individual part of an asset which contributes to the composition of the whole and can be separated from or attached to an asset or a system.
Cost of an asset The amount of cash or cash equivalents paid or the fair value of the consideration given to acquire an asset at the time of its acquisition or construction, plus any costs necessary to place the asset into service. This includes one-off design and project management costs.
Current replacement cost (CRC) The cost the entity would incur to acquire the asset on the reporting date. The cost is measured by reference to the lowest cost at which the gross future economic benefits could be obtained in the normal course of business or the minimum it would cost, to replace the existing asset with a technologically modern equivalent new asset (not a second hand one) with the same economic benefits (gross service potential) allowing for any differences in the quantity and quality of output and in operating costs.
Current replacement cost “As New” (CRC) The current cost of replacing the original service potential of an existing asset, with a similar modern equivalent asset, i.e. the total cost of replacing an existing asset with an as NEW or similar asset expressed in current dollar values.
Cyclic Maintenance** Replacement of higher value components/sub-components of assets that is undertaken on a regular cycle including repainting, building roof replacement, replacement of air conditioning equipment, etc. This work generally falls below the capital/ maintenance threshold and needs to be identified in a specific maintenance budget allocation.
Depreciable amount The cost of an asset, or other amount substituted for its cost, less its residual value (AASB 116.6)
Depreciated replacement cost (DRC) The current replacement cost (CRC) of an asset less, where applicable, accumulated depreciation calculated on the basis of such cost to reflect the already consumed or expired future economic benefits of the asset.
Depreciation / amortisation The systematic allocation of the depreciable amount (service potential) of an asset over its useful life.
Economic life See useful life definition.
Expenditure The spending of money on goods and services. Expenditure includes recurrent and capital.
Fair value
The amount for which an asset could be exchanged, or a liability settled, between knowledgeable, willing parties, in an arms length transaction.
Greenfield asset values ** Asset (re)valuation values based on the cost to initially acquire the asset.
Heritage asset An asset with historic, artistic, scientific, technological, geographical or environmental qualities that is held and maintained principally for its contribution to knowledge and culture and this purpose is central to the objectives of the entity holding it.
Impairment Loss The amount by which the carrying amount of an asset exceeds its recoverable amount.
Infrastructure assets Physical assets of the entity or of another entity that contribute to meeting the public's need for access to major economic and social facilities and services, eg. roads, drainage, footpaths and cycleways. These are typically large, interconnected networks or portfolios of composite assets. The components of these assets may be separately maintained, renewed or replaced individually so that the required level and standard of service from the network of assets is continuously sustained. Generally the components and hence the assets have long lives. They are fixed in place and often have no market value.
Investment property Property held to earn rentals or for capital appreciation or both, rather than for:
(a) use in the production or supply of goods or services or for administrative purposes; or
(b) sale in the ordinary course of business (AASB 140.5)
Level of service The defined service quality for a particular service against which service performance may be measured. Service levels usually relate to quality, quantity, reliability, responsiveness, environmental, acceptability and cost.
Life Cycle Cost ** The life cycle cost (LCC) is average cost to provide the service over the longest asset life cycle. It comprises annual maintenance and asset consumption expense, represented by depreciation expense. The Life Cycle Cost does not indicate the funds required to provide the service in a particular year.
Life Cycle Expenditure ** The Life Cycle Expenditure (LCE) is the actual or planned annual maintenance and capital renewal expenditure incurred in providing the service in a particular year. Life Cycle Expenditure may be compared to Life Cycle Costs to give an initial indicator of life cycle sustainability.
Loans / borrowings

City of Port Lincoln
Infrastructure & Asset Management Plan Document Control Version 1.0
30 | P a g e
Loans result in funds being received which are then repaid over a period of time with interest (an additional cost). Their primary benefit is in ‘spreading the burden’ of capital expenditure over time. Although loans enable works to be completed sooner, they are only ultimately cost effective where the capital works funded (generally renewals) result in operating and maintenance cost savings, which are greater than the cost of the loan (interest and charges).
Maintenance and renewal gap Difference between estimated budgets and projected expenditures for maintenance and renewal of assets, totalled over a defined time (eg 5, 10 and 15 years).
Maintenance and renewal sustainability index Ratio of estimated budget to projected expenditure for maintenance and renewal of assets over a defined time (eg 5, 10 and 15 years).
Maintenance expenditure Recurrent expenditure, which is periodically or regularly required as part of the anticipated schedule of works required to ensure that the asset achieves its useful life and provides the required level of service. It is expenditure, which was anticipated in determining the asset’s useful life.
Materiality An item is material if its omission or misstatement could influence the economic decisions of users taken on the basis of the financial report. Materiality depends on the size and nature of the omission or misstatement judged in the surrounding circumstances.
Modern equivalent asset A structure similar to an existing structure and having the equivalent productive capacity, which could be built using modern materials, techniques and design. Replacement cost is the basis used to estimate the cost of constructing a modern equivalent asset.
Non-revenue generating investments Investments for the provision of goods and services to sustain or improve services to the community that are not expected to generate any savings or revenue to the Council, eg. parks and playgrounds, footpaths, roads and bridges, libraries, etc.
Operating expenditure Recurrent expenditure, which is continuously required excluding maintenance and depreciation, eg power, fuel, staff, plant equipment, on-costs and overheads.
Pavement management system A systematic process for measuring and predicting the condition of road pavements and wearing surfaces over time and recommending corrective actions.
Planned Maintenance** Repair work that is identified and managed through a maintenance management system (MMS). MMS activities include inspection, assessing the condition against failure/breakdown criteria/experience, prioritising scheduling, actioning the work and reporting what was done
to develop a maintenance history and improve maintenance and service delivery performance.
PMS Score A measure of condition of a road segment determined from a Pavement Management System.
Rate of annual asset consumption* A measure of average annual consumption of assets (AAAC) expressed as a percentage of the depreciable amount (AAAC/DA). Depreciation may be used for AAAC.
Rate of annual asset renewal* A measure of the rate at which assets are being renewed per annum expressed as a percentage of depreciable amount (capital renewal expenditure/DA).
Rate of annual asset upgrade* A measure of the rate at which assets are being upgraded and expanded per annum expressed as a percentage of depreciable amount (capital upgrade/expansion expenditure/DA).
Reactive maintenance Unplanned repair work carried out in response to service requests and management/supervisory directions.
Recoverable amount The higher of an asset's fair value less costs to sell and its value in use.
Recurrent expenditure Relatively small (immaterial) expenditure or that which has benefits expected to last less than 12 months. Recurrent expenditure includes operating and maintenance expenditure.
Recurrent funding Funding to pay for recurrent expenditure.
Rehabilitation See capital renewal expenditure definition above.
Remaining life The time remaining until an asset ceases to provide the required service level or economic usefulness. Age plus remaining life is economic life.
Renewal See capital renewal expenditure definition above.
Residual value The net amount which an entity expects to obtain for an asset at the end of its useful life after deducting the expected costs of disposal.
Revenue generating investments Investments for the provision of goods and services to sustain or improve services to the community that are expected to generate some savings or revenue to offset operating costs, eg public halls and theatres, childcare centres, sporting and recreation facilities, tourist information centres, etc.
Risk management

City of Port Lincoln
Infrastructure & Asset Management Plan Document Control Version 1.0
31 | P a g e
The application of a formal process to the range of possible values relating to key factors associated with a risk in order to determine the resultant ranges of outcomes and their probability of occurrence.
Section or segment A self-contained part or piece of an infrastructure asset.
Service potential The capacity to provide goods and services in accordance with the entity's objectives, whether those objectives are the generation of net cash inflows or the provision of goods and services of a particular volume and quantity to the beneficiaries thereof.
Service potential remaining* A measure of the remaining life of assets expressed as a percentage of economic life. It is also a measure of the percentage of the asset’s potential to provide services that is still available for use in providing services (DRC/DA).
Strategic Management Plan (SA)** Documents Council objectives for a specified period (3-5 yrs), the principle activities to achieve the objectives, the means by which that will be carried out, estimated income and expenditure, measures to assess performance and how rating policy relates to the Council’s objectives and activities.
Sub-component Smaller individual parts that make up a component part.
Useful life Either:
(a) the period over which an asset is expected to be available for use by an entity, or
(b) the number of production or similar units expected to be obtained from the asset by the entity.
It is estimated or expected time between placing the asset into service and removing it from service, or the estimated period of time over which the future economic benefits embodied in a depreciable asset, are expected to be consumed by the council. It is the same as the economic life.
Value in Use The present value of estimated future cash flows expected to arise from the continuing use of an asset and from its disposal at the end of its useful life. It is deemed to be depreciated replacement cost (DRC) for those assets whose future economic benefits are not primarily dependent on the asset's ability to generate new cash flows, where if deprived of the asset its future economic benefits would be replaced.
Source: DVC 2006, Glossary Note: Items shown * modified to use DA instead of CRC Additional glossary items shown **
6. ABREVIATIONS AAAC Average annual asset consumption
ARI Average recurrence interval
BOD Biochemical (biological) oxygen demand
CRC Current replacement cost
DA Depreciable amount
DoH Department of Health
EF Earthworks/formation
IAMP Infrastructure & Asset Management Plan
IRMP Infrastructure Risk Management Plan
MMS Maintenance management system
LTFP Long Term Financial Plan
PCI Pavement condition index
RV Residual value
SS Suspended solids
VPH Vehicles per hour

City of Port Lincoln Infrastructure & Asset Management Plan
Document Control Version 1.0
32 | P a g e
7. REFERENCES, STANDARDS & GUIDELINES IPWEA, 2006, ‘International Infrastructure Management Manual’, Institute of Public Works Engineering Australia, Sydney, www.ipwea.org.au
IPWEA, NAMS.PLUS Asset Management- A Guided Pathway
IPWEA, 2006, ‘International Infrastructure Management Manual’, Institute of Public Works Engineering
City of Port Lincoln Strategic Directions Plan 2016-2026
City of Port Lincoln Sustainable Projects Delivery Plan 2018-2027
City of Port Lincoln Long Term Financial Plan 2019-2028
City of Port Lincoln Policy Documents Internal Control Policy 7.63.5
Asset Management Policy 7.63.10
Risk Management Policy 18.63.5
Risk Management Procedure 9.87.1.22
Service and Program Reviews Policy 18.63.7
City of Port Lincoln, Stormwater, London Street Bridge, Footpaths, Kerbing, Road Base and Road Surface review, Tonkin Consultants
City of Port Lincoln, Land, Building, Filtration and Other Community Assets review, Liquid Pacific
City of Port Lincoln Annual Business Plan & Budget Framework PROC345
March 2019 Budget Review
Audited Annual Financial Statements 2017/18

City of Port Lincoln Infrastructure & Asset Management Plan
Document Control Version 1.0
33 | P a g e
PART 1
BUILDINGS

City of Port Lincoln Infrastructure & Asset Management Plan
Document Control Version 1.0
34 | P a g e
8. BUILDING ASSETS
Table 7: Buildings Key Data and Information
KEY DATA DETAILS Total Replacement Cost at 30 June 2018 $44,348,683 Total Written Down Value at 30 June 2018
$26,107,396
Replacement Cost until 2028-29 $7,024,293 Average Useful Life (assets ≤ 2028-29) 24.3 Years Maintenance Programs The average ongoing maintenance cost as projected is
approximately $331k per year
Chart 2: Current value of buildings against written down value of buildings
$44,348,683
$26,107,396
$-
$5,000,000
$10,000,000
$15,000,000
$20,000,000
$25,000,000
$30,000,000
$35,000,000
$40,000,000
$45,000,000
$50,000,000
Buildings at 30 June 2018
Replacement Cost
Written Down Value
City of Port Lincoln Infrastructure & Asset Management Plan
Document Control Version 1.0
35 | P a g e
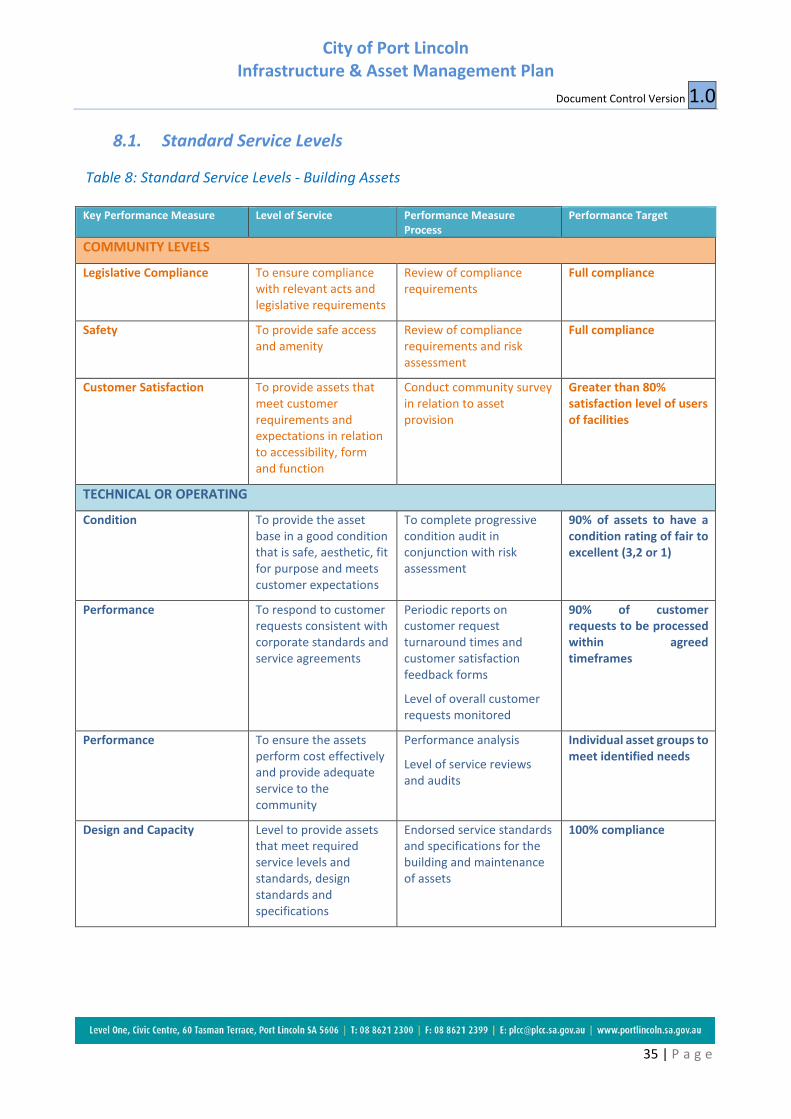
8.1. Standard Service Levels
Table 8: Standard Service Levels - Building Assets Key Performance Measure Level of Service Performance Measure
Process Performance Target
COMMUNITY LEVELS
Legislative Compliance To ensure compliance with relevant acts and legislative requirements
Review of compliance requirements
Full compliance
Safety To provide safe access and amenity
Review of compliance requirements and risk assessment
Full compliance
Customer Satisfaction To provide assets that meet customer requirements and expectations in relation to accessibility, form and function
Conduct community survey in relation to asset provision
Greater than 80% satisfaction level of users of facilities
TECHNICAL OR OPERATING
Condition To provide the asset base in a good condition that is safe, aesthetic, fit for purpose and meets customer expectations
To complete progressive condition audit in conjunction with risk assessment
90% of assets to have a condition rating of fair to excellent (3,2 or 1)
Performance To respond to customer requests consistent with corporate standards and service agreements
Periodic reports on customer request turnaround times and customer satisfaction feedback forms
Level of overall customer requests monitored
90% of customer requests to be processed within agreed timeframes
Performance To ensure the assets perform cost effectively and provide adequate service to the community
Performance analysis
Level of service reviews and audits
Individual asset groups to meet identified needs
Design and Capacity Level to provide assets that meet required service levels and standards, design standards and specifications
Endorsed service standards and specifications for the building and maintenance of assets
100% compliance

City of Port Lincoln Infrastructure & Asset Management Plan
Document Control Version 1.0
36 | P a g e
8.2. Maintenance Expenditure
The following table shows maintenance expenditure trends for Building assets. The reported figures have been based on template 7-7-T8 with percentages to be applied for future maintenance forecasts.
Reactive 26% Cyclic 19% Planned 55%
Table 9: Maintenance Expenditure Trends
Building Maintenance Expenditure Year Reactive Cyclic Subtotal Planned Total
2016/17 $ 78,216 $ 63,995 $ 142,211 $ 213,317 $ 355,528 2017/18 $ 189,307 $ - $ 189,307 $ 126,205 $ 315,512 2018/19 $ 80,451 $ 58,791 $ 139,242 $ 170,185 $ 309,427 TOTAL $ 347,974 $ 122,786 $ 470,760 $ 509,707 $ 980,467
Average $ 156,920 $ 169,902 $ 326,822 Chart 3: Building Assets Maintenance Expenditure
142189
139 139 141 143 146 148 150 152 155 157 159
213 126170 170 173 175 178 181 183 186 189 192 195
0
50
100
150
200
250
300
350
400
16/17 17/18 18/19 19/20 20/21 21/22 22/23 23/24 24/25 25/26 26/27 27/28 28/29
Expenditure on Maintenance of Assets $'000
Reactive & Cyclic Planned

City of Port Lincoln Infrastructure & Asset Management Plan
Document Control Version 1.0
37 | P a g e
8.3. Capital Projects and Forecasts
The following table shows expenditure in renewal of assets as extracted from Council’s Annual Financial Statements Note 7 data. The definition of renewal versus upgraded or new assets is defined by the LGA Model Financial Statements1. Table 10: Buildings Capital Expenditure
RENEWAL EXPENDITURE FINANCIAL YEAR 2016-17 2017-18 2018-19* TOTAL Buildings $5,122,881 $23,823 $73,520 $5,220,224 AVERAGE RENEWAL EXPENDITURE PER ANNUM $1,740,075
NEW AND UPGRADED EXPENDITURE
FINANCIAL YEAR 2016-17 2017-18 2018-19* TOTAL Buildings $184,866 $173,067 $3,198,376 $3,556,309 AVERAGE NEW & UPGRADED EXPENDITURE PER ANNUM $1,185,436.33
*Note: March 2019 Budget Review figures

City of Port Lincoln Infrastructure & Asset Management Plan
Document Control Version 1.0
38 | P a g e
Table 11: Building Assets Maintenance, Planned and Projected Expenditure
$'000 Reactive &
Cyclic Expenditure
Planned Expenditure
Total Maintenance Expenditure
Projected Renewal
Expenditure
Renewal Expenditure included in
LTFP 2020-29
Shortfall Disposal
2016/17 $ 142 $ 213 $ 355 N/A N/A N/A N/A 2017/18 $ 189 $ 126 $ 315 N/A N/A N/A N/A 2018/19 $ 139 $ 170 $ 309 N/A N/A N/A N/A 2019/20 $ 139 $ 170 $ 309 $ 193 $ 193 $ - $ - 2020/21 $ 141 $ 173 $ 314 $ 779 $ 779 $ - $ - 2021/22 $ 143 $ 175 $ 319 $ 1,857 $ 1,857 $ - $ - 2022/23 $ 146 $ 178 $ 324 $ 925 $ 925 $ - $ - 2023/24 $ 148 $ 181 $ 328 $ 506 $ 506 $ - $ - 2024/25 $ 150 $ 183 $ 333 $ 394 $ 394 $ - $ - 2025/26 $ 152 $ 186 $ 338 $ 500 $ 500 $ - $ - 2026/27 $ 155 $ 189 $ 343 $ 649 $ 649 $ - $ - 2027/28 $ 157 $ 192 $ 349 $ 309 $ 309 $ - $ - 2028/29 $ 159 $ 195 $ 354 $ 1,692 $ 1,692 $ - $ - TOTALS $ 1,490 $ 1,821 $ 3,311 $ 7,804 $ 7,804 $ - $ -

City of Port Lincoln Infrastructure & Asset Management Plan
Document Control Version 1.0
39 | P a g e
PART 2
OTHER COMMUNITY ASSETS AND FILTRATION

City of Port Lincoln Infrastructure & Asset Management Plan
Document Control Version 1.0
40 | P a g e
9. OTHER COMMUNITY ASSETS & FILTRATION ASSETS
Table 12: Other Community Assets and Filtration Assets Key Data KEY DATA DETAILS
Total Replacement Cost at 30 June 2018 $26,927,006 Total Written Down Value at 30 June 2018
$16,789,216
Replacement Cost until 2028-29 $4,885,862 Average Useful Life (assets ≤ 2028-29) 21.3 years Value and number of Assets past Useful Life (Appendix E and F)
$484,000 (4 assets)
Maintenance Programs On-going maintenance projected at approximately $1.1mil per year
Chart 4: Other Community Assets and Filtration Assets Current vs Written Down Values
$26,927,006
$16,789,216
$-
$5,000,000
$10,000,000
$15,000,000
$20,000,000
$25,000,000
$30,000,000
Other Community Assets & Filtration at 30 June 2018
Replacement Cost
Written Down Value

City of Port Lincoln Infrastructure & Asset Management Plan
Document Control Version 1.0
41 | P a g e
9.1. Standard Service Levels
Table 13: Standard Service Levels Other Community Assets Key Performance Measure Level of Service Performance Measure
Process Performance Target
COMMUNITY LEVELS
Legislative Compliance To ensure compliance with relevant acts and legislative requirements
Review of compliance requirements
Full compliance
Safety To provide safe access and amenity
Review of compliance requirements and risk assessment
Full compliance
Customer Satisfaction To provide assets that meet customer requirements and expectations in relation to accessibility, form and function
Conduct community survey in relation to asset provision
Greater than 80% satisfaction level of users of facilities
TECHNICAL OR OPERATING
Condition To provide the asset base in a good condition that is safe, aesthetic, fit for purpose and meets customer expectations
To complete progressive condition audit in conjunction with risk assessment
90% of assets to have a condition rating of fair to excellent (3,2 or 1)
Performance To respond to customer requests consistent with corporate standards and service agreements
Periodic reports on customer request turnaround times and customer satisfaction feedback forms.
Periodic monitoring of overall level of customer requests.
90% of customer requests to be processed within agreed timeframes
Performance To ensure the assets perform cost effectively and provide adequate service to the community
Performance analysis
Level of service reviews and audits
Individual asset groups to meet identified needs

City of Port Lincoln Infrastructure & Asset Management Plan
Document Control Version 1.0
42 | P a g e
Table 14: Standard Service Levels Water Reuse (Filtration) Assets Key Performance Measure Level of Service Performance Measure
Process Performance Target
COMMUNITY LEVELS OF SERVICE
Customer Satisfaction Provide irrigated parks, ovals & foreshore lawns throughout the year
Community satisfaction ratings with parks, ovals & reserves irrigated with recycled water.
80% rated “satisfactory” or “above expectations No more than 2 complaints per month.
Community consultation undertaken prior to application of recycled water to Council reserves
Consultation undertaken prior to each additional phase
80% support for application to additional Council reserves
Safety
Legislative
Public health is not affected by the use of recycled water
Public liability claims Zero
TECHNICAL LEVELS OF SERVICE
Design and Capacity Health risks to employees, contractors & the general public minimised.
Water quality meets terms of Department of Health and approval
E-Coli < 1 organism per 100 mL (annual median value)
Turbidity of ≤ 2 NTU
Free chlorine ≥ 0.2 mg/l in water being delivered to field tanks
Condition Equipment maintained in a serviceable condition
Council & SA Water personnel monitor equipment.
Plant has PLC alarm control functions
Telemetry alert Council personnel of issues with field tank or supply
Less than 3 faults identified per month

City of Port Lincoln Infrastructure & Asset Management Plan
Document Control Version 1.0
43 | P a g e
9.2. Maintenance Expenditure
Other Community Assets
The following table shows maintenance expenditure trends for Other Community Assets. The reported figures have been based on template 7-7-T8 with percentages to be applied for future maintenance forecasts.
Table 15: Maintenance Expenditure Trends
OCA Maintenance Expenditure
Year Reactive Cyclic Subtotal Planned Total 2016/17 $ 249,948 $ 117,163 $ 367,111 $ 413,976 $ 781,087 2017/18 $ 257,646 $ 120,772 $ 378,418 $ 426,726 $ 805,144 2018/19 $ 198,459 $ 419,818 $ 618,277 $ 145,028 $ 763,305 TOTAL $ 706,053 $ 657,753 $ 1,363,806 $ 985,730 $ 2,349,536
Average $ 454,602 $ 328,577 $ 783,179
Chart 5: Other Community Assets Maintenance Expenditure Trend Forecasts
367 378618
820.3 832.6 845.0 857.7 870.6 883.6 896.9 910.4 924.0 937.9414 427
145
144.8 146.9 149.1 151.4 153.6 155.9 158.3 160.7 163.1 165.5
0
200
400
600
800
1000
1200
16/17 17/18 18/19 19/20 20/21 21/22 22/23 23/24 24/25 25/26 26/27 27/28 28/29
Expenditure on Maintenance of Assets $'000
Reactive & Cyclic Planned
Reactive 32%
Cyclic 53%
Planned 15%

City of Port Lincoln Infrastructure & Asset Management Plan
Document Control Version 1.0
44 | P a g e
Filtration Assets
The following table shows maintenance expenditure trends for Filtration assets. The reported figures have been based on template 7-7-T8 with percentages to be applied for future maintenance forecasts.
Reactive 33%
Cyclic 33%
Planned 33%
Table 16: Maintenance Expenditure Trends Chart 6: Filtration Asset Maintenance Expenditure Trend Forecasts
42 4332
$40 $41 $41 $42 $42 $43 $44 $44 $45 $46
21 22
8
$20 $20 $21 $21 $21 $22 $22 $22 $23 $23
0
10
20
30
40
50
60
70
80
16/17 17/18 18/19 19/20 20/21 21/22 22/23 23/24 24/25 25/26 26/27 27/28 28/29
Expenditure on Maintenance of Assets $'000
Reactive & Cyclic Planned
Filtration Maintenance Expenditure Year Reactive Cyclic Subtotal Planned Total
2016/17 $ 21,315 $ 21,315 $ 42,630 $ 21,315 $ 63,945 2017/18 $ 21,667 $ 21,667 $ 43,334 $ 21,667 $ 65,001 2018/19 $ 10,370 $ 21,937 $ 32,307 $ 7,578 $ 39,885 TOTAL $ 53,352 $ 64,919 $ 118,271 $ 50,560 $ 168,831
Average $ 39,424 $ 16,853 $ 56,277

City of Port Lincoln Infrastructure & Asset Management Plan
Document Control Version 1.0
45 | P a g e
9.3. Capital Projects and Forecasts
The following table shows expenditure in renewal of assets as extracted from Council’s Annual Financial Statements Note 7 data.
The definition of renewal versus upgraded or new assets is defined by the LGA Model Financial Statements.
Table 17: Other Community Assets and Filtration Assets Capital Expenditure
RENEWAL EXPENDITURE FINANCIAL YEAR 2016-17 2017-18 2018-19* TOTAL Other Community Assets $124,048 $381,128 $144,135 $649,311 Filtration $26,893 $0 $21,607 $48,500 TOTAL $150,941 $381,128 $165,742 $697,811 AVERAGE RENEWAL EXPENDITURE PER ANNUM $232,603.67
NEW AND UPGRADED EXPENDITURE
FINANCIAL YEAR 2016-17 2017-18 2018-19* TOTAL Other Community Assets $547,386 $165,815 $969,889 $1,683,090 Filtration $0 $0 $90,000 $90,000 TOTAL $547,386 $165,815 $1,059,889 $1,773,090 AVERAGE NEW & UPGRADED EXPENDITURE PER ANNUM $591,030
*Note: March 2019 Budget Review figures
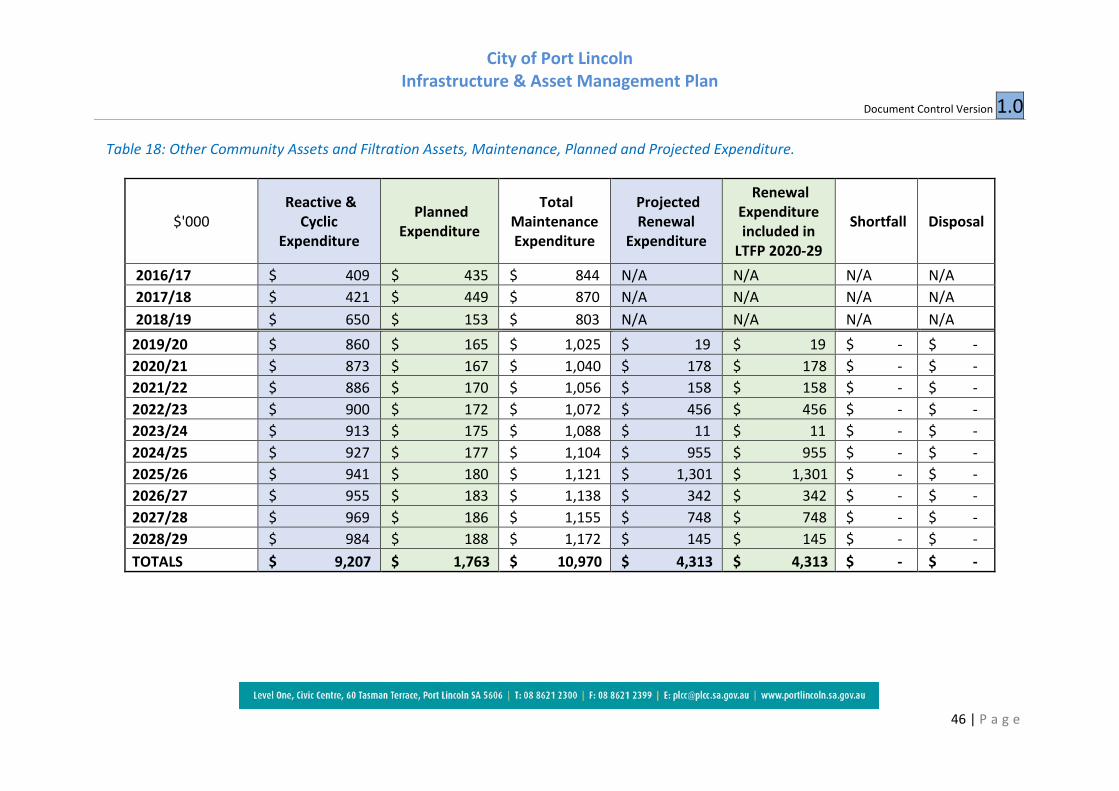
City of Port Lincoln Infrastructure & Asset Management Plan
Document Control Version 1.0
46 | P a g e
Table 18: Other Community Assets and Filtration Assets, Maintenance, Planned and Projected Expenditure.
$'000 Reactive &
Cyclic Expenditure
Planned Expenditure
Total Maintenance Expenditure
Projected Renewal
Expenditure
Renewal Expenditure included in
LTFP 2020-29
Shortfall Disposal
2016/17 $ 409 $ 435 $ 844 N/A N/A N/A N/A 2017/18 $ 421 $ 449 $ 870 N/A N/A N/A N/A 2018/19 $ 650 $ 153 $ 803 N/A N/A N/A N/A 2019/20 $ 860 $ 165 $ 1,025 $ 19 $ 19 $ - $ - 2020/21 $ 873 $ 167 $ 1,040 $ 178 $ 178 $ - $ - 2021/22 $ 886 $ 170 $ 1,056 $ 158 $ 158 $ - $ - 2022/23 $ 900 $ 172 $ 1,072 $ 456 $ 456 $ - $ - 2023/24 $ 913 $ 175 $ 1,088 $ 11 $ 11 $ - $ - 2024/25 $ 927 $ 177 $ 1,104 $ 955 $ 955 $ - $ - 2025/26 $ 941 $ 180 $ 1,121 $ 1,301 $ 1,301 $ - $ - 2026/27 $ 955 $ 183 $ 1,138 $ 342 $ 342 $ - $ - 2027/28 $ 969 $ 186 $ 1,155 $ 748 $ 748 $ - $ - 2028/29 $ 984 $ 188 $ 1,172 $ 145 $ 145 $ - $ - TOTALS $ 9,207 $ 1,763 $ 10,970 $ 4,313 $ 4,313 $ - $ -

City of Port Lincoln Infrastructure & Asset Management Plan
Document Control Version 1.0
47 | P a g e
PART 3
ROADS AND
BRIDGES

City of Port Lincoln Infrastructure & Asset Management Plan
Document Control Version 1.0
48 | P a g e
10. ROADS AND BRIDGES ASSETS
Table 19: Roads and Bridges Assets Key Data KEY DATA DETAILS
Total Replacement Cost at 30 June 2018 $41,508,661 Total Written Down Value at 30 June 2018
$29,819,496
Replacement Cost until 2027-28 $5,512,000 Average Useful Life (assets ≤ 2027-28) 19 years Value and number of Assets past Useful Life
$0
Maintenance Programs On-going maintenance projected at approximately $695k/year.
Chart 7: Road Assets and Bridge Assets Current and Written Down Value
$41,508,661
$29,819,496
$-
$5,000,000
$10,000,000
$15,000,000
$20,000,000
$25,000,000
$30,000,000
$35,000,000
$40,000,000
$45,000,000
Roads & Bridges at 30 June 2018
Replacement Cost
Written Down Value

City of Port Lincoln Infrastructure & Asset Management Plan
Document Control Version 1.0
49 | P a g e
10.1. Standard Service Levels
Table 20: Standard Service Levels Unsealed Road Assets Key Performance Measure Level of Service Performance Measure Process Performance Target
COMMUNITY LEVELS OF SERVICE
Customer Satisfaction Smooth ride (pothole free)
Customer service requests < 1 per month
Safety Ensure safe Reported accidents attributed to road condition
Nil, as measured by DPTI statistics of causes of reported accidents.
Safety Appropriate warning signage installed
Placement at each end of road
Signs Exist
TECHNICAL LEVELS OF SERVICE
Condition Carry out regular maintenance
Grade frequency 2 grades per year
Condition Provide all weather access
Number of road closures Nil
Table 21: Standard Service Levels Sealed Road Assets – Collectors/Distributor & Heavy Vehicle Routes – High Volume AADT>2000Vpd Key Performance Measure Level of Service Performance Measure Process Performance Target
COMMUNITY LEVELS OF SERVICE
Customer Satisfaction Rideability Customer requests relating to rideability
< 1 per month
Customer Satisfaction Meets requirements of residents
Customer service requests < 1 per month
Safety Regulatory signage well maintained
Replacement/response after report of damaged/missing signs
To assess need for Sign repair/replacement within 24 hours of report
Safety Clear linemarking Annual visual inspection Lines remarked every 4 years
Safety Network free of hazards
- Customer reports of potholes - Customer requests for tree maintenance
< 1 per month
TECHNICAL LEVELS OF SERVICE
Condition Seal maintained in satisfactory condition
Condition rating – RSM program reports
< 5% condition > 2.0
Design and Capacity Road width meets desirable width
RSM data/reports No new roads < 8.0m in width

City of Port Lincoln Infrastructure & Asset Management Plan
Document Control Version 1.0
50 | P a g e
Table 22: Standard Service Levels Sealed Road Assets Low Volume Residential <2000Vpd Key Performance Measure Level of Service Performance Measure Process Performance Target
COMMUNITY LEVELS OF SERVICE
Customer Service Rideability Customer requests relating to rideability
< 2 per month
Customer Service Meets requirements of residents
Customer service requests < 2 per month
Safety Network free of hazards
- Customer reports of potholes - Customer requests for tree maintenance
< 2 per month < 10 per year
Safety Regulatory signage well maintained
Replacement/response after report of damaged/ missing signs
To assess need for Sign repair/replacement within 24 hours of report
Safety Good linemarking Annual visual inspection Lines remarked every 4 years
Safety Road free of hazazrds Response to reported potholes
Potholes > 300mm repaired within 48 hours of notification. All other potholes repaired within 10 days.
TECHNICAL LEVELS OF SERVICE
Condition Seal maintained in satisfactory condition
Condition rating – RSM program reports
RSM < 5% condition > 2.5
Design and capacity Road width meets desirable width
RSM data/reports No new roads < 7.5m in width

City of Port Lincoln Infrastructure & Asset Management Plan
Document Control Version 1.0
51 | P a g e
10.2. Maintenance Expenditure - Roads
The following table shows maintenance expenditure trends for Road Transport infrastructure assets. The reported figures have been based on template 7-7-T8 with percentages to be applied for future maintenance forecasts.
Reactive 26%
Cyclic 1%
Planned 73%
Table 23: Road Transport Maintenance Expenditure Trends
Chart 8: Road Asset and Bridges Assets Maintenance Expenditure Forecasts
$186 $173 $173 $175 $178 $180 $183 $186 $188 $191 $194 $197 $200
$504 $469 $475 $473 $480 $487 $495 $502 $510 $517 $525 $533 $541
$-
$100
$200
$300
$400
$500
$600
$700
$800
16/17 17/18 18/19 19/20 20/21 21/22 22/23 23/24 24/25 25/26 26/27 27/28 28/29
Expenditure on Maintenance of Assets $'000
Reactive & Cyclic Planned
Roads & Bridges Maintenance Expenditure Year Reactive Cyclic Subtotal Planned Total 2016/17 $ 179,513 $ 6,904 $ 186,417 $ 504,017 $ 690,434 2017/18 $ 166,882 $ 6,419 $ 173,301 $ 468,553 $ 641,854 2018/19 $ 168,428 $ 4,671 $ 173,099 $ 474,701 $ 647,800 TOTAL $ 514,823 $ 17,994 $ 532,817 $ 1,447,271 $ 1,980,088
Average $ 177,605.67 $ 482,423.67 $ 660,029.33
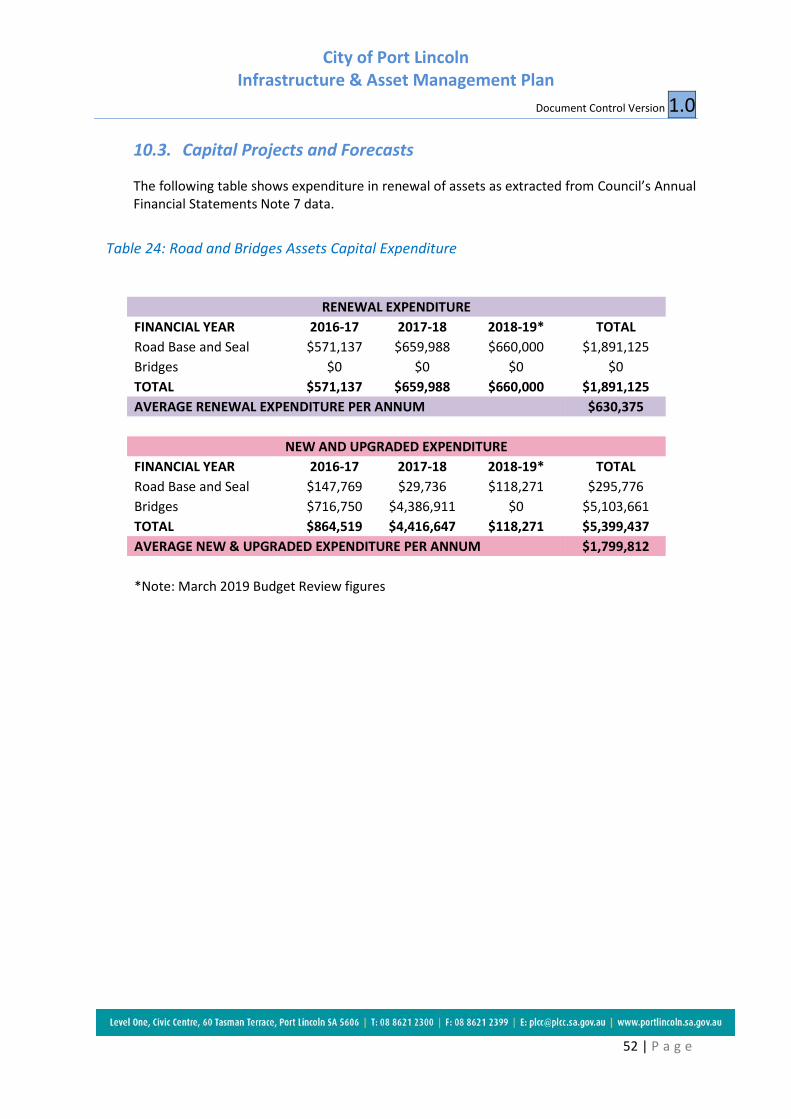
City of Port Lincoln Infrastructure & Asset Management Plan
Document Control Version 1.0
52 | P a g e
10.3. Capital Projects and Forecasts
The following table shows expenditure in renewal of assets as extracted from Council’s Annual Financial Statements Note 7 data.
Table 24: Road and Bridges Assets Capital Expenditure
RENEWAL EXPENDITURE FINANCIAL YEAR 2016-17 2017-18 2018-19* TOTAL Road Base and Seal $571,137 $659,988 $660,000 $1,891,125 Bridges $0 $0 $0 $0 TOTAL $571,137 $659,988 $660,000 $1,891,125 AVERAGE RENEWAL EXPENDITURE PER ANNUM $630,375
NEW AND UPGRADED EXPENDITURE
FINANCIAL YEAR 2016-17 2017-18 2018-19* TOTAL Road Base and Seal $147,769 $29,736 $118,271 $295,776 Bridges $716,750 $4,386,911 $0 $5,103,661 TOTAL $864,519 $4,416,647 $118,271 $5,399,437 AVERAGE NEW & UPGRADED EXPENDITURE PER ANNUM $1,799,812
*Note: March 2019 Budget Review figures
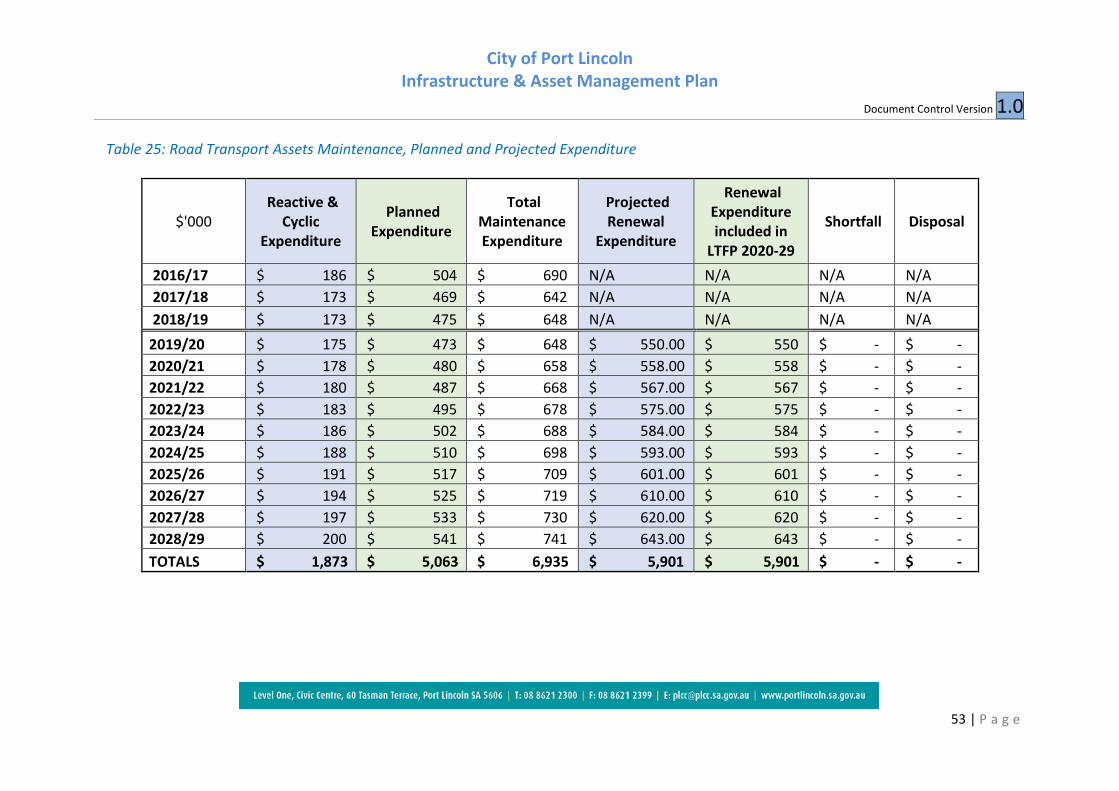
City of Port Lincoln Infrastructure & Asset Management Plan
Document Control Version 1.0
53 | P a g e
Table 25: Road Transport Assets Maintenance, Planned and Projected Expenditure
$'000 Reactive &
Cyclic Expenditure
Planned Expenditure
Total Maintenance Expenditure
Projected Renewal
Expenditure
Renewal Expenditure included in
LTFP 2020-29
Shortfall Disposal
2016/17 $ 186 $ 504 $ 690 N/A N/A N/A N/A 2017/18 $ 173 $ 469 $ 642 N/A N/A N/A N/A 2018/19 $ 173 $ 475 $ 648 N/A N/A N/A N/A 2019/20 $ 175 $ 473 $ 648 $ 550.00 $ 550 $ - $ - 2020/21 $ 178 $ 480 $ 658 $ 558.00 $ 558 $ - $ - 2021/22 $ 180 $ 487 $ 668 $ 567.00 $ 567 $ - $ - 2022/23 $ 183 $ 495 $ 678 $ 575.00 $ 575 $ - $ - 2023/24 $ 186 $ 502 $ 688 $ 584.00 $ 584 $ - $ - 2024/25 $ 188 $ 510 $ 698 $ 593.00 $ 593 $ - $ - 2025/26 $ 191 $ 517 $ 709 $ 601.00 $ 601 $ - $ - 2026/27 $ 194 $ 525 $ 719 $ 610.00 $ 610 $ - $ - 2027/28 $ 197 $ 533 $ 730 $ 620.00 $ 620 $ - $ - 2028/29 $ 200 $ 541 $ 741 $ 643.00 $ 643 $ - $ - TOTALS $ 1,873 $ 5,063 $ 6,935 $ 5,901 $ 5,901 $ - $ -

City of Port Lincoln Infrastructure & Asset Management Plan
Document Control Version 1.0
54 | P a g e
PART 4
KERBING AND
FOOTPATHS

City of Port Lincoln Infrastructure & Asset Management Plan
Document Control Version 1.0
55 | P a g e
11. FOOTPATHS & KERBING INFRASTRUCTURE ASSETS
Table 26: Footpaths and Kerbing Assets Key Data KEY DATA DETAILS Total Replacement Cost at 30 June 2018 $36,064,895 Total Written Down Value at 30 June 2018
$27,754,137
Replacement Cost until 2028-29 $301,465 Average Useful Life (assets ≤ 2028-29) 31 years Maintenance Programs On-going maintenance projected at approximately
$112k per year
Chart 9: Footpath Assets and Kerbing Assets Current vs Written Down Value
$36,064,895
$27,754,137
$-
$5,000,000
$10,000,000
$15,000,000
$20,000,000
$25,000,000
$30,000,000
$35,000,000
$40,000,000
Footpaths & Kerbing at 30 June 2018
Replacement Cost
Written Down Value

City of Port Lincoln Infrastructure & Asset Management Plan
Document Control Version 1.0
56 | P a g e
11.1. Standard Service Levels
Table 27: Standard Service Levels Footways (Footpath) Assets Key Performance Measure Level of Service Performance Measure
Process Performance Target
COMMUNITY LEVELS OF SERVICE
Customer Satisfaction Ensure footways meet all needs of pedestrians
Complaints on suitability/accessibility of existing footpaths
< 2 per month
Customer Satisfaction At least one paved footpath in every street in residential areas
% of streets in residential area served by one paved footpath
Working towards long term target of 100% coverage in residential areas as per the Footpath Priority Plan.
Safety All paved footways free from trip hazards
Reactive requests for maintenance
< 5 per month
Safety Provide footways suitable for demographics and managed on risk priority
Number of loss assessment claims
Zero successful claims per year.
Safety Provide a footpath network free from trip hazards
Annual inspection of footpaths
Annual inspection.
TECHNICAL LEVELS OF SERVICE
Condition Tripping hazards >30mm to be addressed
Number of trip hazards. All identified hazards > 30mm assessed within two weeks.
Design and Capacity Pram ramps provided at all road crossing points to current standards
Annual inspection All new footpaths to have pram ramps and working towards all existing footpaths to have pram ramps as per the Footpath Priority Plan.
Performance Provide maintenance services in a cost-effective manner
Compliance with budget.
Within budget

City of Port Lincoln Infrastructure & Asset Management Plan
Document Control Version 1.0
57 | P a g e
11.2. Maintenance Expenditure - Footpaths
The following table shows maintenance expenditure trends for footpath infrastructure assets. The reported figures have been based on template 7-7-T8 with percentages to be applied for future maintenance forecasts.
Reactive 12%
Cyclic 2%
Planned 86%
Table 28: Footpath Maintenance Expenditure Trends
Footpaths Maintenance Expenditure Year Reactive Cyclic Subtotal Planned Total 2016/17 $ 5,166 $ 861 $ 6,027 $ 37,020 $ 43,047
2017/18 $ 5,905 $ 984 $ 6,889 $ 42,318 $ 49,207 2018/19 $ 5,400 $ 900 $ 6,300 $ 38,700 $ 45,000 TOTAL $ 16,471 $ 2,745 $ 19,216 $ 118,038 $ 137,254
Average $ 6,405 $ 39,346 $ 45,751
Chart 10: Footpaths Assets Maintenance Expenditure Trend Forecasts
$6 $7 $6 $6 $6 $6 $7 $7 $7 $7 $7 $7 $7
$37 $42
$38 $39 $39 $40 $40 $41 $42 $42 $43 $44 $44
$-
$10
$20
$30
$40
$50
$60
16/17 17/18 18/19 19/20 20/21 21/22 22/23 23/24 24/25 25/26 26/27 27/28 28/29
Expenditure on Maintenance of Assets $'000
Reactive & Cyclic Planned
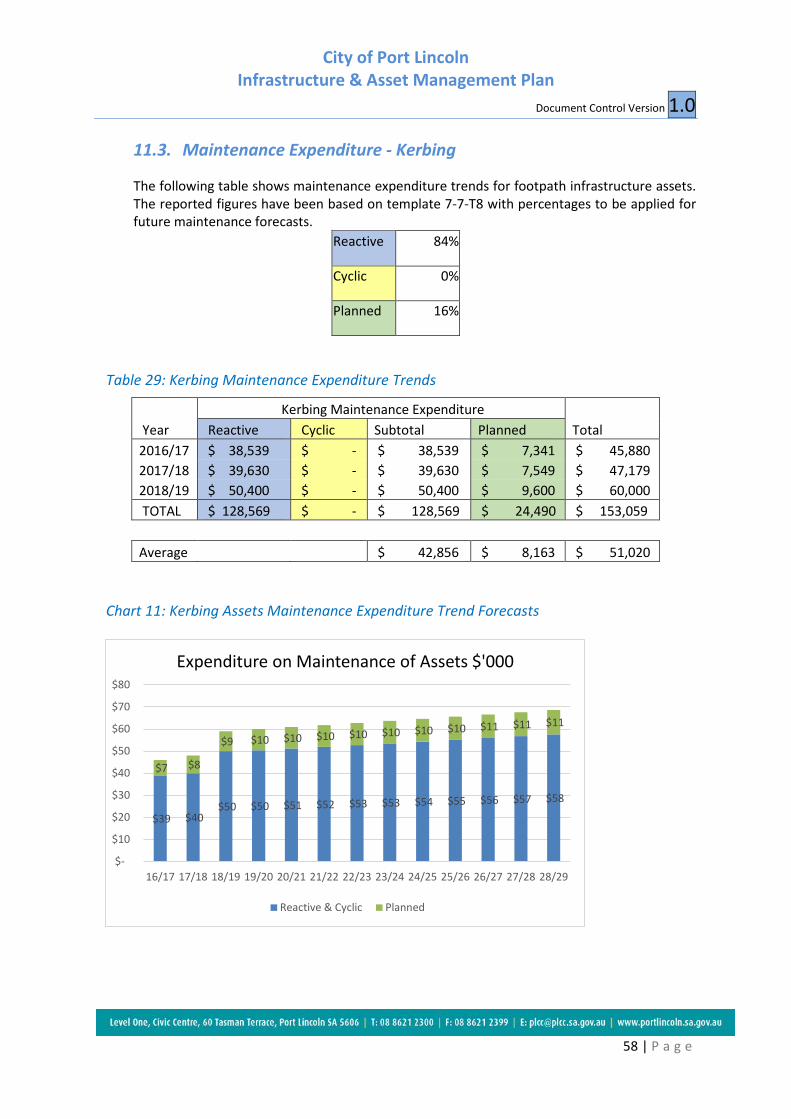
City of Port Lincoln Infrastructure & Asset Management Plan
Document Control Version 1.0
58 | P a g e
11.3. Maintenance Expenditure - Kerbing
The following table shows maintenance expenditure trends for footpath infrastructure assets. The reported figures have been based on template 7-7-T8 with percentages to be applied for future maintenance forecasts.
Reactive 84%
Cyclic 0%
Planned 16%
Table 29: Kerbing Maintenance Expenditure Trends
Chart 11: Kerbing Assets Maintenance Expenditure Trend Forecasts
$39 $40 $50 $50 $51 $52 $53 $53 $54 $55 $56 $57 $58
$7 $8
$9 $10 $10 $10 $10 $10 $10 $10 $11 $11 $11
$-
$10
$20
$30
$40
$50
$60
$70
$80
16/17 17/18 18/19 19/20 20/21 21/22 22/23 23/24 24/25 25/26 26/27 27/28 28/29
Expenditure on Maintenance of Assets $'000
Reactive & Cyclic Planned
Kerbing Maintenance Expenditure Year Reactive Cyclic Subtotal Planned Total 2016/17 $ 38,539 $ - $ 38,539 $ 7,341 $ 45,880 2017/18 $ 39,630 $ - $ 39,630 $ 7,549 $ 47,179 2018/19 $ 50,400 $ - $ 50,400 $ 9,600 $ 60,000 TOTAL $ 128,569 $ - $ 128,569 $ 24,490 $ 153,059
Average $ 42,856 $ 8,163 $ 51,020

City of Port Lincoln Infrastructure & Asset Management Plan
Document Control Version 1.0
59 | P a g e
11.4. Capital Projects and Forecasts
The following table shows expenditure in renewal of assets as extracted from Council’s Annual Financial Statements Note 7 data. The labelling of assets as ‘renewed’ or ‘upgraded’ has been inconsistent in recent years and a concerted effort to classify capital works projects in the correct category is being applied.
Table 30: Footpath and Kerbing Assets Capital Expenditure
RENEWAL EXPENDITURE FINANCIAL YEAR 2016-17 2017-18 2018-19* TOTAL Footpath $14,000 $0 $0 $14,000 Kerbing $0 $0 $0 $0 TOTAL $14,000 $0 $0 $14,000 AVERAGE RENEWAL EXPENDITURE PER ANNUM $4,667
NEW AND UPGRADED EXPENDITURE
FINANCIAL YEAR 2016-17 2017-18 2018-19* TOTAL Footpath $63,021 $108,590 $250,758 $422,369 Kerbing $17,157 $18,013 $5,100 $40,270 TOTAL $80,178 $126,603 $255,858 $462,639 AVERAGE NEW & UPGRADED EXPENDITURE PER ANNUM $154,213
*Note: March 2019 Budget Review figures

City of Port Lincoln Infrastructure & Asset Management Plan
Document Control Version 1.0
60 | P a g e
Table 31: Kerbing and Footpath Assets Maintenance, Planned and Projected Expenditure
$'000 Reactive &
Cyclic Expenditure
Planned Expenditure
Total Maintenance Expenditure
Projected Renewal
Expenditure
Renewal Expenditure included in
LTFP 2020-29
Shortfall Disposal
2016/17 $ 45 $ 44 $ 89 N/A N/A N/A N/A 2017/18 $ 47 $ 50 $ 97 N/A N/A N/A N/A 2018/19 $ 56 $ 47 $ 103 N/A N/A N/A N/A 2019/20 $ 57 $ 48 $ 105 $ 14 $ 14 $ - $ - 2020/21 $ 58 $ 49 $ 107 $ 57 $ 57 $ - $ - 2021/22 $ 58 $ 50 $ 108 $ - $ - $ - $ - 2022/23 $ 59 $ 51 $ 110 $ 35 $ 35 $ - $ - 2023/24 $ 60 $ 51 $ 111 $ 12 $ 12 $ - $ - 2024/25 $ 61 $ 52 $ 113 $ 103 $ 103 $ - $ - 2025/26 $ 62 $ 53 $ 115 $ - $ - $ - $ - 2026/27 $ 63 $ 54 $ 117 $ 11 $ 11 $ - $ - 2027/28 $ 64 $ 54 $ 118 $ - $ - $ - $ - 2028/29 $ 65 $ 55 $ 120 $ 93 $ 93 $ - $ - TOTALS $ 607 $ 517 $ 1,124 $ 325 $ 325 $ - $ -

City of Port Lincoln Infrastructure & Asset Management Plan
Document Control Version 1.0
61 | P a g e
PART 5
STORMWATER

City of Port Lincoln Infrastructure & Asset Management Plan
Document Control Version 1.0
62 | P a g e
12. STORMWATER INFRASTRUCTURE ASSETS
Table 32: Stormwater Infrastructure Assets Key Data KEY DATA DETAILS Total Replacement Cost at 30 June 2018 $25,199,974 Total Written Down Value at 30 June 2018
$16,879,387
Replacement Cost until 2028-29 $6362,172 Average Useful Life (assets ≤ 2028-29) 39 years Maintenance Programs On-going maintenance projected at approximately
$111k per year
Chart 12: Stormwater Assets Current vs Written Down Value
$25,199,974
$16,879,387
$-
$5,000,000
$10,000,000
$15,000,000
$20,000,000
$25,000,000
$30,000,000
Stormwater at 30 June 2018
Replacement Cost
Written Down Value

City of Port Lincoln Infrastructure & Asset Management Plan
Document Control Version 1.0
63 | P a g e
12.1. Standard Service Levels
Table 33: Standard Service Levels Stormwater Assets Key Performance Measure Level of Service Performance Measure Process Performance Target
COMMUNITY LEVELS OF SERVICE
Customer Satisfaction
Ensure stormwater system meets community expectations
Customer requests relating to property flooding
Less than 10p.a.
Safety Ensure road networks are not compromised and are serviceable during rainfall
No. of roads considered hazardous during an ‘average’ winter rain event
Less than 12 customer complaints p.a.
Safety Provide safe and suitable stormwater drainage systems free of hazards
No. of reported claims Nil
TECHNICAL LEVELS OF SERVICE
Condition Periodic visual assessment to determine condition
CCTV Inspection Condition inspection every five years.
Condition Periodic visual assessment to determine condition
Routine clearing of drains
100% of known flood risk areas cleaned each year
Design and Capacity Provide appropriate stormwater drainage system to meet user requirements
Average age of pipe network
<5% of network is within 10 years of the end of it’s useful life.
Design and Capacity Ensure stormwater system has appropriate design capacity
% of pipe/culvert network with capacity below 1 in 5 event.
Working towards 0%.

City of Port Lincoln Infrastructure & Asset Management Plan
Document Control Version 1.0
64 | P a g e
Table 34: Standard Service Levels Stormwater Assets Key Performance Measure Level of Service Performance Measure
Process Performance Target
COMMUNITY LEVELS OF SERVICE
Function Pump system works when required.
Number of pump faults. Less than 5p.a.
Safety Pump stations are not accessible to the public.
Reported incidents of illegal access
Nil
TECHNICAL LEVELS OF SERVICE
Condition Carry out regular maintenance
Repairs completed within agreed response times
100% of works within target times.
Function System operates when required
Number of pump breakdowns
Nil
Safety Required safety devices are fully operational
Number of reported injuries in cleaning and maintenance
Nil

City of Port Lincoln Infrastructure & Asset Management Plan
Document Control Version 1.0
65 | P a g e
12.2. Maintenance Expenditure
The following table shows maintenance expenditure trends for Stormwater assets. The reported figures have been based on template 7-7-T8 with percentages to be applied for future maintenance forecasts.
Reactive 85%
Cyclic 2%
Planned 13%
Table 35: Stormwater Maintenance Expenditure Trends
Stormwater Maintenance Expenditure Year Reactive Cyclic Subtotal Planned Total 2016/17 $ 139,887 $ 3,291 $ 143,178 $ 21,394 $ 164,572 2017/18 $ 88,343 $ 2,079 $ 90,422 $ 13,511 $ 103,933 2018/19 $ 87,500 $ 2,200 $ 89,700 $ 14,300 $ 104,000 TOTAL $ 315,730 $ 7,570 $ 323,300 $ 49,205 $ 372,505
Average $ 107,767 $ 16,402 $ 124,168
Chart 13: Stormwater Maintenance Expenditure Trend Forecasts
$143
$90 $90 $90 $92 $93 $95 $96 $97 $99 $100 $102 $103
$21
$14 $14 $14 $14 $14 $14 $14 $15 $15 $15 $15 $15
$-
$20
$40
$60
$80
$100
$120
$140
$160
$180
16/17 17/18 18/19 19/20 20/21 21/22 22/23 23/24 24/25 25/26 26/27 27/28 28/29
Expenditure on Maintenance of Assets $'000
Reactive & Cyclic Planned

City of Port Lincoln Infrastructure & Asset Management Plan
Document Control Version 1.0
66 | P a g e
12.3. Capital Projects and Forecasts
The following table shows expenditure in renewal of assets as extracted from Council’s Annual Financial Statements Note 7 data.
Table 36: Stormwater Capital Expenditure
RENEWAL EXPENDITURE FINANCIAL YEAR 2016-17 2017-18 2018-19* TOTAL Stormwater $17,893 $0 $0 $17,893 AVERAGE RENEWAL EXPENDITURE PER ANNUM $5,964
NEW AND UPGRADED EXPENDITURE
FINANCIAL YEAR 2016-17 2017-18 2018-19* TOTAL Stormwater $487,638 $792,825 $1,820,503 $3,100,966 AVERAGE NEW & UPGRADED EXPENDITURE PER ANNUM $1,033,655
*Note: March 2019 Budget Review figures

City of Port Lincoln Infrastructure & Asset Management Plan
Document Control Version 1.0
67 | P a g e
Table 37: Stormwater Infrastructure Maintenance, Planned and Projected Expenditure
$'000 Reactive &
Cyclic Expenditure
Planned Expenditure
Total Maintenance Expenditure
Projected Renewal
Expenditure
Renewal Expenditure included in
LTFP 2020-29
Shortfall Disposal
2016/17 $ 143 $ 21 $ 164 N/A N/A N/A N/A 2017/18 $ 90 $ 14 $ 104 N/A N/A N/A N/A 2018/19 $ 90 $ 14 $ 104 N/A N/A N/A N/A 2019/20 $ 90 $ 14 $ 104 $ 3 $ 3 $ - $ - 2020/21 $ 92 $ 14 $ 106 $ - $ - $ - $ - 2021/22 $ 93 $ 14 $ 107 $ - $ - $ - $ - 2022/23 $ 95 $ 14 $ 109 $ 308 $ 308 $ - $ - 2023/24 $ 96 $ 14 $ 110 $ - $ - $ - $ - 2024/25 $ 97 $ 15 $ 112 $ - $ - $ - $ - 2025/26 $ 99 $ 15 $ 114 $ 27 $ 27 $ - $ - 2026/27 $ 100 $ 15 $ 115 $ - $ - $ - $ - 2027/28 $ 102 $ 15 $ 117 $ 30 $ 30 $ - $ - 2028/29 $ 103 $ 15 $ 119 $ 15 $ 15 $ - $ - TOTALS $ 968 $ 145 $ 1,113 $ 383 $ 383 $ - $ -

City of Port Lincoln Infrastructure & Asset Management Plan
Document Control Version 1.0
68 | P a g e
PART 6
PLANT & EQUIPMENT

City of Port Lincoln Infrastructure & Asset Management Plan
Document Control Version 1.0
69 | P a g e
13. PLANT AND EQUIPMENT ASSETS
Table 38: Plant & Equipment Assets Key Data KEY DATA DETAILS Total Replacement Cost at 30 June 2018 $2,138,198 Total Written Down Value at 30 June 2018
$990,776
Replacement Cost until 2028-29 $1,940,500 Average Useful Life (assets ≤ 2028-29) Maintenance Programs On-going maintenance projected at approximately
$122k per year
Chart 14: Plant & Equipment Assets Current vs Written Down Value
$2,138,198
$990,776
$-
$500,000
$1,000,000
$1,500,000
$2,000,000
$2,500,000
Plant & Equipment at 30 June 2018
Replacement Cost
Written Down Value
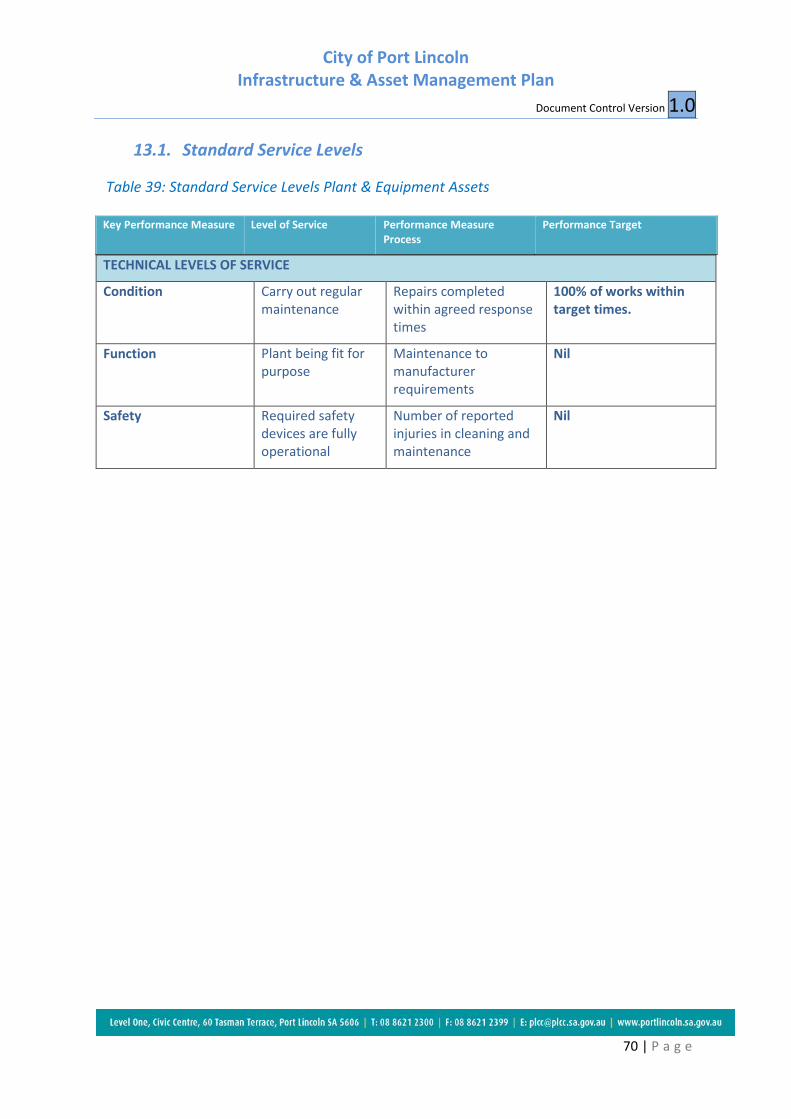
City of Port Lincoln Infrastructure & Asset Management Plan
Document Control Version 1.0
70 | P a g e
13.1. Standard Service Levels
Table 39: Standard Service Levels Plant & Equipment Assets Key Performance Measure Level of Service Performance Measure
Process Performance Target
TECHNICAL LEVELS OF SERVICE
Condition Carry out regular maintenance
Repairs completed within agreed response times
100% of works within target times.
Function Plant being fit for purpose
Maintenance to manufacturer requirements
Nil
Safety Required safety devices are fully operational
Number of reported injuries in cleaning and maintenance
Nil

City of Port Lincoln Infrastructure & Asset Management Plan
Document Control Version 1.0
71 | P a g e
13.2. Maintenance Expenditure
The following table shows maintenance expenditure trends for Plant & Equipment assets. The reported figures have been based on template 7-7-T8 with percentages to be applied for future maintenance forecasts.
Reactive 30%
Cyclic 50%
Planned 20%
Table 40: Plant & Equipment Maintenance Expenditure Trends
Plant Maintenance Expenditure Year Reactive Cyclic Subtotal Planned Total 2016/17 $ 14,165 $ 52,170 $ 66,335 $ 32,499 $ 98,834 2017/18 $ 28,176 $ 47,695 $ 75,871 $ 9,453 $ 85,324 2018/19 $ 34,014 $ 51,903 $ 85,917 $ 21,718 $ 107,635 TOTAL $ 76,355 $ 151,768 $ 228,123 $ 63,670 $ 291,793
Average $ 76,041 $ 21,223 $ 97,264
Chart 15: Plant & Equipment Maintenance Expenditure Trend Forecasts
$66 $76 $86 $91 $93 $94 $95 $97 $98 $100 $101 $103 $104
$33 $8
$22 $23 $23 $23 $24 $24 $25 $25 $25 $26 $26
$-
$20
$40
$60
$80
$100
$120
$140
16/17 17/18 18/19 19/20 20/21 21/22 22/23 23/24 24/25 25/26 26/27 27/28 28/29
Expenditure on Maintenance of Assets $'000
Reactive & Cyclic Planned
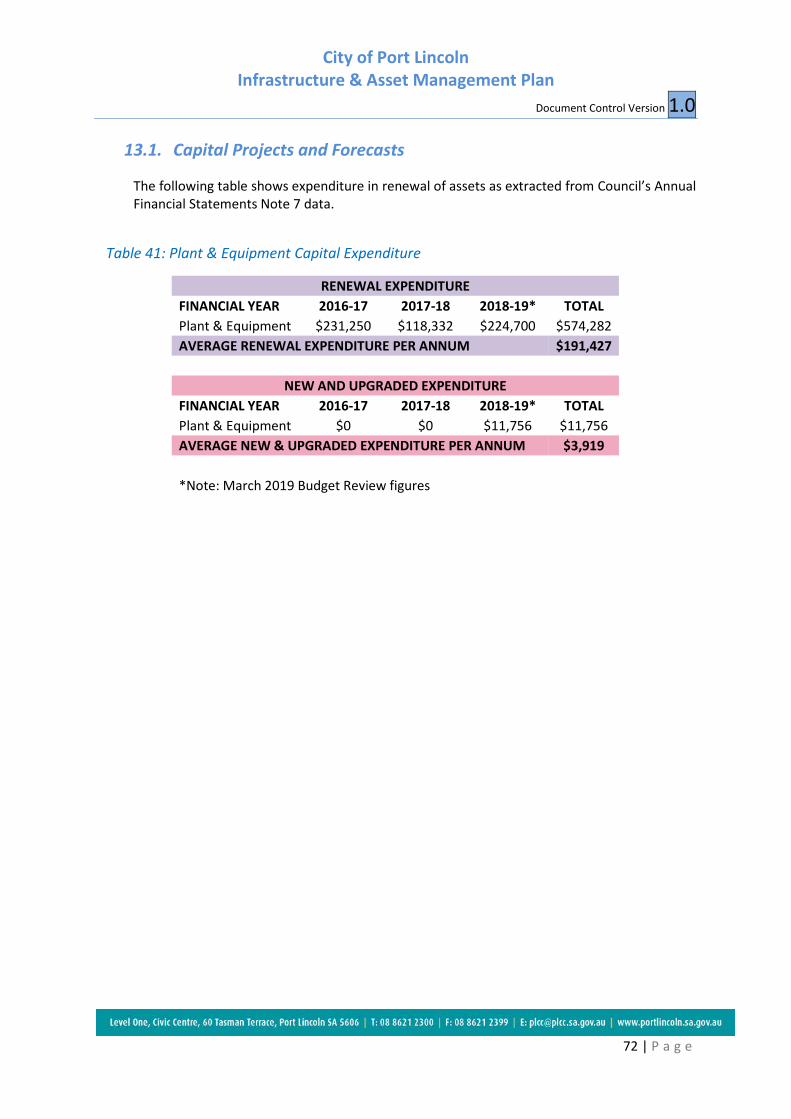
City of Port Lincoln Infrastructure & Asset Management Plan
Document Control Version 1.0
72 | P a g e
13.1. Capital Projects and Forecasts
The following table shows expenditure in renewal of assets as extracted from Council’s Annual Financial Statements Note 7 data.
Table 41: Plant & Equipment Capital Expenditure
RENEWAL EXPENDITURE FINANCIAL YEAR 2016-17 2017-18 2018-19* TOTAL Plant & Equipment $231,250 $118,332 $224,700 $574,282 AVERAGE RENEWAL EXPENDITURE PER ANNUM $191,427
NEW AND UPGRADED EXPENDITURE
FINANCIAL YEAR 2016-17 2017-18 2018-19* TOTAL Plant & Equipment $0 $0 $11,756 $11,756 AVERAGE NEW & UPGRADED EXPENDITURE PER ANNUM $3,919
*Note: March 2019 Budget Review figures
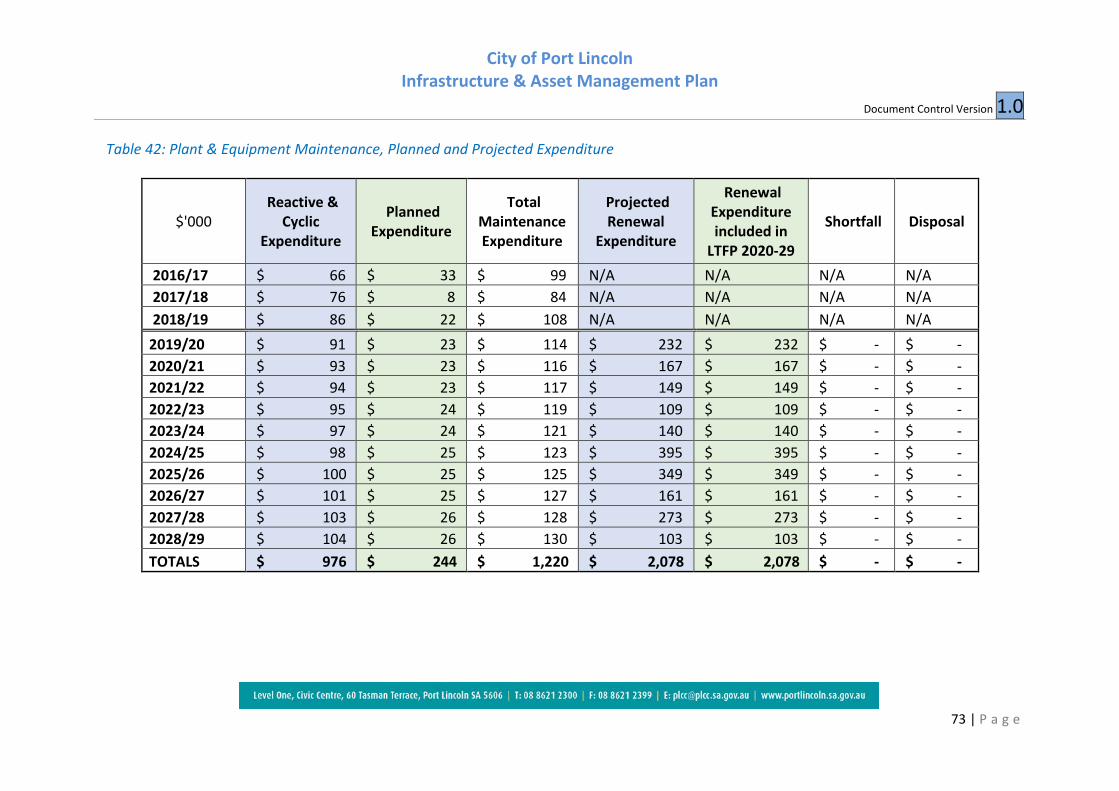
City of Port Lincoln Infrastructure & Asset Management Plan
Document Control Version 1.0
73 | P a g e
Table 42: Plant & Equipment Maintenance, Planned and Projected Expenditure
$'000 Reactive &
Cyclic Expenditure
Planned Expenditure
Total Maintenance Expenditure
Projected Renewal
Expenditure
Renewal Expenditure included in
LTFP 2020-29
Shortfall Disposal
2016/17 $ 66 $ 33 $ 99 N/A N/A N/A N/A 2017/18 $ 76 $ 8 $ 84 N/A N/A N/A N/A 2018/19 $ 86 $ 22 $ 108 N/A N/A N/A N/A 2019/20 $ 91 $ 23 $ 114 $ 232 $ 232 $ - $ - 2020/21 $ 93 $ 23 $ 116 $ 167 $ 167 $ - $ - 2021/22 $ 94 $ 23 $ 117 $ 149 $ 149 $ - $ - 2022/23 $ 95 $ 24 $ 119 $ 109 $ 109 $ - $ - 2023/24 $ 97 $ 24 $ 121 $ 140 $ 140 $ - $ - 2024/25 $ 98 $ 25 $ 123 $ 395 $ 395 $ - $ - 2025/26 $ 100 $ 25 $ 125 $ 349 $ 349 $ - $ - 2026/27 $ 101 $ 25 $ 127 $ 161 $ 161 $ - $ - 2027/28 $ 103 $ 26 $ 128 $ 273 $ 273 $ - $ - 2028/29 $ 104 $ 26 $ 130 $ 103 $ 103 $ - $ - TOTALS $ 976 $ 244 $ 1,220 $ 2,078 $ 2,078 $ - $ -

City of Port Lincoln Infrastructure & Asset Management Plan
Document Control Version 1.0
74 | P a g e
PART 7
FURNITURE &
FITTINGS

City of Port Lincoln Infrastructure & Asset Management Plan
Document Control Version 1.0
75 | P a g e
14. FURNITURE & FITTINGS ASSETS
Table 43: Furniture & Fittings Assets Key Data KEY DATA DETAILS Total Replacement Cost at 30 June 2018 $3,093,131 Total Written Down Value at 30 June 2018
$1,062,033
Replacement Cost until 2028-29 $1,551,539 Average Useful Life (assets ≤ 2027-28) 8 Maintenance Programs Ongoing maintenance projected at approximately $54k
per year Chart 16: Furniture & Fittings Assets Current vs Written Down Value
$3,093,131
$1,062,033
$-
$500,000
$1,000,000
$1,500,000
$2,000,000
$2,500,000
$3,000,000
$3,500,000
Furniture & Fittings at 30 June 2018
Replacement Cost
Written Down Value

City of Port Lincoln Infrastructure & Asset Management Plan
Document Control Version 1.0
76 | P a g e
14.1. Standard Service Levels
Table 44: Standard Service Levels Furniture & Fittings Assets Key Performance Measure Level of Service Performance Measure
Process Performance Target
TECHNICAL LEVELS OF SERVICE
Condition Carry out regular maintenance
Repairs completed within agreed response times
100% of works within target times.
Function Being fit for purpose
Maintenance to manufacturer requirements
Nil
Safety Required safety devices are fully operational
Number of reported injuries in cleaning and maintenance
Nil

City of Port Lincoln Infrastructure & Asset Management Plan
Document Control Version 1.0
77 | P a g e
14.2. Maintenance Expenditure
The following table shows maintenance expenditure trends for Furniture & Fittings assets. The reported figures have been based on template 7-7-T8 with percentages to be applied for future maintenance forecasts.
Reactive 19%
Cyclic 27%
Planned 55%
Table 45: Furniture & Fittings Maintenance Expenditure Trends
Furniture Maintenance Expenditure Year Reactive Cyclic Subtotal Planned Total 2016/17 $ 5,191 $ 16,602 $ 21,793 $ 29,574 $ 51,367 2017/18 $ 4,121 $ 3,352 $ 7,473 $ 14,907 $ 22,380 2018/19 $ 7,740 $ 4,412 $ 12,152 $ 5,607 $ 17,759 TOTAL $ 17,052 $ 24,366 $ 41,418 $ 50,088 $ 91,506
Average $ 13,806 $ 16,696 $ 30,502
Chart 17: Furniture & Fittings Maintenance Expenditure Trend Forecasts
$22
$7 $12 $23 $23 $24 $24 $24 $25 $25 $26 $26 $26
$30
$15 $5
$28 $28 $28 $29 $29 $30 $30 $31 $31 $31
$-
$10
$20
$30
$40
$50
$60
$70
16/17 17/18 18/19 19/20 20/21 21/22 22/23 23/24 24/25 25/26 26/27 27/28 28/29
Expenditure on Maintenance of Assets $'000
Reactive & Cyclic Planned

City of Port Lincoln Infrastructure & Asset Management Plan
Document Control Version 1.0
78 | P a g e
14.3. Capital Projects and Forecasts
The following table shows expenditure in renewal of assets as extracted from Council’s Annual Financial Statements Note 7 data
Table 46: Furniture & Fittings Capital Expenditure
RENEWAL EXPENDITURE
FINANCIAL YEAR 2016-17 2017-18 2018-19* TOTAL
Furniture & Fittings $ 23,038 $ 210,171 $ 15,000 $248,209
AVERAGE RENEWAL EXPENDITURE PER ANNUM $82,736
NEW AND UPGRADED EXPENDITURE
FINANCIAL YEAR 2016-17 2017-18 2018-19* TOTAL Furniture & Fittings $ - $ 172,316 $ 24,000 $196,316 AVERAGE NEW & UPGRADED EXPENDITURE PER ANNUM $65,439
*Note: March 2019 Budget Review figures

City of Port Lincoln Infrastructure & Asset Management Plan
Document Control Version 1.0
79 | P a g e
Table 47: Furniture & Fittings Maintenance, Planned and Projected Expenditure
$'000 Reactive &
Cyclic Expenditure
Planned Expenditure
Total Maintenance Expenditure
Projected Renewal
Expenditure
Renewal Expenditure included in
LTFP 2020-29
Shortfall Disposal
2016/17 $ 22 $ 30 $ 52 N/A N/A N/A N/A 2017/18 $ 7 $ 15 $ 22 N/A N/A N/A N/A 2018/19 $ 12 $ 5 $ 17 N/A N/A N/A N/A 2019/20 $ 23 $ 28 $ 51 $ 31 $ 31 $ - $ - 2020/21 $ 23 $ 28 $ 51 $ 196 $ 196 $ - $ - 2021/22 $ 24 $ 28 $ 52 $ 457 $ 457 $ - $ - 2022/23 $ 24 $ 29 $ 53 $ 95 $ 95 $ - $ - 2023/24 $ 24 $ 29 $ 54 $ 21 $ 21 $ - $ - 2024/25 $ 25 $ 30 $ 54 $ 136 $ 136 $ - $ - 2025/26 $ 25 $ 30 $ 55 $ 126 $ 126 $ - $ - 2026/27 $ 26 $ 31 $ 56 $ 503 $ 503 $ - $ - 2027/28 $ 26 $ 31 $ 57 $ 16 $ 16 $ - $ - 2028/29 $ 26 $ 31 $ 58 $ 74 $ 74 $ - $ - TOTALS $ 246 $ 294 $ 540 $ 1,655 $ 1,655 $ - $ -

City of Port Lincoln Infrastructure & Asset Management Plan
Document Control Version 1.0
80 | P a g e
APPENDIX A

City of Port Lincoln Infrastructure & Asset Management Plan
Document Control Version 1.0
81 | P a g e
Appendix A: Summary of Capital Renewal Expenditure Data from Council's Asset Register as at 1 July 2018 (excluding non renewal assets)
2019/20 2020/21 2021/22 2022/23 2023/24 2024/25 2025/26 2026/27 2027/28 2028/29 TOTAL Part 1 - Buildings
193
505
1,803
885
477
366
458
585
274
1,480
7,024 OCA - Asset past useful life for
renewal
-
267
-
-
-
-
-
-
-
-
267 Part 2 - OCA
19
175
33
373
-
861
1,190
226
312
127
3,316 Part 2 - Filtration
-
-
120
63
10
26
-
82
352
-
653
19
442
153
436
10
887
1,190
308
664
127
4,236 Reseal Amount
550
550
550
550
550
550
550
550
550
550
5,500 Road Base
-
-
-
-
-
-
-
-
-
12
12 Part 3 - Roads & Bridges
550
550
550
550
550
550
550
550
550
562
5,512 Part 4 - Footpaths
14
10
-
33
11
90
-
10
-
53
221 Part 4 - Kerbing
-
46
-
-
-
6
-
-
-
28
81
14
56
-
33
11
96
-
10
-
81
301 Part 5 - Stormwater
3
-
-
295
-
-
25
-
27
13
362 Part 6 - Plant & Equipment
232
165
145
104
132
367
319
145
242
90
1,941 Part 7 - Furniture & Fittings
31
193
444
91
20
126
115
453
15
65
1,552
1,041
1,911
3,095
2,394
1,200
2,393
2,656
2,051
1,772
2,417
20,928

City of Port Lincoln Infrastructure & Asset Management Plan
Document Control Version 1.0
82 | P a g e
INDEX
TABLES: Table 1: Asset valuations by Asset Class as at 30 June 2018 Table 2: Ten Year Projected Capital Renewal Expenditure vs. Planned Capital Renewal Expenditure Table 3: Type of Assets covered by this Plan Table 4: Condition Rate Scale Table 5: Roads, Building and Other Community Assets Condition Rating by Category – Asset Register Table 6: Asset Register Values for Assets and Infrastructure, 2018 Table 7: Buildings Key Data and Information Table 8: Standard Service Levels – Building Assets Table 9: Maintenance Expenditure Trends Table 10: Buildings Capital Expenditure Table 11: Building Assets Maintenance, Planned and Projected Expenditure Table 12: Other Community Assets and Filtration Assets Key Data Table 13: Standard Service Levels Other Community Assets Table 14: Standard Service Levels Water Reuse (Filtration) Assets Table 15: Maintenance Expenditure Trends Table 16: Maintenance Expenditure Trends (Filtration) Table 17: Other Community Assets and Filtration Assets Capital Expenditure Table 18: Other Community Assets and Filtration Assets, Maintenance, Planned and Projected
Expenditure Table 19: Roads and Bridges Assets Key Data Table 20: Standard Service Levels Unsealed Road Assets Table 21: Standard Service Levels Sealed Road Assets – Collectors/Distributor & Heavy Vehicle Routes –
High Volume AADT>2000Vpd Table 22: Standard Service Levels Sealed Road Assets Low Volume Residential <2000Vpd Table 23: Road Transport Maintenance Expenditure Trends Table 24: Road and Bridges Assets Capital Expenditure Table 25: Road Transport Assets Maintenance, Planned and Projected Expenditure Table 26: Footpaths and Kerbing Assets Key Data Table 27: Standard Service Levels Footways (Footpath) Assets Table 28: Footpath Maintenance Expenditure Trends Table 29: Kerbing Maintenance Expenditure Trends Table 30: Footpath and Kerbing Assets Capital Expenditure Table 31: Kerbing and Footpath Assets Maintenance, Planned and Projected Expenditure Table 32: Stormwater Infrastructure Assets Key Data Table 33: Standard Service Levels Stormwater Assets Table 34: Standard Service Levels Stormwater Assets Table 35: Stormwater Maintenance Expenditure Trends Table 36: Stormwater Capital Expenditure Table 37: Stormwater Infrastructure Maintenance, Planned and Projected Expenditure Table 38: Plant & Equipment Assets Key Data Table 39: Standard Service Levels Plant & Equipment Assets Table 40: Plant & Equipment Maintenance Expenditure Trends Table 41: Plant & Equipment Capital Expenditure Table 42: Plant & Equipment Maintenance, Planned and Projected Expenditure Table 43: Furniture & Fittings Assets Key Data Table 44: Standard Service Levels Furniture & Fittings Assets Table 45: Furniture & Fittings Maintenance Expenditure Trend Forecasts Table 46: Furniture & Fittings Capital Expenditure Table 47: Furniture & Fittings Maintenance, Planned and Projected Expenditure

City of Port Lincoln Infrastructure & Asset Management Plan
Document Control Version 1.0
83 | P a g e
CHARTS: Chart 1: Graphical Representation of Table 5 Chart 2: Current value of buildings against written down value of buildings. Chart 3: Building Assets Maintenance Expenditure Chart 4: Other Community Assets and Filtration Assets Current vs Written Down Values Chart 5: Other Community Assets Maintenance Expenditure Trend Forecasts Chart 6: Filtration Asset Maintenance Expenditure Trend Forecasts Chart 7: Road Assets and Bridge Assets Current and Written Down Value Chart 8: Road Asset and Bridges Assets Maintenance Expenditure Forecasts Chart 9: Footpath Assets and Kerbing Assets Current vs Written Down Value Chart 10: Footpaths Assets Maintenance Expenditure Trend Forecasts Chart 11: Kerbing Assets Maintenance Expenditure Trend Forecasts Chart 12: Stormwater Assets Current vs Written Down Value Chart 13: Stormwater Maintenance Expenditure Trend Forecasts Chart 14: Plant & Equipment Assets Current vs Written Down Value Chart 15: Plant & Equipment Expenditure Trend Forecasts Chart 16: Furniture & Fittings Assets Current vs Written Down Value Chart 17: Furniture & Fittings Expenditure Trend Forecasts

City of Port Lincoln Infrastructure & Asset Management Plan
Document Control Version 1.0
84 | P a g e
City of Port Lincoln
Council Administration Office
Level One, Civic Centre
60 Tasman Tce Port Lincoln SA 5606
T: 8621 2300 F: 8621 2399
Web: www.portlincoln.sa.gov.au