|CITY OF PERRIS|2076|AUDIT|FINANCIAL · PDF fileThis report consists of management’s...
199
Comprehensive Annual Financial Report For the Year Ended June 30, 2017
Transcript of |CITY OF PERRIS|2076|AUDIT|FINANCIAL · PDF fileThis report consists of management’s...
Comprehensive Annual Financial Report
For the Year Ended June 30, 2017

CITY OF PERRIS, CALIFORNIA
COMPREHENSIVE ANNUAL FINANCIAL REPORT
Year Ended June 30, 2017
PREPARED BY THE FINANCE DEPARTMENT


INTRODUCTORY SECTION
City of Perris, California

City of Perris, California Comprehensive Annual Financial Report
Year Ended June 30, 2017
i
TABLE OF CONTENTS PAGE I INTRODUCTORY SECTION Table of Contents i - ii Letter of Transmittal iii - vii Directory of Officials viii Organizational Chart ix Map of the City of Perris, Southern California x Government Finance Officers Association Certificate of Achievement xi II FINANCIAL SECTION Independent Auditors’ Report 1 - 3 Management’s Discussion and Analysis 4 - 14 Basic Financial Statements: Government-wide Financial Statements: Statement of Net Position 15 Statement of Activities 16 - 17 Fund Financial Statements: Balance Sheet - Governmental Funds 18 - 19 Reconciliation of the Balance Sheet of Governmental Funds to the Statement of Net Position
20
Statement of Revenues, Expenditures and Changes in Fund Balances - Governmental Funds
21 - 22
Reconciliation of the Statement of Revenues, Expenditures and Changes in Fund Balances of Governmental Funds to the Statement of Activities
23
Statement of Net Position - Proprietary Funds 24 - 25 Statement of Revenues, Expenses and Changes in Net Position - Proprietary Funds 26 - 27 Statement of Cash Flows - Proprietary Funds 28 - 31 Statement of Fiduciary Net Position 32 Statement of Changes in Fiduciary Net Position 33 Notes to Financial Statements 34 - 85 Required Supplementary Information: Schedule of the City’s Proportionate Share of the Net Pension Liability CalPERS Pension Plan
86
Schedule of Contributions CalPERS Pension Plan
87
Schedule of Funding Progress for CPRHP 88 Schedule of Revenues, Expenditures and Changes in Fund Balances - Budget and Actual: General Fund
89
Road and Bridge Benefit District Special Revenue Fund 90 Notes to Required Supplementary Information 91
City of Perris, California Comprehensive Annual Financial Report
Year Ended June 30, 2017
ii
TABLE OF CONTENTS - Continued
PAGE Supplementary Schedules: Non-major Governmental Funds: Combining Balance Sheet 92 - 96 Combining Statement of Revenues, Expenditures and Changes in Fund Balances 97 - 101 Schedule of Revenues, Expenditures and Changes in Fund Balances - Budget and Actual: Major Debt Service Funds 102 - 103 Major Capital Project Funds 104 - 105 Non-major Special Revenue Funds 106 - 120 Non-major Capital Project Funds 121 - 125 Agency Funds Combining Statement of Fiduciary Assets and Liabilities - Agency Funds 126 Statement of Changes of Fiduciary Assets and Liabilities - City Cash Trust Fund 127 Statement of Changes in Fiduciary Assets and Liabilities - Community Facilities Districts 128 Statement of Changes in Fiduciary Assets and Liabilities - Assessment District 86-1 129 Statement of Changes in Fiduciary Assets and Liabilities - Total Agency Funds 130 III STATISTICAL SECTION Net Position by Component 131 - 132 Change in Net Position 133 - 136 Fund Balances of Governmental Funds 137 - 138 Changes in Fund Balance of Governmental Funds 139 - 140 Governmental Activities Tax Revenues by Source 141 Taxable Sales by Category 142 - 143 Assessed Value and Estimated Actual Value of Taxable Property 144 Direct and Overlapping Property Tax Rates 145 Principal Property Taxpayers 146 Property Tax Levies and Collections 147 Ratios of Outstanding Debt by Type 148 Direct and Overlapping Governmental Activities Debt 149 Legal Debt Margin Information 150 Pledged Revenue Coverage 151 - 152 Demographic and Economic Statistics 153 Principal Employers 154 Full-time Equivalent City Government Employees by Function 155 Operating Indicators by Function 156 - 157 Capital Assets Statistics by Function 158 - 159

iii
December 29, 2017 Honorable Mayor, Members of the City Council, and Citizens of the City of Perris: It is with great pleasure that I submit the City of Perris’ Comprehensive Annual Financial Report (CAFR) for the fiscal year ended June 30, 2017. This report consists of management’s representations concerning the finances of the City. Consequently, management assumes full responsibility for the completeness and reliability of the information contained in this report. To provide a reasonable basis for making these representations, management has established a comprehensive internal control framework designed both to protect the City’s assets from loss, theft, or misuse, and to compile sufficient reliable information for the preparation of the City’s financial statements in conformity with accounting principles generally accepted in the United States of America. Because the cost of internal controls should not outweigh their benefits, the internal controls have been designed to provide reasonable rather than absolute assurance that the financial statements will be free of material misstatement. Teaman, Ramirez & Smith, Inc. Certified Public Accountants, have issued an unmodified opinion on the City of Perris’ financial statements for the fiscal year ended June 30, 2017. The opinion states that the financial statements are presented fairly and are in conformity with generally accepted accounting principles. The independent auditors’ report is presented as the first component of the financial section of this report. Management has provided an overall analysis of the financial statements in the form of Management’s Discussion and Analysis (MD&A). This letter of transmittal is designed to complement the MD&A and should be read in conjunction with it. The City of Perris’ MD&A can be found immediately following the report of the independent auditors. Profile of the City of Perris Perris (“City”) covers approximately 33 square miles and is located 70 miles east of Los Angeles and 20 miles southwest of Riverside. The City offers a temperate Mediterranean climate with warm dry summers and mild winters. Demographically, Perris is an ethnically diverse community of approximately 75,739 residents, of which 73% are of Hispanic or Latino origin, and the average household size is 4.5 people. The City of Perris was incorporated in 1911 under the general laws of the State of California and enjoys all the rights and privileges afforded to a general law city. The City is governed by a five-member City Council under the Mayor-Council-Manager form of government. Policy-making and legislative authority are vested in the City Council, consisting of the Mayor and four other members. Council Members are elected at-large and do not represent any one district or area within the City. The Mayor and Council Members are elected to a four-year term and the City does not have term limits. Regular elections are conducted in November of even numbered years. The City Council is responsible, among other things, for passing ordinances, adopting the budget, appointing committees, and hiring the City Manager and City Attorney. The City Manager is responsible for carrying out the policy direction of the City Council and for overseeing the day-to-day operations of the government.
City of Perris C a l i f o r n i a

iv
The City of Perris employs approximately 103 employees. Services include construction and maintenance of City streets, economic development, parks, recreation and senior services, animal control, disaster preparation, as well as community development activities such as urban planning, building permits and inspections, and business licensing. The City contracts for police and fire protection and water and waste water services. The Perris Public Financing Authority, Utility Authority, Housing Authority, Joint Powers Authority, and Community Economic Development Corporation are also included as an integral part of the City’s financial statements. Local Economy The median household income for Perris residents is approximately $51,315 and many of those in the labor force commute to cities and counties outside the City. In recent years, the City has focused its efforts on attracting local businesses and jobs, as well as providing more eateries for its residents. Corky’s Homestyle Kitchen & Bakery opened in April of 2017. Perris Marketplace, Perris’ newest expanding shopping center, recently welcomed Starbucks, Chipotle, Pieology, Popeyes, Waba Grill, Yogurtland, Jimmy John’s, Starbucks, Pacific Dental, Verizon, T-Mobile, Great Clips, and America’s Best Contacts and Eyeglasses. Upcoming Perris Marketplace establishments include Dickey’s Barbecue, Baskin Robbins, Daniel’s Jewelers, and Jamba Juice. At the Nuevo Crossings and Perris Spectrum Shopping Centers the residents will soon see Smart and Final Fresh and Fitness 19, respectively. Perris is seeing its commercial and industrial sectors grow as well with Home Depot and Wayfair expanding their existing operations to additional warehouses and TechStyle (JustFab.com) bringing a new distribution operation to the City. Retail sales tax is a principal revenue source for the City. Sales tax revenues for the 2nd quarter of 2017 increased 4.8% in total over the same quarter of 2016. Local retail sales, the primary source of sales tax revenues, continued to experience strong growth shown by the local point of sale activity increasing by 11%. The new dining options in the City have led to higher receipts in casual dining and quick service restaurants. Overall, restaurants and hotel sales tax revenues are up 17% from 2016 and the new establishments listed above will continue to contribute to that increase. Fuel/service stations and business/industry were the top two producers of sales tax revenues in the past, but in 2017 fuel/service stations was surpassed by building/construction sales tax receipts. Business/industry and building/construction represents 50% of the total sales tax revenue generated within the City. The local housing market continues to grow as the local region capitalizes on its affordability advantage compared to other parts of Southern California. In Perris, the median home price increased 10% from 2016 and 5%-7% of all single family residential transactions in Riverside County were in the City. Home construction in the region has increased to accommodate population growth, but concerns of affordability and low inventory may slow growth in the long term. New home construction in Perris is increasing slowly as new tracts from national developers like KB, Richmond American, and Pulte Homes begin construction. Currently, there are over 6,000 planned residential units in the various stages of the building permit approval process and completion of these units is expected to occur over the next 5 years. The City’s number of new residential building permits issued increased from 214 in the prior fiscal year to 300 in 2017. The number of new commercial building permits issued remained the same as the prior fiscal year at 29 in 2017. Distribution and manufacturing companies are attracted to the area because of the land availability for large buildings and employment gains in the region are driving the continued demand for industrial space. As of the third quarter of 2017, Perris’ total inventory square footage of industrial buildings was approximately 20.9 million. Of that inventory, 4.1% was vacant and when compared to 6 major cities in the East Inland Empire (Colton, Corona/Norco, Moreno Valley, Redlands, Riverside, San Bernardino), Perris had the lowest vacancy rate. One other economic indicator, unemployment, has continued to drop from 18.6% five years ago to just 8.8% in 2017. This statistic indicates the local economy is growing and producing jobs even as housing sales are only seeing slow, but steady, growth.

v
Long Range Financial Planning Budget Process. The City’s five-year capital improvement program is adopted annually and the operating budget is adopted bi-annually, both by the City Council. Strong financial reporting practices, conservative budgeting, and vigilance over costs have resulted in the City maintaining a healthy financial position. The process for budgeting the City’s capital improvement program begins near the end of each calendar year. Department heads and project managers, through the goals set by the City Council, update existing project budgets and propose new projects for the City Council to approve. The primary goal of the City’s capital improvement program is to utilize existing resources efficiently with minimal burden to the general fund. The process for the bi-annual operating budget begins early in spring every two years. Each department head develops goals and objectives based upon the City’s strategic planning session, the community’s concerns, and/or City Council direction. The goals are reflected in the two-year budget proposed for approval by the City Council. The overall budget is developed for the community’s best interest and takes into consideration available resources. Continuing to do more with less and maintaining service levels have been the primary budget objectives in prior years. The present focus is to expand services as the economy improves and as new or increasing resources become available. A mid-year update is provided to the City Council at the halfway mark of each of the two fiscal years and throughout the budget cycle supplemental appropriations are made to the adopted budget as necessary and as approved by the City Council. General Fund Reserve. On August 30, 2011 the City Council adopted a fund balance policy in compliance with GASB Statement No. 54, which committed fund balance in an amount equal to 35% of general fund expenditures. These reserves are committed for use specifically in the case of unforeseen circumstances in addition to $3.4 million for disaster preparedness, $1.3 million for vehicle and equipment replacement, $1.3 million for major capital improvements and repairs, and $200,000 as a budgetary contingency. Relevant Financial Policies Budget Policies and Practices. Budgets are adopted by the City Council. As provided by City ordinance, the Director of Finance is responsible for preparing the budget and for its implementation after adoption. All appropriations lapse at year end, except those approved for carryover. The City Manager has the legal authority to transfer budget appropriations within a fund. Changes to total fund appropriations require the majority approval of the City Council. The City maintains budgetary controls to ensure compliance with legal provisions specified in the budget adopted by the City Council. The level of budgetary control (the level at which expenditures cannot legally exceed the appropriated amount) is established at the fund level. One-Time Revenue. It is the policy of the City to budget conservatively and in line with economic indicators of the various revenues it receives in its general fund. It is general practice for the City to realize one-time revenue in the general fund, however it is not customary for one-time revenue to be budgeted until receipt of the revenue is guaranteed. This is usually accomplished by a budget amendment that occurs during the fiscal year the revenue is to be received. Cash Management Policies and Practices. The City Council annually adopts an investment policy with the intention of minimizing credit and market risks while maintaining a competitive yield on its investments. During 2016-17, the City’s funds were invested primarily in demand deposit accounts, the State of California Local Agency Investment Fund (LAIF), U.S. Government Treasuries, Agency securities, and commercial paper. Investments are made from pooled cash of all funds and earnings are allocated to the various funds in proportion to their relative cash book balance. Pension and Other Post-Employment Benefits. The City of Perris has a defined benefit pension plan that provides retirement and disability benefits, annual cost of living adjustments, and death benefits to plan members and beneficiaries. The City contributes to the California Public Employees Retirement System (CalPERS), an agent, multiple-employer public employees defined benefit pension plan for its regular employees.

vi
The City also provides post-retirement health care benefits for its retired employees according to the employee agreements for each of the employee groups. As of the end of the current fiscal year, there were 50 retired employees receiving these benefits, which are financed on a pay-as-you-go basis. Additional information regarding the City of Perris’ pension arrangements and post-employment benefits can be found in the notes to the financial statements. Major Initiatives The City plans to maintain an ongoing commitment to several major initiatives as described below. City Infrastructure and other Capital Improvements. The five-year capital improvement program has committed in excess of $75 million in funding for transportation, parks, community facilities, and other projects. Public Safety. More General Fund dollars are devoted to public safety than for any other purpose. The City’s general fund budget has set aside over $20 million for Police and Fire services. In 2017, the City Council approved the expansion of Police services to include an additional 10 hours of patrol each day, a new traffic officer position, a new community service officer position, and the addition of a K-9. Parks. The City experienced a slowdown of park development impact fees throughout the economic downturn. The challenge for the department in recent years has been generating new revenue sources to maintain existing parks, facilities, and programs to keep up with the increased demand for more affordable recreational activities. A slowed housing market contributed to the decreased impact fees collected for residential development, but the department implemented a new park impact fee in late 2017 that would be paid by industrial developers. The new revenue source will help mitigate the shortage of revenues to service the City’s parks as the total parkland acreage is now approximately 274. The voters of Perris also approved a tax on cannabis dispensaries that the Perris City Council has directed staff to collect for use by this department as the development of new recreation facilities are completed in the City. There are other funded or developer conditioned park projects that are anticipated to begin or continue construction in the next year including the following: - Monument Ranch Park - Enchanted Heights Park Improvements - Perris Valley Storm Channel Trail - San Jacinto River Trail Economic Development. The Perris Community Economic Development Corporation (the “Perris CEDC”) was incorporated on April 16, 2014 and formed as a nonprofit public benefit corporation under Section 501(c)(3) of the Internal Revenue Code. The specific and primary purpose of this corporation is to provide physical, economic, and educational development and revitalization efforts resulting in expanded employment, economic prosperity, and business and housing opportunities for businesses and residents. The Perris CEDC is attracting new businesses to the downtown area, namely, the numerous establishments mentioned above at the Perris Marketplace, Nuevo Crossings, and Spectrum shopping centers. The Perris CEDC will continue revitalizing the Perris community with a commercial façade program, restaurant incentive program, and restoring the Perris Theatre. Financial Management. The City is committed to the highest standards of financial management and stewardship of public resources. On July 14, 2015 the City Council approved a five-year contract with Tyler Technologies to provide a virtual software platform commonly known in the municipal community as “MUNIS.” Implementation of the project began in September 2015 and is projected to continue through early 2018 in order to migrate the general ledger, accounts payable, accounts receivable, payroll, cashiering, and business licensing modules from the City’s old accounting system. Currently, the first phase of implementation, the general ledger module, is complete. Phases two and three, for payroll and the remaining modules, are in the final stages of implementation as of December 2017. The goal of the new software is to provide one location for all financial data and a virtual platform for employees, residents and customers, and department heads to view

vii
documents and budgetary data in real time, submit timesheets electronically, and utilize electronic workflow to strengthen internal control. Financial Transparency. The City Council has committed to expanding financial transparency concurrent with the implementation of MUNIS described above. In October 2017, the City announced the newest addition to the City’s online financial transparency portal: OpenGov. The OpenGov platform serves as a medium between the public and City financial information. It is an interactive platform that allows users to drill down and search for specific financial data online. The data is updated each month directly from the MUNIS software, essentially allowing any user to view real-time information about the financial activity of the City. Awards and Acknowledgements The Government Finance Officers Association of the United States and Canada awarded the twelfth Certificate of Achievement for Excellence in Financial Reporting to the City of Perris for its Comprehensive Annual Financial Report (CAFR) for the fiscal year ending June 30, 2016. In order to be awarded the Certificate of Achievement, a government must publish an easily readable and efficiently organized CAFR. This report must satisfy both generally accepted accounting principles and applicable legal requirements. A Certificate of Achievement is valid for a period of one year only. The City believes that the current CAFR continues to meet the Certificate of Achievement Program’s requirements and we are submitting it to the GFOA to determine its eligibility for another certificate. Completion of the City’s Comprehensive Annual Financial Report is a significant accomplishment. Special recognition is due to the entire staff of the Finance Department. Special thanks go to Stephen Ajobiewe, Finance Manager, and Adrienne Morales, Accountant I. Only through the efforts and cooperation of all of the Finance Department staff, was the preparation of this document possible. I would also like to express my appreciation to the Mayor, the City Council, and the City Manager for their interest and support in planning and conducting the financial activities of the City in a responsible and progressive manner. Sincerely,
Jennifer Erwin Director of Finance
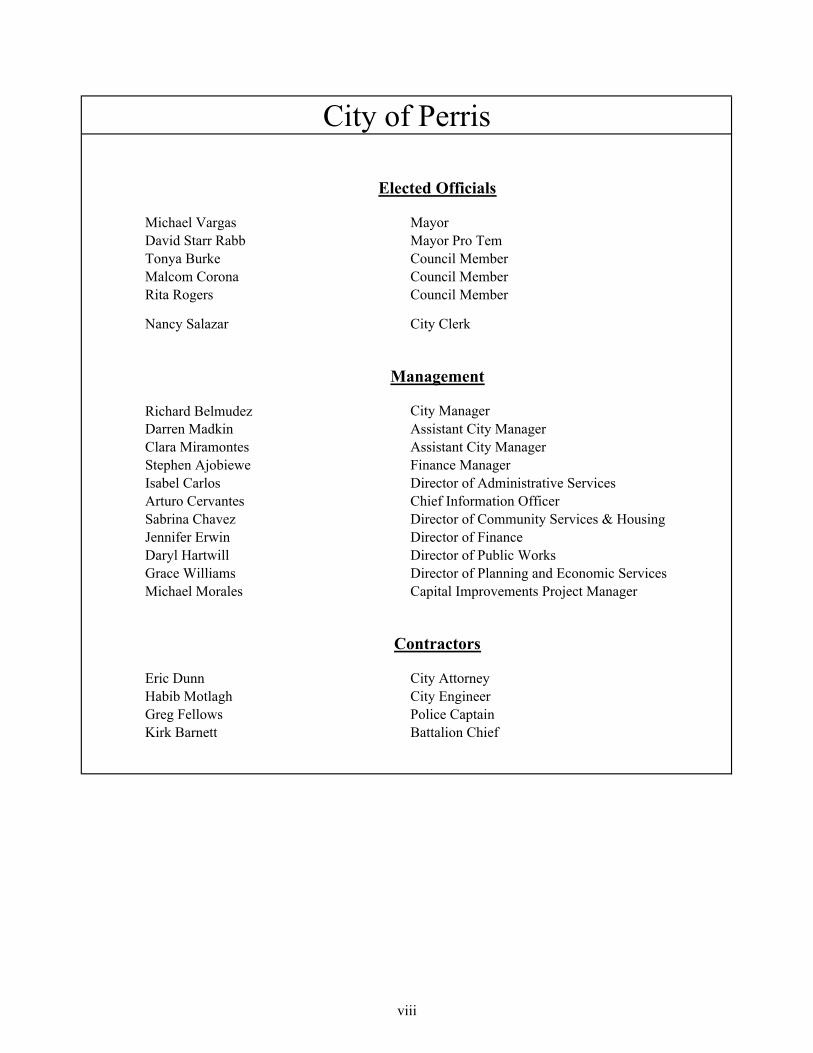
Michael Vargas MayorDavid Starr Rabb Mayor Pro TemTonya Burke Council MemberMalcom Corona Council MemberRita Rogers Council Member
Nancy Salazar City Clerk
Richard Belmudez City ManagerDarren Madkin Assistant City ManagerClara Miramontes Assistant City ManagerStephen Ajobiewe Finance ManagerIsabel Carlos Director of Administrative ServicesArturo Cervantes Chief Information OfficerSabrina Chavez Director of Community Services & HousingJennifer Erwin Director of FinanceDaryl Hartwill Director of Public WorksGrace Williams Director of Planning and Economic ServicesMichael Morales Capital Improvements Project Manager
Eric Dunn City AttorneyHabib Motlagh City EngineerGreg Fellows Police CaptainKirk Barnett Battalion Chief
Elected Officials
Management
Contractors
City of Perris
viii

City Council
City Manager
Richard Belmudez
Assistant City Manager
Darren Madkin
Public Works/Parks/Special Districts
Daryl Hartwill
Housing Division/Community Services
Sabrina Chavez
Information Technology Arturo Cervantes
Assistant City Manager Clara Miramontes
Planning/Economic Development
Dr. Grace Williams
Code Enforcement Department Robert Trejo
Building Department
Finance Department
Jennifer Erwin
Human Resources/Risk Management/Administrative
Services
Isabel Carlos
Police Services Captain Greg Fellows
Fire Services Chief Kirk Barnett
City Engineer
Habib Motlagh
City Attorney
Eric Dunn
City Clerk
Nancy Salazar
ix
City of Perris, CA
x

xi

This page intentionally left blank

FINANCIAL SECTION
City of Perris, California

INDEPENDENT AUDITORS’ REPORT Honorable Mayor and Members of The City Council City of Perris Perris, California Report on Financial Statements We have audited the accompanying financial statements of the governmental activities, the business-type activities, each major fund, and the aggregate remaining fund information of the City of Perris, California (the “City”) as of and for the year ended June 30, 2017, and the related notes to the financial statements, which collectively comprise the City’s basic financial statements as listed in the table of contents. Management’s Responsibility for the Financial Statements
Management is responsible for the preparation and fair presentation of these financial statements in accordance with accounting principles generally accepted in the United States of America; this includes the design, implementation, and maintenance of internal control relevant to the preparation and fair presentation of financial statements that are free from material misstatement, whether due to fraud or error. Auditor’s Responsibility
Our responsibility is to express opinions on these financial statements based on our audit. We conducted our audit in accordance with auditing standards generally accepted in the United States of America and the standards applicable to financial audits contained in Government Auditing Standards, issued by the Comptroller General of the United States. Those standards require that we plan and perform the audit to obtain reasonable assurance whether the financial statements are free from material misstatement. An audit involves performing procedures to obtain audit evidence about the amounts and disclosures in the financial statements. The procedures selected depend on the auditor’s judgment, including the assessment of the risks of material misstatement of the financial statements, whether due to fraud or error. In making those risk assessments, the auditor considers internal control relevant to the City’s preparation and fair presentation of the financial statements in order to design audit procedures that are appropriate in the circumstances, but not for the purpose of expressing an opinion on the effectiveness of the City’s internal control. Accordingly, we express no such opinion. An audit also includes evaluating the appropriateness of accounting policies used and the reasonableness of significant accounting estimates made by management, as well as evaluating the overall presentation of the financial statements. We believe that the audit evidence we have obtained is sufficient and appropriate to provide a basis for our audit opinions. Opinions
In our opinion, the financial statements referred to above present fairly, in all material respects, the respective financial position of the governmental activities, the business-type activities, each major fund, and the aggregate remaining fund information of the City of Perris, California, as of June 30, 2017, and the respective changes in financial position, and, where applicable, cash flows thereof for the year then ended in accordance with accounting principles generally accepted in the United States of America.
Richard A. Teaman, CPA David M. Ramirez, CPA Javier H. Carrillo, CPA Bryan Daugherty, CPA Joshua Calhoun, CPA 4201 Brockton Ave Suite 100 Riverside CA 92501 951.274.9500 951.274.7828 FAX www.trscpas.com

2
Emphasis of Matter Change in Accounting Principle
As described in Note 1 to the basic financial statements, the City adopted the provisions of Governmental Accounting
Standards Board Statements No. 82, Pension Issues - An Amendment of GASB No. 67, No. 68, and No. 73, and No. 80,
Blending Requirements for Certain Component Units - An Amendment of GASB Statement No. 14. Our opinion is not
modified with respect to these matters.
Other Matters
Required Supplementary Information
Accounting principles generally accepted in the United States of America require that the management’s discussion and
analysis and required supplementary information on pages 4 through 14 and 86 through 91 be presented to supplement the
basic financial statements. Such information, although not a part of the basic financial statements, is required by the
Governmental Accounting Standards Board, who considers it to be an essential part of financial reporting for placing the
basic financial statements in an appropriate operational, economic, or historical context. We have applied certain limited
procedures to the required supplementary information in accordance with auditing standards generally accepted in the United
States of America, which consisted of inquiries of management about the methods of preparing the information and
comparing the information for consistency with management’s responses to our inquiries, the basic financial statements, and
other knowledge we obtained during our audit of the basic financial statements. We do not express an opinion or provide
any assurance on the information because the limited procedures do not provide us with sufficient evidence to express an
opinion or provide any assurance.
Other Information
Our audit was conducted for the purpose of forming opinions on the financial statements that collectively comprise the City’s
basic financial statements. The introductory section, supplementary section, and statistical section are presented for purposes
of additional analysis and are not a required part of the basic financial statements.
The supplementary section is the responsibility of management and was derived from and relate directly to the underlying
accounting and other records used to prepare the basic financial statements. Such information has been subjected to the
auditing procedures applied in the audit of the basic financial statements and certain additional procedures, including
comparing and reconciling such information directly to the underlying accounting and other records used to prepare the basic
financial statements or to the basic financial statements themselves, and other additional procedures in accordance with
auditing standards generally accepted in the United States of America. In our opinion, the supplementary section is fairly
stated in all material respects in relation to the basic financial statements as a whole.
The introductory and statistical sections have not been subjected to the auditing procedures applied in the audit of the basic
financial statements and, accordingly, we do not express an opinion or provide any assurance on them.

3
Other Reporting Required by Government Auditing Standards
In accordance with Government Auditing Standards, we have also issued our report dated December 29, 2017, on our
consideration of the City’s internal control over financial reporting and on our tests of its compliance with certain provisions
of laws, regulations, contracts, and grant agreements and other matters. The purpose of that report is to describe the scope of
our testing of internal control over financial reporting and compliance and the results of that testing, and not to provide an
opinion on internal control over financial reporting or on compliance. That report is an integral part of an audit performed in
accordance with Government Auditing Standards in considering the City’s internal control over financial reporting and
compliance.
Riverside, California
December 29, 2017

This page intentionally left blank

CITY OF PERRIS Management’s Discussion and Analysis
4
This section of the City’s Annual Financial Report provides a narrative overview and analysis of the financial activities of the City for the fiscal year ended June 30, 2017. We encourage readers to consider the information presented here in conjunction with City’s financial statements beginning on page 15. All amounts are expressed in thousands of dollars. Financial Highlights The following are some key financial highlights for the fiscal year: The City’s assets exceeded its liabilities, deferred inflows and outflows of resources (net position) at the close of the
most recent fiscal year by $290,094. Of this amount, $5,349 (unrestricted net position) may be used to meet the government’s ongoing obligations to citizens and creditors.
The City’s total net position increased by $26,263 for fiscal year 2016-2017. As of June 30, 2017, the City’s governmental funds reported combined fund balances of $273,542, an increase of
$11,498 in comparison with the prior year. At the end of the current fiscal year, assigned fund balance for the General Fund was $6,200 and unassigned fund
balance for the General Fund was $40, totaling $6,240 or 18.4% of general fund total expenditures. The City of Perris’ total long-term debt increased by $905 for fiscal year 2016-2017. Overview of the Financial Statements This discussion and analysis are intended to serve as an introduction to the City of Perris’ basic financial statements. The City’s basic financial statements are comprised of three components: 1) government-wide financial statements 2) fund financial statements and 3) notes to basic financial statements. This report also contains supplementary information in addition to the basic financial statements.
S u m m a ry D e ta il
C o m p o n e n ts o f th e F in a n c ia l S e c tio n
M a n a g e m e n t'sD is c u s s io n
a n dA n a ly s is
B a s icF in a n c ia l
S ta te m e n ts
R e q u ire dS u p p le m e n ta ry
In fo rm a tio n
G o v e rn m e n t-w id eF in a n c ia l
S ta te m e n ts
F u n dF in a n c ia l
S ta te m e n ts
N o te s to th e
F in a n c ia lS ta te m e n ts

CITY OF PERRIS Management’s Discussion and Analysis
5
Overview of the Financial Statements (Continued) Government-wide Financial Statements. The government-wide financial statements are designed to provide readers with a broad overview of the City’s finances, in a manner similar to a private-sector business. The statement of net position presents information on all of the City’s assets, liabilities and deferred inflows and outflows of resources, with the difference between reported as net position. Over time, increases or decreases in net position may serve as a useful indicator of whether the financial position of the City is improving or deteriorating. The statement of activities presents information showing how the City’s net position changed during the most recent fiscal year. All changes in net position are reported as soon as the underlying event giving rise to the change occurs, regardless of the timing of related cash flows. Thus, revenues and expenses are reported in this statement for some items that will only affect cash flows in future fiscal periods (e.g., uncollected taxes and earned but unused vacation leave). Both of the government-wide financial statements distinguish functions of the City that are principally supported by taxes and intergovernmental revenues (governmental activities) from other functions that are intended to recover all or a significant portion of their costs through user fees and charges (business-type activities). The governmental activities of the City of Perris include general government, public safety, public works, parks and recreation, and interest on long-term debt. The business-type activities of the City of Perris include a Water, Sewer, Public Utility Authority, Housing Authority, the Perris CEDC, and Solid Waste Utility. The government-wide financial statements include not only the City itself (known as the primary government), but also four legally separate entities, the Perris Public Utility Authority, the Perris Public Financing Authority, the Perris Joint Powers Authority, and the Perris Community Economic Development Corporation. The Perris Redevelopment Agency has since been abolished and its activities are reported as a separate Successor Agency trust fund. The City is financially accountable for these entities and financial information for these blended component units is reported within the financial information presented for the primary government itself. The government-wide financial statements can be found beginning on page 15 of this report. Fund Financial Statements. A fund is a grouping of related accounts that is used to maintain control over resources that have been segregated for specific activities or objectives. The City, like other state and local governments, uses fund accounting to ensure and demonstrate compliance with finance-related legal requirements. All of the City’s funds can be divided into three categories: governmental funds, proprietary funds, and fiduciary funds. Governmental Funds. Governmental funds are used to account for essentially the same functions reported as governmental activities in the government-wide financial statements. However, unlike the government-wide financial statements, governmental fund financial statements focus on near-term inflows and outflows of spendable resources, as well as on balances of spendable resources available at the end of the fiscal year. Such information may be useful in evaluating the City’s near-term financial requirements. Because the focus of governmental funds is narrower than that of the government-wide financial statements, it is useful to compare the information presented for governmental funds with similar information presented for governmental activities in the government-wide financial statements. By doing so, readers may better understand the long-term impact of the City’s near-term financial decisions. Both the governmental fund balance sheet and the governmental fund statement of revenue, expenditures and changes in fund balances provide a reconciliation to facilitate this comparison between governmental funds and governmental activities.

CITY OF PERRIS Management’s Discussion and Analysis
6
Overview of the Financial Statements (Continued) The City maintains twenty-six individual governmental funds. Information is presented separately in the governmental fund balance sheet and in the governmental fund statement of revenues, expenditures and changes in fund balances for the General Fund, Public Financing Authority Debt Service Fund, Joint Powers Authority Debt Service Fund, Road and Bridge Benefit District Special Revenue Fund, Storm Drain Development Capital Project Fund, and the Capital Improvements Projects Fund, each of which are considered to be major funds. Data from the other twenty-one governmental funds are combined into a single, aggregated presentation. Individual fund data for each of these non-major governmental funds is provided in the form of combining statements in the non-major governmental funds supplementary information section of this report. The City adopts an annual appropriated budget for its general fund. A budgetary comparison statement has been provided for the general fund to demonstrate compliance with this budget. The governmental fund financial statements can be found beginning on page 18 of this report. Proprietary Funds. The City maintains several proprietary funds. Enterprise funds are used to report the same functions presented as business-type activities in the government-wide financial statements. The City uses enterprise funds to account for the Water Enterprise Fund, Sewer Enterprise Fund, Public Utility Authority Enterprise Fund, the Solid Waste Enterprise Fund, the Housing Authority and Perris CEDC. Proprietary funds provide the same type of information as the government-wide financial statements, only in more detail. The proprietary fund financial statements provide separate information for the maintenance and operation of the City’s water services, sewer services, and solid waste disposal services, as well as information on housing services and programs for residents and activities of the Perris CEDC. These are considered to be Business-type activities in the government-wide financial statements. The Water Enterprise, Sewer Enterprise, Public Utility Authority Enterprise, Solid Waste Enterprise, Housing Authority and Perris CEDC Funds are aggregated and presented as a major fund in the financial statements. The basic proprietary fund financial statements can be found beginning on page 24 of this report. Fiduciary Funds. Fiduciary funds are used to account for resources held for the benefit of parties outside the government. Fiduciary funds are not reflected in the government-wide financial statements because the resources of those funds are not available to support the City of Perris’ own programs. The accounting used for fiduciary funds is much like that used for proprietary funds. The basic fiduciary fund financial statements can be found beginning on page 32 of this report. Notes to the Basic Financial Statements. The notes to the basic financial statements provide additional information that is essential to a full understanding of the data provided in the government-wide and fund financial statements. The notes to the basic financial statements can be found beginning on page 34 of this report. Other Information. In addition to the basic financial statements and accompanying notes, this report also presents certain required supplementary information concerning the City’s progress in funding its obligation to provide pension benefits and other post-employment benefits to its employees and a comparison of budgeted to actual results for the general and major special revenue funds. Required supplementary information can be found beginning on page 86 of this report. The combining statements referred to earlier in connection with non-major governmental funds are presented immediately following the required supplementary information. Combining and individual fund statements and schedules can be found beginning on page 92 of this report. Government-wide Financial Analysis As noted earlier, net position may serve over time as a useful indicator of the City’s financial position. In this case, the City’s assets and deferred outflows exceeded liabilities and deferred inflows by $290,094 at June 30, 2017. A summary of the government-wide statement of net position at June 30, 2017 follows:

CITY OF PERRIS Management’s Discussion and Analysis
7
2017 2016 2017 2016 2017 2016Assets:Current and other assets 323,235$ 310,024$ 9,187$ 4,081$ 332,422$ 314,105$ Capital assets 180,330 174,117 20,051 17,876 200,381 191,993
Total assets 503,565 484,141 29,238 21,957 532,803 506,098
Deferred Outflows of Resources:Pension Related Items 3,301 1,921 141 88 3,442 2,009 Deferred Charge on Refunding (Net) 1,143 1,207 1,143 1,207
Total deferredoutflows of resources 4,444 3,128 141 88 4,585 3,216
Liabilities:Current and other liabilities 48,111 47,653 2,214 1,554 50,325 49,207 Long-term liabilities 190,223 189,263 5,833 5,888 196,056 195,151
Total liabilities 238,334 236,916 8,047 7,442 246,381 244,358
Deferred Inflows of Resources:Pension Related Items 884 1,077 29 48 913 1,125
Total deferredinflows of resources 884 1,077 29 48 913 1,125
Net position:Net Investment in Capital Assets 180,330 174,117 14,755 12,534 195,085 186,651 Restricted 79,514 62,636 10,146 5,757 89,660 68,393 Unrestricted 8,947 12,523 (3,598) (3,736) 5,349 8,787
Total net position 268,791$ 249,276$ 21,303$ 14,555$ 290,094$ 263,831$
City of Perris Net PositionJune 30, 2017
TotalActivitiesActivitiesGovernmental Business-type
CITY OF PERRIS Management’s Discussion and Analysis
8
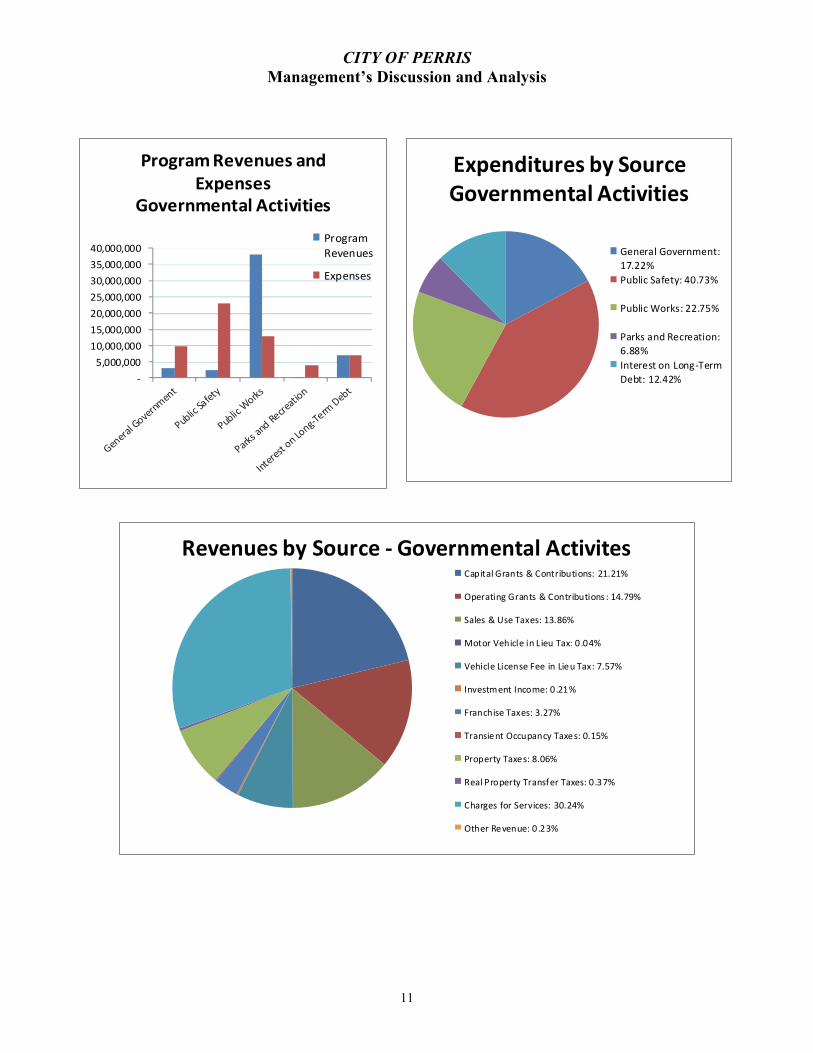
The largest portion of the City’s net position ($195,084) reflects its investment in capital assets (e.g., land, buildings, infrastructure, machinery and equipment, etc.), less any related debt used to acquire those assets that are still outstanding. The City uses these capital assets to provide services to citizens; consequently, these assets are not available for future spending. Although the City’s investment in its capital assets is reported net of related debt, it should be noted that the resources needed to repay this debt must be provided from other sources, since the capital assets themselves cannot be used to liquidate these liabilities. In the current fiscal year, business-type activities’ investment in capital assets changed slightly by $2,221 which arose from the slight change in asset related debt (long-term liabilities). On Page 57, the additions and deletions to long-term liabilities are outlined. For business-type activities, the majority of the change is due to a combined addition of $64 and a total deletion of $120. A description of the note payable reduction is on page 57. A portion of the City’s net position ($89,660) represents resources that are subject to external restrictions on how they may be used. The remaining balance of unrestricted net position, if any, may be used to meet the government’s ongoing obligations to citizens and creditors. At the end of the current fiscal year, the City is able to report a positive balance in all three categories of net position for the City as a whole as well as for its governmental activities. In business-type activities, the net position is positive for all categories except “unrestricted.” The negative unrestricted net position slightly decreased by $138. Governmental and Business-type Activities. Governmental and Business-type activities increased the City’s net position by $26,263 thereby accounting for the 7.4% increase in the net position of the City. Key elements of this increase are as follows: Governmental activities increased the City’s net position by $19,515 due mainly to total revenues significantly
surpassing expenditures. Contributing to the increased net position are: a) increase of $8,539 in capital grants and contributions, b) increase of sales and use tax of $1,316, c) increase of $530 in vehicle license in lieu tax and d) a decrease in Public Works expenses of $4,430.
Business-type activities increased the City of Perris’s net position by $6,748 which is mainly due to a prior year adjustment of $6,161 required to report the City’s Community Economic Development Corporation as a business-type activity in accordance with GASB Statement No. 80, Blending Requirements for Certain Component Units – an Amendment of GASB Statement No. 14. There was also a combined increase of $641 in revenues relating to Sewer Utility, Public Utility, Water Utility, Solid Waste Utility and Housing Authority. Further, there was a combined increase of ($82) in the operating expenses of the Sewer Utility, Public Utility, Water Utility, and Solid Waste Utility while the Housing Authority Funds recorded a decrease in expenses of ($9). Overall, the business-type activities recorded an increase of $587 in net position before prior year adjustment and an increase of $6,748 in net position after prior year adjustment of $6,161. Prior period adjustments are described in detail on page 85.

CITY OF PERRIS Management’s Discussion and Analysis
9
2017 2016 2017 2016 2017 2016Revenues:
Program revenues:Charges for services 23,099$ 26,392$ 7,236$ 6,504$ 30,335$ 32,896$ Operating grants and Contributions 11,300 17,883 - - 11,300 17,883 Capital grants and Contributions 16,207 7,668 2,363 399 18,570 8,067
General revenues:Property taxes 6,157 5,594 - - 6,157 5,594 Sales and Use taxes 10,586 9,270 - - 10,586 9,270 Sales Tax in Lieu Tax - 1,740 - - - 1,740 Motor Vehicle 33 29 - - 33 29 Vehicle License in Lieu Tax 5,784 5,254 - - 5,784 5,254 Franchise taxes 2,496 2,625 - - 2,496 2,625 Transient occupancy taxes 115 159 - - 115 159 Real property taxes 286 308 - - 286 308 Investment earnings 163 654 2 36 165 690 Gain on Sale of Property - 203 - - - 203 Miscellaneous 170 317 - - 170 317 Gain on CFD Investment - 1,260 - - - 1,260
Total revenues 76,396 79,356 9,601 6,939 85,997 86,295
Expenses:General government 9,698 10,621 - - 9,698 10,621 Public safety 22,936 22,586 - - 22,936 22,586 Public works 12,808 17,238 - - 12,808 17,238 Parks and recreation 3,874 3,600 - - 3,874 3,600 Interest on long term debt 6,996 6,457 - - 6,996 6,457 Water utility - - 2,855 2,646 2,855 2,646 Sewer utility - - 2,134 2,101 2,134 2,101 Public Utility - - 1,182 1,152 1,182 1,152 Solid Waste Utility - - 1,172 1,377 1,172 1,377 Housing Authority - - 792 801 792 801 Perris CEDC - - 1,448 - 1,448 -
Total Expenses 56,312 60,502 9,583 8,077 65,895 68,579
Increase (decrease) in net positionbefore item and transfers 20,084 18,854 18 (1,138) 20,102 17,716
Transfers (569) (553) 569 553 - -
Change in net position 19,515 18,301 587 (585) 20,102 17,716
Net position as reported, July 1, 2016 249,276 230,975 14,555 15,067 263,831 246,042 Prior Period Adjustment - - 6,161 73 6,161 73
Net position as restated, July 1, 2016 249,276 230,975 20,716 15,140 269,992 246,115
Net position, June 30, 2017 268,791$ 249,276$ 21,303$ 14,555$ 290,094$ 263,831$
Activities Activities Total
City of Perris, Change in Net Position
June 30, 2017
Governmental Business-type
CITY OF PERRIS Management’s Discussion and Analysis
10
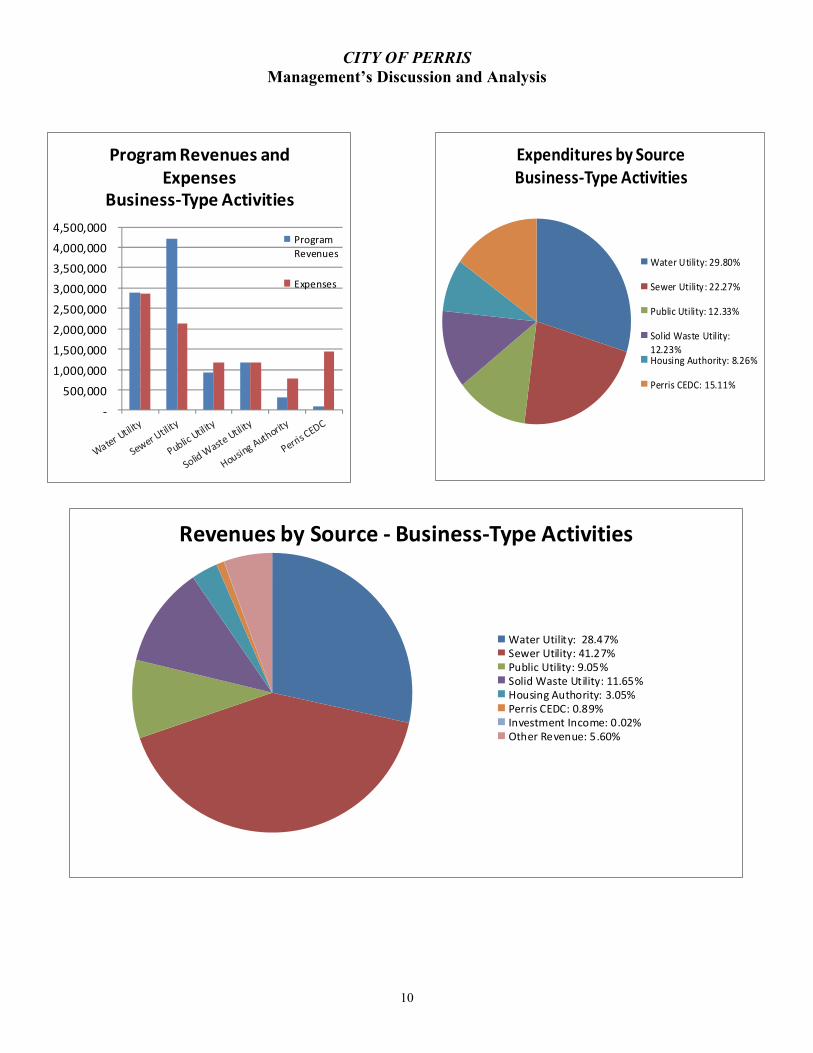
Expenditures by Source Business‐Type Activities
Water Utility: 29.80%
Sewer Utility: 22.27%
Public Utility: 12.33%
Solid Waste Utility:
12.23%Housing Authority: 8.26%
Perris CEDC: 15.11%
‐
500,000
1,000,000
1,500,000
2,000,000
2,500,000
3,000,000
3,500,000
4,000,000
4,500,000
Program Revenues and Expenses
Business‐Type Activities
Program
Revenues
Expenses
Revenues by Source ‐ Business‐Type Activities
Water Utility: 28.47%Sewer Utility: 41.27%Public Utility: 9.05%Solid Waste Utility: 11.65%Housing Authority: 3.05%Perris CEDC: 0.89%Investment Income: 0.02%Other Revenue: 5.60%
CITY OF PERRIS Management’s Discussion and Analysis
11
‐
5,000,000
10,000,000
15,000,000
20,000,000
25,000,000
30,000,000
35,000,000
40,000,000
Program Revenues and Expenses
Governmental Activities
ProgramRevenues
Expenses
Revenues by Source ‐ Governmental ActivitesCapital Grants & Contributions: 21.21%
Operating Grants & Contributions : 14.79%
Sales & Use Taxes: 13.86%
Motor Vehicle in Lieu Tax: 0.04%
Vehicle License Fee in Lieu Tax: 7.57%
Investment Income: 0.21%
Franchise Taxes: 3.27%
Transient Occupancy Taxes: 0.15%
Property Taxes: 8.06%
Real Property Transfer Taxes: 0.37%
Charges for Services: 30.24%
Other Revenue: 0.23%
Expenditures by SourceGovernmental Activities
General Government:
17.22%
Public Safety: 40.73%
Public Works: 22.75%
Parks and Recreation:
6.88%
Interest on Long‐Term
Debt: 12.42%

CITY OF PERRIS Management’s Discussion and Analysis
12
As noted earlier, the City’s uses fund accounting to ensure and demonstrate compliance with finance-related legal requirements. Governmental Funds. The focus of the City’s governmental funds is to provide information on near-term inflows, outflows and balances of spendable resources. Such information may be useful in assessing the City’s financing requirements. In particular, unreserved fund balance may serve as a useful measure of the City’s net resources available for spending at the end of the fiscal year. As of the end of the current fiscal year, the City’s governmental funds reported combined ending fund balances of $273,542. The City’s governmental funds report a net deficit of $(1,270) unassigned fund balance. The remainder of the fund balances are either non-spendable, restricted, committed or assigned to indicate amounts to be used for a specific purpose or in a non-spendable form 1) for deposits with other agencies ($2,107) and prepaid items of $4, 2) for advances ($7,232), 3) restricted resources ($247,465), 4) committed amounts ($11,805) and 5) for assigned amounts ($6,200). The General Fund is the chief operating fund of the City. At the end of the current fiscal year, the unassigned and assigned fund balance of the General Fund was $6,240, while the total fund balance reached $27,388. As a measure of General Fund liquidity, it may be useful to compare the unassigned and assigned fund balances to total fund revenues. General fund balance represents 83% of total general fund revenues of $32,893. The fund balance of the City’s General Fund decreased by $1,496 during the current fiscal year. The decrease in the fiscal year can be attributed primarily to an overall increase in expenditures that exceeded the increase in revenues by $989 and additional amount of $507 for other financing uses. Major increases were in taxes, licenses, permits and fees, fines, forfeitures and penalties, contributions and miscellaneous; and in general government, public safety and parks and recreation expenditures. Taxes increased by $473, licenses, permits and fees increased by $124, fines, forfeitures and penalties increased by $200, contributions increased by $134 and miscellaneous revenues increased by $106 from the prior year amounts. General government expenditures increased by $659, public safety increased by $1,128, and parks and recreation increased by $85 over prior year amounts. The Public Financing Authority Debt Service Fund (PFA) had a decrease of $2,856. The decrease was mainly due to debt service expenditures being higher than the investment earnings of the Fund. The Joint Powers Authority Debt Service Fund (JPA) had a decrease of $193. The JPA issued $4,580,000 2017 Local Agency Revenue Bonds, Series A, to acquire CFD 2014-1 (Avelina) Special Tax Bonds. The net amount of the issued bonds of $4,476 (net of discount on the bonds issue) and the deficiency of the revenues under expenditures of $4,669 accounted for the major decrease in the JPA Fund balance. The Road and Bridge Benefit District Fund had an increase in fund balance of $11,998. The increase was mainly due to developer fees collected for development projects being higher than the amount expended on capital projects as of the end of the fiscal year. The fund balance will be expended in subsequent fiscal years for capital projects. The Storm Drain Development Capital Project Fund is used to account for the capital improvements of upgrading the storm drains within the City. The fund balance of the Storm Drain Development Capital Project Fund decreased by $2,967 due to construction expenditures higher than the developer fees received during the fiscal year. The Capital Improvements Projects Capital Project Fund had a decrease of $333, which is attributed to total capital outlay being higher than the revenues received during the fiscal year.
CITY OF PERRIS Management’s Discussion and Analysis
13
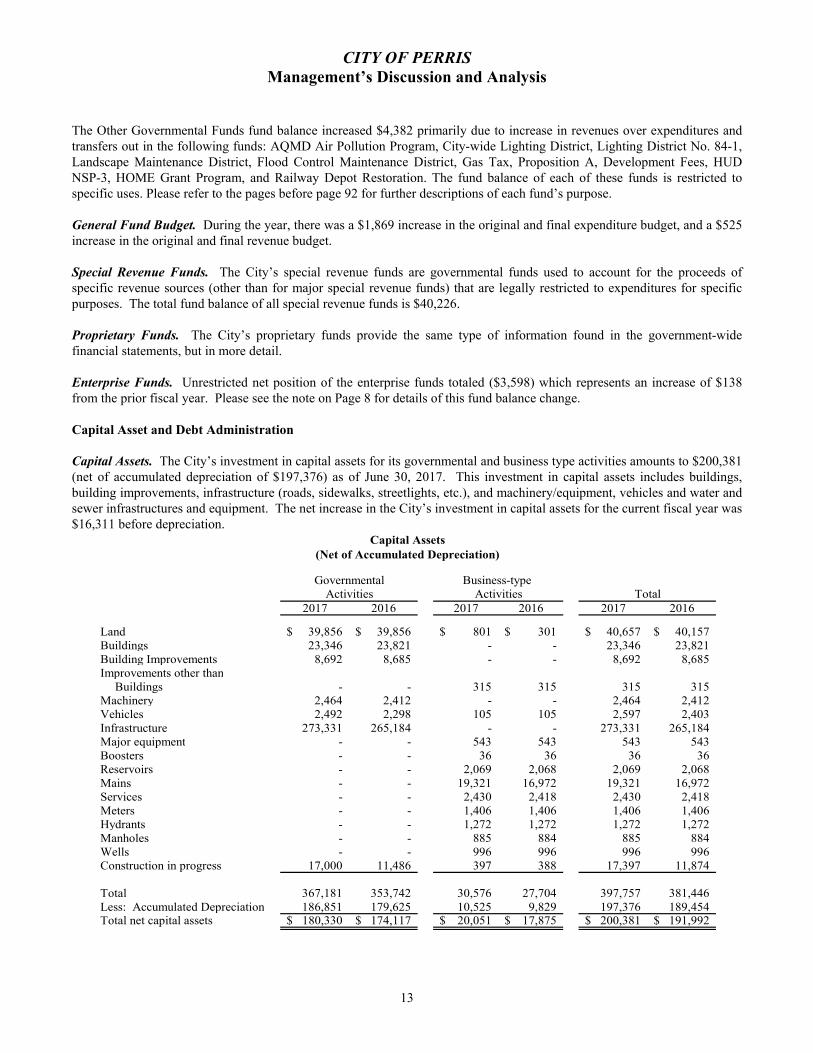
The Other Governmental Funds fund balance increased $4,382 primarily due to increase in revenues over expenditures and transfers out in the following funds: AQMD Air Pollution Program, City-wide Lighting District, Lighting District No. 84-1, Landscape Maintenance District, Flood Control Maintenance District, Gas Tax, Proposition A, Development Fees, HUD NSP-3, HOME Grant Program, and Railway Depot Restoration. The fund balance of each of these funds is restricted to specific uses. Please refer to the pages before page 92 for further descriptions of each fund’s purpose. General Fund Budget. During the year, there was a $1,869 increase in the original and final expenditure budget, and a $525 increase in the original and final revenue budget. Special Revenue Funds. The City’s special revenue funds are governmental funds used to account for the proceeds of specific revenue sources (other than for major special revenue funds) that are legally restricted to expenditures for specific purposes. The total fund balance of all special revenue funds is $40,226. Proprietary Funds. The City’s proprietary funds provide the same type of information found in the government-wide financial statements, but in more detail. Enterprise Funds. Unrestricted net position of the enterprise funds totaled ($3,598) which represents an increase of $138 from the prior fiscal year. Please see the note on Page 8 for details of this fund balance change. Capital Asset and Debt Administration Capital Assets. The City’s investment in capital assets for its governmental and business type activities amounts to $200,381 (net of accumulated depreciation of $197,376) as of June 30, 2017. This investment in capital assets includes buildings, building improvements, infrastructure (roads, sidewalks, streetlights, etc.), and machinery/equipment, vehicles and water and sewer infrastructures and equipment. The net increase in the City’s investment in capital assets for the current fiscal year was $16,311 before depreciation.
2017 2016 2017 2016 2017 2016
Land 39,856$ 39,856$ 801$ 301$ 40,657$ 40,157$ Buildings 23,346 23,821 - - 23,346 23,821 Building Improvements 8,692 8,685 - - 8,692 8,685 Improvements other than Buildings - - 315 315 315 315 Machinery 2,464 2,412 - - 2,464 2,412 Vehicles 2,492 2,298 105 105 2,597 2,403 Infrastructure 273,331 265,184 - - 273,331 265,184 Major equipment - - 543 543 543 543 Boosters - - 36 36 36 36 Reservoirs - - 2,069 2,068 2,069 2,068 Mains - - 19,321 16,972 19,321 16,972 Services - - 2,430 2,418 2,430 2,418 Meters - - 1,406 1,406 1,406 1,406 Hydrants - - 1,272 1,272 1,272 1,272 Manholes - - 885 884 885 884 Wells - - 996 996 996 996 Construction in progress 17,000 11,486 397 388 17,397 11,874
Total 367,181 353,742 30,576 27,704 397,757 381,446 Less: Accumulated Depreciation 186,851 179,625 10,525 9,829 197,376 189,454 Total net capital assets 180,330$ 174,117$ 20,051$ 17,875$ 200,381$ 191,992$
Activities Activities Total
Capital Assets(Net of Accumulated Depreciation)
Governmental Business-type
CITY OF PERRIS Management’s Discussion and Analysis
14
The City’s increase in capital assets was primarily due to the completion and construction in progress of infrastructure projects. The completion of the following five projects during the fiscal year added a total of $8,147 to Governmental Activities-Infrastructure: Perris Logistic Center ($3,935), Murrieta Crossing & Traffic Signal ($2,812), Oakmont II project ($1,385), IBG project ($13) and Del Taco Romona Express ($2). Major construction in progress included Circle Industry project ($783) and Food 4 Less Gas Station ($11). The major construction in progress added to the Governmental Activities-Construction in progress capital assets. Infrastructure improvements are performed on parks, sidewalks, pavement, storm drains, pipelines, bridges, curbs and gutters, and street lights. Additional information on the City’s capital assets can be found in note 5 to the basic financial statements on page 55 of this report. Debt Administration. At the end of the current fiscal year, the City had total bonded debt outstanding of $168,985 which represents revenue and tax allocation bonds issued for Redevelopment projects and bonds issued by the Public Financing Authority and Joint Powers Authority to purchase CFD and assessment district bonds. The City of Perris’ total bonded debt decreased by $2,575 during the fiscal year due to the issuance of Local Agency Revenue Bonds of $4,580 and regular principal payments on all revenue bonds reducing the principal owed to date by $7,155. Additional information on the City’s outstanding debt can be found in note 6 to the basic financial statements on page 57 of this report. State statutes limit the amount of general obligation debt a governmental entity may issue to 15 percent of its total assessed valuation. The current debt limitation for the City is $773,316 which is significantly in excess of the City’s outstanding general obligation debt. Request for Information This financial report is designed to provide a general overview of the City’s finances for readers of the financial statements. Questions concerning any of the information in this report or request for additional financial information should be addressed to the Director of Finance, 101 North “D” Street, Perris, CA.

This page intentionally left blank
BASIC FINANCIAL STATEMENTS

Governmental Business-typeActivities Activities Total
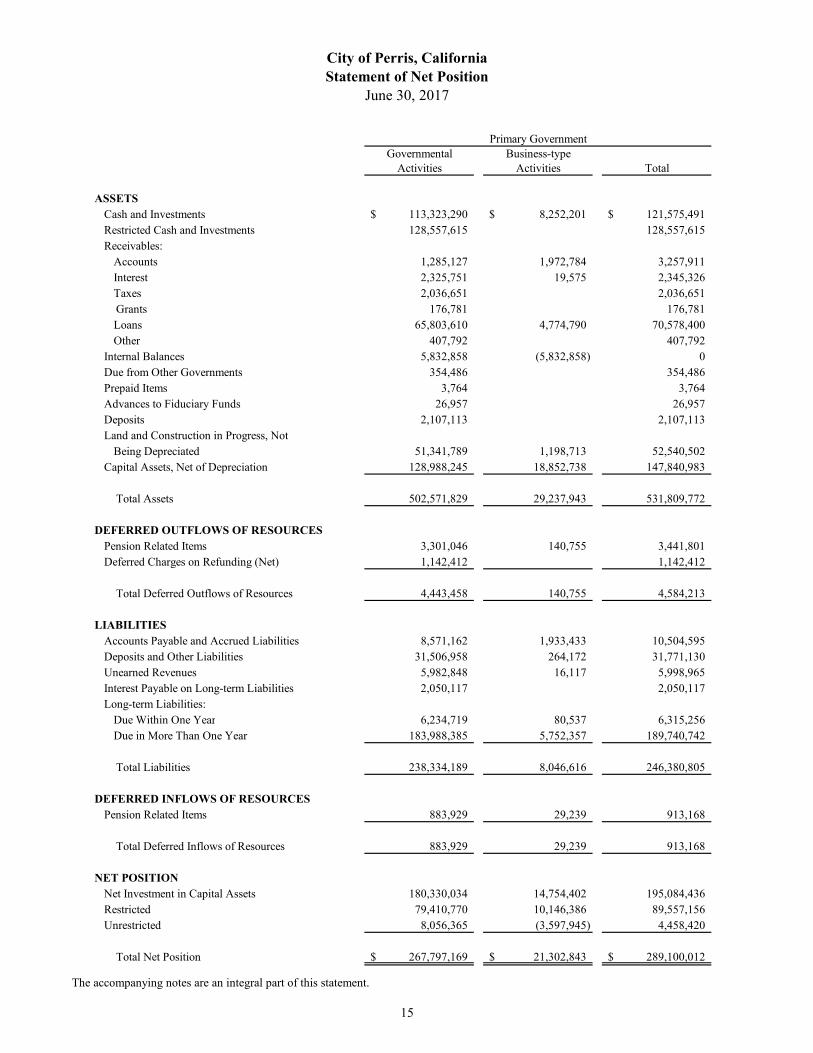
ASSETSCash and Investments 113,323,290$ 8,252,201$ 121,575,491$ Restricted Cash and Investments 128,557,615 128,557,615 Receivables:
Accounts 1,285,127 1,972,784 3,257,911 Interest 2,325,751 19,575 2,345,326 Taxes 2,036,651 2,036,651 Grants 176,781 176,781 Loans 65,803,610 4,774,790 70,578,400 Other 407,792 407,792
Internal Balances 5,832,858 (5,832,858) 0 Due from Other Governments 354,486 354,486 Prepaid Items 3,764 3,764 Advances to Fiduciary Funds 26,957 26,957 Deposits 2,107,113 2,107,113 Land and Construction in Progress, Not
Being Depreciated 51,341,789 1,198,713 52,540,502 Capital Assets, Net of Depreciation 128,988,245 18,852,738 147,840,983
Total Assets 502,571,829 29,237,943 531,809,772
DEFERRED OUTFLOWS OF RESOURCESPension Related Items 3,301,046 140,755 3,441,801 Deferred Charges on Refunding (Net) 1,142,412 1,142,412
Total Deferred Outflows of Resources 4,443,458 140,755 4,584,213
LIABILITIESAccounts Payable and Accrued Liabilities 8,571,162 1,933,433 10,504,595 Deposits and Other Liabilities 31,506,958 264,172 31,771,130 Unearned Revenues 5,982,848 16,117 5,998,965 Interest Payable on Long-term Liabilities 2,050,117 2,050,117 Long-term Liabilities:
Due Within One Year 6,234,719 80,537 6,315,256 Due in More Than One Year 183,988,385 5,752,357 189,740,742
Total Liabilities 238,334,189 8,046,616 246,380,805
DEFERRED INFLOWS OF RESOURCESPension Related Items 883,929 29,239 913,168
Total Deferred Inflows of Resources 883,929 29,239 913,168
NET POSITIONNet Investment in Capital Assets 180,330,034 14,754,402 195,084,436 Restricted 79,410,770 10,146,386 89,557,156 Unrestricted 8,056,365 (3,597,945) 4,458,420
Total Net Position 267,797,169$ 21,302,843$ 289,100,012$
Primary Government
City of Perris, CaliforniaStatement of Net Position
June 30, 2017
The accompanying notes are an integral part of this statement.
15
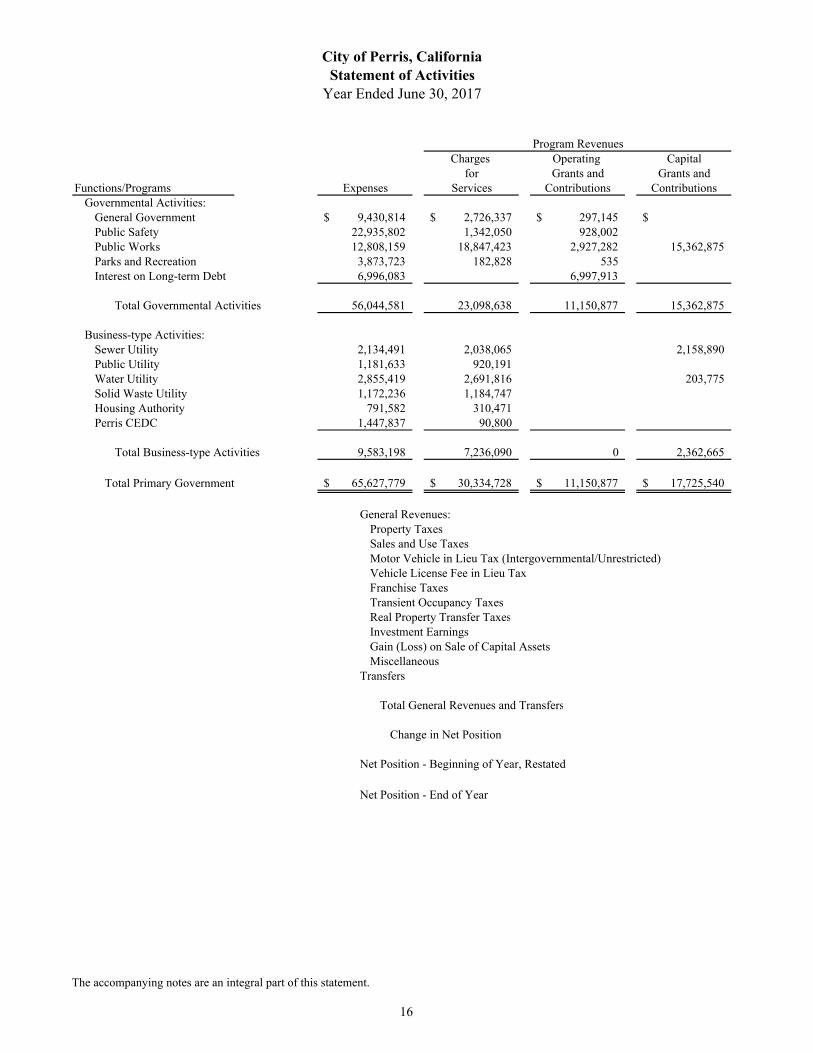
Charges Operating Capitalfor Grants and Grants and
Functions/Programs Expenses Services Contributions ContributionsGovernmental Activities:
General Government 9,430,814$ 2,726,337$ 297,145$ $ Public Safety 22,935,802 1,342,050 928,002 Public Works 12,808,159 18,847,423 2,927,282 15,362,875 Parks and Recreation 3,873,723 182,828 535 Interest on Long-term Debt 6,996,083 6,997,913
Total Governmental Activities 56,044,581 23,098,638 11,150,877 15,362,875
Business-type Activities:Sewer Utility 2,134,491 2,038,065 2,158,890 Public Utility 1,181,633 920,191 Water Utility 2,855,419 2,691,816 203,775 Solid Waste Utility 1,172,236 1,184,747 Housing Authority 791,582 310,471 Perris CEDC 1,447,837 90,800
Total Business-type Activities 9,583,198 7,236,090 0 2,362,665
Total Primary Government 65,627,779$ 30,334,728$ 11,150,877$ 17,725,540$
General Revenues:Property TaxesSales and Use TaxesMotor Vehicle in Lieu Tax (Intergovernmental/Unrestricted)Vehicle License Fee in Lieu TaxFranchise TaxesTransient Occupancy TaxesReal Property Transfer TaxesInvestment EarningsGain (Loss) on Sale of Capital AssetsMiscellaneous
Transfers
Total General Revenues and Transfers
Change in Net Position
Net Position - Beginning of Year, Restated
Net Position - End of Year
City of Perris, CaliforniaStatement of Activities
Year Ended June 30, 2017
Program Revenues
The accompanying notes are an integral part of this statement.
16
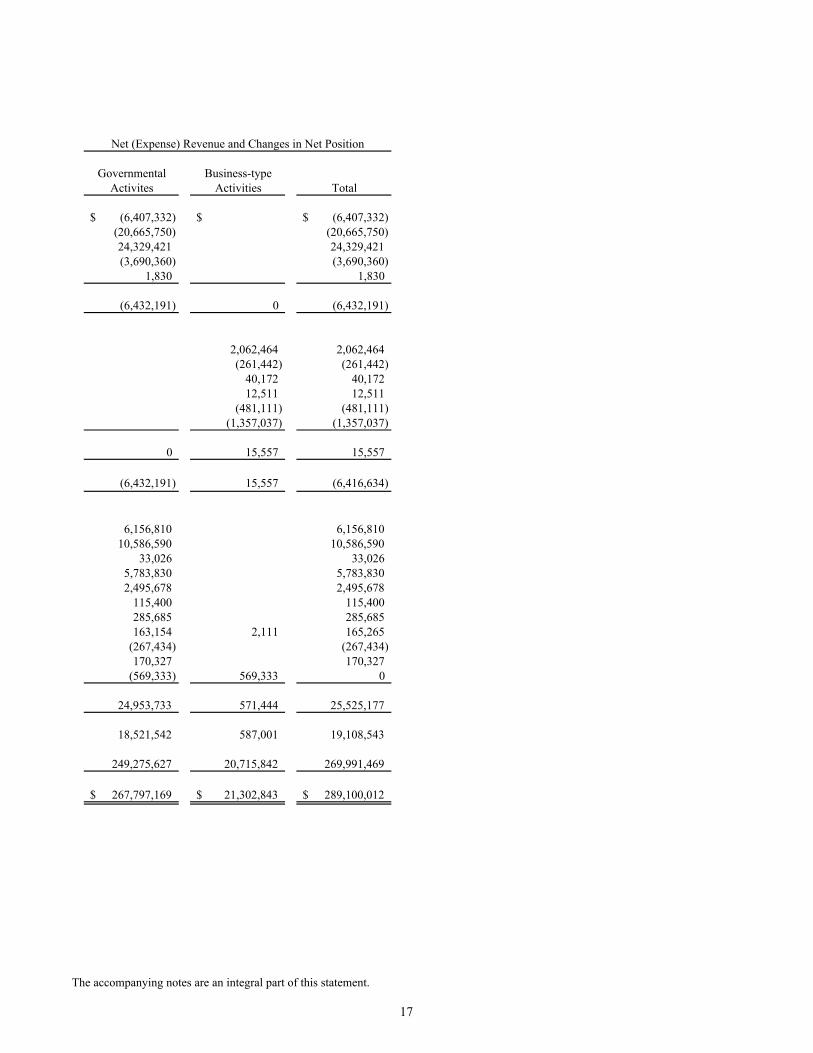
Governmental Business-typeActivites Activities Total
(6,407,332)$ $ (6,407,332)$ (20,665,750) (20,665,750)24,329,421 24,329,421(3,690,360) (3,690,360)
1,830 1,830
(6,432,191) 0 (6,432,191)
2,062,464 2,062,464 (261,442) (261,442)
40,172 40,172 12,511 12,511
(481,111) (481,111) (1,357,037) (1,357,037)
0 15,557 15,557
(6,432,191) 15,557 (6,416,634)
6,156,810 6,156,810 10,586,590 10,586,590
33,026 33,026 5,783,830 5,783,830 2,495,678 2,495,678
115,400 115,400 285,685 285,685 163,154 2,111 165,265
(267,434) (267,434) 170,327 170,327
(569,333) 569,333 0
24,953,733 571,444 25,525,177
18,521,542 587,001 19,108,543
249,275,627 20,715,842 269,991,469
267,797,169$ 21,302,843$ 289,100,012$
Net (Expense) Revenue and Changes in Net Position
The accompanying notes are an integral part of this statement.
17

Public JointGeneral Financing Powers
Fund Authority AuthorityASSETS
Cash and Investments 25,819,682$ $ 48,111$
Cash and Investments with Fiscal Agent 12,059,533 112,492,944Receivables:
Accounts 238,708 Interest 57,783 49Taxes 1,658,068 Grants Loans 65,580,000Other 388,442 7,500 11,850
Due from Other Funds 149,540 Due from Other Governments 139,288 Prepaid Items 3,764 Advances to Other Funds 7,232,350 Deposits with Other Agencies 2,107,113
Total Assets 37,794,738$ 77,647,033$ 112,552,954$
LIABILITIESAccounts Payable and Accrued Liabilities 6,874,441$ 900$ 2,400$ Deposits and Other Liabilities 2,811,432 8,059,411 9,566,588Due to Other Funds 571,573 7,500 11,850Advances from Other FundsUnearned Revenues 1,105,868
Total Liabilities 10,257,446 9,173,679 9,580,838
DEFERRED INFLOWS OF RESOURCESUnavailable Revenue - Taxes and Special Assessments 149,307 Unavailable Revenue - Interest 56 Unavailable Revenue - Intergovernmental
Total Deferred Inflows of Resources 149,307 0 56
FUND BALANCESNonspendable 9,343,227Restricted 68,473,354 102,972,060Committed 11,804,568Assigned 6,200,000Unassigned 40,190
Total Fund Balances 27,387,985 68,473,354 102,972,060
Total Liabilities, Deferred Inflows of
Resources and Fund Balances 37,794,738$ 77,647,033$ 112,552,954$
Debt Service
City of Perris, CaliforniaBalance Sheet
Governmental FundsJune 30, 2017
The accompanying notes are an integral part of this statement.
18
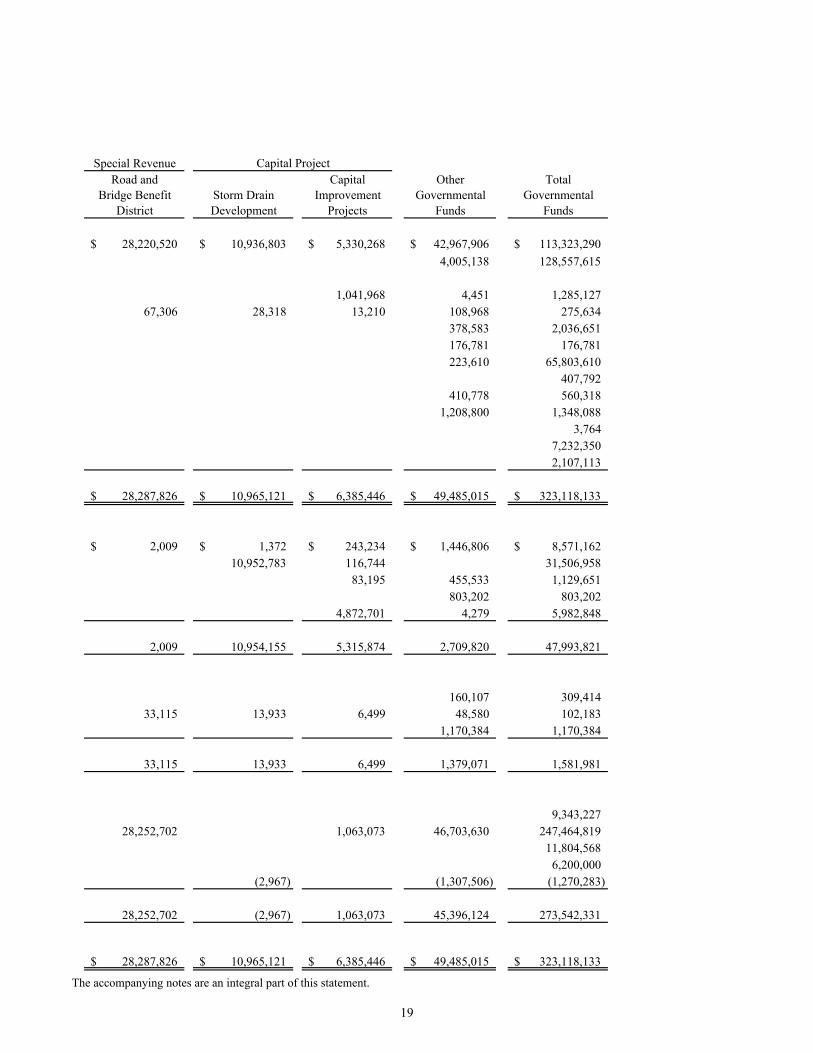
Special RevenueRoad and Capital Other Total
Bridge Benefit Storm Drain Improvement Governmental GovernmentalDistrict Development Projects Funds Funds
28,220,520$ 10,936,803$ 5,330,268$ 42,967,906$ 113,323,290$
4,005,138 128,557,615
1,041,968 4,451 1,285,12767,306 28,318 13,210 108,968 275,634
378,583 2,036,651 176,781 176,781 223,610 65,803,610 407,792
410,778 560,318 1,208,800 1,348,088
3,764 7,232,350 2,107,113
28,287,826$ 10,965,121$ 6,385,446$ 49,485,015$ 323,118,133$
2,009$ 1,372$ 243,234$ 1,446,806$ 8,571,162$ 10,952,783 116,744 31,506,958
83,195 455,533 1,129,651 803,202 803,202
4,872,701 4,279 5,982,848
2,009 10,954,155 5,315,874 2,709,820 47,993,821
160,107 309,414 33,115 13,933 6,499 48,580 102,183
1,170,384 1,170,384
33,115 13,933 6,499 1,379,071 1,581,981
9,343,22728,252,702 1,063,073 46,703,630 247,464,819
11,804,5686,200,000
(2,967) (1,307,506) (1,270,283)
28,252,702 (2,967) 1,063,073 45,396,124 273,542,331
28,287,826$ 10,965,121$ 6,385,446$ 49,485,015$ 323,118,133$
Capital Project
The accompanying notes are an integral part of this statement.
19

This page intentionally left blank
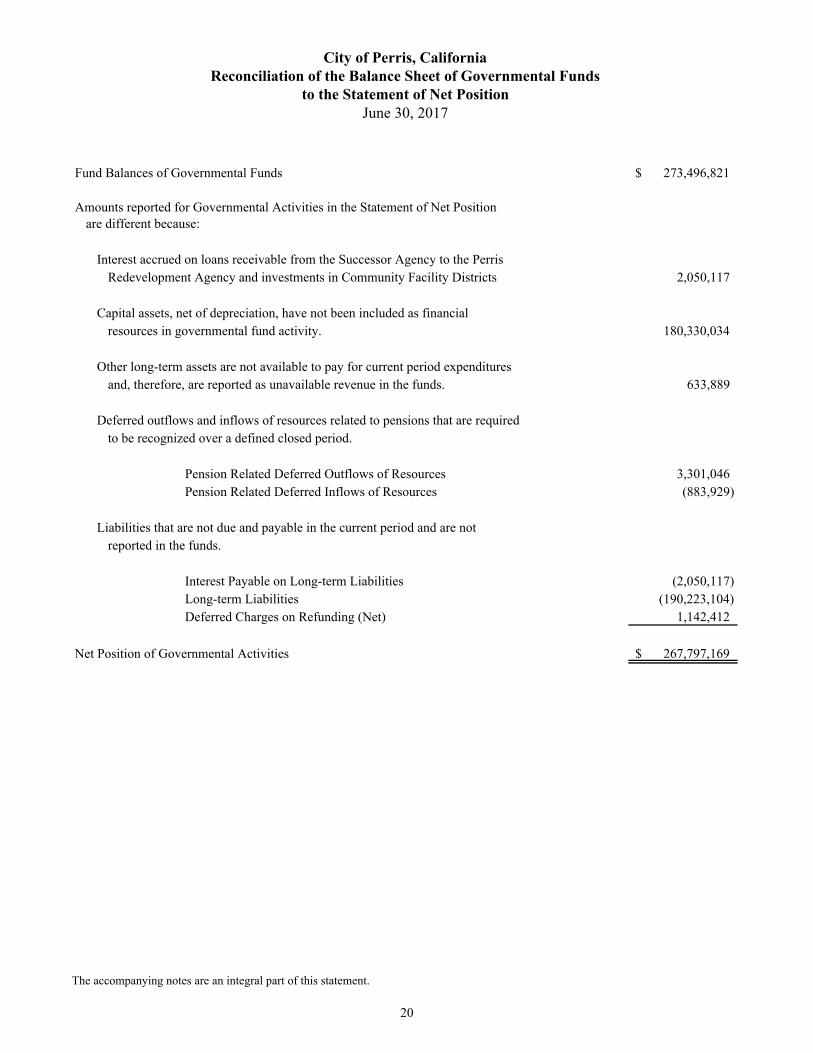
Fund Balances of Governmental Funds 273,496,821$
Amounts reported for Governmental Activities in the Statement of Net Positionare different because:
Interest accrued on loans receivable from the Successor Agency to the Perris Redevelopment Agency and investments in Community Facility Districts 2,050,117
Capital assets, net of depreciation, have not been included as financialresources in governmental fund activity. 180,330,034
Other long-term assets are not available to pay for current period expendituresand, therefore, are reported as unavailable revenue in the funds. 633,889
Deferred outflows and inflows of resources related to pensions that are requiredto be recognized over a defined closed period.
Pension Related Deferred Outflows of Resources 3,301,046Pension Related Deferred Inflows of Resources (883,929)
Liabilities that are not due and payable in the current period and are notreported in the funds.
Interest Payable on Long-term Liabilities (2,050,117)Long-term Liabilities (190,223,104)Deferred Charges on Refunding (Net) 1,142,412
Net Position of Governmental Activities 267,797,169$
City of Perris, CaliforniaReconciliation of the Balance Sheet of Governmental Funds
to the Statement of Net PositionJune 30, 2017
The accompanying notes are an integral part of this statement.
20

Public JointGeneral Financing Powers
Fund Authority AuthorityREVENUES
Taxes 25,421,192$ $ $ Licenses, Permits and Fees 2,583,385 Intergovernmental Revenues 25,346 Charges for Services 827,235 Fines, Forfeitures and Penalties 770,846 Developer Fees 267,188 Investment Earnings 396,895 3,502,486 3,197,265Special Assessments Contributions 2,313,157 7,523 30,931Miscellaneous 287,552 51,511
Total Revenues 32,892,796 3,561,520 3,228,196
EXPENDITURESCurrent:
General Government 7,068,200 14,644 23,750Public Safety 21,944,302 Public Works 1,609,870 Parks and Recreation 3,099,862
Capital Outlay 159,534 Debt Service:
Debt Issuance Costs 119,720Principal Retirement 3,095,000 4,060,000Interest and Fiscal Charges 3,308,186 3,694,179
Total Expenditures 33,881,768 6,417,830 7,897,649
Excess (Deficiency) of Revenues Over Expenditures (988,972) (2,856,310) (4,669,453)
OTHER FINANCING SOURCES (USES)Transfers In 925,000 Transfers Out (1,435,260) Revenue Bonds Issued 4,580,000Discounts on Bonds Issued (103,925)Sale of Property 2,966
Total Other Financing Sources (Uses) (507,294) 0 4,476,075
Net Change in Fund Balances (1,496,266) (2,856,310) (193,378)
Fund Balances - Beginning 28,884,251 71,329,664 103,165,438
Fund Balances - Ending 27,387,985$ 68,473,354$ 102,972,060$
Debt Service
City of Perris, CaliforniaStatement of Revenues, Expenditures, and Changes in Fund Balances
Governmental FundsYear Ended June 30, 2017
The accompanying notes are an integral part of this statement.
21
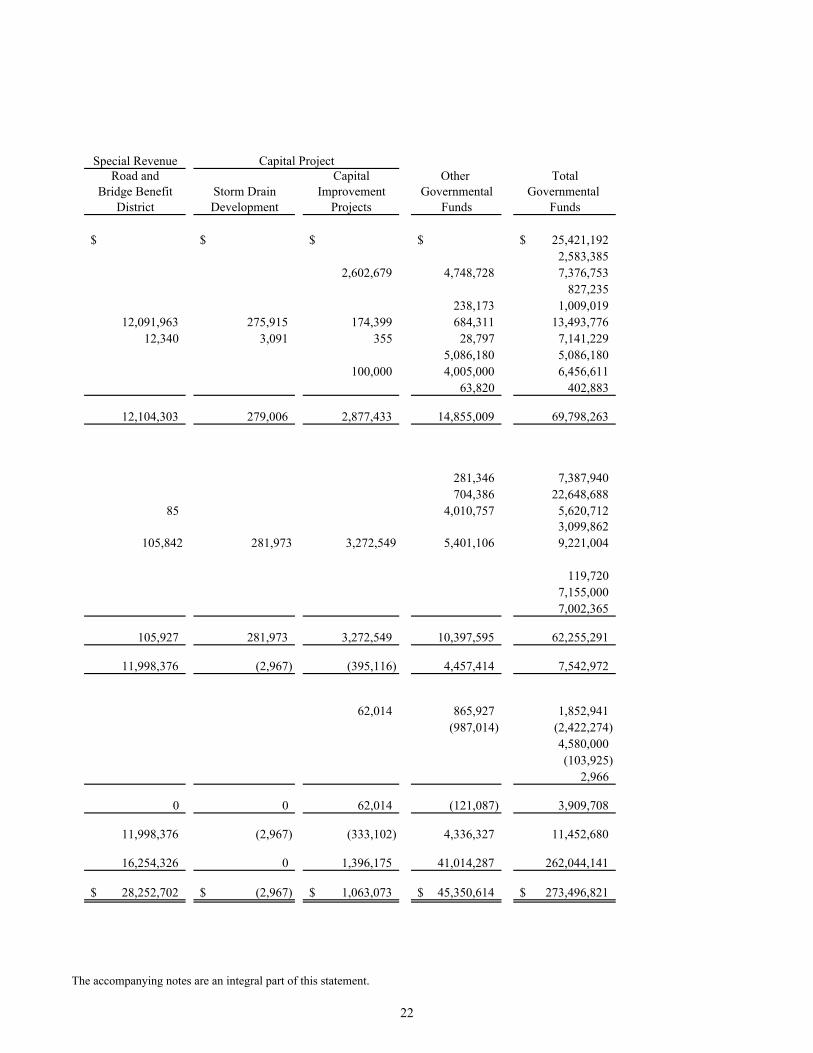
Special RevenueRoad and Capital Other Total
Bridge Benefit Storm Drain Improvement Governmental Governmental District Development Projects Funds Funds
$ $ $ $ 25,421,192$ 2,583,385
2,602,679 4,748,728 7,376,753 827,235
238,173 1,009,01912,091,963 275,915 174,399 684,311 13,493,776
12,340 3,091 355 28,797 7,141,229 5,086,180 5,086,180 100,000 4,005,000 6,456,611 63,820 402,883
12,104,303 279,006 2,877,433 14,855,009 69,798,263
281,346 7,387,940 704,386 22,648,688
85 4,010,757 5,620,712 3,099,862
105,842 281,973 3,272,549 5,401,106 9,221,004
119,720 7,155,000 7,002,365
105,927 281,973 3,272,549 10,397,595 62,255,291
11,998,376 (2,967) (395,116) 4,457,414 7,542,972
62,014 865,927 1,852,941 (987,014) (2,422,274)
4,580,000(103,925)
2,966
0 0 62,014 (121,087) 3,909,708
11,998,376 (2,967) (333,102) 4,336,327 11,452,680
16,254,326 0 1,396,175 41,014,287 262,044,141
28,252,702$ (2,967)$ 1,063,073$ 45,350,614$ 273,496,821$
Capital Project
The accompanying notes are an integral part of this statement.
22

This page intentionally left blank
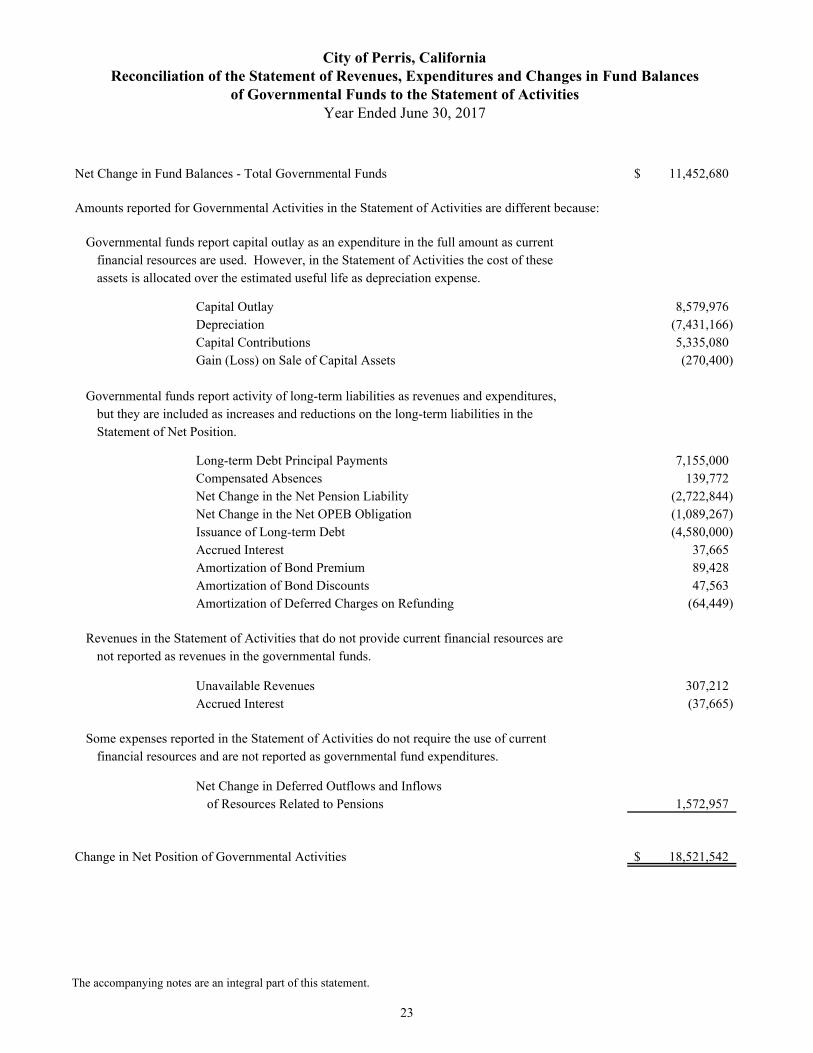
Net Change in Fund Balances - Total Governmental Funds 11,452,680$
Amounts reported for Governmental Activities in the Statement of Activities are different because:
Governmental funds report capital outlay as an expenditure in the full amount as currentfinancial resources are used. However, in the Statement of Activities the cost of theseassets is allocated over the estimated useful life as depreciation expense.
Capital Outlay 8,579,976Depreciation (7,431,166)Capital Contributions 5,335,080Gain (Loss) on Sale of Capital Assets (270,400)
Governmental funds report activity of long-term liabilities as revenues and expenditures,but they are included as increases and reductions on the long-term liabilities in theStatement of Net Position.
Long-term Debt Principal Payments 7,155,000Compensated Absences 139,772Net Change in the Net Pension Liability (2,722,844)Net Change in the Net OPEB Obligation (1,089,267)Issuance of Long-term Debt (4,580,000)Accrued Interest 37,665Amortization of Bond Premium 89,428Amortization of Bond Discounts 47,563Amortization of Deferred Charges on Refunding (64,449)
Revenues in the Statement of Activities that do not provide current financial resources arenot reported as revenues in the governmental funds.
Unavailable Revenues 307,212Accrued Interest (37,665)
Some expenses reported in the Statement of Activities do not require the use of currentfinancial resources and are not reported as governmental fund expenditures.
Net Change in Deferred Outflows and Inflows of Resources Related to Pensions 1,572,957
Change in Net Position of Governmental Activities 18,521,542$
City of Perris, CaliforniaReconciliation of the Statement of Revenues, Expenditures and Changes in Fund Balances
of Governmental Funds to the Statement of ActivitiesYear Ended June 30, 2017
The accompanying notes are an integral part of this statement.
23
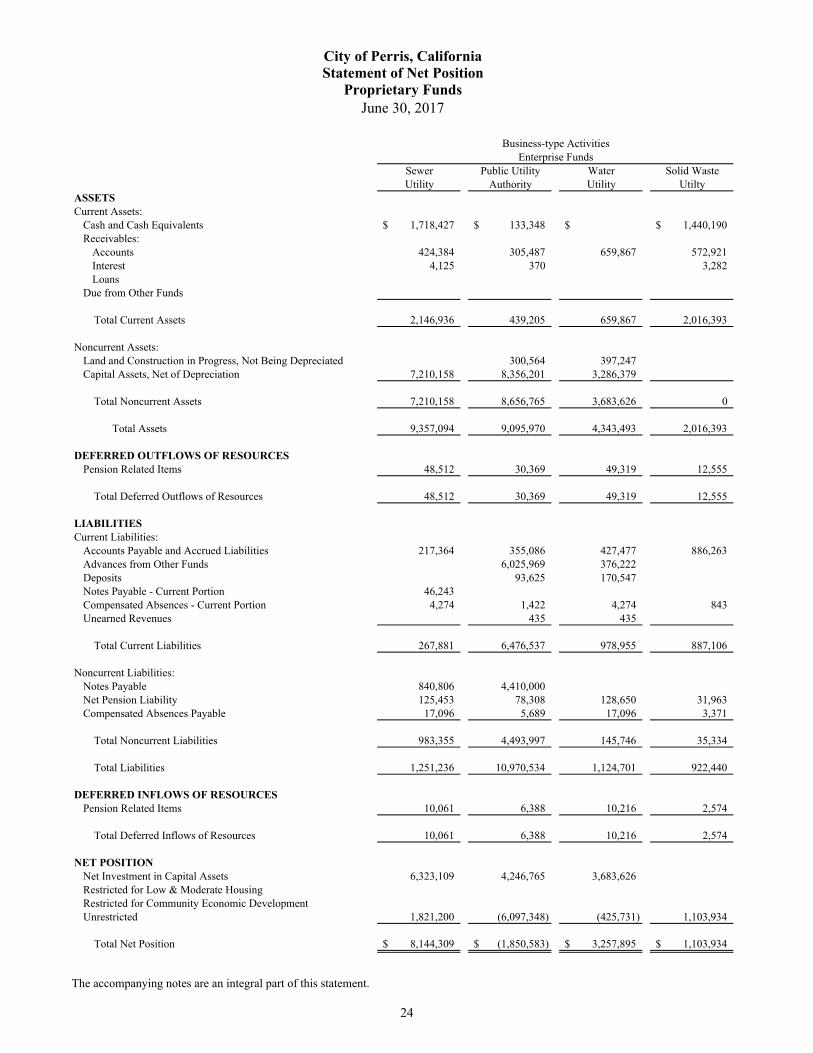
Sewer Public Utility Water Solid WasteUtility Authority Utility Utilty
ASSETSCurrent Assets:
Cash and Cash Equivalents 1,718,427$ 133,348$ $ 1,440,190$ Receivables:
Accounts 424,384 305,487 659,867 572,921 Interest 4,125 370 3,282 Loans
Due from Other Funds
Total Current Assets 2,146,936 439,205 659,867 2,016,393
Noncurrent Assets:Land and Construction in Progress, Not Being Depreciated 300,564 397,247 Capital Assets, Net of Depreciation 7,210,158 8,356,201 3,286,379
Total Noncurrent Assets 7,210,158 8,656,765 3,683,626 0
Total Assets 9,357,094 9,095,970 4,343,493 2,016,393
DEFERRED OUTFLOWS OF RESOURCESPension Related Items 48,512 30,369 49,319 12,555
Total Deferred Outflows of Resources 48,512 30,369 49,319 12,555
LIABILITIESCurrent Liabilities:
Accounts Payable and Accrued Liabilities 217,364 355,086 427,477 886,263 Advances from Other Funds 6,025,969 376,222 Deposits 93,625 170,547 Notes Payable - Current Portion 46,243 Compensated Absences - Current Portion 4,274 1,422 4,274 843 Unearned Revenues 435 435
Total Current Liabilities 267,881 6,476,537 978,955 887,106
Noncurrent Liabilities:Notes Payable 840,806 4,410,000 Net Pension Liability 125,453 78,308 128,650 31,963 Compensated Absences Payable 17,096 5,689 17,096 3,371
Total Noncurrent Liabilities 983,355 4,493,997 145,746 35,334
Total Liabilities 1,251,236 10,970,534 1,124,701 922,440
DEFERRED INFLOWS OF RESOURCESPension Related Items 10,061 6,388 10,216 2,574
Total Deferred Inflows of Resources 10,061 6,388 10,216 2,574
NET POSITIONNet Investment in Capital Assets 6,323,109 4,246,765 3,683,626 Restricted for Low & Moderate HousingRestricted for Community Economic DevelopmentUnrestricted 1,821,200 (6,097,348) (425,731) 1,103,934
Total Net Position 8,144,309$ (1,850,583)$ 3,257,895$ 1,103,934$
City of Perris, CaliforniaStatement of Net Position
Proprietary FundsJune 30, 2017
Enterprise FundsBusiness-type Activities
The accompanying notes are an integral part of this statement.
24
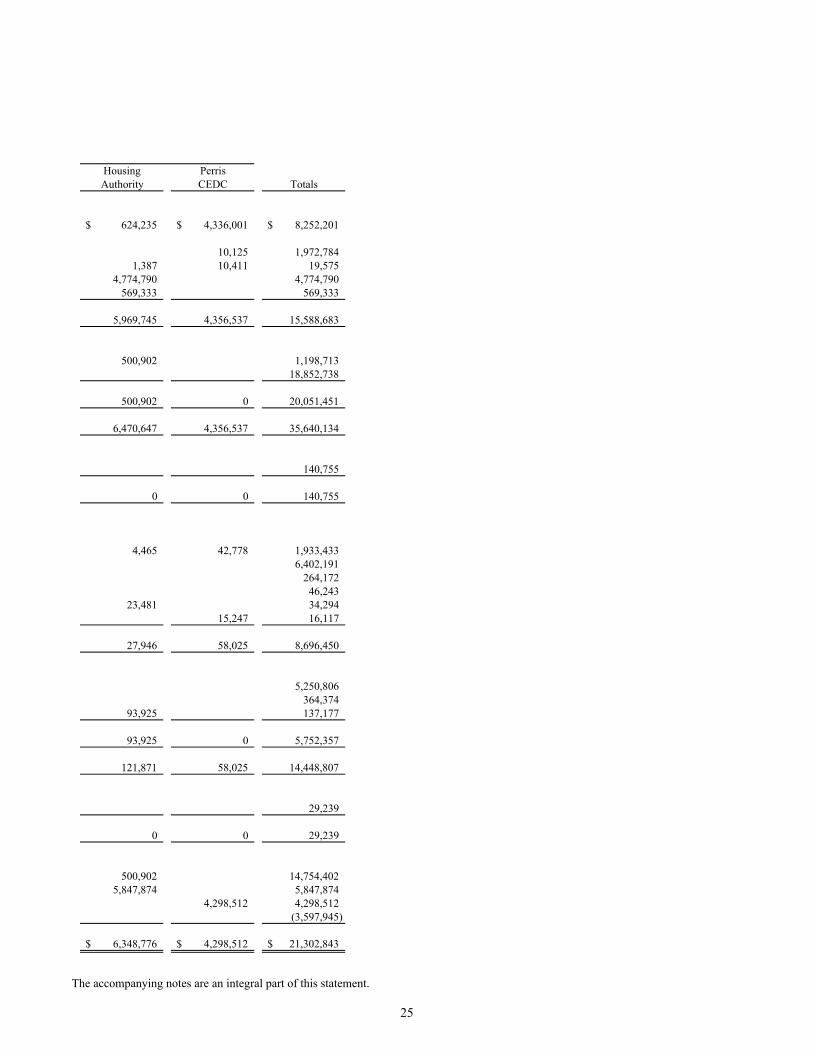
Housing PerrisAuthority CEDC Totals
624,235$ 4,336,001$ 8,252,201$
10,125 1,972,784 1,387 10,411 19,575
4,774,790 4,774,790 569,333 569,333
5,969,745 4,356,537 15,588,683
500,902 1,198,713 18,852,738
500,902 0 20,051,451
6,470,647 4,356,537 35,640,134
140,755
0 0 140,755
4,465 42,778 1,933,433 6,402,191
264,172 46,243
23,481 34,294 15,247 16,117
27,946 58,025 8,696,450
5,250,806 364,374
93,925 137,177
93,925 0 5,752,357
121,871 58,025 14,448,807
29,239
0 0 29,239
500,902 14,754,402 5,847,874 5,847,874
4,298,512 4,298,512 (3,597,945)
6,348,776$ 4,298,512$ 21,302,843$
The accompanying notes are an integral part of this statement.
25

Sewer Public Utility Water Solid WasteUtility Authority Utility Utility
OPERATING REVENUESCharges for Services 1,961,278$ 920,191$ 2,645,012$ 1,184,747$ Miscellaneous 76,787 46,804
Total Operating Revenues 2,038,065 920,191 2,691,816 1,184,747
OPERATING EXPENSESMaintenance and Operations 144,717 103,709 158,552 40,397 Contractual Services 1,727,143 353,026 2,470,162 1,119,147 Materials and Supplies 16,113 Repairs and Maintenance 1,733 Administrative and General 11,286 75,280 52,217 12,692 Depreciation 219,479 320,358 156,642 Loan Amortization ExpenseCommunity SponsorshipsEconomic DevelopmentMiscellaneous Expense
Total Operating Expenses 2,102,625 852,373 2,855,419 1,172,236
Operating Income (Loss) (64,560) 67,818 (163,603) 12,511
NONOPERATING REVENUES (EXPENSES)
Investment Earnings 1,275 291 2,537 Interest Expense (31,866) (329,260)
Total Nonoperating Revenues(Expenses) (30,591) (328,969) 0 2,537
Income before Capital Contributionsand Transfers (95,151) (261,151) (163,603) 15,048
Capital Contributions 2,158,890 203,775 Transfers InTransfers Out
Change in Net Position 2,063,739 (261,151) 40,172 15,048
Total Net Position - Beginning, Restated 6,080,570 (1,589,432) 3,217,723 1,088,886
Total Net Position - Ending 8,144,309$ (1,850,583)$ 3,257,895$ 1,103,934$
Proprietary FundsStatement of Revenues, Expenses, and Changes in Net Position
City of Perris, California
Business-type ActivitiesEnterprise Funds
Year Ended June 30, 2017
The accompanying notes are an integral part of this statement.
26

Housing PerrisAuthority CEDC Totals
310,471$ 90,600$ 7,112,299$ 200 123,791
310,471 90,800 7,236,090
447,375 28,384 12,789 5,710,651
16,113 1,733
648,341 18,745 818,561 696,479
10,396 10,396 64,940 98,000 162,940
1,318,303 1,318,303 39,521 39,521
791,582 1,447,837 9,222,072
(481,111) (1,357,037) (1,985,982)
1,785 (3,777) 2,111 (361,126)
1,785 (3,777) (359,015)
(479,326) (1,360,814) (2,344,997)
2,362,665 1,070,235 1,070,235
(500,902) (500,902)
590,909 (1,861,716) 587,001
5,757,867 6,160,228 20,715,842
6,348,776$ 4,298,512$ 21,302,843$
The accompanying notes are an integral part of this statement.
27
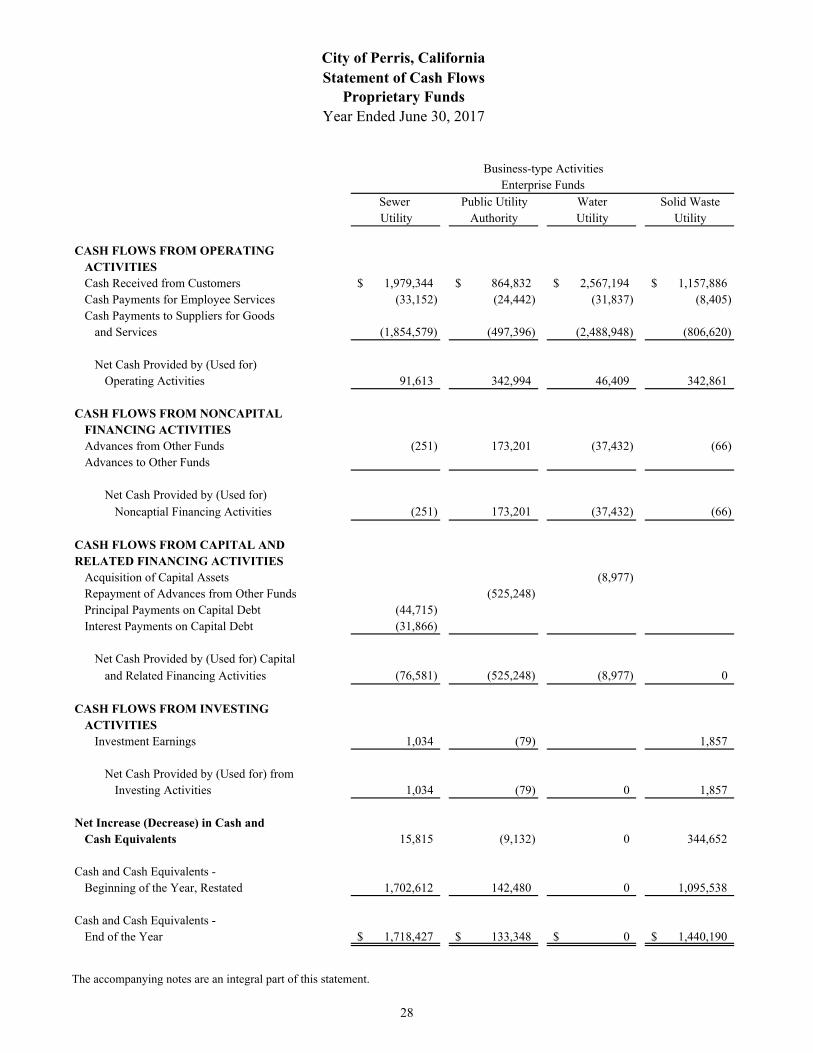
Sewer Public Utility Water Solid WasteUtility Authority Utility Utility
CASH FLOWS FROM OPERATING ACTIVITIESCash Received from Customers 1,979,344$ 864,832$ 2,567,194$ 1,157,886$ Cash Payments for Employee Services (33,152) (24,442) (31,837) (8,405) Cash Payments to Suppliers for Goods
and Services (1,854,579) (497,396) (2,488,948) (806,620)
Net Cash Provided by (Used for) Operating Activities 91,613 342,994 46,409 342,861
CASH FLOWS FROM NONCAPITALFINANCING ACTIVITIESAdvances from Other Funds (251) 173,201 (37,432) (66) Advances to Other Funds
Net Cash Provided by (Used for) Noncaptial Financing Activities (251) 173,201 (37,432) (66)
CASH FLOWS FROM CAPITAL AND RELATED FINANCING ACTIVITIES
Acquisition of Capital Assets (8,977) Repayment of Advances from Other Funds (525,248) Principal Payments on Capital Debt (44,715) Interest Payments on Capital Debt (31,866)
Net Cash Provided by (Used for) Capital
and Related Financing Activities (76,581) (525,248) (8,977) 0
CASH FLOWS FROM INVESTING ACTIVITIES
Investment Earnings 1,034 (79) 1,857
Net Cash Provided by (Used for) from Investing Activities 1,034 (79) 0 1,857
Net Increase (Decrease) in Cash and Cash Equivalents 15,815 (9,132) 0 344,652
Cash and Cash Equivalents - Beginning of the Year, Restated 1,702,612 142,480 0 1,095,538
Cash and Cash Equivalents - End of the Year 1,718,427$ 133,348$ 0$ 1,440,190$
Business-type Activities
City of Perris, CaliforniaStatement of Cash Flows
Proprietary FundsYear Ended June 30, 2017
Enterprise Funds
The accompanying notes are an integral part of this statement.
28
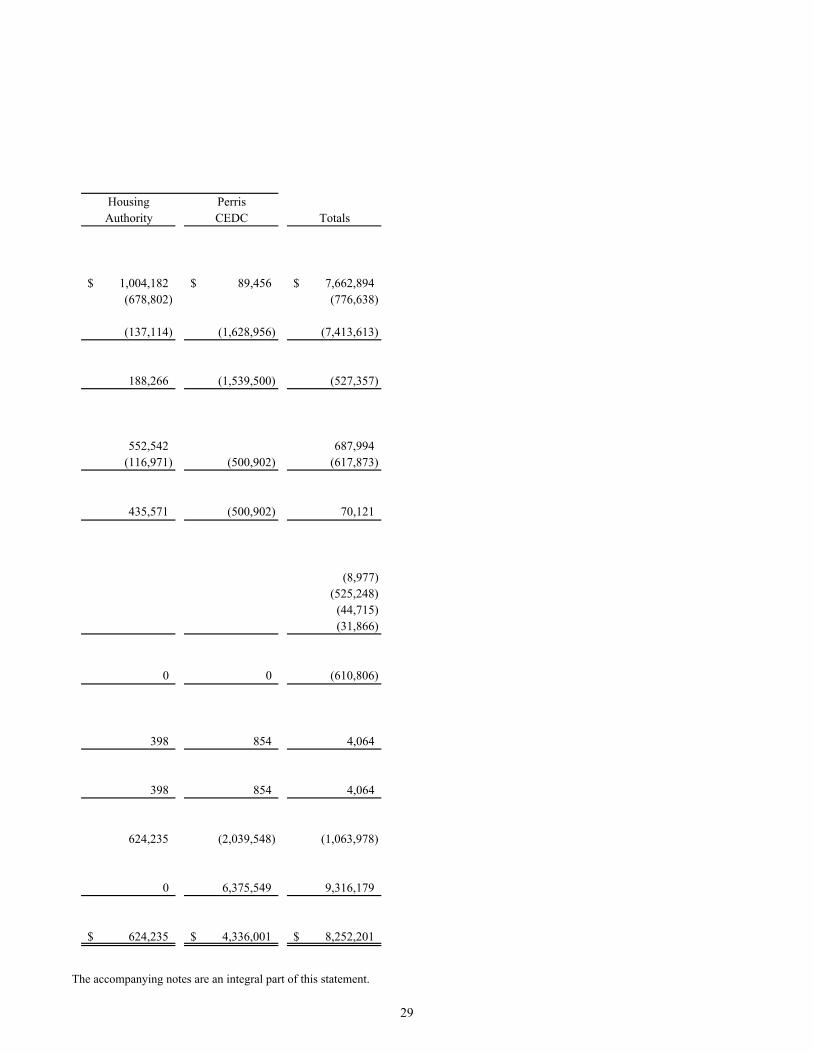
Housing PerrisAuthority CEDC Totals
1,004,182$ 89,456$ 7,662,894$ (678,802) (776,638)
(137,114) (1,628,956) (7,413,613)
188,266 (1,539,500) (527,357)
552,542 687,994 (116,971) (500,902) (617,873)
435,571 (500,902) 70,121
(8,977) (525,248)
(44,715) (31,866)
0 0 (610,806)
398 854 4,064
398 854 4,064
624,235 (2,039,548) (1,063,978)
0 6,375,549 9,316,179
624,235$ 4,336,001$ 8,252,201$
The accompanying notes are an integral part of this statement.
29
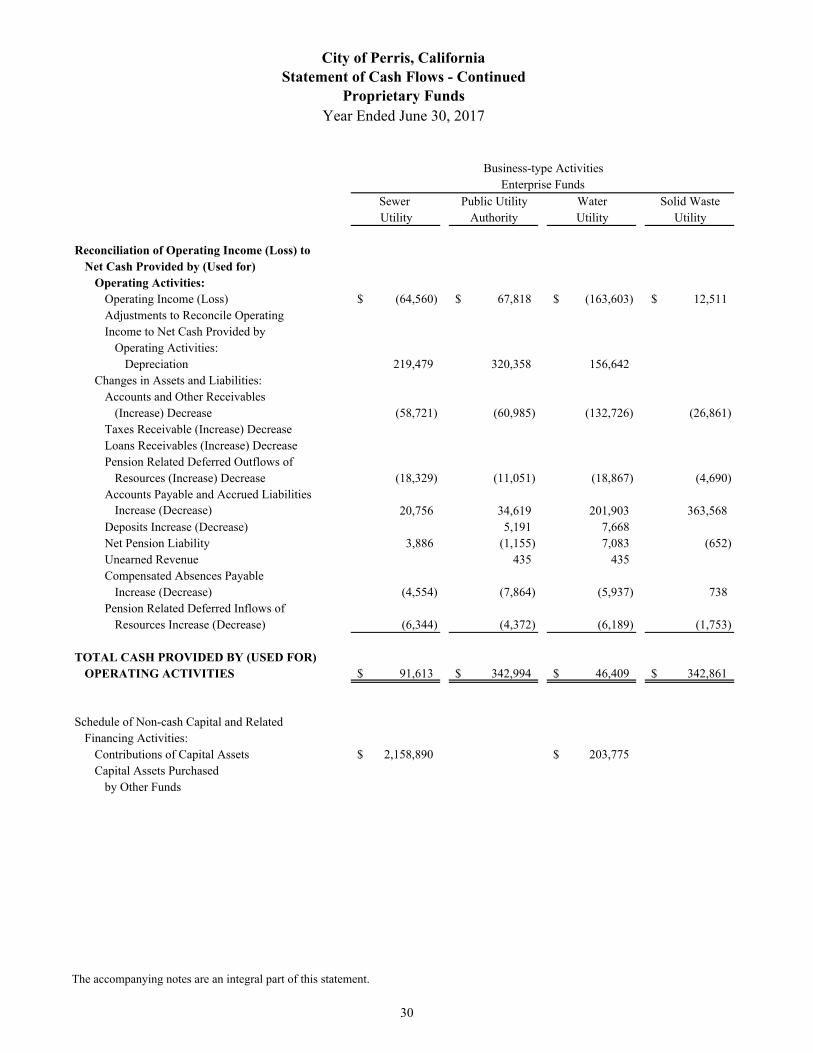
Sewer Public Utility Water Solid WasteUtility Authority Utility Utility
Reconciliation of Operating Income (Loss) to Net Cash Provided by (Used for)
Operating Activities:Operating Income (Loss) (64,560)$ 67,818$ (163,603)$ 12,511$ Adjustments to Reconcile Operating Income to Net Cash Provided by
Operating Activities:Depreciation 219,479 320,358 156,642
Changes in Assets and Liabilities:Accounts and Other Receivables
(Increase) Decrease (58,721) (60,985) (132,726) (26,861)Taxes Receivable (Increase) DecreaseLoans Receivables (Increase) DecreasePension Related Deferred Outflows of
Resources (Increase) Decrease (18,329) (11,051) (18,867) (4,690)Accounts Payable and Accrued Liabilities
Increase (Decrease) 20,756 34,619 201,903 363,568Deposits Increase (Decrease) 5,191 7,668Net Pension Liability 3,886 (1,155) 7,083 (652)Unearned Revenue 435 435Compensated Absences Payable
Increase (Decrease) (4,554) (7,864) (5,937) 738Pension Related Deferred Inflows of
Resources Increase (Decrease) (6,344) (4,372) (6,189) (1,753)
TOTAL CASH PROVIDED BY (USED FOR)OPERATING ACTIVITIES 91,613$ 342,994$ 46,409$ 342,861$
Schedule of Non-cash Capital and Related Financing Activities:
Contributions of Capital Assets 2,158,890$ 203,775$ Capital Assets Purchased
by Other Funds
Enterprise FundsBusiness-type Activities
City of Perris, CaliforniaStatement of Cash Flows - Continued
Proprietary FundsYear Ended June 30, 2017
The accompanying notes are an integral part of this statement.
30
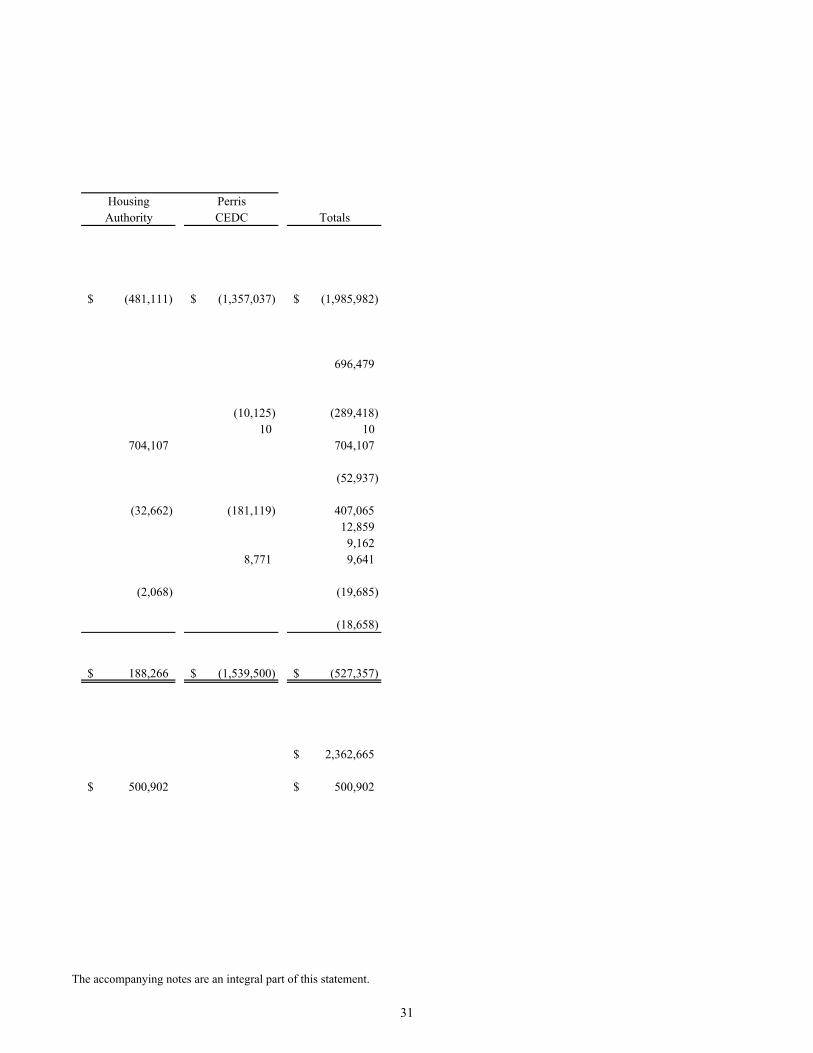
Housing PerrisAuthority CEDC Totals
(481,111)$ (1,357,037)$ (1,985,982)$
696,479
(10,125) (289,418)10 10
704,107 704,107
(52,937)
(32,662) (181,119) 407,06512,859
9,1628,771 9,641
(2,068) (19,685)
(18,658)
188,266$ (1,539,500)$ (527,357)$
2,362,665$
500,902$ 500,902$
The accompanying notes are an integral part of this statement.
31
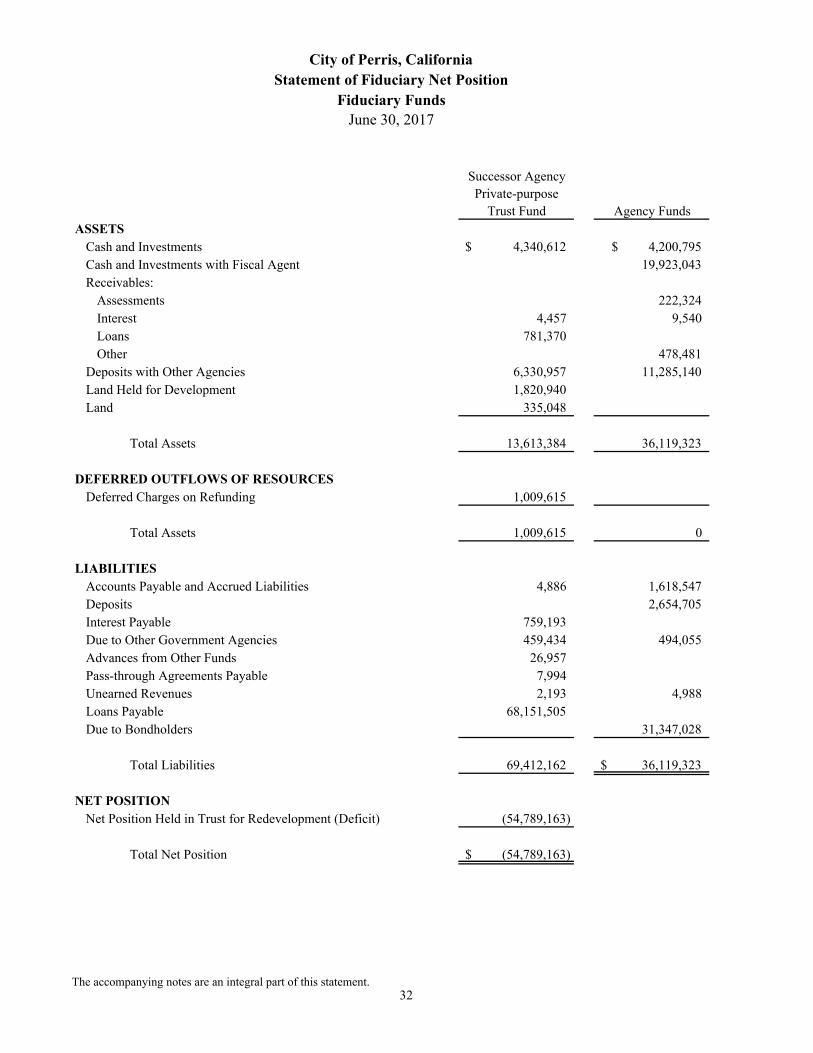
Successor AgencyPrivate-purpose
Trust Fund Agency FundsASSETS
Cash and Investments 4,340,612$ 4,200,795$ Cash and Investments with Fiscal Agent 19,923,043 Receivables:
Assessments 222,324 Interest 4,457 9,540 Loans 781,370 Other 478,481
Deposits with Other Agencies 6,330,957 11,285,140 Land Held for Development 1,820,940 Land 335,048
Total Assets 13,613,384 36,119,323
DEFERRED OUTFLOWS OF RESOURCESDeferred Charges on Refunding 1,009,615
Total Assets 1,009,615 0
LIABILITIESAccounts Payable and Accrued Liabilities 4,886 1,618,547 Deposits 2,654,705 Interest Payable 759,193 Due to Other Government Agencies 459,434 494,055 Advances from Other Funds 26,957 Pass-through Agreements Payable 7,994 Unearned Revenues 2,193 4,988 Loans Payable 68,151,505 Due to Bondholders 31,347,028
Total Liabilities 69,412,162 36,119,323$
NET POSITIONNet Position Held in Trust for Redevelopment (Deficit) (54,789,163)
Total Net Position (54,789,163)$
City of Perris, CaliforniaStatement of Fiduciary Net Position
Fiduciary FundsJune 30, 2017
The accompanying notes are an integral part of this statement.32
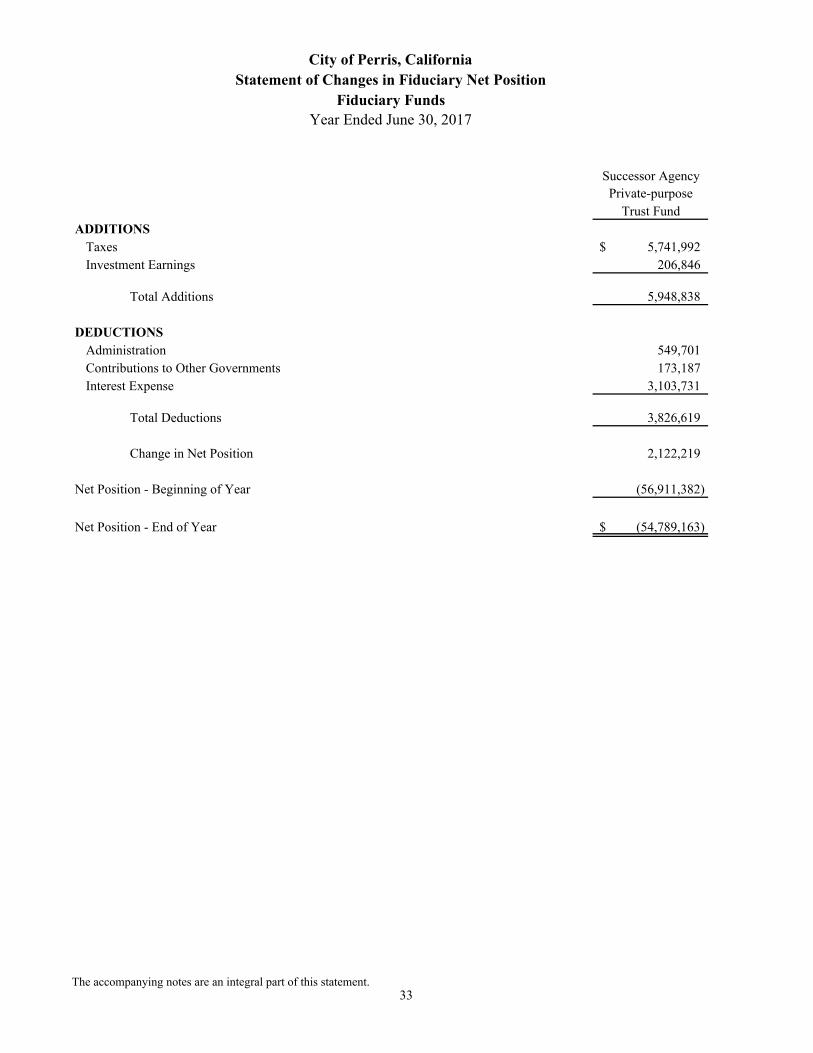
Successor AgencyPrivate-purpose
Trust FundADDITIONS
Taxes 5,741,992$ Investment Earnings 206,846
Total Additions 5,948,838
DEDUCTIONSAdministration 549,701 Contributions to Other Governments 173,187 Interest Expense 3,103,731
Total Deductions 3,826,619
Change in Net Position 2,122,219
Net Position - Beginning of Year (56,911,382)
Net Position - End of Year (54,789,163)$
City of Perris, CaliforniaStatement of Changes in Fiduciary Net Position
Fiduciary FundsYear Ended June 30, 2017
The accompanying notes are an integral part of this statement.33

This page intentionally left blank

City of Perris, California Notes to Financial Statements
June 30, 2017
34
NOTE DESCRIPTION PAGE 1 Reporting Entity and Summary of Significant Accounting Policies 35 - 48 2 Cash and Investments 48 - 53 3 Fair Value Measurement 53 - 54 4 Loans Receivable 54 5 Capital Assets 55 - 57 6 Long-term Liabilities 57 - 64 7 Compensated Absences 65 8 Assessment District and Community Facilities District Bonds 65 - 66 9 Single Family Mortgage Revenue Bonds 66 10 Inter-fund Receivables, Payables and Transfers 67 - 68 11 Net Position and Fund Balance 68 - 70 12 Other Required Individual Fund Disclosures 71 13 City Employees’ Retirement Plan (Defined Benefit Pension Plan) 71 - 77 14 Other Post Employment Benefits 77 - 80 15 Joint Venture 80 - 81 16 Risk Management 81 - 82 17 Commitments and Contingencies 82 18 Successor Agency Trust for Assets of Former Redevelopment Agency 82 - 84 19 Subsequent Events 84 20 Restatements 85
City of Perris, California Notes to Financial Statements
June 30, 2017
35
1) REPORTING ENTITY AND SUMMARY OF SIGNIFICANT ACCOUNTING POLICIES
A) Reporting Entity The City of Perris (the “City”) was incorporated in 1911 as a General Law City. The City operates under a Council -
Manager form of government, and provides the following services: general administrative services; public safety services; highway and street repairs and maintenance; water, sanitation, and sewer services.
The financial statements of the City of Perris include the financial activities of the City, the Perris Public Utility
Authority, the Perris Public Financing Authority, the Perris Housing Authority, the Perris Joint Powers Authority and Perris Community Economic Development Corporation. In accordance with GASB, the basic criteria for including an agency, institution, authority or other organization in a governmental unit's financial reporting entity is financial accountability. Financial accountability includes, but is not limited to 1) selection of the governing body, 2) imposition of will, 3) ability to provide a financial benefit to or impose financial burden on and 4) fiscal dependency.
There may, however, be factors other than financial accountability that are so significant that exclusion of a particular
agency from a reporting entity's financial statements would be misleading. These other factors include scope of public service and special financing relationships.
Based upon the application of these criteria, an agency, institution or authority, may be included as a component unit in
the primary government's financial statements. Blended component units, although legally separate entities, are, in substance, part of the government's operations and so data from these units are combined with data of the primary government. A discretely presented component unit, on the other hand, is reported in a separate column in the combined financial statements to emphasize it is legally separate from the government. All the component units are blended in these financial statements. The governing bodies of these component units are comprised of the City Council and the services they provide almost exclusively benefits the City of Perris. The City’s management oversees the operations of all component units in the same manner as the City. The Perris Community Economic Development Corporation is a nonprofit public benefit Corporation which the City is the sole corporate member. Each component unit presented has a June 30 year end. The following is a brief review of each component unit included in the primary government's reporting entity.
The Perris Public Utility Authority The City of Perris (City) and the Perris Redevelopment Agency (Agency) formed a Joint Powers Authority, pursuant to
a Joint Exercise of Powers Agreement, dated as of December 29, 1999, by and between the Agency and the City. The Perris Public Utility Authority (Utility Authority) was created to assist the City in its financing objectives by purchasing and operating the Sewer and Water systems from the City. The governing body of the Utility Authority is comprised of the City Council. On February 1, 2012, the Perris Redevelopment Agency was dissolved.
The City and the Utility Authority entered into a “Purchase Agreement”, dated March 16, 2000, to sell the Sewer and
Water Enterprise from the City to the Utility Authority. The sale price was based upon the completion of an appraisal of the Enterprise, which was not completed until November 2000. On August 28, 2001, the original purchase agreement was rescinded and replaced by a new purchase agreement. This agreement was subsequently rescinded on February 12, 2002. Therefore transactions related to the sale have not been enacted nor are they presented in these financial statements. The Utility Authority in December 2008, purchased the McCanna Ranch Water Company. The Utility Authority’s activities are blended with those of City in these financial statements and are reported as an enterprise fund. A component unit financial statement may be obtained at 101 North D Street, Perris, California 92507.
City of Perris, California Notes to Financial Statements
June 30, 2017
36
1) REPORTING ENTITY AND SUMMARY OF SIGNIFICANT ACCOUNTING POLICIES - Continued
A) Reporting Entity - Continued
The Perris Public Financing Authority
The Perris Public Financing Authority (the “Financing Authority”) is a joint powers authority organized pursuant to the
State of California Government Code, Section 6500. The Financing Authority exists under a Joint Exercise of Power
Agreement dated August 28, 1989, between the City of Perris and the Perris Redevelopment Agency. Its purpose is to
facilitate financing for public capital improvements of the City and the Agency. The Financing Authority’s activities
are blended with those of the City in these financial statements and are reported as a debt service fund. On February 1,
2012, the Perris Redevelopment Agency was dissolved. A component unit financial statement may be obtained at 101
North D Street, Perris, California 92570.
The Perris Housing Authority
The Perris Housing Authority (Housing Authority) was formed on March 29, 2011 and operates as a public authority
whose primary goal is to provide decent, safe and sanitary housing in a suitable living environment for families that
cannot afford private housing that comply with housing quality standards. A component unit financial statement may
be obtained at 101 North D Street, Perris, California 92570.
The Perris Joint Powers Authority
The Perris Joint Powers Authority (the “Authority”) is a joint exercise of powers between the City of Perris (the “City”)
and the Perris Housing Authority (the “Authority”), created by a joint powers agreement dated March 26, 2013. The
purpose of the Authority is to provide financing for public capital improvements and other programs within the City. A
component unit financial statement may be obtained at 101 North D Street, Perris, California 92570.
The Perris Community Economic Development Corporation
The Perris Community Economic Development Corporation (the “Perris CEDC”) was incorporated on April 16, 2014.
The Corporation was formed as a nonprofit public benefit corporation under Section 501(c)(3) of the Internal Revenue
Code. The specific and primary purpose of this corporation is to provide physical, economic, and educational
development and revitalization efforts resulting in expanded employment, economic prosperity and, business and
housing opportunities, for businesses and residents to provide such services that are associated with such specific
purpose as allowed by the law. The governing body of the Perris CEDC is comprised of the City Council. Upon
dissolution, any assets remaining shall be distributed to the City of Perris or a designated nonprofit fund, foundation or
corporation by the governing body. A component unit financial statement may be obtained at 101 North D Street,
Perris, California 92570.

City of Perris, California Notes to Financial Statements
June 30, 2017
37
1) REPORTING ENTITY AND SUMMARY OF SIGNIFICANT ACCOUNTING POLICIES - Continued
B) Implementation of Governmental Accounting Standards Board (GASB) Pronouncements Governmental Accounting Standard Board Statement No. 74 In June of 2015, GASB issued Statement No. 74, Financial Reporting for Postemployment Benefit Plans Other Than Pension Plans. This Statement was issued to improve the usefulness of information about postemployment benefits other than pensions (other postemployment benefits or OPEB) for making decisions and assessing accountability. This Statement replaces Statements no. 43, Financial Reporting for Post-employment Benefit Plans Other Than Pension Plans, as amended, and No. 57, OPEB Measurements by Agent Employers and Agent Multiple-Employer Plans. It also includes requirements for defined contribution OPEB plans that replace the requirements for those OPEB plans in Statement No. 25, Financial Reporting for Defined Benefit Pension Plans and Note Disclosures for Defined Contribution Plans, as amended, Statement 43, and Statement No. 50, Pension Disclosures. Statement No. 74 is effective for fiscal years beginning after June 15, 2016. Currently, this statement has no effect on the City’s financial statements.
Governmental Accounting Standard Board Statement No. 75 In June of 2015, GASB issued Statement No. 75, Accounting and Financial Reporting for Postemployment Benefits Other Than Pensions. This Statement was issued to improve accounting and financial reporting for postemployment benefits other than pensions (other postemployment benefits or OPEB). It also improves information provided by governmental employers about financial support for OPEB that is provided by other entities. This Statement replaces the requirements of Statements No. 45, Accounting and Financial Reporting by Employers for Postemployment Benefits Other Than Pensions, as amended, and No. 57, OPEB Measurements by Agent Employers and Agent Multiple-Employer Plans, for OPEB. Statement No. 74, Financial Reporting for Postemployment Benefit Plans Other Than Pension Plans, establishes new accounting and financial reporting requirements for OPEB plans. Statement No. 75 is effective for fiscal years beginning after June 15, 2017. The City has elected not to early implement GASB No. 75 and has not determined its effect on the City’s financial statements. Governmental Accounting Standard Board Statement No. 77 In August of 2015, GASB issued Statement No. 77, Tax Abatement Disclosures. This Statement is intended to provide financial statement users needed information about certain limitations on a government’s ability to raise resources and for financial reporting purposes requires disclosure on tax abatement information about (1) a reporting government’s own tax abatement agreements and (2) those that are entered into by other governments that reduce the reporting government’s tax revenues. Statement No. 77 is effective for periods beginning after December 15, 2015. Currently, this statement has no material effect on the City’s financial statements. Governmental Accounting Standard Board Statement No. 80 In January of 2016, GASB issued Statement No. 80, Blending Requirements for Certain Component Units – An Amendment of GASB Statement No. 14. This statement was issued to improve financial reporting by clarifying the financial statement presentation requirements for certain component units. This Statement amends the blending requirements established in paragraph 53 of Statement No. 14, The Financial Reporting Entity, as amended. This Statement amends the blending requirements for the financial statement presentation of component units of all state and local governments. The additional criterion requires blending of a component unit incorporated as a not-for
City of Perris, California Notes to Financial Statements
June 30, 2017
38
1) REPORTING ENTITY AND SUMMARY OF SIGNIFICANT ACCOUNTING POLICIES - Continued
B) Implementation of Governmental Accounting Standards Board (GASB) Pronouncements - Continued Governmental Accounting Standard Board Statement No. 80 - Continued profit corporation in which the primary government is the sole corporate member. The additional criterion does not apply to component units included in the financial reporting entity pursuant to the provisions of Statement No. 39, Determining Whether Certain Organizations Are Component Units. The requirements of this Statement are effective for reporting periods beginning after June 15, 2016. The City has implemented GASB No. 80 which is reflected in the City’s financial statements. Governmental Accounting Standard Board Statement No. 81 In March of 2016, GASB issued Statement No. 81, Irrevocable Split Interest Agreements. This statement was issued to improve accounting and financial reporting for irrevocable split-interest agreements by providing recognition and measurement guidance for situations in which a government is a beneficiary of the agreement. Split-interest agreements are a type of giving agreement used by donors to provide resources to two or more beneficiaries, including governments. Split-interest agreements can be created through trusts—or other legally enforceable agreements with characteristics that are equivalent to split-interest agreements—in which a donor transfers resources to an intermediary to hold and administer for the benefit of a government and at least one other beneficiary. This Statement requires that a government that receives resources pursuant to an irrevocable split-interest agreement recognize assets, liabilities, and deferred inflows of resources at the inception of the agreement. Furthermore, this Statement requires that a government recognize assets representing its beneficial interests in irrevocable split-interest agreements that are administered by a third party, if the government controls the present service capacity of the beneficial interests. This Statement requires that a government recognize revenue when the resources become applicable to the reporting period. The requirements of this Statement are effective for reporting periods beginning after December 15, 2016. The City has elected not to early implement GASB No. 81 and has not determined its effect on the City’s financial statements. Governmental Accounting Standard Board Statement No. 82 In March of 2016, GASB issued Statement No. 82, Pension Issues – An Amendment of GASB Statements No. 67, No. 68, and No. 73. This statement was issued to address certain issues that have been raised with respect to Statements No. 67, Financial Reporting for Pension Plans, No. 68, Accounting and Financial Reporting for Pensions, and No. 73, Accounting and Financial Reporting for Pensions and Related Assets That Are Not within the Scope of GASB Statement 68, and Amendments to Certain Provisions of GASB Statements 67 and 68. Specifically, this Statement addresses issues regarding (1) the presentation of payroll-related measures in required supplementary information, (2) the selection of assumptions and the treatment of deviations from the guidance in an Actuarial Standard of Practice for financial reporting purposes, and (3) the classification of payments made by employers to satisfy employee (plan member) contribution requirements. Prior to the issuance of this Statement, Statements 67 and 68 required presentation of covered-employee payroll, which is the payroll of employees that are provided with pensions through the pension plan, and ratios that use that measure, in schedules of required supplementary information. This Statement amends Statements 67 and 68 to instead require the presentation of covered payroll, defined as the payroll on which contributions to a pension plan are based, and ratios that use that measure. This Statement also clarifies the term deviation used in Actuarial Standards of Practice and payments made by the employer to satisfy contribution requirements. The requirements of this Statement are effective for reporting
City of Perris, California Notes to Financial Statements
June 30, 2017
39
1) REPORTING ENTITY AND SUMMARY OF SIGNIFICANT ACCOUNTING POLICIES - Continued
B) Implementation of Governmental Accounting Standards Board (GASB) Pronouncements - Continued Governmental Accounting Standard Board Statement No. 82 - Continued periods beginning after June 15, 2016, except for the requirements of this Statement for the selection of assumptions in a circumstance in which an employer’s pension liability is measured as of a date other than the employer’s most recent fiscal year-end. In that circumstance, the requirements for the selection of assumptions are effective for that employer in the first reporting period in which the measurement date of the pension liability is on or after June 15, 2017. The City has implemented GASB No. 82 which is reflected on the City’s financial statements. Governmental Accounting Standard Board Statement No. 83 In November of 2016, GASB issued Statement No. 83, Certain Asset Retirement Obligations. This Statement was issued to address the criteria for the recognition and measurement of the liability and corresponding deferred outflows of resources associated with certain asset retirement obligations (AROs). An ARO is a legally enforceable liability associated with the retirement of a tangible capital asset. Statement No. 83 is effective for reporting periods beginning after June 15, 2018. The impact of the implementation of this Statement to the City’s financial statements has not been assessed at this time.
Governmental Accounting Standard Board Statement No. 84 In January of 2017, GASB issued Statement No. 84, Fiduciary Activities. This Statement was issued to improve guidance regarding the identification of fiduciary activities for accounting and financial reporting purposes. This Statement establishes the criteria for identifying fiduciary activities which should be reported in a fiduciary fund in the basic financial statements. The fiduciary funds that should be reported, if applicable: a) pensions trust funds, b) investment trust funds, c) private purpose trust funds, d) custodial funds. Statement No. 84 is effective for reporting periods beginning after December 15, 2018. The impact of the implementation of this Statement to the City’s financial statements has not been assessed at this time. Governmental Accounting Standard Board Statement No. 85 In March of 2017, GASB issued Statement No. 85, Omnibus 2017. This Statement addresses practice issues that have risen from the implementation of certain GASB Statements; primarily pension and OPEB related measurement, recognition, timing, and reporting issues. Other issues include blending of component units for governments whose primary activity is business-type, goodwill reporting, classifying real estate held by insurance entities and measuring particular investments at amortized cost. This Statement is effective for reporting periods beginning after June 15, 2017. The impact of the implementation of this Statement to the City’s financial statements has not been assessed at this time. Governmental Accounting Standard Board Statement No. 86 In May of 2017, GASB issued Statement No. 86, Certain Debt Extinguishment Issues. This Statement expands upon GASB No. 7 Advance Refundings Resulting in Defeasance of Debt which defines debt defeased in substance and the criteria for the trusts used to extinguish debt. This Statement establishes essentially the same requirements for
City of Perris, California Notes to Financial Statements
June 30, 2017
40
1) REPORTING ENTITY AND SUMMARY OF SIGNIFICANT ACCOUNTING POLICIES - Continued
B) Implementation of Governmental Accounting Standards Board (GASB) Pronouncements - Continued Governmental Accounting Standard Board Statement No. 86 - Continued when a government places cash and other monetary assets acquired with only existing resources in an irrevocable trust to extinguish the debt. This Statement is effective for reporting periods beginning after June 15, 2017. The impact of the implementation of this Statement to the City’s financial statements has not been assessed at this time. Governmental Accounting Standard Board Statement No. 87 In June of 2017, GASB issued Statement No. 87, Leases. The intent of this Statement is to improve accounting and financial reporting for government leases by requiring recognition of certain lease assets and liabilities for leases that were previously classified as operating leases and recognized as inflows of resources or outflows of resources based on the payment provisions of the contract. This Statement establishes a single model for lease accounting based on the foundational principle that leases are financings of the right to use an underlying asset. This Statement is effective for reporting periods beginning after December 15, 2019. The impact of the implementation of this Statement to the City’s financial statements has not been assessed at this time.
C) Basis of Presentation The basic financial statements of the City of Perris have been prepared in conformity with accounting principles
generally accepted in the United States of America (“GAAP”). The Governmental Accounting Standards Board (“GASB”) is the accepted standard setting body for governmental accounting and financial reporting purposes.
These statements require that the financial statements described below be presented: Government-wide Statements: The Government-wide financial statements (i.e., the Statement of Net Position and the
Statement of Activities) report information on all of the nonfiduciary activities of the primary government and its component units. For the most part, the effect of inter-fund activity has been removed from these statements. Governmental activities, which normally are supported by taxes and intergovernmental revenues, are reported separately from business-type activities, which rely to a significant extent on fees and charges for support.
The Statement of Activities demonstrates the degree to which the direct expenses of a given function or segment are
offset by program revenues. Direct expenses are expenses that are clearly identifiable with a specific program, project, function or segment. Program revenues of the City include: 1) charges to customers or applicants who purchase, use, or directly benefit from goods, services, or privileges provided by a given function or segment and 2) grants and contributions that are restricted to meeting the operational or capital requirements of a particular function or segment.
Taxes and other items that are properly not included among program revenues are reported instead as general revenues. Fund Financial Statements: Separate financial statements are provided for governmental funds, proprietary funds, and
fiduciary funds, even though the latter are excluded from the government-wide financial statements. Major individual governmental funds are reported as separate columns in the fund financial statements. All remaining governmental funds are aggregated and reported as non-major funds.
City of Perris, California Notes to Financial Statements
June 30, 2017
41
1) REPORTING ENTITY AND SUMMARY OF SIGNIFICANT ACCOUNTING POLICIES - Continued
D) Measurement Focus, Basis of Accounting, and Financial Statement Presentation The government-wide financial statements are reported using the economic resources measurement focus and the
accrual basis of accounting, as are the proprietary fund, private-purpose trust funds and fiduciary fund financial statements except for agency funds which have no measurement focus. Revenues are recorded when earned and expenses are recorded when a liability is incurred, regardless of the timing of related cash flows.
Property taxes are recognized as revenues in the year for which they are levied. Grants and similar items are
recognized as revenue as soon as all eligibility requirements imposed by the providers have been met. Governmental fund financial statements are reported using the current financial resources measurement focus and the
modified accrual basis of accounting. Revenues are recognized as soon as they are both measurable and available. Revenues are considered to be available when they are collected within the current period or soon enough thereafter to pay liabilities of the current period. For this purpose, the City considers revenues to be available if they are collected within 60 days of the end of the current fiscal period. Expenditures generally are recorded when a liability is incurred, as under accrual accounting. However, debt service expenditures, as well as expenditures related to compensated absences and claims and judgements, are recorded only when payment is due.
Taxes, intergovernmental revenues, licenses, and interest associated with the current fiscal period are all considered to
be susceptible to accrual, and are therefore recognized as revenues of the current fiscal period. Only the portion of special assessments receivable due within the current fiscal period is considered to be susceptible to accrual as revenue of the current period. All other revenue items are considered to be measurable and available only when cash is received by the City.
The City reports the following major governmental funds:
The General Fund is used to account for all financial resources of the City, except for those required to be accounted for in another fund.
The Public Financing Authority Debt Service Fund is used to account for the accumulation of resources for, and
the repayment of, long-term debt principal, interest and related costs of the Authority. The Joint Powers Authority Debt Service Fund is used to provide financing and account for the accumulation of
resources for, and the repayment of long-term debt principal, interests and related costs for capital improvements and other programs within the City.
The Road and Bridge Benefit District Special Revenue Fund is used to account for funds received from assessment
and developer fees, and, the expenditures for the maintenance and improvements of roads and bridges. The Storm Drain Development Capital Project Fund is used to account for the capital improvements of upgrading
the storm drains within the City.

City of Perris, California Notes to Financial Statements
June 30, 2017
42
1) REPORTING ENTITY AND SUMMARY OF SIGNIFICANT ACCOUNTING POLICIES - Continued
D) Measurement Focus, Basis of Accounting, and Financial Statement Presentation - Continued
The Capital Improvement Projects Capital Project Fund is used to account for miscellaneous improvement projects which are financed primarily from developer contributions and transportation uniform mitigation fees.
The City reports the following major proprietary funds: The Sewer Utility accounts for the activities of the City’s sewer utility distribution operations. The Public Utility Authority accounts for the water and wastewater activities of McCanna Ranch area. The Water Utility accounts for the activities of the City's water utility distribution operations. The Solid Waste Utility accounts for the activities of the City’s solid waste utility distribution operations. The Housing Authority, accounts for the activities of the City’s housing operations. The Perris Community Economic Development Corporation (CEDC) accounts for the activities of the City’s
nonprofit public benefit Corporation.
Additionally, the City reports the following fund types:
The Enterprise Funds are used to account for operations (a) that are financed and operated in a manner similar to private business enterprises - where the intent of the governing body is that the costs (expenses, including depreciation) of providing goods or services to the general public on a continuing basis be financed or recovered primarily through user charges, or (b) where the governing body has decided that periodic determination of revenues earned, expenses incurred and/or net income is appropriate for capital maintenance, public policy, management control, accountability or other purposes. Revenues are fully accrued to include unbilled services at year end.
The Fiduciary Funds are used to account for resources held in the benefit of parties outside of the government.
Fiduciary funds are not reported in the government-wide financial statements because the resources of those funds are not available to support the City's own programs. The accounting used by the fiduciary funds is much like that used for proprietary funds.
The City reports the following activities: The Private-purpose Trust Fund is used to report resources held in trust for the Successor Agency to the Perris
Redevelopment Agency. The Agency Funds are used to account for money received by the City as an agent for individuals, other
governments and other entities. These funds account for the following activities:
City of Perris, California Notes to Financial Statements
June 30, 2017
43
1) REPORTING ENTITY AND SUMMARY OF SIGNIFICANT ACCOUNTING POLICIES - Continued
D) Measurement Focus, Basis of Accounting, and Financial Statement Presentation - Continued
1) The City receives deposits from other organizations or private individuals in a custodial nature.
2) Special taxes and assessments are receipted to the City to make principal and interest payments for Community Facilities Districts bonds. The City has no obligations to these debt issues.
The City applies all applicable GASB pronouncements in accounting and reporting for its proprietary operations. As a general rule, the effect of inter-fund activity has been eliminated from the government-wide financial statements.
Exceptions to this general rule are interfund services provided and used. Elimination of these charges would distort the direct costs and program revenues reported for the various functions concerned. Direct expenses have not been eliminated from the functional categories; indirect expenses and internal payments have been eliminated.
Amounts reported as program revenues include 1) charges to customers or applicants for goods, services, or privileges
provided, 2) operating grants and contributions, and 3) capital grants and contributions, including special assessments. Internally dedicated resources are reported as general revenues rather than as program revenues. Likewise, general revenues include all taxes.
Proprietary funds distinguish operating revenues and expenses from nonoperating items. Operating revenues and
expenses generally result from providing services and producing and delivering goods in connection with a proprietary fund’s principal ongoing operations. All revenues and expenses not meeting this definition are reported as nonoperating revenues and expenses.
When both restricted and unrestricted resources are available for use, it is the City’s policy to use restricted resources
first, and then use unrestricted resources as they are needed.
E) Encumbrances Encumbrance accounting under which purchase orders, contracts and other commitments for the expenditure of monies
are recorded in order to reserve that portion of the applicable appropriations is employed as an extension of formal budgetary integration in all governmental funds. Unencumbered appropriations of the governmental funds automatically lapse at year end.
F) Investments As a governmental entity other than an external investment pool in accordance with GASB 31, the City's investments
are stated at fair value. In applying GASB 31, the City utilized the following methods and assumptions:

City of Perris, California Notes to Financial Statements
June 30, 2017
44
1) REPORTING ENTITY AND SUMMARY OF SIGNIFICANT ACCOUNTING POLICIES - Continued
F) Investments - Continued
1) Fair value is based on quoted market prices as of the valuation date;
2) The portfolio did not hold investments in any of the following: a) Items required to be reported at amortized cost, b) Items in external pools that are not SEC-registered, c) Items subject to involuntary participation in an external pool, d) Items associated with a fund other than the fund to which the income is assigned; 3) Aside from investments clearly identified as belonging to a specific fund, any unrealized gain/loss resulting from
the valuation will be recognized within the General Fund to the extent its cash and investments' balance exceeds the cumulative value of those investments subject to GASB 31;
4) The gain/loss resulting from valuation will be reported within the revenue account "investment earnings" on the
Statement of Activities and the Statement of Revenues, Expenditures and Changes in Fund Balance for Governmental Funds. For Proprietary Fund Types the gain/loss from valuation will be reported within the “investment earnings” account on the Statement of Activities and the Statement of Revenues, Expenses and Changes in Net Position for Proprietary Funds.
G) Capital Assets
Capital assets, which include land, buildings, building improvements, machinery, vehicles, and infrastructure assets, are reported in the government-wide financial statements. Capital assets are recorded at cost where historical records are available and at an estimated historical cost where no historical records exist. Capital assets purchased in excess of $5,000, and buildings and building improvements purchased in excess of $20,000 are capitalized if they have an expected useful life of 2 years or more. Infrastructure is capitalized if cost is in excess of $50,000 and it has an expected useful life of 2 years or more. The cost of normal maintenance and repairs that do not add to the value of the asset’s lives are not capitalized. Major capital outlay for capital assets and improvements are capitalized as projects are constructed. For debt-financed capital assets, interest incurred during the construction phase is reflected in the capitalization value of the asset constructed, net of interest earned on the invested proceeds over the same period. Capital assets acquired through lease obligations are valued at the present value of future lease payments at the date acquired. Donated capital assets are valued at their estimated acquisition value rather than fair market value at the date of donation.
Capital assets used in operations are depreciated over their estimated useful lives using the straight-line method in the government-wide financial statements and in the fund financial statements of the proprietary funds. Depreciation is charged as an expense against operations and accumulated depreciation is reported on the respective balance sheet.
City of Perris, California Notes to Financial Statements
June 30, 2017
45
1) REPORTING ENTITY AND SUMMARY OF SIGNIFICANT ACCOUNTING POLICIES - Continued
G) Capital Assets - Continued The range of lives used for depreciation purposes for each capital asset class is as follows:
Buildings 30 - 45 yearsBuilding Improvements 7 - 30 yearsMachinery 6 - 15 yearsVehicles 5 - 15 yearsInfrastructure 20 - 40 yearsStructures and Improvements 35 - 40 yearsReservoirs and Manholes 50 - 60 yearsBoosters 25 yearsOther Equipment and Services 35 - 60 years
H) Appropriations Limit Under Article XIIIB of the California Constitution (the GANN Spending Limitation Initiative), the City is restricted as
to the amount of annual appropriations from the proceeds of taxes, and if proceeds of taxes exceed allowed appropriations, the excess must either be refunded to the State Controller or returned to the taxpayers through revised tax rates, revised fee schedules or other refund arrangements. For the fiscal year ended June 30, 2017, proceeds of taxes did not exceed appropriations.
I) Fund Equity Fund balance in governmental funds are reported in classifications that comprise a hierarchy based primarily on the
extent to which the City is bound to honor constraints on the specific purposes for which amounts in those funds can be spent. The City considers restricted fund balance to have been spent first when an expenditure is incurred for purposes for which both restricted and unrestricted fund balance is available. Similarly, when an expenditure is incurred for purposes for which amounts in any of the unrestricted classifications of fund balance could be used, the City considers committed amounts to be reduced first, followed by assigned amounts and then unassigned amounts. The following classifications describe the relative strength of the spending constraints placed on the purposes for which resources can be used:
Nonspendable Fund Balance - Includes amounts that cannot be spent because they are either not in spendable form,
or, for legal or contractual reasons, must be kept intact. Restricted Fund Balance - Constraints placed on the use of these resources are either externally imposed by
creditors (such as through debt covenants), grantors, contributors or other governments; or are imposed by law (through constitutional provisions or enabling legislation).
City of Perris, California Notes to Financial Statements
June 30, 2017
46
1) REPORTING ENTITY AND SUMMARY OF SIGNIFICANT ACCOUNTING POLICIES - Continued
I) Fund Equity - Continued Committed Fund Balance - Amounts that can only be used for specific purposes because of a formal action
(ordinance) by the government's highest level of decision-making authority. The City Council is the highest level of decision-making authority for the City that can, by adoption of an ordinance prior to the end of the fiscal year, commit fund balance. Once adopted, the limitation imposed by the ordinance remains in place until a similar action is taken to remove or revise the limitation.
Assigned Fund Balance - Amounts that are constrained by the City’s intent to be used for specific purposes, but that
do not meet the criteria to be classified as restricted or committed. Intent can be stipulated by the governing body, another body, or by an official to whom the authority has been given. The City Council has by resolution authorized the Finance Director to assign fund balance. The City Council may also assign fund balance, however, unlike commitments, assignments generally only exist temporarily. In other words, an additional action does not normally have to be taken for the removal of an assignment.
Unassigned Fund Balance - These are either residual positive net resources of the General Fund in excess of what
can properly be classified in one of the other categories, or negative balances in all other funds.
J) General Fund Reserve Policy The City adopted a policy to commit a General Fund Reserve amount consisting of 35% of the projected budgeted
revenues for any given fiscal year for specific uses such as economic uncertainty, declaration of a local, state or federal emergency/disaster, or another other emergency expenditure deemed appropriate by the City Council. This commitment can only be modified or removed by an action of the City Council.
K) Use of Estimates The financial statements have been prepared in accordance with accounting principles generally accepted in the United
States of America and necessarily include amounts based on estimates and assumptions by Management. Actual results could differ from those amounts.
L) Cash and Cash Equivalents
For purposes of the Statement of Cash Flows, the City considers all cash and investments with original maturities of 90 days or less to be cash or cash equivalents. In addition, cash invested in the City's cash management pool is considered to be cash equivalents.
M) Inter-fund Activity
In the governmental fund financial statements, activity between funds that are representative of lending/borrowing arrangements outstanding at the end of the fiscal year are referred to as either “due to/from other funds” (i.e., the current portion of inter-fund loans) or “advances to/from other funds” (i.e., the noncurrent portion of inter-fund loans). All other outstanding balances between funds are reported as “due to/from other funds.”
City of Perris, California Notes to Financial Statements
June 30, 2017
47
1) REPORTING ENTITY AND SUMMARY OF SIGNIFICANT ACCOUNTING POLICIES - Continued
M) Inter-fund Activity - Continued Noncurrent portions of long-term inter-fund loan receivables are reported as advances and such amounts are offset
equally by a fund balance reserve account which indicates that they do not constitute expendable available financial resources and therefore are not available for appropriation.
In the government-wide financial statements, these activities have been eliminated.
N) Property Taxes
Property taxes are attached as an enforceable lien on property as of January 1. Taxes are levied on July 1 and are payable in two installments on November 1 and February 1. Such taxes are delinquent on December 10 and April 10, respectively. Any unpaid amounts at the end of the fiscal year are recorded as accounts receivable. The County of Riverside bills and collects the property taxes and subsequently remits the amount due to the City in installments during the year. Historically, the City has received substantially all of the taxes levied within two years from the date they are levied.
The County is permitted by State Law (Article XIIIB of the California Constitution) to levy taxes at one percent (1%) of full market value (at time of purchase) and can increase the property's value no more than two percent (2%) per year. The City receives a share of this basic levy proportionate to what it received in the 1976 to 1978 period.
O) Pensions
For purposes of measuring the net pension liability and deferred outflows/inflows of resources related to pensions, and pension expense, information about the fiduciary net position of the City’s California Public Employees’ Retirement System (CalPERS) plan (Plan) and additions to/deductions from the Plans’ fiduciary net position have been determined on the same basis as they are reported by CalPERS. For this purpose, benefit payments (including refunds of employee contributions) are recognized when due and payable in accordance with the benefit terms. Investments are reported at fair value.
P) Deferred Outflows/Inflows of Resources In addition to assets, the statement of financial position will sometimes report a separate section for deferred outflows of
resources. This separate financial statement element, deferred outflows of resources, represents a consumption of net position that applies to a future period(s) and so will not be recognized as an outflow of resources (expenses/expenditure) until then. The City has two items that qualifies for reporting in this category. The City has deferred outflows related to pensions, which arises only under a full accrual basis of accounting. Accordingly, this item (pension related items), is reported only in the government-wide statement of net position. This includes pension contributions subsequent to the measurement date of the net pension liability and other amounts (see Note 13), which are amortized by an actuarial determined period. The City also has deferred charges on refunding (net) that resulted from the difference in the carrying value of the refunded debt and its reacquisition price. This amount is deferred and amortized over the shorter of the life of the refunded or refunding debt.
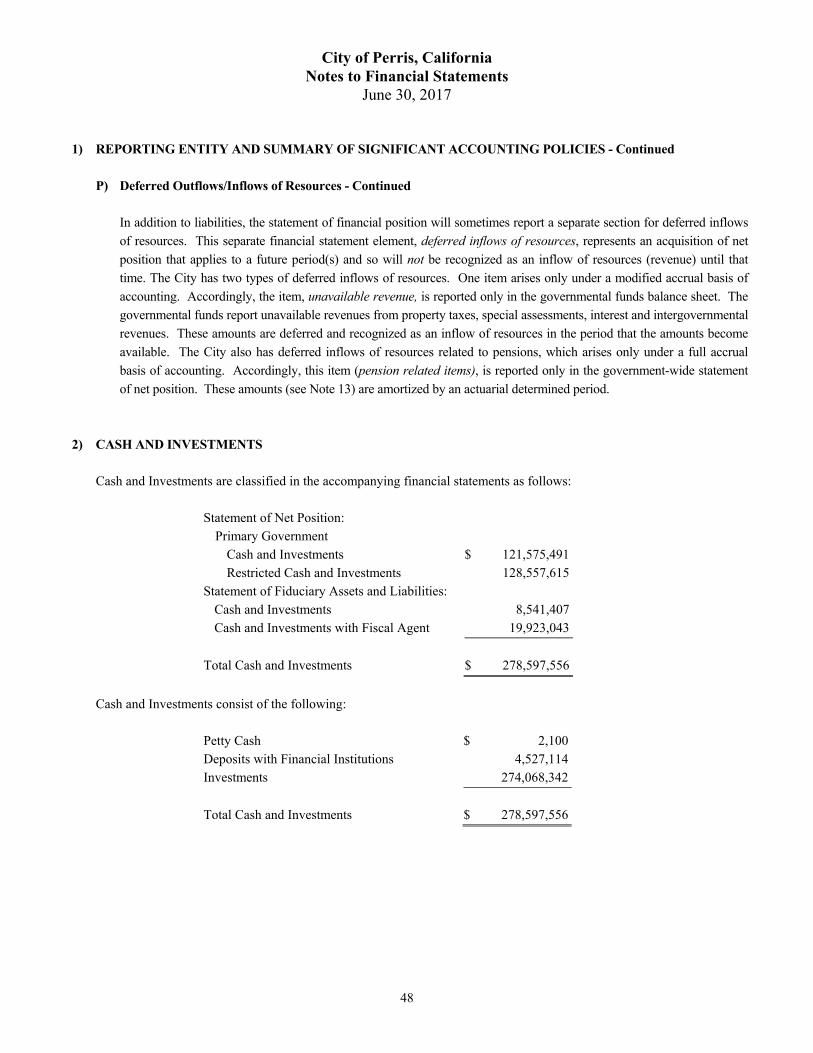
City of Perris, California Notes to Financial Statements
June 30, 2017
48
1) REPORTING ENTITY AND SUMMARY OF SIGNIFICANT ACCOUNTING POLICIES - Continued
P) Deferred Outflows/Inflows of Resources - Continued In addition to liabilities, the statement of financial position will sometimes report a separate section for deferred inflows
of resources. This separate financial statement element, deferred inflows of resources, represents an acquisition of net
position that applies to a future period(s) and so will not be recognized as an inflow of resources (revenue) until that
time. The City has two types of deferred inflows of resources. One item arises only under a modified accrual basis of
accounting. Accordingly, the item, unavailable revenue, is reported only in the governmental funds balance sheet. The
governmental funds report unavailable revenues from property taxes, special assessments, interest and intergovernmental
revenues. These amounts are deferred and recognized as an inflow of resources in the period that the amounts become
available. The City also has deferred inflows of resources related to pensions, which arises only under a full accrual
basis of accounting. Accordingly, this item (pension related items), is reported only in the government-wide statement
of net position. These amounts (see Note 13) are amortized by an actuarial determined period.
2) CASH AND INVESTMENTS Cash and Investments are classified in the accompanying financial statements as follows:
Statement of Net Position: Primary Government Cash and Investments $ 121,575,491 Restricted Cash and Investments 128,557,615Statement of Fiduciary Assets and Liabilities: Cash and Investments 8,541,407 Cash and Investments with Fiscal Agent 19,923,043
Total Cash and Investments $ 278,597,556
Cash and Investments consist of the following:
Petty Cash $ 2,100Deposits with Financial Institutions 4,527,114Investments 274,068,342
Total Cash and Investments $ 278,597,556
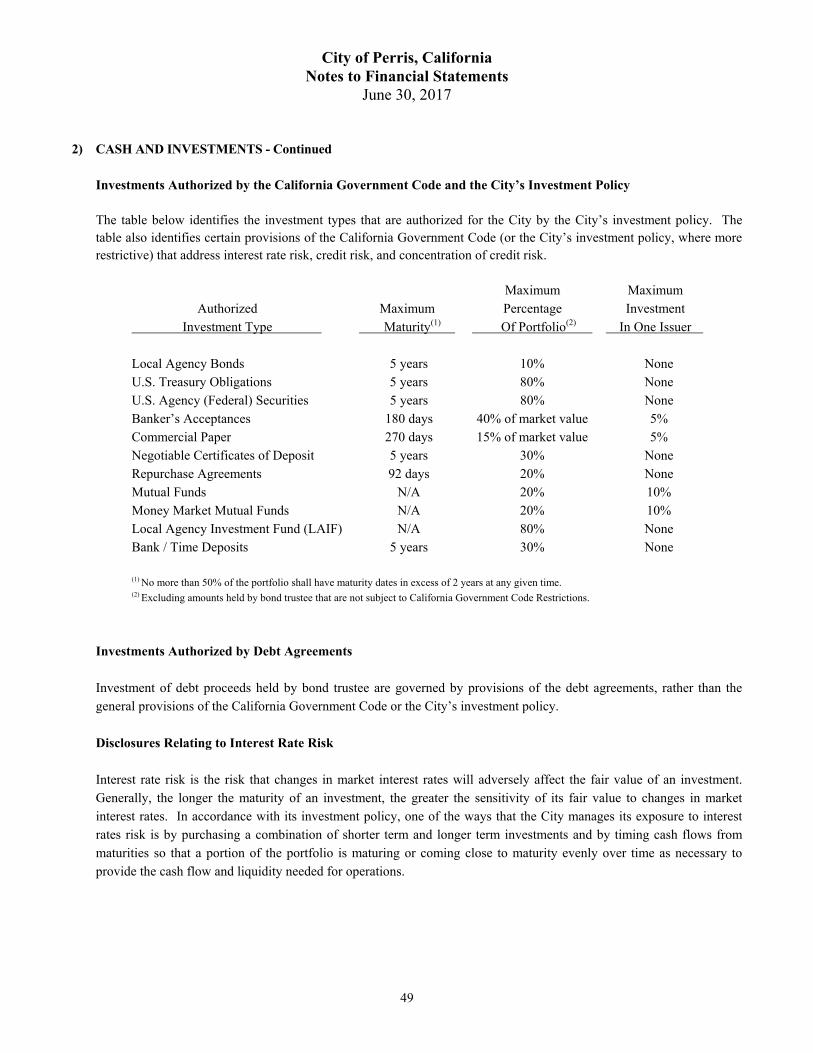
City of Perris, California Notes to Financial Statements
June 30, 2017
49
2) CASH AND INVESTMENTS - Continued
Investments Authorized by the California Government Code and the City’s Investment Policy
The table below identifies the investment types that are authorized for the City by the City’s investment policy. The table also identifies certain provisions of the California Government Code (or the City’s investment policy, where more restrictive) that address interest rate risk, credit risk, and concentration of credit risk.
Maximum Maximum Authorized Maximum Percentage Investment Investment Type Maturity (1) Of Portfolio(2) In One Issuer Local Agency Bonds 5 years 10% None U.S. Treasury Obligations 5 years 80% None U.S. Agency (Federal) Securities 5 years 80% None Banker’s Acceptances 180 days 40% of market value 5% Commercial Paper 270 days 15% of market value 5% Negotiable Certificates of Deposit 5 years 30% None Repurchase Agreements 92 days 20% None Mutual Funds N/A 20% 10% Money Market Mutual Funds N/A 20% 10% Local Agency Investment Fund (LAIF) N/A 80% None Bank / Time Deposits 5 years 30% None (1) No more than 50% of the portfolio shall have maturity dates in excess of 2 years at any given time. (2) Excluding amounts held by bond trustee that are not subject to California Government Code Restrictions.
Investments Authorized by Debt Agreements
Investment of debt proceeds held by bond trustee are governed by provisions of the debt agreements, rather than the general provisions of the California Government Code or the City’s investment policy.
Disclosures Relating to Interest Rate Risk
Interest rate risk is the risk that changes in market interest rates will adversely affect the fair value of an investment. Generally, the longer the maturity of an investment, the greater the sensitivity of its fair value to changes in market interest rates. In accordance with its investment policy, one of the ways that the City manages its exposure to interest rates risk is by purchasing a combination of shorter term and longer term investments and by timing cash flows from maturities so that a portion of the portfolio is maturing or coming close to maturity evenly over time as necessary to provide the cash flow and liquidity needed for operations.
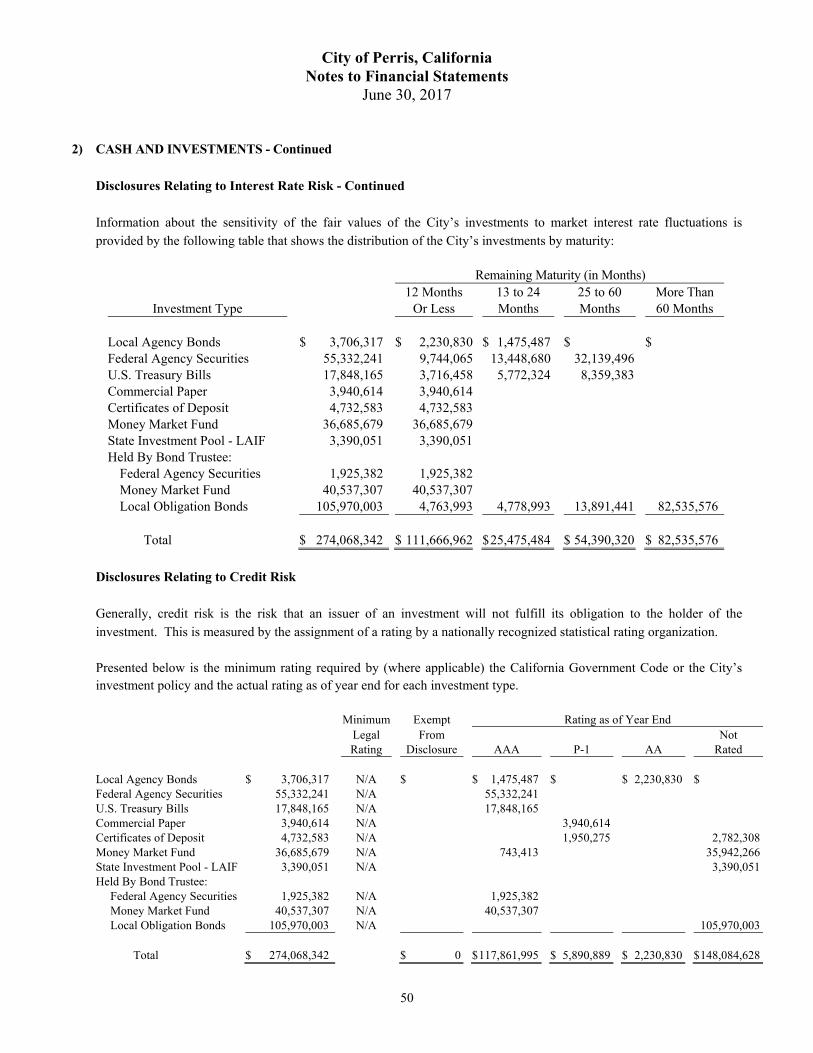
City of Perris, California Notes to Financial Statements
June 30, 2017
50
2) CASH AND INVESTMENTS - Continued
Disclosures Relating to Interest Rate Risk - Continued Information about the sensitivity of the fair values of the City’s investments to market interest rate fluctuations is provided by the following table that shows the distribution of the City’s investments by maturity:
Remaining Maturity (in Months) 12 Months 13 to 24 25 to 60 More Than
Investment Type Or Less Months Months 60 Months Local Agency Bonds $ 3,706,317 $ 2,230,830 $ 1,475,487 $ $ Federal Agency Securities 55,332,241 9,744,065 13,448,680 32,139,496 U.S. Treasury Bills 17,848,165 3,716,458 5,772,324 8,359,383 Commercial Paper 3,940,614 3,940,614 Certificates of Deposit 4,732,583 4,732,583 Money Market Fund 36,685,679 36,685,679 State Investment Pool - LAIF 3,390,051 3,390,051 Held By Bond Trustee: Federal Agency Securities 1,925,382 1,925,382 Money Market Fund 40,537,307 40,537,307 Local Obligation Bonds 105,970,003 4,763,993 4,778,993 13,891,441 82,535,576 Total $ 274,068,342 $ 111,666,962 $ 25,475,484 $ 54,390,320 $ 82,535,576
Disclosures Relating to Credit Risk Generally, credit risk is the risk that an issuer of an investment will not fulfill its obligation to the holder of the
investment. This is measured by the assignment of a rating by a nationally recognized statistical rating organization. Presented below is the minimum rating required by (where applicable) the California Government Code or the City’s investment policy and the actual rating as of year end for each investment type.
Minimum Exempt Rating as of Year End Legal From Not Rating Disclosure AAA P-1 AA Rated Local Agency Bonds $ 3,706,317 N/A $ $ 1,475,487 $ $ 2,230,830 $ Federal Agency Securities 55,332,241 N/A 55,332,241 U.S. Treasury Bills 17,848,165 N/A 17,848,165 Commercial Paper 3,940,614 N/A 3,940,614 Certificates of Deposit 4,732,583 N/A 1,950,275 2,782,308Money Market Fund 36,685,679 N/A 743,413 35,942,266State Investment Pool - LAIF 3,390,051 N/A 3,390,051Held By Bond Trustee: Federal Agency Securities 1,925,382 N/A 1,925,382 Money Market Fund 40,537,307 N/A 40,537,307 Local Obligation Bonds 105,970,003 N/A 105,970,003 Total $ 274,068,342 $ 0 $ 117,861,995 $ 5,890,889 $ 2,230,830 $ 148,084,628
City of Perris, California Notes to Financial Statements
June 30, 2017
51
2) CASH AND INVESTMENTS - Continued
Concentration of Credit Risk Investments in any one issuer (other than U.S. Treasury securities, mutual funds, and external investment pools) that
represent 5% or more of total City’s investments are as follows:
Issuer Investment Type Reported Amount Federal Home Loan Mortgage Corporation Federal Agency Securities $ 17,040,874 Federal National Mortgage Association Federal Agency Securities $ 17,686,918 First American Prime Obligations Fund Money Market Fund $ 40,607,209 Citizens Business Bank Money Market Fund $ 36,615,250 CFD 2005-2 Special Tax Bonds, 2015 Refunding Bonds Local Obligation Bonds $ 13,746,208
Custodial Credit Risk Custodial credit risk for deposits is the risk that, in the event of the failure of a depository financial institution, a government
will not be able to recover its deposits or will not be able to recover collateral securities that are in the possession of an outside party. The custodial credit risk for investments is the risk that, in the event of the failure of the counterparty (e.g., broker-dealer) to a transaction, a government will not be able to recover the value of its investment or collateral securities that are in the possession of another party. The California Government Code and the City’s investment policy do not contain legal or policy requirements that would limit the exposure to custodial credit risk for deposits or investments, other than the following provision for deposits: The California Government Code requires that a financial institution secure deposits made by state or local government units by pledging securities in an undivided collateral pool held by a depository regulated under state law (unless so waived by the governmental unit). The market value of the pledged securities in the collateral pool must equal at least 110% of the total amount deposited by the public agencies. California law also allows financial institutions to secure City deposits by pledging first trust deed mortgage notes having a value of 150% of the secured public deposits.
As of June 30, 2017, $4,277,114 of the City’s deposits with financial institutions in excess of federal depository insurance
limits were held in collateralized accounts, and none of the City’s investments were held by the broker-dealer (counterparty) that was used by the City to buy the securities.
Local Agency Investment Fund (LAIF) The LAIF is a special fund of the California State Treasury through which local governments may pool investments. The
City may invest up to $65,000,000 in the fund for the City and $65,000,000 for each eligible component unit. Investments in LAIF are highly liquid, as deposits can be converted to cash within twenty-four hours without loss of interest. Investments with LAIF are secured by the full faith and credit of the State of California. The yield of LAIF during the quarter ended June 30, 2017 was 0.92%. The carrying value and estimated market value of the LAIF Pool at June 30, 2017 was $77,621,442,814 and $77,539,216,146, respectively. The City's share of the Pool at June 30, 2017 was approximately 0.0044 percent.
City of Perris, California Notes to Financial Statements
June 30, 2017
52
2) CASH AND INVESTMENTS - Continued
Local Agency Investment Fund (LAIF) The fair value of the City’s investment in this pool is reported in the accompanying financial statements at amounts based
upon the City’s pro-rata share of the fair value provided by LAIF for the entire LAIF portfolio (in relation to the amortized cost of that portfolio). The balance available for withdrawal is based on the accounting records maintained by LAIF, which are recorded on an amortized cost basis. Included in LAIF's investment portfolio are certain derivative securities or similar products in the form of asset-backed securities totaling $1,419,481,000 and structured notes totaling $825,000,000. LAIF's and the City's exposure to risk (credit, market or legal) is not currently available.
The LAIF has oversight by the Local Investment Advisory Board. The LAIF Board consists of five members as designated
by Statute. LAIF is also regulated by California Government Code Section 16429. Investment in Bonds The Perris Public Financing Authority and the Perris Joint Powers Authority has purchased various Assessment District
(AD) and Community Facilities District (CFD) Bonds from the proceeds of revenue bonds issued to facilitate the respective bond issues of the Districts. Due to the long-term nature of these investments, a portion of fund balance has been reserved in the Governmental Fund Financial Statements.
The CFD and Assessment District Bonds are secured solely by assessments on property owners within the Districts. The
repayment schedules of the bonds, and interest thereon, to the above component units are concurrent and sufficient to satisfy the debt service requirements of the respective revenue bonds.
The CFD and Assessment District Bonds investments are summarized below.
Investment Fair Value
CFDs 88-1, 88-3 and 90-1 Special Tax Bonds, 2007 Series A and B $ 3,643,206CFD 93-2 Revised Special Tax Bonds, 2013 Series 2,105,000CFD 2002-1 Refunding Special Tax Bonds, 2013 Series 4,970,929CFD 2001-1 Special Tax Bonds (IA1, IA2 and IA3), 2014 Refunding Bonds 10,759,269CFD 2006-1 Special Tax Bonds, 2014 Refunding Bonds 2,397,133CFD 2004-3 Special Tax Refunding Bonds (IA1), 2014 Series 7,557,653CFD 2004-2 Special Tax Refunding Bonds, 2014 Series 4,534,560CFD 2001-1 Special Tax Refunding Bonds (IA6 and IA7), 2014 Series 12,902,661CFD 2004-1 Special Tax Refunding Bonds, 2014 Series A 2,262,395CFD 2003-1 Special Tax Refunding Bonds, 2014 Series 3,273,327CFD 2005-2 Special Tax Refunding Bonds 2015 Series 13,746,208CFD 2006-2 Special Tax Refunding Bonds 2015 Series 9,220,143CFD 2004-3 Special Tax Refunding Bonds (IA2), 2015 Series 8,084,622CFD 2014-2 Special Tax Refunding Bonds 2015 Series 2,927,688CFD 2005-1 Special Tax Refunding Bonds (IA3), 2015 Series 4,686,076

City of Perris, California Notes to Financial Statements
June 30, 2017
53
2) CASH AND INVESTMENTS - Continued Investment in Bonds - Continued
Investment Fair Value
CFD 2005-4 Special Tax Refunding Bonds, 2015 Series $ 5,914,814CFD 2005-4 Special Tax Bonds, 2015 Series 2,813,234CFD 2014-1 Special Tax Bonds, 2017 Series 4,171,085
$ 105,970,003
Cash and Investments with Fiscal Agent Included in cash and investments with fiscal agent are the debt securities issued by some of the City’s Assessment Districts
and Community Facilities Districts. These are special assessment obligations and, therefore, are not obligations of the Perris Public Financing Authority, Perris Joint Powers Authority or the City.
3) FAIR VALUE MEASUREMENTS
Governmental Accounting Standards Board (GASB) Statement No. 72, Fair Value Measurements and Application, provides the framework for measuring fair value. The framework provides a fair value hierarchy that prioritizes the inputs to valuation techniques used to measure fair value with Level 1 given the highest priority and Level 3 the lowest priority. The three levels of the fair value hierarchy are as follows: Level 1 inputs are quoted prices (unadjusted) in active markets for identical assets or liabilities that the organization has the ability to access at the measurement date. Level 2 inputs are inputs other than quoted prices included within Level 1 that are observable for the asset or liability, either directly or indirectly. Level 2 inputs include the following:
a. Quoted prices for similar assets or liabilities in active markets.
b. Quoted prices for identical or similar assets or liabilities in markets that are not active.
c. Inputs other than quoted prices that are observable for the asset or liability (for example, interest rates and yield
curves observable at commonly quoted intervals, volatilities, prepayment speeds, loss severities, credit risks, and default rates).
d. Inputs that are derived principally from or corroborated by observable market data by correlation or other
means (market-corroborated inputs).
Level 3 inputs are unobservable inputs for the asset or liability.
City of Perris, California Notes to Financial Statements
June 30, 2017
54
3) FAIR VALUE MEASUREMENTS - Continued Fair value of assets measured on a recurring basis at June 30, 2017, are as follows:
Significant Other Observable Inputs Fair Value (Level 2) Uncategorized Local Agency Bonds $ 3,706,317 $ 3,706,317 $ Federal Agency Securities 55,332,241 55,332,241 U.S. Treasury Bills 17,848,165 17,848,165 Commercial Paper 3,940,614 3,940,614 Certificates of Deposit 4,732,583 4,732,583 Money Market Fund 36,685,679 36,685,679State Investment Pool - LAIF 3,390,051 3,390,051Held by Bond Trustees Federal Agency Securities 1,925,382 1,925,382 Money Market Funds 40,537,307 40,537,307 Local Obligation Bonds 105,970,003 105,970,003 Total $ 274,068,342 $ 193,455,305 $ 80,613,037
Fair values for investments are determined by using a matrix pricing technique. Matrix pricing is used to value securities based on the security’s relationship to benchmark quoted prices. Uncategorized investments do not fall under the fair value hierarchy as there is no active market for the investments. Land held for development was acquired for the purpose of redevelopment rather than for income and profit. Therefore, land held for development is exempt under GASB 72 fair value measurements.
4) LOANS RECEIVABLE
The Perris Public Financing Authority has entered into loan agreements with the Perris Redevelopment Agency (Agency) whereby the Authority loaned the proceeds of the 2009 Series A, B and C Revenue Bonds, the 2010 Series A Revenue Bond and the 2015 Series A and B Revenue Refunding Bonds issued by the Authority to retire debt and provide funds for certain public improvements in Agency project areas. As of February 1, 2012, the Perris Redevelopment Agency was dissolved (see Note 1) and the Successor Agency of the Perris Redevelopment Agency oversees the remaining activities of the former Perris Redevelopment Agency. The balance of these loans is $65,580,000 as of June 30, 2017. The Authority retained $6,330,957 to fund reserve accounts for the above related debt issues.
City of Perris, California Notes to Financial Statements
June 30, 2017
55
5) CAPITAL ASSETS Capital asset activity for the year was as follows:
Beginning Ending Balance Increases Decreases Balance
Governmental Activities: Capital Assets, Not Depreciated: Land $ 39,856,214 $ $ $ 39,856,214 Construction in Progress 11,485,575 8,326,266 2,811,724 17,000,117 Total Capital Assets Not Depreciated
51,341,789
8,326,266
2,811,724
56,856,331
Capital Assets Being Depreciated: Buildings 23,821,457 475,430 23,346,027 Building Improvements 8,684,491 7,100 8,691,591 Machinery 2,412,009 52,159 2,464,168 Vehicles 2,297,959 194,447 2,492,406 Infrastructure 265,184,056 8,146,808 273,330,864 Total Capital Assets Being Depreciated
302,399,972
8,400,514
475,430
310,325,056
Less Accumulated Depreciation: Buildings (6,501,113) (567,783) (205,030) (6,863,866) Building Improvements (3,975,476) (400,811) (4,376,287) Machinery (1,615,978) (231,511) (1,847,489) Vehicles (1,672,606) (149,217) (1,821,823) Infrastructure (165,860,044) (6,081,844) (171,941,888)
Total Accumulated Depreciation (179,625,217) (7,431,166) (205,030) (186,851,353) Total Capital Assets Being Depreciated, Net
122,774,755
969,348
270,400
123,473,703
Governmental Activities Capital Assets, Net of Depreciation
$ 174,116,544
$ 9,295,614
$ 3,082,124
$ 180,330,034
Depreciation expense was charged to functions/programs as follows:
Governmental Activities: General Government $ 374,008 Public Safety 243,579 Public Works 6,205,890 Parks and Recreation 607,689 Total Depreciation Expense - Governmental Activities $ 7,431,166
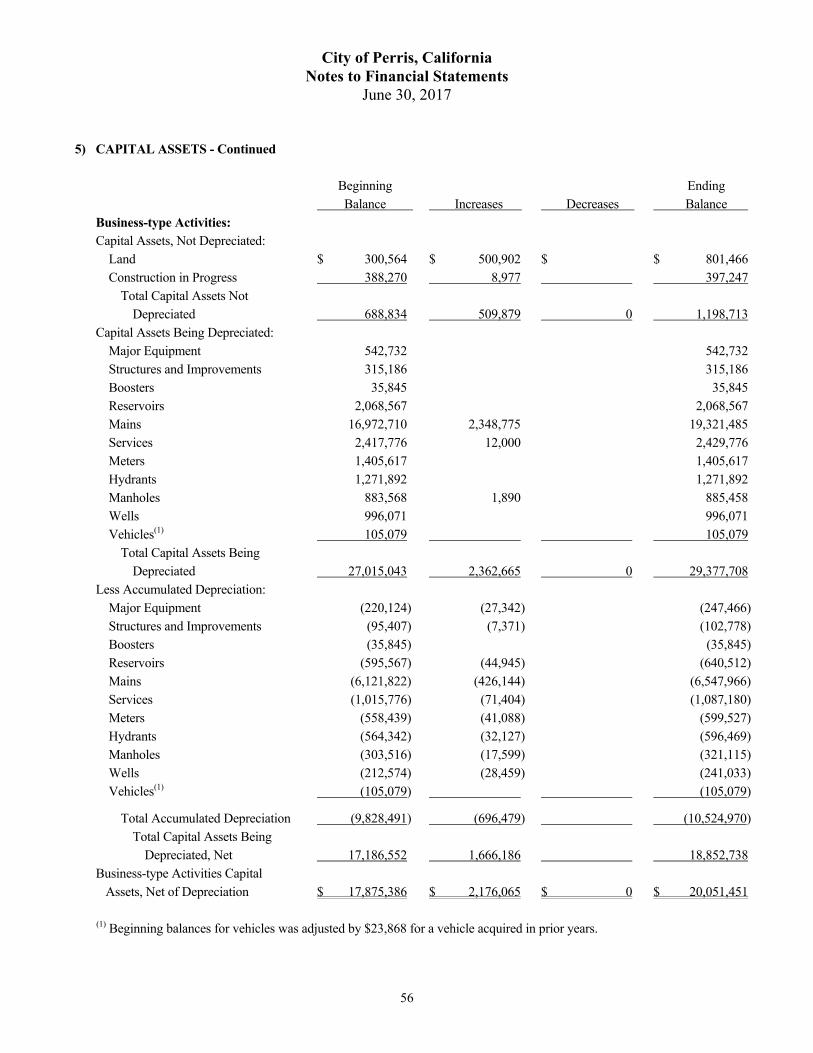
City of Perris, California Notes to Financial Statements
June 30, 2017
56
5) CAPITAL ASSETS - Continued
Beginning Ending Balance Increases Decreases Balance
Business-type Activities: Capital Assets, Not Depreciated: Land $ 300,564 $ 500,902 $ $ 801,466 Construction in Progress 388,270 8,977 397,247 Total Capital Assets Not Depreciated
688,834
509,879
0
1,198,713
Capital Assets Being Depreciated: Major Equipment 542,732 542,732 Structures and Improvements 315,186 315,186 Boosters 35,845 35,845 Reservoirs 2,068,567 2,068,567 Mains 16,972,710 2,348,775 19,321,485 Services 2,417,776 12,000 2,429,776 Meters 1,405,617 1,405,617 Hydrants 1,271,892 1,271,892 Manholes 883,568 1,890 885,458 Wells 996,071 996,071 Vehicles(1) 105,079 105,079 Total Capital Assets Being Depreciated
27,015,043
2,362,665
0
29,377,708
Less Accumulated Depreciation: Major Equipment (220,124) (27,342) (247,466) Structures and Improvements (95,407) (7,371) (102,778) Boosters (35,845) (35,845) Reservoirs (595,567) (44,945) (640,512) Mains (6,121,822) (426,144) (6,547,966) Services (1,015,776) (71,404) (1,087,180) Meters (558,439) (41,088) (599,527) Hydrants (564,342) (32,127) (596,469) Manholes (303,516) (17,599) (321,115) Wells (212,574) (28,459) (241,033) Vehicles(1) (105,079) (105,079)
Total Accumulated Depreciation (9,828,491) (696,479) (10,524,970) Total Capital Assets Being Depreciated, Net
17,186,552
1,666,186
18,852,738
Business-type Activities Capital Assets, Net of Depreciation
$ 17,875,386
$ 2,176,065
$ 0
$ 20,051,451
(1) Beginning balances for vehicles was adjusted by $23,868 for a vehicle acquired in prior years.
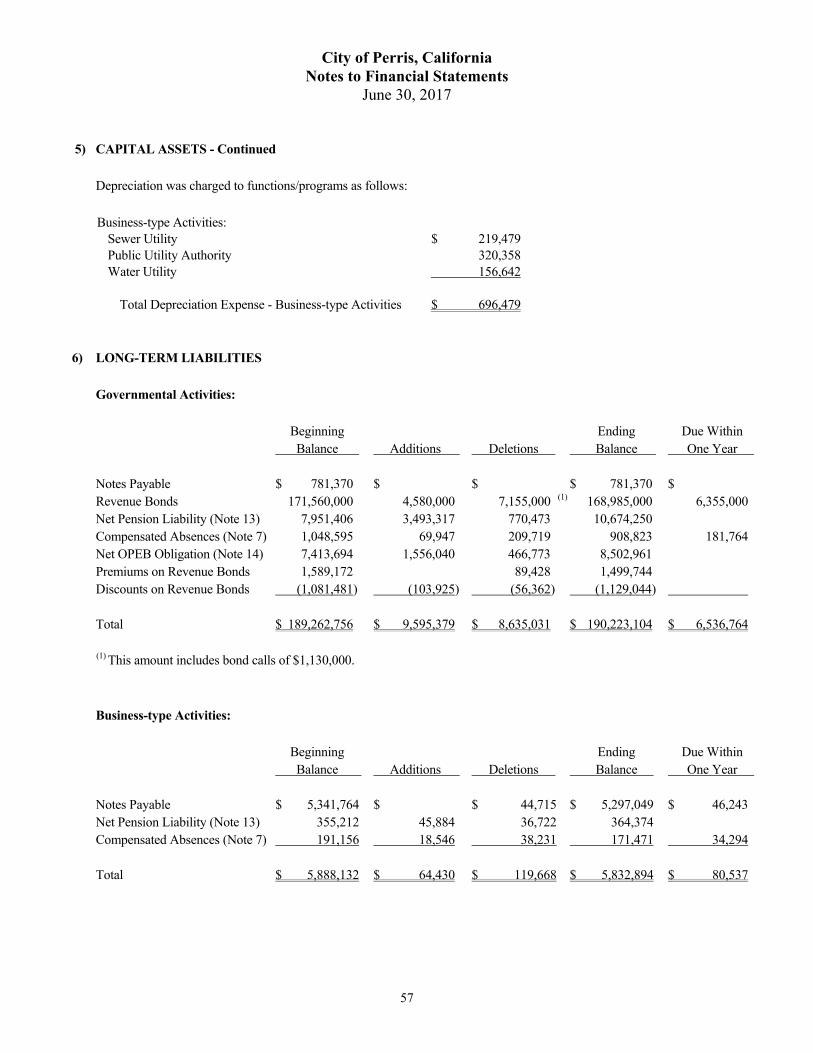
City of Perris, California Notes to Financial Statements
June 30, 2017
57
5) CAPITAL ASSETS - Continued Depreciation was charged to functions/programs as follows:
Business-type Activities: Sewer Utility $ 219,479 Public Utility Authority 320,358 Water Utility 156,642 Total Depreciation Expense - Business-type Activities $ 696,479
6) LONG-TERM LIABILITIES
Governmental Activities:
Beginning Ending Due Within Balance Additions Deletions Balance One Year Notes Payable $ 781,370 $ $ $ 781,370 $ Revenue Bonds 171,560,000 4,580,000 7,155,000 (1) 168,985,000 6,355,000Net Pension Liability (Note 13) 7,951,406 3,493,317 770,473 10,674,250 Compensated Absences (Note 7) 1,048,595 69,947 209,719 908,823 181,764Net OPEB Obligation (Note 14) 7,413,694 1,556,040 466,773 8,502,961 Premiums on Revenue Bonds 1,589,172 89,428 1,499,744 Discounts on Revenue Bonds (1,081,481) (103,925) (56,362) (1,129,044) Total $ 189,262,756 $ 9,595,379 $ 8,635,031 $ 190,223,104 $ 6,536,764
(1) This amount includes bond calls of $1,130,000.
Business-type Activities:
Beginning Ending Due Within Balance Additions Deletions Balance One Year Notes Payable $ 5,341,764 $ $ 44,715 $ 5,297,049 $ 46,243Net Pension Liability (Note 13) 355,212 45,884 36,722 364,374 Compensated Absences (Note 7) 191,156 18,546 38,231 171,471 34,294 Total $ 5,888,132 $ 64,430 $ 119,668 $ 5,832,894 $ 80,537

City of Perris, California Notes to Financial Statements
June 30, 2017
58
6) LONG-TERM LIABILITIES - Continued
Notes Payable
Governmental Activities: The Perris Redevelopment Agency entered into a promissory note with the City of Perris for $2,192,000 on October 26, 2004. The note was to reimburse the Agency's cost to acquire a property for a new sheriff station and other facilities. Interest is accrued at a rate of 4% per annum. Payments are solely made from police and community facilities development impact fees. The balance of this note is $781,370 as of June 30, 2017. During the 2012 fiscal year, the Perris Redevelopment Agency was dissolved and the note is now with the Successor Agency to the Perris Redevelopment Agency. Currently, this note payable has no debt service schedule available.
$ 781,370
Business-type Activities:
On July 23, 2002, the City of Perris entered into an installment sale agreement for $1,600,000, payable to the California Infrastructure and Economic Development Bank. The agreement is to provide funding for the removal, replacement and upgrading of existing sewer mains under the Indian Hills/Enchanted Heights Reach II Sewer Upgrade Project. Interest on the agreement is payable August 1st and February 1st of each year. Interest on the agreement accrues at 3.42% per annum. Principal on the agreement is payable in annual installments ranging from $30,888 to $74,048 commencing February 1, 2004, through February 1, 2032. The agreement requires a maintenance of system revenues that (a) pledged net system revenues are in an amount which will be sufficient to be at least equal to one hundred ten percent (110%) of the annual debt service for such fiscal year and (b) if pledged net system revenues are insufficient to comply with (a) then the City has 180 days following the date the pledged net system revenues failure to meet the requirement to increase rent, rates, fees, charges and/or assessments.
887,049
Year Ending June 30, Principal Interest Total
2018 $ 46,243 $ 30,337 $ 76,580 2019 47,825 28,756 76,581 2020 49,461 27,120 76,581 2021 51,152 25,428 76,580 2022 52,902 23,679 76,581
2023-2027 292,916 89,987 382,903 2028-2032 346,550 36,353 382,903
Total $ 887,049 $ 261,660 $ 1,148,709
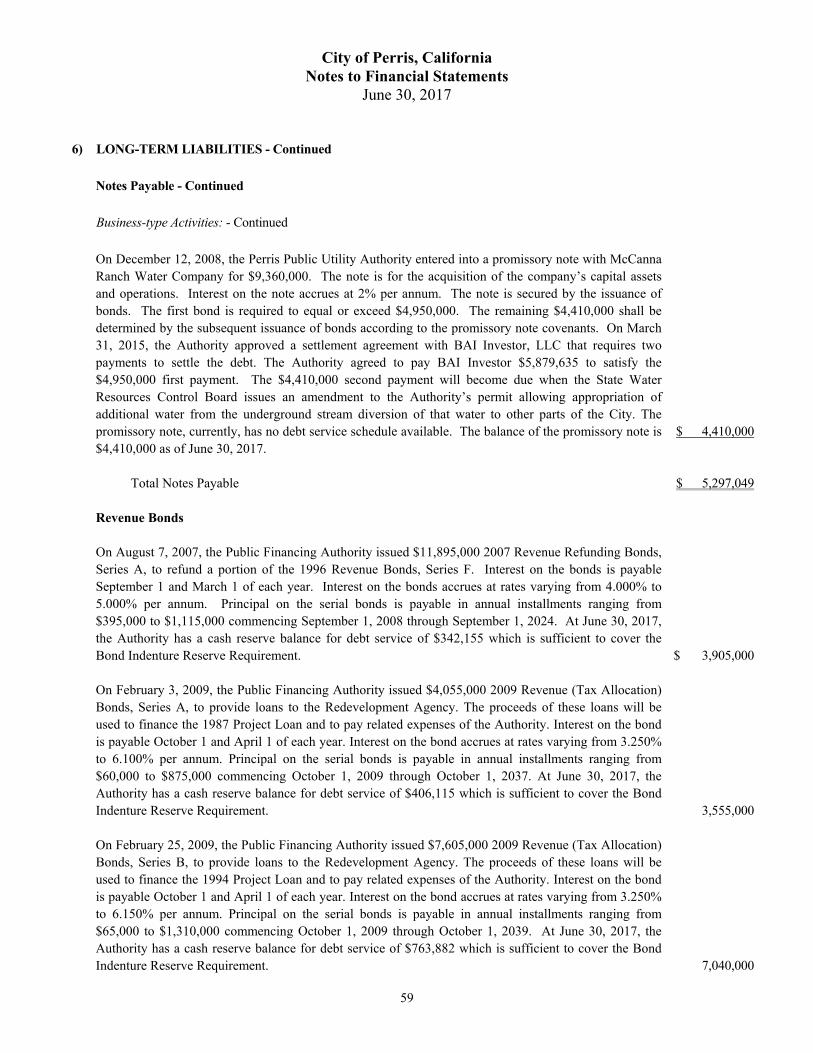
City of Perris, California Notes to Financial Statements
June 30, 2017
59
6) LONG-TERM LIABILITIES - Continued
Notes Payable - Continued Business-type Activities: - Continued
On December 12, 2008, the Perris Public Utility Authority entered into a promissory note with McCanna Ranch Water Company for $9,360,000. The note is for the acquisition of the company’s capital assets and operations. Interest on the note accrues at 2% per annum. The note is secured by the issuance of bonds. The first bond is required to equal or exceed $4,950,000. The remaining $4,410,000 shall be determined by the subsequent issuance of bonds according to the promissory note covenants. On March 31, 2015, the Authority approved a settlement agreement with BAI Investor, LLC that requires two payments to settle the debt. The Authority agreed to pay BAI Investor $5,879,635 to satisfy the $4,950,000 first payment. The $4,410,000 second payment will become due when the State Water Resources Control Board issues an amendment to the Authority’s permit allowing appropriation of additional water from the underground stream diversion of that water to other parts of the City. The promissory note, currently, has no debt service schedule available. The balance of the promissory note is $4,410,000 as of June 30, 2017.
$ 4,410,000
Total Notes Payable $ 5,297,049
Revenue Bonds
On August 7, 2007, the Public Financing Authority issued $11,895,000 2007 Revenue Refunding Bonds, Series A, to refund a portion of the 1996 Revenue Bonds, Series F. Interest on the bonds is payable September 1 and March 1 of each year. Interest on the bonds accrues at rates varying from 4.000% to 5.000% per annum. Principal on the serial bonds is payable in annual installments ranging from $395,000 to $1,115,000 commencing September 1, 2008 through September 1, 2024. At June 30, 2017, the Authority has a cash reserve balance for debt service of $342,155 which is sufficient to cover the Bond Indenture Reserve Requirement.
$ 3,905,000
On February 3, 2009, the Public Financing Authority issued $4,055,000 2009 Revenue (Tax Allocation) Bonds, Series A, to provide loans to the Redevelopment Agency. The proceeds of these loans will be used to finance the 1987 Project Loan and to pay related expenses of the Authority. Interest on the bond is payable October 1 and April 1 of each year. Interest on the bond accrues at rates varying from 3.250% to 6.100% per annum. Principal on the serial bonds is payable in annual installments ranging from $60,000 to $875,000 commencing October 1, 2009 through October 1, 2037. At June 30, 2017, the Authority has a cash reserve balance for debt service of $406,115 which is sufficient to cover the Bond Indenture Reserve Requirement.
3,555,000
On February 25, 2009, the Public Financing Authority issued $7,605,000 2009 Revenue (Tax Allocation) Bonds, Series B, to provide loans to the Redevelopment Agency. The proceeds of these loans will be used to finance the 1994 Project Loan and to pay related expenses of the Authority. Interest on the bond is payable October 1 and April 1 of each year. Interest on the bond accrues at rates varying from 3.250% to 6.150% per annum. Principal on the serial bonds is payable in annual installments ranging from $65,000 to $1,310,000 commencing October 1, 2009 through October 1, 2039. At June 30, 2017, the Authority has a cash reserve balance for debt service of $763,882 which is sufficient to cover the Bond Indenture Reserve Requirement.
7,040,000
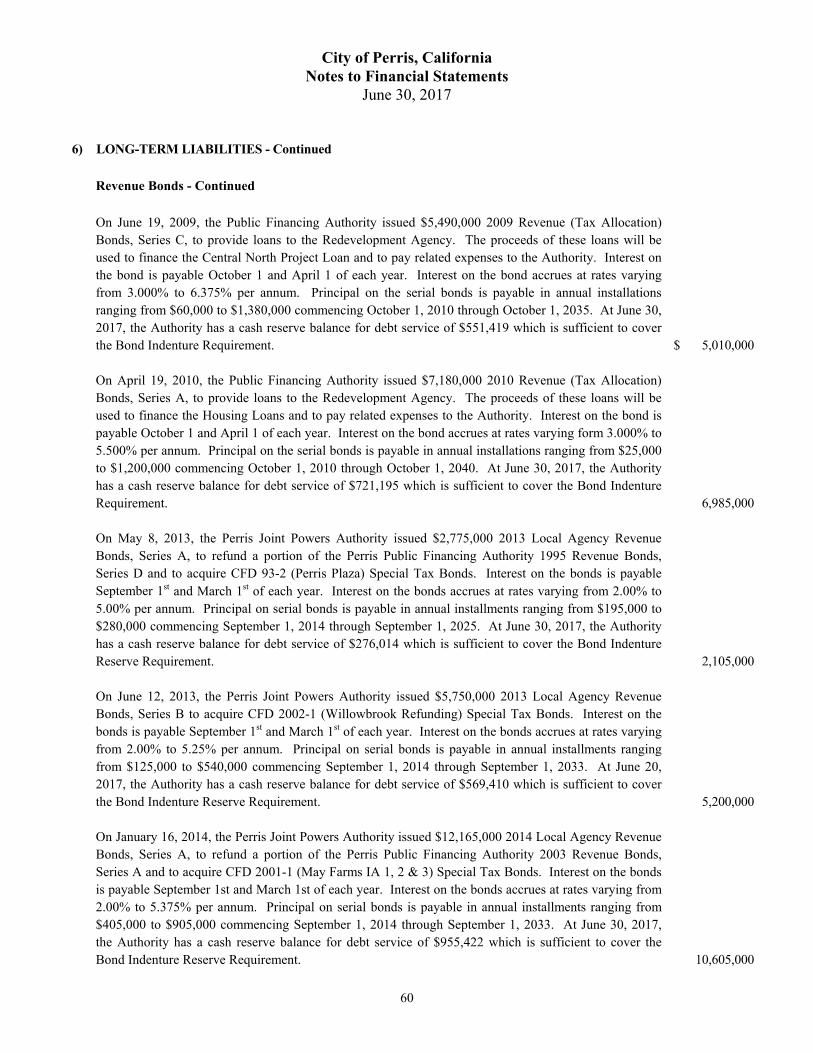
City of Perris, California Notes to Financial Statements
June 30, 2017
60
6) LONG-TERM LIABILITIES - Continued
Revenue Bonds - Continued
On June 19, 2009, the Public Financing Authority issued $5,490,000 2009 Revenue (Tax Allocation) Bonds, Series C, to provide loans to the Redevelopment Agency. The proceeds of these loans will be used to finance the Central North Project Loan and to pay related expenses to the Authority. Interest on the bond is payable October 1 and April 1 of each year. Interest on the bond accrues at rates varying from 3.000% to 6.375% per annum. Principal on the serial bonds is payable in annual installations ranging from $60,000 to $1,380,000 commencing October 1, 2010 through October 1, 2035. At June 30, 2017, the Authority has a cash reserve balance for debt service of $551,419 which is sufficient to cover the Bond Indenture Requirement.
$ 5,010,000
On April 19, 2010, the Public Financing Authority issued $7,180,000 2010 Revenue (Tax Allocation) Bonds, Series A, to provide loans to the Redevelopment Agency. The proceeds of these loans will be used to finance the Housing Loans and to pay related expenses to the Authority. Interest on the bond is payable October 1 and April 1 of each year. Interest on the bond accrues at rates varying form 3.000% to 5.500% per annum. Principal on the serial bonds is payable in annual installations ranging from $25,000 to $1,200,000 commencing October 1, 2010 through October 1, 2040. At June 30, 2017, the Authority has a cash reserve balance for debt service of $721,195 which is sufficient to cover the Bond Indenture Requirement.
6,985,000
On May 8, 2013, the Perris Joint Powers Authority issued $2,775,000 2013 Local Agency Revenue Bonds, Series A, to refund a portion of the Perris Public Financing Authority 1995 Revenue Bonds, Series D and to acquire CFD 93-2 (Perris Plaza) Special Tax Bonds. Interest on the bonds is payable September 1st and March 1st of each year. Interest on the bonds accrues at rates varying from 2.00% to 5.00% per annum. Principal on serial bonds is payable in annual installments ranging from $195,000 to $280,000 commencing September 1, 2014 through September 1, 2025. At June 30, 2017, the Authority has a cash reserve balance for debt service of $276,014 which is sufficient to cover the Bond Indenture Reserve Requirement.
2,105,000
On June 12, 2013, the Perris Joint Powers Authority issued $5,750,000 2013 Local Agency Revenue Bonds, Series B to acquire CFD 2002-1 (Willowbrook Refunding) Special Tax Bonds. Interest on the bonds is payable September 1st and March 1st of each year. Interest on the bonds accrues at rates varying from 2.00% to 5.25% per annum. Principal on serial bonds is payable in annual installments ranging from $125,000 to $540,000 commencing September 1, 2014 through September 1, 2033. At June 20, 2017, the Authority has a cash reserve balance for debt service of $569,410 which is sufficient to cover the Bond Indenture Reserve Requirement.
5,200,000
On January 16, 2014, the Perris Joint Powers Authority issued $12,165,000 2014 Local Agency Revenue Bonds, Series A, to refund a portion of the Perris Public Financing Authority 2003 Revenue Bonds, Series A and to acquire CFD 2001-1 (May Farms IA 1, 2 & 3) Special Tax Bonds. Interest on the bonds is payable September 1st and March 1st of each year. Interest on the bonds accrues at rates varying from 2.00% to 5.375% per annum. Principal on serial bonds is payable in annual installments ranging from $405,000 to $905,000 commencing September 1, 2014 through September 1, 2033. At June 30, 2017, the Authority has a cash reserve balance for debt service of $955,422 which is sufficient to cover the Bond Indenture Reserve Requirement.
10,605,000
City of Perris, California Notes to Financial Statements
June 30, 2017
61
6) LONG-TERM LIABILITIES - Continued
Revenue Bonds - Continued
On June 4, 2014, the Perris Joint Powers Authority issued $2,825,000 2013 Local Agency Revenue Bonds, Series B, to refund a portion of the Perris Public Financing Authority 2007 Revenue Bonds, Series C and to acquire CFD 2006-1 (Meritage Homes) Special Tax Bonds. Interest on the bonds is payable September 1st and March 1st of each year. Interest on the bonds accrues at rates varying from 2.00% to 5.00% per annum. Principal on serial bonds is payable in annual installments ranging from $45,000 to $120,000 commencing September 1, 2014 through September 1, 2038. At June 30, 2017, the Authority has a cash reserve balance for debt service of $223,319 which is sufficient to cover the Bond Indenture Reserve Requirement.
$ 2,575,000
On July 24, 2014, the Perris Joint Powers Authority issued $8,615,000 2014 Local Agency Revenue Bonds, Series C, to refund a portion of the Perris Public Financing Authority 2004 Revenue Bonds, Series A and to acquire CFD 2004-3 (Monument Ranch IA 1) Special Tax Bonds. Interest on the bonds is payable September 1st and March 1st of each year. Interest on the bonds accrues at rates varying from 2.00% to 4.25% per annum. Principal on serial bonds is payable in annual installments ranging from $315,000 to $595,000 commencing September 1, 2015 through September 1, 2034. At June 30, 2017, the Authority has a cash reserve balance for debt service of $624,049 which is sufficient to cover the Bond Indenture Reserve Requirement.
7,875,000
On July 17, 2014, the Perris Joint Powers Authority issued $4,695,000 2014 Local Agency Revenue Bonds, Series D, to acquire CFD 2004-2 (CLC Refunding) Special Tax Bonds. Interest on the bonds is payable September 1st and March 1st of each year. Interest on the bonds accrues at rates varying from 2.00% to 4.25% per annum. Principal on serial bonds is payable in annual installments ranging from $170,000 to $325,000 commencing September 1, 2015 through September 1, 2034. At June 30, 2017, the Authority has a cash reserve balance for debt service of $341,005 which is sufficient to cover the Bond Indenture Reserve Requirement.
4,340,000
On September 18, 2014, the Perris Joint Powers Authority issued $13,925,000 2014 Local Agency Revenue Bonds, Series E, to refund a portion of the Perris Public Financing Authority 2007 Revenue Bonds, Series D and to acquire CFD 2001-1 (May Farms IA 6, & 7) Special Tax Bonds. Interest on the bonds is payable September 1st and March 1st of each year. Interest on the bonds accrues at rates varying from 2.00% to 4.25% per annum. Principal on serial bonds is payable in annual installments ranging from $380,000 to $890,000 commencing September 1, 2015 through September 1, 2038. At June 30, 2017, the Authority has a cash reserve balance for debt service of $930,907 which is sufficient to cover the Bond Indenture Reserve Requirement.
12,970,000
On October 9, 2014, the Perris Joint Powers Authority issued $2,465,000 2014 Local Agency Revenue Bonds, Series F, to refund a portion of the Perris Public Financing Authority 2004 Revenue Bonds, Series A and to acquire CFD 2004-1 (Amber Oaks) Special Tax Bonds. Interest on the bonds is payable September 1st and March 1st of each year. Interest on the bonds accrues at rates varying from 2.00% to 4.00% per annum. Principal on serial bonds is payable in annual installments ranging from $90,000 to $165,000 commencing September 1, 2015 through September 1, 2034. At June 30, 2017, the Authority has a cash reserve balance for debt service of $176,871 which is sufficient to cover the Bond Indenture Reserve Requirement.
2,275,000

City of Perris, California Notes to Financial Statements
June 30, 2017
62
6) LONG-TERM LIABILITIES - Continued
Revenue Bonds - Continued On November 13, 2014, the Perris Joint Powers Authority issued $3,435,000 2014 Local Agency Revenue Bonds, Series G, to refund a portion of the Perris Public Financing Authority 2003 Revenue Bonds, Series A and to acquire CFD 2003-1 (Chaparral Ridge) Special Tax Bonds. Interest on the bonds is payable September 1st and March 1st of each year. Interest on the bonds accrues at rates varying from 2.00% to 4.00% per annum. Principal on serial bonds is payable in annual installments ranging from $105,000 to $290,000 commencing September 1, 2015 through September 1, 2033. At June 30, 2017, the Authority has a cash reserve balance for debt service of $302,630 which is sufficient to cover the Bond Indenture Reserve Requirement.
$ 3,200,000
On March 26, 2015, the Perris Joint Powers Authority issued $13,570,000 2015 Local Agency Revenue Bonds, Series A, to acquire CFD 2005-2 (Harmony Grove) Special Tax Bonds. Interest on the bonds is payable September 1st and March 1st of each year. Interest on the bonds accrues at rates varying from 2.00% to 3.875% per annum. Principal on serial bonds is payable in annual installments ranging from $355,000 to $885,000 commencing September 1, 2015 through September 1, 2035. At June 30, 2017, the Authority has a cash reserve balance for debt service of $925,115 which is sufficient to cover the Bond Indenture Reserve Requirement.
12,750,000
On May 19, 2015, the Perris Joint Powers Authority issued $9,020,000 2015 Local Agency Revenue Bonds, Series B, to acquire CFD 2006-2 (Monument Park Estates) Special Tax Bonds. Interest on the bonds is payable September 1st and March 1st of each year. Interest on the bonds accrues at rates varying from 2.00% to 5.00% per annum. Principal on serial bonds is payable in annual installments ranging from $40,000 to $760,000 commencing September 1, 2016 through September 1, 2045. At June 30, 2017, the Authority has a cash reserve balance for debt service of $756,180 which is sufficient to cover the Bond Indenture Reserve Requirement.
8,890,000
On June 18, 2015, the Perris Joint Powers Authority issued $8,285,000 2015 Local Agency Revenue Bonds, Series C, to acquire CFD 2004-3 (IA2) Special Tax Bonds. Interest on the bonds is payable September 1st and March 1st of each year. Interest on the bonds accrues at rates varying from 2.00% to 4.25% per annum. Principal on serial bonds is payable in annual installments ranging from $210,000 to $715,000 commencing September 1, 2016 through September 1, 2035. At June 30, 2017, the Authority has a cash reserve balance for debt service of $746,777 which is sufficient to cover the Bond Indenture Reserve Requirement.
8,075,000
On July 9, 2015, the Public Financing Authority issued $21,590,000 2015 Revenue (Tax Allocation) Refunding Bonds, Series A, to refund the 2001 Series A and B, 2002, Series A and B and the 2006 (related to the housing loan) Tax Allocation Revenue Bonds and related Successor Agency Loans (see Note 4). Interest on the bond is payable October 1 and April 1 of each year. Interest on the bond accrues at rates varying from 2% to 5% per annum. Principal on the serial bonds is payable in annual installments ranging from $795,000 to $1,645,000 commencing October 1, 2016 through October 1, 2033. At June 30, 2017, the Authority has a cash reserve balance for debt service of $1,806,604 which is sufficient to cover the Bond Indenture Reserve Requirement.
20,635,000
City of Perris, California Notes to Financial Statements
June 30, 2017
63
6) LONG-TERM LIABILITIES - Continued
Revenue Bonds - Continued
On July 9, 2015, the Public Financing Authority issued $23,120,000 2015 Revenue (Tax Allocation Subordinate) Refunding Bonds, Series B, to refund the 2002 Series C and the 2006 (excluding the housing loan portion) Tax Allocation Revenue Bonds and related Successor Agency loans (see Note 4). Interest on the bond is payable October 1 and April 1 of each year. Interest on the bond accrues at rates varying from 2% to 4% per annum. Principal on the serial bonds is payable in annual installments ranging from $765,000 to $2,190,000 commencing October 1, 2016 through October 1, 2036. At June 30, 2017, the Authority has a cash reserve balance for debt service of $2,010,538 which is sufficient to cover the Bond Indenture Reserve Requirement.
$ 22,355,000
On August 6, 2015, the Perris Joint Powers Authority issued $1,540,000 2015 Local Agency Revenue Bonds, Series D, to acquire CFD 2014-2 (Perris Valley Spectrum) Special Tax Bonds. Interest on the bonds is payable September 1st and March 1st of each year. Interest on the bonds accrues at rates varying from 2.00% to 3.00% per annum. Principal on serial bonds is payable in annual installments ranging from $240,000 to $270,000 commencing September 1, 2016 through September 1, 2021. At June 30, 2017, the Authority has a cash reserve balance for debt service of $154,287 which is sufficient to cover the Bond Indenture Reserve Requirement.
1,300,000
On September 15, 2015, the Perris Joint Powers Authority issued $4,560,000 2015 Local Agency Revenue Bonds, Series E, to refund a portion of the Perris Public Financing Authority 2008 Revenue Bonds, Series B, and to acquire CFD 2005-1 (IA3) Special Tax Bonds. Interest on the bonds is payable September 1st and March 1st of each year. Interest on the bonds accrues at rates varying from 2.00% to 4.50% per annum. Principal on serial bonds is payable in annual installments ranging from $130,000 to $295,000 commencing September 1, 2016 through September 1, 2038. At June 30, 2017, the Authority has a cash reserve balance for debt service of $308,937 which is sufficient to cover the Bond Indenture Reserve Requirement.
4,430,000
On October 14, 2015, the Perris Joint Powers Authority issued $5,415,000 2015 Local Agency Revenue Bonds, Series F, to refund a portion of the Perris Public Financing Authority 2008 Revenue Bonds, Series A, and to acquire CFD 2005-4 Special Tax Bonds. Interest on the bonds is payable September 1st and March 1st of each year. Interest on the bonds accrues at rates varying from 2.00% to 4.25% per annum. Principal on serial bonds is payable in annual installments ranging from $145,000 to $340,000 commencing September 1, 2016 through September 1, 2038. At June 30, 2017, the Authority has a cash reserve balance for debt service of $357,916 which is sufficient to cover the Bond Indenture Reserve Requirement.
5,270,000
On December 8, 2015, the Perris Joint Powers Authority issued $3,190,000 2015 Local Agency Revenue Bonds, Series G, to acquire CFD 2005-4 (Steeplechase) Special Tax Bonds. Interest on the bonds is payable September 1st and March 1st of each year. Interest on the bonds accrues at rates varying from 2.00% to 4.0% per annum. Principal on serial bonds is payable in annual installments ranging from $105,000 to $190,000 commencing September 1, 2016 through September 1, 2038. At June 30, 2017, the Authority has a cash reserve balance for debt service of $202,251 which is sufficient to cover the Bond Indenture Reserve Requirement.
3,060,000
City of Perris, California Notes to Financial Statements
June 30, 2017
64
6) LONG-TERM LIABILITIES - Continued
Revenue Bonds - Continued
On June 21, 2017, the Perris Joint Powers Authority issued $4,580,000 2017 Local Agency Revenue Bonds, Series A, to acquire CFD 2014-1 (Avelina) Special Tax Bonds. Interest on the bond is payable September 1st and March 1st of each year. Interest on the bonds accrues at rates varying from 2.00% to 3.75% per annum. Principal on serial bonds is payable in annual installments ranging from $20,000 to $335,000 commencing September 1, 2017 through September 1, 2047. At June 30, 2017, the Authority has a cash reserve balance for debt service of $331,086 which is sufficient to cover the Bond Indenture Reserve Requirement.
$ 4,580,000
Total Revenue Bonds $ 168,985,000 The future debt requirements of the Revenue Bonds are as follows:
Year Ending June 30, Principal Interest Total
2018 $ 6,355,000 $ 6,863,980 $ 13,218,980 2019 6,430,000 6,748,270 13,178,270 2020 6,665,000 6,574,786 13,239,786 2021 6,430,000 6,377,770 12,807,770 2022 6,650,000 6,153,004 12,803,004
2023-2027 35,395,000 26,795,781 62,190,781 2028-2032 41,225,000 19,127,278 60,352,278 2033-2037 40,750,000 9,488,346 50,238,346 2038-2042 14,625,000 2,352,903 16,977,903 2043-2047 4,125,000 484,313 4,609,313
2048 335,000 6,281 341,281 Total $ 168,985,000 $ 90,972,712 $ 259,957,712
Revenues Pledged The City has pledged a portion of future sewer revenues to repay a note payable to the California Infrastructure and Economic Development Bank. The note payable is secured solely by operating revenues from the sewer fund. Total principal and interest remaining on the note payable is $1,148,708 payable through fiscal year 2032. For the current year, principal and interest paid by the sewer operating revenues were $44,715 and $31,866, respectively.
City of Perris, California Notes to Financial Statements
June 30, 2017
65
7) COMPENSATED ABSENCES For governmental funds and proprietary funds, accumulated vacation and sick leave benefits and compensatory time
payable in future years when used by City employees amounted to $908,823 and $364,374, respectively at June 30, 2017. These amounts are payable from future resources and therefore have been recorded in long-term liabilities in the government-wide financial statements. Vacation benefits, sick leave, and compensatory time are recorded as expenditures in the related governmental fund financial statements when used. Upon retirement or termination, the expenditures are recorded in the fund which incurred the original obligation. Generally, in governmental activities, the general fund has liquidated compensated absences in prior years. Compensated absences payable for proprietary funds are reported within the respective funds.
8) ASSESSMENT DISTRICT AND COMMUNITY FACILITIES DISTRICT BONDS Bonds issued for improvements in certain special assessment districts in accordance with the provisions of the Municipal
Improvement Acts of 1911, 1913 and 1915 are liabilities of the property owners and are secured by liens against the assessed property. The City Treasurer acts as an agent for collection of principal and interest payments by the property owners and remittance of such monies to the bondholders.
Neither the faith and credit, nor the general taxing power, of the City of Perris have been pledged to the payment of the
bonds. Therefore, none of the following special assessment bonds have been included in the accompanying financial statements.
Amount Outstanding at District Bonds of Issue End of Year
CFD 93-2 Revised Bonds $ 6,200,000 $ 2,105,000CFD 93-1 2002 Refunding Bond 8,020,000 3,315,000CFD 2004-5 2004 Series A Bonds 1,810,000 1,430,000CFD 2001-1 2005 Series A Bonds 16,475,000 14,045,000CFD 2001-2 2005 Series B Bonds 5,210,000 4,975,000CFD 2001-1 2006 Series A Bonds 9,680,000 8,395,000CFD 2005-1 2007 Series A Bonds 3,385,000 2,865,000CFD 88-1 2007 Refunding Bonds 7,690,000 1,920,000CFD 88-3 2007 Refunding Bonds 5,005,000 1,615,000CFD 90-1 2007 Refunding Bonds 3,140,000 1,265,000CFD 2002-1 2013 Refunding Bonds 5,750,000 5,200,000CFD 2001-2 2014 Refunding Series A Bonds 16,215,000 14,530,000CFD 2001-1 IA1 2014 Refunding Bonds 1,505,000 1,315,000CFD 2001-1 IA2 2014 Refunding Bonds 4,270,000 3,710,000CFD 2001-1 IA3 2014 Refunding Bonds 6,390,000 5,580,000CFD 2006-1 2014 Refunding Bonds 2,825,000 2,575,000CFD 2004-3 IA 1 2014 Refunding Bonds 8,615,000 7,875,000CFD 2004-2 2014 Refunding Bonds 4,695,000 4,340,000

City of Perris, California Notes to Financial Statements
June 30, 2017
66
8) ASSESSMENT DISTRICT AND COMMUNITY FACILITIES DISTRICT BONDS - Continued
Amount Outstanding at District Bonds of Issue End of Year
CFD 2001-1 IA-6 2014 Refunding Bonds $ 6,015,000 $ 5,585,000CFD 2001-1 IA-7 2014 Refunding Bonds 7,910,000 7,385,000CFD 2004-1 2014 Series A Bonds 2,465,000 2,275,000CFD 2003-1 2014 Refunding Bonds 3,435,000 3,200,000CFD 2005-2 2015 Refunding Bonds 13,570,000 12,750,000CFD 2006-2 2015 Series Bonds 9,020,000 8,890,000CFD 2004-3 IA2 2015 Refunding Bonds 8,285,000 8,075,000CFD 2014-2 2015 Refunding Bonds 1,540,000 1,300,000CFD 2005-1 IA3 2015 Refunding Bonds 4,560,000 4,430,000CFD 2005-4 (Stratford Ranch) 2015 Refunding Bonds 5,415,000 5,270,000CFD 2005-4 (Steeplechase) 2015 Refunding Bonds 3,190,000 3,060,000CFD 2014-1 (Avelina) Series A Bonds 4,580,000 4,580,000
$ 186,865,000 $ 153,855,000
9) SINGLE FAMILY MORTGAGE REVENUE BONDS The City has issued mortgage revenue bonds as follows:
Outstanding Balance End of Year
City of Perris Single Family Mortgage Revenue Bonds 1988 Series A $ 28,090,000 1988 Series B 13,145,000 1989 Series A 9,315,000
Total $ 50,550,000
The Bonds are special obligations payable solely from payments made on the loans and are secured by a pledge of such
loans. Neither the faith and credit nor the taxing power of the City of Perris have been pledged to the payment of the bonds, and, therefore, the bond indebtedness is not shown in the financial statements of the City.
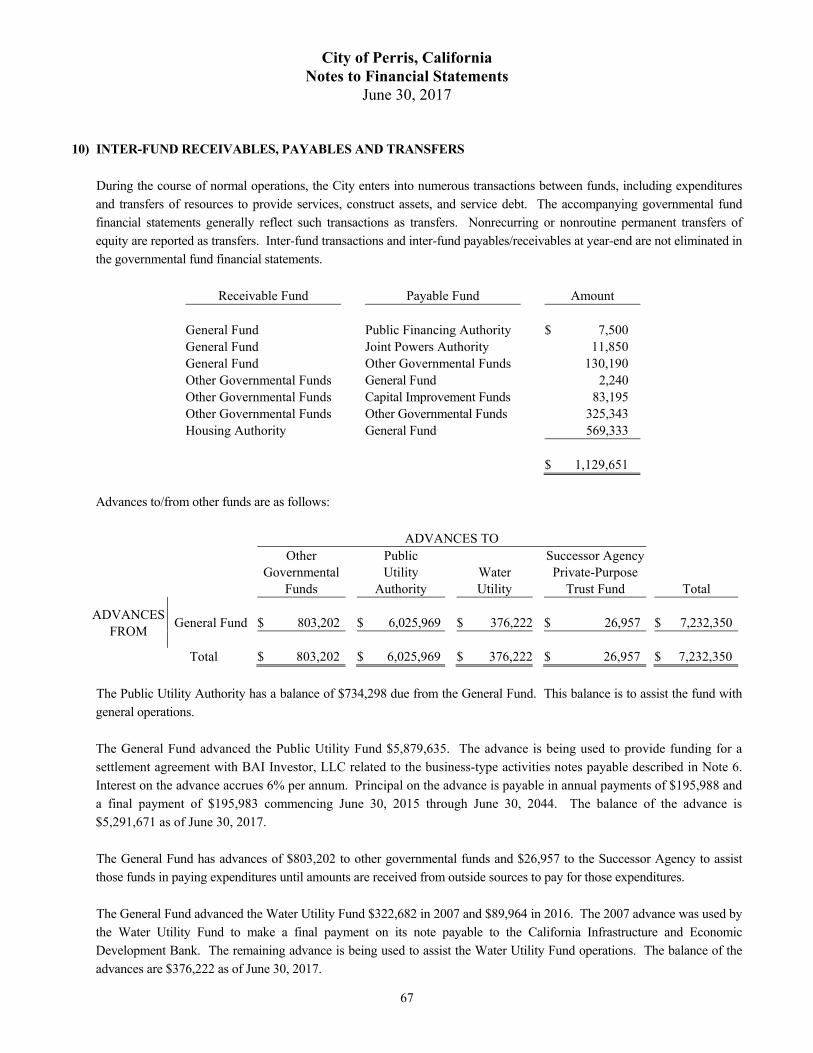
City of Perris, California Notes to Financial Statements
June 30, 2017
67
10) INTER-FUND RECEIVABLES, PAYABLES AND TRANSFERS During the course of normal operations, the City enters into numerous transactions between funds, including expenditures
and transfers of resources to provide services, construct assets, and service debt. The accompanying governmental fund financial statements generally reflect such transactions as transfers. Nonrecurring or nonroutine permanent transfers of equity are reported as transfers. Inter-fund transactions and inter-fund payables/receivables at year-end are not eliminated in the governmental fund financial statements.
Receivable Fund Payable Fund Amount
General Fund Public Financing Authority $ 7,500 General Fund Joint Powers Authority 11,850 General Fund Other Governmental Funds 130,190 Other Governmental Funds General Fund 2,240 Other Governmental Funds Capital Improvement Funds 83,195 Other Governmental Funds Other Governmental Funds 325,343 Housing Authority General Fund 569,333 $ 1,129,651
Advances to/from other funds are as follows:
ADVANCES TO Other Public Successor Agency Governmental Utility Water Private-Purpose Funds Authority Utility Trust Fund Total
ADVANCES FROM
General Fund $ 803,202 $ 6,025,969 $ 376,222 $ 26,957 $ 7,232,350
Total $ 803,202 $ 6,025,969 $ 376,222 $ 26,957 $ 7,232,350
The Public Utility Authority has a balance of $734,298 due from the General Fund. This balance is to assist the fund with
general operations. The General Fund advanced the Public Utility Fund $5,879,635. The advance is being used to provide funding for a
settlement agreement with BAI Investor, LLC related to the business-type activities notes payable described in Note 6. Interest on the advance accrues 6% per annum. Principal on the advance is payable in annual payments of $195,988 and a final payment of $195,983 commencing June 30, 2015 through June 30, 2044. The balance of the advance is $5,291,671 as of June 30, 2017.
The General Fund has advances of $803,202 to other governmental funds and $26,957 to the Successor Agency to assist
those funds in paying expenditures until amounts are received from outside sources to pay for those expenditures. The General Fund advanced the Water Utility Fund $322,682 in 2007 and $89,964 in 2016. The 2007 advance was used by
the Water Utility Fund to make a final payment on its note payable to the California Infrastructure and Economic Development Bank. The remaining advance is being used to assist the Water Utility Fund operations. The balance of the advances are $376,222 as of June 30, 2017.
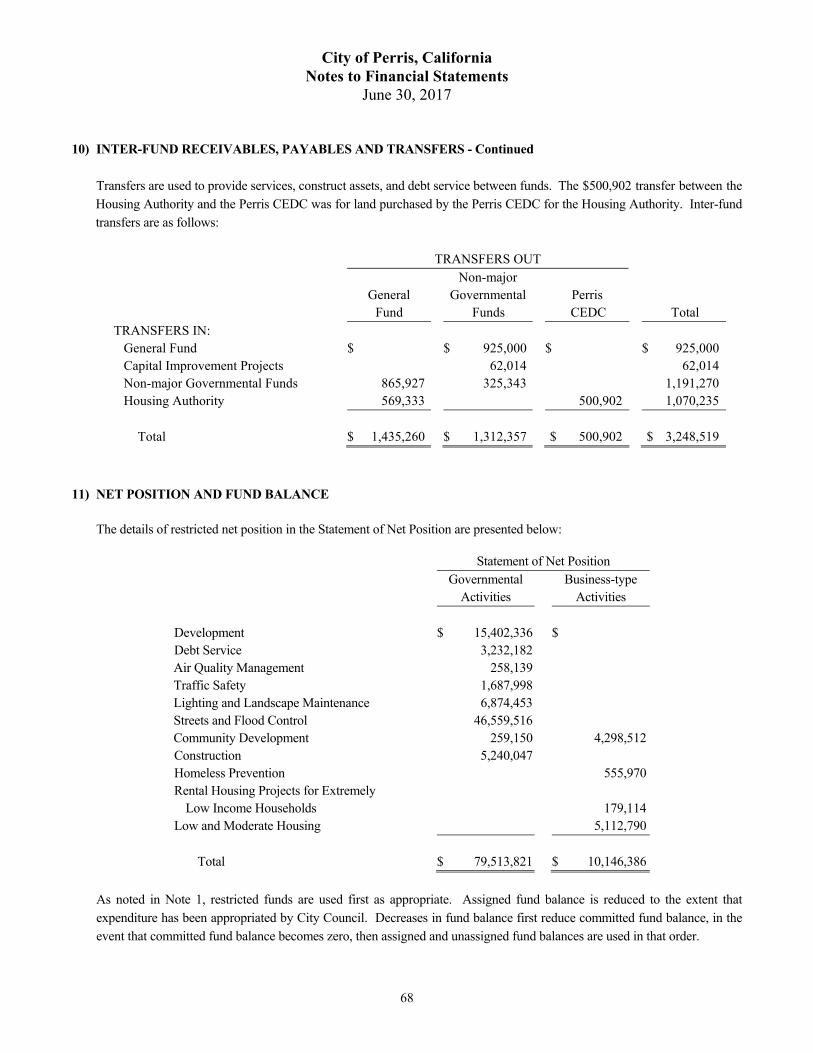
City of Perris, California Notes to Financial Statements
June 30, 2017
68
10) INTER-FUND RECEIVABLES, PAYABLES AND TRANSFERS - Continued Transfers are used to provide services, construct assets, and debt service between funds. The $500,902 transfer between the
Housing Authority and the Perris CEDC was for land purchased by the Perris CEDC for the Housing Authority. Inter-fund transfers are as follows:
TRANSFERS OUT Non-major General Governmental Perris Fund Funds CEDC Total TRANSFERS IN: General Fund $ $ 925,000 $ $ 925,000 Capital Improvement Projects 62,014 62,014 Non-major Governmental Funds 865,927 325,343 1,191,270 Housing Authority 569,333 500,902 1,070,235 Total $ 1,435,260 $ 1,312,357 $ 500,902 $ 3,248,519
11) NET POSITION AND FUND BALANCE The details of restricted net position in the Statement of Net Position are presented below:
Statement of Net Position Governmental Business-type Activities Activities Development $ 15,402,336 $ Debt Service 3,232,182 Air Quality Management 258,139 Traffic Safety 1,687,998 Lighting and Landscape Maintenance 6,874,453 Streets and Flood Control 46,559,516 Community Development 259,150 4,298,512 Construction 5,240,047 Homeless Prevention 555,970 Rental Housing Projects for Extremely Low Income Households
179,114
Low and Moderate Housing 5,112,790 Total $ 79,513,821 $ 10,146,386
As noted in Note 1, restricted funds are used first as appropriate. Assigned fund balance is reduced to the extent that
expenditure has been appropriated by City Council. Decreases in fund balance first reduce committed fund balance, in the event that committed fund balance becomes zero, then assigned and unassigned fund balances are used in that order.
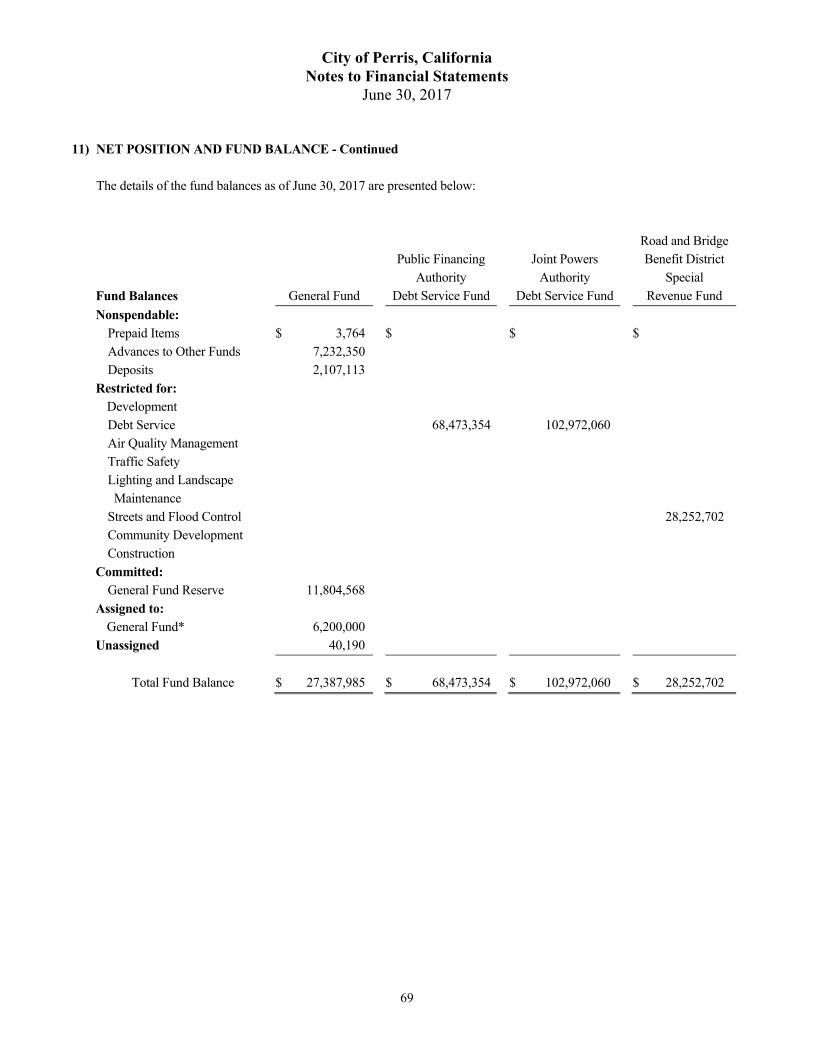
City of Perris, California Notes to Financial Statements
June 30, 2017
69
11) NET POSITION AND FUND BALANCE - Continued The details of the fund balances as of June 30, 2017 are presented below:
Road and Bridge
Fund Balances
General Fund
Public Financing Authority
Debt Service Fund
Joint Powers Authority
Debt Service Fund
Benefit District Special
Revenue Fund
Nonspendable:
Prepaid Items $ 3,764 $ $ $ Advances to Other Funds 7,232,350 Deposits 2,107,113
Restricted for: Development Debt Service 68,473,354 102,972,060 Air Quality Management Traffic Safety Lighting and Landscape Maintenance
Streets and Flood Control 28,252,702 Community Development Construction
Committed: General Fund Reserve 11,804,568
Assigned to: General Fund* 6,200,000
Unassigned 40,190
Total Fund Balance $ 27,387,985 $ 68,473,354 $ 102,972,060 $ 28,252,702
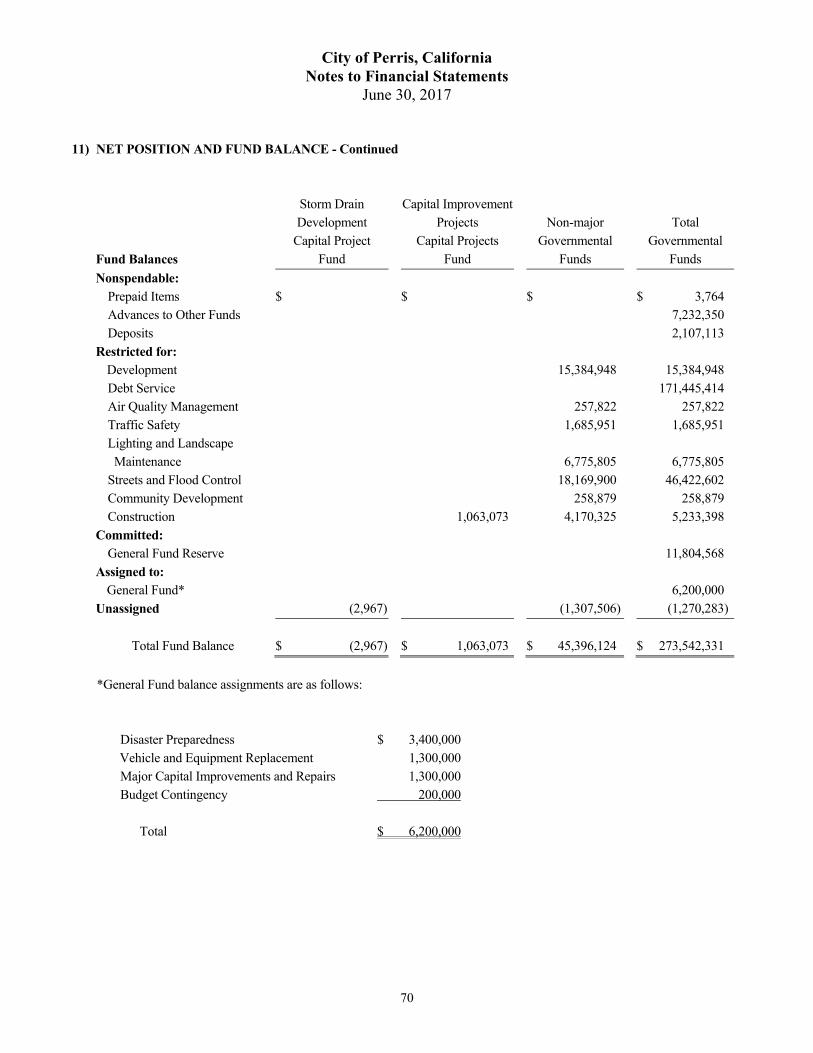
City of Perris, California Notes to Financial Statements
June 30, 2017
70
11) NET POSITION AND FUND BALANCE - Continued
Fund Balances
Storm Drain Development
Capital Project Fund
Capital ImprovementProjects
Capital Projects Fund
Non-major
Governmental Funds
Total
Governmental Funds
Nonspendable: Prepaid Items $ $ $ $ 3,764 Advances to Other Funds 7,232,350 Deposits 2,107,113
Restricted for: Development 15,384,948 15,384,948 Debt Service 171,445,414 Air Quality Management 257,822 257,822 Traffic Safety 1,685,951 1,685,951 Lighting and Landscape Maintenance
6,775,805
6,775,805
Streets and Flood Control 18,169,900 46,422,602 Community Development 258,879 258,879 Construction 1,063,073 4,170,325 5,233,398
Committed: General Fund Reserve 11,804,568
Assigned to: General Fund* 6,200,000
Unassigned (2,967) (1,307,506) (1,270,283)
Total Fund Balance $ (2,967) $ 1,063,073 $ 45,396,124 $ 273,542,331
*General Fund balance assignments are as follows:
Disaster Preparedness $ 3,400,000Vehicle and Equipment Replacement 1,300,000Major Capital Improvements and Repairs 1,300,000Budget Contingency 200,000 Total $ 6,200,000
City of Perris, California Notes to Financial Statements
June 30, 2017
71
12) OTHER REQUIRED INDIVIDUAL FUND DISCLOSURES Total expenditures exceeded total appropriations in the following funds:
Appropriations Expenditures Difference Debt Service Funds: Joint Powers Authority $ 4,905,089 $ 7,897,649 $ (2,992,560)
The following had a deficit fund balance at June 30, 2017. These deficits are expected to be eliminated through future
revenues. Fund Amount
Storm Drain Development Capital Project Fund $ (2,967) CDBG Entitlement Special Revenue Fund (150,100) State Grants Special Revenue Fund (894,742) Federal Grants Special Revenue Fund (226,584) Local Health Grant Special Revenue Fund (36,080) Public Utility Authority Enterprise Fund (1,850,583)
13) CITY EMPLOYEES’ RETIREMENT PLAN (DEFINED BENEFIT PENSION PLAN)
A) General Information about the Pension Plans
Plan Description - All qualified permanent and probationary employees are eligible to participate in the City’s Cost-Sharing Multiple Employer Defined Benefit Pension Plan (Plan) administered by the California Public Employees’ Retirement System (CalPERS). The Plan consists of individual rate plans (benefit tiers) within a safety risk pool (police and fire) and a miscellaneous risk pool (all other). Plan assets may be used to pay benefits for any employer rate plan of the safety and miscellaneous pools. Accordingly, rate plans within the safety or miscellaneous pools are not separate plans under GASB Statement No. 68. Individual employers may sponsor more than one rate plan in the miscellaneous or safety risk pools. The City sponsors four rate plans (three miscellaneous and one safety). Benefit provisions under the Plan are established by State statute and City resolution. CalPERS issues publicly available reports that include a full description of the pension plan regarding provisions, assumptions and membership information that can be found on the CalPERS website.
Benefits Provided - CalPERS provides service retirement and disability benefits, annual cost of living adjustments and death benefits to plan members, who must be public employees and beneficiaries. Benefits are based on years of credited service, equal to one year of fulltime employment. Members with five years of total service are eligible to retire at age 50 with statutorily reduced benefits. All members are eligible for non-duty disability benefits after 10 years of service. The death benefit is one of the following: the Basic Death Benefit, the 1957 Survivor Benefit, or the Optional Settlement 2W Death Benefit. The cost of living adjustments for each plan are applied as specified by the Public Employees’ Retirement Law.
City of Perris, California Notes to Financial Statements
June 30, 2017
72
13) CITY EMPLOYEES’ RETIREMENT PLAN (DEFINED BENEFIT PENSION PLAN)
A) General Information about the Pension Plans - Continued The rate plans provisions and benefits in effect at June 30, 2017, are summarized as follows:
Miscellaneous Prior to On or After Hire Date January 1, 2013 January 1, 2013(1)
Benefit Formulas 2.7% at 55 2.0% at 60
2.0% at 62
Benefit Vesting Schedule 5 Years Service 5 Years Service Benefit Payments Monthly for Life Monthly for Life Retirement Age 50-55+ 52-67+ Monthly Benefits, as a % of Eligible Compensation 2.0% to 2.7% 1.0% to 2.5% Required Employee Contribution Rates 8% 6.25% Required Employer Contribution Rates 11.634% 6.555%
Miscellaneous 2nd Tier Prior to On or After Hire Date January 1, 2013 January 1, 2013(1)
Benefit Formulas 2.0% at 60 2% at 62 Benefit Vesting Schedule 5 Years Service 5 Years Service Benefit Payments Monthly for Life Monthly for Life Retirement Age 55 - 60 52 - 67 Monthly Benefits, as a % of Eligible Compensation 1.092% - 2.418% 1.0% - 2.5% Required Employee Contribution Rates 7% 6.25% Required Employer Contribution Rates 7.159% 6.555%
Safety(2)
Prior to On or After Hire Date January 1, 2013 January 1, 2013(1)
Benefit Formulas 0.5% at 55 N/A Benefit Vesting Schedule 5 Years Service N/A Benefit Payments Monthly for Life N/A Retirement Age 50 N/A Monthly Benefits, as a % of Eligible Compensation 0.5% N/A Required Employee Contribution Rates N/A N/A Required Employer Contribution Rates N/A N/A
(1) For employees hired on or after January 1, 2013, they are included in their respective PEPRA (California Public
Employees’ Pension Reform Act) Plans with the above provisions and benefits. (2) Note the City currently does not have any safety employees. The Safety Plan represents former safety employees.

City of Perris, California Notes to Financial Statements
June 30, 2017
73
13) CITY EMPLOYEES’ RETIREMENT PLAN (DEFINED BENEFIT PENSION PLAN) - Continued
A. General Information about the Pension Plans - Continued
Contributions - Section 20814(c) of the California Public Employees’ Retirement Law requires that the employer
contribution rates for all public employers be determined on an annual basis by the actuary and shall be effective on
the July 1 following notice of a change in the rate. Funding contributions for both Plans are determined annually on
an actuarial basis as of June 30 by CalPERS. The actuarially determined rate is the estimated amount necessary to
finance the costs of benefits earned by employees during the year, with an additional amount to finance any
unfunded accrued liability. The City is required to contribute the difference between the actuarially determined rate
and the contribution rate of employees.
The contributions to the Plan for the year ended June 30, 2017 were $883,205.
B. Pension Liabilities, Pension Expenses and Deferred Outflows/Inflows of Resources Related to Pensions
As of June 30, 2017, the City reported a net pension liability for its proportionate share of the net pension liability
of the Plan of $11,038,624.
The City net pension liability for the Plan is measured as the proportionate share of the net pension liability. The
net pension liability of the Plan is measured as of June 30, 2016, and the total pension liability for the Plan used to
calculate the net pension liability was determined by an actuarial valuation as of June 30, 2015 rolled forward to
June 30, 2016 using standard update procedures. The City’s proportion of the net pension liability was based on a
projection of the City’s long-term share of contributions to the pension plans relative to the projected contributions
of all participating employers, actuarially determined.
The City’s proportionate share of the net pension liability as of June 30, 2016 and 2017 was as follows:
Proportion Change
June 30, 2017 June 30, 2016 Increase (Decrease) 0.01387% 0.12102% 0.00655%
City of Perris, California Notes to Financial Statements
June 30, 2017
74
13) CITY EMPLOYEES’ RETIREMENT PLAN (DEFINED BENEFIT PENSION PLAN) - Continued
B. Pension Liabilities, Pension Expenses and Deferred Outflows/Inflows of Resources Related to Pensions - Continued
For the year ended June 30, 2017, the City recognized pension expense (credit) of $1,970,659. At June 30, 2017,
City reported deferred outflows of resources and deferred inflows of resources related to pensions from the
following sources:
Deferred Outflows of Resources
Deferred Inflows of Resources
Pension contributions subsequent to measurement date $ 883,205 $ Differences between actual and expected experience 24,423 (14,801) Changes in assumptions (271,201) Change in employer’s proportion and differences between the employer’s contributions and the employer’s Proportionate share of contributions
1,134,367
(627,166)
Net differences between projected and actual earnings on plan investments
1,399,806
Total $ 3,441,801 $ (913,168)
The City reported $883,205 as deferred outflows of resources related to contributions subsequent to the
measurement date will be recognized as a reduction of the net pension liability in the year ended June 30, 2018.
Other amounts reported as deferred outflows of resources and deferred inflow of resources related to pensions will
be recognized as pension expense as follows:
Year Ended June 30
2018 $ 299,067 2019 324,635 2020 658,901 2021 362,825
City of Perris, California Notes to Financial Statements
June 30, 2017
75
13) CITY EMPLOYEES’ RETIREMENT PLAN (DEFINED BENEFIT PENSION PLAN) - Continued
B. Pension Liabilities, Pension Expenses and Deferred Outflows/Inflows of Resources Related to Pensions - Continued
Actuarial Assumptions - The total pension liabilities in the June 30, 2015 actuarial valuations were determined using the following actuarial assumptions:
Miscellaneous Valuation Date June 30, 2015 Measurement Date June 30, 2016 Actuarial Cost Method Actuarial Assumptions: Discount Rate 7.65% Inflation 2.75% Payroll Growth 3.0% Projected Salary Increase 3.3% - 14.2% (1) Investment Rate of Return 7.65% (2) Mortality CalPERS Membership Data (3) (1) Depending on age, service and type of employment (2) Net of pension plan investment expenses, including inflation (3) The Mortality Rate Table was derived using CalPERs’ membership data for all funds. The table includes 20
years of mortality improvements using Society of Actuaries Scale BB. For more details on this table, please refer to the 2014 experience study report from the CalPERS website.
All other actuarial assumptions used in the June 30, 2015 valuation were based on the results of an actuarial experience study for the period 1997 to 2011 including updates to salary increase, mortality and retirement rates. Further details of the Experience Study can be found on the CalPERS website.
Discount Rate - The discount rate used to measure the total pension liability was 7.65% for the Plan. To determine whether the municipal bond rate should be used in the calculation of a discount rate for the Plan, CalPERS stress tested plans that would most likely result in a discount rate that would be different from the actuarially assumed discount rate. The tests revealed the assets would not run out. Therefore, the current 7.65 percent discount rate is appropriate and the use of the municipal bond rate calculation is not deemed necessary. The long term expected discount rate of 7.65 percent will be applied to all plans in the Public Employees Retirement Fund (PERF). The cash flows used in the testing were developed assuming that both members and employers will make their required contributions on time and as scheduled in all future years. The stress test results are presented in a detailed report called “GASB Crossover Testing Report” that can be obtained at CalPERS website under the GASB 68 section. The long-term expected rate of return on pension plan investments was determined using a building-block method
in which best-estimate ranges of expected future real rates of return (expected returns, net of pension plan
investment expense and inflation) are developed for each major asset class.

City of Perris, California Notes to Financial Statements
June 30, 2017
76
13) CITY EMPLOYEES’ RETIREMENT PLAN (DEFINED BENEFIT PENSION PLAN) - Continued
B. Pension Liabilities, Pension Expenses and Deferred Outflows/Inflows of Resources Related to Pensions - Continued
In determining the long-term expected rate of return, staff took into account both short-term and long-term market
return expectations as well as the expected pension fund (PERF) cash flows. Taking into account historical returns
of all the Public Employee Retirement Funds’ asset classes (which includes the agent plan and two cost sharing
plans or PERF A, B, and C funds), expected compound (geometric) returns were calculated over the short-term
(first 10 years) and the long-term (11-60 years) using a building-block approach. Using the expected nominal
returns for both short-term and long-term, the present value of benefits was calculated for each PERF fund. The
expected rate of return was set by calculating the single equivalent expected return that arrived at the same present
value of benefits for cash flows as the one calculated using both short-term and long-term returns. The expected
rate of return was then set equivalent to the single equivalent rate calculated above the rounded down to the nearest
one quarter of one percent.
The table below reflects the long-term expected real rate of return by asset class. The rate of return was calculated
using the capital market assumptions applied to determine the discount rate and asset allocation. The target
allocation shown was adopted by the CalPERS Board effective on July 1, 2015.
Asset Class
New Strategic Allocation
Real Return Years 1 - 10(a)
Real Return Years 11+(b)
Global Equity 51.0% 5.25% 5.71% Global Fixed Income 20.0% 0.99% 2.43% Inflation Sensitive 6.0% 0.45% 3.36% Private Equity 10.0% 6.83% 6.95% Real Estate 10.0% 4.50% 5.13% Infrastructure and Forestland 2.0% 4.50% 5.09% Liquidity 1.0% -0.55% -1.05%
Total 100%
(a) An expected inflation of 2.5% used for this period. (b) An expected inflation of 3.0% used for this period.
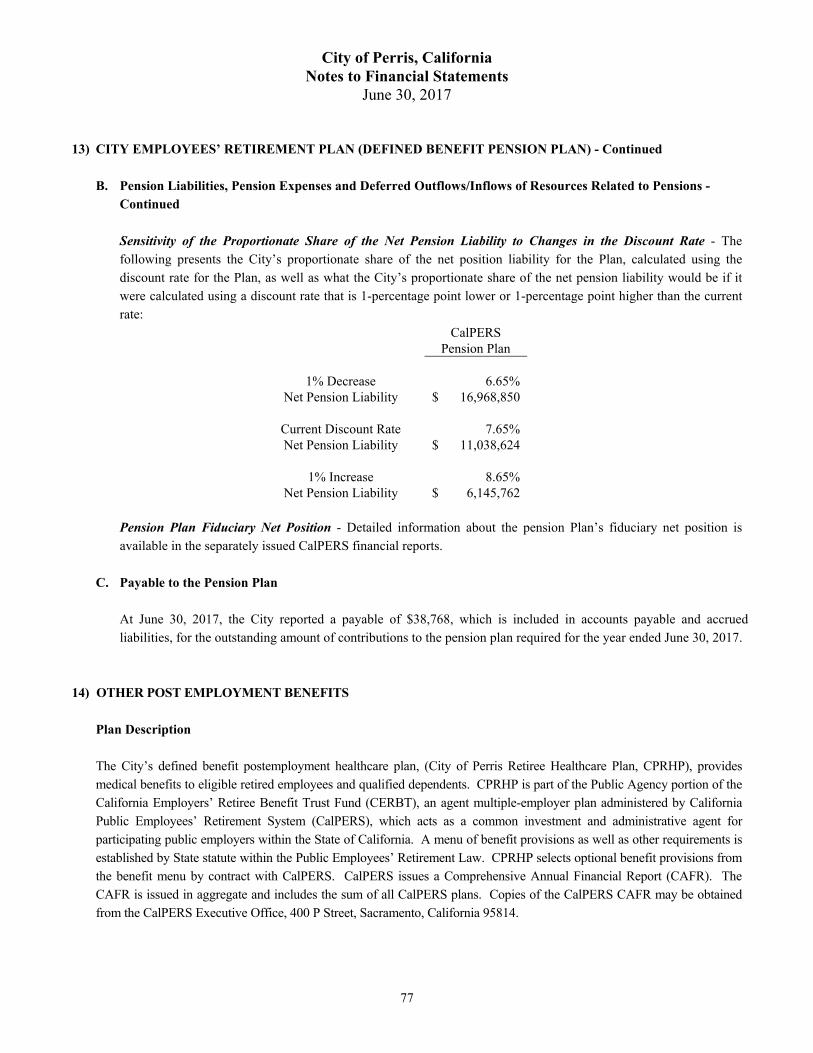
City of Perris, California Notes to Financial Statements
June 30, 2017
77
13) CITY EMPLOYEES’ RETIREMENT PLAN (DEFINED BENEFIT PENSION PLAN) - Continued
B. Pension Liabilities, Pension Expenses and Deferred Outflows/Inflows of Resources Related to Pensions - Continued
Sensitivity of the Proportionate Share of the Net Pension Liability to Changes in the Discount Rate - The following presents the City’s proportionate share of the net position liability for the Plan, calculated using the discount rate for the Plan, as well as what the City’s proportionate share of the net pension liability would be if it were calculated using a discount rate that is 1-percentage point lower or 1-percentage point higher than the current rate:
CalPERS Pension Plan
1% Decrease 6.65%
Net Pension Liability $ 16,968,850
Current Discount Rate 7.65% Net Pension Liability $ 11,038,624
1% Increase 8.65%
Net Pension Liability $ 6,145,762
Pension Plan Fiduciary Net Position - Detailed information about the pension Plan’s fiduciary net position is available in the separately issued CalPERS financial reports.
C. Payable to the Pension Plan At June 30, 2017, the City reported a payable of $38,768, which is included in accounts payable and accrued liabilities, for the outstanding amount of contributions to the pension plan required for the year ended June 30, 2017.
14) OTHER POST EMPLOYMENT BENEFITS
Plan Description The City’s defined benefit postemployment healthcare plan, (City of Perris Retiree Healthcare Plan, CPRHP), provides medical benefits to eligible retired employees and qualified dependents. CPRHP is part of the Public Agency portion of the California Employers’ Retiree Benefit Trust Fund (CERBT), an agent multiple-employer plan administered by California Public Employees’ Retirement System (CalPERS), which acts as a common investment and administrative agent for participating public employers within the State of California. A menu of benefit provisions as well as other requirements is established by State statute within the Public Employees’ Retirement Law. CPRHP selects optional benefit provisions from the benefit menu by contract with CalPERS. CalPERS issues a Comprehensive Annual Financial Report (CAFR). The CAFR is issued in aggregate and includes the sum of all CalPERS plans. Copies of the CalPERS CAFR may be obtained from the CalPERS Executive Office, 400 P Street, Sacramento, California 95814.
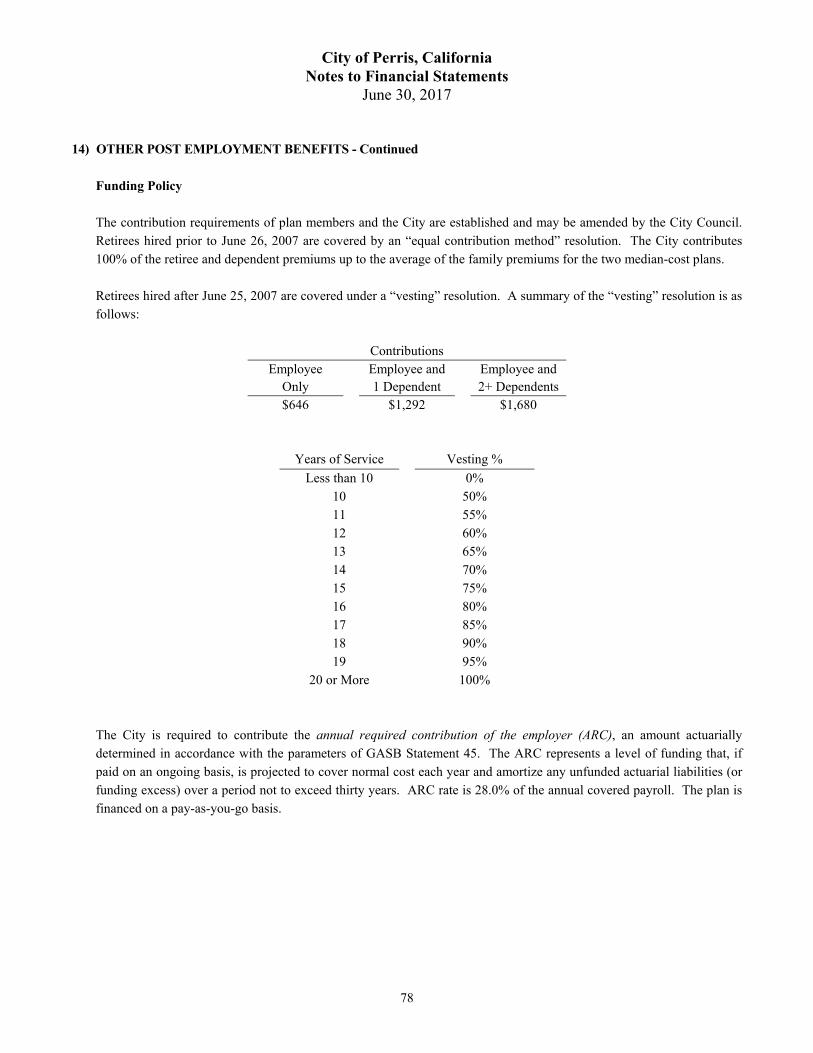
City of Perris, California Notes to Financial Statements
June 30, 2017
78
14) OTHER POST EMPLOYMENT BENEFITS - Continued
Funding Policy The contribution requirements of plan members and the City are established and may be amended by the City Council. Retirees hired prior to June 26, 2007 are covered by an “equal contribution method” resolution. The City contributes 100% of the retiree and dependent premiums up to the average of the family premiums for the two median-cost plans. Retirees hired after June 25, 2007 are covered under a “vesting” resolution. A summary of the “vesting” resolution is as follows:
Contributions Employee Employee and Employee and
Only 1 Dependent 2+ Dependents $646 $1,292 $1,680
Years of Service Vesting %
Less than 10 0% 10 50% 11 55% 12 60% 13 65% 14 70% 15 75% 16 80% 17 85% 18 90% 19 95%
20 or More 100%
The City is required to contribute the annual required contribution of the employer (ARC), an amount actuarially determined in accordance with the parameters of GASB Statement 45. The ARC represents a level of funding that, if paid on an ongoing basis, is projected to cover normal cost each year and amortize any unfunded actuarial liabilities (or funding excess) over a period not to exceed thirty years. ARC rate is 28.0% of the annual covered payroll. The plan is financed on a pay-as-you-go basis.

City of Perris, California Notes to Financial Statements
June 30, 2017
79
14) OTHER POST EMPLOYMENT BENEFITS - Continued
Annual OPEB Cost and Net OPEB Obligation The following table shows the components of the City's annual OPEB cost for the year, the amount actually contributed to the plan, and changes in the City's Net OPEB obligation to the Retiree Health Plan:
Annual Required Contribution $ 1,638,813 Interest on Net OPEB Obligation 296,548 Adjustments to Annual Required Contribution (379,321)
Annual OPEB Cost (Expense) 1,556,040 Contributions Made (466,773)
Increase (Decrease) in Net OPEB Obligation 1,089,267 Net OPEB Obligation - Beginning of Year 7,413,694
Net OPEB Obligation - End of Year $ 8,502,961
For 2017, the City’s annual OPEB cost (expense) of $1,447,999 for CPRHP was equal to the ARC. OPEB costs are typically charged to the General fund and to the Government-wide financial statements for governmental activities. The City’s annual OPEB cost, the percentage of annual OPEB cost contributed to the plan, and the net OPEB obligation for 2017 and the three preceding years were as follows:
THREE YEAR TREND INFORMATION FOR CPRHP Fiscal Annual OPEB Percentage of Net Pension Year Cost (AOC) AOC Contributed Obligation 6/30/15 $ 1,400,909 31% $ 6,448,546 6/30/16 $ 1,439,393 33% $ 7,413,694 6/30/17 $ 1,556,040 30% $ 8,502,961
The funded status of the plan as of July 1, 2014, was as follows:
Actuarial Accrued Liability (AAL) $ 14,849,261 Actuarial Value of Plan Assets $ 0 Unfunded Actuarial Accrued Liability (UAAL) $ 14,849,261 Funded Ratio (Actuarial Value of Plan Assets/AAL) 0% Covered Payroll (Active Plan Members) $ 5,308,945 UAAL as a Percentage of Covered Payroll 279.70%
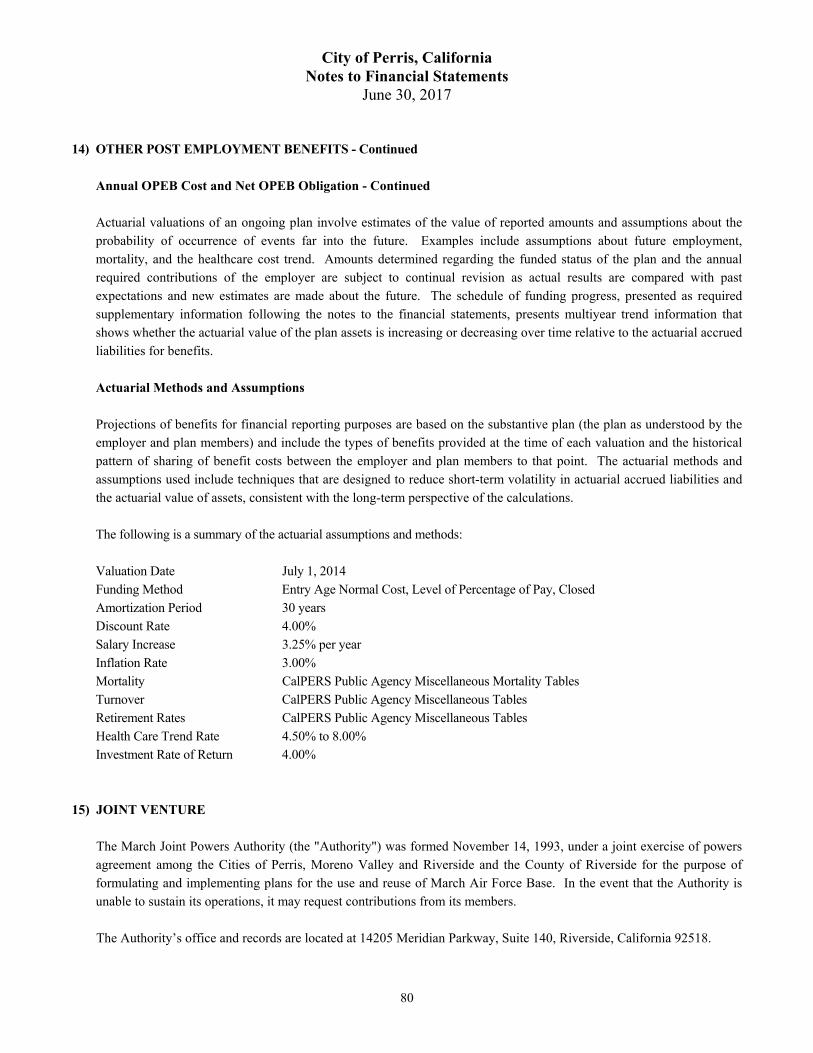
City of Perris, California Notes to Financial Statements
June 30, 2017
80
14) OTHER POST EMPLOYMENT BENEFITS - Continued
Annual OPEB Cost and Net OPEB Obligation - Continued Actuarial valuations of an ongoing plan involve estimates of the value of reported amounts and assumptions about the probability of occurrence of events far into the future. Examples include assumptions about future employment, mortality, and the healthcare cost trend. Amounts determined regarding the funded status of the plan and the annual required contributions of the employer are subject to continual revision as actual results are compared with past expectations and new estimates are made about the future. The schedule of funding progress, presented as required supplementary information following the notes to the financial statements, presents multiyear trend information that shows whether the actuarial value of the plan assets is increasing or decreasing over time relative to the actuarial accrued liabilities for benefits.
Actuarial Methods and Assumptions Projections of benefits for financial reporting purposes are based on the substantive plan (the plan as understood by the employer and plan members) and include the types of benefits provided at the time of each valuation and the historical pattern of sharing of benefit costs between the employer and plan members to that point. The actuarial methods and assumptions used include techniques that are designed to reduce short-term volatility in actuarial accrued liabilities and the actuarial value of assets, consistent with the long-term perspective of the calculations. The following is a summary of the actuarial assumptions and methods: Valuation Date July 1, 2014 Funding Method Entry Age Normal Cost, Level of Percentage of Pay, Closed Amortization Period 30 years Discount Rate 4.00% Salary Increase 3.25% per year Inflation Rate 3.00% Mortality CalPERS Public Agency Miscellaneous Mortality Tables Turnover CalPERS Public Agency Miscellaneous Tables Retirement Rates CalPERS Public Agency Miscellaneous Tables Health Care Trend Rate 4.50% to 8.00% Investment Rate of Return 4.00%
15) JOINT VENTURE The March Joint Powers Authority (the "Authority") was formed November 14, 1993, under a joint exercise of powers
agreement among the Cities of Perris, Moreno Valley and Riverside and the County of Riverside for the purpose of formulating and implementing plans for the use and reuse of March Air Force Base. In the event that the Authority is unable to sustain its operations, it may request contributions from its members.
The Authority’s office and records are located at 14205 Meridian Parkway, Suite 140, Riverside, California 92518.
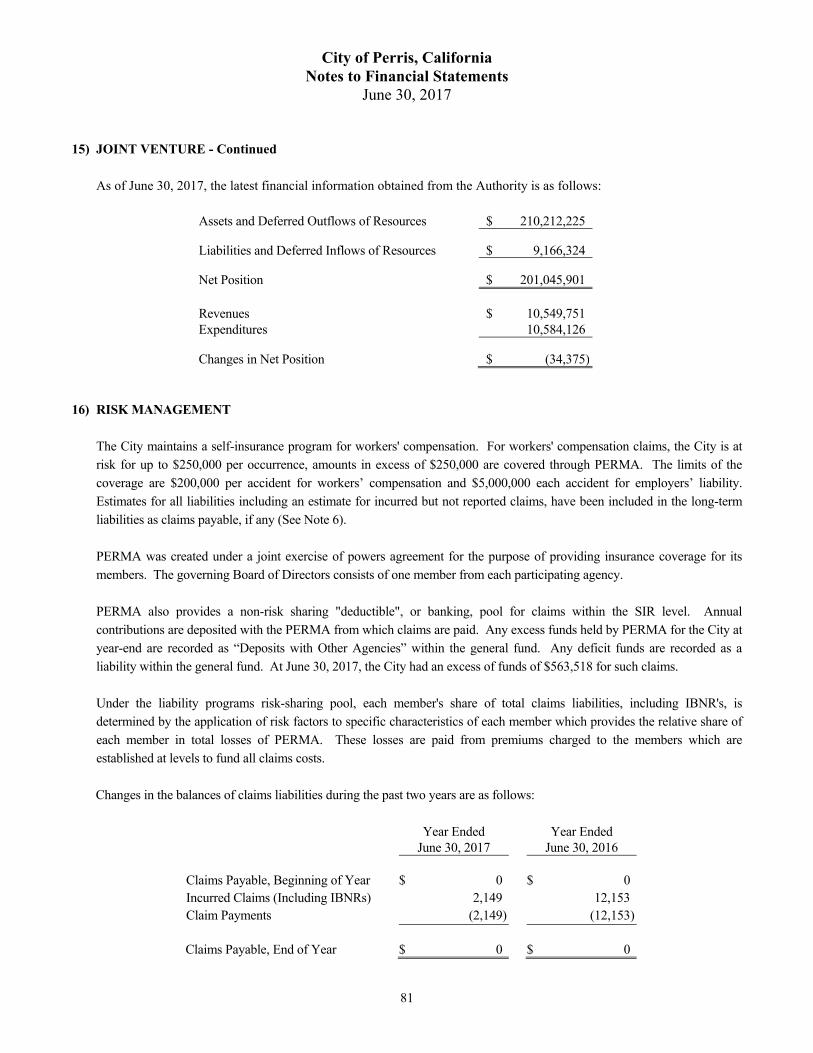
City of Perris, California Notes to Financial Statements
June 30, 2017
81
15) JOINT VENTURE - Continued As of June 30, 2017, the latest financial information obtained from the Authority is as follows:
Assets and Deferred Outflows of Resources $ 210,212,225 Liabilities and Deferred Inflows of Resources $ 9,166,324 Net Position $ 201,045,901 Revenues $ 10,549,751 Expenditures 10,584,126 Changes in Net Position $ (34,375)
16) RISK MANAGEMENT The City maintains a self-insurance program for workers' compensation. For workers' compensation claims, the City is at
risk for up to $250,000 per occurrence, amounts in excess of $250,000 are covered through PERMA. The limits of the coverage are $200,000 per accident for workers’ compensation and $5,000,000 each accident for employers’ liability. Estimates for all liabilities including an estimate for incurred but not reported claims, have been included in the long-term liabilities as claims payable, if any (See Note 6).
PERMA was created under a joint exercise of powers agreement for the purpose of providing insurance coverage for its
members. The governing Board of Directors consists of one member from each participating agency. PERMA also provides a non-risk sharing "deductible", or banking, pool for claims within the SIR level. Annual
contributions are deposited with the PERMA from which claims are paid. Any excess funds held by PERMA for the City at year-end are recorded as “Deposits with Other Agencies” within the general fund. Any deficit funds are recorded as a liability within the general fund. At June 30, 2017, the City had an excess of funds of $563,518 for such claims.
Under the liability programs risk-sharing pool, each member's share of total claims liabilities, including IBNR's, is
determined by the application of risk factors to specific characteristics of each member which provides the relative share of each member in total losses of PERMA. These losses are paid from premiums charged to the members which are established at levels to fund all claims costs.
Changes in the balances of claims liabilities during the past two years are as follows:
Year Ended Year Ended June 30, 2017 June 30, 2016 Claims Payable, Beginning of Year $ 0 $ 0 Incurred Claims (Including IBNRs) 2,149 12,153 Claim Payments (2,149) (12,153) Claims Payable, End of Year $ 0 $ 0
City of Perris, California Notes to Financial Statements
June 30, 2017
82
16) RISK MANAGEMENT - Continued The workers' compensation insurance program is a non-risk sharing program. Therefore, each member is directly charged
for any losses incurred. Each member's equity represents accumulated contributions held by PERMA on the member's behalf. Any deficits created for losses in excess of assets available for a given member is funded over a ten year period through an adjustment to required premiums. During the past three fiscal years none of the above programs of protection have had settlements or judgements that exceeded pooled or insured coverage. There have been no significant reductions in pooled or insured liability coverage from coverage in the prior year. The aforementioned information is not included in the accompanying financial statements. Separate financial statements of PERMA may be obtained at 36-951 Cook Street, Suite 101, Palm Desert, California, 92211.
17) COMMITMENTS AND CONTINGENCIES
As of June 30, 2017, there were no significant encumbrances.
18) SUCCESSOR AGENCY TRUST FOR ASSETS OF FORMER REDEVELOPMENT AGENCY On December 29, 2011, the California Supreme Court upheld Assembly Bill 1X 26 ("the Bill") that provides for the
dissolution of all redevelopment agencies in the State of California. This action impacted the reporting entity of the City of Perris (City) that previously had reported a redevelopment agency within the reporting entity as a blended component unit. The Bill provides that upon dissolution of a redevelopment agency, either the City or another unit of local government will agree to serve as the “successor agency” to hold the assets until they are distributed to other units of state and local government. On March 29, 2011, the City Council elected to become the Successor Agency for the former redevelopment agency in accordance with the Bill as part of City resolution number 4383. In accordance with the timeline set forth in the Bill (as modified by the California Supreme Court on December 29, 2011) all redevelopment agencies in the State of California were dissolved and ceased to operate as a legal entity as of February 1, 2012.
After enactment of the law, which occurred on June 28, 2011, redevelopment agencies in the State of California cannot
enter into new projects, obligations, or commitments. Subject to the control of a newly established oversight board, remaining assets can only be pay enforceable obligations in existence at the date of dissolution (including the completion of any unfinished projects that were subject to legally enforceable contractual commitments. In future fiscal years, successor agencies will only be allocated revenue in the amount that is necessary to pay the estimated annual installment payments on enforceable obligations of the former redevelopment agency until all enforceable obligations of the prior redevelopment agency have been paid in full and all assets have been liquidated.
Successor Agency Capital Assets The remaining capital assets, as of June 30, 2017 is $335,048 which consists of land.

City of Perris, California Notes to Financial Statements
June 30, 2017
83
18) SUCCESSOR AGENCY TRUST FOR ASSETS OF FORMER REDEVELOPMENT AGENCY - Continued
Successor Agency Long-term Obligations
The following is a summary of the changes in the Successor Agency long-term obligations for the year:
Beginning Ending Balance Additions Deletions Balance Pass-through Agreements $ 9,993 $ $ 1,999 $ 7,994Loans Payable to PFA 67,550,000 1,970,000 65,580,000Loan Premiums 2,724,423 152,918 2,571,505 $ 70,284,416 $ 0 $ 2,124,917 $ 68,159,499
Pass-through Agreements Payables The Agency has entered into pass-through agreements with several other units of local governments in order to lessen
the fiscal impact of tax increment financing of redevelopment projects on these other governments. Amounts will be repaid as tax increment funds become available, therefore, a debt amortization schedule is not provided. The estimated portion due is $1,999 based on the most recent activity.
Loans Payable to Public Financing Authority
The City of Perris Public Financing Authority (the "Authority") has issued Tax Allocation Revenue Bonds for financing projects of the Agency and to provide funds for the various debt obligations of the Agency. The Agency has entered into loan agreements with the Authority which mirror the bonds issued by the Authority. Concurrent with the execution and delivery of the loan agreements, the Authority issued the aggregate principal amount of its Tax Allocation Revenue Bonds to the Agency. The loans were made as an advance for the principal amount which was made from the proceeds of the bonds on the closing date of the bond. The principal and interest are payable in installment payments payable not less than three business days prior to the due date on the bonds. See Note 4 loans receivable for the related bond issues of the Authority.
The following table represents the balance of net proceeds loaned to the Successor Agency at the end of the year:
Amount Loans Receivable Issued End of Year 2009 Series A Issue $ 4,055,000 $ 3,555,000 2009 Series B Issue 7,605,000 7,040,000 2009 Series C Issue 5,490,000 5,010,000 2010 Series A Issue 7,180,000 6,985,000 2015 Series A Issue 21,590,000 20,635,000 2015 Series B Issue 23,120,000 22,355,000 Total $ 69,040,000 $ 65,580,000
City of Perris, California Notes to Financial Statements
June 30, 2017
84
18) SUCCESSOR AGENCY TRUST FOR ASSETS OF FORMER REDEVELOPMENT AGENCY - Continued
Loans Payable to Public Financing Authority - Continued The balance at June 30, 2017, of the accounts with retained funds is $6,330,957 by the Authority and is reflected as deposits in the fiduciary fund statements.
Contingencies Management believes, in consultation with legal counsel, that the obligations of the former redevelopment agency due to
the City are valid enforceable obligations payable by the successor agency trust under the requirements of the Bill. The City’s position on this issue is not a position of settled law and there is considerable legal uncertainty regarding this issue. It is reasonably possible that a legal determination may be made at a later date by an appropriate judicial authority that would resolve this issue unfavorable to the City.
19) SUBSEQUENT EVENTS
On July 27, 2017, the City of Perris approved an Asset Purchase Agreement with Liberty Utilities regarding a proposed sale of the City’s water systems. The agreement is contingent on the passing of Measure H and other factors. The sale of the water systems has yet to occur. On September 12, 2017, the City approved the transfer of the North Perris Water System from the Public Utility Authority Fund to the Water Utility Fund. On September 12, 2017, the Perris Joint Powers Authority issued $22,175,000 2017 Local Agency Revenue Bonds, Series B, to acquire (CFD 2001-1 IA 4 & 5 and CFD 2005-1 IA 4) Special Tax Bonds. Interest on the bonds is payable September 1st and March 1st of each year. Interest on the bonds accrues at rates varying from 2.00% to 5.00% per annum. Principal on serial bonds is payable in annual installments ranging from $825,000 to $1,555,000, commencing September 1, 2018 through September 1, 2037. In November 2017, Measure H was passed by the voters to sell the City of Perris’s water systems. On December 14, 2017, the Perris Joint Powers Authority issued $4,060,000 2017 Local Agency Revenue Refunding Bonds, Series C, to acquire CFD 93-1 and CFD 2004-5 Special Tax Bonds. Interest on the bonds is payable September 1st and March 1st of each year. Interest on the bonds accrues at rates varying from 2.00% to 3.75% per annum. Principal on serial bonds is payable in annual installments ranging from $70,000 to $595,000 commencing September 1, 2018 through September 1, 2035.
City of Perris, California Notes to Financial Statements
June 30, 2017
85
20) RESTATEMENTS
The City implemented GASB Statement No. 80, Blending Requirements for Certain Component Units – an Amendment of GASB Statement No. 14. Before the implementation of the GASB statement, the Perris Community Economic Development Corporation, a nonprofit public benefit corporation, was presented as a discretely presented component unit. However, since the City is the sole corporate member of the corporation, under GASB Statement No. 80, it should be presented as a blended component unit. The restatements for the Statement of Activities are as follows:
Primary Government Component Unit Description
Business-type Activities
Perris CEDC
Beginning Net Position, As Previously Stated $ 14,555,614 $ 6,160,228 Adjustment 6,160,228 (6,160,228) Beginning Net Position, Restated
$ 20,715,842
$ 0
The restatements for the Statement of Revenues, Expenses, and Changes in Net Position - Proprietary Funds are as follows:
Description
Perris CEDC
Beginning Net Position, As Previously Stated $ 0 Adjustment 6,160,228 Beginning Net Position, Restated
$ 6,160,228
The restatements for the Statement of Cash Flows - Proprietary Funds are as follows:
Description
Perris CEDC
Cash and Cash Equivalents, As Previously Stated $ 0 Adjustment 6,375,549 Cash and Cash Equivalents, Restated
$ 6,375,549
REQUIRED SUPPLEMENTARY INFORMATION

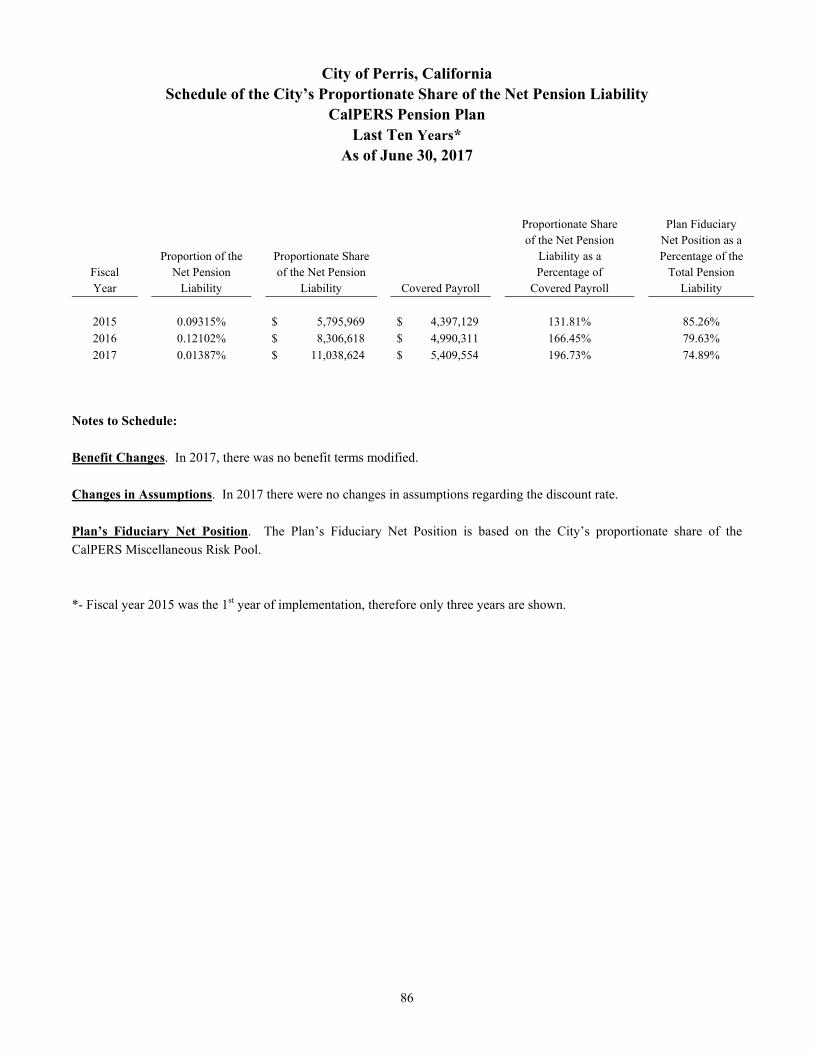
86
City of Perris, California Schedule of the City’s Proportionate Share of the Net Pension Liability
CalPERS Pension Plan Last Ten Years*
As of June 30, 2017
Proportionate Share Plan Fiduciary of the Net Pension Net Position as a Proportion of the Proportionate Share Liability as a Percentage of the
Fiscal Net Pension of the Net Pension Percentage of Total Pension Year Liability Liability Covered Payroll Covered Payroll Liability
2015 0.09315% $ 5,795,969 $ 4,397,129 131.81% 85.26%
2016 0.12102% $ 8,306,618 $ 4,990,311 166.45% 79.63%
2017 0.01387% $ 11,038,624 $ 5,409,554 196.73% 74.89%
Notes to Schedule:
Benefit Changes. In 2017, there was no benefit terms modified.
Changes in Assumptions. In 2017 there were no changes in assumptions regarding the discount rate.
Plan’s Fiduciary Net Position. The Plan’s Fiduciary Net Position is based on the City’s proportionate share of the CalPERS Miscellaneous Risk Pool. *- Fiscal year 2015 was the 1st year of implementation, therefore only three years are shown.

87
City of Perris, California Schedule of Contributions
CalPERS Pension Plan Last Ten Years*
As of June 30, 2017
Contractually Contributions in Required Relation to the Contribution Actuarially Contributions as a
Fiscal (Actuarially Determined Contribution Percentage of Year Determined) Contribution Deficiency (Excess) Covered Payroll Covered Payroll
2015 $ 595,585 $ (595,585) $ 0 $ 4,990,311 11.93%
2016 $ 807,195 $ (807,195) $ 0 $ 5,409,554 14.92%
2017 $ 883,205 $ (883,205) $ 0 $ 5,611,052 15.74%
*- Fiscal year 2015 was the 1st year of implementation, therefore only three years are shown.
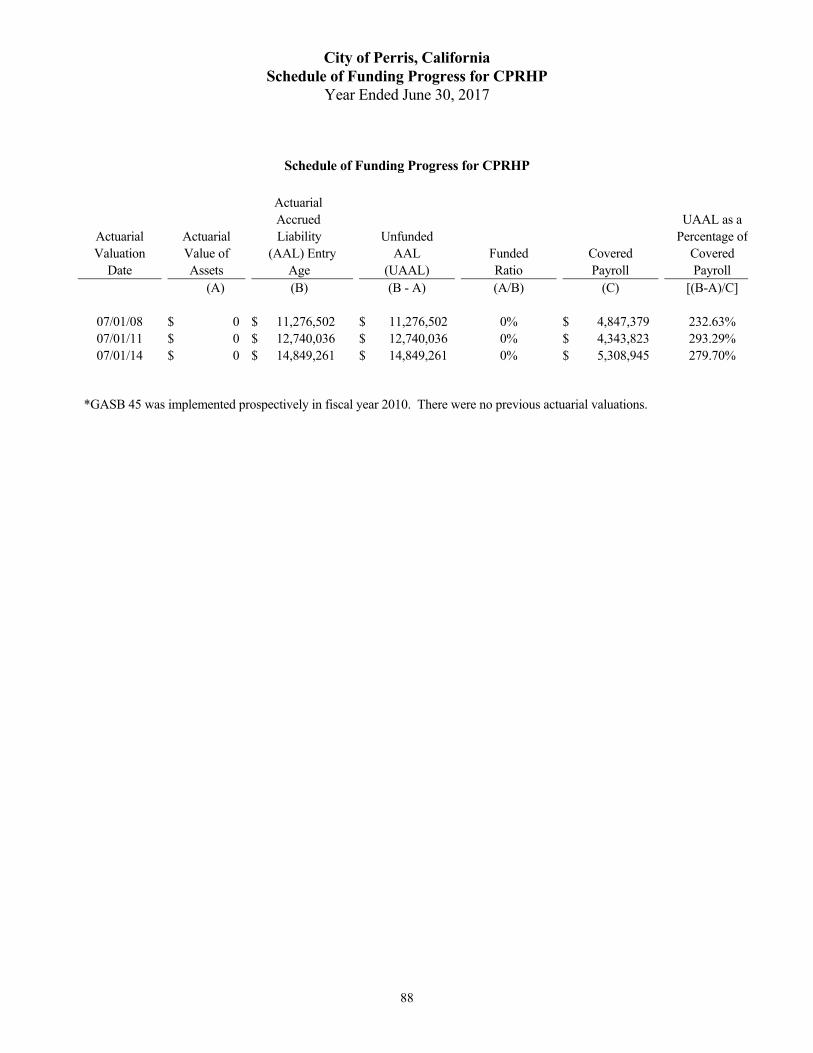
City of Perris, California Schedule of Funding Progress for CPRHP
Year Ended June 30, 2017
88
Schedule of Funding Progress for CPRHP
Actuarial
Accrued UAAL as aActuarial Actuarial Liability Unfunded Percentage ofValuation Value of (AAL) Entry AAL Funded Covered Covered
Date Assets Age (UAAL) Ratio Payroll Payroll (A) (B) (B - A) (A/B) (C) [(B-A)/C]
07/01/08 $ 0 $ 11,276,502 $ 11,276,502 0% $ 4,847,379 232.63% 07/01/11 $ 0 $ 12,740,036 $ 12,740,036 0% $ 4,343,823 293.29% 07/01/14 $ 0 $ 14,849,261 $ 14,849,261 0% $ 5,308,945 279.70%
*GASB 45 was implemented prospectively in fiscal year 2010. There were no previous actuarial valuations.
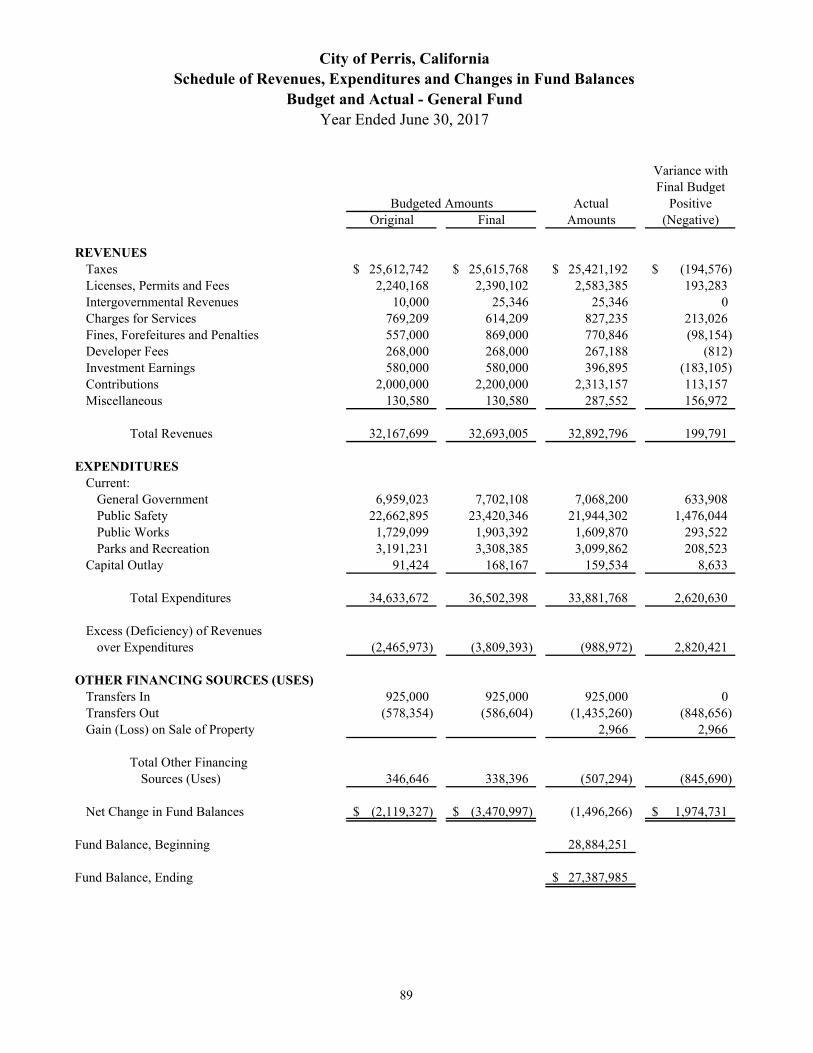
Variance withFinal Budget
Actual PositiveOriginal Final Amounts (Negative)
REVENUESTaxes 25,612,742$ 25,615,768$ 25,421,192$ (194,576)$ Licenses, Permits and Fees 2,240,168 2,390,102 2,583,385 193,283Intergovernmental Revenues 10,000 25,346 25,346 0Charges for Services 769,209 614,209 827,235 213,026Fines, Forefeitures and Penalties 557,000 869,000 770,846 (98,154)Developer Fees 268,000 268,000 267,188 (812)Investment Earnings 580,000 580,000 396,895 (183,105)Contributions 2,000,000 2,200,000 2,313,157 113,157Miscellaneous 130,580 130,580 287,552 156,972
Total Revenues 32,167,699 32,693,005 32,892,796 199,791
EXPENDITURESCurrent:
General Government 6,959,023 7,702,108 7,068,200 633,908Public Safety 22,662,895 23,420,346 21,944,302 1,476,044Public Works 1,729,099 1,903,392 1,609,870 293,522Parks and Recreation 3,191,231 3,308,385 3,099,862 208,523
Capital Outlay 91,424 168,167 159,534 8,633
Total Expenditures 34,633,672 36,502,398 33,881,768 2,620,630
Excess (Deficiency) of Revenuesover Expenditures (2,465,973) (3,809,393) (988,972) 2,820,421
OTHER FINANCING SOURCES (USES)Transfers In 925,000 925,000 925,000 0Transfers Out (578,354) (586,604) (1,435,260) (848,656)Gain (Loss) on Sale of Property 2,966 2,966
Total Other FinancingSources (Uses) 346,646 338,396 (507,294) (845,690)
Net Change in Fund Balances (2,119,327)$ (3,470,997)$ (1,496,266) 1,974,731$
Fund Balance, Beginning 28,884,251
Fund Balance, Ending 27,387,985$
Budgeted Amounts
City of Perris, CaliforniaSchedule of Revenues, Expenditures and Changes in Fund Balances
Budget and Actual - General FundYear Ended June 30, 2017
89
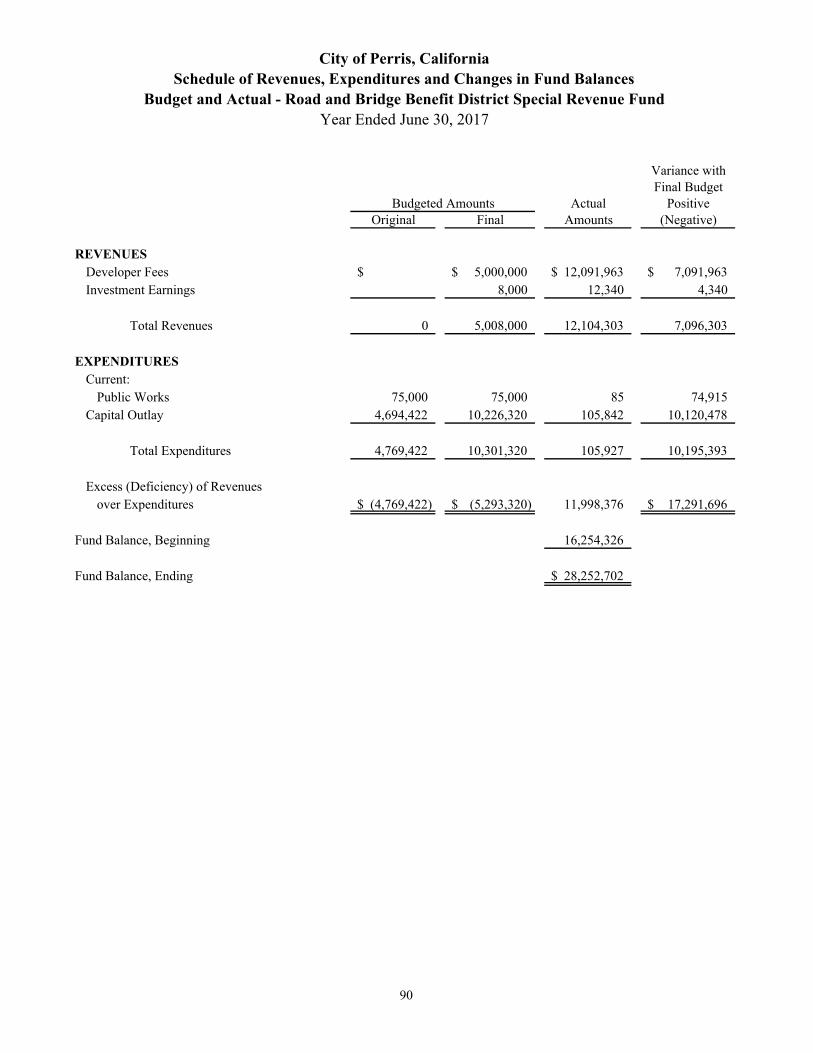
Variance withFinal Budget
Actual PositiveOriginal Final Amounts (Negative)
REVENUESDeveloper Fees $ 5,000,000$ 12,091,963$ 7,091,963$ Investment Earnings 8,000 12,340 4,340
Total Revenues 0 5,008,000 12,104,303 7,096,303
EXPENDITURESCurrent:
Public Works 75,000 75,000 85 74,915Capital Outlay 4,694,422 10,226,320 105,842 10,120,478
Total Expenditures 4,769,422 10,301,320 105,927 10,195,393
Excess (Deficiency) of Revenues over Expenditures (4,769,422)$ (5,293,320)$ 11,998,376 17,291,696$
Fund Balance, Beginning 16,254,326
Fund Balance, Ending 28,252,702$
Budgeted Amounts
City of Perris, CaliforniaSchedule of Revenues, Expenditures and Changes in Fund Balances
Budget and Actual - Road and Bridge Benefit District Special Revenue FundYear Ended June 30, 2017
90

City of Perris, California Notes to Required Supplementary Information
Year Ended June 30, 2017
91
1. BUDGETARY DATA Revenues and expenditures accounted for in the governmental funds are controlled by a formal integrated budgetary
accounting system in accordance with various legal requirements which govern the City's operations. Budgets have been adopted on a basis consistent with accounting principles generally accepted in the United States of
America (GAAP) for nearly all governmental funds. Budgetary control is exercised at the departmental level. Accordingly, department heads are authorized to make transfers
between budgeted line items within their respective departments. Interdepartmental transfers within funds require City Manager authorization (without approval by the City Council); all other changes to the budget must be authorized by the City Council.
SUPPLEMENTARY SCHEDULES


NON-MAJOR GOVERNMENTAL FUNDS
Special Revenue Funds:
AQMD Air Pollution Program - is used to account for AB2766 Subvention revenues and expenditures related to the reduction of vehicular emissions according to South Coast Air Quality Management District guidelines. Traffic Safety - is used to account for monies received under federal and state programs to enforce traffic safety laws. City-wide Lighting District - is used to account for funds received from assessment fees thru property tax collections from individual property owners and the expenditures for the lighting, maintenance and improvements of the City. Lighting District No. 84-1 - is used to account for funds received from assessment fees thru property tax collections from individual property owners and the expenditures for lighting maintenance and improvements. Landscape Maintenance District - is used to account for funds received from assessment fees thru property tax collections from individual property owners and the expenditures for the maintenance and new landscape improvements. Flood Control Maintenance District - is used to account for funds received from assessment fees thru property tax collections from individual property owners and the expenditures for flood control maintenance and improvements. Gas Tax - is used to account for the revenues and expenditures received from the State of California under the Street and Highway Code. The allocations must be spent for street maintenance and construction and a limited amount for engineering. Proposition “A” - is used to account for the revenues and expenditures received for the portion of the half-cent County-wide sales surtax levied to fund transportation improvements to local streets. CDBG Entitlement - is used to account for federal grant monies received directly from the Department of Housing and Urban Development State Grants - is used to account for monies received for miscellaneous state grants and expenditures. Federal Grants - is used to account for monies received for miscellaneous federal grants and expenditures. Development Fees - is used to account for funds received to mitigate the impact of new development on the City's infrastructure. HUD NSP-3 - is used to account for the receipt of intergovernmental funds to stabilize and revitalize areas within the community. HOME Grant Program - is used to account for the receipts of intergovernmental funds to provide affordable housing for low income individuals. Local Health Grant - is used to account for the revenues received from the County of Riverside, Department of Public Health, to provide nutrition education services.
Capital Project Funds:
Construction - is used to account for miscellaneous construction and rehabilitation projects. Railway Depot Restoration - is used to account for the revenues and expenditures for the restoration of the historic Santa Fe Depot in downtown Perris, including a seismic retrofit, refurbishment of the roof, and other structural, mechanical, electrical, and aesthetic improvements. Community Facilities District 06-2 - is used to account for the capital projects for the 2006-2 Monument Park Estates, 2015 Special Tax Bonds. Community Facilities District 05-4 - is used to account for the capital projects for the 2005-4 Stratford Ranch, 2015 Special Tax Bonds, Series A. Community Facilities District 14-1 - is used to account for the capital projects for the 2014-1 Avelina, 2017 Special Tax Bonds.

This page intentionally left blank

AQMD Air City-wide LightingPollution Traffic Lighting District No.Program Safety District 84-1
ASSETSCash and Investments 257,494$ 1,804,450$ 1,670,025$ 1,375,050$ Cash and Investments with Fiscal AgentReceivables:
Accounts Interest 645 4,161 3,859 3,110 Taxes 796 13,998 16,614 GrantsLoans
Due from Other FundsDue from Other Governments
Total Assets 258,139$ 1,809,407$ 1,687,882$ 1,394,774$
LIABILITIES Accounts Payable and Accrued Liabilities $ 121,409$ 11,978$ 120,526$ Due to Other Funds Advances from Other FundsUnearned Revenue
Total Liabilities 0 121,409 11,978 120,526
DEFERRED INFLOWS OF RESOURCESUnavailable Revenue - Special Assessments 4,819 66,615 Unavailable Revenue - Interest 317 2,047 1,899 1,530 Unavailable Revenue - Intergovernmental
Total Deferred Inflows of Resources 317 2,047 6,718 68,145
FUND BALANCESRestricted 257,822 1,685,951 1,669,186 1,206,103Unassigned
Total Fund Balances 257,822 1,685,951 1,669,186 1,206,103
Total Liabilities, Deferred Inflows ofResources and Fund Balances 258,139$ 1,809,407$ 1,687,882$ 1,394,774$
Special Revenue
City of Perris, CaliforniaCombining Balance Sheet
Non-major Governmental FundsJune 30, 2017
92

Landscape Flood ControlMaintenance Maintenance Gas Proposition CDBG
District District Tax "A" Entitlement
4,128,886$ 7,711,502$ 5,685,490$ 4,766,404$ $
9,161 17,713 12,952 10,942
37,123 23,513 286,539
131,611
4,175,170$ 7,752,728$ 5,698,442$ 5,063,885$ 131,611$
250,869$ 159,141$ 21,407$ 74,741$ 166,736$
114,974
250,869 159,141 21,407 74,741 281,710
19,278 13,724 55,671 4,507 8,715 6,372 5,384
45,511
23,785 22,439 6,372 61,055 45,511
3,900,516 7,571,148 5,670,663 4,928,089(195,610)
3,900,516 7,571,148 5,670,663 4,928,089 (195,610)
4,175,170$ 7,752,728$ 5,698,442$ 5,063,885$ 131,611$
Continued
Special Revenue
93

Federal Development HUDState Grants Grants Fees NSP-3
ASSETSCash and Investments $ $ 15,118,457$ 233,451$ Cash and Investments with Fiscal AgentReceivables:
Accounts Interest 44 35,341 550 Taxes Grants 176,781 Loans
Due from Other Funds 83,195 Due from Other Governments 33,059
Total Assets 33,103$ 176,781$ 15,236,993$ 234,001$
LIABILITIESAccounts Payable and Accrued Liabilities 276,395$ 12,328$ 124,219$ $ Due to Other Funds 130,190 Advances from Other Funds 321,828 84,066 Unearned Revenue 4,279
Total Liabilities 602,502 226,584 124,219 0
DEFERRED INFLOWS OF RESOURCESUnavailable Revenue - Special AssessmentsUnavailable Revenue - Interest 17,388 271Unavailable Revenue - Intergovernmental 176,781
Total Deferred Inflows of Resources 0 176,781 17,388 271
FUND BALANCESRestricted 15,095,386 233,730Unassigned (569,399) (226,584)
Total Fund Balances (569,399) (226,584) 15,095,386 233,730
Total Liabilities, Deferred Inflows ofResources and Fund Balances 33,103$ 176,781$ 15,236,993$ 234,001$
Special Revenue
City of Perris, CaliforniaCombining Balance Sheet - Continued
Non-major Governmental FundsJune 30, 2017
94
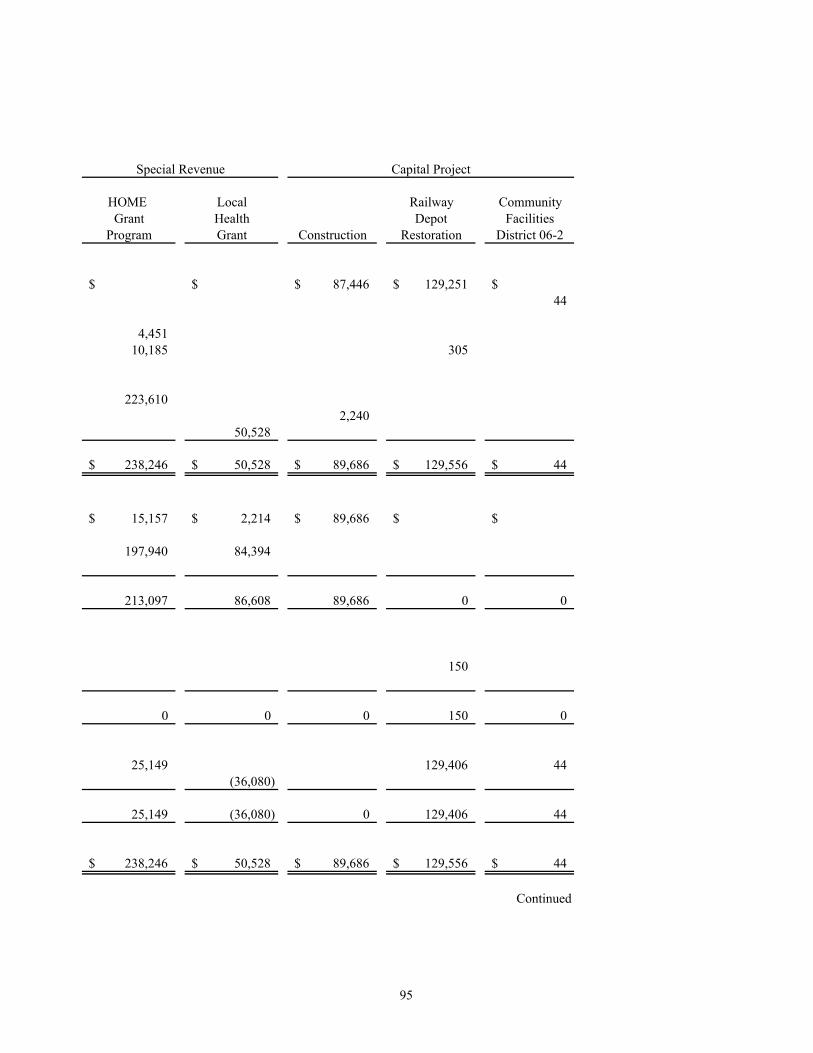
HOME Local Railway CommunityGrant Health Depot Facilities
Program Grant Construction Restoration District 06-2
$ $ 87,446$ 129,251$ $44
4,451 10,185 305
223,610 2,240
50,528
238,246$ 50,528$ 89,686$ 129,556$ 44$
15,157$ 2,214$ 89,686$ $ $
197,940 84,394
213,097 86,608 89,686 0 0
150
0 0 0 150 0
25,149 129,406 44 (36,080)
25,149 (36,080) 0 129,406 44
238,246$ 50,528$ 89,686$ 129,556$ 44$
Continued
Capital ProjectSpecial Revenue
95
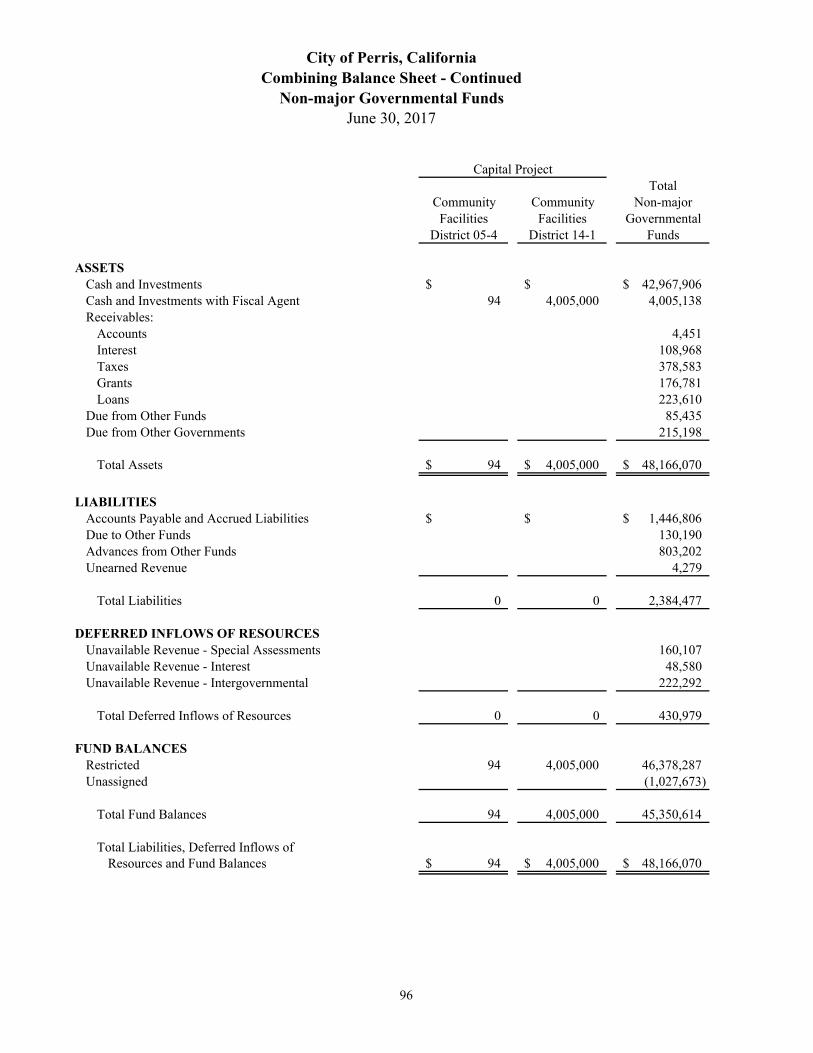
TotalCommunity Community Non-major
Facilities Facilities GovernmentalDistrict 05-4 District 14-1 Funds
ASSETSCash and Investments $ $ 42,967,906$ Cash and Investments with Fiscal Agent 94 4,005,000 4,005,138 Receivables:
Accounts 4,451 Interest 108,968 Taxes 378,583 Grants 176,781 Loans 223,610
Due from Other Funds 85,435 Due from Other Governments 215,198
Total Assets 94$ 4,005,000$ 48,166,070$
LIABILITIESAccounts Payable and Accrued Liabilities $ $ 1,446,806$ Due to Other Funds 130,190 Advances from Other Funds 803,202 Unearned Revenue 4,279
Total Liabilities 0 0 2,384,477
DEFERRED INFLOWS OF RESOURCESUnavailable Revenue - Special Assessments 160,107 Unavailable Revenue - Interest 48,580 Unavailable Revenue - Intergovernmental 222,292
Total Deferred Inflows of Resources 0 0 430,979
FUND BALANCESRestricted 94 4,005,000 46,378,287 Unassigned (1,027,673)
Total Fund Balances 94 4,005,000 45,350,614
Total Liabilities, Deferred Inflows ofResources and Fund Balances 94$ 4,005,000$ 48,166,070$
Capital Project
City of Perris, CaliforniaCombining Balance Sheet - Continued
Non-major Governmental FundsJune 30, 2017
96

This page intentionally left blank
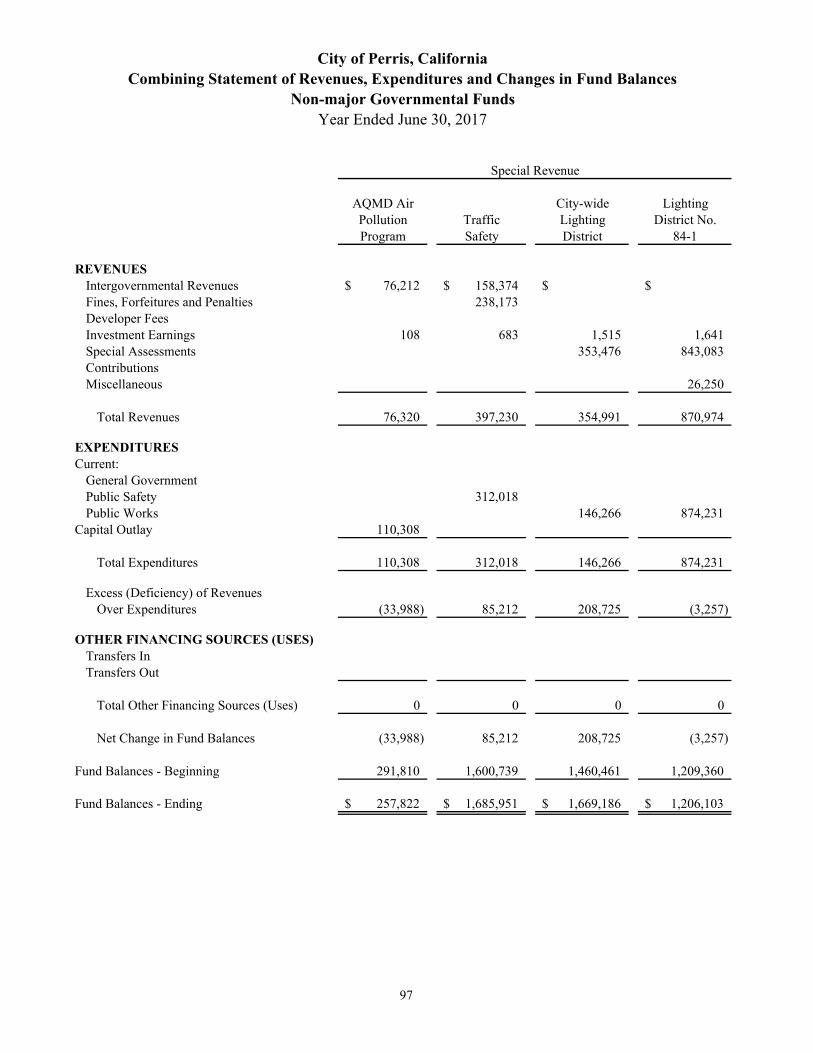
AQMD Air City-wide LightingPollution Traffic Lighting District No.Program Safety District 84-1
REVENUESIntergovernmental Revenues 76,212$ 158,374$ $ $ Fines, Forfeitures and Penalties 238,173 Developer Fees Investment Earnings 108 683 1,515 1,641 Special Assessments 353,476 843,083 ContributionsMiscellaneous 26,250
Total Revenues 76,320 397,230 354,991 870,974
EXPENDITURESCurrent:
General Government Public Safety 312,018 Public Works 146,266 874,231
Capital Outlay 110,308
Total Expenditures 110,308 312,018 146,266 874,231
Excess (Deficiency) of Revenues Over Expenditures (33,988) 85,212 208,725 (3,257)
OTHER FINANCING SOURCES (USES)Transfers In Transfers Out
Total Other Financing Sources (Uses) 0 0 0 0
Net Change in Fund Balances (33,988) 85,212 208,725 (3,257)
Fund Balances - Beginning 291,810 1,600,739 1,460,461 1,209,360
Fund Balances - Ending 257,822$ 1,685,951$ 1,669,186$ 1,206,103$
Special Revenue
City of Perris, CaliforniaCombining Statement of Revenues, Expenditures and Changes in Fund Balances
Non-major Governmental FundsYear Ended June 30, 2017
97

Landscape Flood ControlMaintenance Maintenance Gas Proposition CDBG
District District Tax "A" Entitlement
$ $ 1,399,949$ 1,457,121$ 769,629$
6,632 6,533 1,982 389 2,351,502 1,538,119
21,820 15,750
2,379,954 1,560,402 1,401,931 1,457,510 769,629
392,368
1,767,397 591,280 54,331 7,855 191,546 295,704 1,094,698 522,067
1,775,252 782,826 295,704 1,149,029 914,435
604,702 777,576 1,106,227 308,481 (144,806)
(925,000)
0 0 (925,000) 0 0
604,702 777,576 181,227 308,481 (144,806)
3,295,814 6,793,572 5,489,436 4,619,608 (50,804)
3,900,516$ 7,571,148$ 5,670,663$ 4,928,089$ (195,610)$
Continued
Special Revenue
98
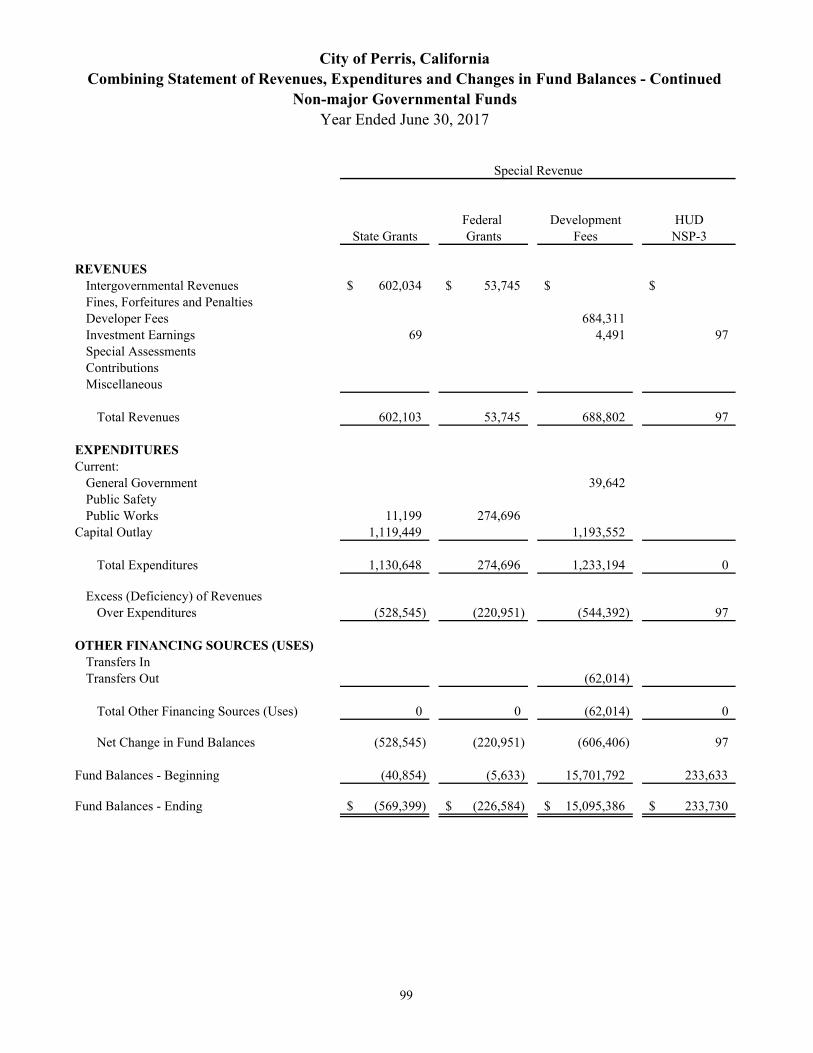
Federal Development HUDState Grants Grants Fees NSP-3
REVENUESIntergovernmental Revenues 602,034$ 53,745$ $ $ Fines, Forfeitures and Penalties Developer Fees 684,311 Investment Earnings 69 4,491 97 Special Assessments ContributionsMiscellaneous
Total Revenues 602,103 53,745 688,802 97
EXPENDITURESCurrent:
General Government 39,642 Public Safety Public Works 11,199 274,696
Capital Outlay 1,119,449 1,193,552
Total Expenditures 1,130,648 274,696 1,233,194 0
Excess (Deficiency) of Revenues Over Expenditures (528,545) (220,951) (544,392) 97
OTHER FINANCING SOURCES (USES)Transfers In Transfers Out (62,014)
Total Other Financing Sources (Uses) 0 0 (62,014) 0
Net Change in Fund Balances (528,545) (220,951) (606,406) 97
Fund Balances - Beginning (40,854) (5,633) 15,701,792 233,633
Fund Balances - Ending (569,399)$ (226,584)$ 15,095,386$ 233,730$
City of Perris, CaliforniaCombining Statement of Revenues, Expenditures and Changes in Fund Balances - Continued
Non-major Governmental FundsYear Ended June 30, 2017
Special Revenue
99
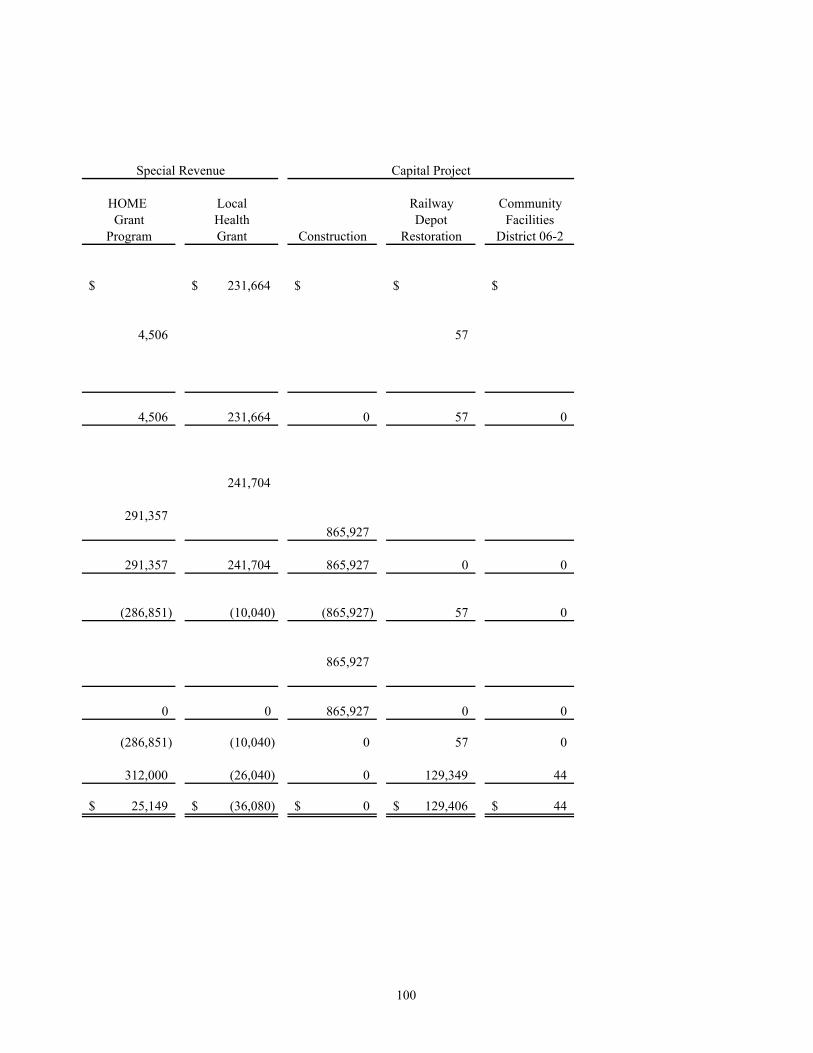
HOME Local Railway CommunityGrant Health Depot Facilities
Program Grant Construction Restoration District 06-2
$ 231,664$ $ $ $
4,506 57
4,506 231,664 0 57 0
241,704
291,357 865,927
291,357 241,704 865,927 0 0
(286,851) (10,040) (865,927) 57 0
865,927
0 0 865,927 0 0
(286,851) (10,040) 0 57 0
312,000 (26,040) 0 129,349 44
25,149$ (36,080)$ 0$ 129,406$ 44$
Capital ProjectSpecial Revenue
100

TotalCommunity Community Non-major
Facilities Facilities GovernmentalDistrict 05-4 District 14-1 Funds
REVENUESIntergovernmental Revenues $ $ 4,748,728$ Fines, Forfeitures and Penalties 238,173 Developer Fees 684,311 Investment Earnings 94 28,797 Special Assessments 5,086,180 Contributions 4,005,000 4,005,000 Miscellaneous 63,820
Total Revenues 94 4,005,000 14,855,009
EXPENDITURESCurrent:
General Government 281,346 Public Safety 704,386 Public Works 4,010,757
Capital Outlay 5,401,106
Total Expenditures 0 0 10,397,595
Excess (Deficiency) of Revenues Over Expenditures 94 4,005,000 4,457,414
OTHER FINANCING SOURCES (USES)Transfers In 865,927 Transfers Out (987,014)
Total Other Financing Sources (Uses) 0 0 (121,087)
Net Change in Fund Balances 94 4,005,000 4,336,327
Fund Balances - Beginning 0 0 41,014,287
Fund Balances - Ending 94$ 4,005,000$ 45,350,614$
City of Perris, CaliforniaCombining Statement of Revenues, Expenditures and Changes in Fund Balances - Continued
Non-major Governmental FundsYear Ended June 30, 2017
Capital Project
101

Variance withFinal Budget
Actual PositiveOriginal Final Amounts (Negative)
REVENUESInvestment Earnings 7,387,625$ 6,399,277$ 3,502,486$ (2,896,791)$ Contributions 16,500 5,000 7,523 2,523 Miscellaneous 25,000 51,511 51,511
Total Revenues 7,429,125 6,404,277 3,561,520 (2,842,757)
EXPENDITURESCurrent:
General Government 26,500 27,500 14,644 12,856Debt Service:
Principal Retirement 2,655,000 2,507,150 3,095,000 (587,850)Interest and Fiscal Charges 4,705,125 4,705,125 3,308,186 1,396,939
Total Expenditures 7,386,625 7,239,775 6,417,830 821,945
Excess (Deficiency) of Revenuesover Expenditures 42,500.00$ (835,498.00)$ (2,856,310) (2,020,812.00)$
Fund Balance, Beginning 71,329,664
Fund Balance, Ending 68,473,354$
Budgeted Amounts
City of Perris, California
Year Ended June 30, 2017Budget and Actual - Public Financing Authority Debt Service FundSchedule of Revenues, Expenditures and Changes in Fund Balances
102

Variance withFinal Budget
Actual PositiveOriginal Final Amounts (Negative)
REVENUESInvestment Earnings 4,905,089$ 4,905,089$ 3,197,265$ (1,707,824)$ Contributions 30,931 30,931
Total Revenues 4,905,089 4,905,089 3,228,196 (1,676,893)
EXPENDITURESCurrent:
General Government 25,000 25,000 23,750 1,250Debt Service:
Debt Issuance Costs 119,720 (119,720)Principal Retirement 2,385,000 2,385,000 4,060,000 (1,675,000)Interest and Fiscal Charges 2,495,089 2,495,089 3,694,179 (1,199,090)
Total Expenditures 4,905,089 4,905,089 7,897,649 (2,992,560)
Excess (Deficiency) of Revenuesover Expenditures 0 0 (4,669,453) (4,669,453)
OTHER FINANCING SOURCES (USES)Revenue Bonds Issued 4,580,000 4,580,000Discounts on Bonds Issued (103,925) (103,925)
Total Other Financing Sources (Uses) 0 0 4,476,075 4,476,075
Net Change in Fund Balances 0$ 0$ (193,378) (193,378)$
Fund Balance, Beginning 103,165,438
Fund Balance, Ending 102,972,060$
City of Perris, CaliforniaSchedule of Revenues, Expenditures and Changes in Fund Balances
Budget and Actual - Joint Powers Authority Debt Service FundYear Ended June 30, 2017
Budgeted Amounts
103
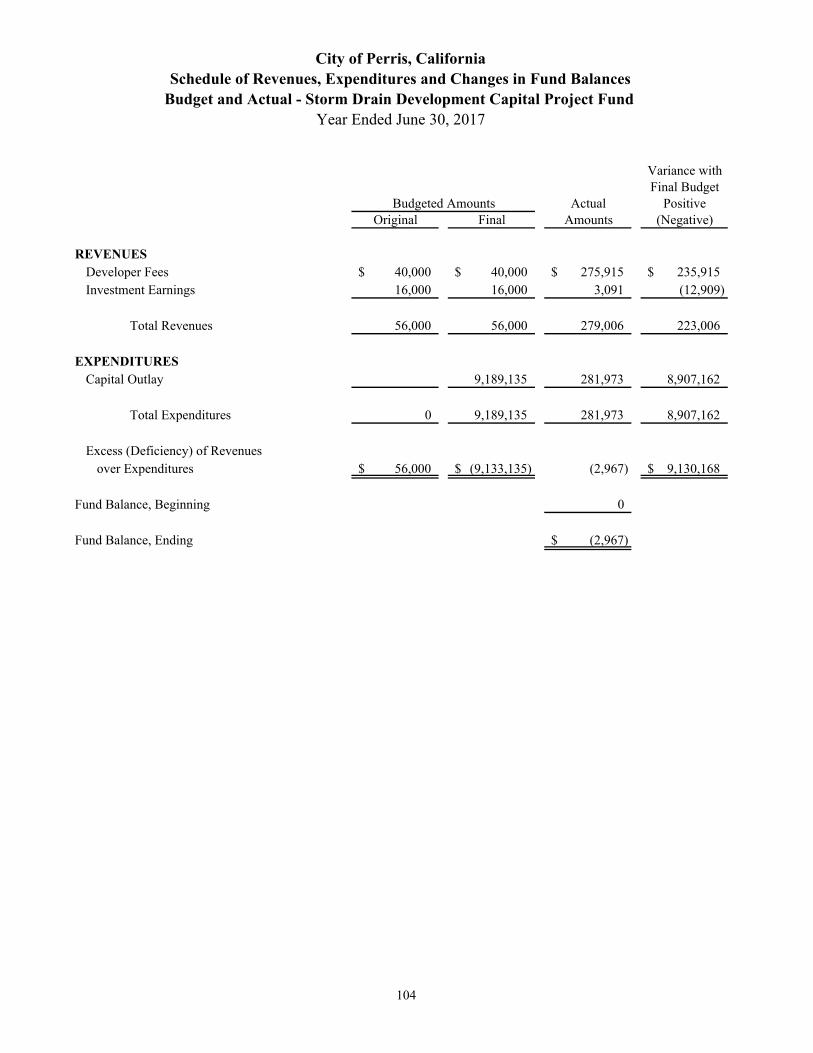
Variance withFinal Budget
Actual PositiveOriginal Final Amounts (Negative)
REVENUESDeveloper Fees 40,000$ 40,000$ 275,915$ 235,915$ Investment Earnings 16,000 16,000 3,091 (12,909)
Total Revenues 56,000 56,000 279,006 223,006
EXPENDITURESCapital Outlay 9,189,135 281,973 8,907,162
Total Expenditures 0 9,189,135 281,973 8,907,162
Excess (Deficiency) of Revenues over Expenditures 56,000$ (9,133,135)$ (2,967) 9,130,168$
Fund Balance, Beginning 0
Fund Balance, Ending (2,967)$
Budgeted Amounts
City of Perris, CaliforniaSchedule of Revenues, Expenditures and Changes in Fund Balances
Budget and Actual - Storm Drain Development Capital Project Fund Year Ended June 30, 2017
104
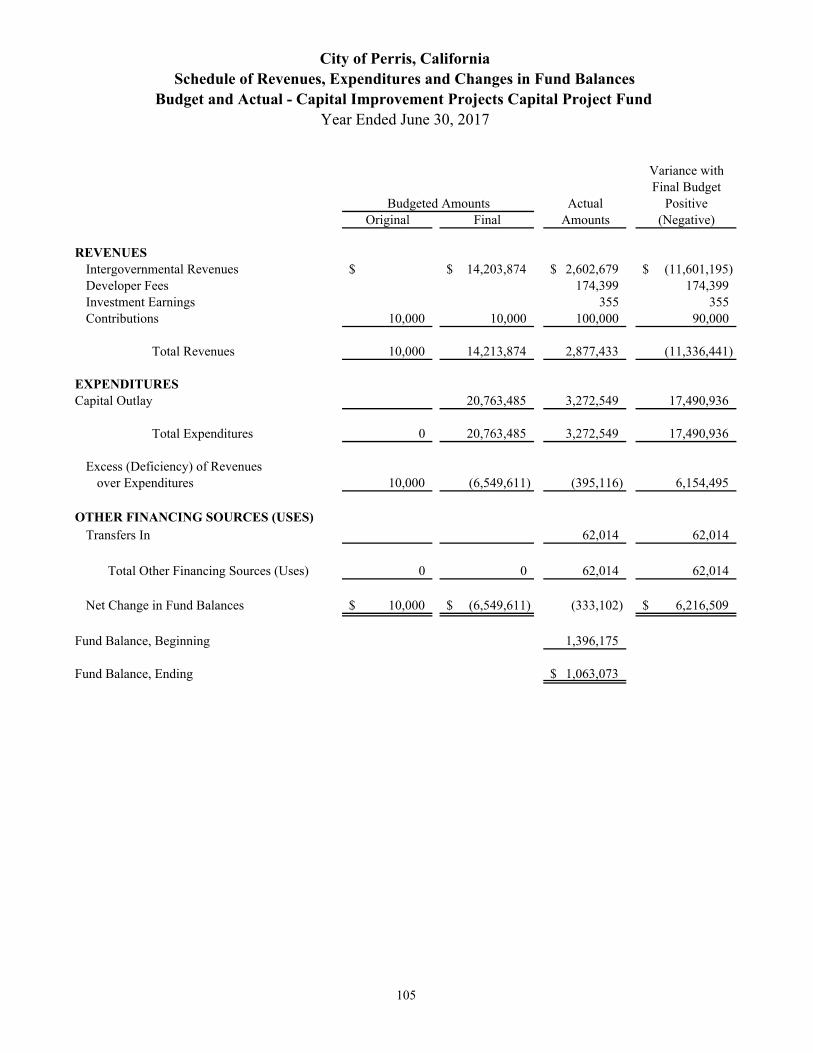
Variance withFinal Budget
Actual PositiveOriginal Final Amounts (Negative)
REVENUESIntergovernmental Revenues $ 14,203,874$ 2,602,679$ (11,601,195)$ Developer Fees 174,399 174,399 Investment Earnings 355 355 Contributions 10,000 10,000 100,000 90,000
Total Revenues 10,000 14,213,874 2,877,433 (11,336,441)
EXPENDITURESCapital Outlay 20,763,485 3,272,549 17,490,936
Total Expenditures 0 20,763,485 3,272,549 17,490,936
Excess (Deficiency) of Revenues over Expenditures 10,000 (6,549,611) (395,116) 6,154,495
OTHER FINANCING SOURCES (USES)Transfers In 62,014 62,014
Total Other Financing Sources (Uses) 0 0 62,014 62,014
Net Change in Fund Balances 10,000$ (6,549,611)$ (333,102) 6,216,509$
Fund Balance, Beginning 1,396,175
Fund Balance, Ending 1,063,073$
Budgeted Amounts
City of Perris, CaliforniaSchedule of Revenues, Expenditures and Changes in Fund Balances
Budget and Actual - Capital Improvement Projects Capital Project Fund Year Ended June 30, 2017
105
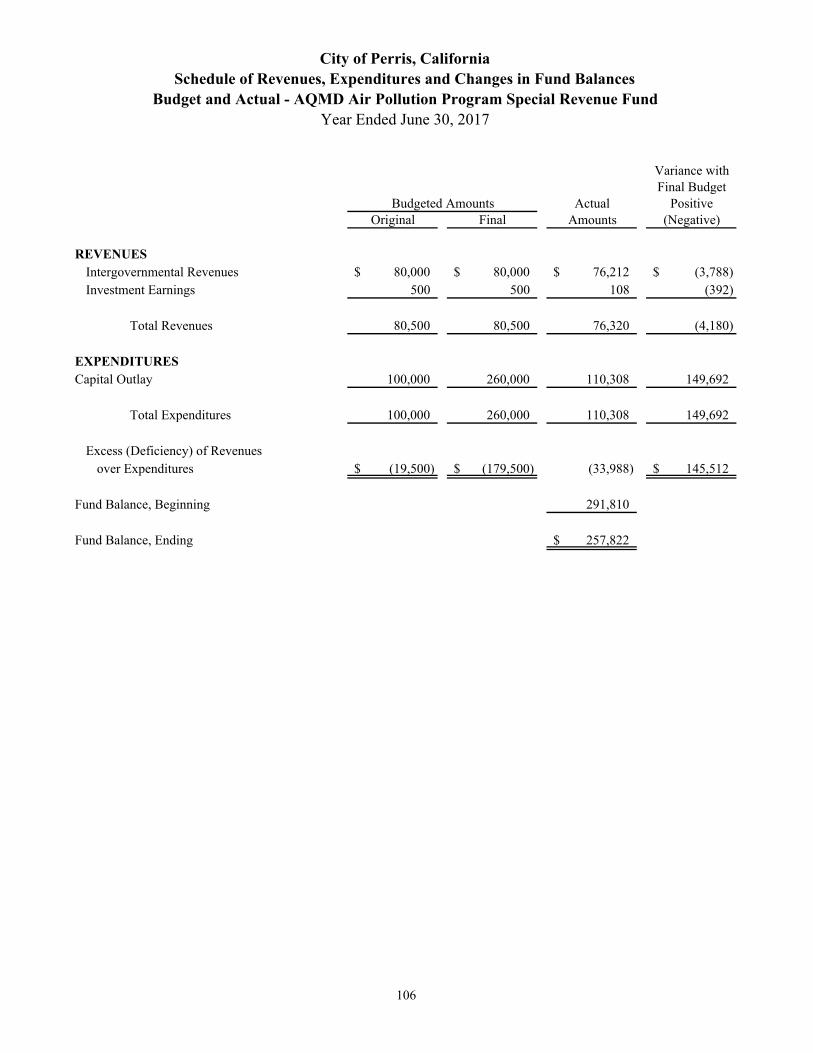
Variance withFinal Budget
Actual PositiveOriginal Final Amounts (Negative)
REVENUESIntergovernmental Revenues 80,000$ 80,000$ 76,212$ (3,788)$ Investment Earnings 500 500 108 (392)
Total Revenues 80,500 80,500 76,320 (4,180)
EXPENDITURESCapital Outlay 100,000 260,000 110,308 149,692
Total Expenditures 100,000 260,000 110,308 149,692
Excess (Deficiency) of Revenues over Expenditures (19,500)$ (179,500)$ (33,988) 145,512$
Fund Balance, Beginning 291,810
Fund Balance, Ending 257,822$
Budgeted Amounts
City of Perris, CaliforniaSchedule of Revenues, Expenditures and Changes in Fund Balances
Budget and Actual - AQMD Air Pollution Program Special Revenue FundYear Ended June 30, 2017
106
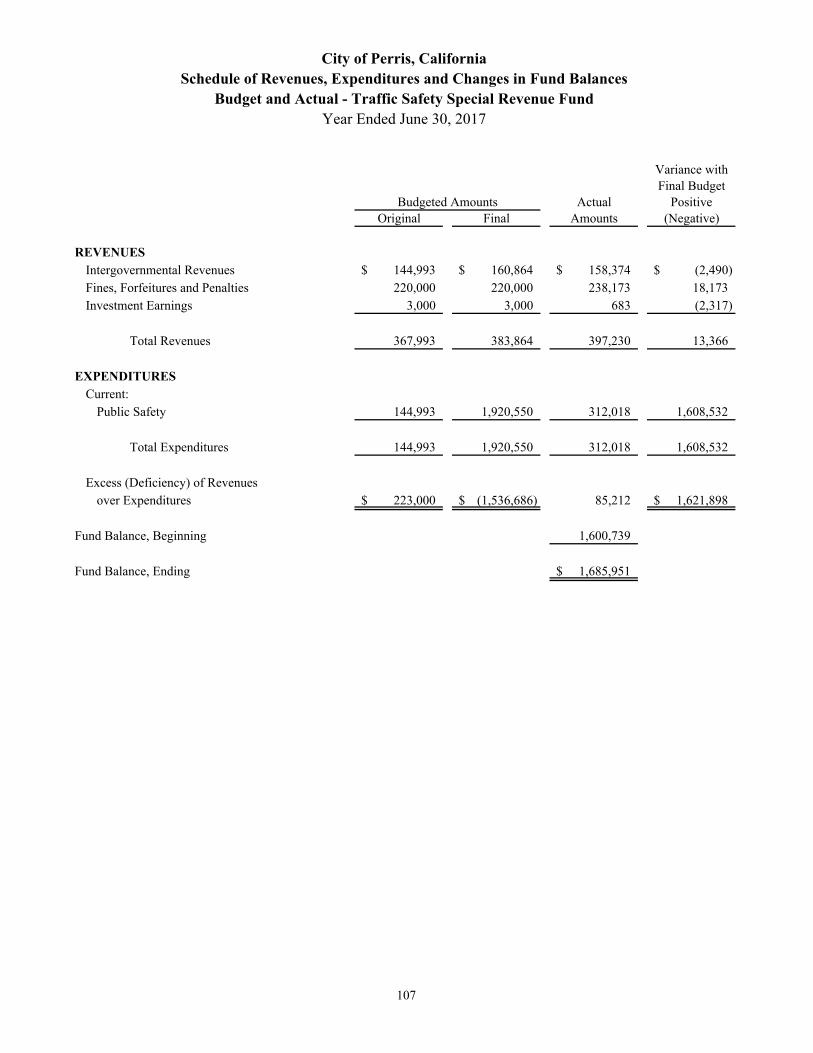
Variance withFinal Budget
Actual PositiveOriginal Final Amounts (Negative)
REVENUESIntergovernmental Revenues 144,993$ 160,864$ 158,374$ (2,490)$ Fines, Forfeitures and Penalties 220,000 220,000 238,173 18,173Investment Earnings 3,000 3,000 683 (2,317)
Total Revenues 367,993 383,864 397,230 13,366
EXPENDITURESCurrent:
Public Safety 144,993 1,920,550 312,018 1,608,532
Total Expenditures 144,993 1,920,550 312,018 1,608,532
Excess (Deficiency) of Revenues over Expenditures 223,000$ (1,536,686)$ 85,212 1,621,898$
Fund Balance, Beginning 1,600,739
Fund Balance, Ending 1,685,951$
Budgeted Amounts
City of Perris, CaliforniaSchedule of Revenues, Expenditures and Changes in Fund Balances
Budget and Actual - Traffic Safety Special Revenue FundYear Ended June 30, 2017
107
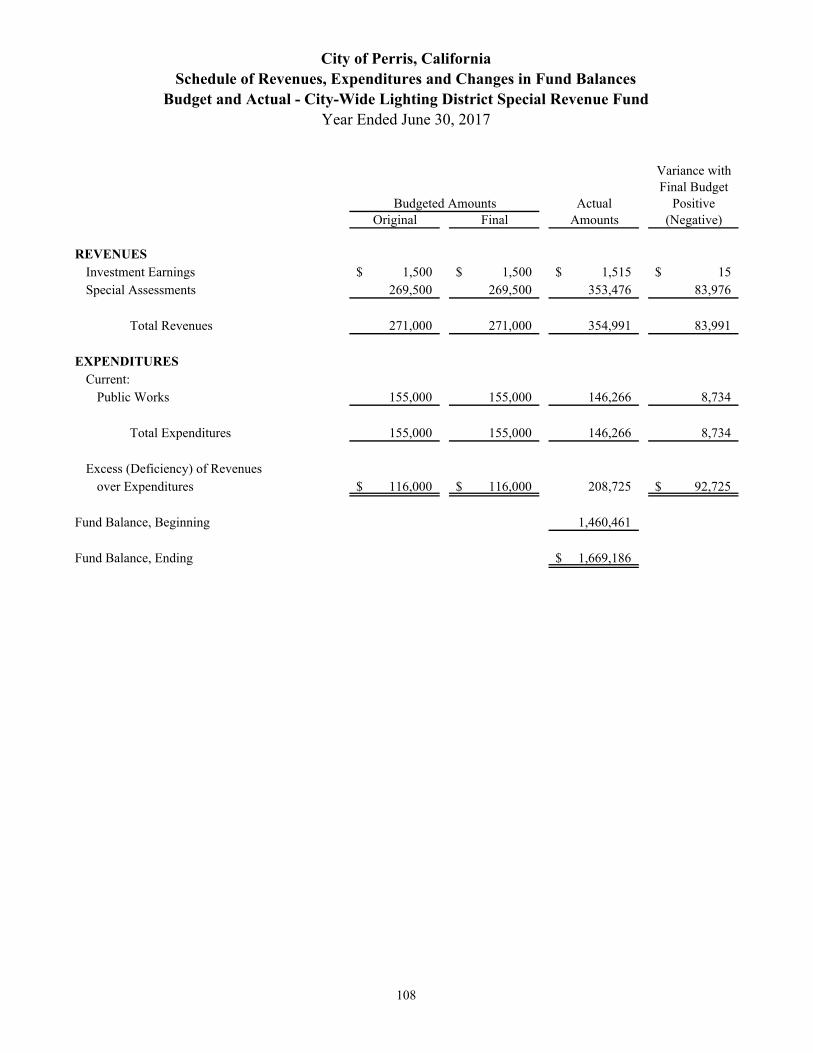
Variance withFinal Budget
Actual PositiveOriginal Final Amounts (Negative)
REVENUESInvestment Earnings 1,500$ 1,500$ 1,515$ 15$ Special Assessments 269,500 269,500 353,476 83,976
Total Revenues 271,000 271,000 354,991 83,991
EXPENDITURESCurrent:
Public Works 155,000 155,000 146,266 8,734
Total Expenditures 155,000 155,000 146,266 8,734
Excess (Deficiency) of Revenues over Expenditures 116,000$ 116,000$ 208,725 92,725$
Fund Balance, Beginning 1,460,461
Fund Balance, Ending 1,669,186$
Budgeted Amounts
City of Perris, CaliforniaSchedule of Revenues, Expenditures and Changes in Fund Balances
Budget and Actual - City-Wide Lighting District Special Revenue FundYear Ended June 30, 2017
108

Variance withFinal Budget
Actual PositiveOriginal Final Amounts (Negative)
REVENUESInvestment Earnings 3,000$ 3,000$ 1,641$ (1,359)$ Special Assessments 857,382 857,382 843,083 (14,299)Miscellaneous 20,000 20,000 26,250 6,250
Total Revenues 880,382 880,382 870,974 (9,408)
EXPENDITURESCurrent:
Public Works 820,393 902,736 874,231 28,505
Total Expenditures 820,393 902,736 874,231 28,505
Excess (Deficiency) of Revenues over Expenditures 59,989$ (22,354)$ (3,257) 19,097$
Fund Balance, Beginning 1,209,360
Fund Balance, Ending 1,206,103$
Budgeted Amounts
City of Perris, CaliforniaSchedule of Revenues, Expenditures and Changes in Fund Balances
Budget and Actual - Lighting District No. 84-1 Special Revenue FundYear Ended June 30, 2017
109
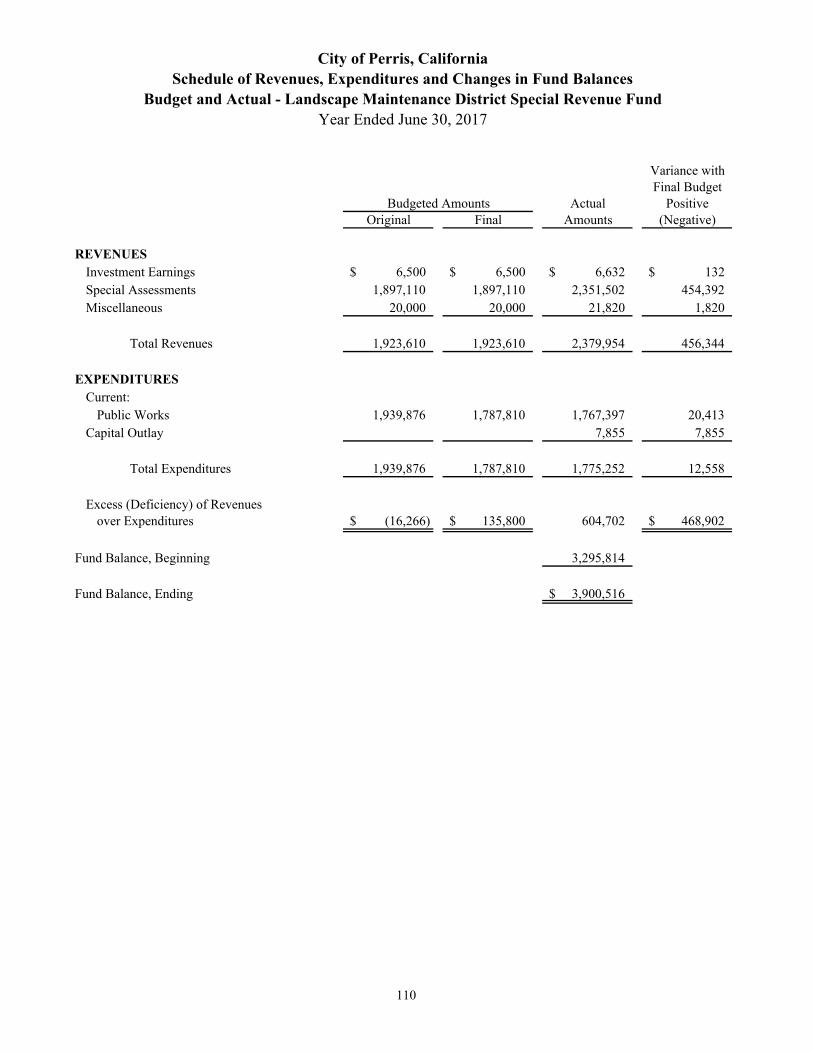
Variance withFinal Budget
Actual PositiveOriginal Final Amounts (Negative)
REVENUESInvestment Earnings 6,500$ 6,500$ 6,632$ 132$ Special Assessments 1,897,110 1,897,110 2,351,502 454,392Miscellaneous 20,000 20,000 21,820 1,820
Total Revenues 1,923,610 1,923,610 2,379,954 456,344
EXPENDITURESCurrent:
Public Works 1,939,876 1,787,810 1,767,397 20,413Capital Outlay 7,855 7,855
Total Expenditures 1,939,876 1,787,810 1,775,252 12,558
Excess (Deficiency) of Revenues over Expenditures (16,266)$ 135,800$ 604,702 468,902$
Fund Balance, Beginning 3,295,814
Fund Balance, Ending 3,900,516$
Budgeted Amounts
City of Perris, CaliforniaSchedule of Revenues, Expenditures and Changes in Fund Balances
Budget and Actual - Landscape Maintenance District Special Revenue FundYear Ended June 30, 2017
110
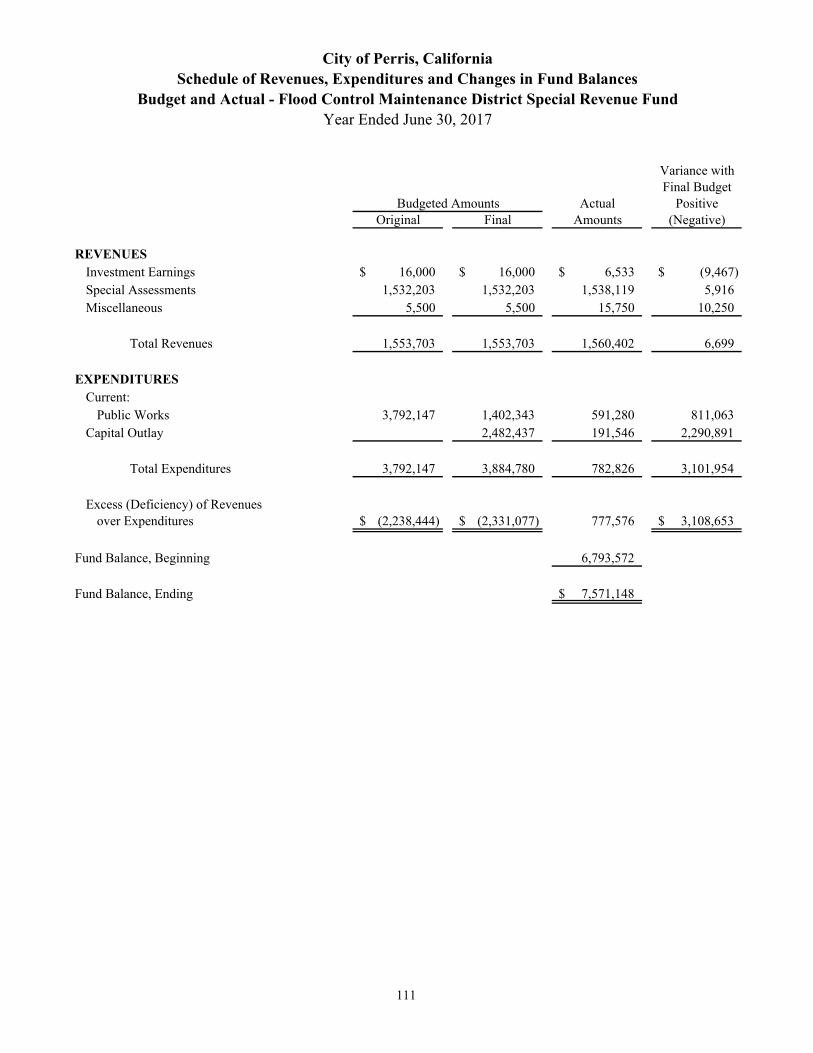
Variance withFinal Budget
Actual PositiveOriginal Final Amounts (Negative)
REVENUESInvestment Earnings 16,000$ 16,000$ 6,533$ (9,467)$ Special Assessments 1,532,203 1,532,203 1,538,119 5,916 Miscellaneous 5,500 5,500 15,750 10,250
Total Revenues 1,553,703 1,553,703 1,560,402 6,699
EXPENDITURESCurrent:
Public Works 3,792,147 1,402,343 591,280 811,063Capital Outlay 2,482,437 191,546 2,290,891
Total Expenditures 3,792,147 3,884,780 782,826 3,101,954
Excess (Deficiency) of Revenues over Expenditures (2,238,444)$ (2,331,077)$ 777,576 3,108,653$
Fund Balance, Beginning 6,793,572
Fund Balance, Ending 7,571,148$
Budgeted Amounts
City of Perris, CaliforniaSchedule of Revenues, Expenditures and Changes in Fund Balances
Budget and Actual - Flood Control Maintenance District Special Revenue FundYear Ended June 30, 2017
111
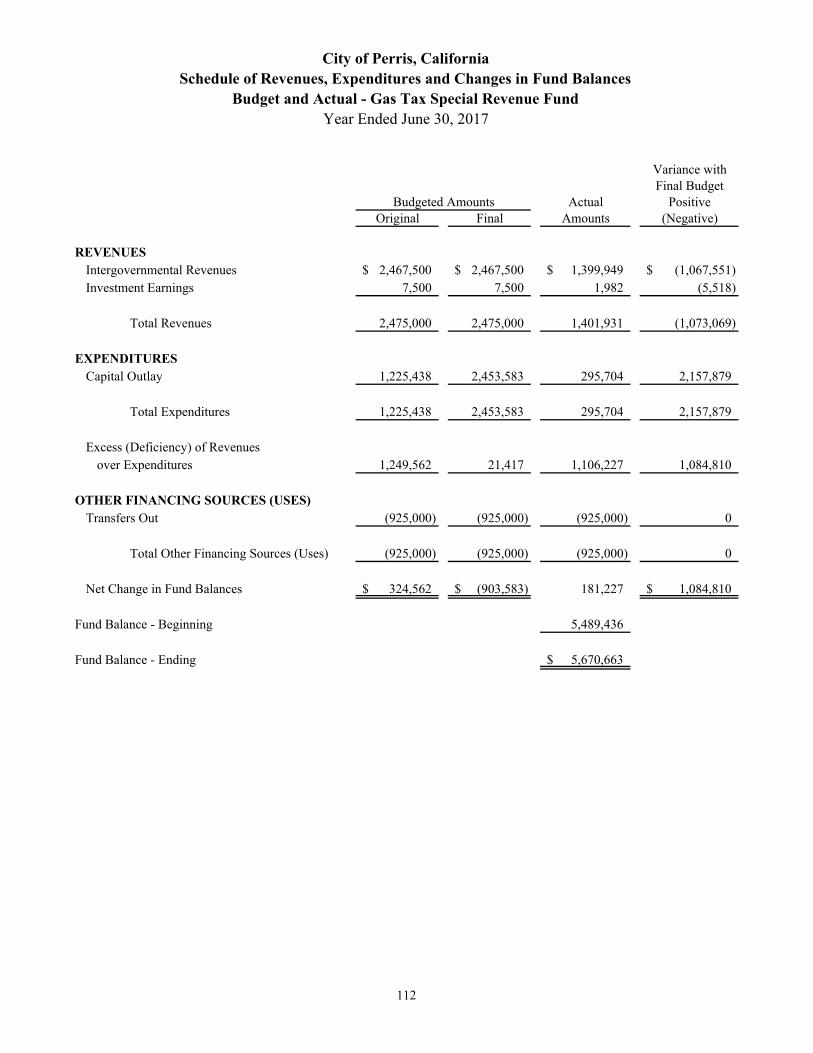
Variance withFinal Budget
Actual PositiveOriginal Final Amounts (Negative)
REVENUESIntergovernmental Revenues 2,467,500$ 2,467,500$ 1,399,949$ (1,067,551)$ Investment Earnings 7,500 7,500 1,982 (5,518)
Total Revenues 2,475,000 2,475,000 1,401,931 (1,073,069)
EXPENDITURES Capital Outlay 1,225,438 2,453,583 295,704 2,157,879
Total Expenditures 1,225,438 2,453,583 295,704 2,157,879
Excess (Deficiency) of Revenues over Expenditures 1,249,562 21,417 1,106,227 1,084,810
OTHER FINANCING SOURCES (USES)Transfers Out (925,000) (925,000) (925,000) 0
Total Other Financing Sources (Uses) (925,000) (925,000) (925,000) 0
Net Change in Fund Balances 324,562$ (903,583)$ 181,227 1,084,810$
Fund Balance - Beginning 5,489,436
Fund Balance - Ending 5,670,663$
Budgeted Amounts
City of Perris, CaliforniaSchedule of Revenues, Expenditures and Changes in Fund Balances
Budget and Actual - Gas Tax Special Revenue FundYear Ended June 30, 2017
112

Variance withFinal Budget
Actual PositiveOriginal Final Amounts (Negative)
REVENUESIntergovernmental Revenues 1,444,000$ 1,444,000$ 1,457,121$ 13,121$ Investment Earnings 5,000 5,000 389 (4,611)
Total Revenues 1,449,000 1,449,000 1,457,510 8,510
EXPENDITURESCurrent:
Public Works 54,331 54,331 Capital Outlay 900,000 4,676,592 1,094,698 3,581,894
Total Expenditures 900,000 4,676,592 1,149,029 3,636,225
Excess (Deficiency) of Revenues over Expenditures 549,000$ (3,227,592)$ 308,481 3,536,073$
Fund Balance - Beginning 4,619,608
Fund Balance - Ending 4,928,089$
Budgeted Amounts
City of Perris, CaliforniaSchedule of Revenues, Expenditures and Changes in Fund Balances
Budget and Actual - Proposition "A" Special Revenue FundYear Ended June 30, 2017
113

Variance withFinal Budget
Actual PositiveOriginal Final Amounts (Negative)
REVENUESIntergovernmental Revenues 245,195$ 844,622$ 769,629$ (74,993)$
Total Revenues 245,195 844,622 769,629 (74,993)
EXPENDITURESCurrent:
Public Safety 185,049 634,271 392,368 241,903Capital Outlay 1,869,954 1,869,954 522,067 1,347,887
Total Expenditures 2,055,003 2,504,225 914,435 1,589,790
Excess (Deficiency) of Revenues over Expenditures (1,809,808)$ (1,659,603)$ (144,806) 1,514,797$
Fund Balance, Beginning (50,804)
Fund Balance, Ending (195,610)$
Budgeted Amounts
City of Perris, CaliforniaSchedule of Revenues, Expenditures and Changes in Fund Balances
Budget and Actual - CDBG Entitlement Special Revenue FundYear Ended June 30, 2017
114
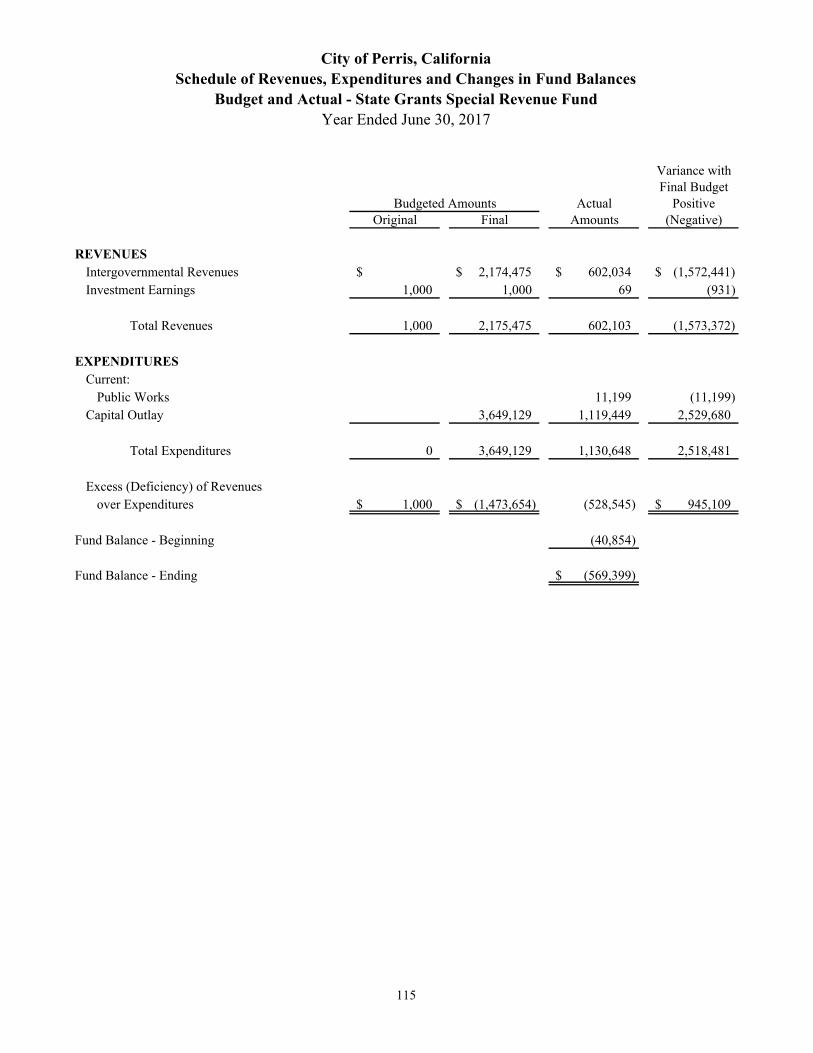
Variance withFinal Budget
Actual PositiveOriginal Final Amounts (Negative)
REVENUESIntergovernmental Revenues $ 2,174,475$ 602,034$ (1,572,441)$ Investment Earnings 1,000 1,000 69 (931)
Total Revenues 1,000 2,175,475 602,103 (1,573,372)
EXPENDITURESCurrent:
Public Works 11,199 (11,199)Capital Outlay 3,649,129 1,119,449 2,529,680
Total Expenditures 0 3,649,129 1,130,648 2,518,481
Excess (Deficiency) of Revenues over Expenditures 1,000$ (1,473,654)$ (528,545) 945,109$
Fund Balance - Beginning (40,854)
Fund Balance - Ending (569,399)$
Budgeted Amounts
City of Perris, CaliforniaSchedule of Revenues, Expenditures and Changes in Fund Balances
Budget and Actual - State Grants Special Revenue FundYear Ended June 30, 2017
115
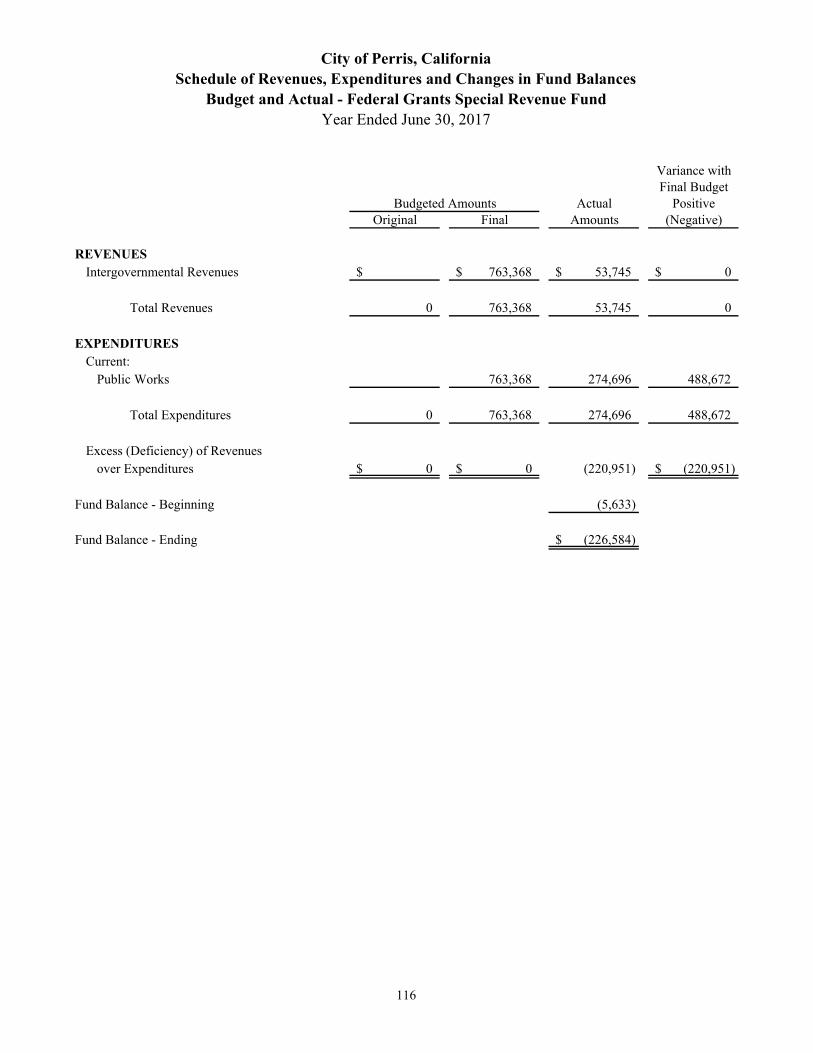
Variance withFinal Budget
Actual PositiveOriginal Final Amounts (Negative)
REVENUESIntergovernmental Revenues $ 763,368$ 53,745$ 0$
Total Revenues 0 763,368 53,745 0
EXPENDITURESCurrent:
Public Works 763,368 274,696 488,672
Total Expenditures 0 763,368 274,696 488,672
Excess (Deficiency) of Revenues over Expenditures 0$ 0$ (220,951) (220,951)$
Fund Balance - Beginning (5,633)
Fund Balance - Ending (226,584)$
City of Perris, CaliforniaSchedule of Revenues, Expenditures and Changes in Fund Balances
Budget and Actual - Federal Grants Special Revenue FundYear Ended June 30, 2017
Budgeted Amounts
116
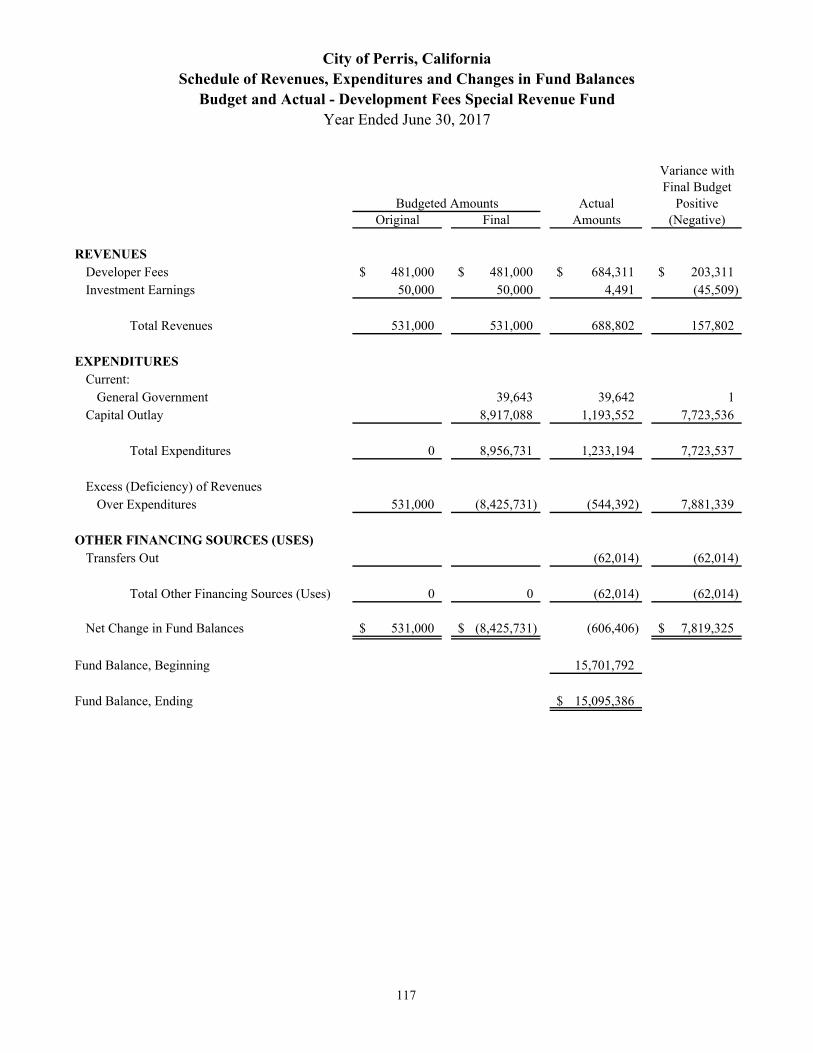
Variance withFinal Budget
Actual PositiveOriginal Final Amounts (Negative)
REVENUESDeveloper Fees 481,000$ 481,000$ 684,311$ 203,311$ Investment Earnings 50,000 50,000 4,491 (45,509)
Total Revenues 531,000 531,000 688,802 157,802
EXPENDITURESCurrent:
General Government 39,643 39,642 1Capital Outlay 8,917,088 1,193,552 7,723,536
Total Expenditures 0 8,956,731 1,233,194 7,723,537
Excess (Deficiency) of RevenuesOver Expenditures 531,000 (8,425,731) (544,392) 7,881,339
OTHER FINANCING SOURCES (USES)Transfers Out (62,014) (62,014)
Total Other Financing Sources (Uses) 0 0 (62,014) (62,014)
Net Change in Fund Balances 531,000$ (8,425,731)$ (606,406) 7,819,325$
Fund Balance, Beginning 15,701,792
Fund Balance, Ending 15,095,386$
Budgeted Amounts
City of Perris, CaliforniaSchedule of Revenues, Expenditures and Changes in Fund Balances
Budget and Actual - Development Fees Special Revenue FundYear Ended June 30, 2017
117
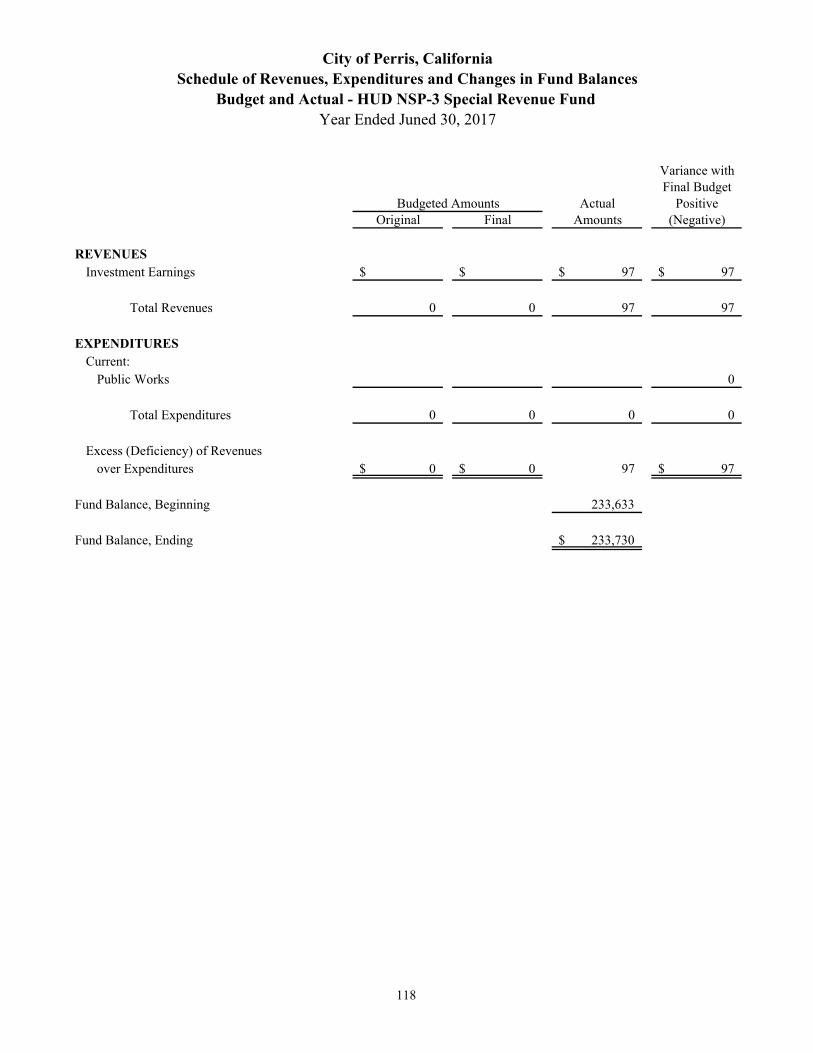
Variance withFinal Budget
Actual PositiveOriginal Final Amounts (Negative)
REVENUESInvestment Earnings $ $ 97$ 97$
Total Revenues 0 0 97 97
EXPENDITURESCurrent:
Public Works 0
Total Expenditures 0 0 0 0
Excess (Deficiency) of Revenuesover Expenditures 0$ 0$ 97 97$
Fund Balance, Beginning 233,633
Fund Balance, Ending 233,730$
Budgeted Amounts
City of Perris, CaliforniaSchedule of Revenues, Expenditures and Changes in Fund Balances
Budget and Actual - HUD NSP-3 Special Revenue Fund Year Ended Juned 30, 2017
118
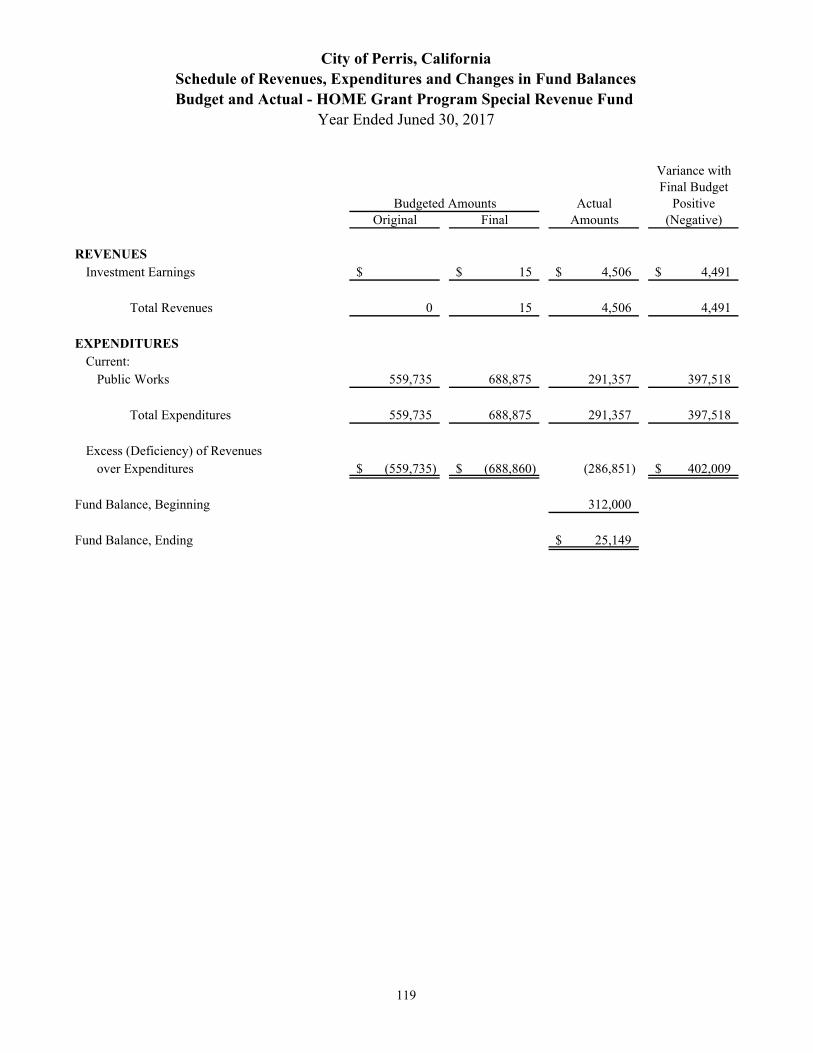
Variance withFinal Budget
Actual PositiveOriginal Final Amounts (Negative)
REVENUESInvestment Earnings $ 15$ 4,506$ 4,491$
Total Revenues 0 15 4,506 4,491
EXPENDITURESCurrent:
Public Works 559,735 688,875 291,357 397,518
Total Expenditures 559,735 688,875 291,357 397,518
Excess (Deficiency) of Revenuesover Expenditures (559,735)$ (688,860)$ (286,851) 402,009$
Fund Balance, Beginning 312,000
Fund Balance, Ending 25,149$
City of Perris, CaliforniaSchedule of Revenues, Expenditures and Changes in Fund BalancesBudget and Actual - HOME Grant Program Special Revenue Fund
Year Ended Juned 30, 2017
Budgeted Amounts
119
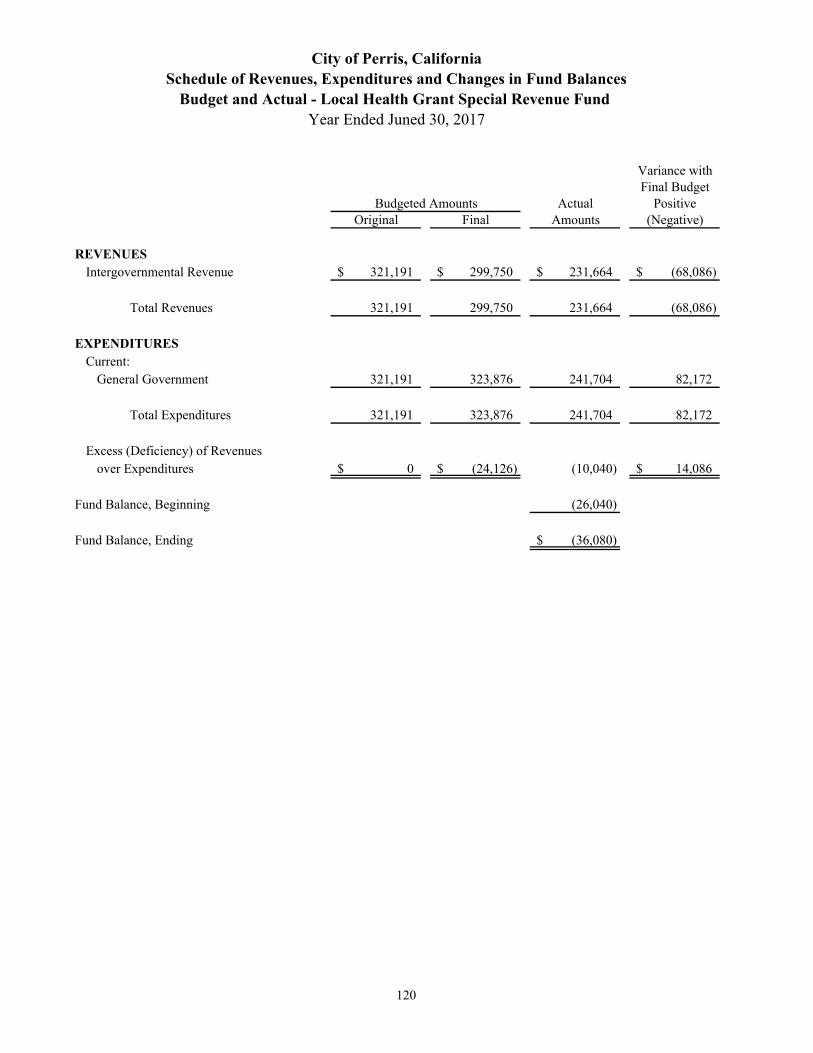
Variance withFinal Budget
Actual PositiveOriginal Final Amounts (Negative)
REVENUESIntergovernmental Revenue 321,191$ 299,750$ 231,664$ (68,086)$
Total Revenues 321,191 299,750 231,664 (68,086)
EXPENDITURESCurrent:
General Government 321,191 323,876 241,704 82,172
Total Expenditures 321,191 323,876 241,704 82,172
Excess (Deficiency) of Revenues over Expenditures 0$ (24,126)$ (10,040) 14,086$
Fund Balance, Beginning (26,040)
Fund Balance, Ending (36,080)$
City of Perris, CaliforniaSchedule of Revenues, Expenditures and Changes in Fund Balances
Budget and Actual - Local Health Grant Special Revenue Fund Year Ended Juned 30, 2017
Budgeted Amounts
120
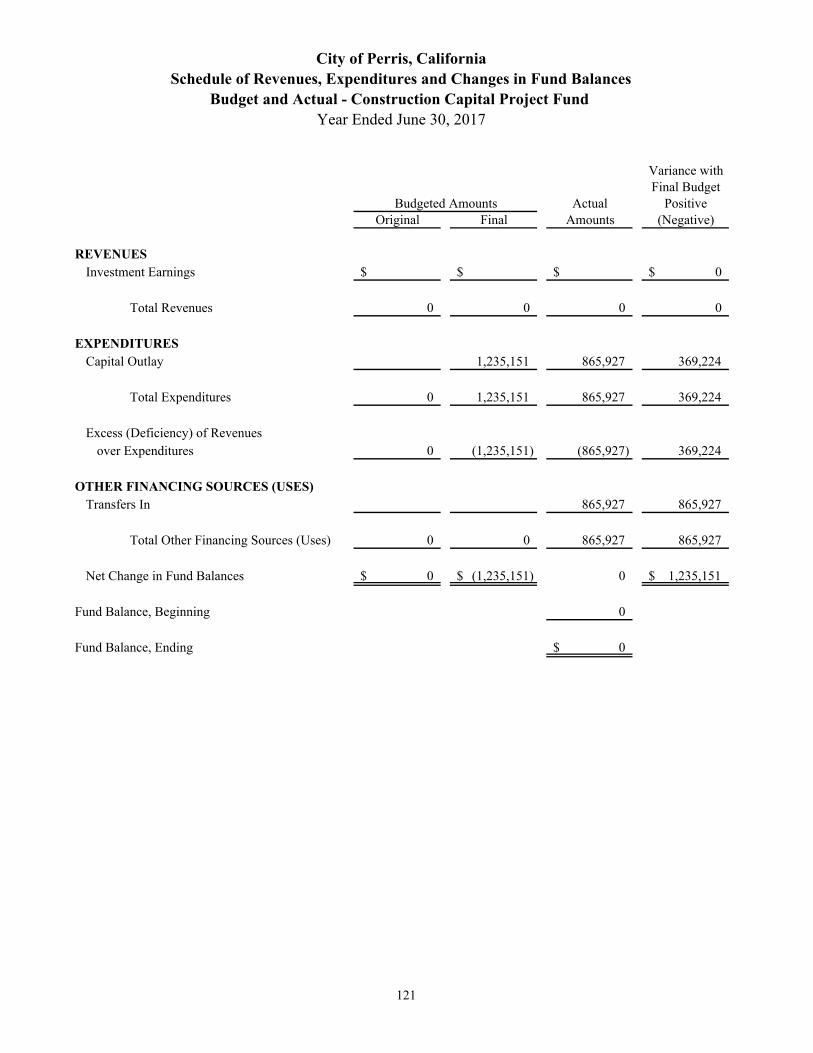
Variance withFinal Budget
Actual PositiveOriginal Final Amounts (Negative)
REVENUESInvestment Earnings $ $ $ 0$
Total Revenues 0 0 0 0
EXPENDITURESCapital Outlay 1,235,151 865,927 369,224
Total Expenditures 0 1,235,151 865,927 369,224
Excess (Deficiency) of Revenues over Expenditures 0 (1,235,151) (865,927) 369,224
OTHER FINANCING SOURCES (USES)Transfers In 865,927 865,927
Total Other Financing Sources (Uses) 0 0 865,927 865,927
Net Change in Fund Balances 0$ (1,235,151)$ 0 1,235,151$
Fund Balance, Beginning 0
Fund Balance, Ending 0$
Budgeted Amounts
City of Perris, CaliforniaSchedule of Revenues, Expenditures and Changes in Fund Balances
Budget and Actual - Construction Capital Project Fund Year Ended June 30, 2017
121
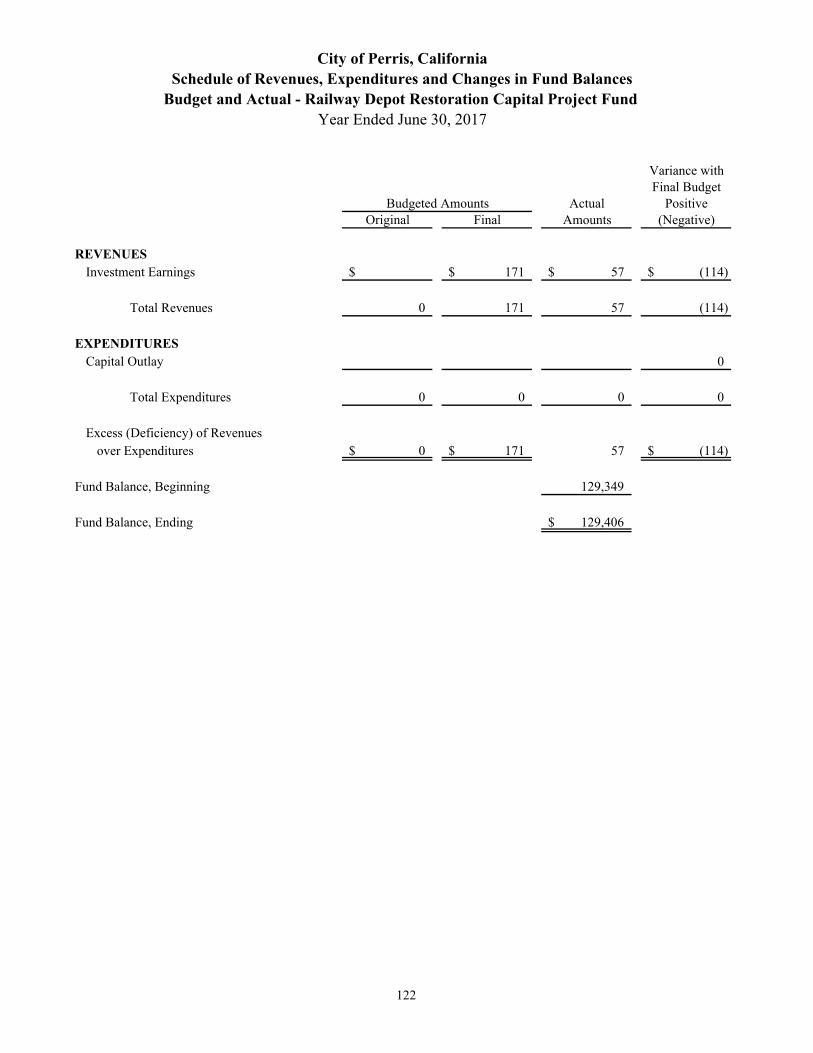
Variance withFinal Budget
Actual PositiveOriginal Final Amounts (Negative)
REVENUESInvestment Earnings $ 171$ 57$ (114)$
Total Revenues 0 171 57 (114)
EXPENDITURESCapital Outlay 0
Total Expenditures 0 0 0 0
Excess (Deficiency) of Revenues over Expenditures 0$ 171$ 57 (114)$
Fund Balance, Beginning 129,349
Fund Balance, Ending 129,406$
Budgeted Amounts
City of Perris, CaliforniaSchedule of Revenues, Expenditures and Changes in Fund Balances
Budget and Actual - Railway Depot Restoration Capital Project Fund Year Ended June 30, 2017
122
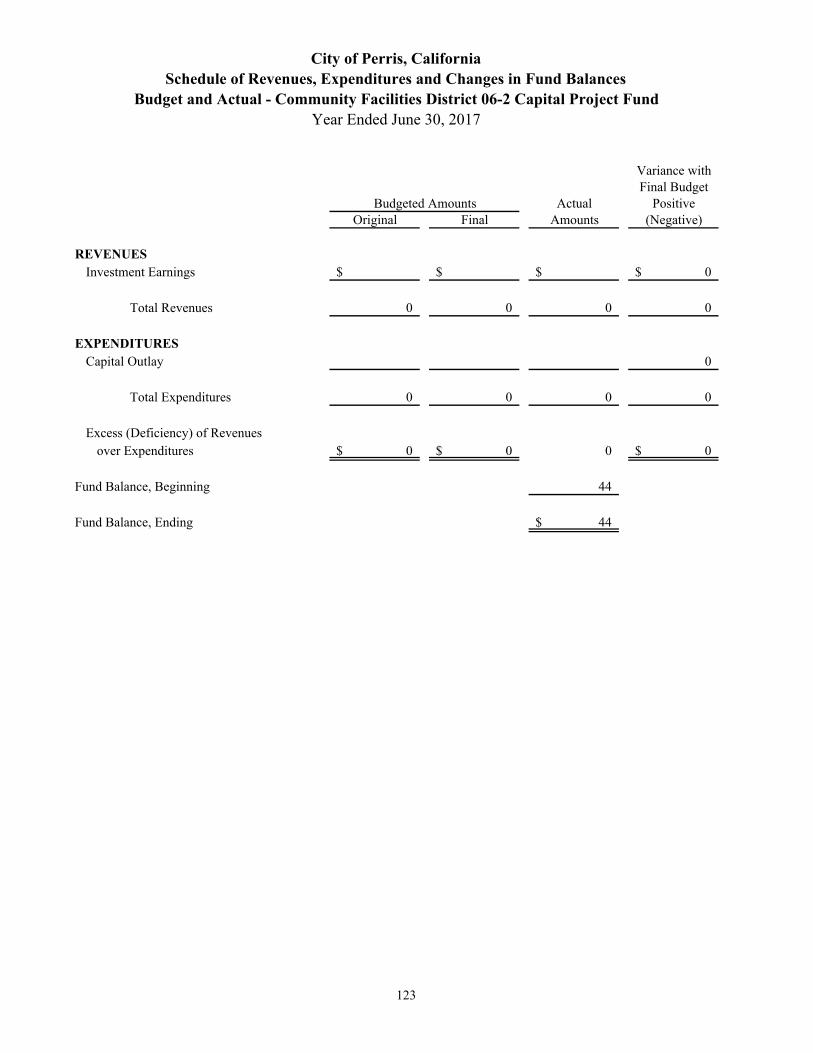
Variance withFinal Budget
Actual PositiveOriginal Final Amounts (Negative)
REVENUESInvestment Earnings $ $ $ 0$
Total Revenues 0 0 0 0
EXPENDITURESCapital Outlay 0
Total Expenditures 0 0 0 0
Excess (Deficiency) of Revenues over Expenditures 0$ 0$ 0 0$
Fund Balance, Beginning 44
Fund Balance, Ending 44$
City of Perris, CaliforniaSchedule of Revenues, Expenditures and Changes in Fund Balances
Budget and Actual - Community Facilities District 06-2 Capital Project FundYear Ended June 30, 2017
Budgeted Amounts
123

Variance withFinal Budget
Actual PositiveOriginal Final Amounts (Negative)
REVENUESInvestment Earnings $ $ 94$ 94$
Total Revenues 0 0 94 94
EXPENDITURESPublic Works 0
Total Expenditures 0 0 0 0
Excess (Deficiency) of Revenues over Expenditures 0$ 0$ 94 94$
Fund Balance, Beginning 0
Fund Balance, Ending 94$
Budgeted Amounts
City of Perris, CaliforniaSchedule of Revenues, Expenditures and Changes in Fund Balances
Budget and Actual - Community Facilities District 05-4 Capital Project FundYear Ended June 30, 2017
124

Variance withFinal Budget
Actual PositiveOriginal Final Amounts (Negative)
REVENUESContributions $ $ 4,005,000$ 4,005,000$
Total Revenues 0 0 4,005,000 4,005,000
EXPENDITURESCapital Outlay 0
Total Expenditures 0 0 0 0
Excess (Deficiency) of Revenues over Expenditures 0$ 0$ 4,005,000 4,005,000$
Fund Balance, Beginning 0
Fund Balance, Ending 4,005,000$
Budgeted Amounts
City of Perris, CaliforniaSchedule of Revenues, Expenditures and Changes in Fund Balances
Budget and Actual - Community Facilities District 14-1 Capital Project Fund Year Ended June 30, 2017
125
AGENCY FUNDS
City Cash Trust Fund - is used to account for monies held for other organizations or private individuals.
Community Facilities Districts - is used to account for the principal and interest payments for various Community Facilities Districts bonds.
Assessment District 86-1 - is used to account for the principal and interest payments of the 1993 Series A, AD86-1 Improvement refunding bonds for use in the construction and improvements of the City’s infrastructure.
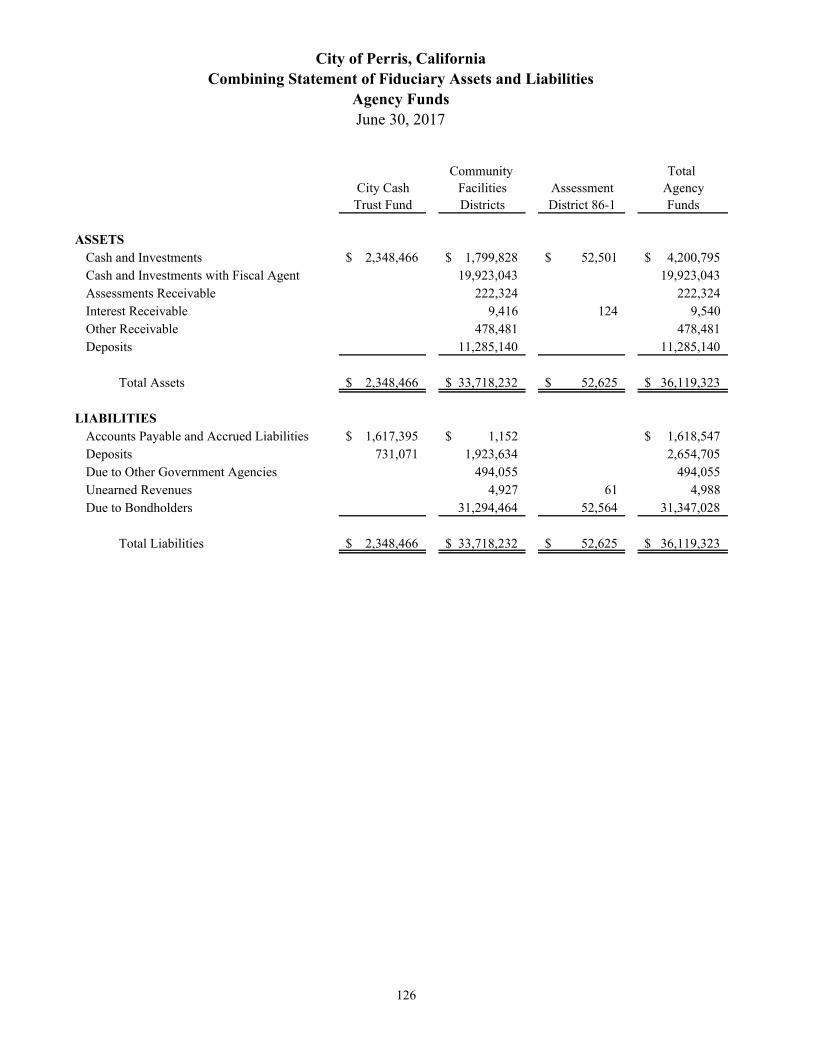
Community Total City Cash Facilities Assessment AgencyTrust Fund Districts District 86-1 Funds
ASSETSCash and Investments 2,348,466$ 1,799,828$ 52,501$ 4,200,795$ Cash and Investments with Fiscal Agent 19,923,043 19,923,043 Assessments Receivable 222,324 222,324 Interest Receivable 9,416 124 9,540 Other Receivable 478,481 478,481 Deposits 11,285,140 11,285,140
Total Assets 2,348,466$ 33,718,232$ 52,625$ 36,119,323$
LIABILITIES Accounts Payable and Accrued Liabilities 1,617,395$ 1,152$ 1,618,547$ Deposits 731,071 1,923,634 2,654,705 Due to Other Government Agencies 494,055 494,055 Unearned Revenues 4,927 61 4,988 Due to Bondholders 31,294,464 52,564 31,347,028
Total Liabilities 2,348,466$ 33,718,232$ 52,625$ 36,119,323$
City of Perris, CaliforniaCombining Statement of Fiduciary Assets and Liabilities
Agency FundsJune 30, 2017
126
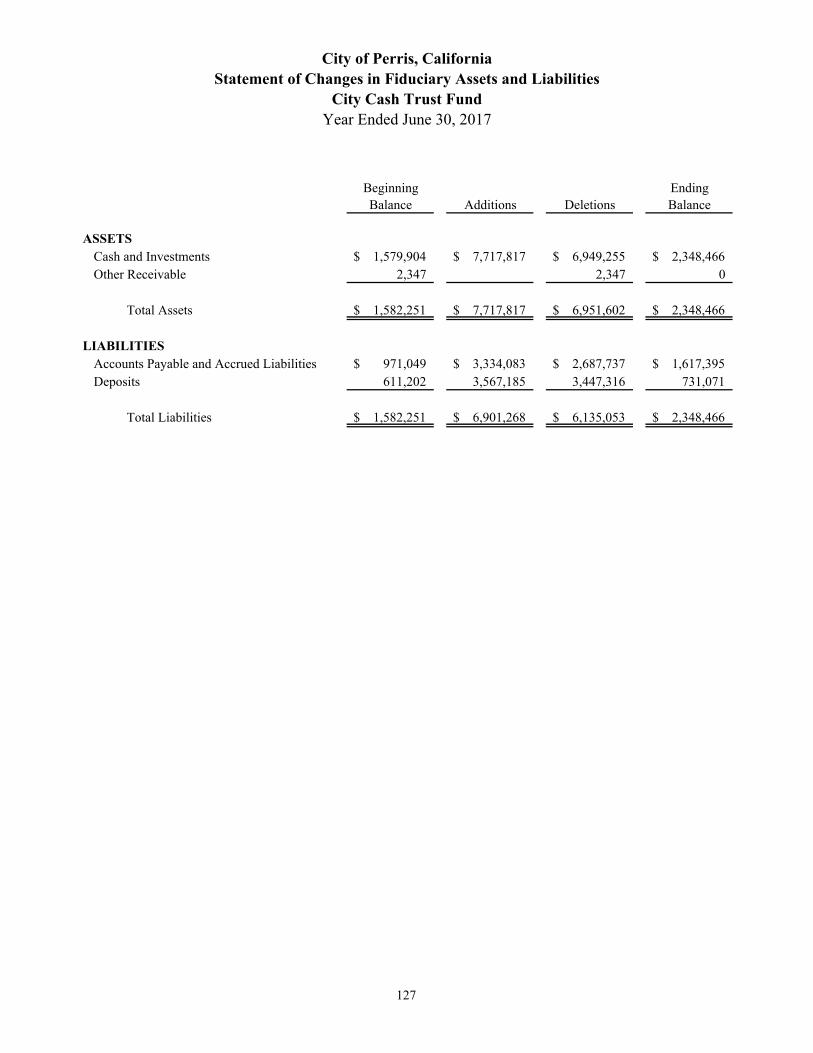
Beginning EndingBalance Additions Deletions Balance
ASSETSCash and Investments 1,579,904$ 7,717,817$ 6,949,255$ 2,348,466$ Other Receivable 2,347 2,347 0
Total Assets 1,582,251$ 7,717,817$ 6,951,602$ 2,348,466$
LIABILITIESAccounts Payable and Accrued Liabilities 971,049$ 3,334,083$ 2,687,737$ 1,617,395$ Deposits 611,202 3,567,185 3,447,316 731,071
Total Liabilities 1,582,251$ 6,901,268$ 6,135,053$ 2,348,466$
City of Perris, CaliforniaStatement of Changes in Fiduciary Assets and Liabilities
Year Ended June 30, 2017City Cash Trust Fund
127

Beginning EndingBalance Additions Deletions Balance
ASSETSCash and Investments 8,192,478$ 27,400,960$ 33,793,610$ 1,799,828$ Cash and Investments with Fiscal Agent 14,425,180 105,999,332 100,501,469 19,923,043 Assessments Receivable 199,643 222,324 199,643 222,324 Interest Receivable 10,922 16,043 17,549 9,416 Other Receivable 15,705 502,970 40,194 478,481 Deposits 10,849,403 11,344,015 10,908,278 11,285,140
Total Assets 33,693,331$ 145,485,644$ 145,460,743$ 33,718,232$
LIABILITIESAccounts Payable and Accrued Liabilities 14,923$ 123,246$ 137,017$ 1,152$ Deposits 360,521 1,948,958 385,845 1,923,634 Due to Other Government Agencies 24,079 494,240 24,264 494,055 Unearned Revenues 4,816 4,807 4,696 4,927 Due to Bondholders 33,288,992 146,046,468 148,040,996 31,294,464
Total Liabilities 33,693,331$ 148,617,719$ 148,592,818$ 33,718,232$
City of Perris, CaliforniaStatement of Changes in Fiduciary Assets and Liabilities
Year Ended June 30, 2017Community Facilities Districts
128

Beginning EndingBalance Additions Deletions Balance
ASSETSCash and Investments 52,472$ 210,011$ 209,982$ 52,501$ Interest Receivable 122 193 191 124
Total Assets 52,594$ 210,204$ 210,173$ 52,625$
LIABILITIESUnearned Revenue 53$ 61$ 53$ 61$ Due to Bondholders 52,541 210,257 210,234 52,564
Total Liabilities 52,594$ 210,318$ 210,287$ 52,625$
City of Perris, CaliforniaStatement of Changes in Fiduciary Assets and Liabilities
Year Ended June 30, 2017Assessment District 86-1
129
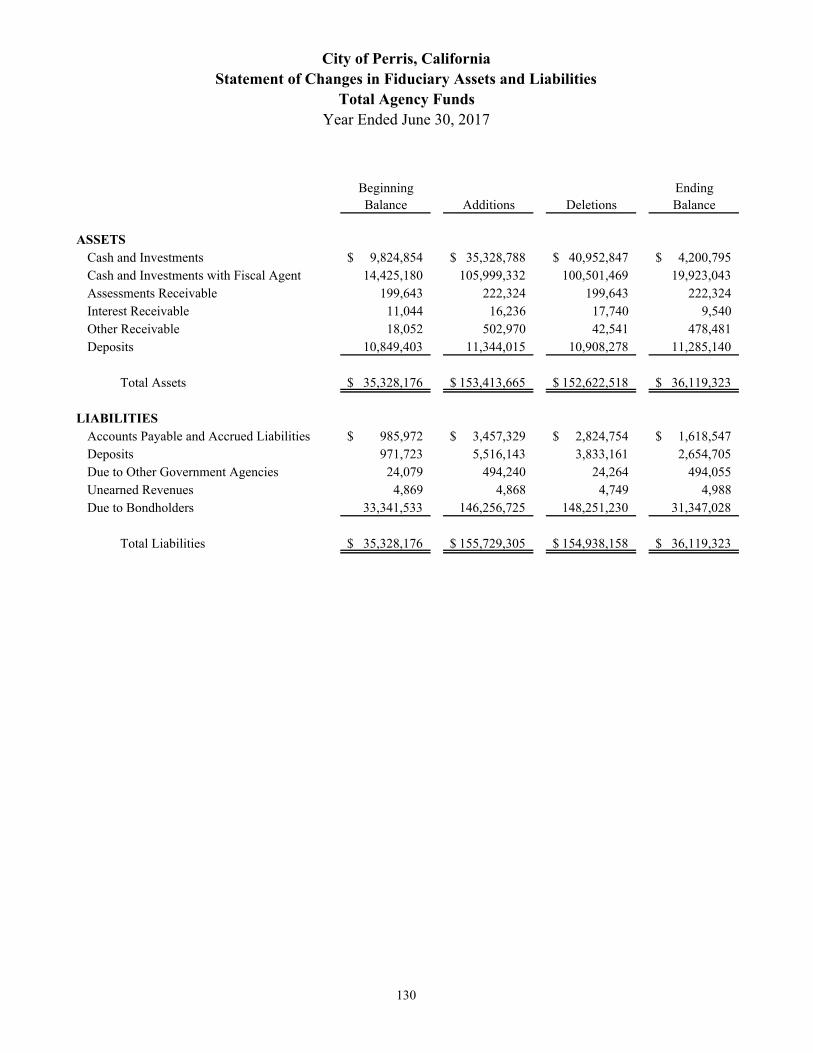
Beginning EndingBalance Additions Deletions Balance
ASSETSCash and Investments 9,824,854$ 35,328,788$ 40,952,847$ 4,200,795$ Cash and Investments with Fiscal Agent 14,425,180 105,999,332 100,501,469 19,923,043 Assessments Receivable 199,643 222,324 199,643 222,324 Interest Receivable 11,044 16,236 17,740 9,540 Other Receivable 18,052 502,970 42,541 478,481 Deposits 10,849,403 11,344,015 10,908,278 11,285,140
Total Assets 35,328,176$ 153,413,665$ 152,622,518$ 36,119,323$
LIABILITIES Accounts Payable and Accrued Liabilities 985,972$ 3,457,329$ 2,824,754$ 1,618,547$ Deposits 971,723 5,516,143 3,833,161 2,654,705 Due to Other Government Agencies 24,079 494,240 24,264 494,055 Unearned Revenues 4,869 4,868 4,749 4,988 Due to Bondholders 33,341,533 146,256,725 148,251,230 31,347,028
Total Liabilities 35,328,176$ 155,729,305$ 154,938,158$ 36,119,323$
City of Perris, CaliforniaStatement of Changes in Fiduciary Assets and Liabilities
Year Ended June 30, 2017Total Agency Funds
130

STATISTICAL SECTION
City of Perris, California

STATISTICAL SECTION
This part of the City of Perris comprehensive annual financial report presents detailed information as a context for understanding what the information in the financial statements, note disclosures, and required supplementary information says about the government’s overall financial health.
CONTENTS PAGE Financial Trends These schedules contain trend information to help the reader understand how the government’s
financial performance and well-being have changed over time.
131
Revenue Capacity These schedules contain information to help the reader assess the government’s most significant local
revenue source, the property tax.
141
Debt Capacity These schedules present information to help the reader assess the affordability of the government’s
current levels of outstanding debt and the government’s ability to issue additional debt in the future.
148
Demographic and Economic Information These schedules offer demographic and economic indicators to help the reader understand the
environment within which the government’s financial activities take place.
153
Operating Information These schedules contain service and infrastructure data to help the reader understand how the
information in the government’s financial report relates to the services the government provides and the activities it performs.
155
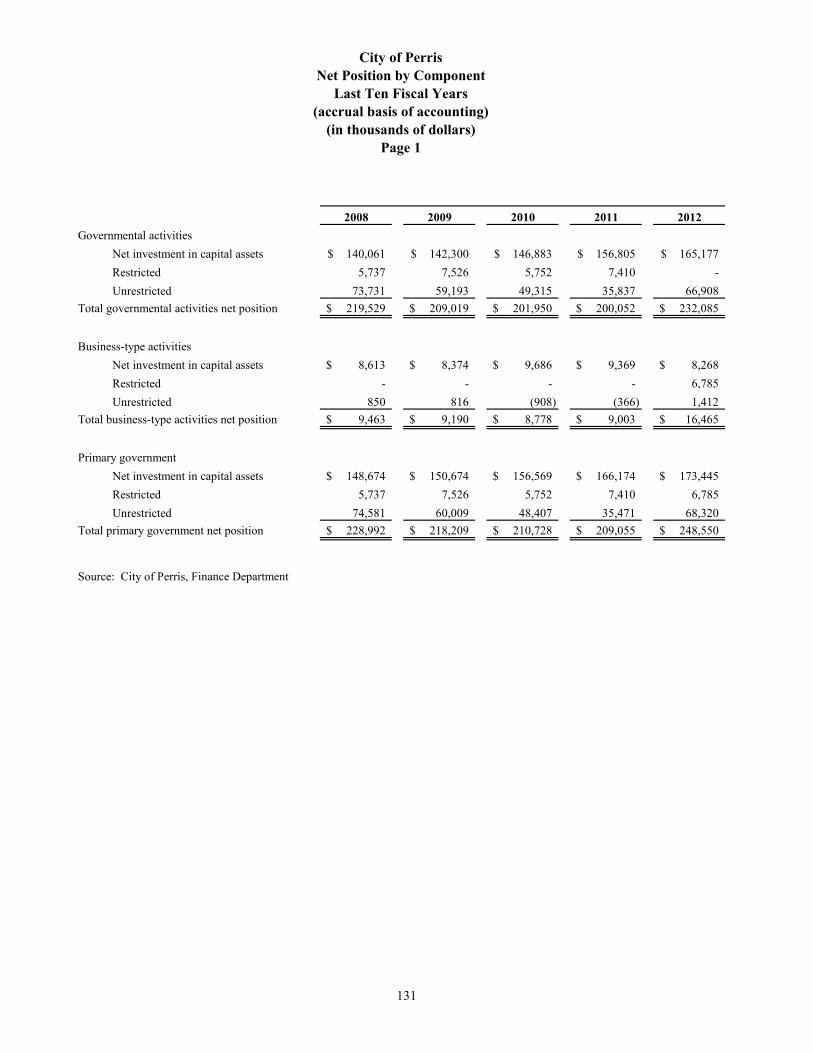
2008 2009 2010 2011 2012
Governmental activities
Net investment in capital assets 140,061$ 142,300$ 146,883$ 156,805$ 165,177$
Restricted 5,737 7,526 5,752 7,410 -
Unrestricted 73,731 59,193 49,315 35,837 66,908
Total governmental activities net position 219,529$ 209,019$ 201,950$ 200,052$ 232,085$
Business-type activities
Net investment in capital assets 8,613$ 8,374$ 9,686$ 9,369$ 8,268$
Restricted - - - - 6,785
Unrestricted 850 816 (908) (366) 1,412
Total business-type activities net position 9,463$ 9,190$ 8,778$ 9,003$ 16,465$
Primary government
Net investment in capital assets 148,674$ 150,674$ 156,569$ 166,174$ 173,445$
Restricted 5,737 7,526 5,752 7,410 6,785
Unrestricted 74,581 60,009 48,407 35,471 68,320
Total primary government net position 228,992$ 218,209$ 210,728$ 209,055$ 248,550$
Source: City of Perris, Finance Department
City of PerrisNet Position by Component
Last Ten Fiscal Years(accrual basis of accounting)
(in thousands of dollars)Page 1
131
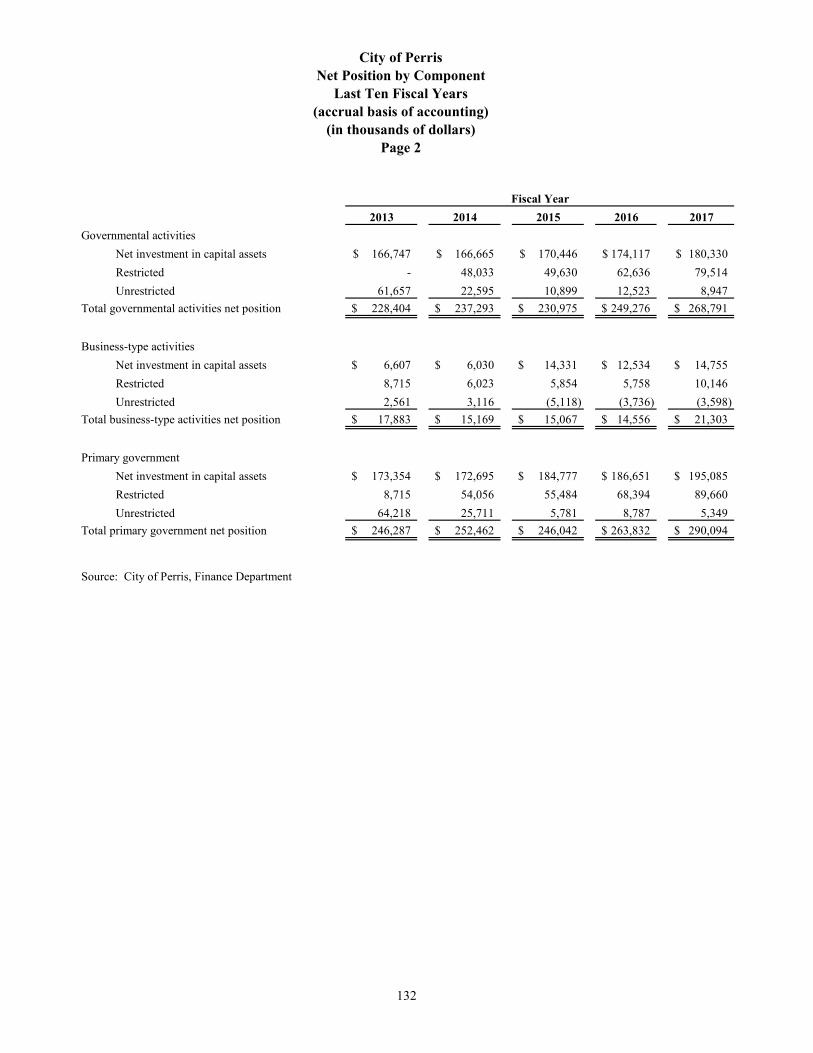
2013 2014 2015 2016 2017
Governmental activities
Net investment in capital assets 166,747$ 166,665$ 170,446$ 174,117$ 180,330$
Restricted - 48,033 49,630 62,636 79,514
Unrestricted 61,657 22,595 10,899 12,523 8,947
Total governmental activities net position 228,404$ 237,293$ 230,975$ 249,276$ 268,791$
Business-type activities
Net investment in capital assets 6,607$ 6,030$ 14,331$ 12,534$ 14,755$
Restricted 8,715 6,023 5,854 5,758 10,146
Unrestricted 2,561 3,116 (5,118) (3,736) (3,598)
Total business-type activities net position 17,883$ 15,169$ 15,067$ 14,556$ 21,303$
Primary government
Net investment in capital assets 173,354$ 172,695$ 184,777$ 186,651$ 195,085$
Restricted 8,715 54,056 55,484 68,394 89,660
Unrestricted 64,218 25,711 5,781 8,787 5,349
Total primary government net position 246,287$ 252,462$ 246,042$ 263,832$ 290,094$
Source: City of Perris, Finance Department
City of PerrisNet Position by Component
Last Ten Fiscal Years(accrual basis of accounting)
Fiscal Year
(in thousands of dollars)Page 2
132
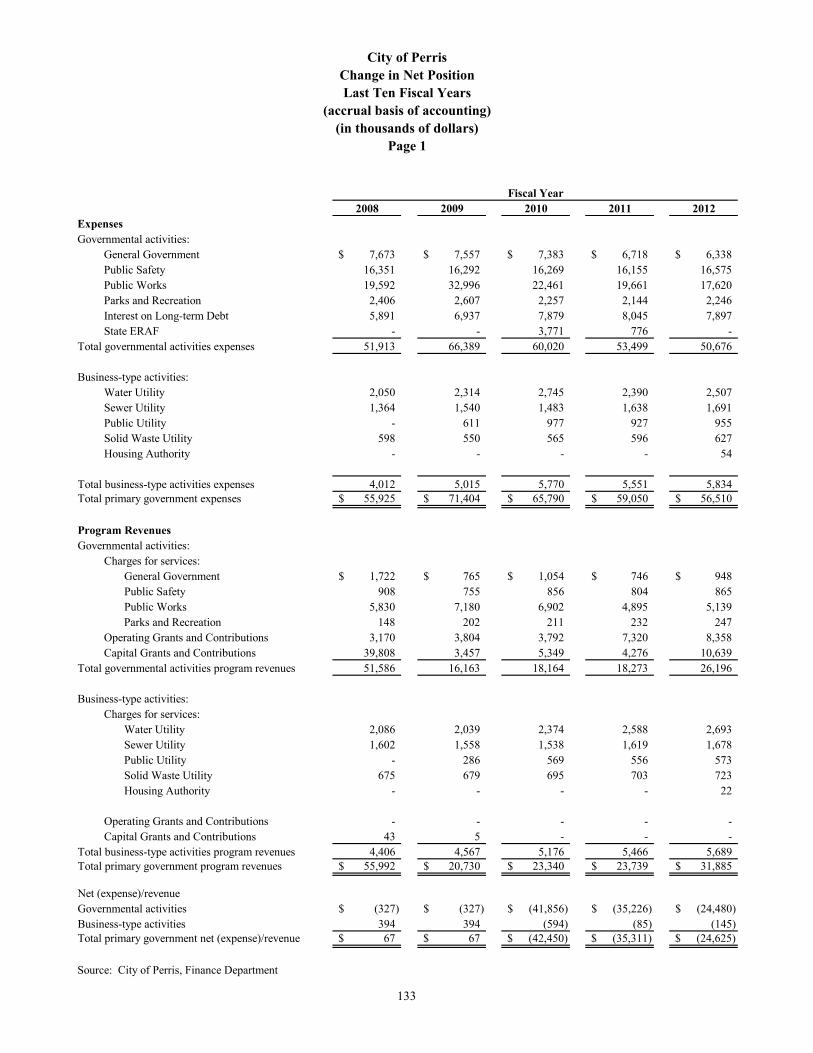
2008 2009 2010 2011 2012ExpensesGovernmental activities:
General Government 7,673$ 7,557$ 7,383$ 6,718$ 6,338$ Public Safety 16,351 16,292 16,269 16,155 16,575 Public Works 19,592 32,996 22,461 19,661 17,620 Parks and Recreation 2,406 2,607 2,257 2,144 2,246 Interest on Long-term Debt 5,891 6,937 7,879 8,045 7,897 State ERAF - - 3,771 776 -
Total governmental activities expenses 51,913 66,389 60,020 53,499 50,676
Business-type activities:Water Utility 2,050 2,314 2,745 2,390 2,507 Sewer Utility 1,364 1,540 1,483 1,638 1,691 Public Utility - 611 977 927 955 Solid Waste Utility 598 550 565 596 627 Housing Authority - - - - 54
Total business-type activities expenses 4,012 5,015 5,770 5,551 5,834 Total primary government expenses 55,925$ 71,404$ 65,790$ 59,050$ 56,510$
Program RevenuesGovernmental activities:
Charges for services:General Government 1,722$ 765$ 1,054$ 746$ 948$ Public Safety 908 755 856 804 865 Public Works 5,830 7,180 6,902 4,895 5,139 Parks and Recreation 148 202 211 232 247
Operating Grants and Contributions 3,170 3,804 3,792 7,320 8,358 Capital Grants and Contributions 39,808 3,457 5,349 4,276 10,639
Total governmental activities program revenues 51,586 16,163 18,164 18,273 26,196
Business-type activities:Charges for services:
Water Utility 2,086 2,039 2,374 2,588 2,693 Sewer Utility 1,602 1,558 1,538 1,619 1,678 Public Utility - 286 569 556 573 Solid Waste Utility 675 679 695 703 723 Housing Authority - - - - 22
Operating Grants and Contributions - - - - - Capital Grants and Contributions 43 5 - - -
Total business-type activities program revenues 4,406 4,567 5,176 5,466 5,689 Total primary government program revenues 55,992$ 20,730$ 23,340$ 23,739$ 31,885$
Net (expense)/revenueGovernmental activities (327)$ (327)$ (41,856)$ (35,226)$ (24,480)$ Business-type activities 394 394 (594) (85) (145) Total primary government net (expense)/revenue 67$ 67$ (42,450)$ (35,311)$ (24,625)$
Source: City of Perris, Finance Department
Fiscal Year
Page 1
City of PerrisChange in Net PositionLast Ten Fiscal Years
(in thousands of dollars)(accrual basis of accounting)
133
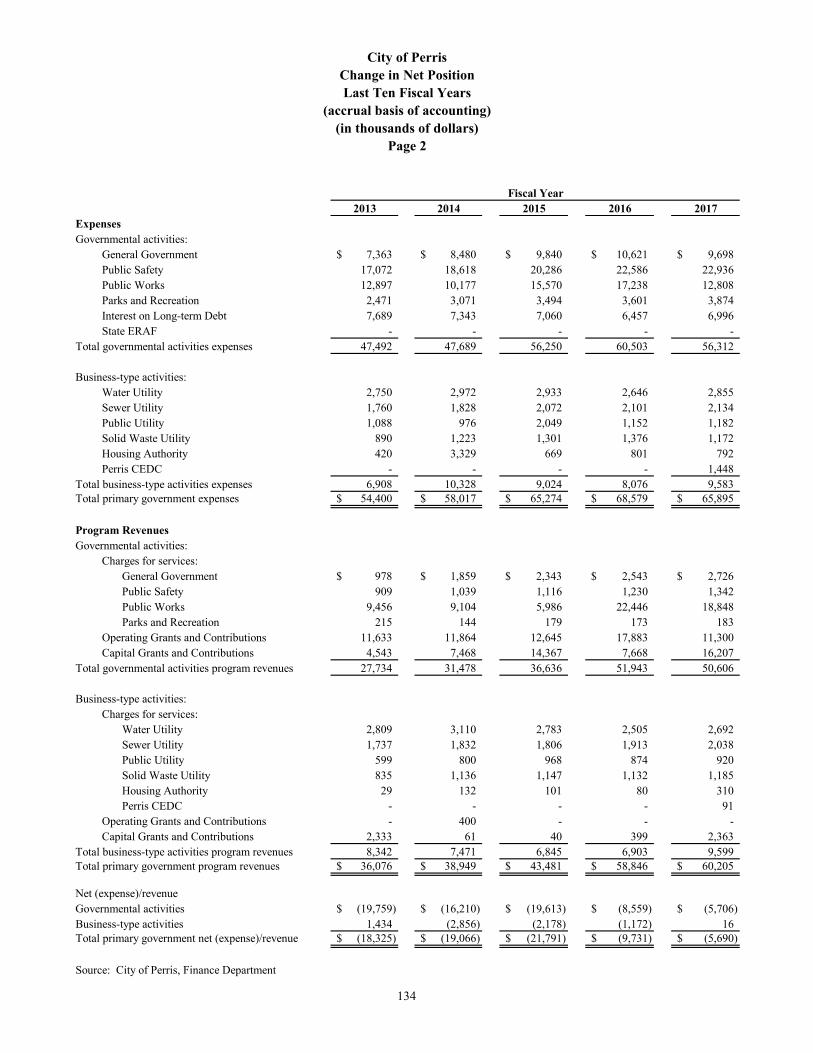
2013 2014 2015 2016 2017ExpensesGovernmental activities:
General Government 7,363$ 8,480$ 9,840$ 10,621$ 9,698$ Public Safety 17,072 18,618 20,286 22,586 22,936 Public Works 12,897 10,177 15,570 17,238 12,808 Parks and Recreation 2,471 3,071 3,494 3,601 3,874 Interest on Long-term Debt 7,689 7,343 7,060 6,457 6,996 State ERAF - - - - -
Total governmental activities expenses 47,492 47,689 56,250 60,503 56,312
Business-type activities:Water Utility 2,750 2,972 2,933 2,646 2,855 Sewer Utility 1,760 1,828 2,072 2,101 2,134 Public Utility 1,088 976 2,049 1,152 1,182 Solid Waste Utility 890 1,223 1,301 1,376 1,172 Housing Authority 420 3,329 669 801 792 Perris CEDC - - - - 1,448
Total business-type activities expenses 6,908 10,328 9,024 8,076 9,583 Total primary government expenses 54,400$ 58,017$ 65,274$ 68,579$ 65,895$
Program RevenuesGovernmental activities:
Charges for services:General Government 978$ 1,859$ 2,343$ 2,543$ 2,726$ Public Safety 909 1,039 1,116 1,230 1,342 Public Works 9,456 9,104 5,986 22,446 18,848 Parks and Recreation 215 144 179 173 183
Operating Grants and Contributions 11,633 11,864 12,645 17,883 11,300 Capital Grants and Contributions 4,543 7,468 14,367 7,668 16,207
Total governmental activities program revenues 27,734 31,478 36,636 51,943 50,606
Business-type activities:Charges for services:
Water Utility 2,809 3,110 2,783 2,505 2,692 Sewer Utility 1,737 1,832 1,806 1,913 2,038 Public Utility 599 800 968 874 920 Solid Waste Utility 835 1,136 1,147 1,132 1,185 Housing Authority 29 132 101 80 310 Perris CEDC - - - - 91
Operating Grants and Contributions - 400 - - - Capital Grants and Contributions 2,333 61 40 399 2,363
Total business-type activities program revenues 8,342 7,471 6,845 6,903 9,599 Total primary government program revenues 36,076$ 38,949$ 43,481$ 58,846$ 60,205$
Net (expense)/revenueGovernmental activities (19,759)$ (16,210)$ (19,613)$ (8,559)$ (5,706)$ Business-type activities 1,434 (2,856) (2,178) (1,172) 16 Total primary government net (expense)/revenue (18,325)$ (19,066)$ (21,791)$ (9,731)$ (5,690)$
Source: City of Perris, Finance Department
Fiscal Year
Page 2(in thousands of dollars)
City of PerrisChange in Net PositionLast Ten Fiscal Years
(accrual basis of accounting)
134
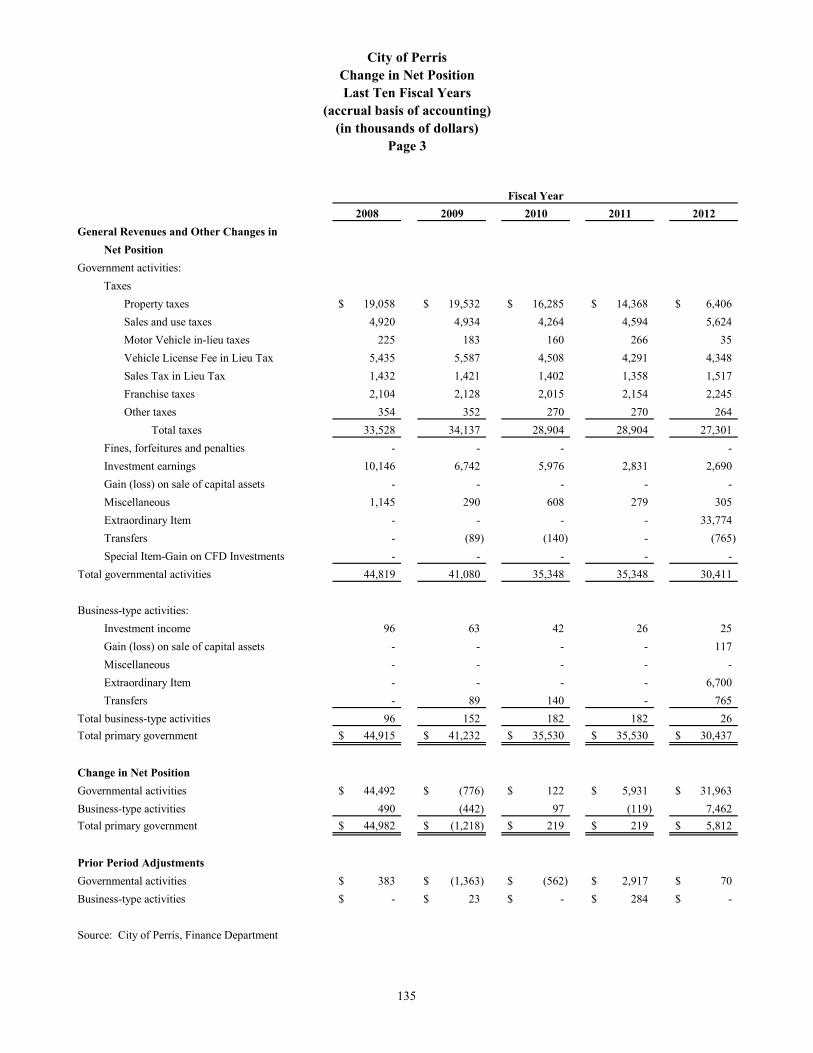
2008 2009 2010 2011 2012
General Revenues and Other Changes in
Net Position
Government activities:
Taxes
Property taxes 19,058$ 19,532$ 16,285$ 14,368$ 6,406$
Sales and use taxes 4,920 4,934 4,264 4,594 5,624
Motor Vehicle in-lieu taxes 225 183 160 266 35
Vehicle License Fee in Lieu Tax 5,435 5,587 4,508 4,291 4,348
Sales Tax in Lieu Tax 1,432 1,421 1,402 1,358 1,517
Franchise taxes 2,104 2,128 2,015 2,154 2,245
Other taxes 354 352 270 270 264
Total taxes 33,528 34,137 28,904 28,904 27,301
Fines, forfeitures and penalties - - - -
Investment earnings 10,146 6,742 5,976 2,831 2,690
Gain (loss) on sale of capital assets - - - - -
Miscellaneous 1,145 290 608 279 305
Extraordinary Item - - - - 33,774
Transfers - (89) (140) - (765)
Special Item-Gain on CFD Investments - - - - -
Total governmental activities 44,819 41,080 35,348 35,348 30,411
Business-type activities:
Investment income 96 63 42 26 25
Gain (loss) on sale of capital assets - - - - 117
Miscellaneous - - - - -
Extraordinary Item - - - - 6,700
Transfers - 89 140 - 765
Total business-type activities 96 152 182 182 26
Total primary government 44,915$ 41,232$ 35,530$ 35,530$ 30,437$
Change in Net Position
Governmental activities 44,492$ (776)$ 122$ 5,931$ 31,963$
Business-type activities 490 (442) 97 (119) 7,462
Total primary government 44,982$ (1,218)$ 219$ 219$ 5,812$
Prior Period Adjustments
Governmental activities 383$ (1,363)$ (562)$ 2,917$ 70$
Business-type activities -$ 23$ -$ 284$ -$
Source: City of Perris, Finance Department
Fiscal Year
(in thousands of dollars)Page 3
(accrual basis of accounting)Last Ten Fiscal Years
City of PerrisChange in Net Position
135
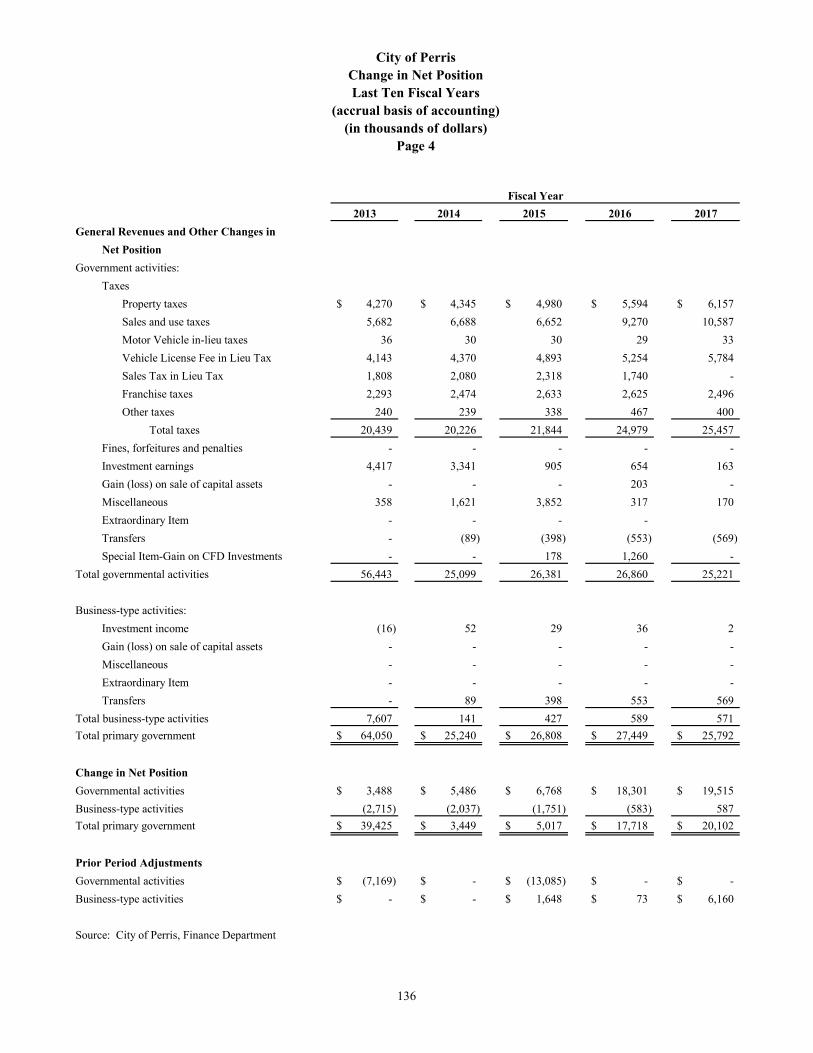
2013 2014 2015 2016 2017
General Revenues and Other Changes in
Net Position
Government activities:
Taxes
Property taxes 4,270$ 4,345$ 4,980$ 5,594$ 6,157$
Sales and use taxes 5,682 6,688 6,652 9,270 10,587
Motor Vehicle in-lieu taxes 36 30 30 29 33
Vehicle License Fee in Lieu Tax 4,143 4,370 4,893 5,254 5,784
Sales Tax in Lieu Tax 1,808 2,080 2,318 1,740 -
Franchise taxes 2,293 2,474 2,633 2,625 2,496
Other taxes 240 239 338 467 400
Total taxes 20,439 20,226 21,844 24,979 25,457
Fines, forfeitures and penalties - - - - -
Investment earnings 4,417 3,341 905 654 163
Gain (loss) on sale of capital assets - - - 203 -
Miscellaneous 358 1,621 3,852 317 170
Extraordinary Item - - - -
Transfers - (89) (398) (553) (569)
Special Item-Gain on CFD Investments - - 178 1,260 -
Total governmental activities 56,443 25,099 26,381 26,860 25,221
Business-type activities:
Investment income (16) 52 29 36 2
Gain (loss) on sale of capital assets - - - - -
Miscellaneous - - - - -
Extraordinary Item - - - - -
Transfers - 89 398 553 569
Total business-type activities 7,607 141 427 589 571
Total primary government 64,050$ 25,240$ 26,808$ 27,449$ 25,792$
Change in Net Position
Governmental activities 3,488$ 5,486$ 6,768$ 18,301$ 19,515$
Business-type activities (2,715) (2,037) (1,751) (583) 587
Total primary government 39,425$ 3,449$ 5,017$ 17,718$ 20,102$
Prior Period Adjustments
Governmental activities (7,169)$ -$ (13,085)$ -$ -$
Business-type activities -$ -$ 1,648$ 73$ 6,160$
Source: City of Perris, Finance Department
Fiscal Year
(accrual basis of accounting)(in thousands of dollars)
City of Perris
Page 4
Change in Net PositionLast Ten Fiscal Years
136
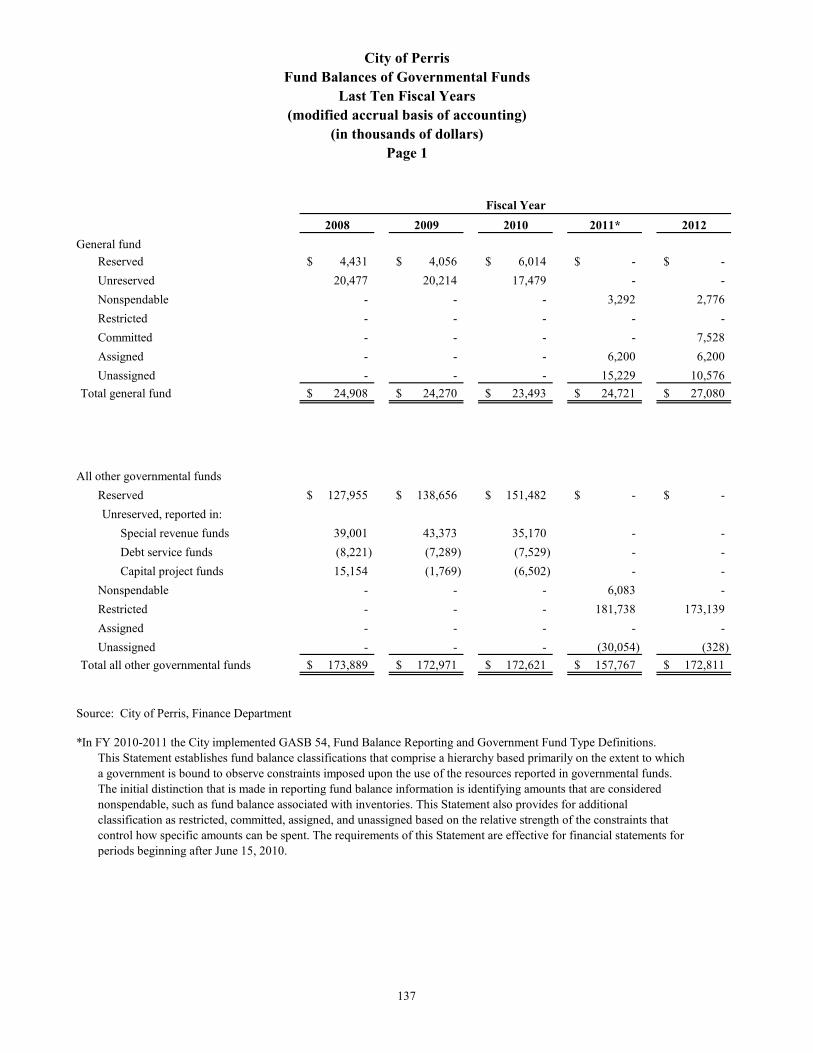
2008 2009 2010 2011* 2012
General fund
Reserved 4,431$ 4,056$ 6,014$ -$ -$
Unreserved 20,477 20,214 17,479 - -
Nonspendable - - - 3,292 2,776
Restricted - - - - -
Committed - - - - 7,528
Assigned - - - 6,200 6,200
Unassigned - - - 15,229 10,576
Total general fund 24,908$ 24,270$ 23,493$ 24,721$ 27,080$
All other governmental funds
Reserved 127,955$ 138,656$ 151,482$ -$ -$
Unreserved, reported in:
Special revenue funds 39,001 43,373 35,170 - -
Debt service funds (8,221) (7,289) (7,529) - -
Capital project funds 15,154 (1,769) (6,502) - -
Nonspendable - - - 6,083 -
Restricted - - - 181,738 173,139
Assigned - - - - -
Unassigned - - - (30,054) (328)
Total all other governmental funds 173,889$ 172,971$ 172,621$ 157,767$ 172,811$
Source: City of Perris, Finance Department
*In FY 2010-2011 the City implemented GASB 54, Fund Balance Reporting and Government Fund Type Definitions.This Statement establishes fund balance classifications that comprise a hierarchy based primarily on the extent to whicha government is bound to observe constraints imposed upon the use of the resources reported in governmental funds.The initial distinction that is made in reporting fund balance information is identifying amounts that are considerednonspendable, such as fund balance associated with inventories. This Statement also provides for additionalclassification as restricted, committed, assigned, and unassigned based on the relative strength of the constraints thatcontrol how specific amounts can be spent. The requirements of this Statement are effective for financial statements forperiods beginning after June 15, 2010.
(modified accrual basis of accounting)(in thousands of dollars)
Page 1
Fiscal Year
City of PerrisFund Balances of Governmental Funds
Last Ten Fiscal Years
137
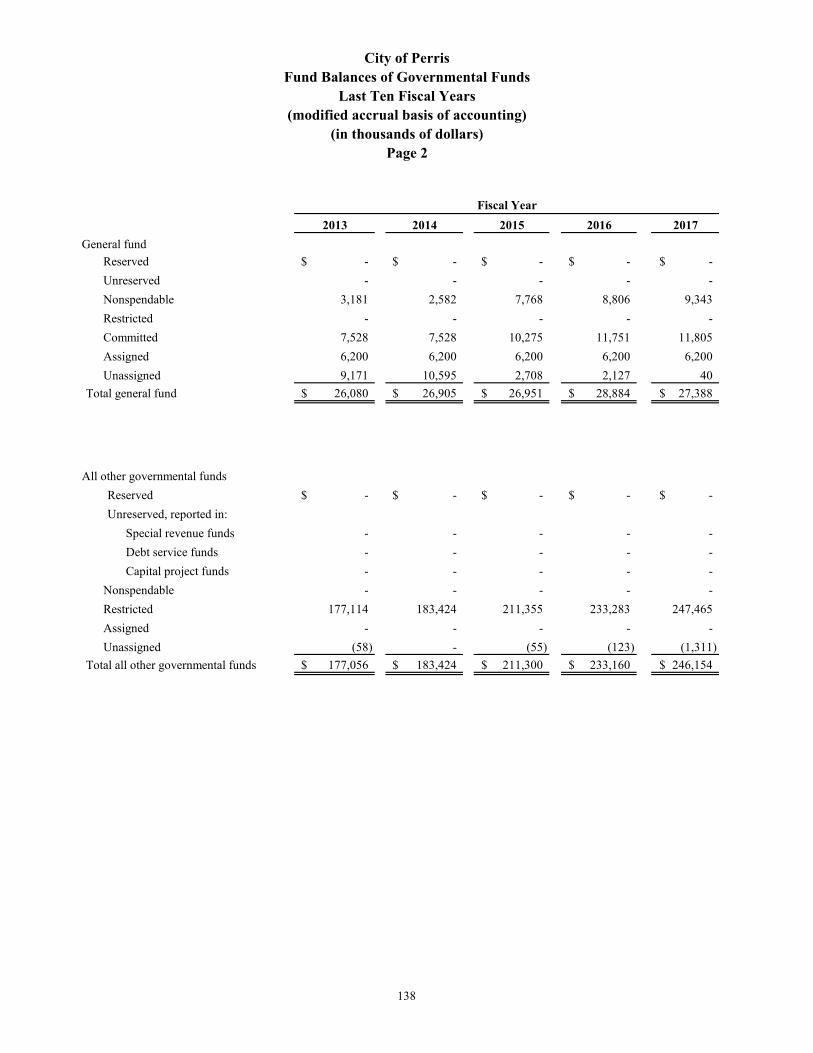
2013 2014 2015 2016 2017
General fund
Reserved -$ -$ -$ -$ -$
Unreserved - - - - -
Nonspendable 3,181 2,582 7,768 8,806 9,343
Restricted - - - - -
Committed 7,528 7,528 10,275 11,751 11,805
Assigned 6,200 6,200 6,200 6,200 6,200
Unassigned 9,171 10,595 2,708 2,127 40
Total general fund 26,080$ 26,905$ 26,951$ 28,884$ 27,388$
All other governmental funds
Reserved -$ -$ -$ -$ -$
Unreserved, reported in:
Special revenue funds - - - - -
Debt service funds - - - - -
Capital project funds - - - - -
Nonspendable - - - - -
Restricted 177,114 183,424 211,355 233,283 247,465
Assigned - - - - -
Unassigned (58) - (55) (123) (1,311)
Total all other governmental funds 177,056$ 183,424$ 211,300$ 233,160$ 246,154$
Fiscal Year
(modified accrual basis of accounting)(in thousands of dollars)
Page 2
City of PerrisFund Balances of Governmental Funds
Last Ten Fiscal Years
138

2008 2009 2010 2011 2012Revenues
Taxes 33,462$ 34,136$ 28,904$ 27,302$ 20,440$ Licenses and Permits 1,989 748 1,005 771 1,003 Intergovernmental Revenues 6,490 4,785 5,138 5,867 5,429 Charges for Services 992 480 350 598 557 Fines, Forfeitures, and Penalties 650 619 739 666 731 Developer Fees 1,032 2,303 2,553 603 1,417 Investment Earnings 10,146 6,743 5,717 6,658 6,751 Special Assessments 3,709 3,382 4,251 4,032 4,027 Contributions from Property Owners 22,542 2,490 3,659 1,862 3,942 Other Revenue 1,395 1,627 1,273 313 333
Total Revenues 82,407 57,313 53,589 48,672 44,630
ExpendituresGeneral Government 6,756 6,307 5,636 4,738 4,684 Public Safety 16,194 16,132 16,092 15,938 16,372 Public Works 5,506 6,013 7,736 12,696 10,344 Parks and Recreation 2,001 2,174 1,827 1,716 1,795 State ERAF - - 3,771 776 - Capital Outlay 27,848 22,712 16,953 14,043 12,567 Debt Service
Pass-through Agreements 3,454 6,841 3,161 3,369 1,597 Issuance Costs 1,978 783 930 - - Principal Retirement 2,447 1,803 3,100 3,590 3,130 Interest and Fiscal Charges 5,512 6,683 7,760 8,084 7,941
Total Expenditures 71,696 69,448 66,966 64,950 58,430
Excess of revenuesover (under) expenditures 10,711 (12,135) (13,377) (16,278) (13,800)
Other Financing Sources (Uses)Transfers in 5,001 6,399 8,845 14,873 57,680 Transfers Out (5,001) (6,487) (8,985) (14,873) (57,680) Proceeds from Sale of Property 98 6 51 (604) (258) Proceeds from Sale of Land - - (430) - - Sale of Property - - - - - Payments to Refunded Bond Escrow Agent (15,312) - - - - Loss on Debt Refunding - - - - - Premiums on Long Term Debt - - - - - Revenue Bonds Issued - - - - - Proceeds from Refunding Bonds 337 - - - - Proceeds from Long Term Debt 41,546 12,024 13,014 339 141 Premiums on Refunding Bonds Issued - - - - - Discounts on Refunding Bonds Issued - - - - -
Total Other Financing Sources (Uses) 26,669 11,942 12,495 (265) (117)
Special ItemGain on CFD Investments - - - - -
Net Change in Fund Balances before Prior Period Adjustments and Extraordinary Item 37,380 (193) (882) (16,543) (13,917)
Prior Period Adjustments 356 (1,362) (245) 292 70 Extraordinary Item - - - - 31,250
Net Change in Fund Balances 37,736$ (1,555)$ (1,127)$ (16,251)$ 17,403$
Debt Service as a percentage ofnon-capital expenditures 21.5% 13.6% 19.0% 23.4% 23.4%
Source: City of Perris, Finance Department
Fiscal Year
(modified accrual basis of accounting)(in thousands of dollars)
Page 1
City of PerrisChanges in Fund Balance of Governmental Funds
Last Ten Fiscal Years
139
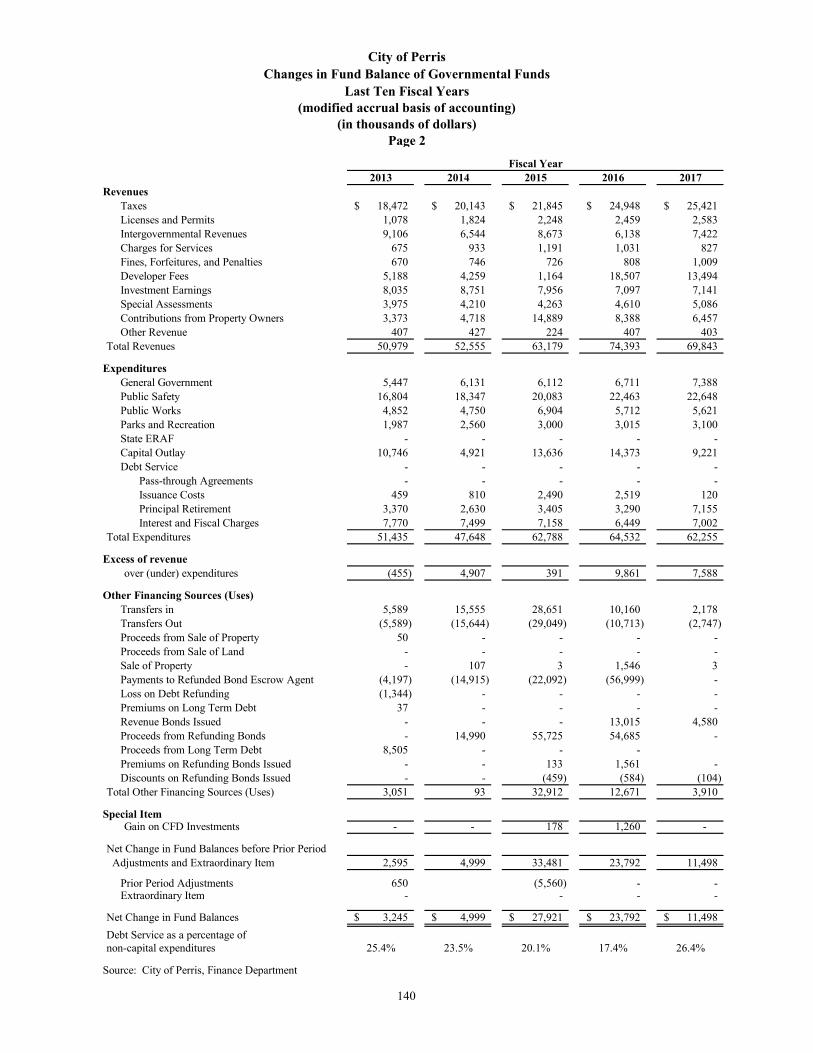
2013 2014 2015 2016 2017Revenues
Taxes 18,472$ 20,143$ 21,845$ 24,948$ 25,421$ Licenses and Permits 1,078 1,824 2,248 2,459 2,583 Intergovernmental Revenues 9,106 6,544 8,673 6,138 7,422 Charges for Services 675 933 1,191 1,031 827 Fines, Forfeitures, and Penalties 670 746 726 808 1,009 Developer Fees 5,188 4,259 1,164 18,507 13,494 Investment Earnings 8,035 8,751 7,956 7,097 7,141 Special Assessments 3,975 4,210 4,263 4,610 5,086 Contributions from Property Owners 3,373 4,718 14,889 8,388 6,457 Other Revenue 407 427 224 407 403
Total Revenues 50,979 52,555 63,179 74,393 69,843
ExpendituresGeneral Government 5,447 6,131 6,112 6,711 7,388 Public Safety 16,804 18,347 20,083 22,463 22,648 Public Works 4,852 4,750 6,904 5,712 5,621 Parks and Recreation 1,987 2,560 3,000 3,015 3,100 State ERAF - - - - - Capital Outlay 10,746 4,921 13,636 14,373 9,221 Debt Service - - - - -
Pass-through Agreements - - - - - Issuance Costs 459 810 2,490 2,519 120 Principal Retirement 3,370 2,630 3,405 3,290 7,155 Interest and Fiscal Charges 7,770 7,499 7,158 6,449 7,002
Total Expenditures 51,435 47,648 62,788 64,532 62,255
Excess of revenueover (under) expenditures (455) 4,907 391 9,861 7,588
Other Financing Sources (Uses)Transfers in 5,589 15,555 28,651 10,160 2,178 Transfers Out (5,589) (15,644) (29,049) (10,713) (2,747) Proceeds from Sale of Property 50 - - - - Proceeds from Sale of Land - - - - - Sale of Property - 107 3 1,546 3 Payments to Refunded Bond Escrow Agent (4,197) (14,915) (22,092) (56,999) - Loss on Debt Refunding (1,344) - - - - Premiums on Long Term Debt 37 - - - - Revenue Bonds Issued - - - 13,015 4,580 Proceeds from Refunding Bonds - 14,990 55,725 54,685 - Proceeds from Long Term Debt 8,505 - - - Premiums on Refunding Bonds Issued - - 133 1,561 - Discounts on Refunding Bonds Issued - - (459) (584) (104)
Total Other Financing Sources (Uses) 3,051 93 32,912 12,671 3,910
Special ItemGain on CFD Investments - - 178 1,260 -
Net Change in Fund Balances before Prior Period Adjustments and Extraordinary Item 2,595 4,999 33,481 23,792 11,498
Prior Period Adjustments 650 (5,560) - - Extraordinary Item - - - -
Net Change in Fund Balances 3,245$ 4,999$ 27,921$ 23,792$ 11,498$
Debt Service as a percentage ofnon-capital expenditures 25.4% 23.5% 20.1% 17.4% 26.4%
Source: City of Perris, Finance Department
Fiscal Year
(modified accrual basis of accounting)(in thousands of dollars)
Page 2
City of PerrisChanges in Fund Balance of Governmental Funds
Last Ten Fiscal Years
140
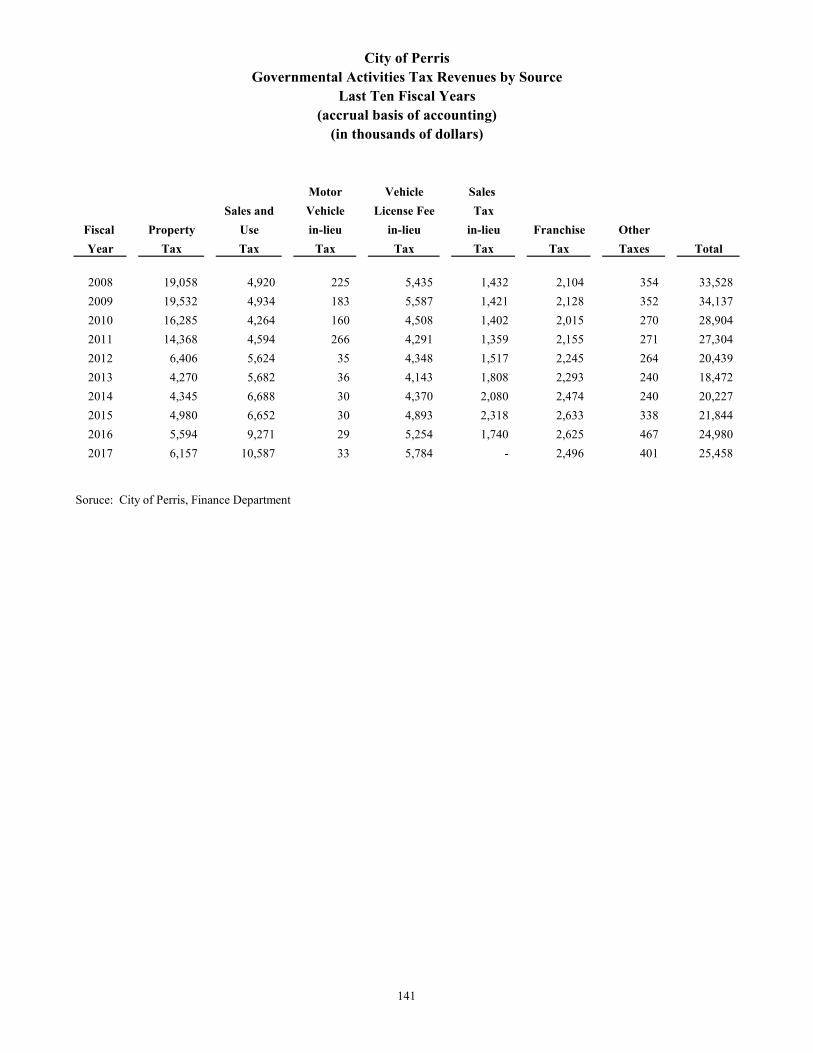
Motor Vehicle Sales
Sales and Vehicle License Fee Tax
Fiscal Property Use in-lieu in-lieu in-lieu Franchise Other
Year Tax Tax Tax Tax Tax Tax Taxes Total
2008 19,058 4,920 225 5,435 1,432 2,104 354 33,528
2009 19,532 4,934 183 5,587 1,421 2,128 352 34,137
2010 16,285 4,264 160 4,508 1,402 2,015 270 28,904
2011 14,368 4,594 266 4,291 1,359 2,155 271 27,304
2012 6,406 5,624 35 4,348 1,517 2,245 264 20,439
2013 4,270 5,682 36 4,143 1,808 2,293 240 18,472
2014 4,345 6,688 30 4,370 2,080 2,474 240 20,227
2015 4,980 6,652 30 4,893 2,318 2,633 338 21,844
2016 5,594 9,271 29 5,254 1,740 2,625 467 24,980
2017 6,157 10,587 33 5,784 - 2,496 401 25,458
Soruce: City of Perris, Finance Department
(in thousands of dollars)
City of PerrisGovernmental Activities Tax Revenues by Source
Last Ten Fiscal Years(accrual basis of accounting)
141
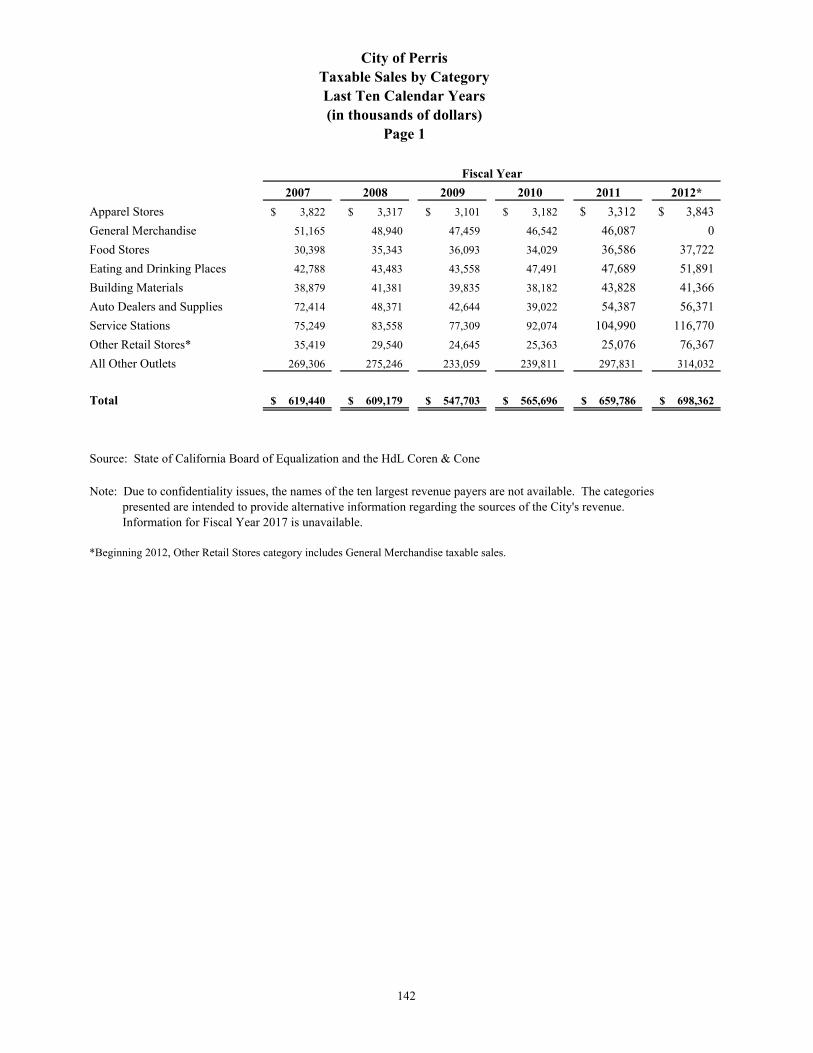
2007 2008 2009 2010 2011 2012*
Apparel Stores 3,822$ 3,317$ 3,101$ 3,182$ 3,312$ 3,843$
General Merchandise 51,165 48,940 47,459 46,542 46,087 0
Food Stores 30,398 35,343 36,093 34,029 36,586 37,722
Eating and Drinking Places 42,788 43,483 43,558 47,491 47,689 51,891
Building Materials 38,879 41,381 39,835 38,182 43,828 41,366
Auto Dealers and Supplies 72,414 48,371 42,644 39,022 54,387 56,371
Service Stations 75,249 83,558 77,309 92,074 104,990 116,770
Other Retail Stores* 35,419 29,540 24,645 25,363 25,076 76,367
All Other Outlets 269,306 275,246 233,059 239,811 297,831 314,032
Total 619,440$ 609,179$ 547,703$ 565,696$ 659,786$ 698,362$
Source: State of California Board of Equalization and the HdL Coren & Cone
Note: Due to confidentiality issues, the names of the ten largest revenue payers are not available. The categories presented are intended to provide alternative information regarding the sources of the City's revenue. Information for Fiscal Year 2017 is unavailable.
*Beginning 2012, Other Retail Stores category includes General Merchandise taxable sales.
Fiscal Year
Taxable Sales by CategoryCity of Perris
Last Ten Calendar Years(in thousands of dollars)
Page 1
142
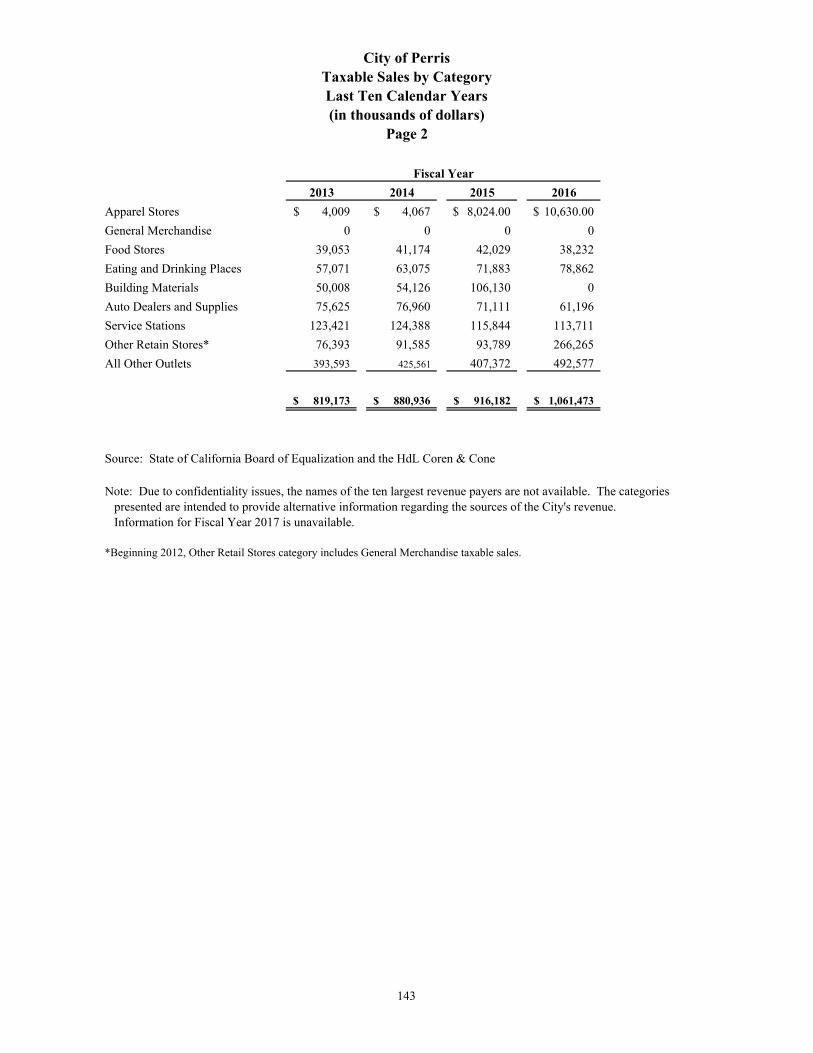
2013 2014 2015 2016
Apparel Stores 4,009$ 4,067$ 8,024.00$ 10,630.00$
General Merchandise 0 0 0 0
Food Stores 39,053 41,174 42,029 38,232
Eating and Drinking Places 57,071 63,075 71,883 78,862
Building Materials 50,008 54,126 106,130 0
Auto Dealers and Supplies 75,625 76,960 71,111 61,196
Service Stations 123,421 124,388 115,844 113,711
Other Retain Stores* 76,393 91,585 93,789 266,265
All Other Outlets 393,593 425,561 407,372 492,577
819,173$ 880,936$ 916,182$ 1,061,473$
Source: State of California Board of Equalization and the HdL Coren & Cone
Note: Due to confidentiality issues, the names of the ten largest revenue payers are not available. The categories presented are intended to provide alternative information regarding the sources of the City's revenue. Information for Fiscal Year 2017 is unavailable.
*Beginning 2012, Other Retail Stores category includes General Merchandise taxable sales.
Fiscal Year
City of PerrisTaxable Sales by CategoryLast Ten Calendar Years(in thousands of dollars)
Page 2
143

Fiscal Year Total Taxable Total
Ended Real Personal Other Homeowners' Assessed Direct Tax
June 30 Property Property Other Exemptions Exemptions Value Rate
2008* 4,712,125$ 100,303$ 86,737$ 26,092$ 41,021$ 4,832,052$ 1.0000
2009* 4,824,482 103,735 110,176 27,606 43,399 4,967,388 1.0000
2010* 3,858,356 111,085 111,869 30,722 43,445 4,007,143 1.0000
2011* 3,654,277 106,428 105,083 27,412 45,808 3,792,568 1.0000
2012* 3,712,750 91,163 109,697 28,065 45,422 3,840,123 1.0000
2013* 3,552,789 94,267 115,361 38,319 44,772 3,679,326 1.0000
2014* 3,750,174 100,978 146,695 48,917 43,843 3,905,087 1.0000
2015* 4,182,286 110,855 141,272 49,308 42,854 4,342,251 1.0000
2016* 4,521,608 126,013 151,211 54,620 42,549 4,701,663 1.0000
2017* 4,932,555 150,617 177,229 62,425 42,537 5,155,439 1.0000
Source: HdL Coren & Cone
City of PerrisAssessed Value and Actual Value of Taxable Property
Last Ten Fiscal Years
Less:
(In thousands of dollars)
144

2008 2009 2010 2011 2012 2013 2014 2015 2016 2017
Basic Levy 1.00000 1.00000 1.00000 1.00000 1.00000 1.00000 1.00000 1.00000 1.00000 1.00000
Eastern Municipal Water Improvement District 0.00800 0.00400 0.05300 0.05300 0.05300 0.05000 0.05000 0.05000 0.05000 0.05000
Metropolitan Water District Original Area 0.00450 0.00430 0.00430 0.03436 0.00370 0.00350 0.00350 0.00350 0.00350 0.00350
Menifee School 0.00549 0.02370 0.03254 0.00370 0.03486 0.03543 0.03421 0.03275 0.03010 0.03269
Perris School District 0.02999 0.02894 0.02485 0.01983 0.01983 0.01800 0.02524 0.05588 0.04699 0.05491
Perris Union High School 0.02110 0.02031 0.02686 0.03126 0.03429 0.03429 0.06970 0.06303 0.06236 0.06092
Riverside City Community College 0.01259 0.01254 0.01242 0.01499 0.01700 0.01702 0.01768 0.01791 0.01725 0.01649
Val Verde Unified 0.00000 0.03189 0.04089 0.03347 0.03160 0.08383 0.07235 0.07882 0.07135 0.07210
Mt San Jacinto Jr College 0.00000 0.00000 0.00000 0.00000 0.00000 0.00000 0.00000 0.00000 0.01394 0.01320
Total Prop 13 Rate 1.08167 1.12568 1.19486 1.19061 1.19428 1.24207 1.27268 1.30189 1.29549 1.30381
City's Share of 1% Levy Per Prop 13 0.25436 0.25436 0.13146 0.25436 0.25436 0.25436 0.13146 0.13146 0.13146 0.13146
Source: *HdL Coren & Cone
Agency
City of PerrisDirect and Overlapping Property Tax Rates
Last Ten Fiscal Years
145

Taxable Assessed Value Rank
Percentage of Total Taxable
Assessed Value
Taxable Assessed
Value Rank
Percentage of Total Taxable
Assessed Value
Ross Distribution Inc 190,289,298$ 1 3.66% -$ 0.00%
DB RREEF Perris California 137,356,033 2 2.64% - 0.00%
Western A West CA LLC 86,580,918 3 1.67% - 0.00%
Lowes HIW Inc 84,706,333 4 1.63% 79,628,687 2 1.63%
O R E Industrial 79,703,620 5 1.53% - 0.00%
Stratford Ranch 72,786,761 6 1.40% - 0.00%
Duke Realty LP 66,650,240 7 1.28% - 0.00%
HD California DFDC Landlord 64,621,372 8 1.24% - 0.00%
GM Gabrych Family LP 59,734,743 9 1.15% - 0.00%
Home Depot USA Inc 43,727,774 10 0.84% - 0.00%
Centex Homes - 0.00% 107,600,268 1 2.21%
Wachovia Dev Corporation - 0.00% 72,203,222 3 1.48%
Ross Dress For Less Inc - 0.00% 34,908,623 4 0.72%
Ranch at Green Valley - 0.00% 30,489,708 5 0.63%
KB Home Coastal Inc - 0.00% 27,107,096 6 0.56%
Courdures Family LP - 0.00% 26,261,195 7 0.54%
Rubio Holdings - 0.00% 22,600,000 8 0.46%
First Industrial - 0.00% 21,878,771 9 0.45%
Perris Industrial - 0.00% 21,391,140 10 0.44%
Totals 886,157,092$ 17.05% 444,068,710$ 9.11%
Source: HdL Coren & Cone, Riverside County Assessor 2016/17 & 2007/08 Combined Tax Rolls and SBE Non Unitary Tax Roll
Taxpayer
2008
City of PerrisPrincipal Property Taxpayers
June 30, 2017(in thousands of dollars)
Current Year and Nine Years Ago
2017
146
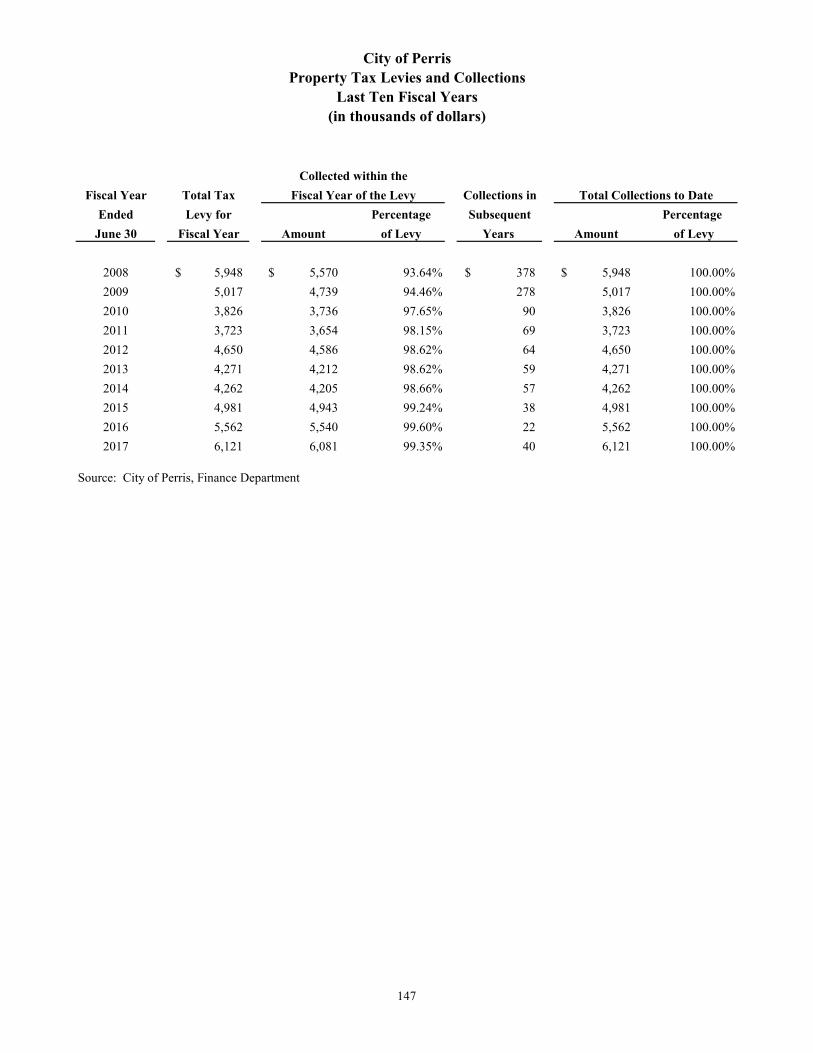
Fiscal Year Total Tax Collections in
Ended Levy for Percentage Subsequent Percentage
June 30 Fiscal Year Amount of Levy Years Amount of Levy
2008 5,948$ 5,570$ 93.64% 378$ 5,948$ 100.00%
2009 5,017 4,739 94.46% 278 5,017 100.00%
2010 3,826 3,736 97.65% 90 3,826 100.00%
2011 3,723 3,654 98.15% 69 3,723 100.00%
2012 4,650 4,586 98.62% 64 4,650 100.00%
2013 4,271 4,212 98.62% 59 4,271 100.00%
2014 4,262 4,205 98.66% 57 4,262 100.00%
2015 4,981 4,943 99.24% 38 4,981 100.00%
2016 5,562 5,540 99.60% 22 5,562 100.00%
2017 6,121 6,081 99.35% 40 6,121 100.00%
Source: City of Perris, Finance Department
Fiscal Year of the Levy Total Collections to Date
(in thousands of dollars)
City of PerrisProperty Tax Levies and Collections
Last Ten Fiscal Years
Collected within the
147
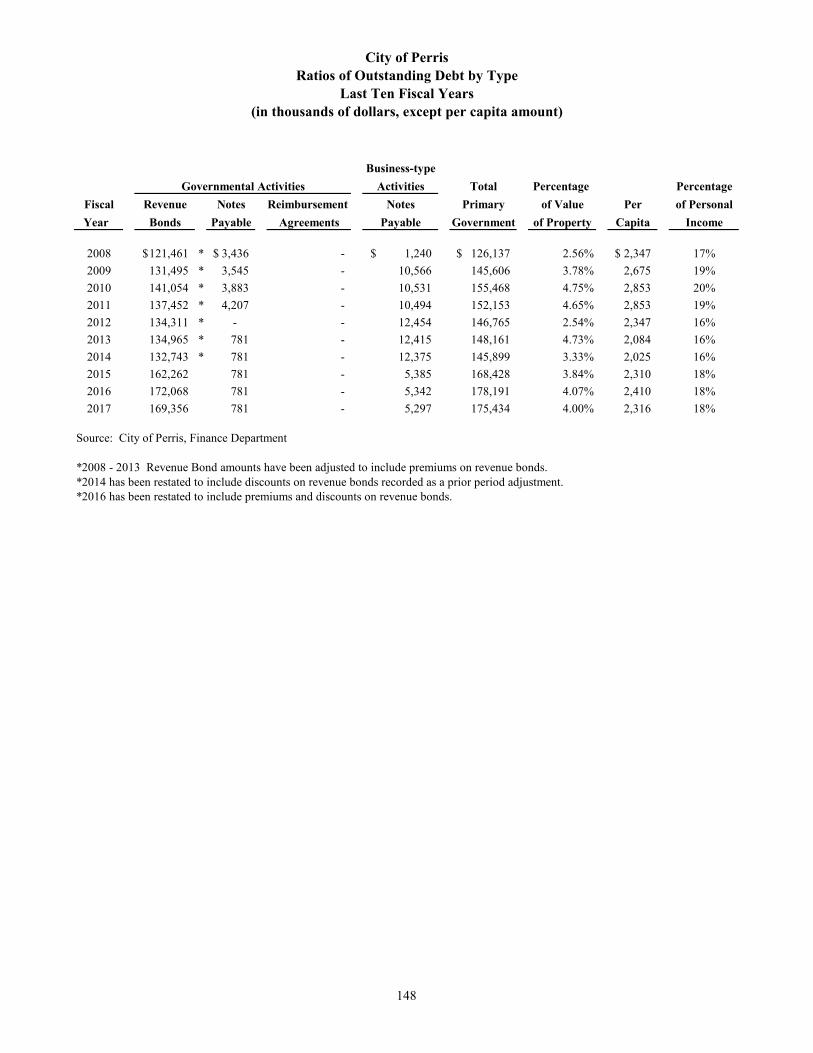
Business-type
Activities Total Percentage Percentage
Fiscal Revenue Notes Reimbursement Notes Primary of Value Per of Personal
Year Bonds Payable Agreements Payable Government of Property Capita Income
2008 121,461$ * 3,436$ - 1,240$ 126,137$ 2.56% 2,347$ 17%
2009 131,495 * 3,545 - 10,566 145,606 3.78% 2,675 19%
2010 141,054 * 3,883 - 10,531 155,468 4.75% 2,853 20%
2011 137,452 * 4,207 - 10,494 152,153 4.65% 2,853 19%
2012 134,311 * - - 12,454 146,765 2.54% 2,347 16%
2013 134,965 * 781 - 12,415 148,161 4.73% 2,084 16%
2014 132,743 * 781 - 12,375 145,899 3.33% 2,025 16%
2015 162,262 781 - 5,385 168,428 3.84% 2,310 18%
2016 172,068 781 - 5,342 178,191 4.07% 2,410 18%
2017 169,356 781 - 5,297 175,434 4.00% 2,316 18%
Source: City of Perris, Finance Department
*2008 - 2013 Revenue Bond amounts have been adjusted to include premiums on revenue bonds.*2014 has been restated to include discounts on revenue bonds recorded as a prior period adjustment.
Governmental Activities
City of PerrisRatios of Outstanding Debt by Type
Last Ten Fiscal Years(in thousands of dollars, except per capita amount)
*2016 has been restated to include premiums and discounts on revenue bonds.
148

Percentage Share of
DIRECT DEBT: Applicable Overlapping Debt
City of Perris - Perris Redevelopment Agency Loan 100.000% 781,370$
Perris Financing Authority - Revenue Bonds 100.000% 69,485,000
Perris Joint Powers Authority - Revenue Bonds 100.000% 99,500,000
Premiums and Discounts on Revenue Bonds (Net) 370,700
TOTAL DIRECT DEBT 170,137,070$
OVERLAPPING TAX AND ASSESSMENT DEBT:
Metropolitan Water District 0.201% 150,559$
Eastern Municipal Water District, I.D. U8 0.000% -
Eastern Municipal Water District, I.D. U9 100.000% 2,707,000
Riverside County Flood Control and Water Conservation District, Zone 4 11.561% 2,165,375
Mount San Jacinto Community College District 2.712% 1,734,324
Riverside City Community College District 3.229% 8,465,299
Val Verde Unified School District 41.306% 51,531,915
Perris Union High School District 15.125% 16,639,651
Menifee Union School District 0.075% 50,666
Perris School District 71.237% 21,172,521
City of Perris Community Facilities Districts 100.000% 153,340,000
Romoland School District Community Facilities District No. 2001-1 100.000% 3,350,000
Val Verde Unified School District Community Facilities Districts 100.000% 4,150,000
Perris Union High School District Community Facilities Districts 1.146% 9,709,139
City of Perris 100.000% -
TOTAL GROSS OVERLAPPING TAX AND ASSESSMENT DEBT 275,166,449$
OVERLAPPING GENERAL FUND OBLIGATION DEBT:
Riverside County General Fund Obligations 2.075% 17,618,937$
Riverside County Pension Oblications 2.075% 5,945,601
Val Verde Unified School District Certificates of Participation 41.306% 28,050,905
Perris Union High School District General Fund Obligations 15.125% 1,191,409
Menifee Union School District Certificates of Participation 0.075% 21,499
Perris School District Certificates of Participation 71.237% 5,136,188
TOTAL GROSS OVERLAPPING GENERAL FUND OBLIGATION DEBT 57,964,539$
Less: Riverside County self-supporting obligations 100,580
TOTAL NET OVERLAPPING GENERAL FUND OBLIGATION DEBT 57,863,959$
OVERLAPPING TAX INCREMENT DEBT (SUCCESSORY AGENCY) 100.000% 65,580,000
TOTAL OVERLAPPING DEBT (NET) 398,610,408$
GROSS COMBINED TOTAL DEBT (1) 568,848,058$ (2)
NET COMBINED TOTAL DEBT 568,747,478$
Source: California Municipal Statistics. Inc., City of Perris Finance Department
(1) Percentage of overlapping agency's assessed valuation located within the boundaries of the City.
(2) Excludes tax and revenue anticipation notes, enterprise revenue, mortgage revenue and
non-bonded capital lease obligations. Qualified Zone Acadamy Bonds are inlcuded based on principal due at maturity.
City of PerrisDirect and Overlapping Governmental Activities Debt
As of June 30, 2017
149
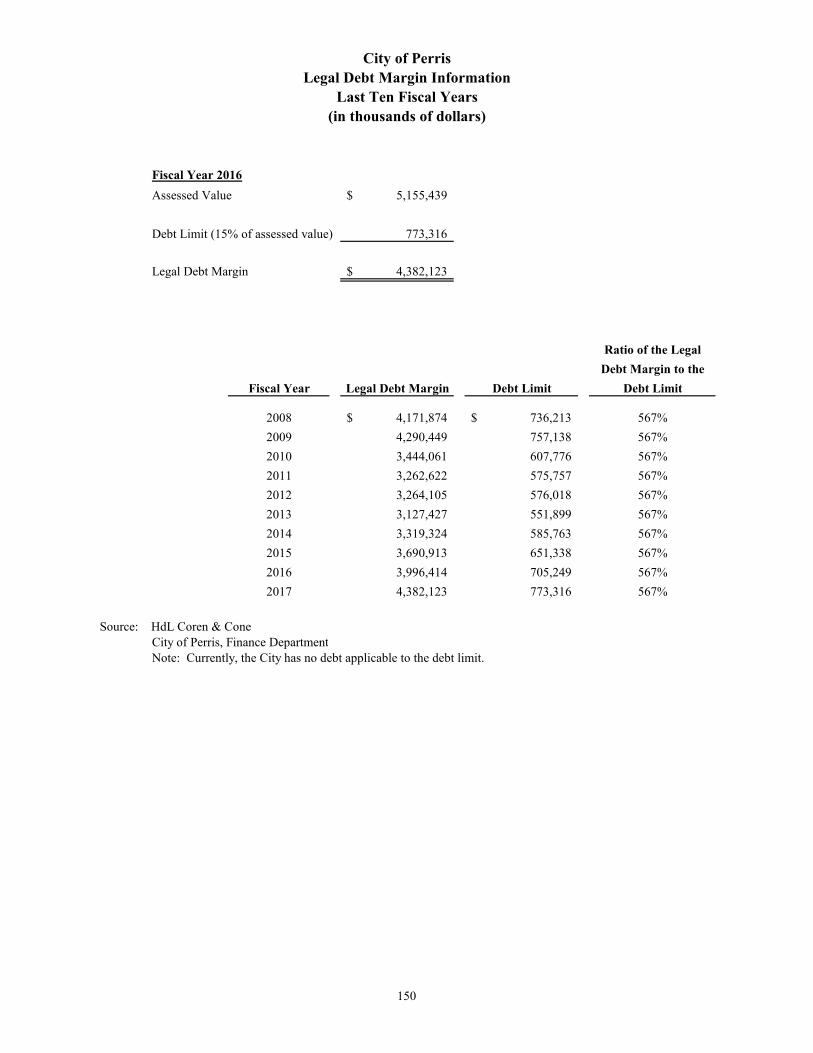
Fiscal Year 2016
Assessed Value 5,155,439$
Debt Limit (15% of assessed value) 773,316
Legal Debt Margin 4,382,123$
Ratio of the Legal
Debt Margin to the
Fiscal Year Legal Debt Margin Debt Limit Debt Limit
2008 4,171,874$ 736,213$ 567%
2009 4,290,449 757,138 567%
2010 3,444,061 607,776 567%
2011 3,262,622 575,757 567%
2012 3,264,105 576,018 567%
2013 3,127,427 551,899 567%
2014 3,319,324 585,763 567%
2015 3,690,913 651,338 567%
2016 3,996,414 705,249 567%
2017 4,382,123 773,316 567%
Source: HdL Coren & ConeCity of Perris, Finance DepartmentNote: Currently, the City has no debt applicable to the debt limit.
Last Ten Fiscal Years(in thousands of dollars)
City of PerrisLegal Debt Margin Information
150

Sewer Less: Net
Fiscal Charges Operating Available
Year and Other Expenses Revenue Principal Interest Coverage
2008 1,602$ 1,321$ 281$ 33$ 44$ 364.94%
2009 1,493 1,497 (4) 34 42 -5.26%
2010 1,559 1,442 117 35 41 153.95%
2011 1,619 1,598 21 37 40 27.27%
2012 1,678 1,652 26 38 39 33.77%
2013 1,734 1,524 210 39 37 276.32%
2014 1,850 1,593 257 40 36 338.16%
2015 1,820 1,837 (17) 42 35 -22.08%
2016 1,934 1,867 67 43 33 88.16%
2017 2,039 2,103 (64) 45 32 -83.12%
Source: City of Perris, Finance Department
Note: Details regarding the government's outstanding debt can be found in the notes to the financial
statements. Sewer Charges and Other and Water Charges and Other include investment Income.
Operating expenses do not include interest or depreciation.
Page 1
City of PerrisPledged Revenue Coverage
Last Ten Fiscal Years
Debt Service
(in thousands of dollars)
Sewer Revenue Bonds
151

Water Less: Net
Fiscal Charges Operating Available
Year and Other Expenses Revenue Principal Interest Coverage
2008 2,086$ 2,042$ 44$ 322$ 8$ -
2009 2,039 2,314 (275) - - -
2010 2,374 2,745 (371) - - -
2011 2,588 2,390 198 - - -
2012 2,693 2,507 186 - - -
2013 2,809 2,585 224 - - -
2014 3,112 2,814 298 - - -
2015 2,786 2,776 10 - - -
2016 2,506 2,489 17 - - -
2017 2,692 2,856 (164) - - -
Source: City of Perris, Finance Department
Note: Details regarding the government's outstanding debt can be found in the notes to the financial
statements. Sewer Charges and Other and Water Charges and Other include investment Income.
Operating expenses do not include interest or depreciation.
City of PerrisPledged Revenue Coverage
Last Ten Fiscal YearsPage 2
Debt Service
Water Revenue Bonds
(in thousands of dollars)
152
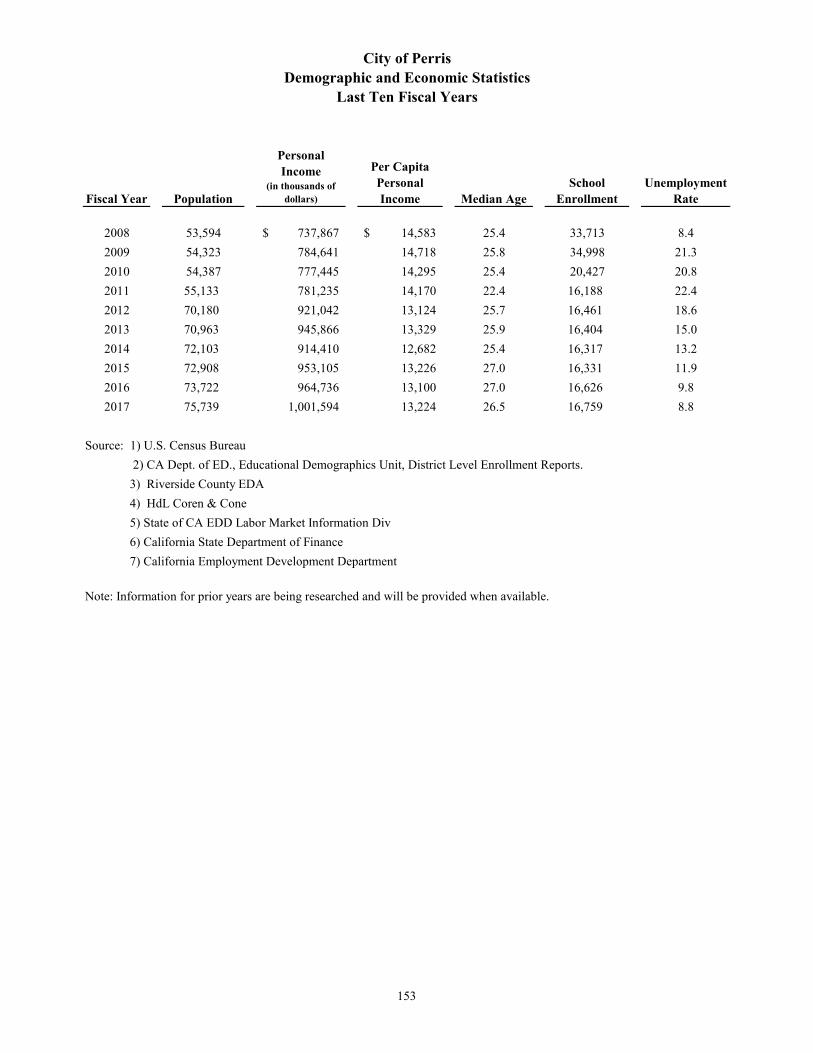
Fiscal Year Population
Personal Income
(in thousands of dollars)
Per Capita Personal Income Median Age
School Enrollment
Unemployment Rate
2008 53,594 737,867$ 14,583$ 25.4 33,713 8.4
2009 54,323 784,641 14,718 25.8 34,998 21.3
2010 54,387 777,445 14,295 25.4 20,427 20.8
2011 55,133 781,235 14,170 22.4 16,188 22.4
2012 70,180 921,042 13,124 25.7 16,461 18.6
2013 70,963 945,866 13,329 25.9 16,404 15.0
2014 72,103 914,410 12,682 25.4 16,317 13.2
2015 72,908 953,105 13,226 27.0 16,331 11.9
2016 73,722 964,736 13,100 27.0 16,626 9.8
2017 75,739 1,001,594 13,224 26.5 16,759 8.8
Source: 1) U.S. Census Bureau
2) CA Dept. of ED., Educational Demographics Unit, District Level Enrollment Reports.
3) Riverside County EDA
4) HdL Coren & Cone
5) State of CA EDD Labor Market Information Div
6) California State Department of Finance
7) California Employment Development Department
Note: Information for prior years are being researched and will be provided when available.
Demographic and Economic StatisticsLast Ten Fiscal Years
City of Perris
153

Employees Rank
Percentage of Total City
Employment Employees Rank
Percentage of Total City
Employment
Ross Stores Inc. 1,900 1 6.38% --- ---
Perris Union High School District 919 2 3.08% --- ---
Lowe's CA Regional Distribution Center 756 3 2.54% --- ---
Eastern Municipal Water District 604 5 2.03% 1,000 2 ---
Perris Elementary School District 750 4 2.52% --- ---
NFI Industries (3) 551 6 1.85% --- ---
Wal-Mart 0.00% 250 5 ---
California Trus CO Inc* 370 8 1.24% --- ---
CR&R Waste - Perris 275 10 0.92% --- ---
National Stores Inc (aka Fallas, Factory 2 U) (1) 485 7 1.63% --- ---
Wayfair Distribution Center (1) 330 9 1.11%
Pw EagleInc. 267 4 ---
Coreslab Structures Inc. 200 6 ---
Clayton Homes 200 7 ---
Starcrest --- --- 1,400 1 ---
Silver Creek Industries 175 8 ---
Navigator Yachts 150 9 ---
National RV Holdings Inc --- --- 850 3 ---
Stater Brothers 120 10 ---
Totals 6,940$ 23.30% 4,612$ 0.00%
Source: 1) Muniservices, LLC
2) City of Perris, Finance Department (2017 CAFR)
3) City of Perris, Finance Department (2008 CAFR)
Notes
*2016-17 - Perris Location only. 2015-16 - 3 locations: Perris, Modesto, Sanger.** Total City Labor Force provided by EDD Labor Force Data.
Total Employment Numbers2017 City Totals 29,800$ **2016 City Totals 29,400 2015 City Totals 16,100 2013 City Totals 17,400 2009 City Totals 18,045 2007 City Totals 14,750
(1) Includes sub-contracted employees from temp services
(2) Includes classified, certificated and admin
(3) Supply chain management for Hanes, Whirlpool and Amazon
City of PerrisPrincipal Employers
Current Year and Nine Years Ago
Employer
2017 2008
154

This page intentionally left blank
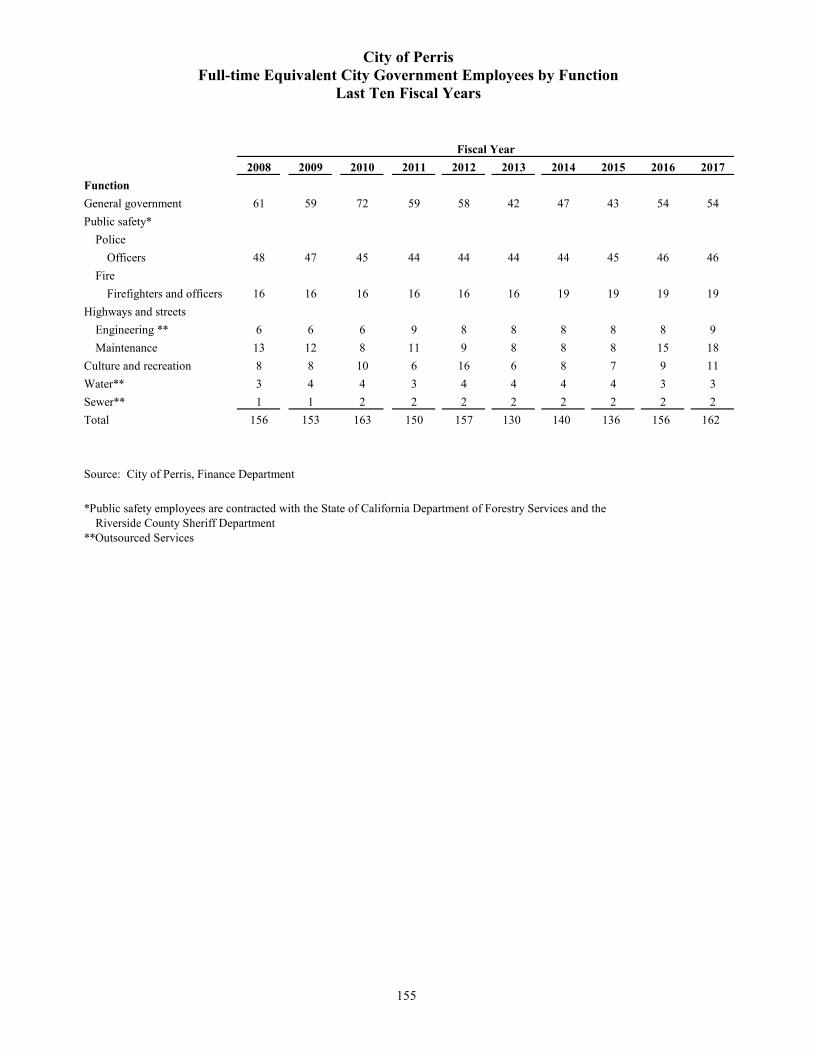
2008 2009 2010 2011 2012 2013 2014 2015 2016 2017
Function
General government 61 59 72 59 58 42 47 43 54 54
Public safety*
Police
Officers 48 47 45 44 44 44 44 45 46 46
Fire
Firefighters and officers 16 16 16 16 16 16 19 19 19 19
Highways and streets
Engineering ** 6 6 6 9 8 8 8 8 8 9
Maintenance 13 12 8 11 9 8 8 8 15 18
Culture and recreation 8 8 10 6 16 6 8 7 9 11
Water** 3 4 4 3 4 4 4 4 3 3
Sewer** 1 1 2 2 2 2 2 2 2 2
Total 156 153 163 150 157 130 140 136 156 162
Source: City of Perris, Finance Department
*Public safety employees are contracted with the State of California Department of Forestry Services and theRiverside County Sheriff Department
**Outsourced Services
City of PerrisFull-time Equivalent City Government Employees by Function
Last Ten Fiscal Years
Fiscal Year
155
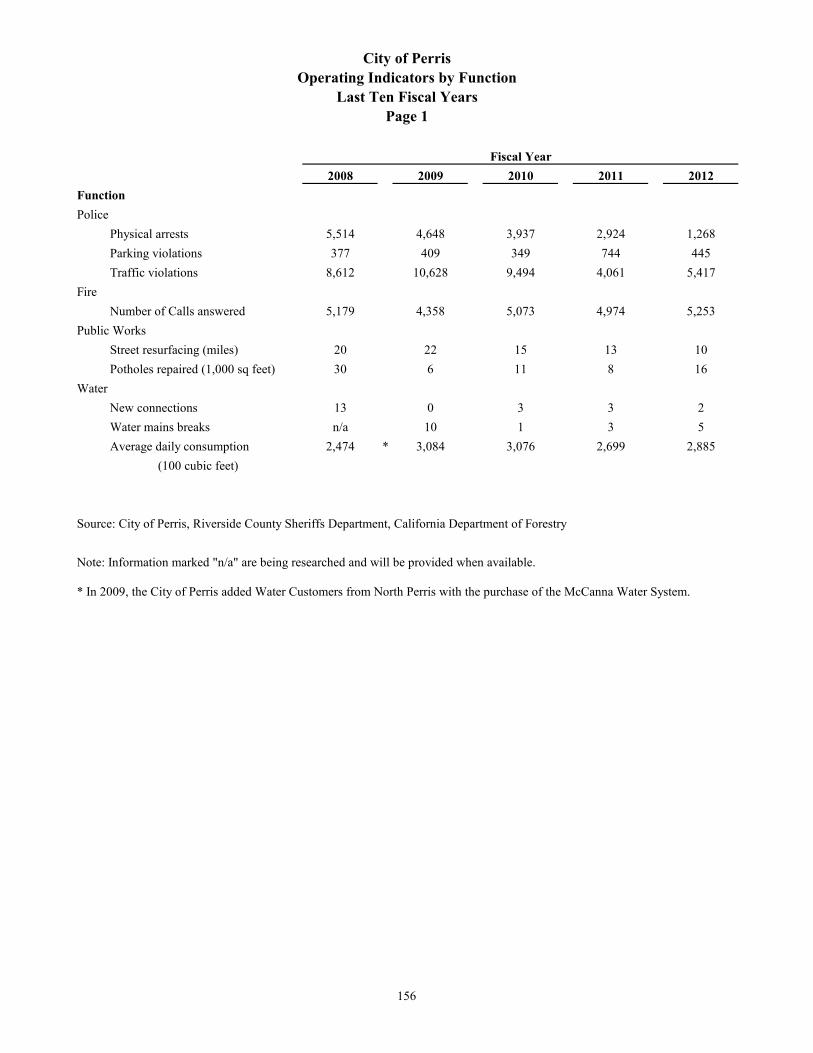
2008 2009 2010 2011 2012
Function
Police
Physical arrests 5,514 4,648 3,937 2,924 1,268
Parking violations 377 409 349 744 445
Traffic violations 8,612 10,628 9,494 4,061 5,417
Fire
Number of Calls answered 5,179 4,358 5,073 4,974 5,253
Public Works
Street resurfacing (miles) 20 22 15 13 10
Potholes repaired (1,000 sq feet) 30 6 11 8 16
Water
New connections 13 0 3 3 2
Water mains breaks n/a 10 1 3 5
Average daily consumption 2,474 * 3,084 3,076 2,699 2,885
(100 cubic feet)
Source: City of Perris, Riverside County Sheriffs Department, California Department of Forestry
Note: Information marked "n/a" are being researched and will be provided when available.
* In 2009, the City of Perris added Water Customers from North Perris with the purchase of the McCanna Water System.
City of PerrisOperating Indicators by Function
Last Ten Fiscal YearsPage 1
Fiscal Year
156

2013 2014 2015 2016 2017
Function
Police
Physical arrests 1,590 1,823 1,445 1,321 1,373
Parking violations 638 582 325 177 149
Traffic violations 3,493 5,087 5,624 6,412 6,586
Fire
Number of Calls answered 5,714 5,762 5,892 6,773 8,763
Public Works
Street resurfacing (miles) 14 16 32 22 16
Potholes repaired (1,000 sq feet) 320 336 280 16 26
Water
New connections 6 5 10 11 13
Water mains breaks 2 2 3 4 0
Average daily consumption 3,683 3,165 2,861 2,457 2,624
(100 cubic feet)
Fiscal Year
157
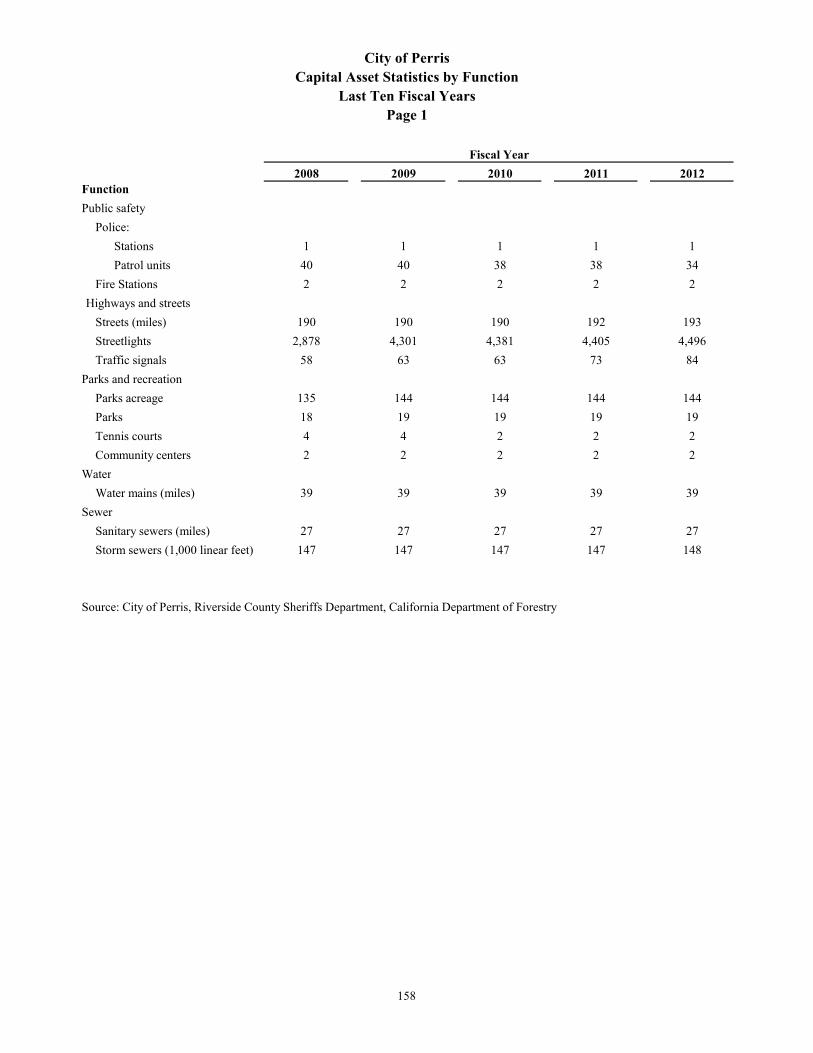
2008 2009 2010 2011 2012Function
Public safety
Police:
Stations 1 1 1 1 1
Patrol units 40 40 38 38 34
Fire Stations 2 2 2 2 2
Highways and streets
Streets (miles) 190 190 190 192 193
Streetlights 2,878 4,301 4,381 4,405 4,496
Traffic signals 58 63 63 73 84
Parks and recreation
Parks acreage 135 144 144 144 144
Parks 18 19 19 19 19
Tennis courts 4 4 2 2 2
Community centers 2 2 2 2 2
Water
Water mains (miles) 39 39 39 39 39
Sewer
Sanitary sewers (miles) 27 27 27 27 27
Storm sewers (1,000 linear feet) 147 147 147 147 148
Source: City of Perris, Riverside County Sheriffs Department, California Department of Forestry
City of PerrisCapital Asset Statistics by Function
Last Ten Fiscal YearsPage 1
Fiscal Year
158
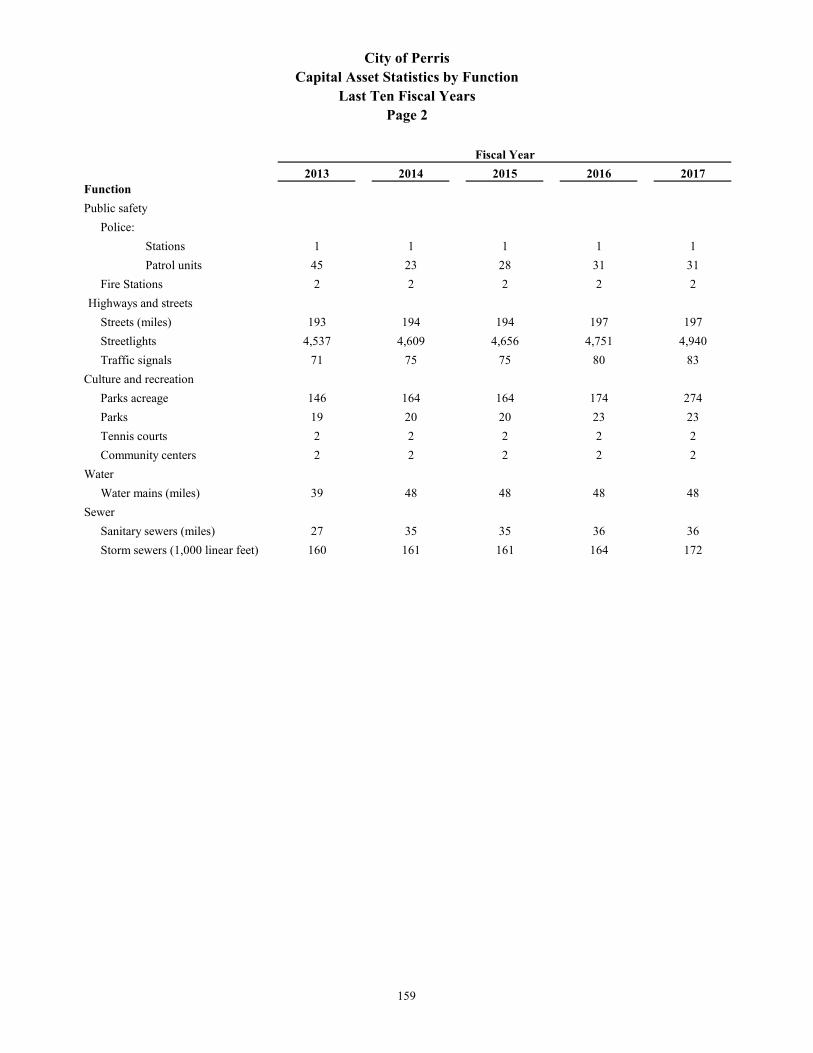
2013 2014 2015 2016 2017Function
Public safety
Police:
Stations 1 1 1 1 1
Patrol units 45 23 28 31 31
Fire Stations 2 2 2 2 2
Highways and streets
Streets (miles) 193 194 194 197 197
Streetlights 4,537 4,609 4,656 4,751 4,940
Traffic signals 71 75 75 80 83
Culture and recreation
Parks acreage 146 164 164 174 274
Parks 19 20 20 23 23
Tennis courts 2 2 2 2 2
Community centers 2 2 2 2 2
Water
Water mains (miles) 39 48 48 48 48
Sewer
Sanitary sewers (miles) 27 35 35 36 36
Storm sewers (1,000 linear feet) 160 161 161 164 172
Fiscal Year
City of PerrisCapital Asset Statistics by Function
Last Ten Fiscal YearsPage 2
159