CITY OF PEMBROKE PINES, FLORIDA CHARTER SCHOOLS rpts/2017 city of pembroke... · city of pembroke...
61
CITY OF PEMBROKE PINES, FLORIDA CHARTER SCHOOLS SPECIAL PURPOSE FINANCIAL STATEMENTS FOR THE FISCAL YEAR ENDED JUNE 30, 2017 (With Independent Auditors’ Reports Thereon)
Transcript of CITY OF PEMBROKE PINES, FLORIDA CHARTER SCHOOLS rpts/2017 city of pembroke... · city of pembroke...

CITY OF PEMBROKE PINES, FLORIDA
CHARTER SCHOOLS
SPECIAL PURPOSE FINANCIAL STATEMENTS FOR THE FISCAL YEAR ENDED JUNE 30, 2017
(With Independent Auditors’ Reports Thereon)
CITY OF PEMBROKE PINES, FLORIDA
CHARTER SCHOOLS
TABLE OF CONTENTS PAGE INDEPENDENT AUDITORS’ REPORT 1-3 MANAGEMENT’S DISCUSSION AND ANALYSIS
(REQUIRED SUPPLEMENTARY INFORMATION) 4-11 SPECIAL PURPOSE FINANCIAL STATEMENTS: Government-wide Financial Statements:
Statement of Net Position 12 Statement of Activities 13
Fund Financial Statements:
Balance Sheet – Governmental Fund 14 Statement of Revenues, Expenditures and Changes in Fund Balances – Governmental Funds 15 Reconciliation of the Statement of Revenues, Expenditures and Changes in Fund Balances
of Governmental Funds to the Statement of Activities 16 Notes to Special Purpose Financial Statements 17-45 REQUIRED SUPPLEMENTARY INFORMATION (OTHER THAN MD&A):
Budgetary Comparison Schedules 46-48 Notes to Budgetary Comparison Schedules Pension Schedules Schedule of Contributions
49 50-52
53 SUPPLEMENTARY AUDITORS’ REPORTS: Independent Auditors’ Report on Internal Control over Financial Reporting and on
Compliance and Other Matters Based on an Audit of Financial Statements Performed in Accordance with Government Auditing Standards 54-55
Management Letter in Accordance with the Rules of the Auditor General of the State of Florida 56-58


-4-
MANAGEMENT'S DISCUSSION AND ANALYSIS
As management of the Charter Schools, we offer readers of the Charter Schools’ special purpose financial statements this narrative overview and analysis of the financial activities of the Charter Schools for the twelve-month period ended June 30, 2017. We encourage readers to consider the information presented here in conjunction with the Charter Schools’ special purpose financial statements, which follow this section. Financial Highlights The liabilities and deferred inflows of resources of the Charter Schools as reported in the
government-wide financial statements exceeded their assets and deferred outflows of resources at the close of the current fiscal year by ($7,053,678) (net position) which decreased by $1,401,302 from prior year.
As of the close of the current fiscal year, the Charter Schools’ governmental funds’ financial statements reported combined ending fund balances of $1,810,151 or 4.1% of total expenditures. This represents a decrease of $930,625 (-34.0%) from prior year. The entire fund balance is assigned for rent payments.
Overview of the Special Purpose Financial Statements This discussion and analysis is intended to serve as an introduction to the City of Pembroke Pines Charter Schools’ special purpose financial statements. The Charter Schools’ special purpose financial statements consist of three components: 1) government-wide financial statements, 2) fund financial statements, and 3) notes to special purpose statements. Government-wide financial statements. The government-wide financial statements are designed to provide readers with a broad overview of the Charter Schools’ finances, in a manner similar to a private-sector business. The statement of net position presents information on all of the Charter Schools’ assets, deferred outflows of resources, liabilities, and deferred inflows of resources, with the difference between the two reported as net position. Over time, increases or decreases in net position may serve as a useful indicator of whether the financial position of the Charter Schools is improving or deteriorating. The statement of activities presents information for all of the current year's revenues and expenses regardless of when cash is received or paid. Thus, revenues and expenses are reported in this statement for some items that will eventually result in cash flows in future fiscal periods. The Charter Schools’ government-wide financial statements distinguish the functions of the Charter Schools as being principally supported by local revenues (FTE dollars through the Broward County School Board) (governmental activities) as opposed to business-type activities that are intended to recover all or a significant portion of their costs through user fees and charges. The Charter Schools have no business-type activities and no component units for which they are financially accountable. The government-wide financial statements can be found on pages 12-13 of this report.

-5-
Fund financial statements. A fund is a grouping of related accounts that is used to maintain control over resources that have been segregated for specific activities or objectives. The Charter Schools, like other state and local governments, use fund accounting to ensure and demonstrate compliance with finance-related requirements. All of the funds used by the Charter Schools are considered governmental fund types, and are special revenues funds of the City of Pembroke Pines. Governmental funds. Governmental funds are used to account for essentially the same functions reported as governmental activities in the government-wide financial statements. However, unlike the government-wide financial statements, governmental fund financial statements focus on near-term inflows and outflows of spendable resources, as well as on balances of spendable resources available at the end of the fiscal year. Such information may be useful in evaluating a government's near-term financing requirements. Because the focus of governmental funds is narrower than that of the government-wide financial statements, it is useful to compare the information presented for governmental funds with similar information presented for governmental activities in the government-wide financial statements. By doing so, readers may better understand the long-term impact of the government's near-term financing decisions. Both the governmental funds balance sheet and the governmental funds statement of revenues, expenditures and changes in fund balances provide a reconciliation to facilitate this comparison between governmental funds and governmental activities. The Charter Schools maintain three funds (governmental funds). Information is presented separately in the governmental funds balance sheet and in the governmental funds statement of revenues, expenditures and changes in fund balances. The Charter Schools adopt an annual appropriated budget. Budgetary comparison schedules and notes has been provided to demonstrate compliance with these budgets. The governmental funds financial statements can be found on pages 14-16 of this report. Notes to special purpose financial statements. The notes provide additional information that is essential to a complete understanding of the data provided in the government-wide and funds financial statements. The notes to special purpose financial statements can be found on pages 17-45 of this report. Required Supplementary Information. The information in this section is required by the Governmental Accounting Standards Board (GASB). It consists of the Management’s Discussion and Analysis (MD&A) comprising pages 4-11, the budgetary comparison schedules, the notes to budgetary comparison schedules, pension schedules and schedule of contributions which can be found on pages 46-53. Supplementary Auditors’ Reports. This section includes the following:
Independent Auditors’ Report on Internal Control over Financial Reporting and on Compliance and Other Matters Based on an Audit of Financial Statements Performed in Accordance with Government Auditing Standards, which can be found on pages 54-55.
Management Letter in Accordance with the Rules of the Auditor General of the State of
Florida, which can be found on pages 56-58.
-6-
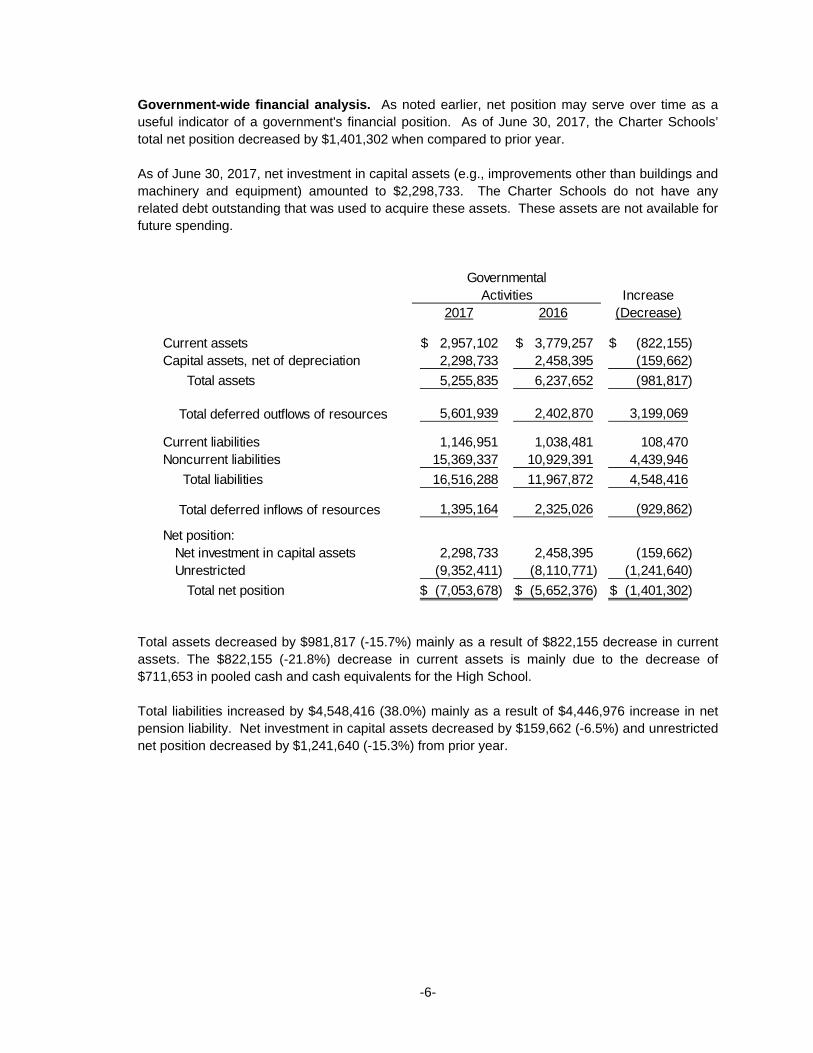
Government-wide financial analysis. As noted earlier, net position may serve over time as a useful indicator of a government's financial position. As of June 30, 2017, the Charter Schools’ total net position decreased by $1,401,302 when compared to prior year. As of June 30, 2017, net investment in capital assets (e.g., improvements other than buildings and machinery and equipment) amounted to $2,298,733. The Charter Schools do not have any related debt outstanding that was used to acquire these assets. These assets are not available for future spending.
Increase2017 2016 (Decrease)
Current assets 2,957,102$ 3,779,257$ (822,155)$ Capital assets, net of depreciation 2,298,733 2,458,395 (159,662)
Total assets 5,255,835 6,237,652 (981,817)
Total deferred outflows of resources 5,601,939 2,402,870 3,199,069
Current liabilities 1,146,951 1,038,481 108,470 Noncurrent liabilities 15,369,337 10,929,391 4,439,946
Total liabilities 16,516,288 11,967,872 4,548,416
Total deferred inflows of resources 1,395,164 2,325,026 (929,862)
Net position: Net investment in capital assets 2,298,733 2,458,395 (159,662) Unrestricted (9,352,411) (8,110,771) (1,241,640)
Total net position (7,053,678)$ (5,652,376)$ (1,401,302)$
GovernmentalActivities
Total assets decreased by $981,817 (-15.7%) mainly as a result of $822,155 decrease in current assets. The $822,155 (-21.8%) decrease in current assets is mainly due to the decrease of $711,653 in pooled cash and cash equivalents for the High School. Total liabilities increased by $4,548,416 (38.0%) mainly as a result of $4,446,976 increase in net pension liability. Net investment in capital assets decreased by $159,662 (-6.5%) and unrestricted net position decreased by $1,241,640 (-15.3%) from prior year.

-7-
Governmental activities. The Charter Schools’ total net position at the end of the year amounted to ($7,053,678), a decrease of $1,401,302 (-24.8%) from the previous fiscal year. The total cost of all governmental activities this year was $44,757,805. Key elements of these changes in net position are as follows:
Increase
2017 2016 (Decrease)Revenues: Program revenues: Charges for services 4,125,908$ 4,742,718$ (616,810)$ Operating grants and contributions 2,078,913 4,451,082 (2,372,169) General revenues: FTE non-specific revenues 36,166,333 35,114,832 1,051,501 Unrestricted investment earnings 4,418 49,867 (45,449) Rental income 937,743 972,698 (34,955) E-rate program 23,585 - 23,585 ICMA forfeiture revenue 19,603 17,020 2,583
Total revenues 43,356,503 45,348,217 (1,991,714)
Expenses: Instructional services 23,587,640 23,344,121 243,519 Rent 5,516,886 5,698,139 (181,253) Instructional support services 1,781,553 1,638,844 142,709 Food services 2,149,197 2,066,172 83,025 Student transportation services 1,799,212 1,804,145 (4,933) Operation and maintenance of school 5,264,410 5,582,843 (318,433) School administration 3,962,841 3,631,199 331,642 Other 696,066 575,723 120,343
Total expenses 44,757,805 44,341,186 416,619
Change in net position (1,401,302) 1,007,031 (2,408,333)
Net position, beginning (5,652,376) (6,659,407) 1,007,031
Net position - ending (7,053,678)$ (5,652,376)$ (1,401,302)$
GovernmentalActivities
The Charter Schools’ total revenues decreased by $1,991,714 (-4.4%) during the year. The $1,991,174 decrease is mainly due to a $2,372,169 (-53.3%) decrease in operating grants and contributions and $616,810 (-13.0%) decrease in charges for services which are offset by $1,051,501 (3.0%) increase in FTE non-specific revenues.

-8-
The $2,372,169 decrease in operating grants and contributions is mainly due to a $1,578,173 bond technology grant received in prior year which was not received in current year. The $616,818 decrease in charges for services is mainly due to a $718,594 decrease in public education capital outlay. The increase of $1,051,501 in FTE non-specific revenues is mainly as a result of a rate increase in the Base Student Allocation (BSA) from the State of Florida and an increase in the number of full time equivalents by 18 from prior year. The rate was raised from $4,154 per student in fiscal 2015-16 to $4,161 per student in fiscal year 2016-17. Total expenses before transfers increased by $416,619 (0.9%) from prior year. This increase was mainly due to an increase in personnel costs including benefits of approximately $1,724,005 (6.7%) which is offset by a decrease in operating expenses of approximately $760,861 (-4.2%). The $1,724,005 increase in personnel costs including benefits is mainly attributed to the increase of approximately $1,053,590 (142.3%) in pension expense, $532,728 (15.4%) increase in health insurance, and $94,847 in salaries. The increase in salaries is mainly due to the increase in the number of School teachers. The overall decrease in operating expenses was mainly due to the purchase of bond technology opportunity computer equipment and other equipment less than $1,000 of $1,256,418 (-100.0%) in prior year.
Financial analysis of the Charter Schools’ funds. As noted earlier, the Charter Schools use fund accounting to ensure and demonstrate compliance with finance-related legal requirements and segregation for particular purposes. Governmental funds. The focus of the Charter Schools’ governmental funds is to provide information on near-term inflows, outflows, and balances of spendable resources. Such information is useful in assessing the Charter Schools’ financing requirements. Budgetary Highlights For the fiscal year ended June 30, 2017, the Charter Schools had final estimated revenues and appropriations of $44,096,008 and $45,122,874, respectively, excluding other financing sources. Over the course of the year, the Charter Schools made several revisions to budgeted revenues and appropriations. These amendments may fall into one or more of the following categories: Amendments related to grants and new programs. Amendments to revise estimates for state and local revenues based on the latest
information on student attendance. Amendments during the year for unexpected occurrences.
The Charter Elementary Schools, East, West and Central Campuses, made the following amendments to budget: Several amendments were made to increase budgeted revenues totaling $262,404. This was mainly due to an increase of $192,154 in revenues provided by the State for Governor’s A+ funds. Amendments were made decreasing the expenditure budget in the amount of $304,455. These adjustments were made mainly to decrease the budget for the annual true-up adjustment for health, life and workers’ compensation in the amount of $476,859, which is offset by an increase of $192,154 in Governor’s A+ expenditures.

-9-
After appropriations were amended, as described above, actual revenues were under the budgeted revenues by $428,652, and overall actual expenditures were below final budgeted amounts by $326,485 before transfers. The Charter Middle Schools, West and Central Campuses, made the following amendments to budget: Several amendments were made to increase the budgeted revenues totaling $177,891. This was mainly due to an increase of $130,463 in revenues provided by the State for Governor’s A+ funds. Amendments were made decreasing the expenditure budget in the amount of $164,645. These adjustments were made mainly to decrease the budget for the annual true-up adjustment for health, life and workers’ compensation in the amount of $342,536, which is offset by an increase of $130,463 in Governor’s A+ expenditures. After appropriations were amended, as described above, actual revenues were under the budgeted revenues by $449,287, and actual expenditures were below final budgeted amounts by $179,611 before transfers. The Charter High School made the following amendments to budget: Several amendments were made to increase the budgeted revenues totaling $279,169. This was mainly due to an increase of $201,319 in revenues provided by the State for Governor’s A+ funds. Amendments were made decreasing the expenditure budget in the amount of $199,718. These adjustments were made mainly to decrease the budget for the annual true-up adjustment for health, life and workers’ compensation in the amount of $478,887, which is offset by an increase of $201,319 in Governor’s A+ expenditures. After appropriations were amended, as described above, actual revenues were under the budgeted revenues by $436,631, and actual expenditures were below final budgeted amounts by $329,650 before transfers. The Broward Teachers Union Local 1975 approved a salary increase to the Charter Schools teachers 60 days after the fiscal year end of the schools. As a result of these increases, the Charter Schools’ budgets show excess of expenditures over appropriations for some of the line items in the amount of $49,925, $75,524 and $162,307 for Charter Elementary School, Charter Middle School, and Charter High School, respectively. Capital Assets The Charter Schools’ investment in capital assets for its governmental activities as of June 30, 2017 amounted to $2,298,733, net of accumulated depreciation. This investment in capital assets includes improvements other than buildings, and machinery and equipment.
-10-
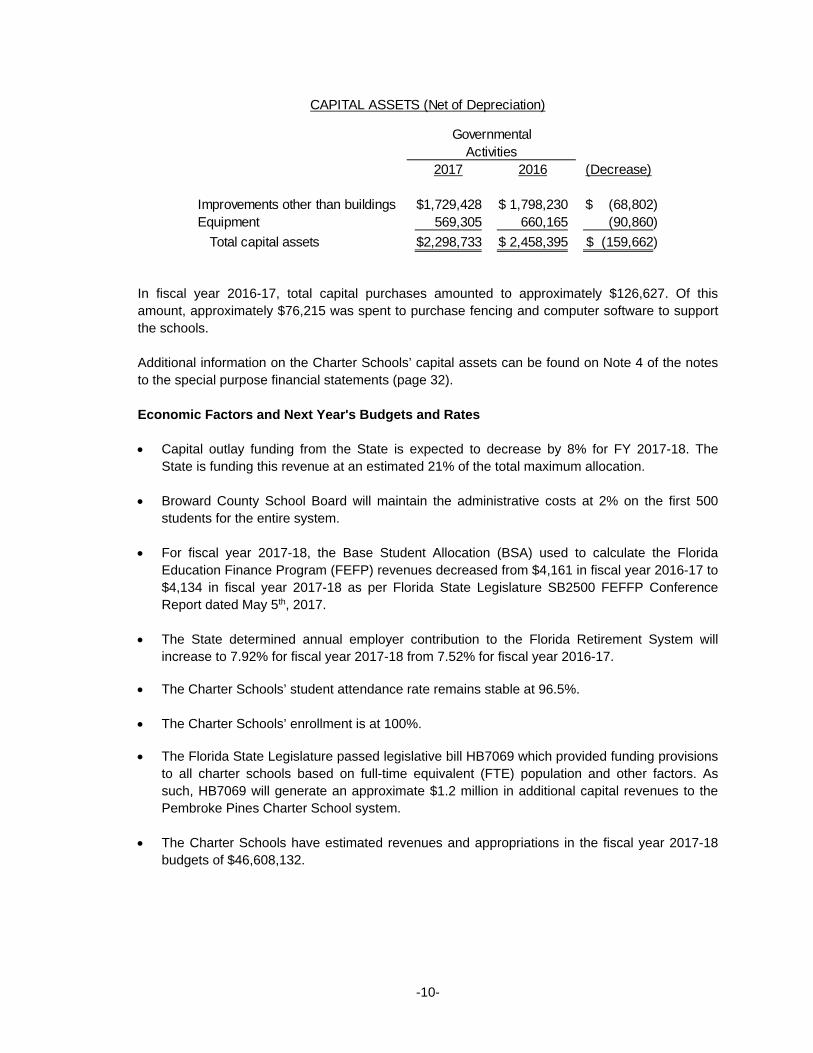
2017 2016 (Decrease)
Improvements other than buildings 1,729,428$ 1,798,230$ (68,802)$ Equipment 569,305 660,165 (90,860)
Total capital assets 2,298,733$ 2,458,395$ (159,662)$
GovernmentalActivities
CAPITAL ASSETS (Net of Depreciation)
In fiscal year 2016-17, total capital purchases amounted to approximately $126,627. Of this amount, approximately $76,215 was spent to purchase fencing and computer software to support the schools. Additional information on the Charter Schools’ capital assets can be found on Note 4 of the notes to the special purpose financial statements (page 32). Economic Factors and Next Year's Budgets and Rates Capital outlay funding from the State is expected to decrease by 8% for FY 2017-18. The
State is funding this revenue at an estimated 21% of the total maximum allocation. Broward County School Board will maintain the administrative costs at 2% on the first 500
students for the entire system. For fiscal year 2017-18, the Base Student Allocation (BSA) used to calculate the Florida
Education Finance Program (FEFP) revenues decreased from $4,161 in fiscal year 2016-17 to $4,134 in fiscal year 2017-18 as per Florida State Legislature SB2500 FEFFP Conference Report dated May 5th, 2017.
The State determined annual employer contribution to the Florida Retirement System will
increase to 7.92% for fiscal year 2017-18 from 7.52% for fiscal year 2016-17.
The Charter Schools’ student attendance rate remains stable at 96.5%. The Charter Schools’ enrollment is at 100%.
The Florida State Legislature passed legislative bill HB7069 which provided funding provisions
to all charter schools based on full-time equivalent (FTE) population and other factors. As such, HB7069 will generate an approximate $1.2 million in additional capital revenues to the Pembroke Pines Charter School system.
The Charter Schools have estimated revenues and appropriations in the fiscal year 2017-18
budgets of $46,608,132.

-11-
Requests for Information This financial report is designed to provide the reader with a general overview of the Charter Schools’ finances, as well as demonstrate accountability for funds the Charter Schools receive. Questions concerning any of the information provided in this report, or requests for additional information, should be addressed to the Office of the City Manager, 601 City Center Way, Pembroke Pines, Florida 33025.

GovernmentalActivities
ASSETS
Pooled cash and cash equivalents 2,696,605$ Due from Broward County 13,984 Due from Federal Government 18,921 Other miscellaneous receivables 227,592 Capital assets being depreciated, net 2,298,733
Total assets 5,255,835
DEFERRED OUTFLOWS OF RESOURCESDeferred outflows related to pension 5,601,939 Total deferred outflows of resources 5,601,939
LIABILITIES
Accrued liabilities 366,869 Unearned revenue 35,096 Deposits 744,986
Noncurrent liabilities: Due within one year 638,155 Due in more than one year 14,731,182
Total liabilities 16,516,288
DEFERRED INFLOWS OF RESOURCESDeferred inflows related to pension 1,395,164 Total deferred inflows of resources 1,395,164
NET POSITION
Net investment in capital assets 2,298,733 Unrestricted (9,352,411)
Total net position (7,053,678)$
CITY OF PEMBROKE PINES CHARTER SCHOOLS
STATEMENT OF NET POSITION
JUNE 30, 2017
See notes to special purpose financial statements.-12-

Net (Expense)
Revenue and
Changes in
Net Position
Operating Total
Charges for Grants and Governmental
Functions/Programs Expenses Services Contributions Activities
Governmental activities:
Instructional services 23,587,640$ -$ 46,700$ (23,540,940)$
Rent 5,516,886 1,483,547 - (4,033,339)
Instructional support services 1,781,553 - - (1,781,553)
Food services 2,149,197 1,441,929 949,979 242,711
Student transportation services 1,799,212 404,184 - (1,395,028)
Operation and maintenance of school 5,264,410 - 507,169 (4,757,241)
School administration 3,962,841 133 - (3,962,708) Other 696,066 796,115 575,065 675,114
Total Charter Schools 44,757,805$ 4,125,908$ 2,078,913$ (38,552,984)
36,166,333
4,418
937,743
23,585
19,603
37,151,682
(1,401,302)
(5,652,376) (7,053,678)$ Net position, ending
FTE non-specific revenues
Unrestricted investment earnings
Rental income
Total general revenues
ICMA forfeitures revenue
E-rate program
Change in net position
Net position, beginning
CITY OF PEMBROKE PINES CHARTER SCHOOLS
STATEMENT OF ACTIVITIES
FISCAL YEAR ENDED JUNE 30, 2017
General revenues:
See notes to special purpose financial statements.-13-

Charter Charter Charter
Elementary Middle High
Schools Schools School Total
ASSETS
Pooled cash and cash equivalents 1,889,821$ 180,129$ 626,655$ 2,696,605$
Due from Broward County - - 13,984 13,984
Due from Federal Government 10,025 6,074 2,822 18,921 Other miscellaneous receivables 52,796 30,155 144,641 227,592
Total assets 1,952,642$ 216,358$ 788,102$ 2,957,102$
LIABILITIES AND FUND BALANCE
Liabilities:
Accrued liabilities 123,210$ 80,814$ 162,845$ 366,869$
Unearned revenue 15,071 8,883 11,142 35,096 Deposits 163,398 124,642 456,946 744,986
Total liabilities 301,679 214,339 630,933 1,146,951
Fund balances: Assigned for rent payments 1,650,963 2,019 157,169 1,810,151
Total fund balances 1,650,963 2,019 157,169 1,810,151
Total liabilities and fund balances 1,952,642$ 216,358$ 788,102$
2,298,733
(797,642)
Deferred outflows and inflows of resources related to pensions are applicable to
future periods and, therefore, are not reported in the funds:
Deferred outflows of resources 5,601,939
Deferred inflows of resources (1,395,164)
Long-term liabilities, such as net pension liability, are not due and payable in the
current period and, therefore, are not reported as a liability in the funds (14,571,695)
(7,053,678)$
Amounts reported for governmental activities in the statement
of net assets are different because:
Capital assets used in governmental activities are not financial
CITY OF PEMBROKE PINES CHARTER SCHOOLS
GOVERNMENTAL FUNDS
JUNE 30, 2017
BALANCE SHEET
Net position of governmental activities (page 12)
resources and, therefore, are not reported in the funds.
Compensated absences, shown as noncurrent liabilities, are not due and payable
in the current period and, therefore, are not reported in the funds.
See notes to special purpose financial statements.-14-

Charter Charter CharterElementary Middle High
Schools Schools School TotalRevenues: Local 15,893,947$ 9,706,166$ 16,184,643$ 41,784,756$ Federal and State grants 419,121 250,520 327,041 996,682
Total revenues 16,313,068 9,956,686 16,511,684 42,781,438
Expenditures: Current: K-3 Basic 5,327,587 - - 5,327,587 4-8 Basic 2,639,097 5,638,514 1,127,676 9,405,287 9-12 Basic - - 6,477,068 6,477,068 Exceptional student program 661,734 591,608 364,498 1,617,840 Vocational 6-12 - - 127,176 127,176 Substitute teachers 163,315 116,563 71,616 351,494 School/other - - 25,406 25,406 Guidance services 220,202 199,690 530,432 950,324 Instructional media services 306,337 268,169 125,420 699,926 ESE specialist - - 77,495 77,495 Instructional staff training service 10,844 12,372 8,677 31,893 School administration 1,710,087 1,057,947 1,168,978 3,937,012 Facilities acquisition and construction 1,291,539 1,228,880 2,996,466 5,516,885 Food services 766,443 564,886 817,869 2,149,198 Student transportation services 666,090 456,556 676,566 1,799,212 Operation of school 1,597,680 1,077,170 2,301,517 4,976,367 Child care supervision 342,550 - 8,205 350,755 Athletics - 28,131 311,445 339,576 Capital outlay 38,762 22,984 64,881 126,627
Total expenditures 15,742,267 11,263,470 17,281,391 44,287,128
Excess (Deficit) of revenues over (under) expenditures 570,801 (1,306,784) (769,707) (1,505,690)
Other financing sources (uses): Transfers in - 1,255,065 - 1,255,065 Transfers out (680,000) - - (680,000)
Total other financing sources (uses) (680,000) 1,255,065 - 575,065
Net change in fund balances (109,199) (51,719) (769,707) (930,625)
Fund balances, beginning 1,760,162 53,738 926,876 2,740,776
Fund balances, ending 1,650,963$ 2,019$ 157,169$ 1,810,151$
CITY OF PEMBROKE PINES CHARTER SCHOOLS
STATEMENT OF REVENUES, EXPENDITURES AND CHANGES IN FUND BALANCESGOVERNMENTAL FUNDS
FISCAL YEAR ENDED JUNE 30, 2017
See notes to special purpose financial statements.-15-
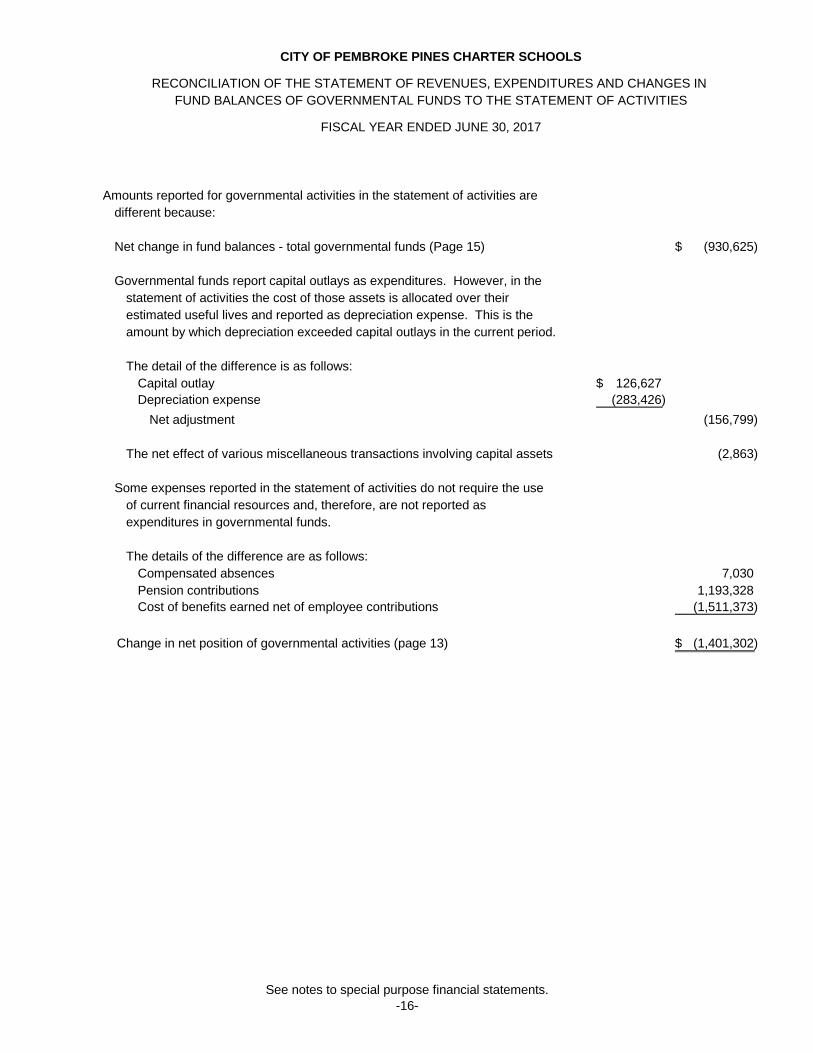
Amounts reported for governmental activities in the statement of activities aredifferent because:
Net change in fund balances - total governmental funds (Page 15) (930,625)$
Governmental funds report capital outlays as expenditures. However, in thestatement of activities the cost of those assets is allocated over their estimated useful lives and reported as depreciation expense. This is the amount by which depreciation exceeded capital outlays in the current period.
The detail of the difference is as follows:Capital outlay 126,627$ Depreciation expense (283,426)
Net adjustment (156,799)
The net effect of various miscellaneous transactions involving capital assets (2,863)
Some expenses reported in the statement of activities do not require the useof current financial resources and, therefore, are not reported as expenditures in governmental funds.
The details of the difference are as follows:Compensated absences 7,030 Pension contributions 1,193,328 Cost of benefits earned net of employee contributions (1,511,373)
Change in net position of governmental activities (page 13) (1,401,302)$
FISCAL YEAR ENDED JUNE 30, 2017
CITY OF PEMBROKE PINES CHARTER SCHOOLS
RECONCILIATION OF THE STATEMENT OF REVENUES, EXPENDITURES AND CHANGES IN FUND BALANCES OF GOVERNMENTAL FUNDS TO THE STATEMENT OF ACTIVITIES
See notes to special purpose financial statements.-16-

CITY OF PEMBROKE PINES CHARTER SCHOOLS
NOTES TO SPECIAL PURPOSE FINANCIAL STATEMENTS
- 17 -
NOTE 1. SUMMARY OF SIGNIFICANT ACCOUNTING POLICIES
a. Reporting Entity
On August 20, 1997, June 2, 1998 and August 19, 1998, the City Commission approved the creation of the City of Pembroke Pines Charter Elementary School, consisting of three campuses; the City of Pembroke Pines Charter Middle School, consisting of two campuses; and the City of Pembroke Pines Charter High School, consisting of one campus, respectively. The three schools will be referred to collectively as the Schools in these special purpose financial statements. The City of Pembroke Pines, Florida (the City) is a municipal corporation operating charter schools organized pursuant to Section 1002.33 of the Florida Statutes. The City of Pembroke Pines Charter Elementary Schools’ first school year commenced in August 1998; the City of Pembroke Pines Charter Middle Schools’ first school year commenced in July 1999 and the City of Pembroke Pines Charter High School’s first school year commenced in July 2000. The governing body of the Schools is the City Commission comprising five voting members which consist of the City of Pembroke Pines Mayor, Vice Mayor, and three Commissioners. The Pembroke Pines City Manager also serves as the Superintendent of the Charter Schools. The Schools operate under a charter of the sponsoring school district, the Broward County School Board (the District). The Elementary Schools’ charter agreement was approved by the District on August 18, 1998 and is effective until June 30, 2014. The Middle Schools’ charter agreement was approved by the District on June 15, 1999 and is effective until June 30, 2014. The High School’s charter was approved by the City Commission on April 04, 2000 and is effective until June 30, 2015. The Elementary, Middle and High Schools’ charter agreements were renewed from July 1, 2014 to June 30, 2029. All three charters may be renewed pursuant to Section 1002.33(7)(b)(1), Florida Statutes, for such duration as may be established by mutual written agreement of the parties. At the end of the term of the charters, the District may choose not to renew the charters under grounds specified in the charter in which case the District is required to notify the Schools in writing at least 90 days prior to the charter’s expiration. Pursuant to Section 1002.33, Florida Statutes, the charter school contract provides that in the event the Schools are dissolved or terminated, any unencumbered funds and all school property purchased with public funds automatically revert to the Broward County School Board. During the term of the charter, the District may also terminate the charter if good cause is shown. The Schools are accounted for as special revenue funds of the City. The financial statements contained herein present only the operations of the Schools, and do not purport to, and do not, present fairly the financial position of the City, as of June 30, 2017, and the changes in its financial position for the year then ended in conformity with accounting principles generally accepted in the United States of America.

CITY OF PEMBROKE PINES CHARTER SCHOOLS
NOTES TO SPECIAL PURPOSE FINANCIAL STATEMENTS
- 18 -
NOTE 1. SUMMARY OF SIGNIFICANT ACCOUNTING POLICIES (Continued) b. Government-Wide and Fund Financial Statements
On February 1, 2003 the City entered into a Charter Agreement with Florida State University (FSU) to create a seventh Charter School – the City of Pembroke Pines/Florida State University Charter Elementary School. This Charter School opened for the 2003-2004 School year, and has a current enrollment of 679 students for the 2016-17 school year. Its financial information is not included herein, as it is separately chartered with Florida State University and issues its own special purpose financial statements.
The Schools’ government-wide financial statements (i.e., the statement of net position and the statement of activities) report information on all of the activities of the Schools. For the most part, the effect of interfund activity has been removed from these statements. Full-time equivalent (FTE) dollars and intergovernmental revenues support governmental activities. The statement of activities demonstrates the degree to which the direct expenses of a given function or segment is offset by program revenues. Direct expenses are those that are clearly identifiable with a specific function or segment. Program revenues include: 1) charges to customers who purchase, use or directly benefit from goods, services or privileges provided by a given function or segment, and 2) grants and contributions that are restricted to meeting the operational or capital requirements of a particular function or segment. FTE dollars and other items not properly included among program revenues are reported instead as general revenues.
Major individual governmental funds are reported as separate columns in the fund financial statements. The Schools’ special purpose financial statements have been prepared in accordance with accounting principles generally accepted in the United States of America as prescribed by the Governmental Accounting Standards Board.
c. Measurement Focus, Basis of Accounting and Financial Statement Presentation
The Schools’ government-wide financial statements are reported using the economic resources measurement focus and the accrual basis of accounting. Revenues are recorded when earned and expenses are recorded when a liability is incurred, regardless of the timing of related cash flows. Grants and similar items are recognized as revenue as soon as all eligibility requirements imposed by the provider have been met.

CITY OF PEMBROKE PINES CHARTER SCHOOLS
NOTES TO SPECIAL PURPOSE FINANCIAL STATEMENTS
- 19 -
NOTE 1. SUMMARY OF SIGNIFICANT ACCOUNTING POLICIES (Continued)
c. Measurement Focus, Basis of Accounting and Financial Statement Presentation (Continued)
The Schools’ fund financial statements are reported using the current financial resources measurement focus and the modified accrual basis of accounting. Revenues are recognized as soon as they are both measurable and available. Revenues are considered to be available when they are collectible within the current period or soon enough thereafter to pay liabilities of the current period. For this purpose, the Schools consider revenues to be available if they are collected within 60 days of the end of the current fiscal period. Expenditures are recorded when a liability is incurred, as under accrual accounting. FTE dollars, grants and interest associated with the current fiscal period are all considered to be susceptible to accrual and have been recognized as revenues of the current fiscal period. All other revenue items are considered to be measurable and available only when the Schools receive cash. The Schools report the following major funds:
Charter Elementary Schools – The Elementary Schools consist of an East, West and Central campus, serving 1,900 student stations for the 2016-17 school year.
Charter Middle Schools – The Middle Schools consist of a West and Central campus, serving 1,304 student stations for the 2016-17 school year. Charter High School – The Charter High School, located at the Academic Village site, serving 2,043 student stations for the 2016-17 school year.
When both restricted and unrestricted resources are available for use, it is the Schools’ policy to use restricted resources first, and then unrestricted resources as they are needed.

CITY OF PEMBROKE PINES CHARTER SCHOOLS
NOTES TO SPECIAL PURPOSE FINANCIAL STATEMENTS
- 20 -
NOTE 1. SUMMARY OF SIGNIFICANT ACCOUNTING POLICIES (Continued)
d. Assets, Liabilities and Fund Equity
1. Deposits & Investments
The Schools consider all highly liquid investments with maturity of three months or less when purchased to be cash and cash equivalents. The Schools maintain their cash and cash equivalents in pooled accounts managed by the City. Within the City’s pooled control accounts, separate accounting is maintained for each fund. Pooled cash and cash equivalents include investment in the Florida Municipal Investment Trust (FMIvT) administered by the Florida League of Cities.
2. Receivables
All receivables are considered to be collectible. No allowance for uncollectible accounts is recorded.
3. Inventories
Inventories consist of expendable food commodities and are valued on the first-in, first-out basis. United States Department of Agriculture surplus commodities are stated at their fair value as determined at the time of donation to the School’s food service program by the Florida Department of Agriculture and Consumer Services, Bureau of Food Distribution. This inventory is accounted for under the consumption method, and as such, is recorded as an expenditure when used rather than purchased. The Schools have no inventories at June 30, 2017.
4. Capital Assets
Capital assets, which include improvements other than buildings and equipment, are reported in the governmental activities column in the government-wide financial statements. Capital assets are defined by the Schools as assets with an initial, individual cost of $1,000 or more. Such assets are recorded at historical cost or estimated historical cost if purchased or constructed. Donated capital assets are recorded at acquisition value. The costs of normal maintenance and repairs that do not add to the value of the asset or materially extend assets lives are not capitalized. Capital assets of the Schools are depreciated using the straight-line method over the following estimated useful lives:

CITY OF PEMBROKE PINES CHARTER SCHOOLS
NOTES TO SPECIAL PURPOSE FINANCIAL STATEMENTS
- 21 -
NOTE 1. SUMMARY OF SIGNIFICANT ACCOUNTING POLICIES (Continued)
d. Assets, Liabilities and Fund Equity (Continued) 4. Capital Assets (Continued)
Assets Years
Improvements other than buildings 5-50 Equipment 3-10
In accordance with Florida Statutes, all property and improvements, furnishings and equipment purchased with public funds will automatically revert to full ownership by the Broward County School Board upon the non-renewal or termination of the charter agreement.
5. Compensated Absences
The City’s Charter Schools’ teachers are given three sick leave days at the beginning of the school year and accrue one day per month up to ten days per year. Sick leave may be carried over into the following school year. Once teachers reach thirty days, they will bank those days for future use and will be compensated for any sick leave days over thirty at the end of each school year at their current rate of pay. Each full time, all year round employee is entitled to ten working days of vacation. Teachers and non-instructional employees that are not all year round employees do not accrue vacation. Eligible employees may carryover any unused vacation days for a maximum of ten days. An employee will not be paid for earned vacation leave in lieu of taking such leave unless recommended by the Principal and approved by the City Manager. Employees resigning voluntarily or who retire and give at least ten working days advance written notice of their intention to resign will receive up to a maximum of ten days of vacation leave credit earned as of the date of resignation or at retirement at the current base rate of pay. The liability for these compensated absences is recorded as long-term debt in the government-wide financial statements. The current portion of this debt is estimated based on historical trends. In the fund financial statements, the Schools report only the compensated absence liability due and payable at June 30th and paid from expendable available financial resources.
6. Long-Term Obligations
In the government-wide financial statements, long-term obligations are reported as liabilities in the applicable governmental activities. Long-term debt, which is reported in the City’s financial statements, is not included in the School’s financial statements, and is described below:

CITY OF PEMBROKE PINES CHARTER SCHOOLS
NOTES TO SPECIAL PURPOSE FINANCIAL STATEMENTS
- 22 -
NOTE 1. SUMMARY OF SIGNIFICANT ACCOUNTING POLICIES (Continued)
d. Assets, Liabilities and Fund Equity (Continued)
6. Long-Term Obligations (Continued)
The City borrowed $10,000,000 from a bank in December 1997 of which approximately $8,000,000 was used to finance the acquisition of land and construction of the Elementary Schools. In 1998, the City issued Public Improvement Revenue Bonds, Series 1998 for $24,055,000 of which approximately $12,500,000 was used to finance the construction of the Middle School, and the purchase and development of the site for the City’s Charter High School. During 1999, the City issued Capital Improvement Revenue Bonds, Series 1999 for $45,240,000 of which approximately $31,000,000 was used to finance the construction of the City of Pembroke Pines Charter High School and further expansion of the Schools. During 2001, the City issued Charter School Revenue Bonds, Series 2001A and 2001B for $31,910,000 and $20,060,000, respectively, which were used to finance the construction of the City of Pembroke Pines Charter Central Campus and the shared-use facility located at the Academic Village Charter High School Campus. On December 1, 2006, $18,935,000 of the Public Improvement Revenue Bonds, Series 1998, and $10,985,000 of the Public Improvement Revenue Bonds, Series 2001 were advance refunded by the City’s $29,720,000 Public Improvement Revenue Refunding Bonds, Series 2006. Also on December 1, 2006, $28,100,000 of the Capital Improvement Revenue Bonds, Series 1999 was advance refunded by a portion of the City’s $45,050,000 Capital Improvement Revenue Refunding Bonds, Series 2006. In October 2016, $29,720,000 of the Public Improvement Revenue Bonds, Series 2006 were refunded by $17,386,400 Public Improvement Revenue Refunding Bonds, Series 2016, which resulted in rent savings of approximately $295,000 annually for all the Charter Schools. In May 2017, $30,505,000 of the Capital Improvement Revenue Refunding Bonds, Series 2006 was refunded by a portion of the City’s $45,960,000 Capital Improvement Revenue Refunding Bonds, Series 2017, which resulted in rent savings of approximately $151,000 annually for all the Charter Schools. On March 25, 2008, the City advance refunded the Charter School Revenue Bonds, Series 2001A and 2001B, and constructed thirty-eight (38) additional classrooms for the City of Pembroke Pines Charter Schools and twelve (12) new classrooms for the City of Pembroke Pines/Florida State University Charter Elementary School by issuing the Charter School Revenue Bonds, Series 2008 for $64,095,000. This was done to comply with the State’s Class Size Amendment. The Amendment allows for no more than 18 students in Kindergarten through Third grade classrooms and 22 students in each Fourth through Fifth grade classroom. On May 17, 2011, the City remarketed the Series 2008 Bonds to Wells Fargo and obtained a variable rate of SIFMA rate plus 0.89% for a three year term. On May 29, 2014, the City remarketed the Series 2008 Bonds to PNC Financial Service Group (the "Bank") and obtained a variable rate of SIFMA rate plus 0.59% for a four year term, which resulted in rent savings of approximately $139,000 annually for all the Charter Schools, including the FSU Charter School.

CITY OF PEMBROKE PINES CHARTER SCHOOLS
NOTES TO SPECIAL PURPOSE FINANCIAL STATEMENTS
- 23 -
NOTE 1. SUMMARY OF SIGNIFICANT ACCOUNTING POLICIES (Continued)
d. Assets, Liabilities and Fund Equity (Continued)
6. Long-Term Obligations (Continued)
The Schools remit a yearly rental fee to the City for the use of the facilities that were constructed by the City (see Note 7 – Operating Leases).
7. Equity Classifications
Government-wide Financial Statements Equity is classified as net position and is displayed in three components: a. Net investment in capital assets – Consists of capital assets, net of accumulated
depreciation which are attributable to the acquisition, construction or improvement of those assets.
b. Restricted net position – Consists of net position with constraints placed on the use either
by (1) external groups such as creditors, grantors, contributors, or laws or regulations of other governments; or (2) law through constitutional provision or enabling legislation. The Schools have no restricted assets as of June 30, 2017.
c. Unrestricted net position – All other net position that do not meet the definition of
“restricted’ or “net investment in capital assets”. In the fund financial statements, governmental funds report fund classifications that comprise a hierarchy based primarily on the extent to which the Schools’ are bound to honor constraints on the specific purposes for which amounts in these funds can be spent. Amounts that are restricted to specific purposes either by a) constraints placed on the use of resources by creditors, grantors, contributors, or laws or regulations of other governments or b) imposed by law through constitutional provisions or enabling legislation are classified as restricted fund balances. Amounts that can only be used for specific purposes pursuant to constraints imposed by the City Commission through an ordinance or resolution are classified as committed fund balances. Amounts that are constrained by the intent to be used for specific purposes but are neither restricted nor committed are classified as assigned fund balances. Assignments are made by management based on Commission direction. Nonspendable fund balances include amounts that cannot be spent because they are either (a) not spendable in form or (b) legally or contractually required to be maintained intact. Unassigned fund balance represents fund balance that has not been assigned to other funds and that has not been restricted, committed, or assigned to specific purposes.

CITY OF PEMBROKE PINES CHARTER SCHOOLS
NOTES TO SPECIAL PURPOSE FINANCIAL STATEMENTS
- 24 -
NOTE 1. SUMMARY OF SIGNIFICANT ACCOUNTING POLICIES (Continued)
d. Assets, Liabilities and Fund Equity (Continued)
7. Equity Classifications (Continued) Fund Financial Statements Fund balance of the Charter Schools are considered to be assigned for rent payments, as they are special revenue funds of the City. Per GASB 54, all remaining amounts reported in governmental funds that are not classified as nonspendable, and are neither restricted nor committed should be reported as assigned fund balance. When an expenditure is incurred for purposes for which both restricted and unrestricted fund balance is available, Schools consider restricted funds to have been spent first. When an expenditure is incurred for which committed, assigned, or unassigned fund balances are available, the Schools consider amounts to have been spent, first out of committed funds, then assigned funds, and finally unassigned funds, as needed, unless the Schools have provided otherwise in its commitment or assignment actions.
8. Revenue Sources
Revenues for current operations are received primarily from the Broward County School Board pursuant to the funding provisions included in the Schools’ charter. In accordance with the funding provisions of the charter and Section 1002.33, Florida Statutes, the Schools report the number of full-time equivalent (FTE) students and related data to the District. Under the provisions of Section 1002.33, Florida Statutes, the District reports the number of full-time equivalent students and related data to the Florida Department of Education (FDOE) for funding through the Florida Education Finance Program. Funding for the Schools is adjusted during the year to reflect the revised calculations by the FDOE under the Florida Education Finance Program and the actual full-time equivalent students reported by the Schools during the designated full-time equivalent student survey periods.
9. Use of Estimates
The preparation of financial statements in conformity with accounting principles generally accepted in the United States requires management to make estimates and assumptions that affect the amounts reported in the financial statements and accompanying notes. Although these estimates are based on management’s knowledge of current events and actions it may undertake in the future, they may differ from actual results.

CITY OF PEMBROKE PINES CHARTER SCHOOLS
NOTES TO SPECIAL PURPOSE FINANCIAL STATEMENTS
- 25 -
NOTE 1. SUMMARY OF SIGNIFICANT ACCOUNTING POLICIES (Continued)
d. Assets, Liabilities and Fund Equity (Continued)
10. Pensions
For purposes of measuring the Net Pension Liability, deferred outflows of resources and deferred inflows of resources related to pensions, and pension expense, information about the fiduciary net position of the Florida Retirement Systems (FRS) and additions to/deductions from FRS’ fiduciary net position have been determined on the same basis as they are reported by FRS. For this purpose, benefit payments (including refunds of employee contributions) are recognized when due and payable in accordance with the benefit terms. Investments are reported at fair value.
11. Deferred outflows and inflows of resources In addition to assets, the statement of net position will periodically report a separate section for deferred outflows of resources. This separate financial statement element, deferred outflows of resources, represents a consumption of net position that applies to a future period(s) and so will not be recognized as an outflow of resources (expense/expenditure) until then. The charter school deferred outflows of resources relate to the pensions, as discussed in Note 11. In addition to liabilities, the statement of net position will periodically report a separate section for deferred inflows of resources. This separate financial statement element, deferred inflows of resources, represents an acquisition of net position that applies to a future period(s) and so will not be recognized as an inflow of resources (revenue) until that time. The charter school deferred inflows of resources relate to the pensions, as discussed in Note 11.

CITY OF PEMBROKE PINES CHARTER SCHOOLS
NOTES TO SPECIAL PURPOSE FINANCIAL STATEMENTS
- 26 -
NOTE 2. DEPOSITS AND INVESTMENTS
The School pools its cash, cash equivalents, and investments in accordance with legal restrictions. As of June 30, 2017 the Schools pooled cash and cash equivalents are summarized as follows:
The Charter Schools’ investment objective order of priority is safety of capital, liquidity of funds, and investment income. Authorized investments of the Charter Schools are subject to limitations prescribed in the City of Pembroke Pines’ Investment Policy as adopted per Ordinance 1493, dated September 1, 2004 and amended per Ordinance 1793, dated October 1, 2014. The average duration of the entire portfolio as a whole may not exceed five (5) years. This calculation excludes maturities of the underlying securities of a repurchase agreement. This calculation also applies to the expected average life of asset-backed securities and mortgage-backed securities (rather than the stated final maturity). No more than 30% of the total investment portfolio shall be placed in securities with an expected duration of more than five (5) years. This calculation excludes maturities of the underlying securities of a repurchase agreement. Authorized Investments per the Investment Policy are as follows:
LIST OF AUTHORIZED INVESTMENTS:
(a) The Local Government Surplus Funds Trust Fund and any other investment plan or investment trust developed by the Florida League of Cities, the Florida Association of Counties, the Florida Association of Court Clerks, or similar state or national associations, approved by the City. (b) Negotiable direct obligations of, or obligations the principal and interest of which are unconditionally guaranteed by the United States Government or its agencies, including but not limited to, U.S. Government Treasury Securities, and Government National Mortgage Associations (GNMAs).
Description Carrying AmountFMIvT 1-3 Year High Quality Bond Fund $2,694,729Cash on hand 1,876
Total pooled cash and cash equivalents $2,696,605

CITY OF PEMBROKE PINES CHARTER SCHOOLS
NOTES TO SPECIAL PURPOSE FINANCIAL STATEMENTS
- 27 -
NOTE 2. DEPOSITS & INVESTMENTS (Continued) (c) Non-negotiable interest-bearing time certificates of deposits or savings accounts in state or federal banks, state or federal savings and loan associations as permitted and/or prescribed by Chapter 280 of the Florida Statutes. (d) Government Sponsored Enterprises including but not limited to Federal Farm Credit Banks, Federal Home Loan Bank or its district banks, Federal National Mortgage Association, Federal Home Loan Mortgage Corporation, and Student Loan Marketing Association. (e) Prime commercial paper. Commercial Paper having a maturity of 90 days or less shall require one of the following three minimum ratings: A-1, P-1 or F-1, or better as rated by Standard & Poors, Moody's, and/or Fitch Investors Service rating services. Prime commercial paper of U.S. Corporations having a maturity in excess of 90 days shall require two of the three above-mentioned ratings. (f) Repurchase agreements comprised of only those investment instruments as otherwise authorized herein. (g) State or local government taxable and tax exempt debt, general obligation and/or revenue bonds rated at least "A3" by Moody's or "A-" by Standard & Poor's for long-term debt or rated at least MIG-2 by Moody’s or SP-2 Standard & Poor's for short-term debt. (h) Securities or, other interests in, any open-end or closed-end management type investment company or investment trust registered under the Investment Company Act of 1940, provided the portfolio meets the City's investment policy. (i) Securities and Exchange Commission registered money market funds with the highest credit quality rating from a nationally recognized rating agency. The funds must be in compliance with Title 17, Part 270, Section 2a-7 of the Federal Code of Regulations. (j) U.S dollar denominated debt obligations of domestic or foreign corporations, or foreign sovereignties issued in the U.S. or in foreign markets having two of the following three minimum ratings: BBB, Baa2, or BBB, as rated by Standard and Poor’s, and/or Moody’s, and/or Fitch Investors Service rating services. However, if such obligations are rated by only one rating service, then such rating shall be at least A-, A3, or A- by Standard & Poor’s, or Moody’s or Fitch. (k) Real estate, so long as the acquisition and sale complies with applicable federal and state laws and regulations in addition to applicable City Charter provisions, if any, and the City Code of Ordinances.

CITY OF PEMBROKE PINES CHARTER SCHOOLS
NOTES TO SPECIAL PURPOSE FINANCIAL STATEMENTS
- 28 -
NOTE 2. DEPOSITS & INVESTMENTS (Continued) (l) Real Estate Investment Trusts (“REIT”) which are properly registered pursuant to applicable Federal and State laws, provided the (“REIT”) portfolio meets the City's Investment Policy. (m) Land Trusts or Title Trusts as described in Sections 689.07 or 689.071, Florida Statutes, so long as the Land Trust complies with any applicable Federal and State laws and regulations, applicable City Charter provisions, if any, and the City's Code of Ordinances. (n) Mortgage-Backed Securities. Securities collateralized by mortgages on residential property or commercial (industrial, office, retail etc.) property (“commercial Mortgage-Backed Securities”). The securities may be issued by a Federal Instrumentality or by a private corporation and may be structured as collateralized mortgage obligations or unstructured pass-through securities. (o) Asset-Backed Securities. Securities collateralized by pools of assets (credit cards, autos, home equity loans). The securities may be structured or unstructured pass-through securities. The Schools invest in the Florida Municipal Investment Trust (FMIvT) administered by the Florida League of Cities. The Florida Municipal Investment Trust (FMIvT) was created under the laws of the State of Florida to provide eligible units of local government with an investment vehicle to pool their surplus funds and to reinvest such funds in one or more investment portfolios under the direction and daily supervision of an investment advisor. The Florida League of Cities serves as the administrator, investment manager and secretary-treasurer of the Trust. The Florida Municipal Investment Trust (FMIvT) is not a registrant with the Securities and Exchange Commission (SEC); however, the funds have adopted operating procedures consistent with the requirements for a 2a-7 Fund. The Charter Schools invest operating funds in the 1-3 Year High Quality Bond Fund. Oversight is provided by a Board of Trustees consisting of the President (or appointee) and Second Vice President of the Florida League of Cities (FLOC), two appointed representatives from the Florida Municipal insurance Trust, and three additional appointed members who are elected officials of municipalities (city, town or village) who actively participate in the Trust. In addition, an Investment Advisory Committee comprised of Finance Directors from throughout the state, assists the Administrator with developing and maintaining the investment guidelines and policies of the Trust. Interest Rate Risk: Interest rate risk is the risk that changes in the market interest rates will adversely affect the fair market value of an investment. The School limits its exposure to fair value losses arising from increasing interest rates by limiting the effective duration of the investment portfolio.

CITY OF PEMBROKE PINES CHARTER SCHOOLS
NOTES TO SPECIAL PURPOSE FINANCIAL STATEMENTS
- 29 -
NOTE 2. DEPOSITS & INVESTMENTS (Continued)
The Charter Schools’ operating fund in the 1-3 Year High Quality Bond Fund and the sensitivity of the fair values of the Schools’ investments to market interest rate fluctuations as of June 30, 2017 are provided below.
Fair Value
Effective Duration (Years)
Weighted Average Maturity
Credit Rating Fitch
FMIvT 1-3 Year High Quality Bond Fund $2,694,729 1.38 1.50 AAAf/S2
Credit Risk: Credit risk is the risk that a security or a portfolio will lose some or all of its value due to a real or perceived change in the ability of the issuer to repay its debt. This risk is generally measured by the assignment of a rating by a nationally recognized statistical rating organization. The Schools utilize portfolio diversification and credit quality rating in order to control this risk. The Florida Municipal Investment Trust (FMIvT) 1-3 Year High Quality Bond Fund is rated by Fitch. Concentration of Credit Risk: Concentration risk exists when investments are concentrated in one issuer. Investments issued or explicitly guaranteed by the U.S. government and investments in mutual funds, external investment pools and other pooled investment are excluded from the concentration of credit risk disclosure requirements. Fair Value Measurement: The School categorizes its fair value measurements within the fair value hierarchy established by generally accepted accounting principles. The fair value hierarchy categorizes the inputs to valuation techniques used to measure fair value into three levels. Level 1 – Inputs are quoted prices (unadjusted) for identical assets or liabilities in active markets that a government can access at the measurement date. Level 2 – Inputs are other than quoted prices included within Level 1 that are observable for an asset or liability, either directly or indirectly, including quoted prices for similar assets or liabilities in active markets. Level 3 – Inputs are significant unobservable inputs for an asset or liability.

CITY OF PEMBROKE PINES CHARTER SCHOOLS
NOTES TO SPECIAL PURPOSE FINANCIAL STATEMENTS
- 30 -
NOTE 2. DEPOSITS & INVESTMENTS (Continued) The overall valuation process and information sources for the investment classification is as follows:
FMIvT 1-3 Year High Quality Bond Fund - this fund invests mainly in US government and agency securities and asset-backed securities. The underlying securities have observable level 1 quoted pricing inputs or observable level 2 significant other observable pricing inputs. Most of the security prices were obtained from a pricing service, Interactive Data Corporation (IDC). While the underlying asset values are based on quoted prices or market-corroborated inputs, the net asset value of the portfolio is not publicly quoted. Members should consider reporting these shares as level 2, since the value is based on market-corroborated data.
The City has the following recurring fair value measurements as of June 30, 2017:
Fair Value Measurement Using
Investment Type
6/30/2017
Quoted Prices in Active
Markets for Identical Assets
(Level 1)
Significant Other
Observable Inputs
(Level 2)
Significant Unobservable Inputs (Level 3)
FMIvT-1-3 High Quality Bond Fund $2,694,729 $ - $2,694,729 $ -

CITY OF PEMBROKE PINES CHARTER SCHOOLS
NOTES TO SPECIAL PURPOSE FINANCIAL STATEMENTS
- 31 -
NOTE 3. REVENUE SOURCES Elementary Middle High
Schools Schools School TotalBroward County School Board: Florida education finance program 8,774,923$ 5,559,460$ 9,432,570$ 23,766,953$ Class size reduction 2,504,998 1,204,520 1,899,333 5,608,851 Public education capital outlay (PECO) 540,469 366,495 576,583 1,483,547 District school taxes 903,121 572,183 970,827 2,446,131 Supplemental academic instruction 388,003 263,105 413,768 1,064,876 Digital classroom allocation 33,678 22,837 35,914 92,429 Transportation revenue 155,155 232,794 465,335 853,284 ESE guaranteed allocation 327,516 268,578 303,121 899,215 Governor's A+ funds 192,154 130,463 201,319 523,936 Instructional materials 135,930 92,176 161,342 389,448 Safe schools program 41,954 28,450 44,738 115,142 Discretionary lottery funds 33,033 20,928 35,524 89,485 Best & brightest scholarship 6,817 20,451 20,451 47,719 Summer reading program 85,001 53,853 91,409 230,263 Library media materials 8,238 5,587 8,785 22,610 School lunch supplement 2,471 1,688 2,583 6,742 Science lab materials 2,252 1,527 2,401 6,180 School breakfast supplement 1,124 768 1,175 3,067
Total Broward County School Board 14,136,837 8,845,863 14,667,178 37,649,878
Other: Rental revenue 143,640 212,165 581,938 937,743 Food sales 432,598 387,015 622,316 1,441,929 Contributions 182,233 113,121 211,815 507,169 Before and after school education program 775,090 - 21,025 796,115 In-house transportation 192,600 136,936 74,647 404,183 Interest 4,674 (239) (17) 4,418 ICMA forfeiture revenue 15,467 4,136 - 19,603 E-rate program 10,759 7,136 5,690 23,585 Other miscellaneous revenue 49 33 51 133
Total other 1,757,110 860,303 1,517,465 4,134,878
Total local 15,893,947 9,706,166 16,184,643 41,784,756
Federal and State grants: National school lunch program 280,896 171,217 225,885 677,998 NSLP non-cash assistance (commodities) 64,743 44,225 67,664 176,632 School breakfast program 50,526 19,899 24,927 95,352 Individuals with disabilities education act (IDEA) 2,407 2,133 5,511 10,051 Fund for improvement of education 1,334 - - 1,334 Gardiner scholarship - SAFE grant 19,215 13,046 3,054 35,315
Total Federal and State grants 419,121 250,520 327,041 996,682
Total Revenues Sources 16,313,068$ 9,956,686$ 16,511,684$ 42,781,438$

CITY OF PEMBROKE PINES CHARTER SCHOOLS
NOTES TO SPECIAL PURPOSE FINANCIAL STATEMENTS
- 32 -
NOTE 4. CAPITAL ASSETS
NOTE 5. RECEIVABLES
Beginning EndingBalance Increases Decreases Balance
Capital assets, being depreciated: Improvements other than buildings 2,672,926$ -$ -$ 2,672,926$ Equipment 2,740,180 126,627 (60,146) 2,806,661
Total capital assets being depreciated 5,413,106 126,627 (60,146) 5,479,587
Less accumulated depreciation for: Improvements other than buildings (874,696) (68,802) - (943,498) Equipment (2,080,015) (214,624) 57,283 (2,237,356)
Total accumulated depreciation (2,954,711) (283,426) 57,283 (3,180,854)
Total capital assets being depreciated, net 2,458,395$ (156,799)$ (2,863)$ 2,298,733$
Depreciation expense was charged to functions/programs of the Schools as follows:
Governmental activities: Operation of school 283,426$
Charter Charter CharterElementary Middle High
Schools Schools School TotalReceivables
Due from Broward County -$ -$ 13,984$ 13,984$ Due from Federal Government 10,025 6,074 2,822 18,921 Other miscellaneous receivables 52,796 30,155 144,641 227,592
Total receivables 62,821$ 36,229$ 161,447$ 260,497$
CITY OF PEMBROKE PINES CHARTER SCHOOLS
NOTES TO SPECIAL PURPOSE FINANCIAL STATEMENTS
- 33 -
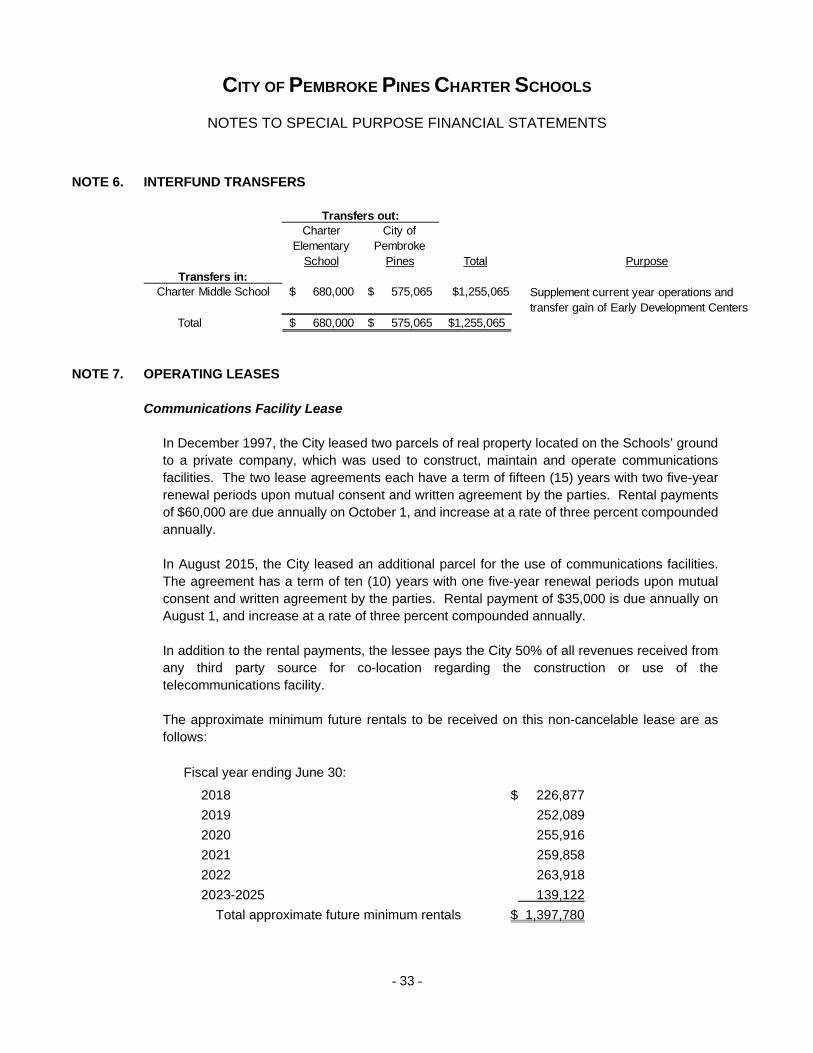
NOTE 6. INTERFUND TRANSFERS
NOTE 7. OPERATING LEASES
Communications Facility Lease
In December 1997, the City leased two parcels of real property located on the Schools’ ground to a private company, which was used to construct, maintain and operate communications facilities. The two lease agreements each have a term of fifteen (15) years with two five-year renewal periods upon mutual consent and written agreement by the parties. Rental payments of $60,000 are due annually on October 1, and increase at a rate of three percent compounded annually. In August 2015, the City leased an additional parcel for the use of communications facilities. The agreement has a term of ten (10) years with one five-year renewal periods upon mutual consent and written agreement by the parties. Rental payment of $35,000 is due annually on August 1, and increase at a rate of three percent compounded annually. In addition to the rental payments, the lessee pays the City 50% of all revenues received from any third party source for co-location regarding the construction or use of the telecommunications facility.
The approximate minimum future rentals to be received on this non-cancelable lease are as follows:
Fiscal year ending June 30:
2018 $ 226,877
2019 252,089
2020 255,916
2021 259,858
2022 263,918
2023-2025 139,122
Total approximate future minimum rentals $ 1,397,780
Charter Elementary
School
City of Pembroke
Pines Total PurposeTransfers in:
Charter Middle School 680,000$ 575,065$ $1,255,065
Total 680,000$ 575,065$ $1,255,065
Transfers out:
Supplement current year operations and transfer gain of Early Development Centers

CITY OF PEMBROKE PINES CHARTER SCHOOLS
NOTES TO SPECIAL PURPOSE FINANCIAL STATEMENTS
- 34 -
NOTE 7. OPERATING LEASES (Continued)
Schools’ Facility Leases
The Schools lease their elementary, middle and high school campuses from the City for varying annual rental fees based on the total debt service requirements of the debt issued by the City to purchase the land and construct the Schools (see Note 1.d.6). For the fiscal year ended June 30, 2017, rent expense was approximately $1,292,000, $1,229,000 and $2,996,000 for the Elementary, Middle and High Schools, respectively.
The approximate combined minimum future rentals to be paid to the City are as follows:
Fiscal year ending June 30:
2018 $ 6,440,000
2019 6,448,000
2020 6,447,000
2021 6,445,000
2022 6,433,000
2023-2027 30,006,000
2028-2032 30,936,000
2033-2037 28,047,000
2038 5,587,000
Total approximate minimum future rentals $ 126,789,000
CITY OF PEMBROKE PINES CHARTER SCHOOLS
NOTES TO SPECIAL PURPOSE FINANCIAL STATEMENTS
- 35 -
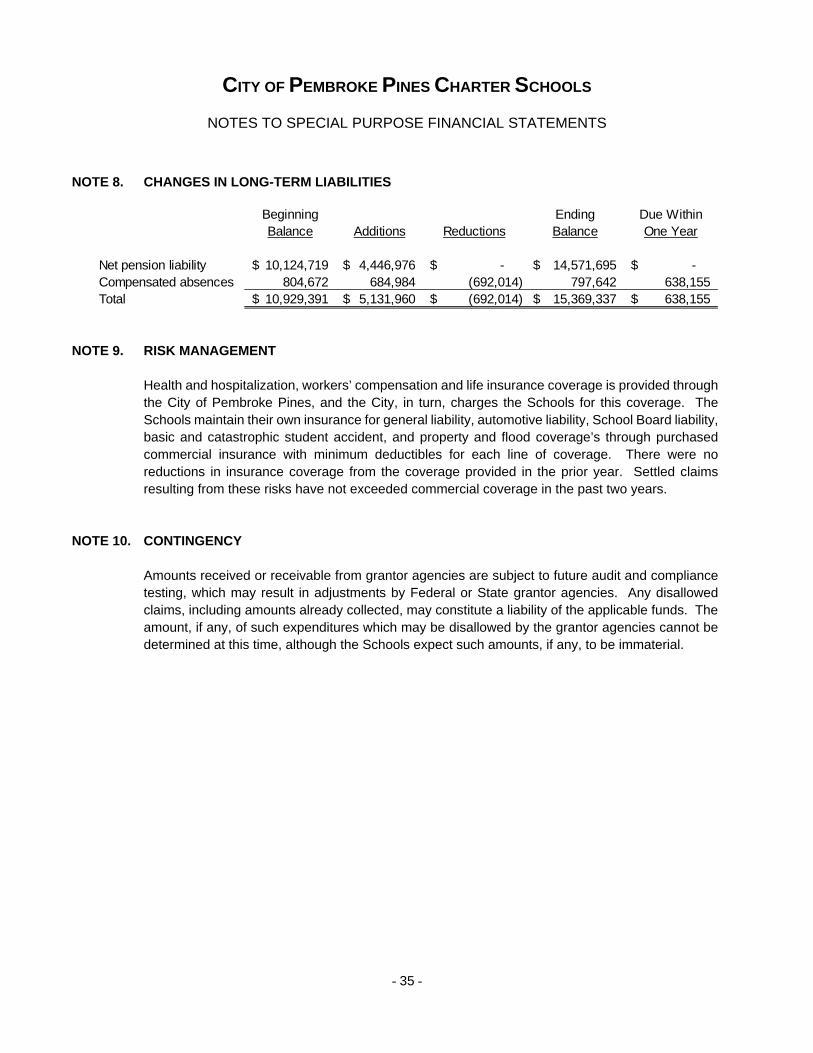
NOTE 8. CHANGES IN LONG-TERM LIABILITIES
NOTE 9. RISK MANAGEMENT
Health and hospitalization, workers’ compensation and life insurance coverage is provided through the City of Pembroke Pines, and the City, in turn, charges the Schools for this coverage. The Schools maintain their own insurance for general liability, automotive liability, School Board liability, basic and catastrophic student accident, and property and flood coverage’s through purchased commercial insurance with minimum deductibles for each line of coverage. There were no reductions in insurance coverage from the coverage provided in the prior year. Settled claims resulting from these risks have not exceeded commercial coverage in the past two years.
NOTE 10. CONTINGENCY
Amounts received or receivable from grantor agencies are subject to future audit and compliance testing, which may result in adjustments by Federal or State grantor agencies. Any disallowed claims, including amounts already collected, may constitute a liability of the applicable funds. The amount, if any, of such expenditures which may be disallowed by the grantor agencies cannot be determined at this time, although the Schools expect such amounts, if any, to be immaterial.
Beginning Ending Due WithinBalance Additions Reductions Balance One Year
Net pension liability 10,124,719$ 4,446,976$ -$ 14,571,695$ -$ Compensated absences 804,672 684,984 (692,014) 797,642 638,155 Total 10,929,391$ 5,131,960$ (692,014)$ 15,369,337$ 638,155$

CITY OF PEMBROKE PINES CHARTER SCHOOLS
NOTES TO SPECIAL PURPOSE FINANCIAL STATEMENTS
- 36 -
NOTE 11. PENSION PLANS Defined Benefit Plan Florida Retirement System The Charter Schools’ employees participate in the Florida Retirement System (FRS), a cost-sharing, multiple-employer Public Employment Retirement System (PERS). The FRS is totally administered by the State of Florida. Plan Description Membership in the FRS is required for all full-time and part-time employees working in regularly established positions for state agencies, county governments, district school boards, state universities, and state community colleges, or cities, independent special districts, metropolitan planning districts, and public charter schools that make an irrevocable election to participate. Most Pension Plan members (including renewed members), and State Community College Optional Retirement Program participants may elect to participate in the FRS Investment Plan. Florida Retirement System Pension Plan members who retired and chose to participate in the Deferred Retirement Option Program (DROP) are not eligible to become members of the FRS Investment Plan. Type of Benefit The FRS Pension Plan is a cost-sharing, multiple-employer qualified defined benefit pension plan with a Deferred Retirement Option Program (DROP) available for eligible employees. The FRS was established and is administered in accordance with Chapter 121, Florida Statutes. Retirees receive a lifetime pension benefit with joint and survivor payment options. FRS membership is compulsory for employees filling regularly established positions in a state agency, county agency, state university, state community college, or district school board, unless restricted from FRS membership under sections 121.053 and 121.122, Florida Statutes, or allowed to participate in a nonintegrated defined contribution plan in lieu of FRS membership. Participation by cities, municipalities, special districts, charter schools and metropolitan planning organizations is optional. The Retiree Health Insurance Subsidy (HIS) Program is a cost-sharing, multiple-employer defined benefit pension plan established and administered in accordance with section 112.363, Florida Statutes. The benefit is a monthly payment to assist retirees of the state-administered retirement systems in paying their health insurance costs. For the fiscal year ended June 30, 2016, eligible retirees and beneficiaries received a monthly HIS payment equal to the number of years of service credited at retirement multiplied by $5. The minimum payment is $30 and the maximum payment is $150 per month, pursuant to section 112.363, Florida Statutes. To be eligible to receive a HIS benefit, a retiree under one of the state administered retirement systems must provide proof of eligible health insurance coverage, which can include Medicare.
CITY OF PEMBROKE PINES CHARTER SCHOOLS
NOTES TO SPECIAL PURPOSE FINANCIAL STATEMENTS
- 37 -
NOTE 11. PENSION PLANS (Continued)
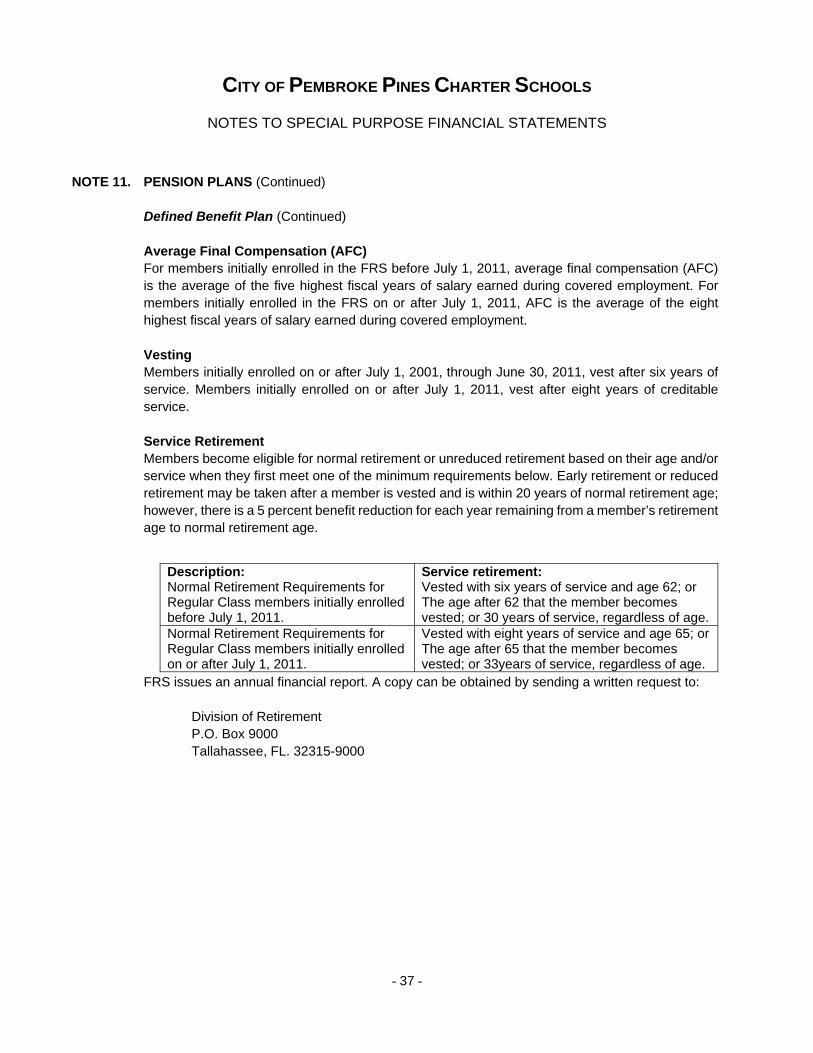
Defined Benefit Plan (Continued) Average Final Compensation (AFC) For members initially enrolled in the FRS before July 1, 2011, average final compensation (AFC) is the average of the five highest fiscal years of salary earned during covered employment. For members initially enrolled in the FRS on or after July 1, 2011, AFC is the average of the eight highest fiscal years of salary earned during covered employment. Vesting Members initially enrolled on or after July 1, 2001, through June 30, 2011, vest after six years of service. Members initially enrolled on or after July 1, 2011, vest after eight years of creditable service. Service Retirement Members become eligible for normal retirement or unreduced retirement based on their age and/or service when they first meet one of the minimum requirements below. Early retirement or reduced retirement may be taken after a member is vested and is within 20 years of normal retirement age; however, there is a 5 percent benefit reduction for each year remaining from a member’s retirement age to normal retirement age.
FRS issues an annual financial report. A copy can be obtained by sending a written request to:
Division of Retirement P.O. Box 9000 Tallahassee, FL. 32315-9000
Description: Normal Retirement Requirements for Regular Class members initially enrolled before July 1, 2011.
Service retirement: Vested with six years of service and age 62; or The age after 62 that the member becomes vested; or 30 years of service, regardless of age.
Normal Retirement Requirements for Regular Class members initially enrolled on or after July 1, 2011.
Vested with eight years of service and age 65; or The age after 65 that the member becomes vested; or 33years of service, regardless of age.

CITY OF PEMBROKE PINES CHARTER SCHOOLS
NOTES TO SPECIAL PURPOSE FINANCIAL STATEMENTS
- 38 -
NOTE 11. PENSION PLANS (Continued)
Defined Benefit Plan (Continued) Funding Policy The Charter Schools’ required contribution rate is established, and may be amended, by State Statute. For the fiscal year ended June 30, 2017, the contribution rate increased to 7.52% from 7.26% for Regular Class Members and increased from 12.88% to 12.99% for DROP Members. The Charter Schools are required to contribute both for full-time and part-time members of the Plan, which amounted to $1,311,513. As of June 30, 2017, there were 431 members in this Plan. The contribution rate includes the post-employment health insurance supplement of 1.66% and the administrative/educational fee of 0.06%. Starting in fiscal year 2012, the State mandated that employees contribute 3% of pay to the FRS Pension Plan. This required employee contribution amounted to $511,638 for fiscal year 2017.
Net Pension Liabilities The components of the collective net pension liability of the participating employers for each defined benefit plan for the measurement date of June 30, 2016, are shown below (in thousands):
Annual TotalFiscal Required Employer PercentageYear Contributions Contributions Contributed Regular Class DROP
2017 1,311,513$ 1,311,513$ 100.0% 7.52% 12.99%2016 1,191,296 1,191,296 100.0% 7.26% 12.88%
2015 1,202,083 1,202,083 100.0% 7.37% 12.28%
2014 1,157,206 1,157,206 100.0% 6.95% 12.84%2013 884,548 884,548 100.0% 5.18% 5.44%2012 812,317 812,317 100.0% 4.91% 4.42%2011 1,761,326 1,761,326 100.0% 10.77% 12.25%2010 1,563,168 1,563,168 100.0% 9.85% 10.91%
Contribution Rates
FRS HISTotal Pension Liability 167,030,999$ 11,768,445$ Plan Fiduciary Net Position (141,780,921) (113,859) Net Pension Liability 25,250,078$ 11,654,586$
Plan Fiduciary Net Position as a Percentage of the Total Pension Liability 84.88% 0.97%
CITY OF PEMBROKE PINES CHARTER SCHOOLS
NOTES TO SPECIAL PURPOSE FINANCIAL STATEMENTS
- 39 -
NOTE 11. PENSION PLANS (Continued)
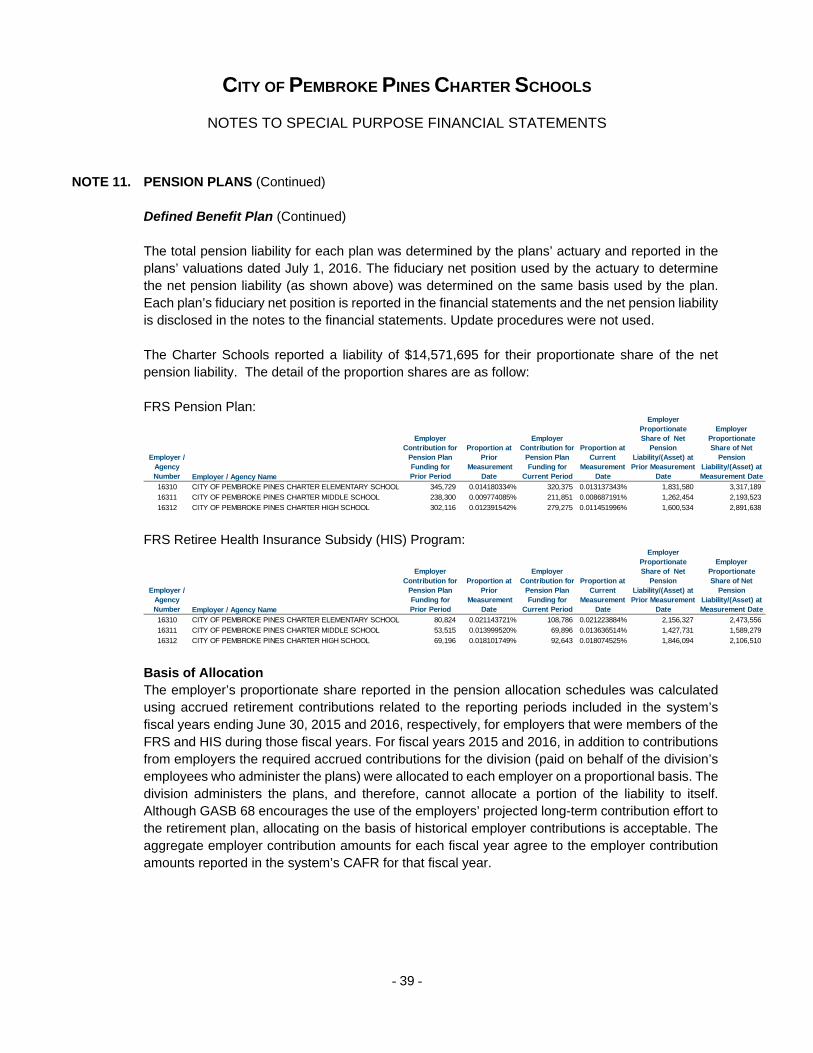
Defined Benefit Plan (Continued) The total pension liability for each plan was determined by the plans’ actuary and reported in the plans’ valuations dated July 1, 2016. The fiduciary net position used by the actuary to determine the net pension liability (as shown above) was determined on the same basis used by the plan. Each plan’s fiduciary net position is reported in the financial statements and the net pension liability is disclosed in the notes to the financial statements. Update procedures were not used. The Charter Schools reported a liability of $14,571,695 for their proportionate share of the net pension liability. The detail of the proportion shares are as follow: FRS Pension Plan:
FRS Retiree Health Insurance Subsidy (HIS) Program:
Basis of Allocation The employer’s proportionate share reported in the pension allocation schedules was calculated using accrued retirement contributions related to the reporting periods included in the system’s fiscal years ending June 30, 2015 and 2016, respectively, for employers that were members of the FRS and HIS during those fiscal years. For fiscal years 2015 and 2016, in addition to contributions from employers the required accrued contributions for the division (paid on behalf of the division’s employees who administer the plans) were allocated to each employer on a proportional basis. The division administers the plans, and therefore, cannot allocate a portion of the liability to itself. Although GASB 68 encourages the use of the employers’ projected long-term contribution effort to the retirement plan, allocating on the basis of historical employer contributions is acceptable. The aggregate employer contribution amounts for each fiscal year agree to the employer contribution amounts reported in the system’s CAFR for that fiscal year.
Employer / Agency Number Employer / Agency Name
Employer Contribution for
Pension Plan Funding for Prior Period
Proportion at Prior
Measurement Date
Employer Contribution for
Pension Plan Funding for
Current Period
Proportion at Current
Measurement Date
Employer Proportionate Share of Net
Pension Liability/(Asset) at Prior Measurement
Date
Employer Proportionate Share of Net
Pension Liability/(Asset) at Measurement Date
16310 CITY OF PEMBROKE PINES CHARTER ELEMENTARY SCHOOL 345,729 0.014180334% 320,375 0.013137343% 1,831,580 3,317,189
16311 CITY OF PEMBROKE PINES CHARTER MIDDLE SCHOOL 238,300 0.009774085% 211,851 0.008687191% 1,262,454 2,193,523
16312 CITY OF PEMBROKE PINES CHARTER HIGH SCHOOL 302,116 0.012391542% 279,275 0.011451996% 1,600,534 2,891,638
Employer / Agency Number Employer / Agency Name
Employer Contribution for
Pension Plan Funding for Prior Period
Proportion at Prior
Measurement Date
Employer Contribution for
Pension Plan Funding for
Current Period
Proportion at Current
Measurement Date
Employer Proportionate Share of Net
Pension Liability/(Asset) at Prior Measurement
Date
Employer Proportionate Share of Net
Pension Liability/(Asset) at Measurement Date
16310 CITY OF PEMBROKE PINES CHARTER ELEMENTARY SCHOOL 80,824 0.021143721% 108,786 0.021223884% 2,156,327 2,473,556
16311 CITY OF PEMBROKE PINES CHARTER MIDDLE SCHOOL 53,515 0.013999520% 69,896 0.013636514% 1,427,731 1,589,279
16312 CITY OF PEMBROKE PINES CHARTER HIGH SCHOOL 69,196 0.018101749% 92,643 0.018074525% 1,846,094 2,106,510
CITY OF PEMBROKE PINES CHARTER SCHOOLS
NOTES TO SPECIAL PURPOSE FINANCIAL STATEMENTS
- 40 -
NOTE 11. PENSION PLANS (Continued)
Defined Benefit Plan (Continued) The proportion calculated based on contributions for each of the fiscal years presented in the pension allocation schedules was applied to the net pension liability and other pension amounts applicable to that fiscal year to determine each employer’s proportionate share of the liability, deferred outflows of resources, deferred inflows of resources and associated pension expense. For the purposes of the pension allocation schedules, pension amounts are allocated to reporting employers. The pension amounts of participating employers whose payrolls are reported and contributions are remitted by another entity are included in the reporting employer’s amounts and will be allocated to the participating employer by the reporting employer. Actuarial Methods and Assumptions Actuarial assumptions for both defined benefit plans are reviewed annually by the Florida Retirement System Actuarial Assumptions Conference. The FRS Pension Plan has a valuation performed annually. The HIS Program has a valuation performed biennially that is updated for GASB reporting in the year a valuation is not performed. The most recent experience study for the FRS Pension Plan was completed in 2014 for the period July 1, 2008, through June 30, 2013. Because the HIS Program is funded on a pay-as-you-go basis, no experience study has been completed for this program. The actuarial assumptions that determined the total pension liability for the HIS Program were based on certain results of the most recent experience study for the FRS Pension Plan. The total pension liability for each cost-sharing defined benefit plan was determined using the individual entry age actuarial cost method. Inflation increases for both plans is assumed at 2.60%. Payroll growth, including inflation, for both plans is assumed at 3.25%. Both the discount rate and the long-term expected rate of return used for FRS Pension Plan investments is 7.60%. The plan’s fiduciary net position was projected to be available to make all projected future benefit payments of current active and inactive employees. Therefore, the discount rate for calculating the total pension liability is equal to the long-term expected rate of return. Because the HIS Program uses a pay-as-you-go funding structure, a municipal bond rate of 2.85% was used to determine the total pension liability for the program. Mortality assumptions for both plans were based on the Generational RP-2000 with Projection Scale BB tables. The following changes in actuarial assumptions occurred in 2016: 1. FRS: The long-term expected rate of return was decreased from 7.65% to 7.60% and the active
member mortality assumption was updated. 2. HIS: The municipal rate used to determine total pension liability decreased from 3.80% to
2.85%.
CITY OF PEMBROKE PINES CHARTER SCHOOLS
NOTES TO SPECIAL PURPOSE FINANCIAL STATEMENTS
- 41 -
NOTE 11. PENSION PLANS (Continued)
Defined Benefit Plan (Continued)
Because the HIS is essentially funded on a pay-as-you-go basis, the depletion date is considered to be immediate, and the single equivalent discount rate is equal to a long-duration, high-quality, tax-exempt municipal bond rate selected by the plan sponsor. In September 2014 the Actuarial Assumptions Conference adopted the Bond Buyer General Obligation 20-Bond Municipal Bond Index as the applicable municipal bond index. The benefits received by retirees and beneficiaries are increased by a cost-of-living adjustment (COLA) each July based on their June benefit amount (excluding the Retiree Health Insurance Subsidy benefit). For retirees who have been retired for less than 12 months on July 1, the first COLA increase is prorated. The COLA applies to all continuing monthly retirement benefits paid under the FRS Pension Plan (i.e., normal and early service retirement benefits and benefits accruing in participant accounts under the DROP, disability retirement benefits, and survivor benefits). The COLA for retirements or DROP participation effective before Aug. 1, 2011, is 3 percent per year. The COLA formula for retirees with an effective retirement date or DROP begin date on or after Aug. 1, 2011, will be the sum of the pre-July 2011 service credit divided by the total service credit at retirement multiplied by 3 percent. Each Pension Plan member with an effective retirement date of Aug. 1, 2011, or after will have an individual COLA factor for retirement. FRS Pension Plan members initially enrolled on or after July 1, 2011, will not have a COLA after retirement.
Long-Term Expected Rate of Return To develop an analytical basis for the selection of the long-term expected rate of return assumption, in October 2016 the FRS Actuarial Assumptions conference reviewed long-term assumptions developed by both Milliman’s capital market assumptions team and by a capital market assumptions team from Aon Hewitt Investment Consulting, which consults to the Florida State Board of Administration. The table below shows Milliman’s assumptions for each of the asset classes in which the plan was invested at that time based on the long-term target asset allocation. The allocation policy’s description of each asset class was used to map the target allocation to the asset classes shown below. Each asset class assumption is based on a consistent set of underlying assumptions, and includes an adjustment for the inflation assumption. These assumptions are not based on historical returns, but instead are based on a forward-looking capital market economic model.

CITY OF PEMBROKE PINES CHARTER SCHOOLS
NOTES TO SPECIAL PURPOSE FINANCIAL STATEMENTS
- 42 -
NOTE 11. PENSION PLANS (Continued)
Defined Benefit Plan (Continued)
Sensitivity Analysis The following tables demonstrate the sensitivity of the net pension liability to changes in the discount rate. The sensitivity analysis shows the impact to the collective net pension liability of the participating employers if the discount rate was 1.00% higher or 1.00% lower than the current discount rate at June 30, 2017.
1% DecreaseCurrent
Discount Rate 1% Increase6.60% 7.60% 8.60%
Elementary 6,107,170$ 3,317,189$ 994,899$ Middle 4,038,424 2,193,523 657,886 High 5,323,702 2,891,638 867,267
FRS Net Pension Liability
1% DecreaseCurrent
Discount Rate 1% Increase1.85% 2.85% 3.85%
Elementary 2,837,730$ 2,473,556$ 2,171,311$ Middle 1,823,264 1,589,279 1,395,084 High 2,416,647 2,106,510 1,849,115
HIS Net Pension Liability

CITY OF PEMBROKE PINES CHARTER SCHOOLS
NOTES TO SPECIAL PURPOSE FINANCIAL STATEMENTS
- 43 -
NOTE 11. PENSION PLANS (Continued)
Defined Benefit Plan (Continued)
Pension Expense and Deferred Outflows/(Inflows) of Resources In accordance with GASB 68, paragraph 54 and 71, changes in the net pension liability are recognized in pension expense in the current measurement period, except as indicated below. For each of the following, a portion is recognized in pension expense in the current measurement period, and the balance is amortized as deferred outflows or deferred inflows of resources using a systematic and rational method over a closed period, as defined below: 1. Differences between expected and actual experience with regard to economic and
demographic factors – amortized over the average expected remaining service life of all employees that are provided with pensions through the pension plan (active and inactive employees)
2. Changes of assumptions or other inputs – amortized over the average expected remaining service life of all employees that are provided with pensions through the pension plan (active and inactive employees)
3. Changes in proportion and differences between contributions and proportionate share of contributions – amortized over the average expected remaining service life of all employees that are provided with pension through the pension plan (active and inactive employees)
4. Differences between expected and actual earnings on pension plan investments – amortized over five years
Employer contributions to the pension plans from employers are not included in collective pension expense, however, employee contributions are used to reduce pension expense. The average expected remaining service life of all employees provided with pensions through the pension plans at June 30, 2016, was 6.4 years for FRS and 7.2 years for HIS. The components of collective pension expense reported in the pension allocation schedules for the fiscal year ended June 30, 2017, are presented below:
Collective Pension Expenses
Charter Elementary 711,321$ Charter Middle 466,513 Charter High 615,936 Total 1,793,770$

CITY OF PEMBROKE PINES CHARTER SCHOOLS
NOTES TO SPECIAL PURPOSE FINANCIAL STATEMENTS
- 44 -
NOTE 11. PENSION PLANS (Continued)
Defined Benefit Plan (Continued) The components of deferred outflows and inflows of resources schedules for the fiscal year ended June 30, 2017, are presented below for each plan.
Deferred Outflows of Resources
Deferred Inflows of
Resources
Deferred Outflows of Resources
Deferred Inflows of
Resources
Deferred Outflows of Resources
Deferred Inflows of
Resources Total
Changes in:
Contributions, subsequent to measurement date 353,465$ -$ 238,650$ -$ 312,825$ -$ 904,940$
Assumptions/inputs 200,680 - 132,702 - 174,935 - 508,317
Projected/Actual earnings 857,453 - 566,999 - 747,453 - 2,171,905
Experience expected/actual 253,990 (30,885) 167,953 (20,423) 221,406 (26,923) 565,118
Change in Proportion, NPL - (500,187) - (277,907) 62,033 (148,511) (864,572)
1,665,588$ (531,072)$ 1,106,304$ (298,330)$ 1,518,652$ (175,434)$ 3,285,708$
HighElementary Middle
FRS Pension Plan
Deferred Outflows of Resources
Deferred Inflows of
Resources
Deferred Outflows of Resources
Deferred Inflows of
Resources
Deferred Outflows of Resources
Deferred Inflows of
Resources Total
Changes in:
Contributions, subsequent to measurement date 112,860$ -$ 75,171$ -$ 100,357$ -$ 288,388$
Assumptions/inputs 388,164 - 249,398 - 330,565 - 968,127
Projected/Actual earnings 1,251 - 804 - 1,065 - 3,120
Experience expected/actual - (5,634) - (3,620) - (4,798) (14,052)
Change in Proportion, NPL 6,482 (268,048) - (106,027) 45,278 (2,201) (324,516)
508,757$ (273,682)$ 325,373$ (109,647)$ 477,265$ (6,999)$ 921,067$
Elementary Middle High
HIS Program

CITY OF PEMBROKE PINES CHARTER SCHOOLS
NOTES TO SPECIAL PURPOSE FINANCIAL STATEMENTS
- 45 -
NOTE 11. PENSION PLANS (Continued) Defined Benefit Plan (Continued) Deferred outflows of resources related to employer contributions paid subsequent to the measurement date and prior to the employer’s fiscal year end will be recognized as a reduction of the net pension liability in the reporting period ending June 30, 2018. Other amounts reported as deferred outflows of resources and deferred inflows of resources related to pension expense will be recognized as follows:
Defined Contribution Plan Effective July 1, 2000, the City established a Defined Contribution Plan for employees of the Charter Schools and Early Development Centers (the Charter Schools’ Plan) created in accordance with Internal Revenue Service Code 401(a) and Ordinance 1345 and amended by Ordinance 1401 dated April 3, 2002. If a participant separates from service and subsequently becomes employed with another unit of a state or local government, then the participant may rollover the benefits into his or her new employer’s pension plan providing said plan permits rollovers. In Fiscal Year 2007 employees were given the option to enter the Florida Retirement System (FRS) or to remain in the Defined Contribution Plan with the ICMA-RC. At June 30, 2017, there were 29 Plan members. Effective January 1, 2002, the Schools’ Plan members may make voluntary after-tax contributions of up to twenty-five percent (25%) of compensation during the fiscal year. The Schools’ required contribution is 7.52% of the Plan member’s gross salary to agree with the contribution to the FRS. For the year ended June 30, 2017, the Schools contributed $103,320 and the employees contributed $8,515 to the Plan. Provisions of the Schools’ Plan may be amended by the City Commission. The Schools’ Plan is held in a trust for the exclusive benefit of the participants and their beneficiaries. Therefore, the net position of the Schools’ Plan is not included in the Schools’ special purpose financial statements. Beginning in Fiscal Year 2009, the Schools recorded a revenue and a receivable for ICMA forfeitures. These forfeitures represent the amount of non-vested accrued employer benefits. The Schools will utilize these forfeitures to offset future employer contributions to the Plan.
Reporting Period Ending June 30, FRS Expense HIS Expense FRS Expense HIS Expense FRS Expense HIS Expense
2018 48,068$ 11,508$ 49,516$ 23,382$ 136,425$ 67,134$ 2019 48,069 11,508 49,516 23,382 136,425 67,135 2020 382,358 11,270 270,568 23,228 427,828 66,932 2021 275,228 11,156 190,084 23,155 295,121 66,834 2022 19,998 29,857 8,290 22,615 28,470 57,909
Thereafter 7,329 46,916 1,349 24,793 6,125 43,965 Total 781,050$ 122,215$ 569,323$ 140,555$ 1,030,394$ 369,909$
HighElementary Middle

Required Supplementary Information

Variance
with
Final
Budget
Actual Positive
Original Final Amounts (Negative)
Revenues:
Local 16,103,472$ 16,338,490$ 15,893,947$ (444,543)$ Federal and State grants 375,844 403,230 419,121 15,891
Total revenues 16,479,316 16,741,720 16,313,068 (428,652)
Expenditures:
Current:
K-3 Basic 5,502,254 5,362,470 5,327,587 34,883
4-8 Basic 2,754,898 2,691,793 2,639,097 52,696
Exceptional student program 713,121 693,924 661,734 32,190
Substitute teachers 122,082 122,082 163,315 (41,233)
Guidance services 219,774 211,510 220,202 (8,692)
Instructional media services 319,904 324,330 306,337 17,993
Instructional staff training service 43,050 43,050 10,844 32,206
School administration 1,839,323 1,734,418 1,710,087 24,331
Facilities acquisition and construction 1,313,750 1,313,750 1,291,539 22,211
Food services 711,183 775,787 766,443 9,344
Student transportation services 709,970 676,976 666,090 10,886
Operation of school 1,724,091 1,678,339 1,597,680 80,659
Child care supervision 386,181 385,763 342,550 43,213 Capital outlay 13,626 54,560 38,762 15,798
Total expenditures 16,373,207 16,068,752 15,742,267 326,485
Excess (Deficit) of revenues over (under) expenditures 106,109 672,968 570,801 (102,167)
Other financing uses: Transfers out (526,137) (616,137) (680,000) (63,863)
Net change in fund balances (420,028) 56,831 (109,199) (166,030)
Fund balances, beginning 1,760,162 1,760,162 1,760,162 -
Fund balances, ending 1,340,134$ 1,816,993$ 1,650,963$ (166,030)$
Budgeted Amounts
CITY OF PEMBROKE PINES CHARTER SCHOOLS
REQUIRED SUPPLEMENTARY INFORMATIONBUDGETARY COMPARISON SCHEDULE
FISCAL YEAR ENDED JUNE 30, 2017
CHARTER ELEMENTARY SCHOOLS
See notes to Budgetary Comparison Schedule
-46-

VariancewithFinal
BudgetActual Positive
Original Final Amounts (Negative)Revenues: Local 9,989,103$ 10,148,367$ 9,706,166$ (442,201)$ Federal and State grants 238,979 257,606 250,520 (7,086)
Total revenues 10,228,082 10,405,973 9,956,686 (449,287)
Expenditures: Current: 4-8 Basic 5,696,833 5,608,961 5,638,514 (29,553) Intensive English/ESOL 1,921 1,921 - 1,921 Exceptional student program 570,422 568,767 591,608 (22,841) Substitute teachers 97,895 97,895 116,563 (18,668) Guidance services 203,219 195,228 199,690 (4,462) Instructional media services 293,604 288,755 268,169 20,586 Instructional staff training service 23,150 23,750 12,372 11,378 School administration 1,211,383 1,136,791 1,057,947 78,844 Facilities acquisition and construction 1,269,129 1,269,129 1,228,880 40,249 Food services 545,117 581,189 564,886 16,303 Student transportation services 482,541 460,486 456,556 3,930 Operation of school 1,176,694 1,156,848 1,077,170 79,678 Athletics 23,034 28,134 28,131 3 Capital outlay 12,784 25,227 22,984 2,243
Total expenditures 11,607,726 11,443,081 11,263,470 179,611
Excess (Deficit) of revenues over (under) expenditures (1,379,644) (1,037,108) (1,306,784) (269,676)
Other financing sources: Transfers in 1,120,749 1,120,749 1,255,065 134,316
Net change in fund balances (258,895) 83,641 (51,719) (135,360)
Fund balances, beginning 53,738 53,738 53,738 -
Fund balances, ending (205,157)$ 137,379$ 2,019$ (135,360)$
Budgeted Amounts
CITY OF PEMBROKE PINES CHARTER SCHOOLS
REQUIRED SUPPLEMENTARY INFORMATIONBUDGETARY COMPARISON SCHEDULE
FISCAL YEAR ENDED JUNE 30, 2017
CHARTER MIDDLE SCHOOLS
See notes to Budgetary Comparison Schedule
-47-

Variance
with
Final
Budget
Actual Positive
Original Final Amounts (Negative)
Revenues:
Local 16,345,429$ 16,613,004$ 16,184,643$ (428,361)$ Federal and State grants 323,717 335,311 327,041 (8,270)
Total revenues 16,669,146 16,948,315 16,511,684 (436,631)
Expenditures:
Current:
4-8 Basic 1,091,189 1,080,299 1,127,676 (47,377)
9-12 Basic 6,525,443 6,383,365 6,477,068 (93,703)
Exceptional student program 387,437 377,954 364,498 13,456
Vocational 6-12 142,538 131,353 127,176 4,177
Substitute teachers 72,558 72,558 71,616 942
School/other 41,463 41,463 25,406 16,057
Guidance services 523,665 509,205 530,432 (21,227)
Instructional media services 122,737 126,003 125,420 583
ESE specialist 78,756 76,468 77,495 (1,027)
Instructional staff training service 22,317 22,317 8,677 13,640
School administration 1,325,150 1,248,529 1,168,978 79,551
Facilities acquisition and construction 3,130,190 3,130,190 2,996,466 133,724
Food services 804,824 834,846 817,869 16,977
Student transportation services 705,490 676,864 676,566 298
Operation of school 2,273,272 2,284,718 2,301,517 (16,799)
Child care supervision 7,775 7,775 8,205 (430)
Athletics 276,180 312,314 311,445 869 Capital outlay 279,775 294,820 64,881 229,939
Total expenditures 17,810,759 17,611,041 17,281,391 329,650
Excess (Deficit) of revenues over (under) expenditures (1,141,613) (662,726) (769,707) (106,981)
Other financing uses: Transfers in 305,841 305,841 - (305,841)
Net change in fund balances (835,772) (356,885) (769,707) (412,822)
Fund balances, beginning 926,876 926,876 926,876 -
Fund balances, ending 91,104$ 569,991$ 157,169$ (412,822)$
Budgeted Amounts
CITY OF PEMBROKE PINES CHARTER SCHOOLS
REQUIRED SUPPLEMENTARY INFORMATIONBUDGETARY COMPARISON SCHEDULE
FISCAL YEAR ENDED JUNE 30, 2017
CHARTER HIGH SCHOOL
See notes to Budgetary Comparison Schedule
-48-
CITY OF PEMBROKE PINES CHARTER SCHOOLS
NOTES TO BUDGETARY COMPARISON SCHEDULES
FISCAL YEAR ENDED JUNE 30, 2017
-49-
NOTE 1. BUDGETS AND BUDGETARY ACCOUNTING
1. Annual budgets are legally adopted for all Charter School funds which are governmental funds. All governmental fund budgets are maintained on the modified accrual basis of accounting, consistent with accounting principles generally accepted in the United States, except for encumbrances, which are purchase orders and contracts issued for goods and services not received at year end.
For budgetary purposes, significant encumbrances outstanding at year end are reappropriated in the subsequent year’s budget. Unencumbered appropriations lapse at year-end. For the fiscal year ended June 30, 2017, there were no encumbrances.
2. The Charter Schools’ budgets are approved via resolution in a public hearing conducted by the City Commission. The adopted budgets are integrated into the accounting software system effective July 1st. The budgets establish the legal authority to incur expenditures up to the appropriated amount for each line item.
3. Section 30.30(F) of the Code of Ordinances requires a majority affirmative vote of the quorum to adopt the budgets, which prior to July 1st, are legally enacted through passage of a resolution. Section 6.06 of the City Charter provides that no officer, department or agency may legally expend or contract to expend the amounts in excess of the amounts appropriated for any department, within an individual fund. Therefore, the legal level of control is at the department level.
4. The adopted budgets may be amended as follows:
a. The City Manager or his designee and the Principals approve line item adjustments within a school site or school function.
b. The City Commission approves budget adjustments that transfer monies from fund to fund or interdepartmentally.
c. The City Commission may approve supplemental appropriations of revenues and expenditures. If this is done, the adoption of an amended budget resolution is required.
5. Actual expenditures for several school line items exceeded its appropriation mainly due to an increase in teachers’ salaries which was approved by the Broward Teachers Union 60 days after the fiscal year end of the schools.
6. The final budgets include the supplemental appropriations before transfers, which have the effect of adjusting the original adopted budgets. There were supplemental expenditure appropriations before transfers of $304,455 less than the original budget in the elementary schools, $164,645 less than the original budget in the middle schools and $199,718 less than the original budget in the high school during the fiscal year ended June 30, 2017. There were revenues before transfer of $262,404 more than the original budget in the elementary schools, $177,891 more than the original budget in the middle schools, and $279,169 more than the original budget in the high schools.

Florida Retirement System Plan (in thousands): FRS HIS FRS HIS FRS HISTotal pension liability 167,030,999$ 11,768,445$ 161,370,735$ 10,249,201$ 156,115,763$ 9,443,629$ Plan fiduciary net position (141,780,921) (113,859) (148,454,394) (50,774) (150,014,292) (93,385) Net pension liability 25,250,078$ 11,654,586$ 12,916,341$ 10,198,427$ 6,101,471$ 9,350,244$
Plan fiduciary net position as a percentage of the total pension liability 84.88% 0.97% 92.00% 0.50% 96.09% 0.99%
Charter Elementary Schools:Share of net pension liability as a percentage 0.013137343% 0.021223884% 0.014180334% 0.021143721% 0.015319553% 0.023009714%Share of net pension liability as an amount 3,317,189$ 2,473,556$ 1,831,580$ 2,156,327$ 934,718$ 2,151,464$
Covered-employee payroll 7,745,300$ 7,745,300$ 7,520,707$ 7,520,707$ 7,546,090$ 7,546,090$
Net pension liability as a percentage of covered-employee payroll 42.83% 31.94% 24.35% 28.67% 12.39% 28.51%
Note to Schedule:Assumptions:1.
2. Inflation increases for both plans is assumed at 2.60%.3. Payroll growth for both plans is assumed at 3.25%. 4.5.6.
Benefit Types:1. FRS pension plan's retirees receive a lifetime pension benefit with joint and survivor payment options. 2.
Note: Schedule is intended to show information for 10 years. Additional years will be displayed as they become available.
CITY OF PEMBROKE PINES CHARTER SCHOOLSREQUIRED SUPPLEMENTARY INFORMATION
PENSION SCHEDULECHARTER ELEMENTARY SCHOOLS
HIS program is a monthly payment to assist retirees of the state-administered retirement systems in paying their health insurance costs. For the fiscal year ended June 30, 2017, eligible retirees and beneficiaries received a monthly HIS payment equal to the number of years of service credited at retirement multiplied by $5. The minimum payment is $30 and the maximum payment is $150 per month, pursuant to section 112.363, Florida Statutes.
2015
The municipal rate (the Bond Buyer General Obligation 20-Bond Municipal Bond Index) used to determine total pension liability for HIS is 2.85%.
The total pension liability for each of the defined benefit plans was determined by an actuarial valuation as of July 1, 2016, using the entry age normal actuarial cost method.
Both the discount rate and the long-term expected rate of return used for FRS Pension Plan investments is 7.60%. Mortality assumptions for both plans were based on the Generational RP-2000 with Projection Scale BB tables.
20162017
-50-

Florida Retirement System Plan (in thousands): FRS HIS FRS HIS FRS HISTotal pension liability 167,030,999$ 11,768,445$ 161,370,735$ 10,249,201$ 156,115,763$ 9,443,629$ Plan fiduciary net position (141,780,921) (113,859) (148,454,394) (50,774) (150,014,292) (93,385) Net pension liability 25,250,078$ 11,654,586$ 12,916,341$ 10,198,427$ 6,101,471$ 9,350,244$
Plan fiduciary net position as a percentage of the total pension liability 84.88% 0.97% 92.00% 0.50% 96.09% 0.99%
Charter Middle Schools:Share of net pension liability as a percentage 0.008687191% 0.013636514% 0.009774085% 0.013999520% 0.010014704% 0.014743185%Share of net pension liability as an amount 2,193,523$ 1,589,279$ 1,262,454$ 1,427,731$ 611,044$ 1,378,524$
Covered-employee payroll 5,398,562$ 5,398,562$ 5,357,386$ 5,357,386$ 5,273,513$ 5,273,513$
Net pension liability as a percentage of covered-employee payroll 40.63% 29.44% 23.56% 26.65% 11.59% 26.14%
Note to Schedule:Assumptions:1.
2. Inflation increases for both plans is assumed at 2.60%.3. Payroll growth for both plans is assumed at 3.25%. 4.5.6.
Benefit Types:1. FRS pension plan's retirees receive a lifetime pension benefit with joint and survivor payment options. 2.
Note: Schedule is intended to show information for 10 years. Additional years will be displayed as they become available.
CITY OF PEMBROKE PINES CHARTER SCHOOLSREQUIRED SUPPLEMENTARY INFORMATION
PENSION SCHEDULECHARTER MIDDLE SCHOOLS
The municipal rate (the Bond Buyer General Obligation 20-Bond Municipal Bond Index) used to determine total pension liability for HIS is 2.85%.
HIS program is a monthly payment to assist retirees of the state-administered retirement systems in paying their health insurance costs. For the fiscal year ended June 30, 2017, eligible retirees and beneficiaries received a monthly HIS payment equal to the number of years of service credited at retirement multiplied by $5. The minimum payment is $30 and the maximum payment is $150 per month, pursuant to section 112.363, Florida Statutes.
2015
The total pension liability for each of the defined benefit plans was determined by an actuarial valuation as of July 1, 2016, using the entry age normal actuarial cost method.
Both the discount rate and the long-term expected rate of return used for FRS Pension Plan investments is 7.60%. Mortality assumptions for both plans were based on the Generational RP-2000 with Projection Scale BB tables.
20162017
-51-

Florida Retirement System Plan (in thousands): FRS HIS FRS HIS FRS HISTotal pension liability 167,030,999$ 11,768,445$ 161,370,735$ 10,249,201$ 156,115,763$ 9,443,629$ Plan fiduciary net position (141,780,921) (113,859) (148,454,394) (50,774) (150,014,292) (93,385) Net pension liability 25,250,078$ 11,654,586$ 12,916,341$ 10,198,427$ 6,101,471$ 9,350,244$
Plan fiduciary net position as a percentage of the total pension liability 84.88% 0.97% 92.00% 0.50% 96.09% 0.99%
Charter High School:Share of net pension liability as a percentage 0.011451996% 0.018074525% 0.012391542% 0.018101749% 0.011808963% 0.017492768%Share of net pension liability as an amount 2,891,638$ 2,106,510$ 1,600,534$ 1,846,093$ 720,520$ 1,635,616$
Covered-employee payroll 6,894,012$ 6,894,012$ 6,648,338$ 6,648,338$ 6,249,677$ 6,249,677$
Net pension liability as a percentage of covered-employee payroll 41.94% 30.56% 24.07% 27.77% 11.53% 26.17%
Note to Schedule:Assumptions:1.
2. Inflation increases for both plans is assumed at 2.60%.3. Payroll growth for both plans is assumed at 3.25%. 4.5.6.
Benefit Types:1. FRS pension plan's retirees receive a lifetime pension benefit with joint and survivor payment options. 2.
Note: Schedule is intended to show information for 10 years. Additional years will be displayed as they become available.
The municipal rate (the Bond Buyer General Obligation 20-Bond Municipal Bond Index) used to determine total pension liability for HIS is 2.85%.
HIS program is a monthly payment to assist retirees of the state-administered retirement systems in paying their health insurance costs. For the fiscal year ended June 30, 2017, eligible retirees and beneficiaries received a monthly HIS payment equal to the number of years of service credited at retirement multiplied by $5. The minimum payment is $30 and the maximum payment is $150 per month, pursuant to section 112.363, Florida Statutes.
REQUIRED SUPPLEMENTARY INFORMATIONCITY OF PEMBROKE PINES CHARTER SCHOOLS
CHARTER HIGH SCHOOL
2015
The total pension liability for each of the defined benefit plans was determined by an actuarial valuation as of July 1, 2016, using the entry age normal actuarial cost method.
Both the discount rate and the long-term expected rate of return used for FRS Pension Plan investments is 7.60%. Mortality assumptions for both plans were based on the Generational RP-2000 with Projection Scale BB tables.
PENSION SCHEDULE
20162017
-52-

2017 2016 2015 2014 2013 2012 2011 2010 2009 2008Contractually required contribution 1,311,513$ 1,191,296$ 1,202,083$ 1,157,206$ 884,548$ 812,317$ 1,761,326$ 1,563,168$ 1,527,703$ 1,431,383$ Contributions in relation to the contractually required contribution (1,311,513) (1,191,296) (1,202,083) (1,157,206) (884,548) (812,317) (1,761,326) (1,563,168) (1,527,703) (1,431,383) Contributions deficiency (excess) -$ -$ -$ -$ -$ -$ -$ -$ -$ -$
Covered-employee payroll 20,037,874$ 19,526,431$ 19,069,280$ 19,177,190$ 19,842,569$ 19,029,259$ 192,994,408$ 19,090,703$ 18,475,074$ 16,251,480$
Contributions as a percentage of covered-employee payroll 6.55% 6.10% 6.30% 6.03% 4.46% 4.27% 0.91% 8.19% 8.27% 8.81%
CITY OF PEMBROKE PINES CHARTER SCHOOLSREQUIRED SUPPLEMENTARY INFORMATION
SCHEDULE OF CONTRIBUTIONSCHARTER SCHOOLS
SCHEDULE OF CONTRIBUTIONS
-53-