City of Ottawa Taxi and Limousine Regulations and … · Ottawa Taxi and Limousine Regulations and...
19
City of Ottawa Taxi and Limousine Regulations and Services Review “Customer Experience” October 14, 2015 Core Strategies
Transcript of City of Ottawa Taxi and Limousine Regulations and … · Ottawa Taxi and Limousine Regulations and...
City of Ottawa Taxi and Limousine Regulations and
Services Review
“Customer Experience”
October 14, 2015
C o r e S t r a t e g i e s
Table of Contents
Ottawa Taxi and Limousine Regulations and Services Review – Customer Experience ....... 1
Executive Summary ............................................................................................................ 1
Methodology ....................................................................................................................... 2
Findings .............................................................................................................................. 3
1. Uber earns significantly higher customer experience ratings over Taxi ...................... 4
2. Primary advantage of Uber over Taxi: Cost and App Convenience ............................ 5
3. Secondary customer experience factors: Uber rated higher than Taxi ....................... 6
4. Vehicle Insurance is a significant Uber concern ......................................................... 7
5. Customer Experience Ratings differ by Gender ......................................................... 8
6. The importance of service attributes differ from rated service attributes ..................... 9
7. Older adults more familiar with Taxi than Uber.……………………………………….. 10
8. Focus Group participants say 62% of their Vehicle for Hire rides are with Uber ....... 11
9. Public opinion shaped by recent incidents/behaviour within the industry .................. 11
10. Regulatory awareness mixed; customers want new competitive/level playing field .. 12
Appendix A – Chart summarizing all data from tables 1 through 6 ................................. 14
This document has been prepared for the use of the City of Ottawa (the City) during the
Taxicab and Limousine Regulations and Service Review. No representation or warranty is
provided that the information contained in this document is accurate, complete, sufficient or
appropriate for use by any person or entity other than the City. This document may not be
relied upon by any person or entity other than the City, and any and all responsibility or
liability to any such person or entity in connection with their use of this document is hereby
disclaimed.
Core Strategies P a g e | 1
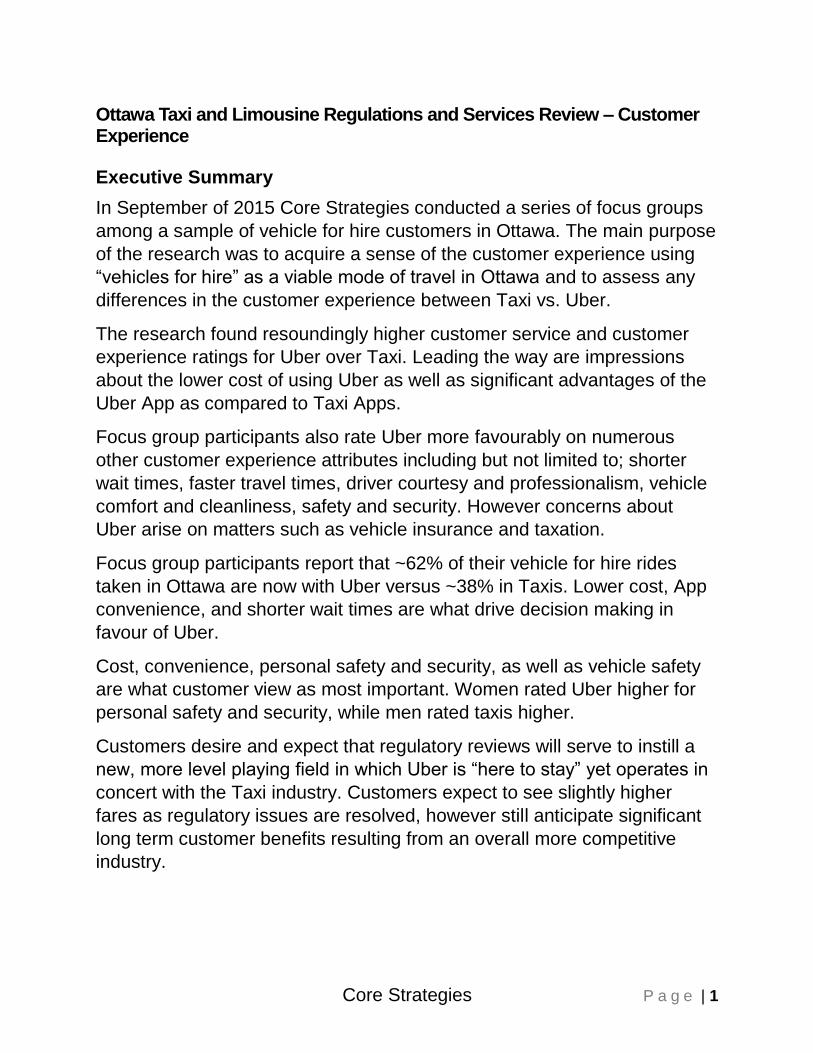
Ottawa Taxi and Limousine Regulations and Services Review – Customer Experience
Executive Summary
In September of 2015 Core Strategies conducted a series of focus groups
among a sample of vehicle for hire customers in Ottawa. The main purpose
of the research was to acquire a sense of the customer experience using
“vehicles for hire” as a viable mode of travel in Ottawa and to assess any
differences in the customer experience between Taxi vs. Uber.
The research found resoundingly higher customer service and customer
experience ratings for Uber over Taxi. Leading the way are impressions
about the lower cost of using Uber as well as significant advantages of the
Uber App as compared to Taxi Apps.
Focus group participants also rate Uber more favourably on numerous
other customer experience attributes including but not limited to; shorter
wait times, faster travel times, driver courtesy and professionalism, vehicle
comfort and cleanliness, safety and security. However concerns about
Uber arise on matters such as vehicle insurance and taxation.
Focus group participants report that ~62% of their vehicle for hire rides
taken in Ottawa are now with Uber versus ~38% in Taxis. Lower cost, App
convenience, and shorter wait times are what drive decision making in
favour of Uber.
Cost, convenience, personal safety and security, as well as vehicle safety
are what customer view as most important. Women rated Uber higher for
personal safety and security, while men rated taxis higher.
Customers desire and expect that regulatory reviews will serve to instill a
new, more level playing field in which Uber is “here to stay” yet operates in
concert with the Taxi industry. Customers expect to see slightly higher
fares as regulatory issues are resolved, however still anticipate significant
long term customer benefits resulting from an overall more competitive
industry.
Core Strategies P a g e | 2
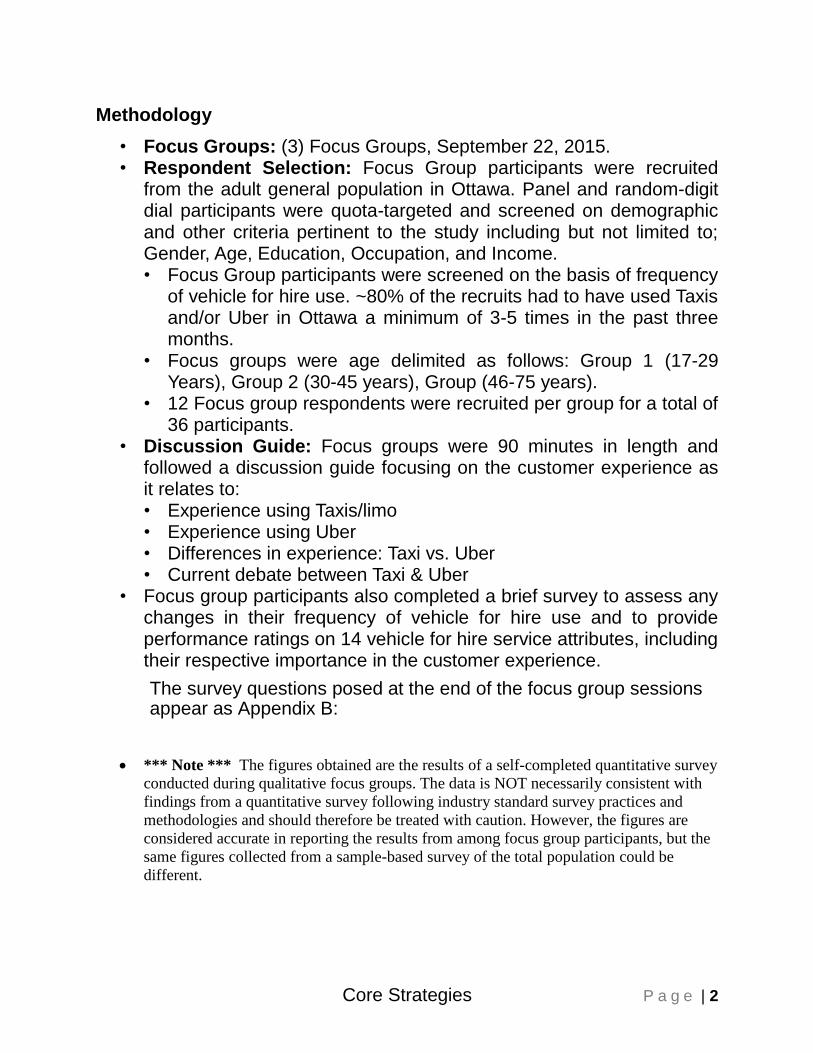
Methodology
• Focus Groups: (3) Focus Groups, September 22, 2015. • Respondent Selection: Focus Group participants were recruited
from the adult general population in Ottawa. Panel and random-digit dial participants were quota-targeted and screened on demographic and other criteria pertinent to the study including but not limited to; Gender, Age, Education, Occupation, and Income. • Focus Group participants were screened on the basis of frequency
of vehicle for hire use. ~80% of the recruits had to have used Taxis and/or Uber in Ottawa a minimum of 3-5 times in the past three months.
• Focus groups were age delimited as follows: Group 1 (17-29 Years), Group 2 (30-45 years), Group (46-75 years).
• 12 Focus group respondents were recruited per group for a total of 36 participants.
• Discussion Guide: Focus groups were 90 minutes in length and followed a discussion guide focusing on the customer experience as it relates to: • Experience using Taxis/limo • Experience using Uber • Differences in experience: Taxi vs. Uber • Current debate between Taxi & Uber
• Focus group participants also completed a brief survey to assess any changes in their frequency of vehicle for hire use and to provide performance ratings on 14 vehicle for hire service attributes, including their respective importance in the customer experience.
The survey questions posed at the end of the focus group sessions appear as Appendix B:
*** Note *** The figures obtained are the results of a self-completed quantitative survey
conducted during qualitative focus groups. The data is NOT necessarily consistent with
findings from a quantitative survey following industry standard survey practices and
methodologies and should therefore be treated with caution. However, the figures are
considered accurate in reporting the results from among focus group participants, but the
same figures collected from a sample-based survey of the total population could be
different.
Core Strategies P a g e | 3
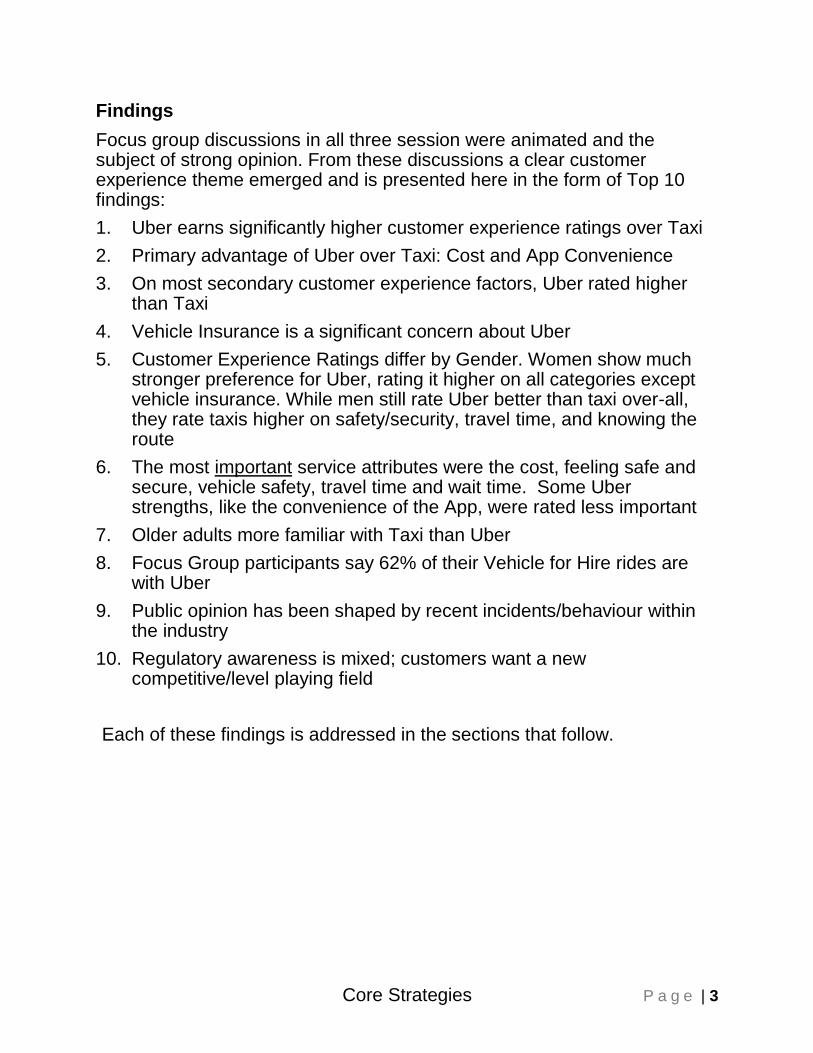
Findings
Focus group discussions in all three session were animated and the subject of strong opinion. From these discussions a clear customer experience theme emerged and is presented here in the form of Top 10 findings:
1. Uber earns significantly higher customer experience ratings over Taxi
2. Primary advantage of Uber over Taxi: Cost and App Convenience
3. On most secondary customer experience factors, Uber rated higher than Taxi
4. Vehicle Insurance is a significant concern about Uber
5. Customer Experience Ratings differ by Gender. Women show much stronger preference for Uber, rating it higher on all categories except vehicle insurance. While men still rate Uber better than taxi over-all, they rate taxis higher on safety/security, travel time, and knowing the route
6. The most important service attributes were the cost, feeling safe and secure, vehicle safety, travel time and wait time. Some Uber strengths, like the convenience of the App, were rated less important
7. Older adults more familiar with Taxi than Uber
8. Focus Group participants say 62% of their Vehicle for Hire rides are with Uber
9. Public opinion has been shaped by recent incidents/behaviour within the industry
10. Regulatory awareness is mixed; customers want a new competitive/level playing field
Each of these findings is addressed in the sections that follow.

Core Strategies P a g e | 4
1. Uber earns significantly higher customer experience ratings over Taxi
Focus group participants describe and rate the overall customer service experience using Uber as significantly higher than the taxi customer experience.
Table 1
Experience Taxi Uber Diff
Cost 3.9 9.1 5.2
Convenience using App 5.1 9.4 4.3
Payment Process 6.0 9.6 3.6
Driver Courtesy 5.6 8.7 3.1
Wait Times 5.8 8.8 3.0
Driver Professionalism 5.5 8.3 2.8
Vehicle Comfort 6.4 8.2 1.8
Vehicle cleanliness 7.1 8.5 1.4
Functionality in other cities 7.5 8.4 0.9
Travel Time / Arriving on time 7.4 7.9 0.5
Feeling safe and secure 7.6 7.8 0.2
Vehicle Safety 7.5 7.7 0.2
Knowledge of the route 7.9 7.9 0.0
Vehicle is properly insured 9.0 6.1 -2.9
Average 6.6 8.3 1.7
Uber factors receiving the greatest number of mentions and most praise include:
• Lower cost
• App convenience
• Driver courtesy, attitude, and overall friendliness
• Faster pick-up times (shorter wait time)
• Ability to track vehicle on route to pick up
• Ability to rate the driver and for the driver to rate the customer
• Vehicle comfort: Including bottle of water and music service
• Payment process: happens automatically, including gratuity
Core Strategies P a g e | 5
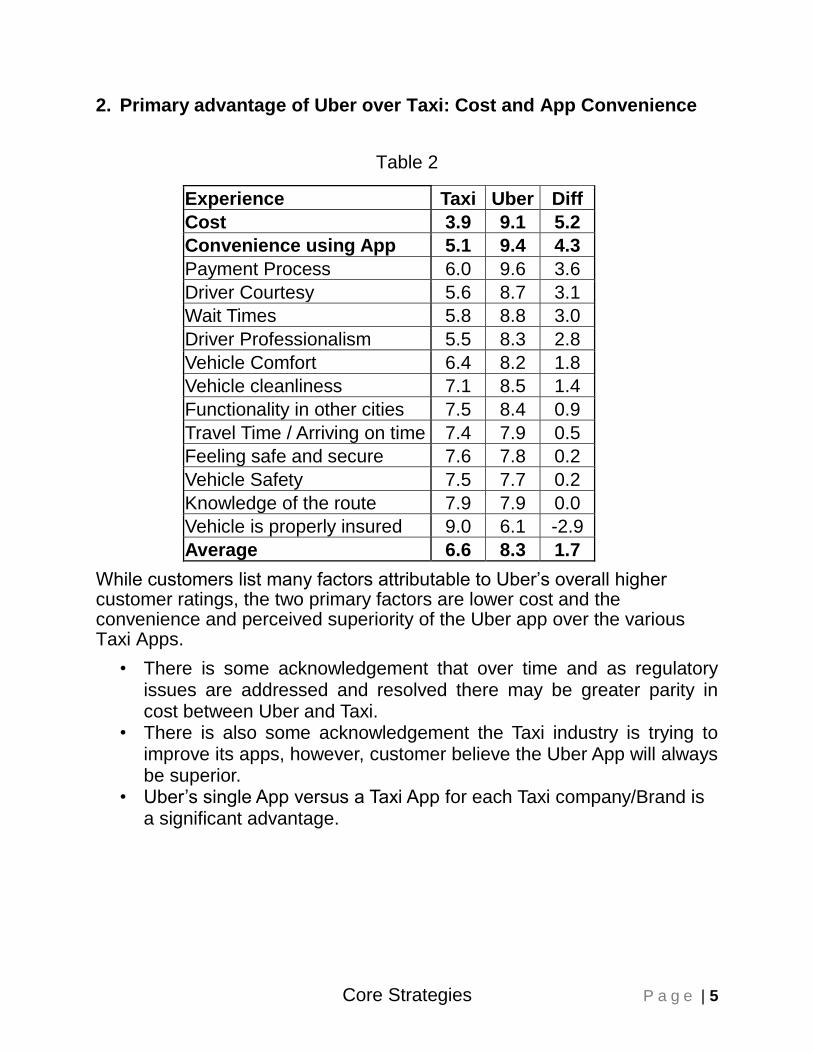
2. Primary advantage of Uber over Taxi: Cost and App Convenience
Table 2
Experience Taxi Uber Diff
Cost 3.9 9.1 5.2
Convenience using App 5.1 9.4 4.3
Payment Process 6.0 9.6 3.6
Driver Courtesy 5.6 8.7 3.1
Wait Times 5.8 8.8 3.0
Driver Professionalism 5.5 8.3 2.8
Vehicle Comfort 6.4 8.2 1.8
Vehicle cleanliness 7.1 8.5 1.4
Functionality in other cities 7.5 8.4 0.9
Travel Time / Arriving on time 7.4 7.9 0.5
Feeling safe and secure 7.6 7.8 0.2
Vehicle Safety 7.5 7.7 0.2
Knowledge of the route 7.9 7.9 0.0
Vehicle is properly insured 9.0 6.1 -2.9
Average 6.6 8.3 1.7
While customers list many factors attributable to Uber’s overall higher customer ratings, the two primary factors are lower cost and the convenience and perceived superiority of the Uber app over the various Taxi Apps.
• There is some acknowledgement that over time and as regulatory issues are addressed and resolved there may be greater parity in cost between Uber and Taxi.
• There is also some acknowledgement the Taxi industry is trying to improve its apps, however, customer believe the Uber App will always be superior.
• Uber’s single App versus a Taxi App for each Taxi company/Brand is a significant advantage.
Core Strategies P a g e | 6
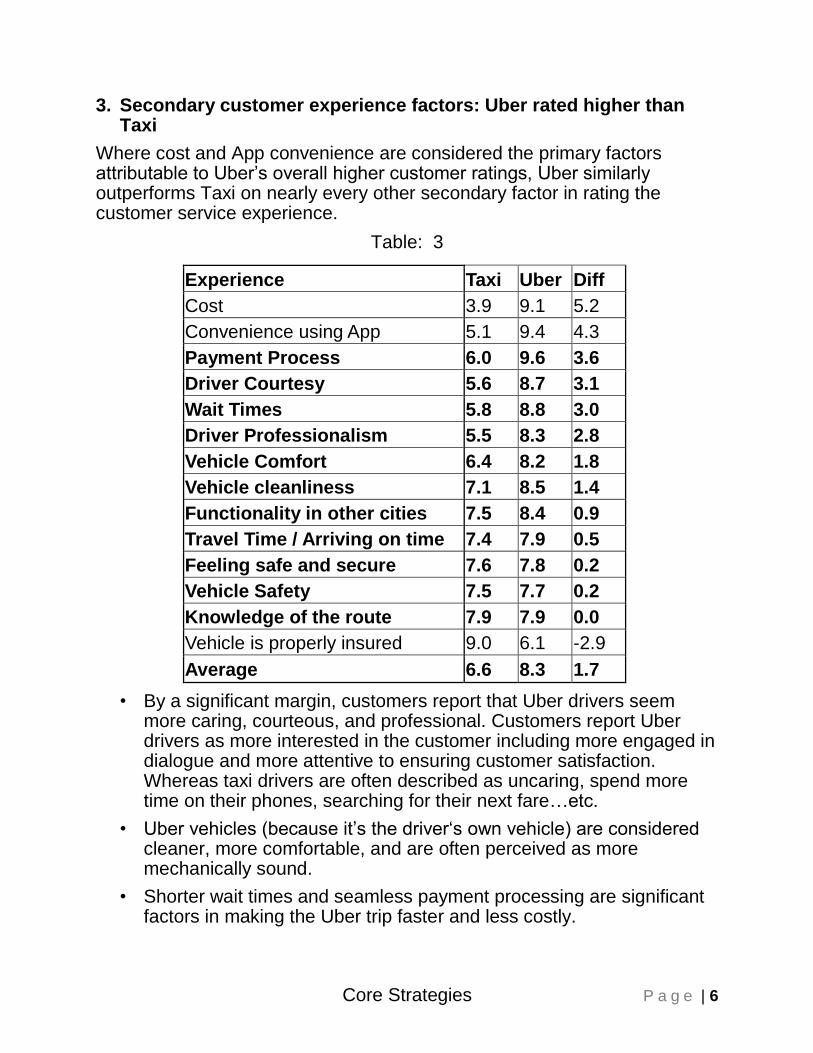
3. Secondary customer experience factors: Uber rated higher than Taxi
Where cost and App convenience are considered the primary factors attributable to Uber’s overall higher customer ratings, Uber similarly outperforms Taxi on nearly every other secondary factor in rating the customer service experience.
Table: 3
Experience Taxi Uber Diff
Cost 3.9 9.1 5.2
Convenience using App 5.1 9.4 4.3
Payment Process 6.0 9.6 3.6
Driver Courtesy 5.6 8.7 3.1
Wait Times 5.8 8.8 3.0
Driver Professionalism 5.5 8.3 2.8
Vehicle Comfort 6.4 8.2 1.8
Vehicle cleanliness 7.1 8.5 1.4
Functionality in other cities 7.5 8.4 0.9
Travel Time / Arriving on time 7.4 7.9 0.5
Feeling safe and secure 7.6 7.8 0.2
Vehicle Safety 7.5 7.7 0.2
Knowledge of the route 7.9 7.9 0.0
Vehicle is properly insured 9.0 6.1 -2.9
Average 6.6 8.3 1.7
• By a significant margin, customers report that Uber drivers seem more caring, courteous, and professional. Customers report Uber drivers as more interested in the customer including more engaged in dialogue and more attentive to ensuring customer satisfaction. Whereas taxi drivers are often described as uncaring, spend more time on their phones, searching for their next fare…etc.
• Uber vehicles (because it’s the driver‘s own vehicle) are considered cleaner, more comfortable, and are often perceived as more mechanically sound.
• Shorter wait times and seamless payment processing are significant factors in making the Uber trip faster and less costly.
Core Strategies P a g e | 7
4. Vehicle Insurance is a significant Uber concern
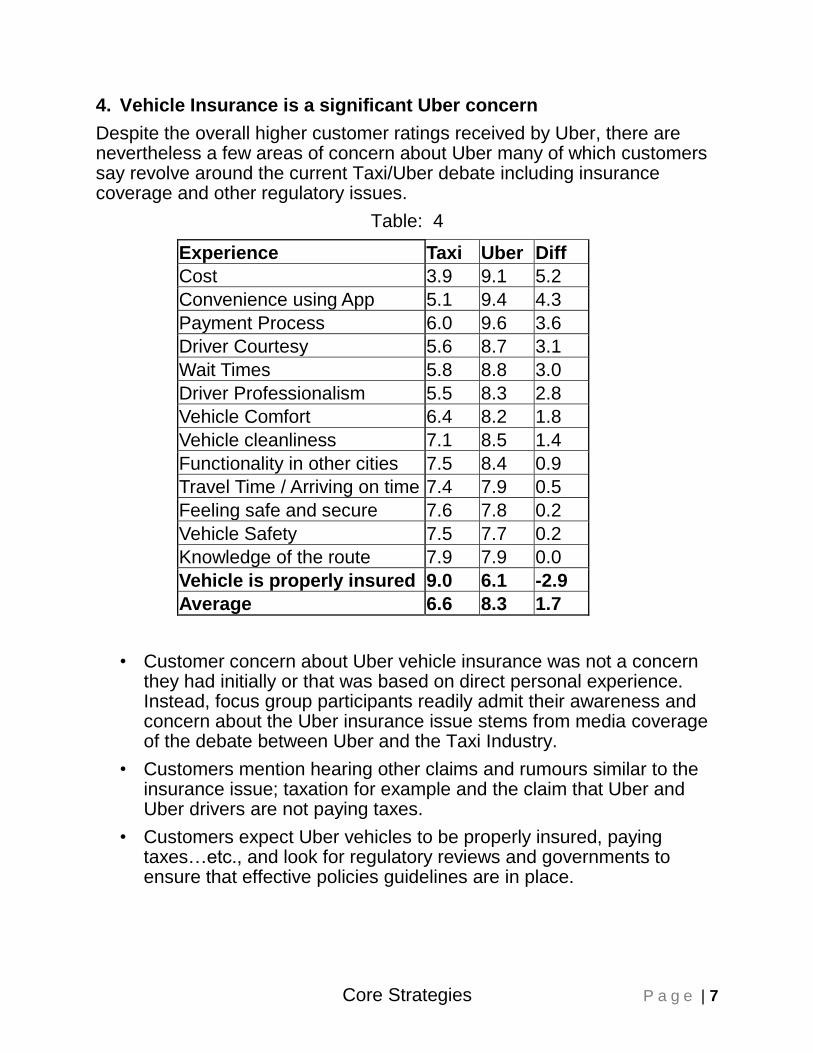
Despite the overall higher customer ratings received by Uber, there are nevertheless a few areas of concern about Uber many of which customers say revolve around the current Taxi/Uber debate including insurance coverage and other regulatory issues.
Table: 4
Experience Taxi Uber Diff
Cost 3.9 9.1 5.2
Convenience using App 5.1 9.4 4.3
Payment Process 6.0 9.6 3.6
Driver Courtesy 5.6 8.7 3.1
Wait Times 5.8 8.8 3.0
Driver Professionalism 5.5 8.3 2.8
Vehicle Comfort 6.4 8.2 1.8
Vehicle cleanliness 7.1 8.5 1.4
Functionality in other cities 7.5 8.4 0.9
Travel Time / Arriving on time 7.4 7.9 0.5
Feeling safe and secure 7.6 7.8 0.2
Vehicle Safety 7.5 7.7 0.2
Knowledge of the route 7.9 7.9 0.0
Vehicle is properly insured 9.0 6.1 -2.9
Average 6.6 8.3 1.7
• Customer concern about Uber vehicle insurance was not a concern they had initially or that was based on direct personal experience. Instead, focus group participants readily admit their awareness and concern about the Uber insurance issue stems from media coverage of the debate between Uber and the Taxi Industry.
• Customers mention hearing other claims and rumours similar to the insurance issue; taxation for example and the claim that Uber and Uber drivers are not paying taxes.
• Customers expect Uber vehicles to be properly insured, paying taxes…etc., and look for regulatory reviews and governments to ensure that effective policies guidelines are in place.
Core Strategies P a g e | 8
5. Customer Experience Ratings differ by Gender
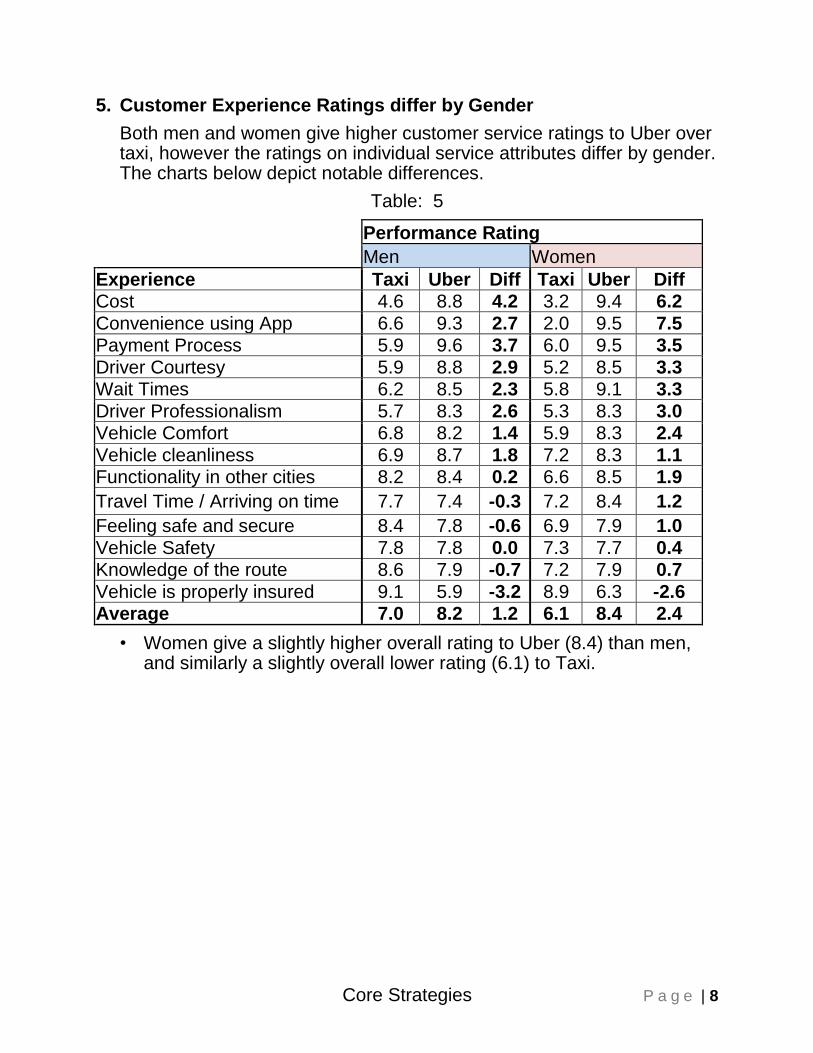
Both men and women give higher customer service ratings to Uber over taxi, however the ratings on individual service attributes differ by gender. The charts below depict notable differences.
Table: 5
Performance Rating
Men Women
Experience Taxi Uber Diff Taxi Uber Diff Cost 4.6 8.8 4.2 3.2 9.4 6.2
Convenience using App 6.6 9.3 2.7 2.0 9.5 7.5
Payment Process 5.9 9.6 3.7 6.0 9.5 3.5
Driver Courtesy 5.9 8.8 2.9 5.2 8.5 3.3 Wait Times 6.2 8.5 2.3 5.8 9.1 3.3
Driver Professionalism 5.7 8.3 2.6 5.3 8.3 3.0 Vehicle Comfort 6.8 8.2 1.4 5.9 8.3 2.4
Vehicle cleanliness 6.9 8.7 1.8 7.2 8.3 1.1 Functionality in other cities 8.2 8.4 0.2 6.6 8.5 1.9
Travel Time / Arriving on time 7.7 7.4 -0.3 7.2 8.4 1.2
Feeling safe and secure 8.4 7.8 -0.6 6.9 7.9 1.0
Vehicle Safety 7.8 7.8 0.0 7.3 7.7 0.4 Knowledge of the route 8.6 7.9 -0.7 7.2 7.9 0.7
Vehicle is properly insured 9.1 5.9 -3.2 8.9 6.3 -2.6 Average 7.0 8.2 1.2 6.1 8.4 2.4
• Women give a slightly higher overall rating to Uber (8.4) than men, and similarly a slightly overall lower rating (6.1) to Taxi.
Core Strategies P a g e | 9
6. The importance of service attributes differ from rated service attributes
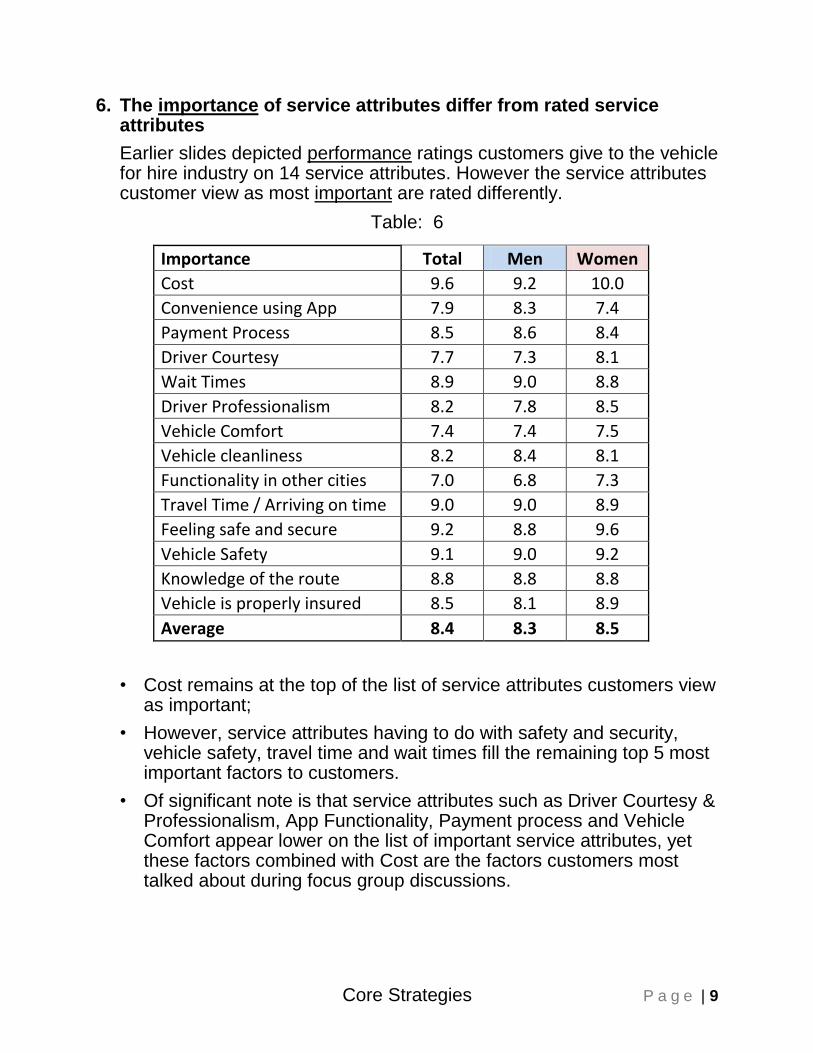
Earlier slides depicted performance ratings customers give to the vehicle for hire industry on 14 service attributes. However the service attributes customer view as most important are rated differently.
Table: 6
Importance Total Men Women
Cost 9.6 9.2 10.0
Convenience using App 7.9 8.3 7.4
Payment Process 8.5 8.6 8.4
Driver Courtesy 7.7 7.3 8.1
Wait Times 8.9 9.0 8.8
Driver Professionalism 8.2 7.8 8.5
Vehicle Comfort 7.4 7.4 7.5
Vehicle cleanliness 8.2 8.4 8.1
Functionality in other cities 7.0 6.8 7.3
Travel Time / Arriving on time 9.0 9.0 8.9
Feeling safe and secure 9.2 8.8 9.6
Vehicle Safety 9.1 9.0 9.2
Knowledge of the route 8.8 8.8 8.8
Vehicle is properly insured 8.5 8.1 8.9
Average 8.4 8.3 8.5
• Cost remains at the top of the list of service attributes customers view as important;
• However, service attributes having to do with safety and security, vehicle safety, travel time and wait times fill the remaining top 5 most important factors to customers.
• Of significant note is that service attributes such as Driver Courtesy & Professionalism, App Functionality, Payment process and Vehicle Comfort appear lower on the list of important service attributes, yet these factors combined with Cost are the factors customers most talked about during focus group discussions.

Core Strategies P a g e | 10
• Safety and security, vehicle safety…etc. are important “expected” factors versus cost and app convenience factors which “drive” decision making on which service they will use.
7. Older adults more familiar with Taxi than Uber
The first and second focus groups were conducted among 17-29 year olds and 30-45 years olds respectively, whereas the third focus group consisted of adults between the ages of 46-75. Significant differences existed between the two younger groups and the older group. By a significant margin the two younger groups were:
• Much more familiar with and experienced at using Uber
• Slightly more harsh in their assessment of their experiences using taxis and more complementary of their Uber experiences
• More certain of the cost benefit of Uber
• More appreciative and complimentary of the benefits of the Uber App.
• More resounding in their desire to see Uber succeed and flourish
By contrast older focus group participants were:
• Less familiar and experienced using Uber
• More prone to discuss the virtues of Uber from what they heard from others versus what they experienced personally
• Slightly more forgiving of the Taxi industry’s alleged failings
• More keen to see that a level playing field emerges as a result of regulatory reviews
• Nevertheless equally prone to believing Uber is “here to stay.”
Note – Despite the differences noted above, Performance and Importance ratings were not significantly different by age group.
Core Strategies P a g e | 11
8. Focus Group participants say 62% of their Vehicle for Hire rides are with Uber
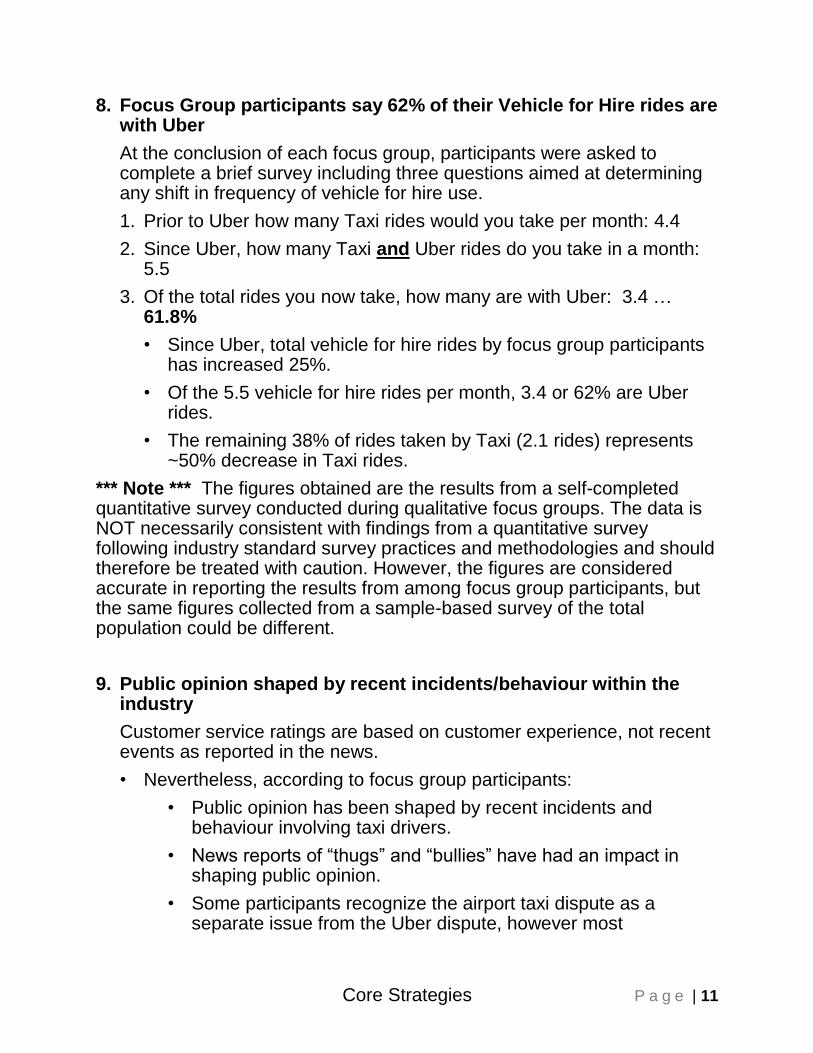
At the conclusion of each focus group, participants were asked to complete a brief survey including three questions aimed at determining any shift in frequency of vehicle for hire use.
1. Prior to Uber how many Taxi rides would you take per month: 4.4
2. Since Uber, how many Taxi and Uber rides do you take in a month: 5.5
3. Of the total rides you now take, how many are with Uber: 3.4 … 61.8%
• Since Uber, total vehicle for hire rides by focus group participants has increased 25%.
• Of the 5.5 vehicle for hire rides per month, 3.4 or 62% are Uber rides.
• The remaining 38% of rides taken by Taxi (2.1 rides) represents ~50% decrease in Taxi rides.
*** Note *** The figures obtained are the results from a self-completed quantitative survey conducted during qualitative focus groups. The data is NOT necessarily consistent with findings from a quantitative survey following industry standard survey practices and methodologies and should therefore be treated with caution. However, the figures are considered accurate in reporting the results from among focus group participants, but the same figures collected from a sample-based survey of the total population could be different.
9. Public opinion shaped by recent incidents/behaviour within the industry
Customer service ratings are based on customer experience, not recent events as reported in the news.
• Nevertheless, according to focus group participants:
• Public opinion has been shaped by recent incidents and behaviour involving taxi drivers.
• News reports of “thugs” and “bullies” have had an impact in shaping public opinion.
• Some participants recognize the airport taxi dispute as a separate issue from the Uber dispute, however most
Core Strategies P a g e | 12
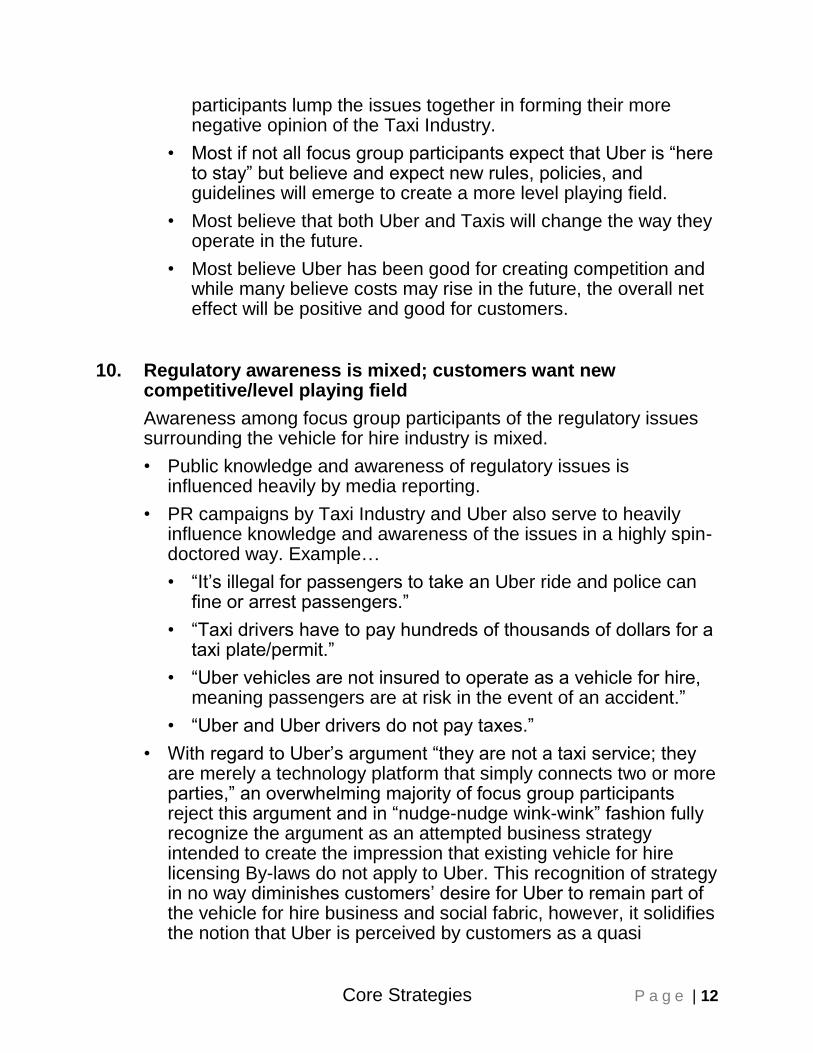
participants lump the issues together in forming their more negative opinion of the Taxi Industry.
• Most if not all focus group participants expect that Uber is “here to stay” but believe and expect new rules, policies, and guidelines will emerge to create a more level playing field.
• Most believe that both Uber and Taxis will change the way they operate in the future.
• Most believe Uber has been good for creating competition and while many believe costs may rise in the future, the overall net effect will be positive and good for customers.
10. Regulatory awareness is mixed; customers want new competitive/level playing field
Awareness among focus group participants of the regulatory issues surrounding the vehicle for hire industry is mixed.
• Public knowledge and awareness of regulatory issues is influenced heavily by media reporting.
• PR campaigns by Taxi Industry and Uber also serve to heavily influence knowledge and awareness of the issues in a highly spin-doctored way. Example…
• “It’s illegal for passengers to take an Uber ride and police can fine or arrest passengers.”
• “Taxi drivers have to pay hundreds of thousands of dollars for a taxi plate/permit.”
• “Uber vehicles are not insured to operate as a vehicle for hire, meaning passengers are at risk in the event of an accident.”
• “Uber and Uber drivers do not pay taxes.”
• With regard to Uber’s argument “they are not a taxi service; they are merely a technology platform that simply connects two or more parties,” an overwhelming majority of focus group participants reject this argument and in “nudge-nudge wink-wink” fashion fully recognize the argument as an attempted business strategy intended to create the impression that existing vehicle for hire licensing By-laws do not apply to Uber. This recognition of strategy in no way diminishes customers’ desire for Uber to remain part of the vehicle for hire business and social fabric, however, it solidifies the notion that Uber is perceived by customers as a quasi
Core Strategies P a g e | 13
“dispatcher” and the Uber vehicle/driver as providing a Taxi type of service.
• The participants are generally aware of and highly supportive of the vehicle for hire industry review currently taking place in many Canadian cities. The most common desired outcomes include:
• New rules, policies, and regulations that allow both Taxi and Uber to operate.
• Continued lower fares as a result of competition, although most believe Uber costs will increase as regulatory issues are resolved.
• That all vehicle for hire agencies be regulated in terms of safety and security standards.
Core Strategies P a g e | 14
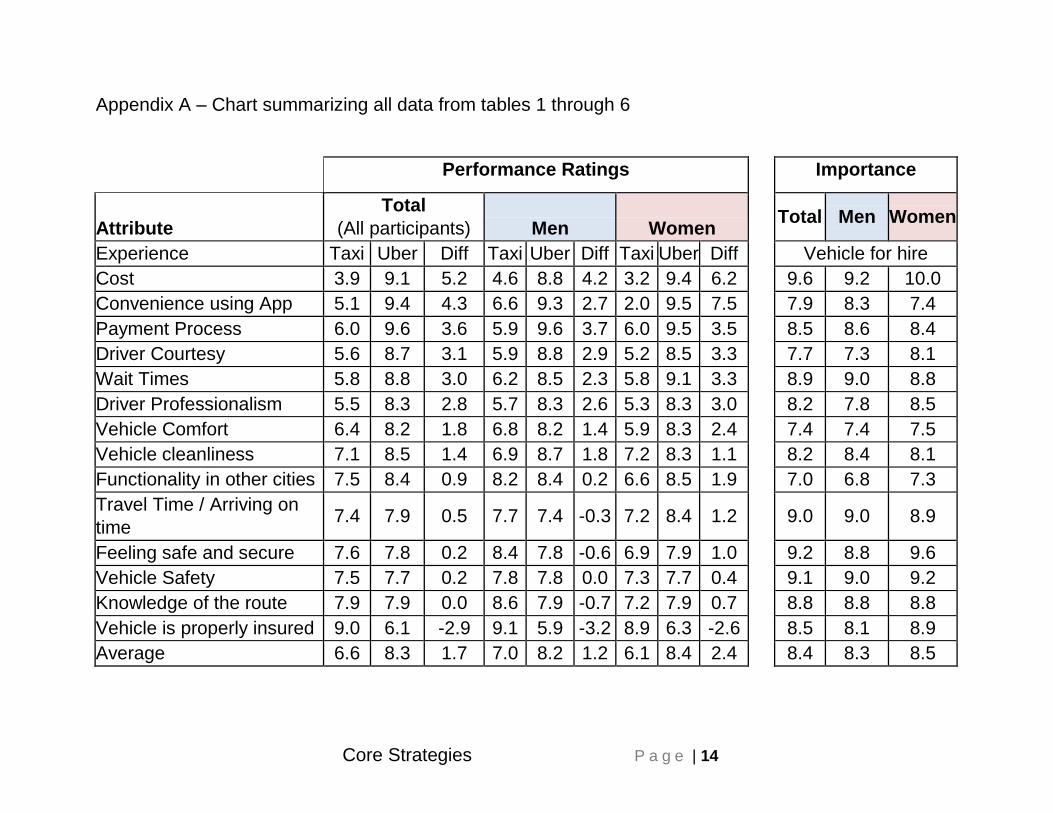
Appendix A – Chart summarizing all data from tables 1 through 6
Empty Cell Performance Ratings
Em
pty
Cell
Importance
Attribute
Total
(All participants) Men Women Total Men Women
Experience Taxi Uber Diff Taxi Uber Diff Taxi Uber Diff Vehicle for hire
Cost 3.9 9.1 5.2 4.6 8.8 4.2 3.2 9.4 6.2 9.6 9.2 10.0
Convenience using App 5.1 9.4 4.3 6.6 9.3 2.7 2.0 9.5 7.5 7.9 8.3 7.4
Payment Process 6.0 9.6 3.6 5.9 9.6 3.7 6.0 9.5 3.5 8.5 8.6 8.4
Driver Courtesy 5.6 8.7 3.1 5.9 8.8 2.9 5.2 8.5 3.3 7.7 7.3 8.1
Wait Times 5.8 8.8 3.0 6.2 8.5 2.3 5.8 9.1 3.3 8.9 9.0 8.8
Driver Professionalism 5.5 8.3 2.8 5.7 8.3 2.6 5.3 8.3 3.0 8.2 7.8 8.5
Vehicle Comfort 6.4 8.2 1.8 6.8 8.2 1.4 5.9 8.3 2.4 7.4 7.4 7.5
Vehicle cleanliness 7.1 8.5 1.4 6.9 8.7 1.8 7.2 8.3 1.1 8.2 8.4 8.1
Functionality in other cities 7.5 8.4 0.9 8.2 8.4 0.2 6.6 8.5 1.9 7.0 6.8 7.3
Travel Time / Arriving on
time 7.4 7.9 0.5 7.7 7.4 -0.3 7.2 8.4 1.2 9.0 9.0 8.9
Feeling safe and secure 7.6 7.8 0.2 8.4 7.8 -0.6 6.9 7.9 1.0 9.2 8.8 9.6
Vehicle Safety 7.5 7.7 0.2 7.8 7.8 0.0 7.3 7.7 0.4 9.1 9.0 9.2
Knowledge of the route 7.9 7.9 0.0 8.6 7.9 -0.7 7.2 7.9 0.7 8.8 8.8 8.8
Vehicle is properly insured 9.0 6.1 -2.9 9.1 5.9 -3.2 8.9 6.3 -2.6 8.5 8.1 8.9
Average 6.6 8.3 1.7 7.0 8.2 1.2 6.1 8.4 2.4 8.4 8.3 8.5
Core Strategies P a g e | 15
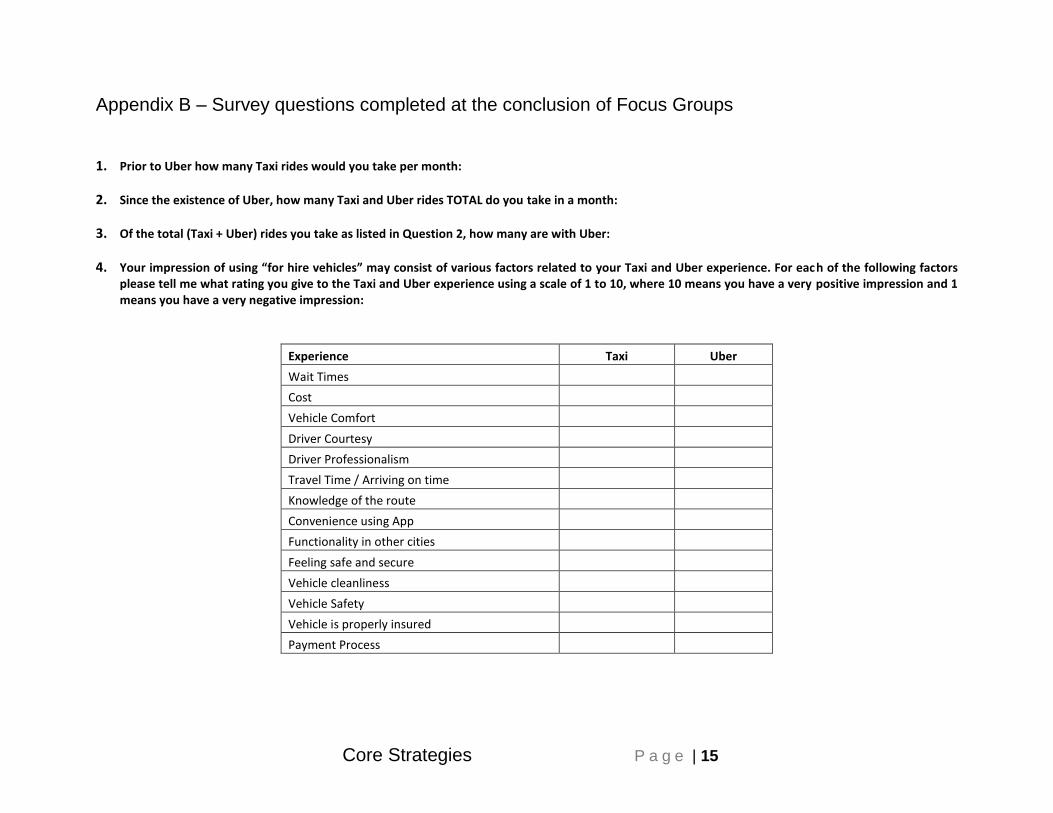
Appendix B – Survey questions completed at the conclusion of Focus Groups
1. Prior to Uber how many Taxi rides would you take per month:
2. Since the existence of Uber, how many Taxi and Uber rides TOTAL do you take in a month:
3. Of the total (Taxi + Uber) rides you take as listed in Question 2, how many are with Uber:
4. Your impression of using “for hire vehicles” may consist of various factors related to your Taxi and Uber experience. For each of the following factors please tell me what rating you give to the Taxi and Uber experience using a scale of 1 to 10, where 10 means you have a very positive impression and 1 means you have a very negative impression:
Experience Taxi Uber
Wait Times
Cost
Vehicle Comfort
Driver Courtesy
Driver Professionalism
Travel Time / Arriving on time
Knowledge of the route
Convenience using App
Functionality in other cities
Feeling safe and secure
Vehicle cleanliness
Vehicle Safety
Vehicle is properly insured
Payment Process
Core Strategies P a g e | 16
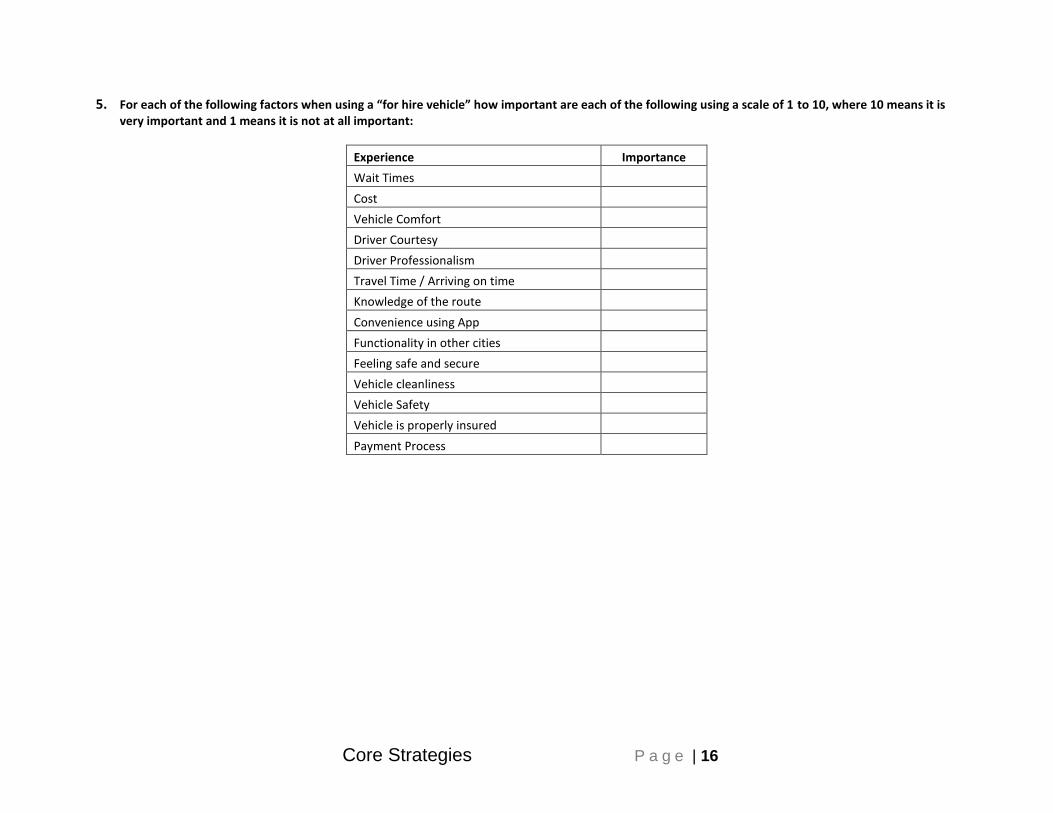
5. For each of the following factors when using a “for hire vehicle” how important are each of the following using a scale of 1 to 10, where 10 means it is very important and 1 means it is not at all important:
Experience Importance
Wait Times
Cost
Vehicle Comfort
Driver Courtesy
Driver Professionalism
Travel Time / Arriving on time
Knowledge of the route
Convenience using App
Functionality in other cities
Feeling safe and secure
Vehicle cleanliness
Vehicle Safety
Vehicle is properly insured
Payment Process
Core Strategies P a g e | 1
City of Ottawa Taxi and Limousine Regulations and Services Review
“Customer Experience”
FOR MORE INFORMATION
PLEASE CONTACT: Dan Baril
Core Strategies Inc. www.corestrategies.ca
[email protected] 416.230.6503