CITY OF NEW YORK, NEW YORK - Welcome to NYC. · PDF filevolume 1 of 1 city of new york, new...
131
VOLUME 1 OF 1 CITY OF NEW YORK, NEW YORK COMMUNITY NAME COMMUNITY NUMBER BRONX COUNTY KINGS COUNTY NEW YORK COUNTY QUEENS COUNTY RICHMOND COUNTY Preliminary: DECEMEBER 5, 2013 FLOOD INSURANCE STUDY NUMBER 360497V000B Version Number 1.0.0.0 City of New York
Transcript of CITY OF NEW YORK, NEW YORK - Welcome to NYC. · PDF filevolume 1 of 1 city of new york, new...

VOLUME 1 OF 1
CITY OF NEW YORK,NEW YORK COMMUNITY NAME COMMUNITY NUMBERBRONX COUNTY KINGS COUNTY NEW YORK COUNTY QUEENS COUNTY RICHMOND COUNTY
Preliminary:DECEMEBER 5, 2013
FLOOD INSURANCE STUDY NUMBER 360497V000BVersion Number 1.0.0.0
City of New York

NOTICE TO FLOOD INSURANCE STUDY USERS
Communities participating in the National Flood Insurance Program have established repositories of flood hazard data for floodplain management and flood insurance purposes. This Flood Insurance Study (FIS) may not contain all data available within the repository. It is advisable to contact the community repository for any additional data.
Part or all of this FIS may be revised and republished at any time. In addition, part of this FIS may be revised by the Letter of Map Revision process, which does not involve republication or redistribution of the FIS. It is, therefore, the responsibility of the user to consult with community officials and to check the community repository to obtain the most current FIS components.
Initial FIS Effective Date: May 16, 1983 (FIS report); November 16, 1983 (Flood Insurance Rate Map)
Revised FIS Dates: February 15, 1991- To change zone designations and to add special flood hazard areas.
May 18, 1992- To add otherwise protected areas.
July 5, 1994- To add base flood elevations, to add special flood hazard areas and to change special flood hazard areas.
May 21, 2001- To reflect updated topographic information, to update map format and to change special flood hazard areas.
September 5, 2007- To reflect updated topographic information, to update map format and to change special flood hazard areas

TABLE OF CONTENTS
Page
1.0 INTRODUCTION 1
1.1 Purpose of Study 1
1.2 Authority and Acknowledgments 1
1.3 Coordination 2
2.0 AREA STUDIED 3
2.1 Scope of Study 3
2.2 Community Description 5
2.3 Principal Flood Problems 8
2.4 Flood Protection Measures 11
3.0 ENGINEERING METHODS 13
3.1 Riverine Hydrologic Analyses 13
3.2 Riverine Hydraulic Analyses 18
3.3 Coastal Analyses 20
3.4 Wave Height Analyses 22
3.5 Vertical Datum 57
4.0 FLOODPLAIN MANAGEMENT APPLICATIONS 57
4.1 Floodplain Boundaries 58
4.2 Floodways 58
5.0 INSURANCE APPLICATIONS 71
6.0 FLOOD INSURANCE RATE MAP 72
7.0 OTHER STUDIES 72
8.0 LOCATION OF DATA 73
9.0 BIBLIOGRAPHY AND REFERENCES 73
ii
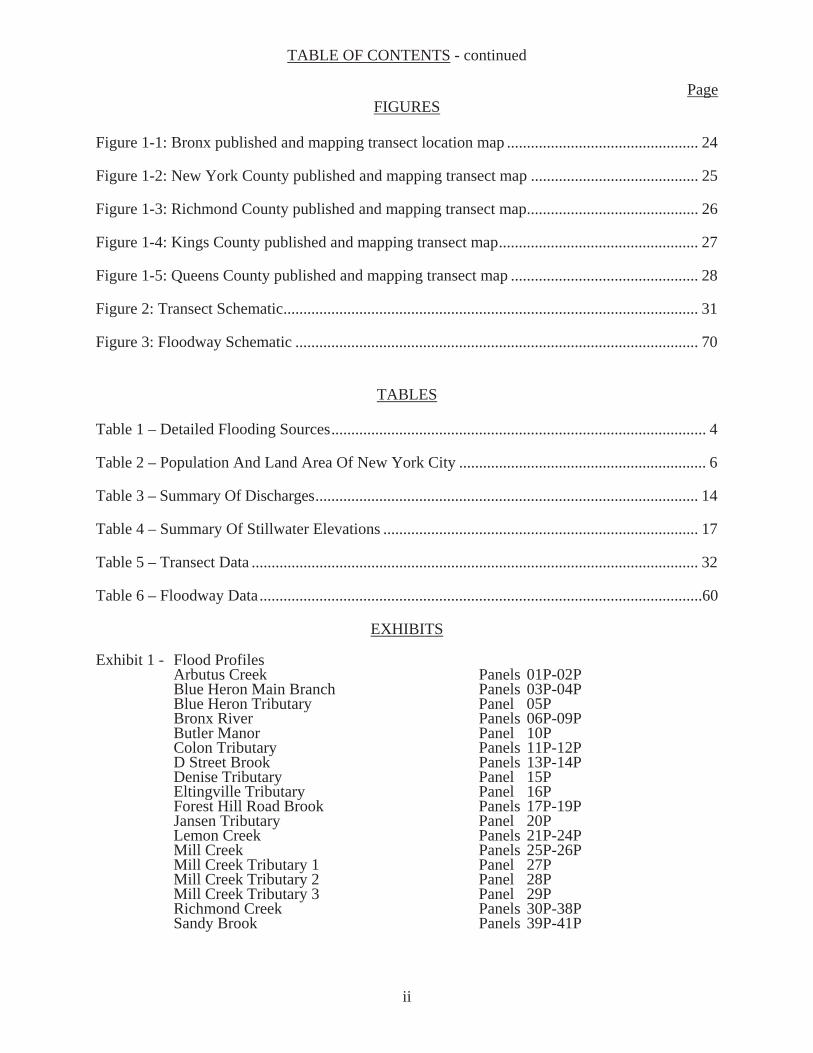
TABLE OF CONTENTS - continued
PageFIGURES
Figure 1-1: Bronx published and mapping transect location map ................................................ 24
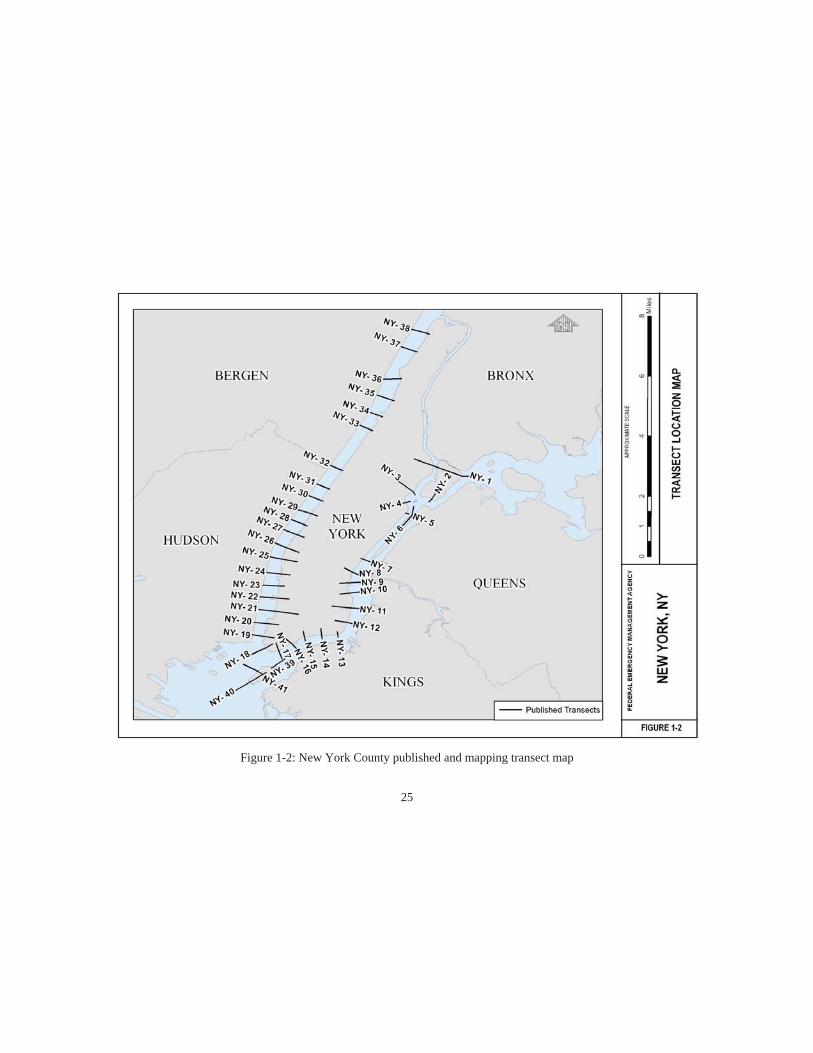
Figure 1-2: New York County published and mapping transect map .......................................... 25
Figure 1-3: Richmond County published and mapping transect map ........................................... 26
Figure 1-4: Kings County published and mapping transect map .................................................. 27
Figure 1-5: Queens County published and mapping transect map ............................................... 28
Figure 2: Transect Schematic ........................................................................................................ 31
Figure 3: Floodway Schematic ..................................................................................................... 70
TABLES
Table 1 – Detailed Flooding Sources .............................................................................................. 4
Table 2 – Population And Land Area Of New York City .............................................................. 6
Table 3 – Summary Of Discharges ................................................................................................ 14
Table 4 – Summary Of Stillwater Elevations ............................................................................... 17
Table 5 – Transect Data ................................................................................................................ 32
Table 6 – Floodway Data ...............................................................................................................60
EXHIBITS
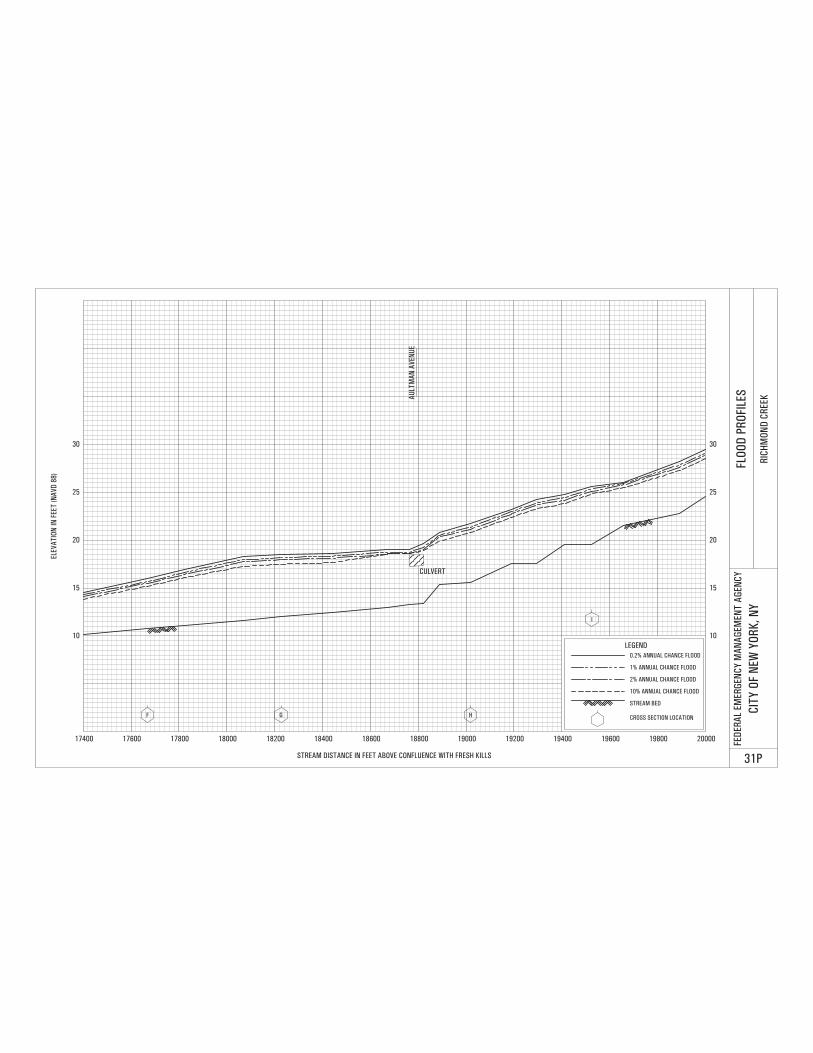
Exhibit 1 - Flood Profiles Arbutus Creek Panels 01P-02P Blue Heron Main Branch Panels 03P-04P Blue Heron Tributary Panel 05P Bronx River Panels 06P-09P Butler Manor Panel 10P Colon Tributary Panels 11P-12P D Street Brook Panels 13P-14P Denise Tributary Panel 15P Eltingville Tributary Panel 16P Forest Hill Road Brook Panels 17P-19P Jansen Tributary Panel 20P Lemon Creek Panels 21P-24P Mill Creek Panels 25P-26P Mill Creek Tributary 1 Panel 27P Mill Creek Tributary 2 Panel 28P Mill Creek Tributary 3 Panel 29P Richmond Creek Panels 30P-38P Sandy Brook Panels 39P-41P

iii
EXHIBITS – continued
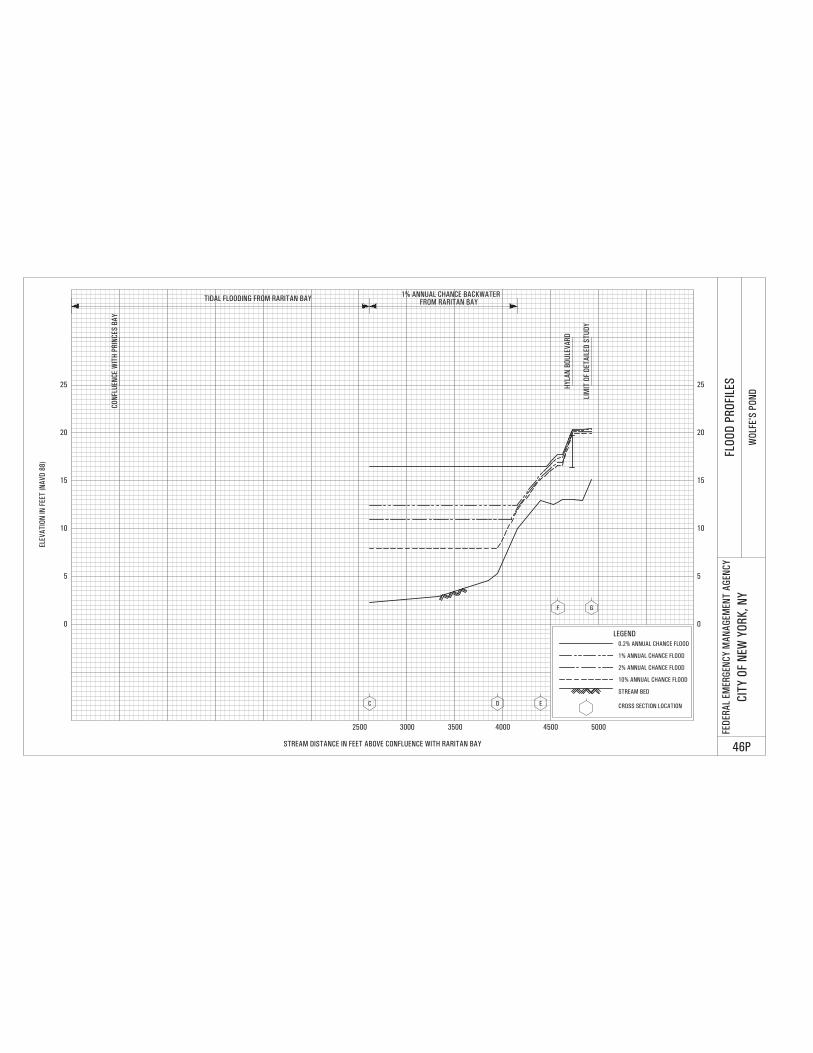
Exhibit 1 - Flood Profiles (continued) Sweet Brook Panels 42P-45P Wolfe’s Pond Panel 46P
Exhibit 2 - Flood Insurance Rate Map Index Flood Insurance Rate Map

1
FLOOD INSURANCE STUDY CITY OF NEW YORK,
BRONX, KINGS, NEW YORK, QUEENS, AND RICHMOND COUNTIES, NEW YORK
1.0 INTRODUCTION
1.1 Purpose of Study
This Flood Insurance Study (FIS) revises and updates a previous FIS/Flood Insurance Rate Map (FIRM) for the City of New York, which incorporates all of Bronx, Kings, New York, Queens, and Richmond counties, New York, this also includes Ellis Island and Liberty Island. This information will be used by the City of New York to update existing floodplain regulations as part of the Regular Phase of the National Flood Insurance Program (NFIP). The information will also be used by local and regional planners to further promote sound land use and floodplain development.
In some States or communities, floodplain management criteria or regulations may exist that are more restrictive or comprehensive than the minimum Federal requirements. In such cases, the more restrictive criteria take precedence and the State (or other jurisdictional agency) will be able to explain them.
1.2 Authority and Acknowledgments
The sources of authority for this FIS are the National Flood Insurance Act of 1968 and the Flood Disaster Protection Act of 1973.
For the original May 16, 1983, FIS and November 16, 1983, FIRM (hereinafter referred to as the 1983 FIS), the hydrologic and hydraulic analyses for Arthur Kill, the Atlantic Ocean, Bronx Kill, the Bronx River, the East River, the Harlem River, the Hudson River, the Hutchinson River, Jamaica Bay, Kill Van Kull, Long Island Sound, Lower Bay, Newark Bay, Raritan Bay, and Upper Bay were prepared by Camp, Dresser and McKee, Inc., under subcontract to the New York State Department of Environmental Conservation (NYSDEC) for the Federal Emergency Management Agency (FEMA), under Contract No. H-4784. That work was completed in December 1981.
For the February 15, 1991, revision, the hydrologic and hydraulic analyses for Ranger Creek were prepared by the New York City Department of City Planning for FEMA. That work was completed in May 1989.
For the July 5, 1994, revision, the hydrologic and hydraulic analyses for Sweet Brook, Colon Tributary, Eltingville Tributary, Arbutus Creek, Jansen Tributary, Denise Tributary, Lemon Creek, and Sandy Brook, were prepared by Leonard Jackson Associates for FEMA, under Contract No. 91-R-3373. That work was completed in June 1992.

2
For the May 21, 2001, revision, updated topographic information of wetlands within Richmond County only was prepared by the New York City Department of Environmental Protection (NYCDEP). This information was agreed upon with FEMA to be used for the revision.
For the September 5, 2007, revision, updated topographic information for the City of New York was provided by the City of New York Department of Information Technology and Telecommunication (DOITT) and used to redelineate all detailed flood hazard areas. Additionally, updated hydrologic and hydraulic analyses for the Bronx River, Arbutus Creek, Blue Heron Main, Blue Heron Tributary, Butler Manor, Colon Tributary, D Street Brook, Denise Tributary, Eltingville Tributary, Foresthill Road Brook, Jansen Tributary, Lemon Creek, Mill Creek, Mill Creek Tributary 1, Mill Creek Tributary 2, Mill Creek Tributary 3, Sandy Brook, Sweet Brook, and Richmond Creek were prepared by Leonard Jackson Associates for FEMA, under Contract No. EMN-2003-RP-001.
For the [date] revision, updated topographic information generated by LiDAR (Light Detection and Ranging) for the City of New York was collected and processed by Sanborn Map Company. The LiDAR data were collected from April 14 to May 1, 2010. The updated topographic information was used to redelineate all detailed flood hazard areas. New coastal analysis was performed for the coastal flood hazard areas.
Base map information shown on the FIRMs was provided by DOITT. This information was derived from digital orthophotography produced at a scale of 1:1,200 from photography dated April 2008.
The coordinate system used for the production of this FIRM is New York State Plane FIPSZONE 3104.
1.3 Coordination
The purpose of an initial Consultation Coordination Officer's (CCO) meeting is to discuss the scope of the FIS. A final CCO meeting is held to review the results of the study.
For the 1983 FIS, an initial CCO meeting was held on August 12, 1976, and a final CCO meeting was held on December 13, 1982. Both of these meetings were attended by representatives of the City of New York; Camp, Dresser and McKee, Inc.; and FEMA.
For the July 5, 1994, study, an initial CCO meeting was held on February 1990 and was attended by representatives of the City of New York, Leonard Jackson Associates, and FEMA.
For the May 21, 2001, revision, a Cooperating Technical Community (CTC) Agreement was made on July 8, 1999, between the Borough of Staten Island and FEMA.

3
For the September 5, 2007, revision, an initial CCO meeting was held on April 22, 2004, and was attended by representatives of the City of New York Department of Buildings, DOITT, City of New York Department of Planning, City of New York Office of Emergency Management, Leonard Jackson Associates, Dewberry, and FEMA.
For the [date] revision, New York City serves as a Cooperating Technical Partner with FEMA for this Flood Insurance Study and Flood Insurance Rate Map update. FEMA has worked closely with New York City throughout the development of this updated Flood Insurance Study. FEMA and NYC have met on a weekly basis to discuss technical, programmatic, and administrative matters related to this project. Additionally, FEMA presented detailed technical information on October 18, 2012 to many NYC Departments such as New York City Department of City Planning, the Mayor’s Office of Long-Term Planning and Sustainability, Department of Buildings, and the Office of Emergency Management. Further, on June 26, 2013, FEMA and the New York State Department of Environmental Conservation met with the New York City Department of City Planning, the Mayor’s Office of Long-Term Planning and Sustainability, Department of Buildings to discuss the regulatory aspects of administering the Flood Insurance Rate Maps and Flood Insurance Study update.
2.0 AREA STUDIED
2.1 Scope of Study
This FIS covers the incorporated area of the City of New York, Bronx, Kings, New York, Queens, and Richmond Counties, New York; this also includes Ellis Island and Liberty Island. Although Elis Island is largely part of Jersey City, New Jersey, the island will be shown on the Hudson County, NJ maps along with the City of New York maps.
For the 1983 FIS, the following streams were studied by detailed methods: the Bronx River, the Hutchinson River, the Atlantic Ocean, Raritan Bay, New York Bay (including the Upper Bay, Lower Bay, and the Narrows), Jamaica Bay, Long Island Sound, Little Neck Bay, the East River, the Harlem River, the Hudson River, Arthur Kill, Bronx Kill, and Kill Van Kull.
The February 15, 1991, FIS was prepared to map wetlands as 1-percent-annual-chance special flood hazard areas along Ranger Creek stream corridors in Richmond County on Staten Island.
For the July 5, 1994, FIS, the following streams were studied by detailed methods: Sweet Brook, from its confluence with the Richmond Creek swamplands to Delmar Avenue; Colon Tributary, from its confluence with Sweet Brook to Gifford’s Lane; Eltingville Tributary, from its confluence with Sweet Brook to the Staten Island Railroad; Arbutus Creek, from the Hylan Boulevard to a point approximately 1,200 feet upstream of Amboy Road; Jansen Tributary, from its confluence with Arbutus Creek to a point near Kingdom Avenue; Denise Tributary, from its confluence with Arbutus Creek to a point near Hogan Avenue;

4
Lemon Creek, from a point approximately 500 feet upstream of Rossville Avenue to Amboy Road for a distance of approximately 1.5 miles; and Sandy Brook, from its confluence with Lemon Creek to a point approximately 500 feet downstream of Sharrotts Road.
For the May 21, 2001, FIS, some 1-percent-annual-chance Flood (Zone A) floodplains and a portion of the 1-Percent Annual Chance Flood (Zone AE) floodplain along Eltingville Tributary, from Katan Avenue to a point approximately 200 feet upstream of Wilson Avenue, within Richmond County on Staten Island, were removed and/or redelineated based on updated topographic information (NYCDEP, 1999). The revision also incorporated the following Letter of Map Revisions: 92-02-014P, dated December 24, 1992, to reflect the effects of two completed storm drain projects, to contain Springville Creek in the vicinity of the Heartland Condominiums II and 98-02-698P, dated May 2, 1999, to modify Special Flood Hazard Areas (SFHAs) near the intersection of Dewey Avenue and Greaves Avenue.
For the September 5, 2007 FIS, some 1-percent-annual-chance (Zone AE) and 500-year (Zone X shaded) floodplains were revised and/or redelineated based on updated topographic and base map information (NYC DOITT, 2004).
The September 5, 2007 FIS also incorporates the following Letter of Map Revision: 01-02-045P, dated July 3, 2002, to reflect the construction of a rip-rap revetment and slope protection along Prince’s Bay.
As part of the September 5, 2007 FIS, updated analyses were included for the flooding sources shown in Table 1, “Detailed Flooding Sources.”
TABLE 1: DETAILED FLOODING SOURCES
Limits of detailed study are indicated on the Flood Profiles (Exhibit 1) and on the FIRM (Exhibit 2). The areas studied by detailed methods were selected with priority given to all known flood hazard areas and areas of projected development and proposed construction.
Amboy Road WetlandArbutus Creek Blue Heron Main Blue Heron Tributary Bronx River Butler Manor Cleveland Avenue Wetland Colon Tributary D Street Brook Denise Tributary Eibs Pond Eltingville Tributary Forest Hill Road Brook Hillside Avenue Wetland
Jacks PondJansen Tributary Lemon Creek Mill Creek Mill Creek Tributary 1 Mill Creek Tributary 2 Mill Creek Tributary 3 Richmond Creek Sandy Brook Stump Pond Sweet Brook Wolfe’s Pond Wood Duck Pond

5
Several streams were studied by approximate methods. Approximate analyses were used to study those areas having a low development potential or minimal flood hazards. The scope and methods of study were proposed to, and agreed upon by, FEMA and the City of New York.
For the [date] FIS, new analysis for coastal flood hazard areas for the entire shoreline of the City of New York was incorporated and all detailed flood hazard areas were redelineated based on updated topographic data.
2.2 Community Description
The City of New York is located in southeastern New York State and consists of Bronx County (Bronx Borough), Kings County (Brooklyn Borough), New York County (Manhattan Borough), Queens County (Queens Borough), and Richmond County (Staten Island Borough). The City of New York is bordered to the west and southwest in the State of New Jersey by Sandy Hook, the Towns of Middletown, Union Beach, Cliffwood, Cliffwood Beach, Lawrence Harbor, Sayreville, the City of South Amboy and the Boroughs of Keansburg and Keyport along the southern shore of Raritan Bay; the Cities of Perth Amboy, Linden, Elizabeth and Bayonne, the Township of Woodbridge, and the Borough of Carteret, located west of Staten Island; and the Cities of Jersey City and Hoboken, the Towns of West New York, and Guttenburg, the Townships of Weehawken, North Bergen, and Tenafly, on the west side of the Hudson River. In the State of New York, communities bordering the City of New York to the north include the Cities of Yonkers and Mount Vernon, the Villages of Pelham Manor, Pelham, and New Rochelle. The surface area of the City of New York is 412.3 square miles (27 percent is under water) with a land area of 303 square miles.
New York City originated in the spring of 1624 when 30 families arrived on Manhattan Island and constructed permanent dwellings on the southern shore, now known as the Battery. By 1700, the population had increased to 5,000. By that time, the docks along the coastline had been filled in with refuse and silt and paved over so that the docks could be extended. By 1800, the population of the city increased to 60,000. Staten Island had a population of 4,500. In 1834, Brooklyn became a city with a population of 24,000. By 1850, the population of New York City, still consisting only of Manhattan, had increased to 515,000. In 1898, greater New York originated the merger of Manhattan with Brooklyn, Staten Island, Queens, and the Bronx. The correct borough name for Richmond County is also Richmond. However, the borough is most commonly referred to as Staten Island, which is used throughout this study. Today, the City of New York is the largest city in the United States and one of the largest cities in the world. The 1980 population of the city was 7,035,348 (U.S. Department of Commerce, 1981). The 1990 population of the city was 7,322,564. The population of the city increased to 8,008,278 in the 2000 Census (U.S. Census, 2000). In the 2010 census, the population of the city increased to 8,175,133 (U.S. Census, 2010). The populations of the counties and boroughs in New York are shown in Table 2, “Population and Land Area of New York City.”

6
TABLE 2: POPULATION AND LAND AREA OF NEW YORK CITY
1990 Census 2000 Census 2010 Census Land Area County Borough Population Population Population (sq. miles)
Bronx Bronx 1,203,789 1,332,650 1,385,108 42 Kings Brooklyn 2,300,664 2,465,326 2,504,700 71 New York Manhattan 1,487,536 1,537,195 1,585,873 23 Queens Queens 1,951,598 2,229,379 2,230,722 109 Richmond Staten Island 378,977 443,728 468,730 58
The following brief history of the Rockaway Peninsula and Jamaica Bay will provide some insight as to the reason data regarding the city’s coastline and water area should be referenced to a specific time period.
In 1835, Rockaway Point was located near the present east boundary of Jacob Riis Park. East Rockaway Inlet was located 20,000 feet east of its present position, near Long Beach, New York. South of Rockaway Point, a large shoal had formed which was to provide the material for extending this point nearly four miles to the east during the next 100 years. The shoreline generally receded between 1835 and 1878 while, at the same time, Rockaway Point extended two miles westward. Jacob Riis Park acquired its present shoreline during this period.
Between 1878 and 1927, the shoreline of the Rockaways advanced a small amount. Rockaway Point grew rapidly until 1902, but from 1902 to 1927, its westward expansion was only half its previous rate. From 1927 to 2007, the shoreline of the Rockaways has been stable. Nearly 12 million cubic yards of sand have been artificially placed east of Rockaway Point since that time.
Within Jamaica Bay, it has been estimated that 150 million cubic yards of material have been dredged. The most common use for dredged material has been for fill purposes in land reclamation projects. Originally, almost all of the area surrounding Jamaica Bay except the barrier beach to the south was marshland. Due to extensive filling, the shoreline around the bay is always changing.
Some of the larger projects in Jamaica Bay during this time were: Floyd Bennet Airfield at Barren Island; the development of the Mill Basin area by private developers; the construction of Canarsie pier; the completion of the Shore Parkway over low-lying marshland; the City of New York Department of Parks reclamation work in connection with the building of Spring Creek Park; the fill around Broad Channel and Rulers Bar Hassock for the construction of Cross Bay Boulevard in the 1920s; and the operations concerned with the development of John F. Kennedy Airport.
The excellent harbor facilities and location in respect to canal and railroad transportation systems have contributed to the growth of the City of New York. In addition to shoreline development associated with the city’s commerce as a port, the high population density has caused development in areas subject to flooding.
7
Despite the proximity of the City of New York to the Atlantic Ocean and its numerous bays and rivers, the climate of the city is more continental than maritime. This is because the weather conditions affecting New York usually approach the city from the west. However, the maritime influence is not totally absent. During the summer, sea breezes moderate the heat, and during the winter, coastal storms accompanied by winds from the east may bring considerable amounts of rain or snow.
The mean annual temperature for the City of New York is 55.2 degrees Fahrenheit ( F). Subfreezing temperatures occur on an average of 92 days per year; however, subzero weather may occur only two days in every three winters. During an average summer, the temperature reaches the 90s on 7 days. Temperatures of 100 F or higher have occurred approximately 7 times since 1871.
Precipitation is moderate and is distributed evenly throughout the year. The normal annual precipitation is 46.2 inches; with approximately 25 inches occurring between April and October. A prolonged dry period may be expected approximately every two or three years, usually in September or October. Rainfall occurring between June and September is usually the result of thunderstorms and is brief and relatively intense. From October through April, rainfall is generally associated with widespread storms generating day-long precipitation. The average annual snowfall is approximately 28.6 inches and occurs on an average of approximately 35 days between November and April.
The City of New York consists of three physiographically different areas. Bronx and New York Counties are an eroded southern extension of the glaciated upland area that occupies a large part of New England. The northern half of Kings and Queens Counties and all but a one-mile wide strip on the southeastern shore of Richmond County consists of terminal moraine and the hilly till-covered area north of the terminal moraine. The remainder of these three counties is made up of glacial outwash plain.
The New York Bight is the geographic designation for the portion of the continental shelf bordered by the Atlantic Coastal Plain extending from Cape May, New Jersey, northeast to Montauk, Long Island. It is characterized by beaches, numerous shallow, irregular estuaries and bays, the most prominent of which is the estuary of the Hudson River. The Hudson River has drowned valley morphology. Sediment movement and deposition have resulted in significant changes in the shelf area nearest the bight.
Long Island Sound also has drowned valley morphology. The southern slope of the ground, near Long Island, is steep and smooth, reaching depths of over 140 feet.
New York Bay is divided into Upper New York Bay and Lower New York Bay by the Narrows. The Upper Bay is bounded by the Battery on the north and Fort Hamilton-Fort Wadsworth on the south. The Lower Bay is bounded by Fort Hamilton and Sandy Hook.

8
Raritan Bay is part of the system of interconnected bays and channels surrounding Staten Island and the northern coast of New Jersey. This system also includes Arthur Kill, Kill Van Kull, and Newark Bay.
The Bronx River extends 23 miles from its mouth at the East River to Kensico Reservoir. The Kensico Reservoir does not release flows to the river, but serves as a water supply for the City of New York. From the just downstream of the reservoir, the river flows through Westchester County. Within the City of New York, the Bronx River flows south from the Yonkers corporate limits through the center of the borough for approximately 8.7 miles to its mouth at the East River. The river once served as the border between the Cities of Yonkers and Mount Vernon; however, continued relocations of the river have altered this. Within the City of New York, a series of four dams cause a drop in elevation of approximately 40 feet. The dams limit backwater effects from reaching far upstream on the Bronx River. Within the city, the river drops a total of 60 feet before flowing into the East River between Hunts Point and Claron Point. The Bronx River has a drainage area of 56.4 miles at its mouth. Exclusion of the areas draining into four water supply reservoirs reduces the drainage area to 38.3 square miles. The average width of the drainage basin is 2.5 miles.
The Hutchinson River originates in New Rochelle and flows for approximately 11 miles to Long Island Sound. The Hutchinson River is tidally controlled for its entire length. Within the study area, the river has a drainage area of 5.8 square miles. Historical discharge data for the Hutchinson River is available from USGS gaging station No. 01301500 at Pelham, New York. As of May 1, 2013 funding was dropped for USGS monitoring network in the five boroughs of New York City. (USGS, September 24, 2013).
The Hudson River originates in the Adirondack Mountains. The river has a drainage area of 13,400 square miles, most of which lie in the northern and eastern parts of New York and in small portions of Vermont, Massachusetts, Connecticut, and New Jersey. The lower Hudson is an estuary with tidal effects propagating 150 miles upstream to the Green Island Dam at Troy, New York, and downstream from the confluence of the Mohawk River.
The East River and the Harlem River serve as a connection between the Hudson River, the Upper Bay and Long Island Sound.
Jamaica Bay is a semi-enclosed body of water, sheltered from the Atlantic Ocean by the Rockaway Peninsula. The Rockaway Inlet is a long, narrow channel between the peninsula and Brooklyn, and is the only connection between the bay and the ocean during the non-storm tidal cycles. Many islands make Jamaica Bay into a network of channels and marshy areas.
2.3 Principal Flood Problems
The City of New York is affected by flooding from local, fluvial, and coastal flooding. Local flooding refers to flooding of inland portions of the city from short-term, high-intensity rainfall in areas with poor drainage.

9
Fluvial flooding is caused by rivers and streams overflowing their banks. Most of the rivers within the City of New York are tidally influenced. This means that water levels in the rivers are controlled by the tidal conditions at the mouth of the river with little or no influence from the flow in the stream. Both fluvial and tidal flooding associated with waves occur within the study area; however, tidal flooding was found to be the primary cause of damage within the city.
Coastal flooding is caused by long and short wave surges that affect the shores of the open ocean, bays and tidally influenced rivers, streams, and inlets. The movement of coastal waters is influenced by the astronomic tide and meteorological forces such as northeasters and hurricanes. Hurricanes and northeasters have historically caused flooding in and around the study area. Inundation of low-lying coastal areas in the City of New York is primarily the result of storm surges, wave setup, and wave runup, which occur during hurricanes and northeasters.
The City of New York is built in a confined coastal location, which accounts for much of its natural protection against hurricanes. The strongest winds from a storm rarely reach New York since the New Jersey coast is on one side of the city and Long Island is on the other side. However, high storm surges can propagate within the New York Bight and cause severe flooding along the coastal portions of the city. Moreover, the cuplike topography of the area accounts for most of the dynamic effects, including resurgence, which cause the waters to oscillate to flood levels well after the storm has left the area.
Sections of Queens, Brooklyn, and Staten Island are exposed to direct ocean surges and waves. Coney Island and the Rockaway Peninsula are particularly vulnerable to wave damage. On Rockaway Peninsula and Jamaica Bay, the shoreline configuration has changed considerably over the past 50 years due to dredging and filling. These changes affect wave propagation, particularly in areas such as Rockaway Point at Rockaway Inlet, where the configuration of the point controls the direction of the incoming waves. Surge waves can also propagate through Long Island Sound. Consequently, a surge wave can propagate in the New York Bight, move into New York Bay through the Hudson River and enter the East River from the south.
Jamaica Bay is affected by astronomical tides, storm surges from the Atlantic Ocean off New York Bay, wind-generated wave setups within the bay, and rainfall runoff from other areas (American Society of Engineering, 1964). The outer shoreline of the Rockaway Peninsula is subject to tidal fluctuations from the Atlantic Ocean. The Rockaway Peninsula can be a surge barriers to Jamaica Bay during small storm surges; however, a storm surge can almost entirely overtop and inundate the peninsula during larger surge events.
The most severe flooding conditions result from the overtopping of the peninsula. The low-lying areas of Brooklyn and Southern Queens including Kennedy Airport are directly affected by flooding from Jamaica Bay.

10
The northern portion of Queens and the east Bronx are directly affected by surges originating in Long Island Sound. The east shore of City Island has a history of severe damage. In 1969, it was estimated that a recurrence of the 1938 hurricane, the storm of record, would produce $23 million damage of City Island alone.
Detailed descriptions of coastal flood damage in and around the City of New York caused by the November 1950, November 1953, September 1960, and March 1962 storms are presented in Study Overview (Camp, Dresser and McKee, 1983).
The storm of November 1950 caused millions of dollars worth of damage and required evacuation of many parts of New York. Damage as a result of the flood occurred in parts of Queens, Jamaica Bay, Brooklyn, Rockaway Point, and Staten Island. Tides inundated portions of Staten Island for up to one mile inland.
During this flood, Rockaway Point beaches were severely eroded and the protective dunes were leveled. Homes along the ocean and bay were inundated by one to two feet of water. Wave crest heights ranged to an estimated 25 feet along the Atlantic Ocean.
There was a tide recorded (8.6 feet at Fort Hamilton, Brooklyn, New York) that resulted from the hurricane of September 1960. The City of New York experienced damage estimated at close to $20,000,000.
As a result of the March 1962 storm, the City of New York experienced damages totaling approximately $17,000,000. Portions of Coney Island and Rockaway Beach were inundated by one to two feet of water.
Almost all of the largest storms through the April 1962 to November 1992 period were either small tropical storms by the time they got to the Northeast or they passed to the east of New York City and had very little impacts in New York City, such as Gloria in 1985 (Category 2) and Agnes in 1972 (Category 1).
On December 12, 1992, the city sustained the most significant flood damage since the March 1962 storm. A peak wind gust of 67 mph was recorded at LaGuardia Airport. Commerce and transportation all but ceased as roads and subway tunnels became flooded. Peak tidal elevations were recorded 8.04 feet NAVD 1988, at the Battery, in Manhattan and 11.27 feet NAVD 1988 at Willets Point, in Queens. Over 3000 homes, citywide, sustained storm related damage. Estimates of storm related damage topped 750 million dollars.
Having earlier been downgraded to a tropical storm, Irene came ashore in Brooklyn on August 28, 2011 during the astronomical high tide. Peak winds were recorded at 58 mph at JFK International Airport. A peak tidal elevation of approximately 9.5 feet NAVD 1988 was recorded at the Battery. Heavy rain swept through the city with 6.87 inches of rain being reported in Central Park. Fearing damage to infrastructure and possible public safety issues, the city shut down the subway system and evacuated thousands of residents in low-lying coastal areas; however, only minor flooding was reported. The storm continued

11
inland with extensive flood related damages to property and infrastructure, for areas upstate of the city, approximating 1.3 billion dollars.
Sandy came ashore as an immense extratropical storm in Brigantine, New Jersey, on October 29, 2012. Being north and east of the storm track the city sustained extensive damage to property and infrastructure in each of the 5 boroughs. The astronomical tides in the city at the time of landfall were at their highest level. A peak wind gust of 90 mph was recorded at Islip, in Long Island. At the entrance to New York Harbor, wave heights were recorded to 32.5 feet. Storm related tidal levels were approximately 11.28 feet NAVD 1988 at the Battery (NOAA NOS Hurricane Sandy Water Level & Meteorological Data Report, January 24, 2013)and 12.5 feet NAVD 1988 at Kings Point. General tidal inundation elevations were 9 to 12 feet NAVD 1988 in Manhattan, 10 to 13 feet NAVD 1988 in Staten Island, 9 to 12 feet NAVD 1988 in Brooklyn, and 10 to 11 feet NAVD 1988 in Queens and the Bronx. Emergency responses were hampered; especially in Queens, where high winds and storm surge prevented fire response which resulted in the loss of approximately 122 structures. Extensive coastal flooding occurred in Staten Island, affecting the communities of Oakland Beach, New Dorp and Midland. In Manhattan, inundation occurred in the vicinity of the Battery, East Village and areas along and below Canal Street. Public infrastructure, citywide, was severely affected with all modes of public transportation ceasing operations due to storm conditions. Seven major subway tunnels were flooded, disrupting service for up to several weeks. Several highway tunnels were also flooded as well as the World Trade Center site. Bridges and tunnels were closed. Extensive disruptions in electrical power occurred in Manhattan. Commerce was disrupted, on a nationwide basis, with a closure of the stock exchanges, lasting 2 days. Estimates of storm related damages, including the City of New York, exceed 42 billion dollars.
2.4 Flood Protection Measures
Numerous flood protection measures have been developed in the City of New York. Many portions of the city are subjected to the direct influence of the ocean and have had bulkheads constructed for the purpose of beach stabilization. Riprap and seawalls have been constructed to dissipate waves caused by tidal action. Much construction has been elevated or protected to prevent extensive flood damage. In order to comply with requirements allowing citizens to be eligible for the Flood Insurance Program, the City of New York calls for all new construction to be protected to a specified elevation. A summary of flood protection measures built up until 1983 for Staten Island, the Rockaway Peninsula, and Jamaica Bay is presented in Study Overview (Camp, Dresser and McKee, 1983). The Coastal Protection Section (Chapter 3) of the New York City “A Stronger, More Resilient, New York” comprehensive plan (New York City, 2013) states that there are no purpose-built coastal flood protection structures in New York City but act in this way by coincidence. The New York City comprehensive plan also contains a detailed description of the shorelines of New York City and the impacts of Hurricane Sandy, as well as proposed protection measures.

12
The City of New York has an intricate navigational system. While the purpose of the system is not to provide flood protection, the existence of well-maintained channels assures a relatively unrestricted flow of water throughout the area which could potentially result in water reaching areas that it should not.
The principal deep-water channels of the Port of New York include: Ambrose Channel, from the Atlantic Ocean into Lower New York Bay; Anchorage Channel, in Upper New York Bay; and the Hudson River Channel, up to 59th Street. These channels have a depth of 45 feet and a width of 2,000 feet. Buttermilk, Bay Ridge, and Red Hook Channels, the East River to the Brooklyn Navy Yard, and tributary channels all have depths of 40 feet. Kill Van Kull and Arthur Kill Channels, known as the New York and New Jersey Channels, respectively, have a separate entrance to the ocean by way of Bayside Channel and have depths of 35 feet. A recently authorized modification provides a new entrance channel replacing the eastern portion of the Bayside-Gedney Channel. The East River has been improved to a point 35 feet beyond the Navy Yard. Secondary channels such as Gowanus Creek, Newtown Creek, Coney Island Channel, Rockaway Inlet, Jamaica Bay, and the Harlem River have depths ranging from 15 to 30 feet.
Federal construction and maintenance costs now total more than $200 million since the first dredging and removal of rock obstructions at Hells Gate in the East River was undertaken by the U.S. Army Corps of Engineers (USACE) in 1853. The average annual commerce in the Port of New York between 1966 and 1975 was over 180 million tons. Commerce including waste material during 1975 was more than 177 million tons. While the port has naturally deep-water harbors and channels, extensive improvements have been made over the last 150 years. Some of the current active projects are listed below and detailed descriptions can be found in (USACE, 2013).
Bronx River Basin Jamaica Bay Flushing Bay and Creek (Ecosystem Restoration and Navigation) Hudson Raritan Estuary—Gowanus Bay and Canal Hudson Raritan Estuary—Overall Feasibility Study Hudson River
New York City Watershed Atlantic Coast of New York Monitoring Program East River/ Queensbridge Seawall East River South Border Island Channel
East Rockaway Inlet to Rockaway Inlet (Rockaway Beach) Rikers Island Rockaway Inlet to Norton Point (Coney Island) South Shore of Staten Island Arthur Kill Channel Buttermilk Channel New York and New Jersey Channels Great Kills Harbor New Harbor

13
Engineer School/Fort Totten Gerritsen Creek
Plumb Beach Orchard Beach
3.0 ENGINEERING METHODS
For the flooding sources studied in detail in the community, standard hydrologic and hydraulic study methods were used to determine the flood hazard data required for this study. Flood events of a magnitude which are expected to be equaled or exceeded once on the average during any 10-, 2-, 1-, and 0.2-percent-annual-chance Flood period (recurrence interval) have been selected as having special significance for floodplain management and for flood insurance rates. These events, commonly termed the 10-, 50-, 100-, and 500-year floods, have a 10-, 2-, 1-, and 0.2-percent chance, respectively, of being equaled or exceeded during any year. Although the recurrence interval represents the long term average period between floods of a specific magnitude, rare floods could occur at short intervals or even within the same year. The risk of experiencing a rare flood increases when periods greater than 1 year are considered. For example, the risk of having a flood which equals or exceeds the 100-year flood (1-percent chance of annual exceedence) in any 50-year period is approximately 40 percent (4 in 10), and, for any 90-year period, the risk increases to approximately 60 percent (6 in 10). The analyses reported herein reflect flooding potentials based on conditions existing in the community at the time of completion of this study. Maps and flood elevations will be amended periodically to reflect future changes.
For the 1983 FIS, the City of New York separately examined the impact of fluvial flooding, coastal flooding caused by hurricane surges, and coastal flooding caused by northeasters. Since the causes of flooding are independent, the separate results were combined in a probabilistic sense. A wave height analysis was also performed to account for the inclusion of short-period, wave-induced waves. The extensive hydrologic and hydraulic analyses necessary to accomplish this study have been documented in a series of reports prepared for the New York State Department of Environmental Conservation (NYSDEC) (Camp, Dresser and McKee, 1983, 1979, 1982, April 1981, 1980, December 1981, November 1981, Total Stillwater Elevations; November 1981, Wave Crest Analysis).
3.1 Riverine Hydrologic Analyses
Hydrologic analyses were carried out to establish the peak discharge-frequency and peak elevation-frequency relationships for each flooding source studied in detail affecting the community.
For the May 16, 1983, study, a log-Pearson Type III distribution of the annual peak flows was used to generate discharge-frequency relationships for the Bronx River (Water Resources Council, 1977; U.S. Department of the Interior, 1979). Discharge-frequency estimates were made for other points along the Bronx River by adjusting the discharge-frequency curve at the gaging station according to the ratios between corresponding drainage areas, main channel slopes, surface storage indexes, and indexes of manmade impervious cover. The procedure is

14
documented in a report prepared for the NYSDEC (Camp, Dresser and McKee, April 1981). A similar procedure was used to study New Jersey by the State of New Jersey Department of Environmental Protection (Stankowski, 1974).
From the FIS for Mount Vernon, Westchester County, New York, it was determined that flooding along portions of the Hutchinson River downstream of East Sanford Boulevard was completely tidally controlled; therefore, no fluvial analysis was performed (FEMA, 1978). The stage-frequency analysis for the Hutchinson River in the Bronx is, therefore, performed as part of the coastal analysis in for the May 16, 1983 study.
For the September 5, 2007, revision, the USACE HEC-1 Flood Hydrograph computer program was used to establish peak discharge and peak elevation-frequency relationships for all streams except Wood Duck Pond and Eibs Pond, where a stage elevation relationship was derived and analyzed.
For the [date] revision, no new riverine analysis was performed. The flood hazard boundaries were redelineated using updated topographic information. As of May 1, 2013 funding was dropped for the USGS monitoring network in the five boroughs of New York City (USGS, September 24, 2013).
A summary of the drainage area-peak discharge relationships for a portion of the streams studied by detailed methods is shown in Table 3, "Summary of Discharges."
TABLE 3: SUMMARY OF DISCHARGES
FLOODING SOURCE DRAINAGE AREA PEAK DISCHARGES (cfs) AND LOCATION (sq. miles) 10-PERCENT 2-PERCENT 1-PERCENT 0.2-PERCENT
ARBUTUS CREEK Confluence with Arbutus Lake 0.71 205 330 404 575 Upstream of Hylan Boulevard 0.59 293 414 484 650 Upstream of Arbutus Avenue 0.42 211 297 347 450 Upstream of Louise Street 0.37 187 263 307 410 At confluence with Jansen Tributary 0.30 151 212 248 320 Upstream of Amboy Road 0.23 117 165 193 260
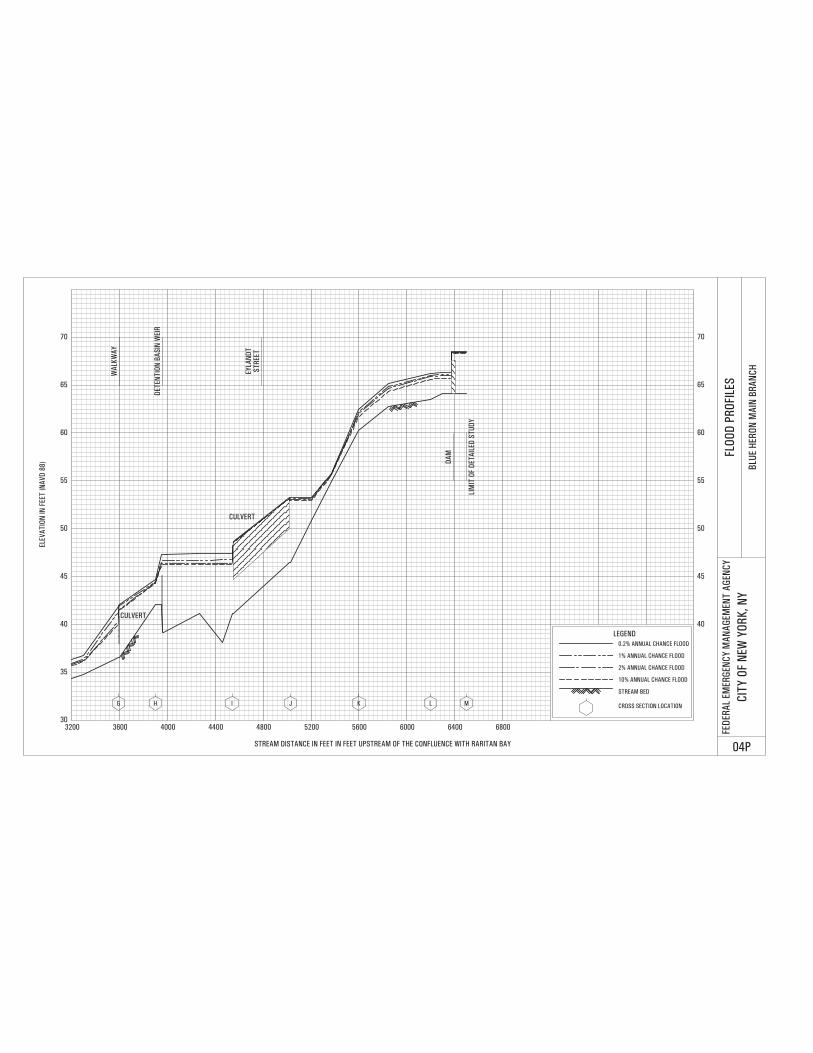
BLUE HERON MAIN BRANCH Outflow from Lipsett Pond 0.50 193 239 345 440 Upstream of Hylan Boulevard 0.47 208 303 342 430 Upstream of confluence with Blue Heron Main Tributary 0.22 112 134 193 245 Upstream of Eylandt Street 0.17 92 131 155 195 Upstream of Tallman Street 0.10 50 72 85 110
BLUE HERON TRIBUTARY Upstream confluence with Blue Heron Main Branch 0.13 75 109 128 170 Upstream Barclay Avenue 0.08 47 70 82 110

15
TABLE 3: SUMMARY OF DISCHARGES - continued
FLOODING SOURCE DRAINAGE AREA PEAK DISCHARGES (cfs) AND LOCATION (sq. miles) 10-PERCENT 2-PERCENT 1-PERCENT 0.2-PERCENT
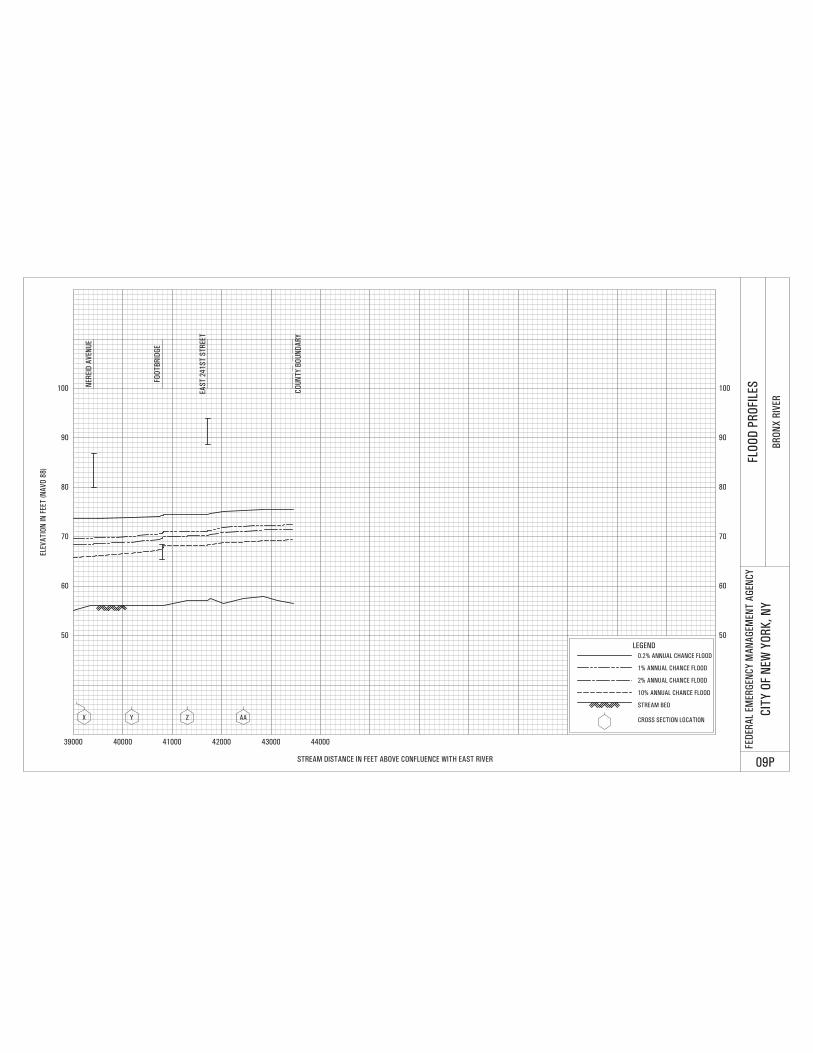
BRONX RIVER At confluence with East River 38.3 2,312 3,486 4,097 5,798 At East Gun Hill Road 34.4 2,175 3,286 3,866 5,495 At East 238th Street (corporate limits) 31.4 2,065 3,125 3,680 5,250 At USGS gage 26.5 1,875 2,847 3,358 4,823
BUTLER MANOR Mouth to Raritan Bay 0.18 305 414 276 600 Approximately 1,000 feet upstream of Raritan Bay 0.18 172 228 257 315 Upstream of Richard Avenue 0.06 67 82 89 105 Downstream of Hylan Boulevard 0.05 50 60 62 70 Upstream of Hylan Boulevard 0.05 64 89 104 130
COLON TRIBUTARY Confluence with Sweet Brook 0.36 108 151 177 225 Approximately 1,530 feet Upstream of D Street 0.01 126 166 192 248
DENISE TRIBUTARY Confluence with Arbutus Creek 0.13 65 92 108 150
ELTINGVILLE TRIBUTARY Confluence with Sweet Brook 1.17 339 479 560 710
FORESTHILL ROAD BROOK Approximately 756 feet upstream of Foresthill Road * 263 387 443 565 At the confluence with Richmond Creek * 126 172 199 260
JANSEN TRIBUTARY Confluence with Arbutus Creek 0.05 25 35 41 57
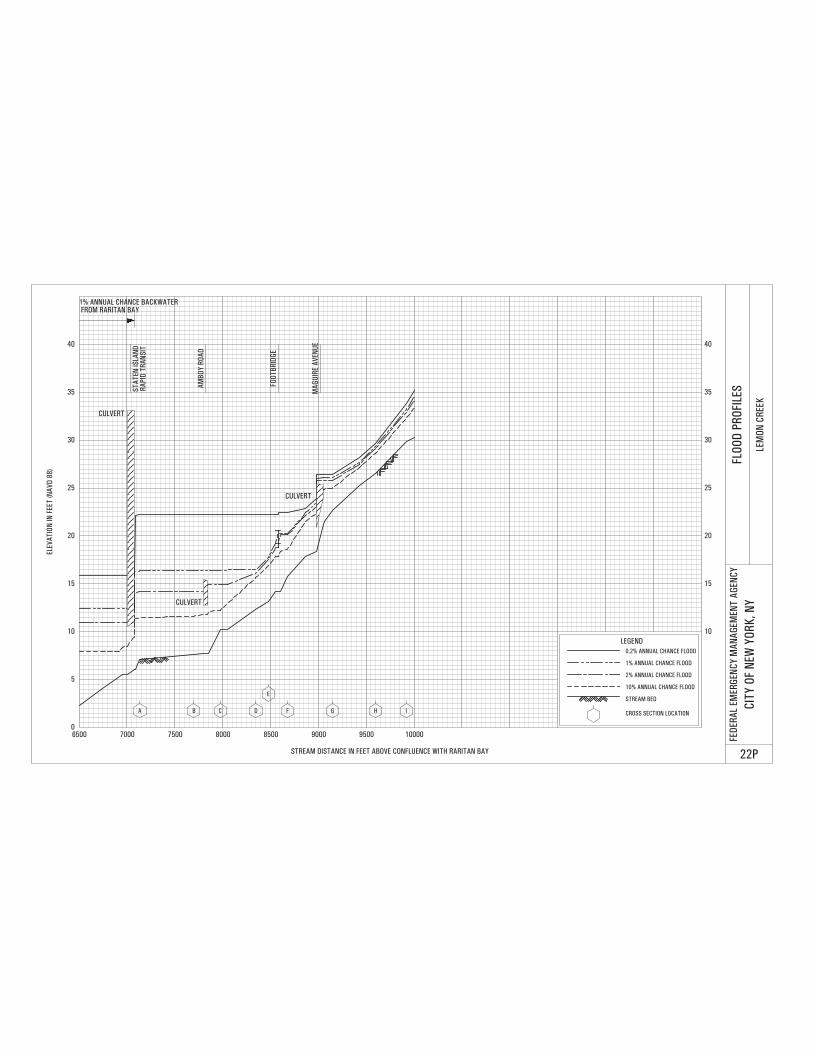
LEMON CREEK Mouth to Princes Bay (Raritan Bay) 2.09 490 708 849 1,120 Upstream of Bayview Avenue 1.67 390 572 689 920 Upstream of S.I.R.T. 1.23 290 438 529 730 Upstream of Maguire Avenue 0.77 147 246 301 440 At Richmond Parkway 0.73 139 234 285 425 *Data not available

16
TABLE 3: SUMMARY OF DISCHARGES - continued
FLOODING SOURCE DRAINAGE AREA PEAK DISCHARGES (cfs) AND LOCATION (sq. miles) 10-PERCENT 2-PERCENT 1-PERCENT 0.2-PERCENTLEMON CREEK (cont’d) Upstream of Richmond Parkway/confluence with Sandy Bridge 0.50 100 171 209 315 Upstream of Detention Basin Outlet near Helene Court 0.38 86 153 189 285 Outlet from Prodzio Pond 0.16 37 63 78 115 Upstream of Rossville Avenue 0.09 27 40 47 62
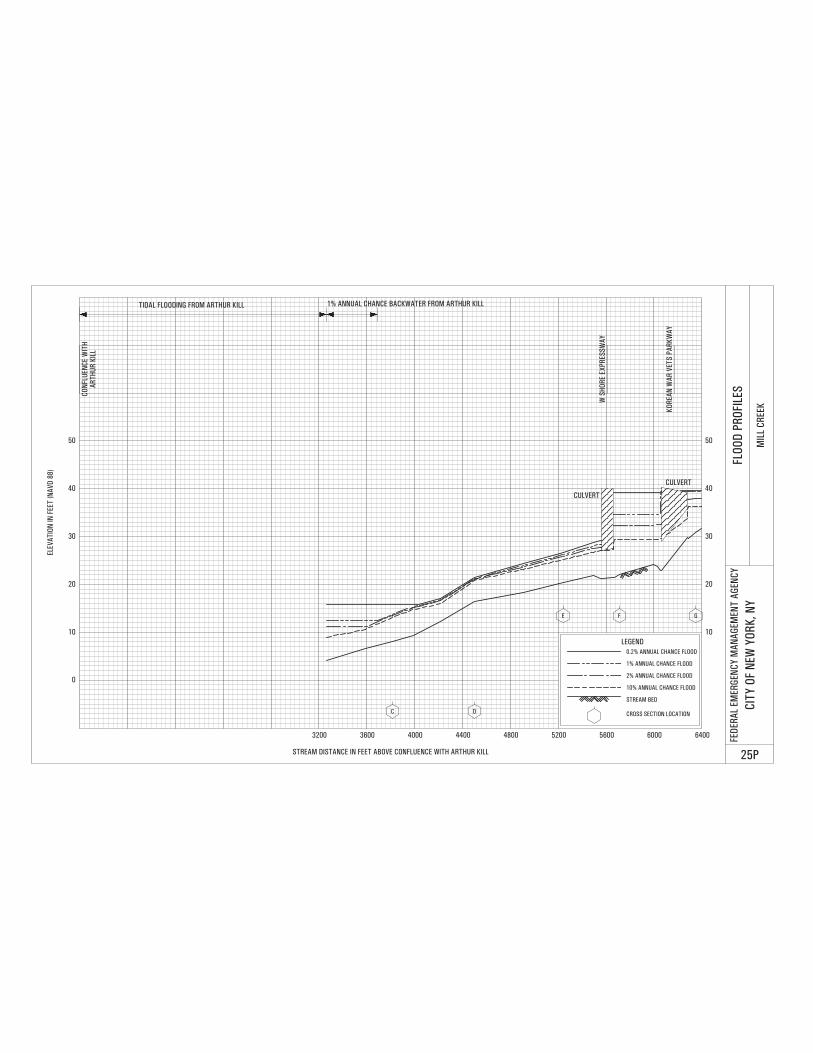
MILL CREEK Upstream of Page Avenue – downstream limit of study 1.30 1,012 1,411 1,653 2,100 Upstream of lower S.I.R.T. crossing 0.61 533 742 863 1,080 Upstream of Upper S.I.R.T. crossing 0.59 516 718 835 1,050 Upstream of Boscombe Avenue (gage) 0.47 408 569 661 840 Upstream of Richmond Parkway 0.39 311 434 506 620 Upstream of West Shore Expressway 0.24 159 223 260 335 Upstream of Vereans Road West 0.12 69 97 114 150
MILL CREEK TRIBUTARY 1 Confluence with Mill Creek 0.16 153 213 247 320
MILL CREEK TRIBUTARY 2 Confluence with Mill Creek 0.42 368 513 597 760
MILL CREEK TRIBUTARY 3 (TO TRIBUTARY 2) Confluence with Mill Creek Tributary 2 0.15 164 228 265 340
RICHMOND CREEK Upstream of Arthur Kill Road 1.90 780 1,010 1,170 1,400 Upstream of Eleanor Street 1.00 335 440 515 620 Upstream of Rockland Avenue 0.50 150 200 230 280
SANDY BROOK At confluence with Lemon Creek 0.22 48 70 83 115 Upstream of Bloomingdale Road 0.13 33 48 57 78

17
TABLE 3: SUMMARY OF DISCHARGES - continued
FLOODING SOURCE DRAINAGE AREA PEAK DISCHARGES (cfs) AND LOCATION (sq. miles) 10-PERCENT 2-PERCENT 1-PERCENT 0.2-PERCENT
SWEET BROOK Upstream of Arthur Kill Avenue 2.92 793 1,142 1,388 1,850 Upstream of Abingdon Avenue 2.23 602 875 1,070 1,500 Upstream of Ridgewood Road 2.09 567 826 1,011 1,380 Upstream of Genesee Avenue/ Richmond Avenue 2.06 558 814 997 1,360 Upstream of confluence with Eltingville Tributary 0.84 219 337 424 600 Upstream of Grantwood Avenue 0.65 178 278 352 640 Upstream of Arden Avenue 0.52 154 243 310 440 Upstream of Detroit Avenue 0.46 151 222 296 400 Upstream of Ionia Avenue 0.43 139 208 278 380 Upstream of Richmond Parkway 0.40 124 191 256 340 Upstream of Annadale Wedge Pond 0.30 88 145 194 280 Upstream of Sheldon Avenue 0.30 132 185 217 300
WOLFES POND Mouth at outlet to Raritan Bay (downstream study limit) 0.91 227 290 380 620 Downstream Wolfe’s Pond 0.89 225 287 377 610 Upstream Wolfe’s Pond 0.89 238 300 411 680 Downstream Hylan Boulevard 0.71 190 240 344 530
The stillwater elevations have been determined for the 10-, 2-, 1-, and 0.2-percent-annual-chance floods for the flooding sources studied by detailed methods and are summarized in Table 4, "Summary of Stillwater Elevations."
TABLE 4: SUMMARY OF STILLWATER ELEVATIONS
ELEVATION (feet NAVD*)FLOODING SOURCE 1-Percent Annual Chance Flood
Amboy Road Wetland 49.17 Cleveland Avenue Wetland 56.88 Eibs Pond 86.30 Hillside Avenue Wetland 54.43 Jacks Pond 51.22 Stump Pond 270.10 Wood Duck Pond 52.77
*North American Vertical Datum of 1988

18
3.2 Riverine Hydraulic Analyses
Analyses of the hydraulic characteristics of flooding from the source studied were carried out to provide estimates of the elevations of floods of the selected recurrence intervals. Users should be aware that flood elevations shown on the FIRM represent rounded whole-foot elevations and may not exactly reflect the elevations shown on the Flood Profiles or in the Floodway Data tables in the FIS report. For construction and/or floodplain management purposes, users are encouraged to use the flood elevation data presented in this FIS in conjunction with the data shown on the FIRM.
For the July 5, 1994 study, below-water sections were obtained by field measurement. All bridges and culverts were field surveyed to obtain elevation data and structural geometry. Along certain portions of Sweet Brook and Lemon Creek, a profile base line is shown on the maps to represent channel distances as indicated on the flood profiles and floodway data tables.
Channel roughness factors (Manning’s “n”) used in the hydraulic computations for the streams studied by detailed methods were chosen by engineering judgment and based on field observations of the streams and floodplain areas (Barnes, 1967). For streams studied by detailed methods, the channel “n” value used was 0.015-0.035 and the overbank “n” values ranged from 0.04 to 0.12. An “n” value of 0.015 was used for concrete structures and 0.024 was used for corrugated metal pipes. A weighted average “n” value was used for bridges with steel decks, concrete abutments, and earthen bottoms. Non-effective flow areas were disregarded by using extremely high “n” values. The acceptability of all assumed hydraulic factors, cross sections, and hydraulic structure data was checked by calibrating computed flood profiles to known historic flood profiles.
For the May 21, 2001, revision, for streams studied by detailed methods, water-surface elevations of floods of selected recurrence intervals were computed through the use of the HEC-2 step-backwater computer program (USACE, 1990).
Several stream courses in the Borough of Staten Island have been enclosed in storm sewers. In some cases, these storm sewers were found to be unable to contain the 1-percent-annual-chance flood discharges. The capacity of these storm sewers was estimated using standard pipe flow methods and was subtracted from the estimated 1-percent-annual-chance discharge at the entrance. Based on the street network and the line of greatest slope, a profile baseline was estimated for the excess discharges and was incorporated into the HEC-2 program. The built environment and infrastructure system within the City of New York have altered the natural storm water system to the extent that it’s more difficult to predict where smaller areas of overland flooding might occur.
For the September 5, 2007, revision, for streams studied by detailed methods, water-surface elevations of floods of selected recurrence intervals were computed through the use of HEC-RAS 3.1.3 (USACE, 3.1.3). Starting water-surface elevations for Blue Heron Main, Blue Heron Tributary, Butler Manor, D Street Brook, Denise Tributary, Foresthill Tributary, Jensen Tributary, Lemon Creek, Richmond Creek and Sandy Creek were obtained by utilizing normal depth.

19
Starting water-surface elevations for Arbutus Creek were obtained by utilizing critical depth. Starting water-surface elevations for the remaining revised streams were obtained from known water surface elevations as per studies conducted by the NYCDEP.
Flood profiles were drawn showing computed water-surface elevations to an accuracy of 0.5 foot for floods of the selected recurrence intervals. Locations of selected cross sections used in the hydraulic analyses are shown on the flood profiles (Exhibit 1). For stream segments for which a floodway is computed (Section 4.2), selected cross-section locations are also shown on the revised FIRM (Exhibit 2).
The hydraulic analyses for this study were based on unobstructed flow. The flood elevations shown on the profiles are thus considered valid only if hydraulic structures remain unobstructed, operate properly, and do not fail
For [date] revision, no new riverine analysis was performed. The flood hazard boundaries were redelineated using updated topographic information. However, floodplain mapping and elevations for the riverine areas have been updated to reflect tie-in information from the updated coastal analysis
Qualifying bench marks within a given jurisdiction that are cataloged by the National Geodetic Survey (NGS) and entered into the National Spatial Reference System (NSRS) as First or Second Order Vertical and have a vertical stability classification of A, B, or C are shown and labeled on the FIRM with their 6-character NSRS Permanent Identifier.
Bench marks cataloged by the NGS and entered into the NSRS vary widely in vertical stability classification. NSRS vertical stability classifications are as follows:
Stability A: Monuments of the most reliable nature, expected to hold position/elevation well (e.g., mounted in bedrock)
Stability B: Monuments which generally hold their position/elevation well (e.g., concrete bridge abutment)
Stability C: Monuments which may be affected by surface ground movements (e.g., concrete monument below frost line)
Stability D: Mark of questionable or unknown vertical stability (e.g., concrete monument above frost line, or steel witness post)
In addition to NSRS bench marks, the FIRM may also show vertical control monuments established by a local jurisdiction; these monuments will be shown on the FIRM with the appropriate designations. Local monuments will only be placed on the FIRM if the community has requested that they be included, and if the monuments meet the aforementioned NSRS inclusion criteria.

20
To obtain current elevation, description, and/or location information for bench marks shown on the FIRM for this jurisdiction, please contact the Information Services Branch of the NGS at (301) 713-3242, or visit their Web site at www.ngs.noaa.gov.
It is important to note that temporary vertical monuments are often established during the preparation of a flood hazard analysis for the purpose of establishing local vertical control. Although these monuments are not shown on the FIRM, they may be found in the Technical Support Data Notebook associated with this FIS and FIRM. Interested individuals may contact FEMA to access this data.
3.3 Coastal Analyses
Coastal stillwater analysis was performed for the Harlem, Hudson, Hutchinson, and East Rivers, Arthur and Bronx Kills and Kill Van Kull, the Atlantic Ocean, Raritan Bay, New York Bay, Jamaica Bay, Long Island Sound, Little Neck Bay, and all the bays and inlets within these areas.
The City of New York and the New York Bight area are affected equally by hurricanes and northeasters. The extent of coastal flooding due to hurricanes and northeasters is determined by three factors: 1) the nature of the storm with respect to intensity, duration, and path; 2) astronomic tide conditions at the time the storm-surge wave reaches the shore; and 3) the physical geometry and bathymetry of a particular area, which affects the timing and passage of the surge wave.
Bronx County is separated from New York County (Manhattan) by the Harlem River and from Queens by the East River. The county is also affected by flooding from Long Island Sound, Hudson River, and Eastchester Bay. High bluffs subject to erosion can be found along Long Island Sound. The shoreline is a mix of natural and developed areas and includes some unpopulated islands.
New York County (Manhattan) is an island. New York County is separated from Bronx County by the Harlem River and from Kings and Queens Counties by the East River. New York County is separated from New Jersey by the Hudson River. The shoreline in New York County is generally highly developed with many piers. There are some bluffs and other park areas on the upper west side of the island.
Richmond County (Staten Island) is an island and is separated from Long Island by the Narrows and from mainland New Jersey by the Arthur Kill and Kill Van Kull. Coastal flooding affects all shorelines of the island. A low primary frontal dune (PFD) is situated in Richmond County along the Franklin D. Roosevelt Boardwalk. Other sections of PFD are present in Fort Wadsworth, Cedar Grove, New Dorp Beach, Oakwood Beach and in Great Kills Park. These areas are subject to erosion. Erodible bluffs are present along the Raritan Bay in Richmond County. The rest of the shoreline is a mix of natural and developed areas

21
Kings County (Brooklyn) is located on Long Island and is separated from Richmond County and Hudson County, NJ by the Upper and Lower Bays and the Narrows. Kings County is separated from New York County by the East River. Kings and Queens Counties are separated by Newtown Creek at the northern Kings Boundary (across the East River from New York County). Jamaica Bay separates the barrier island portion of Queens from Kings Counties and Old Mill Creek separates the two counties just west of John F. Kennedy airport. A small primary frontal dune has been delineated in the Sea Gate area and a large beach-front area with a boardwalk runs along the Coney Island, Brighton Beach, and Manhattan Beach neighborhoods. Many areas of the shoreline also have erosion control structures such as bulkheads and groins. The rest of the shoreline is a mix of natural and developed areas with some areas with extensive pier networks.
Queens County is located on Long Island and is separated from Kings County by Newtown Creek (along the East River at the northern part of Kings County), by Old Mill Creek just west of John F. Kennedy airport, and by Jamaica Bay between the barrier island portion of Queens and the Kings mainland. Queens is separated from New York County by the East River and from Bronx by the East River and Long Island Sound. Queens shares a land boundary with Nassau County except for the Head of Bay division to the east of John F. Kennedy airport. Beaches and primary frontal dune areas can be found along the barrier island covering Breezy Point, and the Rockaway neighborhoods. There are several unpopulated islands in Jamaica Bay along with the populated Broad Channel Island. Queens is characterized by erodible bluffs on the North Shore or Long Island Sound shoreline. The rest of the shoreline is a mix of natural and developed areas
The FEMA Region II Office initiated a study in 2009 to update the coastal storm surge elevations within the states of New York and New Jersey including the Atlantic Ocean, the Barnegat Bay, the Raritan Bay, the Jamaica Bay, the West end Long Island Sound and their tributaries. The study replaces outdated coastal analyses as well as previously published storm surge stillwater elevations for all FIS Reports in the study area, including all five New York City boroughs and serves as the basis for updated FIRMs.
The region wide storm surge modeling system includes the Advanced Circulation Model for Oceanic, Coastal and Estuarine Waters (ADCIRC) for simulation of 2-dimensional hydrodynamics. ADCIRC was dynamically coupled to the unstructured numerical wave model Simulating Waves Nearshore (unSWAN) to calculate the contribution of waves to total storm surge (FEMA, 2010). The resulting model system is typically referred to as SWAN+ADCIRC. A seamless modeling grid was developed to support the storm surge modeling efforts. The modeling system validation consisted of a comprehensive tidal calibration followed by a validation using carefully reconstructed wind and pressure fields for six major flood events affecting the region: the 1938 hurricane, the Great Atlantic Hurricane of 1944, Hurricane Donna, Hurricane Gloria, and two extra-tropical storms, from 1984 and 1992. Two of the more recent storm events Irene

22
and Sandy were not used in this study for validation. Both Irene and Sandy occurred during the study or after this storm surge study was completed. Irene was a major rainfall event and did not produce major coastal tidal flooding. The climatology of Sandy at this time is not well studied.
Model skill was assessed by quantitative comparison of model output to wind, wave, and high water mark observations. The model was then used to re-create 30 historical extra-tropical storms and 157 synthetic hurricanes to create a synthetic water elevation record from which the 10-, 2-, 1-, and 0.2- percent annual chance of exceedence elevations were determined.
Wave setup results in an increased water level at the shoreline due to the breaking of waves and transfer of momentum to the water column during hurricanes and severe storms. For the New York and New Jersey surge study, wave setup was determined directly from the coupled wave and storm surge model. The total stillwater elevation with wave setup was then used for the erosion and overland wave modeling.
The stillwater elevations for the 10-, 2-, 1-, and 0.2- percent annual chance floods determined for the primary sources of flooding in New York City including: Long Island Sound, East River, Hudson River, Raritan Bay, Jamaica Bay, and others are shown in Table 5, “Transect Data.” The analyses reported herein reflect the stillwater elevations due to tidal and wind setup effects. If the elevation on the FIRM is higher than the elevation shown in this table, a wave height or wave runup component likely exists, in which case, the higher elevation should be used for construction and/or floodplain management purposes.
3.4 Wave Height Analyses
The wave height analysis was carried out to provide estimates of the elevations of floods of the selected recurrence intervals along the shoreline of the Atlantic Ocean, Raritan Bay, New York Bay, Jamaica Bay, Long Island Sound, Little Neck Bay, and the East River.
The destructiveness of coastal flooding due to high stillwater elevations may be increased by wind-induced waves which contribute to increased water levels and whose size and velocity may damage structures directly. The height of a wave is dependent upon wind speed and its duration, depth of water, and length of fetch. The wave crest elevation is the sum of the stillwater elevation and the portion of the wave height above the stillwater elevation.
Transects represent the locations where the overland wave height analysis was modeled and are placed with consideration given to topography, land use, shoreline features and orientation, and the available fetch distance. The transects were located with consideration given to the physical and cultural characteristics of the land so that they would closely represent conditions in their locality. Each transect was placed to capture the dominant wave direction, typically perpendicular to the shoreline and extended inland to a point where coastal flooding ceased. Transects were spaced close together in areas of complex

23
topography and dense development. In areas having more uniform characteristics, the transects were spaced at larger intervals. It was also necessary to locate transects in areas where unique flooding existed and in areas where computed wave heights varied significantly between adjacent transects. Transects were placed along the shoreline along all sources of primary flooding in each New York City county, as illustrated on the FIRMs and in the “Transect Location Map” provided in Figures 1-1 thru 1-5. Transects also represent locations visited during field reconnaissance to assist in parameterizing obstructions and observing shore protection features.

24
Figure 1-1: Bronx published and mapping transect location map
25
Figure 1-2: New York County published and mapping transect map

26
Figure 1-3: Richmond County published and mapping transect map

27
Figure 1-4: Kings County published and mapping transect map

28
Figure 1-5: Queens County published and mapping transect map

29
The methodology for analyzing the effects of wave heights associated with coastal storm surge flooding is described in a report prepared by the National Academy of Sciences (NAS) (NAS, 1977). This method is based on three major concepts. First, depth-limited waves in shallow water reach maximum breaking height that is equal to 0.78 times the total stillwater depth. The wave crest is 70 percent of the total wave height above the total stillwater level. The second major concept is that wave height may be diminished by dissipation of energy due to the presence of obstructions, such as sand dunes, dikes and seawalls, buildings and vegetation. The amount of energy dissipation is a function of the physical characteristics of the obstruction and is determined by procedures prescribed in NAS Report. The third major concept is that wave height can be regenerated in open fetch areas due to the transfer of wind energy to the water. This added energy is related to fetch length and depth.
A review of the geology and shoreline type was made to determine the applicability of standard erosion methods, and FEMA’s standard erosion methodology for coastal areas having primary frontal dunes, referred to as the “540 rule,” was used (FEMA, 2007a). This methodology first evaluates the dune’s cross-sectional profile to determine whether the dune has a reservoir of material that is greater or less than 540 square feet. If the reservoir is greater than 540 square feet, the “retreat” erosion method is employed and approximately 540 square feet of the dune is eroded using a standardized eroded profile, as specified in FEMA guidelines. If the reservoir is less than 540 square feet, the “remove” erosion method is employed where the dune is removed for subsequent analysis, again using a standard eroded profile. The storm surge study provided the return period stillwater elevations required for erosion analyses. Each cross-shore transect was analyzed for erosion, when applicable.
Simulations of inland wave propagation were conducted using FEMA’s Wave Height Analysis for Flood Insurance Studies (WHAFIS) model Version 4.0 (FEMA, August 2007). WHAFIS is a one-dimensional model that was applied to each transect in the study area. The model uses the total stillwater and starting wave information extracted from the coupled wave and storm surge model. In Table 5, “Transect Data,” the 10-, 2-, 1-, and 0.2-percent annual chance stillwater elevations for each transect are provided along with the starting wave height and period. Simulations of wave transformations were then conducted with WHAFIS taking into account the storm-induced erosion and overland features of each transect such as ground elevation, obstructions, and wind contributions. The model outputs the combined flood elevation from the total SWEL and wave height along each cross-shore transect allowing for the establishment of base flood elevations (BFEs) and flood zones from the shoreline to points inland within the study area. Wave heights were calculated to the nearest 0.1 foot, and BFEs were determined at whole-foot increments along the transects.
Wave runup is defined as the maximum vertical extent of wave uprush on a beach or structure. FEMA’s 2007 Guidelines and Specifications require the 2-percent wave runup level be computed for the coastal feature being evaluated (cliff,

30
coastal bluff, dune, or structure) (FEMA, February 2007). The 2-percent runup level is the highest 2 percent of wave runup affecting the shoreline during the 1-percent-annual-chance flood event. Each transect defined within the study area was evaluated for the applicability of wave runup, and if necessary, the appropriate runup methodology was selected and applied to each transect. Runup elevations were then compared to WHAFIS results to determine the dominant process affecting BFEs and associated flood hazard levels. Based on wave runup rates, wave overtopping was computed following the FEMA 2007 Guidelines and Specifications.
Between transects, elevations were interpolated using topographic maps, land-use and land-cover data, and engineering judgment to determine the extent of coastal flood zones. The results of the overland wave height and runup calculations are accurate until local topography, vegetation, or cultural development within the community undergoes major changes.
Areas of coastline subject to significant wave attack are referred to as coastal high hazard zones. The USACE has established the 3-foot breaking wave as the criterion for identifying the limit of coastal high hazard zones. The one exception to the 3-foot wave criteria is where a primary frontal dune exists. The limit of the coastal high hazard area then becomes the landward toe of the primary frontal dune or where a 3-foot or greater breaking wave exists, whichever is most landward. The coastal high hazard zone is depicted on the FIRMs as Zone VE, where the delineated flood hazard includes wave heights equal to or greater than three feet. Zone AE is depicted on the FIRMs where the delineated flood hazard includes wave heights less than three feet. A depiction of how the Zones VE and AE are mapped is shown in Figure 2.
Post-storm field visits and laboratory tests have confirmed that wave heights as small as 1.5 feet can cause significant damage to structures when constructed without consideration to the coastal hazards. Additional flood hazards associated with coastal waves include floating debris, high velocity flow, erosion, and scour which can cause damage to Zone AE-type construction in these coastal areas. To help community officials and property owners recognize this increased potential for damage due to wave action in the AE zone, FEMA issued guidance in December 2008 on identifying and mapping the 1.5-foot wave height line, referred to as the Limit of Moderate Wave Action (LiMWA). While FEMA does not impose floodplain management requirements based on the LiMWA, the LiMWA is provided to help communicate the higher risk that exists in that area. Consequently, it is important to be aware of the area between this inland limit and the Zone VE boundary as it still poses a high risk, though not as high of a risk as Zone VE, see Figure 2, "Transect Schematic".

31
Figure 2: Transect Schematic
A description of the starting wave conditions and stillwater elevation input to the modeling for each transect is shown in Table 5, “Transect Data.”

1Stillwater elevations include the contribution from wave setup. 2For transects with a constant stillwater elevation, only one number is provided to represent both the starting value and the range.
32
TABLE 5: TRANSECT DATA
FloodSource Transect
Starting Wave Conditions for the 1% Annual Chance
Starting Stillwater Elevations1 (ft NAVD88) Range of Stillwater Elevations2(ft NAVD88)
CoordinatesSignificant Wave
Height (ft) Peak Wave Period (sec)
10% Annual Chance
2% Annual Chance
1% Annual Chance
0.2% Annual Chance
Bronx County, NY Long Island
Sound BX-1 N 40.882876 W 73.793188 3.08 4.36 9.7
11.9 11.9 - 12
12.9 12.8 - 12.9 14.9
Long Island Sound BX-2
N 40.875510 W 73.785368 4.81 4.61
9.6 9.6 - 9.8
11.9 11.9 - 12.1
12.8 12.8 - 13
14.7 14.7 - 15
Long Island Sound BX-3
N 40.867896 W 73.791576 5.04 5.29
9.6 9.5 - 9.8
11.9 11.9 - 12.2
12.8 12.8 - 13.2
14.6 14.6 - 15.2
Long Island Sound BX-4
N 40.857657 W 73.788791 4.55 4.43
9.7 9.6 - 9.7
11.9 11.8 - 12
12.8 12.7 - 12.9
14.6 14.5 - 14.8
Long Island Sound BX-5
N 40.853174 W 73.787539 4.08 4.03 9.7 12
12.8 12.8 - 12.9
14.7 14.6 - 14.7
Long Island Sound BX-6
N 40.846334 W 73.782475 3.11 3.36 9.6
11.9 11.8 - 11.9
12.7 12.6 - 12.7 14.5
Long Island Sound BX-7
N 40.840038 W 73.781424 3.83 3.50 9.6 11.9 12.8 14.6
EastchesterBay BX-8
N 40.840755 W 73.787536 2.63 3.02 9.6 11.9 12.8 14.6
EastchesterBay BX-9
N 40.849456 W 73.789833 2.26 3.11 9.6
11.9 11.8 - 11.9 12.8 14.6
EastchesterBay BX-10
N 40.850414 W 73.801881 2.79 2.98
9.7 9.6 - 9.7
12 11.8 - 12
12.9 12.6 - 12.9
14.7 14.5 - 14.7
EastchesterBay BX-11
N 40.859015 W 73.807876 2.50 2.92 9.7 12 12.9 14.8
EastchesterBay BX-12
N 40.853506 W 73.817070 2.59 2.91 9.7 12.1 13 15

TABLE 5: TRANSECT DATA - continued
1Stillwater elevations include the contribution from wave setup. 2For transects with a constant stillwater elevation, only one number is provided to represent both the starting value and the range.
33
FloodSource Transect
Starting Wave Conditions for the 1% Annual Chance
Starting Stillwater Elevations1 (ft NAVD88) Range of Stillwater Elevations2(ft NAVD88)
CoordinatesSignificant Wave
Height (ft) Peak Wave Period (sec)
10% Annual Chance
2% Annual Chance
1% Annual Chance
0.2% Annual Chance
EastchesterBay BX-13
N 40.847353 W 73.816165 2.83 3.02 9.8 12.1
13 12.9 - 13
15 14.8 - 15
EastchesterBay BX-14
N 40.840772 W 73.815333 2.66 2.99 9.8 12.1 13 14.9
EastchesterBay BX-15
N 40.836330 W 73.816310 2.79 3.11 9.8 12.1 13 14.9
EastchesterBay BX-16
N 40.831840 W 73.815367 2.88 3.17 9.8 12.1 13 14.9
EastchesterBay BX-17
N 40.825977 W 73.814133 3.12 3.49 9.8
12 12 - 12.1 13.1 15
EastchesterBay BX-18
N 40.822950 W 73.806499 3.28 3.46 9.8 12 13 14.8
EastchesterBay BX-19
N 40.819079 W 73.804739 3.29 3.50 9.8 12
13 12.9 - 13
14.8 14.8 - 14.9
Long Island sound BX-20
N 40.815456 W 73.799164 3.28 3.40
9.7 9.7 - 9.8
12.1 12 - 12.1
12.9 12.8 - 12.9
14.8 14.7 - 14.9
Long Island sound BX-21
N 40.813471 W 73.801406 3.26 3.53
9.8 8.7 - 9.8
12.1 12 - 12.1
12.9 12.8 - 13.1
14.8 14.8 - 15
Long Island sound BX-22
N 40.811723 W 73.803529 3.25 3.45 9.8 12
13 12.9 - 13
14.9 14.8 - 14.9
Long Island sound BX-23
N 40.807911 W 73.794756 3.32 3.36 9.8 12 12.9 14.7
Long Island sound BX-24
N 40.804938 W 73.790269 3.05 3.29 9.7
12 11.9 - 12
12.9 12.8 - 12.9
14.7 14.6 - 14.7
East River BX-25 N 40.809133 W 73.803045 2.62 3.50
9.7 9.7 - 9.8 12
12.9 12.9 - 13.1
14.8 14.8 - 15
East River BX-26 N 40.812835 W 73.809719 2.58 3.41 9.7 12 12.9 14.8

TABLE 5: TRANSECT DATA - continued
1Stillwater elevations include the contribution from wave setup. 2For transects with a constant stillwater elevation, only one number is provided to represent both the starting value and the range.
34
FloodSource Transect
Starting Wave Conditions for the 1% Annual Chance
Starting Stillwater Elevations1 (ft NAVD88) Range of Stillwater Elevations2(ft NAVD88)
CoordinatesSignificant Wave
Height (ft) Peak Wave Period (sec)
10% Annual Chance
2% Annual Chance
1% Annual Chance
0.2% Annual Chance
East River BX-27 N 40.813721 W 73.817371 2.55 3.28
9.7 9.6 - 9.7
12 11.9 - 12
12.9 12.8 - 12.9
14.9 14.8 - 14.9
East River BX-28 N 40.813192 W 73.819875 2.62 3.28
9.7 9.5 - 9.7
12 11.9 - 12
12.9 12.8 - 12.9 14.9
East River BX-29 N 40.811760 W 73.825350 2.57 3.33 9.7
12.1 11.9 - 12.1
13 12.9 - 13
14.9 14.9 - 15.2
East River BX-30 N 40.808182 W 73.832188 2.47 3.25
9.8 9.6 - 9.8
12.1 11.8 - 12.2
13 12.7 - 13.1
15 14.7 - 15
East River BX-31 N 40.810697 W 73.846372 2.43 3.14 9.7
11.4 11.1 - 11.4
13 12.8 - 13
15 14.9 - 15
East River BX-32 N 40.809094 W 73.850006 2.07 2.57 9.7
12.1 12 - 12.1
13 12.9 - 13.1 15.1
East River BX-33 N 40.805165 W 73.847739 2.69 3.64 9.7
12 12 - 12.1
13 13 - 13.1
14.9 14.9 - 15.1
East River BX-34 N 40.804769 W 73.856471 2.59 3.30 9.6 12.1 13
15 15 - 15.2
East River BX-35 N 40.809620 W 73.860589 2.29 2.86 9.6 12.1 12.9
15 15 - 15.1
East River BX-36 N 40.810482 W 73.866440 2.11 2.62 9.6 12.1 13.1 15.2
East River BX-37 N 40.802478 W 73.871062 2.62 3.06 9.7
12.1 11.8 - 13.5
13.1 12.9 - 13.1
15.2 15.1 - 15.2
East River BX-38 N 40.802234 W 73.883391 2.28 3.19
9.6 9.5 - 9.6
12 11.5 - 12
13 12.7 - 13
15.1 14.9 - 15.1
East River BX-39 N 40.806363 W 73.892463 2.79 3.39 9.5
12 11.8 - 12
12.9 12.8 - 12.9
15.1 14.9 - 15.1
East River BX-40 N 40.804857 W 73.901251 2.11 3.02
9.4 9.1 - 9.4
11.9 11.6 - 13.5
12.9 12.6 - 12.9
15.2 15 - 15.2

TABLE 5: TRANSECT DATA - continued
1Stillwater elevations include the contribution from wave setup. 2For transects with a constant stillwater elevation, only one number is provided to represent both the starting value and the range.
35
FloodSource Transect
Starting Wave Conditions for the 1% Annual Chance
Starting Stillwater Elevations1 (ft NAVD88) Range of Stillwater Elevations2(ft NAVD88)
CoordinatesSignificant Wave
Height (ft) Peak Wave Period (sec)
10% Annual Chance
2% Annual Chance
1% Annual Chance
0.2% Annual Chance
East River BX-41 N 40.798453 W 73.908958 2.71 2.74 9.4
11.9 11.4 - 11.9
12.9 12.7 - 12.9
15.2 15.1 - 15.3
Harlem River BX-42 N 40.802539 W 73.927213 1.80 2.43 7.9
10.4 10.1 - 10.7
11.4 11.2 - 11.4
13.8 13.5 - 13.8
Hudson River BX-43 N 40.880389 W 73.923785 4.12 4.43 5.4 8 9.1
12.3 12.2 - 12.3
Hudson River BX-44 N 40.894006 W 73.918004 4.05 4.51 5.4 7.8 9
12.1 12.1 - 12.2
Hudson River BX-45 N 40.902509 W 73.915161 4.07 5.01 5.4 7.8 8.9 11.9
Hudson River BX-46 N 40.915050 W 73.910557 3.51 4.58 5.3 7.7 8.9
11.8 11.7 - 11.8
Long Island sound BX-47
N 40.856289 W 73.766650 5.93 4.23
9.6 9.5 - 9.6
11.8 11.6 - 11.8
12.6 12.5 - 12.8
14.4 14.2 - 14.9
Long Island sound BX-48
N 40.851035 W 73.768842 4.59 3.87 9.6 11.7 12.6 14.4
Long Island sound BX-49
N 40.852594 W 73.771758 3.89 4.25 9.6
11.8 11.8 - 11.9
12.6 12.6 - 12.7
14.3 14.2 - 14.6
East River BX-50 N 40.792101 W 73.874565 2.50 2.95 9.7 12.2 13.2 15.4
East River BX-51 N 40.786214 W 73.882983 2.58 2.74 9.4
11.9 11.7 - 11.9
12.8 12.7 - 12.8
15 14.9 - 15
East River BX-52 N 40.791346 W 73.892419 2.87 3.17 9.4 11.9
12.9 12.8 - 12.9 15
East River BX-53 N 40.797559 W 73.886136 2.40 3.37 9.5 12 13 15.1
East River BX-54 N 40.801180 W 73.896639 2.99 4.01
9.6 9.6 - 9.8
12 11.9 - 12
13 12.8 - 13 15.2

TABLE 5: TRANSECT DATA - continued
1Stillwater elevations include the contribution from wave setup. 2For transects with a constant stillwater elevation, only one number is provided to represent both the starting value and the range.
36
FloodSource Transect
Starting Wave Conditions for the 1% Annual Chance
Starting Stillwater Elevations1 (ft NAVD88) Range of Stillwater Elevations2(ft NAVD88)
CoordinatesSignificant Wave
Height (ft) Peak Wave Period (sec)
10% Annual Chance
2% Annual Chance
1% Annual Chance
0.2% Annual Chance
East River BX-55 N 40.796870 W 73.897179 2.83 3.47
9.5 9.4 - 9.5
11.9 11.8 - 11.9
12.9 12.8 - 12.9
15 14.9 - 15

TABLE 5: TRANSECT DATA - continued
1Stillwater elevations include the contribution from wave setup. 2For transects with a constant stillwater elevation, only one number is provided to represent both the starting value and the range.
37
FloodSource Transect
Starting Wave Conditions for the 1% Annual Chance
Starting Stillwater Elevations1 (ft NAVD88) Range of Stillwater Elevations2(ft NAVD88)
CoordinatesSignificant Wave
Height (ft) Peak Wave Period (sec)
10% Annual Chance
2% Annual Chance
1% Annual Chance
0.2% Annual Chance
Kings County, NY
Jamaica Bay K-1N 40.650180 W 73.857295 3.20 2.91 6.5
98.9 - 9.1
10.1 10.1 - 10.3
12.9 12.6 - 13.2
Jamaica Bay K-2N 40.642913 W 73.861579 3.19 2.91
6.5 6.5 - 6.6
98.8 - 9 10.1
12.8 12.7 - 13
Jamaica Bay K-3N 40.637659 W 73.870611 3.43 3.16 6.6 9 10.1
12.8 12.7 - 12.8
Jamaica Bay K-4N 40.635459 W 73.877340 3.34 3.08
6.6 6.5 - 6.7
9.5 9.5 - 9.8
10.2 10.1 - 10.3
12.9 12.7 - 13.1
Jamaica Bay K-5N 40.631760 W 73.882391 3.08 2.92 6.7 9.8
10.2 10 - 10.2
12.9 12.7 - 13.1
Jamaica Bay K-6N 40.627664 W 73.888337 3.21 3.00
6.7 6.6 - 6.7 9.8
10.3 10 - 10.3
13 12.9 - 13.1
Jamaica Bay K-7N 40.622933 W 73.894580 3.08 3.02 6.7 9.8
10.3 10.1 - 10.4
13 12.9 - 13.4
Jamaica Bay K-8N 40.618794 W 73.895780 3.08 3.06
6.7 6.7 - 6.8 9.8
10.3 10 - 10.3
13 12.8 - 13.4
Jamaica Bay K-9N 40.608044 W 73.892504 3.10 3.11
6.7 6.7 - 7.1
9.1 8.9 - 9.8
10.2 10.1 - 10.7
12.8 12.8 - 13.7
Jamaica Bay K-10N 40.602728 W 73.883254 3.03 3.12 6.6
9.1 8.8 - 9.1
10.1 9.9 - 10.2
12.7 12.4 - 13
Jamaica Bay K-11N 40.593793 W 73.880519 3.05 3.12 6.6 9 10
12.6 12.6 - 13.1
Jamaica Bay K-12N 40.578895 W 73.883644 3.89 4.57 6.6 8.9
9.9 9.7 - 9.9
12.5 12.4 - 12.8
Dead Horse Bay K-13
N 40.579371 W 73.896649 4.46 4.03 6.6 8.9 10.1
12.9 12.8 - 12.9

TABLE 5: TRANSECT DATA - continued
1Stillwater elevations include the contribution from wave setup. 2For transects with a constant stillwater elevation, only one number is provided to represent both the starting value and the range.
38
FloodSource Transect
Starting Wave Conditions for the 1% Annual Chance
Starting Stillwater Elevations1 (ft NAVD88) Range of Stillwater Elevations2(ft NAVD88)
CoordinatesSignificant Wave
Height (ft) Peak Wave Period (sec)
10% Annual Chance
2% Annual Chance
1% Annual Chance
0.2% Annual Chance
Dead Horse Bay K-14
N 40.587565 W 73.899036 3.49 3.28 6.6 8.9 10.3 13.1
Dead Horse Bay K-15
N 40.586948 W 73.906879 3.58 3.62 6.6
9.1 8.7 - 9.2
10.3 10 - 10.3
13.2 13.2 - 13.3
Raritan Bay K-16N 40.582036 W 73.917709 4.80 4.58
6.7 6.6 - 6.7
9.2 8.9 - 9.8
10.4 10.2 - 10.5
13.3 13.2 - 13.6
Raritan Bay K-17N 40.583425 W 73.923126 5.00 4.58
6.7 6.6 - 6.7
9.2 8.9 - 9.8
10.5 10.3 - 10.7
13.4 13.4 - 13.8
Raritan Bay K-18N 40.583473 W 73.928895 5.25 4.67 6.7
9.3 9 - 9.8
10.5 10.3 - 10.7
13.5 13.5 - 14.1
Raritan Bay K-19N 40.575543 W 73.937167 6.89 5.94 6.7
9.4 9.4 - 9.8
10.5 10.1 - 10.7
13.5 13.2 - 13.8
Raritan Bay K-20N 40.574959 W 73.947220 7.25 7.18 6.8
9.6 9.1 - 9.8
10.7 10.1 - 10.9
13.7 13.1 - 14.3
Raritan Bay K-21N 40.574173 W 73.957374 7.81 8.44 6.8
9.6 9.2 - 9.8
10.9 10.2 - 10.9
14 12.9 - 14.2
Raritan Bay K-22N 40.573203 W 73.967783 8.47 10.64 6.9
9.7 9 - 9.8
11 10 - 11
14.3 12.5 - 14.5
Raritan Bay K-23N 40.572069 W 73.976340 8.36 10.66
6.6 6.6 - 6.7
9.8 9.1 - 9.8
11.1 10 - 11.2
14.4 12.9 - 14.6
Raritan Bay K-24N 40.571304 W 73.985245 8.36 11.20
76.7 - 7
9.9 9.4 - 10
11.2 10 - 11.4
14.6 12.8 - 14.9
Raritan Bay K-25N 40.570384 W 73.994383 8.64 11.34
76.7 - 7
9.8 9.4 - 9.8
11.1 10.7 - 11.2
14.5 13.9 - 14.6
Raritan Bay K-26N 40.572728 W 74.004156 8.91 11.14
76.6 - 7
9.8 9.5 - 9.8
11.1 10.8 - 11.1
14.4 14.2 - 14.5
Raritan Bay K-27N 40.576794 W 74.012480 8.55 6.99 7
9.8 9.8 - 9.9
11.1 10.2 - 11.3
14.4 13.1 - 14.9

TABLE 5: TRANSECT DATA - continued
1Stillwater elevations include the contribution from wave setup. 2For transects with a constant stillwater elevation, only one number is provided to represent both the starting value and the range.
39
FloodSource Transect
Starting Wave Conditions for the 1% Annual Chance
Starting Stillwater Elevations1 (ft NAVD88) Range of Stillwater Elevations2(ft NAVD88)
CoordinatesSignificant Wave
Height (ft) Peak Wave Period (sec)
10% Annual Chance
2% Annual Chance
1% Annual Chance
0.2% Annual Chance
Lower New York Bay K-28
N 40.590029 W 73.998578 4.48 4.56
77 - 7.1 9.8
11.2 10.1 - 11.2
14.5 12.9 - 14.5
Lower New York Bay K-29
N 40.595454 W 74.002996 4.73 5.34 7 9.9
11.2 11 - 11.3
14.6 14.5 - 14.6
Lower New York Bay K-30
N 40.600945 W 74.011295 5.69 6.00 7 9.9 11.3
14.7 14.6 - 14.7
Lower New York Bay K-31
N 40.603748 W 74.022831 6.03 5.96 7.1 10
11.4 11.2 - 11.4
14.8 14.8 - 15.1
Upper New York Bay K-32
N 40.610985 W 74.036792 7.18 6.66 7.1 10
11.3 11.3 - 11.4 14.7
Upper New York Bay K-33
N 40.619585 W 74.041365 7.20 7.43 7 9.9 11.3 14.6
Upper New York Bay K-34
N 40.627366 W 74.041565 6.59 6.87 7 9.9 11.3 14.7
Upper New York Bay K-35
N 40.634525 W 74.039003 6.25 5.98 7 10
11.4 11.3 - 11.4
14.8 14.6 - 14.8
Upper New York Bay K-36
N 40.642177 W 74.036170 5.84 5.29 7 10
11.4 11 - 11.4
14.8 14.6 - 14.8
Upper New York Bay K-37
N 40.645337 W 74.026905 4.92 4.45 7
9.9 9.8 - 9.9
11.4 11.3 - 11.4
14.8 14.7 - 14.8
Upper New York Bay K-38
N 40.650947 W 74.024463 4.83 4.33 7 9.9
11.3 11.1 - 11.3
14.8 14.5 - 14.8
Upper New York Bay K-39
N 40.657654 W 74.018838 4.45 4.10
6.9 6.8 - 6.9 9.9
11.3 11.2 - 11.3
14.8 14.6 - 14.8
Upper New York Bay K-40
N 40.660150 W 74.007926 2.64 3.11 6.9
9.8 9.6 - 9.8
11.2 11 - 11.2
14.7 14.5 - 14.7
Upper New York Bay K-41
N 40.667702 W 74.004180 2.71 2.44
6.9 6.6 - 6.9
9.8 9.5 - 9.8
11.3 10.3 - 11.3
14.8 13.8 - 14.8

TABLE 5: TRANSECT DATA - continued
1Stillwater elevations include the contribution from wave setup. 2For transects with a constant stillwater elevation, only one number is provided to represent both the starting value and the range.
40
FloodSource Transect
Starting Wave Conditions for the 1% Annual Chance
Starting Stillwater Elevations1 (ft NAVD88) Range of Stillwater Elevations2(ft NAVD88)
CoordinatesSignificant Wave
Height (ft) Peak Wave Period (sec)
10% Annual Chance
2% Annual Chance
1% Annual Chance
0.2% Annual Chance
Upper New York Bay K-42
N 40.670684 W 74.018672 4.30 4.12
76.8 - 7
9.9 9.7 - 9.9
11.4 10.7 - 11.4
14.9 14.4 - 14.9
Upper New York Bay K-43
N 40.676241 W 74.017878 4.24 4.09 7
9.9 9.7 - 9.9
11.3 10.9 - 11.3
14.9 14.6 - 14.9
Upper New York Bay K-44
N 40.683167 W 74.013571 3.15 4.24
6.8 6.7 - 7
9.9 9.7 - 9.9
11.3 11.1 - 11.3
14.9 14.7 - 14.9
East River K-45N 40.687110 W 74.005415 1.61 3.74 6.9
9.8 9.8 - 9.9
11.3 10.8 - 11.3
14.8 14.5 - 14.8
East River K-46N 40.693747 W 74.001117 3.35 3.17 6.8
9.8 9.7 - 9.8
11.2 11.1 - 11.2
14.8 14.7 - 14.8
East River K-47N 40.699626 W 73.997517 3.32 3.61 6.8
9.8 9.7 - 9.8
11.2 10.8 - 11.2
14.7 14.6 - 14.7
East River K-48N 40.705170 W 73.987400 2.66 2.67 6.8
9.7 9.5 - 9.7
11 10.9 - 11
14.3 14.1 - 14.3
East River K-49N 40.705888 W 73.973068 2.86 2.93
6.9 6.7 - 6.9
9.7 9.2 - 10.6
10.9 10.6 - 11
14 13.8 - 14.1
East River K-50N 40.714219 W 73.968382 3.08 3.31 6.9 9.6 10.9 13.9
East River K-51N 40.722032 W 73.962987 3.30 3.48 6.9
9.6 9.3 - 9.6
10.9 10.7 - 10.9
13.9 13.7 - 13.9
East River K-52N 40.729474 W 73.961207 3.14 3.21
77 - 7.1
9.7 9.6 - 9.7
10.9 10 - 10.9
13.9 12.8 - 13.9
East River K-53N 40.736815 W 73.960049 3.12 3.24 6.9 9.6
10.9 10.1 - 10.9
13.9 13 - 13.9
Jamaica Bay K-54N 40.616812 W 73.870376 2.93 3.03
6.6 6.5 - 6.6
98.9 - 9
10.1 10 - 10.1
12.7 12.6 - 12.7
Jamaica Bay K-55N 40.596268 W 73.859579 3.04 2.87
6.6 6.5 - 6.6
8.9 8.8 - 8.9
9.9 9.8 - 9.9
12.5 12 - 12.5

TABLE 5: TRANSECT DATA - continued
1Stillwater elevations include the contribution from wave setup. 2For transects with a constant stillwater elevation, only one number is provided to represent both the starting value and the range.
41
FloodSource Transect
Starting Wave Conditions for the 1% Annual Chance
Starting Stillwater Elevations1 (ft NAVD88) Range of Stillwater Elevations2(ft NAVD88)
CoordinatesSignificant Wave
Height (ft) Peak Wave Period (sec)
10% Annual Chance
2% Annual Chance
1% Annual Chance
0.2% Annual Chance
New York County, NY
East River NY-1 N 40.793831 W 73.913812 2.68 2.92
9.3 7.5 - 9.3
11.8 10.3 - 11.8
12.8 11.3 - 12.9
15.1 13.4 - 15.4
East River NY-2 N 40.781691 W 73.929639 2.18 2.68
8.1 8.1 - 8.2
10.8 10.7 - 10.8
11.9 11.8 - 11.9
14.5 14.3 - 14.5
East River NY-3 N 40.785609 W 73.939519 2.32 2.97
8.2 5.6 - 8.2
10.9 10.4 - 12.6
12 11.8 - 12
14.5 14.5 - 14.7
East River NY-4 N 40.779837 W 73.943466 2.45 2.82 8.2 10.8
11.9 11.8 - 11.9
14.5 14.4 - 14.5
East River NY-5 N 40.774289 W 73.943270 2.78 3.50 7.9 10.5 11.7 14.3
East River NY-6 N 40.772969 W 73.940171 2.52 3.02
8.1 7.6 - 8.1
10.6 10.4 - 10.7
11.7 11 - 11.7
14.1 13.6 - 14.2
East River NY-7 N 40.749979 W 73.966252 2.98 3.18 7.1 9.8 11 13.9
East River NY-8 N 40.743089 W 73.971655 3.11 3.21 7 9.8
11 10.7 - 11
14 13.9 - 14
East River NY-9 N 40.737477 W 73.972616 3.15 3.22
76.7 - 7 9.7
11 10.7 - 11
13.9 13.9 - 14.1
East River NY-10 N 40.731894 W 73.973573 3.18 3.24 6.9 9.7
11 10.7 - 11 13.9
East River NY-11 N 40.724087 W 73.972177 3.32 3.48
6.9 6.9 - 7.4
9.7 9.5 - 9.7
10.9 10.7 - 10.9
13.9 13.9 - 14
East River NY-12 N 40.716408 W 73.974358 3.16 3.36
6.8 6.6 - 6.8
9.6 9.5 - 9.6
10.9 10.7 - 10.9
13.9 13.8 - 14.1
East River NY-13 N 40.710420 W 73.979459 2.74 2.86 6.8 9.6
10.9 10.7 - 10.9
14 13.9 - 14

TABLE 5: TRANSECT DATA - continued
1Stillwater elevations include the contribution from wave setup. 2For transects with a constant stillwater elevation, only one number is provided to represent both the starting value and the range.
42
FloodSource Transect
Starting Wave Conditions for the 1% Annual Chance
Starting Stillwater Elevations1 (ft NAVD88) Range of Stillwater Elevations2(ft NAVD88)
CoordinatesSignificant Wave
Height (ft) Peak Wave Period (sec)
10% Annual Chance
2% Annual Chance
1% Annual Chance
0.2% Annual Chance
East River NY-14 N 40.709185 W 73.987873 2.58 2.65
6.8 6.6 - 6.8 9.6
11 10.9 - 11
14.3 14.3 - 14.5
East River NY-15 N 40.708799 W 73.997024 2.93 3.09
6.8 6.7 - 6.8 9.7
11.1 10.9 - 11.1 14.6
East River NY-16 N 40.705313 W 74.003819 3.12 3.51
6.8 6.6 - 6.8
9.8 9.7 - 9.8
11.2 10.9 - 11.3
14.7 14.7 - 14.8
East River NY-17 N 40.701590 W 74.010682 3.37 3.21
6.9 6.9 - 7.4 9.9
11.3 10.7 - 11.3
14.8 14.8 - 14.9
Upper New York Bay NY-18
N 40.702983 W 74.017383 5.01 5.17 6.9 9.9
11.3 11 - 11.3
14.9 14.7 - 14.9
Hudson River NY-19 N 40.709054 W 74.018613 5.02 5.81
6.9 6.9 - 7.3
9.8 9.1 - 9.8
11.3 10.5 - 11.3
14.8 14.3 - 15.1
Hudson River NY-20 N 40.715891 W 74.017227 4.94 5.82 6.6 9.7
11.2 10.7 - 11.2
14.7 14.3 - 14.7
Hudson River NY-21 N 40.722252 W 74.012398 4.71 5.27 6.7
9.7 9.6 - 9.7
11.1 10.1 - 11.1
14.6 14.4 - 14.6
Hudson River NY-22 N 40.729533 W 74.014233 4.59 5.21
6.7 6.6 - 6.7 9.6
11 10.8 - 11
14.4 14.2 - 14.4
Hudson River NY-23 N 40.735728 W 74.010684 4.56 5.01 6.6 9.4
11 10.8 - 11
14.4 14.3 - 14.4
Hudson River NY-24 N 40.742069 W 74.009242 4.40 4.89 6.5 9.4
10.9 10.8 - 10.9
14.3 14.1 - 14.3
Hudson River NY-25 N 40.750050 W 74.009229 4.44 5.20
6.4 6.4 - 6.6
9.3 9.1 - 9.3
10.7 10.4 - 10.7
14.1 13.9 - 14.1
Hudson River NY-26 N 40.755928 W 74.006425 4.56 4.89
6.5 6.5 - 6.6 9.3
10.6 10 - 10.6
14 13.7 - 14
Hudson River NY-27 N 40.763002 W 74.001275 4.36 4.68 6.6 9.3
10.7 10.4 - 10.7
14.2 13.8 - 14.2

TABLE 5: TRANSECT DATA - continued
1Stillwater elevations include the contribution from wave setup. 2For transects with a constant stillwater elevation, only one number is provided to represent both the starting value and the range.
43
FloodSource Transect
Starting Wave Conditions for the 1% Annual Chance
Starting Stillwater Elevations1 (ft NAVD88) Range of Stillwater Elevations2(ft NAVD88)
CoordinatesSignificant Wave
Height (ft) Peak Wave Period (sec)
10% Annual Chance
2% Annual Chance
1% Annual Chance
0.2% Annual Chance
Hudson River NY-28 N 40.767894 W 73.996609 2.66 4.43 6.4 9.2 10.6
14 13.8 - 14
Hudson River NY-29 N 40.773962 W 73.993331 4.16 4.41 6.4 9.1
10.5 10.2 - 10.5
13.8 13.6 - 13.8
Hudson River NY-30 N 40.781047 W 73.988345 4.59 5.17 6.2 9 10.4
13.7 13.4 - 13.7
Hudson River NY-31 N 40.787199 W 73.984194 4.58 5.15 6.2 8.9 10.2
13.4 13.4 - 13.5
Hudson River NY-32 N 40.797037 W 73.977270 3.88 4.85 6 8.8 10.2 13.6
Hudson River NY-33 N 40.818234 W 73.961908 3.98 4.58 5.9
8.6 8.6 - 8.8
9.9 9.7 - 9.9
13.2 12.7 - 13.2
Hudson River NY-34 N 40.826015 W 73.957987 3.79 4.47 5.9 8.5
9.7 9.6 - 9.7
12.9 12.6 - 12.9
Hudson River NY-35 N 40.833945 W 73.950475 3.57 4.21 5.8 8.4 9.7
12.9 12.8 - 12.9
Hudson River NY-36 N 40.845426 W 73.946225 3.37 3.93 5.8 8.4
9.6 9.6 - 9.7
12.8 12.6 - 12.8
Hudson River NY-37 N 40.859698 W 73.937985 3.67 4.03 5.6 8.1 9.3 12.5
Hudson River NY-38 N 40.869369 W 73.932182 3.84 3.93 5.5 8.1 9.4
12.6 12.2 - 12.6
East River NY-39 N 40.692651 W 74.014019 3.35 3.21 6.9 9.8 11.3 14.8
Upper New York Bay NY-40
N 40.684656 W 74.026236 5.45 5.23 6.9
9.9 9.8 - 9.9
11.3 10.9 - 11.3
14.9 14.8 - 14.9
Upper New York Bay NY-41
N 40.690563 W 74.021778 5.56 5.44 6.9 9.8
11.2 10.8 - 11.2
14.8 14.6 - 14.8

TABLE 5: TRANSECT DATA - continued
1Stillwater elevations include the contribution from wave setup. 2For transects with a constant stillwater elevation, only one number is provided to represent both the starting value and the range.
44
FloodSource Transect
Starting Wave Conditions for the 1% Annual Chance
Starting Stillwater Elevations1 (ft NAVD88) Range of Stillwater Elevations2(ft NAVD88)
Coordinates Significant Wave
Height (ft) Peak Wave Period (sec)
10% Annual Chance
2% Annual Chance
1% Annual Chance
0.2% Annual Chance
Queens County, NY Oyster Bay
Inlet Q-1N 40.594669 W 73.745862 3.35 3.21 6.2
8.8 8.3 - 8.8
10.2 9.9 - 10.7
14 14 - 14.2
AtlanticOcean Q-2
N 40.591015 W 73.759443 16.60 12.67 6.6
9.4 8.3 - 9.7
10.8 9.4 - 10.8
15.1 12.5 - 15.4
AtlanticOcean Q-3
N 40.591317 W 73.765597 16.58 12.68
6.7 6.4 - 6.7
9.3 8 - 9.3
10.8 9 - 10.8
15 11.4 - 15
AtlanticOcean Q-4
N 40.590428 W 73.773961 16.58 12.65
6.7 6.3 - 6.7
9.5 8.3 - 9.6
11 9.3 - 11
15.4 11.7 - 16
AtlanticOcean Q-5
N 40.588977 W 73.783052 16.56 12.59
6.8 6.4 - 6.8
9.6 8 - 9.6
11.1 9.1 - 11.4
15.5 11.5 - 16.1
AtlanticOcean Q-6
N 40.587307 W 73.792161 16.47 12.51
6.9 6.5 - 7
9.7 8.3 - 9.8
11.2 9.2 - 11.2
15.4 11.5 - 15.4
AtlanticOcean Q-7
N 40.585476 W 73.800662 16.64 12.47
6.6 6.4 - 6.6
9.6 8.3 - 9.6
11.2 9.3 - 11.3
15.7 11.7 - 15.8
AtlanticOcean Q-8
N 40.584194 W 73.808180 16.61 12.41
6.8 6.1 - 6.8
9.6 8.2 - 9.6
11 9.2 - 11
15.3 11.7 - 15.3
AtlanticOcean Q-9
N 40.582866 W 73.815873 16.80 12.41
6.9 6.4 - 6.9
9.5 8.3 - 9.5
10.9 9.4 - 10.9
15.1 11.7 - 15.1
AtlanticOcean Q-10
N 40.580918 W 73.822877 16.77 12.35
6.8 6.6 - 6.8
9.5 8.4 - 9.5
10.9 9.5 - 10.9
15.1 11.8 - 15.1
AtlanticOcean Q-11
N 40.578178 W 73.831836 16.55 12.22 6.8
9.5 8.5 - 9.5
11.1 9.6 - 11.1
15.5 12 - 15.5
AtlanticOcean Q-12
N 40.575263 W 73.839673 16.41 12.13
6.9 6.5 - 6.9
9.7 8.6 - 9.7
11.2 9.7 - 11.3
15.4 12.2 - 15.8
AtlanticOcean Q-13
N 40.572588 W 73.847907 16.10 11.98
6.9 6.5 - 6.9
9.5 8.6 - 9.5
11.2 9.7 - 11.2
15.4 12.2 - 15.7

TABLE 5: TRANSECT DATA - continued
1Stillwater elevations include the contribution from wave setup. 2For transects with a constant stillwater elevation, only one number is provided to represent both the starting value and the range.
45
FloodSource Transect
Starting Wave Conditions for the 1% Annual Chance
Starting Stillwater Elevations1 (ft NAVD88) Range of Stillwater Elevations2(ft NAVD88)
Coordinates Significant Wave
Height (ft) Peak Wave Period (sec)
10% Annual Chance
2% Annual Chance
1% Annual Chance
0.2% Annual Chance
AtlanticOcean Q-14
N 40.569530 W 73.856159 15.63 11.79
6.9 6.6 - 6.9
9.3 8.7 - 9.3
11.2 9.9 - 11.2
15.2 12.5 - 15.2
AtlanticOcean Q-15
N 40.566813 W 73.864874 15.52 11.80
6.9 6.6 - 6.9
9.7 8.8 - 9.7
11.1 9.9 - 11.1
15.1 12.4 - 15.1
AtlanticOcean Q-16
N 40.563836 W 73.874305 15.61 11.83 6.9
9.7 8.8 - 9.7
11.1 9.9 - 11.5
15.1 12.5 - 15.6
AtlanticOcean Q-17
N 40.560930 W 73.883202 15.43 11.99
6.9 6.6 - 6.9
9.6 8.6 - 9.6
11 9.8 - 11
14.9 12.5 - 14.9
AtlanticOcean Q-18
N 40.558587 W 73.891068 15.37 12.08 6.8
9.6 8.7 - 9.6
11 10 - 11
14.9 12.8 - 14.9
AtlanticOcean Q-19
N 40.557177 W 73.897973 16.30 11.79
6.9 6.7 - 6.9
9.4 8.9 - 9.4
11 10 - 11.1
14.9 12.8 - 15.5
AtlanticOcean Q-20
N 40.555047 W 73.908256 16.19 11.83
7.1 6.6 - 7.1
9.9 9.1 - 10
11.3 10.3 - 11.6
15.1 13.1 - 15.3
AtlanticOcean Q-21
N 40.551618 W 73.917206 16.58 11.72
76.5 - 7
9.8 9.1 - 10.1
11.2 10.4 - 11.5
14.9 13.2 - 15.3
AtlanticOcean Q-22
N 40.548471 W 73.925678 16.84 11.68
76.5 - 7.3
9.8 9.1 - 10
11.2 10.4 - 11.3
14.7 13.4 - 14.9
AtlanticOcean Q-23
N 40.545638 W 73.932721 17.12 11.62
76.6 - 7
9.7 8.9 - 9.8
11 10.1 - 11.1
14.3 13.1 - 14.7
AtlanticOcean Q-24
N 40.547566 W 73.940247 7.40 7.80
6.7 6.7 - 6.9
9.3 9.1 - 9.3
10.4 10.3 - 10.5
13.2 13.1 - 13.8
Rockaway Inlet Q-25
N 40.557202 W 73.935954 4.60 4.05
6.8 6.6 - 6.8
9.3 9 - 9.5
10.5 10.2 - 10.8
13.4 13.4 - 14.3
Rockaway Inlet Q-26
N 40.560125 W 73.928427 4.59 4.09
6.7 6.6 - 6.7
9.2 9 - 9.7
10.4 10.4 - 11.1
13.3 13.3 - 14.9
Rockaway Inlet Q-27
N 40.562836 W 73.918331 4.81 4.29
6.7 6.6 - 6.7
9.2 9.2 - 9.7
10.4 10.4 - 11.2
13.2 13.2 - 15

TABLE 5: TRANSECT DATA - continued
1Stillwater elevations include the contribution from wave setup. 2For transects with a constant stillwater elevation, only one number is provided to represent both the starting value and the range.
46
FloodSource Transect
Starting Wave Conditions for the 1% Annual Chance
Starting Stillwater Elevations1 (ft NAVD88) Range of Stillwater Elevations2(ft NAVD88)
Coordinates Significant Wave
Height (ft) Peak Wave Period (sec)
10% Annual Chance
2% Annual Chance
1% Annual Chance
0.2% Annual Chance
Rockaway Inlet Q-28
N 40.562807 W 73.905540 4.04 3.99 6.7
9.1 8.9 - 9.1
10.2 10 - 10.2
12.9 12.8 - 13.5
Rockaway Inlet Q-29
N 40.564806 W 73.897078 3.65 3.67 6.6
9.1 8.8 - 9.1
10.1 10 - 10.1
12.8 12.8 - 13
Rockaway Inlet Q-30
N 40.568633 W 73.889579 3.90 4.35 6.6
8.9 8.7 - 8.9
10 9.8 - 10
12.6 12.4 - 12.7
Rockaway Inlet Q-31
N 40.568614 W 73.879877 3.28 4.01 6.6
8.8 8.5 - 8.9
9.7 9.7 - 10.1
12.4 12.4 - 13.6
Jamaica Bay Q-32N 40.571129 W 73.872699 3.31 3.58 6.6
8.9 8.8 - 9.3
9.9 9.9 - 11.3
12.4 12.4 - 15.7
Jamaica Bay Q-33N 40.575222 W 73.864420 2.31 2.53
6.5 6.5 - 6.7
8.9 8.8 - 9
9.9 9.8 - 10.7
12.4 12.4 - 14.3
Jamaica Bay Q-34N 40.579347 W 73.856668 2.33 2.53
6.6 6.5 - 6.6
8.8 8.7 - 8.9
9.9 9.8 - 10.8
12.3 12.2 - 14.9
Jamaica Bay Q-35N 40.581586 W 73.845151 2.36 2.42
6.5 6.5 - 6.6
8.8 8.7 - 9
9.7 9.6 - 10.5
12.1 12.1 - 14.3
Jamaica Bay Q-36N 40.583782 W 73.832484 2.31 2.37 6.5
8.7 8.6 - 8.7
9.7 9.5 - 9.9
11.9 11.9 - 13.3
Jamaica Bay Q-37N 40.599213 W 73.799926 2.45 2.51
6.4 6.4 - 6.5
8.6 8.3 - 8.6
9.5 9.3 - 9.6
11.8 11.6 - 14
Jamaica Bay Q-38N 40.601870 W 73.784291 2.46 2.69
6.6 6.5 - 6.6
8.7 8.2 - 8.8
9.6 9.2 - 10
11.8 11.6 - 13.7
Jamaica Bay Q-39N 40.608130 W 73.780568 3.11 3.74 6.4 8.5 9.5 11.8
Jamaica Bay Q-40N 40.604180 W 73.775460 2.16 3.30 6.4 8.5 9.5 11.8
Jamaica Bay Q-41N 40.597957 W 73.771696 1.98 2.93
6.4 6.4 - 6.5
8.5 8.3 - 8.6
9.4 9.2 - 10.7
11.7 11.6 - 15

TABLE 5: TRANSECT DATA - continued
1Stillwater elevations include the contribution from wave setup. 2For transects with a constant stillwater elevation, only one number is provided to represent both the starting value and the range.
47
FloodSource Transect
Starting Wave Conditions for the 1% Annual Chance
Starting Stillwater Elevations1 (ft NAVD88) Range of Stillwater Elevations2(ft NAVD88)
Coordinates Significant Wave
Height (ft) Peak Wave Period (sec)
10% Annual Chance
2% Annual Chance
1% Annual Chance
0.2% Annual Chance
Jamaica Bay Q-42N 40.608876 W 73.768933 2.47 3.19 6.4
8.5 8.4 - 8.6
9.5 9 - 9.5
11.8 11.4 - 11.8
Head of Bay Q-43N 40.636635 W 73.746686 2.96 2.90
6.3 6.2 - 6.3
8.5 8.2 - 8.6
9.4 8.7 - 9.4
11.9 11.1 - 11.9
Head of Bay Q-44N 40.632402 W 73.756471 3.12 3.04 6.3
8.5 8.5 - 8.6
9.5 8.7 - 9.5
11.8 10.4 - 11.8
Jamaica Bay Q-45N 40.626856 W 73.775550 3.39 3.88 6.3
8.5 7.8 - 8.7
9.5 8.7 - 9.5
11.9 10.4 - 11.9
Jamaica Bay Q-46N 40.630490 W 73.783438 3.13 3.35 6.4
8.6 8.6 - 8.7
9.7 9.3 - 9.7
12.1 8.9 - 12.1
Jamaica Bay Q-47N 40.634532 W 73.791294 3.77 3.45 6.4 8.7
9.7 9.5 - 9.7
12.2 10.4 - 12.2
Jamaica Bay Q-48N 40.638481 W 73.799361 4.07 3.74 6.4 8.7
9.7 9.4 - 9.7
12.2 9 - 12.2
Jamaica Bay Q-49N 40.641954 W 73.807004 4.13 3.79 6.4 8.7 9.7
12.3 11.1 - 12.4
Jamaica Bay Q-50N 40.645451 W 73.815218 3.80 3.48 6.4 8.7 9.8
12.3 11.3 - 12.3
Jamaica Bay Q-51N 40.648086 W 73.835104 3.00 3.03
6.4 6.4 - 6.6
8.8 8.4 - 8.9
9.9 9.6 - 10
12.5 12.1 - 12.7
Jamaica Bay Q-52N 40.644655 W 73.843198 3.45 3.00
6.4 6.4 - 6.5
8.9 8.6 - 9.6
10 9.7 - 10
12.6 12.2 - 12.8
Jamaica Bay Q-53N 40.650765 W 73.854350 2.70 2.74 6.5
99 - 9.6
10.1 9.7 - 10.1
12.9 12.6 - 13
East River Q-54N 40.741010 W 73.961831 3.12 3.26
76.7 - 7
9.7 8.9 - 9.7
11 10.3 - 11
14 13.4 - 14
East River Q-55N 40.744804 W 73.958734 2.92 3.17
77 - 7.1
9.8 8.9 - 9.8
11 10.1 - 11
14 12.8 - 14

TABLE 5: TRANSECT DATA - continued
1Stillwater elevations include the contribution from wave setup. 2For transects with a constant stillwater elevation, only one number is provided to represent both the starting value and the range.
48
FloodSource Transect
Starting Wave Conditions for the 1% Annual Chance
Starting Stillwater Elevations1 (ft NAVD88) Range of Stillwater Elevations2(ft NAVD88)
Coordinates Significant Wave
Height (ft) Peak Wave Period (sec)
10% Annual Chance
2% Annual Chance
1% Annual Chance
0.2% Annual Chance
East River Q-56N 40.749444 W 73.955923 2.73 3.15
7.1 7 - 7.1
9.8 9 - 9.9
11 9.8 - 11.2
14 12.2 - 14.2
East River Q-57N 40.790792 W 73.909040 2.64 2.77
9.2 9.1 - 9.2
11.7 11.4 - 12.1
12.7 12.4 - 12.7
14.9 14.6 - 14.9
East River Q-58N 40.788781 W 73.900060 2.89 3.17 9.4
11.8 11.8 - 12.6
12.7 12.7 - 12.8
15 15 - 15.3
East River Q-59N 40.783012 W 73.895900 2.85 3.00
9.4 9.3 - 9.4
11.9 11.6 - 12.6
12.9 12.7 - 12.9
15.1 15.1 - 15.3
East River Q-60N 40.779115 W 73.891502 2.77 2.74 9.5
11.9 11.9 - 12.3
12.9 12.8 - 12.9
15.1 15 - 15.1
Bowery Bay Q-61N 40.773964 W 73.886563 2.15 2.59
9.4 9.4 - 9.5
11.9 11.7 - 12.6
12.9 12.7 - 12.9
15 14.8 - 15
East River Q-62N 40.780091 W 73.884032 2.63 2.78 9.4
11.9 11.6 - 12.4
12.8 12.6 - 12.8
15 14.7 - 15
East River Q-63N 40.785453 W 73.870015 2.17 2.97
9.7 9 - 9.7
12.2 11.4 - 12.6
13.1 12.5 - 13.4
15.2 14.7 - 16
Flushing Bay Q-64N 40.776960 W 73.865277 2.14 2.75
9.7 9.6 - 9.8
12.1 12.1 - 12.6
13.1 12.8 - 13.4
15.2 15.1 - 15.7
Flushing Bay Q-65N 40.773346 W 73.857673 1.98 2.55
9.9 9.6 - 9.9
12 12 - 12.6
13 12.7 - 13.3
15 15 - 15.6
Flushing Bay Q-66N 40.765428 W 73.861606 1.99 2.43
9.8 9.7 - 9.8
12.2 12.2 - 12.6
13.1 12.9 - 13.1
15.1 15 - 15.1
Flushing Bay Q-67N 40.760713 W 73.855522 1.97 2.40 9.7
12.1 12.1 - 12.5
13 12.8 - 13
15 14.7 - 15
Flushing Bay Q-68N 40.762636 W 73.844918 1.88 2.31
9.7 9.4 - 9.7
12 11.5 - 12.6
12.9 12.2 - 12.9
14.9 13.2 - 14.9
Flushing Bay Q-69N 40.772603 W 73.849560 1.96 2.55 9.7
12 11 - 12.3
12.9 12.1 - 12.9
14.9 13.8 - 14.9

TABLE 5: TRANSECT DATA - continued
1Stillwater elevations include the contribution from wave setup. 2For transects with a constant stillwater elevation, only one number is provided to represent both the starting value and the range.
49
FloodSource Transect
Starting Wave Conditions for the 1% Annual Chance
Starting Stillwater Elevations1 (ft NAVD88) Range of Stillwater Elevations2(ft NAVD88)
Coordinates Significant Wave
Height (ft) Peak Wave Period (sec)
10% Annual Chance
2% Annual Chance
1% Annual Chance
0.2% Annual Chance
Flushing Bay Q-70N 40.778912 W 73.849789 2.20 2.57 9.7
12 12 - 12.4
12.9 12.8 - 12.9
14.9 14.7 - 14.9
Flushing Bay Q-71N 40.782781 W 73.855419 2.11 2.57
9.6 9.6 - 9.7
12 11.8 - 12
13 12.7 - 13
15 14.8 - 15
East River Q-72N 40.786851 W 73.858353 2.41 3.05 9.7
12.2 11.8 - 12.2
13.2 12.9 - 13.2
15.4 15 - 15.4
East River Q-73N 40.789605 W 73.854575 2.33 3.00 9.7 12.3 13.3
15.7 15.7 - 15.8
East River Q-74N 40.794228 W 73.853197 2.48 3.37 9.6 12 13
15.1 15.1 - 15.8
East River Q-75N 40.794223 W 73.849052 1.92 2.74 9.6
12 12 - 12.1 12.9 14.9
East River Q-76N 40.795995 W 73.846778 2.54 3.48 9.7 12.1 13 15
East River Q-77N 40.796866 W 73.840234 2.72 3.58
9.6 9.6 - 9.7
11.8 11.8 - 11.9
12.8 12.7 - 12.9
14.7 14.7 - 15
East River Q-78N 40.792646 W 73.836711 1.89 2.48 9.7
12.1 12.1 - 12.4
13 12.9 - 13 15
East River Q-79N 40.788656 W 73.832370 1.73 2.37 9.7
12.1 11.9 - 12.1
13 12.8 - 13
15 14.9 - 15
East River Q-80N 40.792125 W 73.828807 1.81 2.62 9.7 12 12.9 14.9
East River Q-81N 40.796754 W 73.827758 2.68 3.44 9.7 12 12.9 14.9
East River Q-82N 40.800467 W 73.820914 2.60 3.41 9.6 11.9 12.8 14.7
East River Q-83N 40.798011 W 73.814756 2.77 3.61 9.7 12 12.9 14.8

TABLE 5: TRANSECT DATA - continued
1Stillwater elevations include the contribution from wave setup. 2For transects with a constant stillwater elevation, only one number is provided to represent both the starting value and the range.
50
FloodSource Transect
Starting Wave Conditions for the 1% Annual Chance
Starting Stillwater Elevations1 (ft NAVD88) Range of Stillwater Elevations2(ft NAVD88)
Coordinates Significant Wave
Height (ft) Peak Wave Period (sec)
10% Annual Chance
2% Annual Chance
1% Annual Chance
0.2% Annual Chance
East River Q-84N 40.796555 W 73.807127 2.76 3.60 9.7 11.9
12.8 12.7 - 12.8
14.7 14.6 - 14.7
East River Q-85N 40.795622 W 73.798051 2.97 3.84 9.7 12.1
12.9 12.9 - 13 14.8
Little Bay Q-86N 40.792174 W 73.794948 3.07 3.44
9.9 9.8 - 9.9
12.3 12.1 - 12.3
13.2 13.1 - 13.2
15.3 15.1 - 15.3
Little Bay Q-87N 40.790352 W 73.788610 3.32 3.58 9.8
12.1 11.9 - 12.2
12.9 12.8 - 12.9
14.8 14.7 - 14.8
Little Bay Q-88N 40.792818 W 73.780787 2.99 3.75 9.8 12 12.9 14.8
Little Neck Bay Q-89
N 40.796678 W 73.779399 3.07 3.32
9.7 9.7 - 9.8 12
12.8 12.8 - 12.9 14.6
Little Neck Bay Q-90
N 40.793805 W 73.774072 3.34 3.39 9.8 12
12.8 12.8 - 12.9 14.7
Little Neck Bay Q-91
N 40.789138 W 73.771231 3.08 3.23 9.8
12 11.9 - 12.6
12.9 12.8 - 12.9
14.7 14.6 - 14.8
Little Neck Bay Q-92
N 40.782543 W 73.771118 3.09 3.23 9.8
11.9 11.9 - 12.6
12.8 12.8 - 13
14.6 14.6 - 14.8
Little Neck Bay Q-93
N 40.777313 W 73.767301 2.89 3.16 9.8 12 12.9 14.6
Little Neck Bay Q-94
N 40.771976 W 73.763192 2.76 3.09 9.8
12 11.7 - 12
12.9 12.7 - 12.9
14.6 14.5 - 14.7
Little Neck Bay Q-95
N 40.766360 W 73.756074 2.61 3.20
9.8 9.7 - 9.8
12 11.3 - 12.4
12.8 12.2 - 12.8
14.5 14 - 14.6
Little Neck Bay Q-96
N 40.769218 W 73.754705 2.62 3.23 9.8
12 11.8 - 12
12.8 12.6 - 12.8
14.5 14.3 - 14.5
Little Neck Bay Q-97
N 40.772355 W 73.753746 2.85 3.15 9.8
12 11.8 - 12
12.8 12.6 - 12.8
14.5 14.4 - 14.5

TABLE 5: TRANSECT DATA - continued
1Stillwater elevations include the contribution from wave setup. 2For transects with a constant stillwater elevation, only one number is provided to represent both the starting value and the range.
51
FloodSource Transect
Starting Wave Conditions for the 1% Annual Chance
Starting Stillwater Elevations1 (ft NAVD88) Range of Stillwater Elevations2(ft NAVD88)
Coordinates Significant Wave
Height (ft) Peak Wave Period (sec)
10% Annual Chance
2% Annual Chance
1% Annual Chance
0.2% Annual Chance
Little Neck Bay Q-98
N 40.778121 W 73.754360 2.89 3.16 9.6 11.9 12.7
14.5 14.4 - 14.5
Little Neck Bay Q-99
N 40.782501 W 73.751333 2.45 2.95 9.7 12.4 12.7 14.3
Little Neck Bay Q-100
N 40.780487 W 73.748058 2.16 3.20 9.7
11.9 11.7 - 11.9
12.7 12.5 - 12.7
14.5 14.3 - 14.5
Little Neck Bay Q-101
N 40.780321 W 73.746834 2.15 3.16 9.7
11.9 11.7 - 12.4
12.7 12.5 - 12.7
14.4 14.2 - 14.4
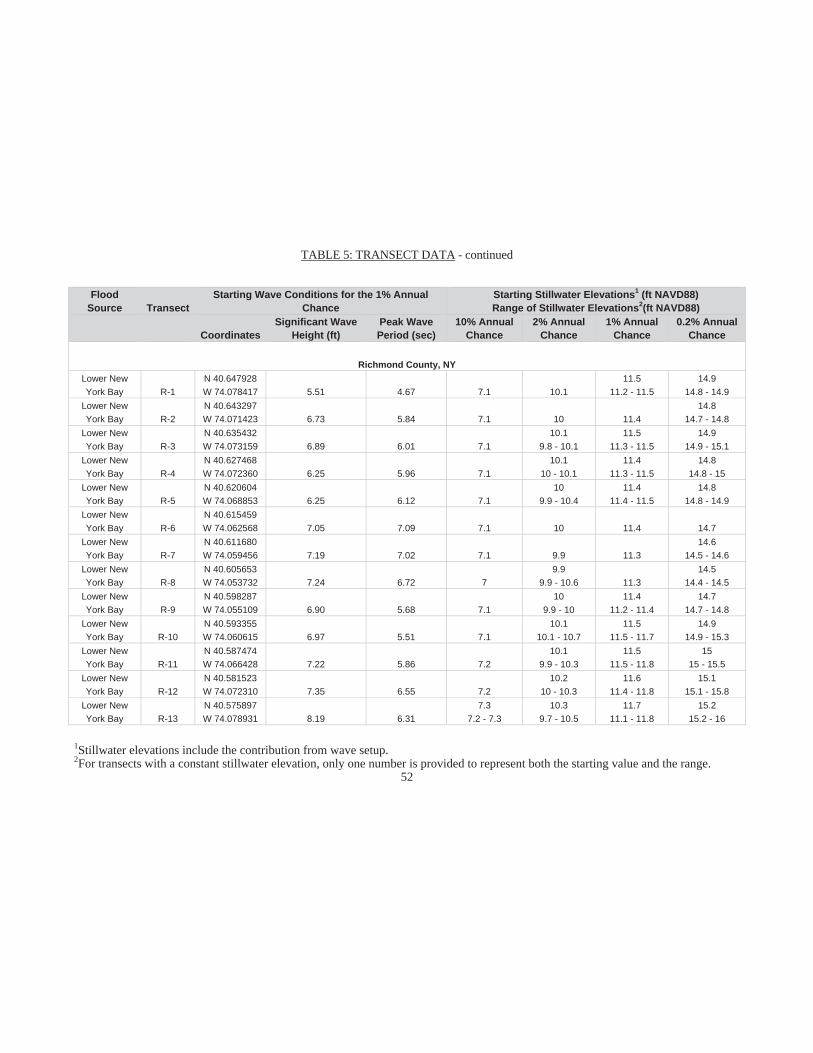
TABLE 5: TRANSECT DATA - continued
1Stillwater elevations include the contribution from wave setup. 2For transects with a constant stillwater elevation, only one number is provided to represent both the starting value and the range.
52
FloodSource Transect
Starting Wave Conditions for the 1% Annual Chance
Starting Stillwater Elevations1 (ft NAVD88) Range of Stillwater Elevations2(ft NAVD88)
CoordinatesSignificant Wave
Height (ft) Peak Wave Period (sec)
10% Annual Chance
2% Annual Chance
1% Annual Chance
0.2% Annual Chance
Richmond County, NY Lower New York Bay R-1
N 40.647928 W 74.078417 5.51 4.67 7.1 10.1
11.5 11.2 - 11.5
14.9 14.8 - 14.9
Lower New York Bay R-2
N 40.643297 W 74.071423 6.73 5.84 7.1 10 11.4
14.8 14.7 - 14.8
Lower New York Bay R-3
N 40.635432 W 74.073159 6.89 6.01 7.1
10.1 9.8 - 10.1
11.5 11.3 - 11.5
14.9 14.9 - 15.1
Lower New York Bay R-4
N 40.627468 W 74.072360 6.25 5.96 7.1
10.1 10 - 10.1
11.4 11.3 - 11.5
14.8 14.8 - 15
Lower New York Bay R-5
N 40.620604 W 74.068853 6.25 6.12 7.1
10 9.9 - 10.4
11.4 11.4 - 11.5
14.8 14.8 - 14.9
Lower New York Bay R-6
N 40.615459 W 74.062568 7.05 7.09 7.1 10 11.4 14.7
Lower New York Bay R-7
N 40.611680 W 74.059456 7.19 7.02 7.1 9.9 11.3
14.6 14.5 - 14.6
Lower New York Bay R-8
N 40.605653 W 74.053732 7.24 6.72 7
9.9 9.9 - 10.6 11.3
14.5 14.4 - 14.5
Lower New York Bay R-9
N 40.598287 W 74.055109 6.90 5.68 7.1
10 9.9 - 10
11.4 11.2 - 11.4
14.7 14.7 - 14.8
Lower New York Bay R-10
N 40.593355 W 74.060615 6.97 5.51 7.1
10.1 10.1 - 10.7
11.5 11.5 - 11.7
14.9 14.9 - 15.3
Lower New York Bay R-11
N 40.587474 W 74.066428 7.22 5.86 7.2
10.1 9.9 - 10.3
11.5 11.5 - 11.8
15 15 - 15.5
Lower New York Bay R-12
N 40.581523 W 74.072310 7.35 6.55 7.2
10.2 10 - 10.3
11.6 11.4 - 11.8
15.1 15.1 - 15.8
Lower New York Bay R-13
N 40.575897 W 74.078931 8.19 6.31
7.3 7.2 - 7.3
10.3 9.7 - 10.5
11.7 11.1 - 11.8
15.2 15.2 - 16

TABLE 5: TRANSECT DATA - continued
1Stillwater elevations include the contribution from wave setup. 2For transects with a constant stillwater elevation, only one number is provided to represent both the starting value and the range.
53
FloodSource Transect
Starting Wave Conditions for the 1% Annual Chance
Starting Stillwater Elevations1 (ft NAVD88) Range of Stillwater Elevations2(ft NAVD88)
CoordinatesSignificant Wave
Height (ft) Peak Wave Period (sec)
10% Annual Chance
2% Annual Chance
1% Annual Chance
0.2% Annual Chance
Lower New York Bay R-14
N 40.570726 W 74.085542 8.01 5.49
7.3 7.2 - 7.3
10.3 9.7 - 10.5
11.7 11.2 - 11.9
15.2 15.2 - 16
Lower New York Bay R-15
N 40.565630 W 74.092032 7.95 5.51
7.4 7.2 - 7.4
10.4 9.9 - 10.6
11.8 11.7 - 11.9
15.3 15.3 - 16
Raritan Bay R-16 N 40.560017 W 74.097971 7.70 5.57 7.4
10.4 10.3 - 10.4
11.8 11.8 - 12
15.4 15.4 - 16
Raritan Bay R-17 N 40.554569 W 74.104308 7.35 5.94
7.4 6.6 - 7.4
10.4 10.3 - 10.5
11.7 11.7 - 11.9
15.4 15.4 - 16
Raritan Bay R-18 N 40.550606 W 74.110940 7.05 6.51 7.4
10.5 10.4 - 10.7
11.9 11.8 - 12
15.5 15.5 - 16.1
Raritan Bay R-19 N 40.547211 W 74.118255 6.71 6.05
7.5 7.4 - 7.7
10.6 10.5 - 10.7
12 11.8 - 12.1
15.5 15.2 - 16.2
Raritan Bay R-20 N 40.542278 W 74.124885 6.85 6.28 7.6 10.6 12.1 15.6
Raritan Bay R-21 N 40.536754 W 74.128999 6.74 6.34 7.6 10.6
12.1 11.9 - 12.1
15.6 15.5 - 15.6
Raritan Bay R-22 N 40.530708 W 74.134748 7.21 6.65
7.5 7.5 - 7.6 10.6
12 11.8 - 12
15.5 15.5 - 15.8
Raritan Bay R-23 N 40.533872 W 74.140535 5.08 5.95 7.5 10.6
12.1 12 - 12.1 15.6
Great Kills Harbor R-24
N 40.537078 W 74.132095 1.76 2.38 7.4 10.6 12 15.6
Great Kills Harbor R-25
N 40.544967 W 74.128942 2.09 2.62 7.4 10.6 12
15.7 15.6 - 16
Great Kills Harbor R-26
N 40.545236 W 74.138461 2.03 2.76
7.5 7.4 - 7.5
10.6 10.5 - 10.6
12.1 12 - 12.1 15.8
Raritan Bay R-27 N 40.536842 W 74.144047 5.27 5.93
7.5 7.4 - 7.5 10.6
12.1 12.1 - 12.2
15.7 15.7 - 15.9

TABLE 5: TRANSECT DATA - continued
1Stillwater elevations include the contribution from wave setup. 2For transects with a constant stillwater elevation, only one number is provided to represent both the starting value and the range.
54
FloodSource Transect
Starting Wave Conditions for the 1% Annual Chance
Starting Stillwater Elevations1 (ft NAVD88) Range of Stillwater Elevations2(ft NAVD88)
CoordinatesSignificant Wave
Height (ft) Peak Wave Period (sec)
10% Annual Chance
2% Annual Chance
1% Annual Chance
0.2% Annual Chance
Raritan Bay R-28 N 40.532775 W 74.150388 6.36 6.83
7.6 0 - 0 10.7
12.1 12.1 - 12.2
15.7 15.7 - 16.1
Raritan Bay R-29 N 40.528419 W 74.157873 6.37 6.15 7.7 10.8 12.3 15.8
Raritan Bay R-30 N 40.525471 W 74.165748 7.30 6.44 7.8 10.9 12.3 15.8
Raritan Bay R-31 N 40.521914 W 74.174300 7.42 6.08 7.8 10.9 12.4 15.9
Raritan Bay R-32 N 40.519829 W 74.183611 7.53 6.08 7.8 11 12.4 16
Raritan Bay R-33 N 40.514262 W 74.190726 7.53 5.93
7.8 7.7 - 7.8 11
12.4 12.3 - 12.4
16 16 - 16.6
Raritan Bay R-34 N 40.510220 W 74.194769 6.10 4.72
7.9 7.7 - 7.9
11 10.9 - 11
12.4 12.3 - 12.7
16 15.8 - 16.5
Raritan Bay R-35 N 40.511679 W 74.208054 4.87 4.43 7.9 11.1 12.5 16.1
Raritan Bay R-36 N 40.502497 W 74.222385 6.65 5.49
86.9 - 8.1 11.2
12.7 12.5 - 12.7
16.2 16.1 - 16.3
Raritan Bay R-37 N 40.501746 W 74.231526 6.17 5.27 8.1 11.3 12.8 16.3
Raritan Bay R-38 N 40.497605 W 74.240883 6.05 5.46
8.1 7.9 - 8.7 11.3
12.8 12.8 - 13
16.4 16.4 - 16.7
Raritan Bay R-39 N 40.497433 W 74.250294 4.71 4.75
8.2 6.8 - 8.3
11.4 11.3 - 11.4
12.9 12.8 - 12.9
16.4 16.4 - 16.6
Arthur Kill R-40 N 40.508668 W 74.254714 1.47 2.17 8.2 11.4 12.8 16.2
Arthur Kill R-41 N 40.516106 W 74.248753 3.15 3.67 8.2
11.3 11.2 - 11.3
12.7 12.6 - 12.7
16.1 16 - 16.1

TABLE 5: TRANSECT DATA - continued
1Stillwater elevations include the contribution from wave setup. 2For transects with a constant stillwater elevation, only one number is provided to represent both the starting value and the range.
55
FloodSource Transect
Starting Wave Conditions for the 1% Annual Chance
Starting Stillwater Elevations1 (ft NAVD88) Range of Stillwater Elevations2(ft NAVD88)
CoordinatesSignificant Wave
Height (ft) Peak Wave Period (sec)
10% Annual Chance
2% Annual Chance
1% Annual Chance
0.2% Annual Chance
Arthur Kill R-42 N 40.519839 W 74.240138 3.30 3.84
8.1 7.4 - 8.1 11.3
12.7 12.2 - 12.7
16.1 15.8 - 16.4
Arthur Kill R-43 N 40.533052 W 74.242277 3.31 4.09 8 11.2
12.6 12.2 - 12.6
16.1 15.9 - 16.1
Arthur Kill R-44 N 40.546489 W 74.245113 3.04 3.53 8
11.1 11 - 11.1
12.5 12.3 - 12.5
15.9 15.8 - 15.9
Arthur Kill R-45 N 40.556223 W 74.225917 2.36 2.46
7.9 7.8 - 8.4
10.9 10.4 - 10.9
12.3 12 - 12.3
15.6 15.6 - 16.1
Arthur Kill R-46 N 40.576712 W 74.206661 1.23 1.94
7.7 7.6 - 7.7
10.7 10.5 - 12
12 11.6 - 12
15.2 14.8 - 15.2
Arthur Kill R-47 N 40.596065 W 74.198014 1.46 2.24
7.6 7.5 - 8.1
10.5 9.6 - 10.8
11.8 11.2 - 11.8
15 14.6 - 15
ArthurKill/Pralls
River R-48 N 40.611746 W 74.202226 0.89 1.64
7.5 7.4 - 7.7
10.4 9.4 - 10.9
11.7 10.9 - 11.7
14.8 14.1 - 14.8
Arthur Kill R-49 N 40.629270 W 74.200964 1.02 1.81
7.4 6.8 - 7.4
10.3 9.1 - 10.7
11.6 10.6 - 12.2
14.7 13.5 - 14.7
Newark Bay R-50 N 40.644615 W 74.173481 2.29 3.06
7.1 7 - 7.2
9.8 9.4 - 10.1
11 10.8 - 11
13.9 13.5 - 14
Newark Bay R-51 N 40.641895 W 74.168219 2.45 3.07 7.1
9.8 9.6 - 9.8
10.9 10.8 - 10.9 13.7
Newark Bay R-52 N 40.637944 W 74.157896 3.35 3.82
7.1 7.1 - 7.5
9.7 9.6 - 9.7
10.9 10.5 - 10.9
13.7 13.5 - 13.7
Newark Bay R-53 N 40.638943 W 74.148219 3.21 3.23
76.8 - 7
9.7 9.6 - 9.7
10.8 10.6 - 10.8
13.6 13.3 - 13.7
Kill Van Kull R-54 N 40.640911 W 74.138589 1.71 2.50 7 9.6
10.8 10.6 - 10.8
13.6 13.3 - 13.6
Kill Van Kull R-55 N 40.640142 W 74.127786 1.58 2.36
7.1 7 - 7.5 9.8
11 10.9 - 11
13.9 13.4 - 13.9

TABLE 5: TRANSECT DATA - continued
1Stillwater elevations include the contribution from wave setup. 2For transects with a constant stillwater elevation, only one number is provided to represent both the starting value and the range.
56
FloodSource Transect
Starting Wave Conditions for the 1% Annual Chance
Starting Stillwater Elevations1 (ft NAVD88) Range of Stillwater Elevations2(ft NAVD88)
CoordinatesSignificant Wave
Height (ft) Peak Wave Period (sec)
10% Annual Chance
2% Annual Chance
1% Annual Chance
0.2% Annual Chance
Kill Van Kull R-56 N 40.641811 W 74.117989 1.45 2.18
7.2 7.2 - 7.3 9.8
11.1 10.7 - 11.1
14 13.8 - 14
Kill Van Kull R-57 N 40.645573 W 74.106734 1.43 2.40
7.1 6.9 - 7.1
9.9 9.2 - 10 11.1 14.1
Kill Van Kull R-58 N 40.645431 W 74.095429 1.74 2.64
7.1 0 - 0 10 11.3 14.5
Kill Van Kull R-59 N 40.648563 W 74.086878 3.66 3.46 7.1 10 11.3 14.6

57
3.5 Vertical Datum
All FISs and FIRMs are referenced to a specific vertical datum. The vertical datum provides a starting point against which flood, ground, and structure elevations can be referenced and compared. Until recently, the standard vertical datum in use for newly created or revised FISs and FIRMs was the National Geodetic Vertical Datum of 1929 (NGVD 29). With the finalization of the North American Vertical Datum of 1988 (NAVD 88), many FIS reports and FIRMs are being prepared using NAVD 88 as the referenced vertical datum.
All flood elevations shown in this FIS report and on the FIRM are referenced to NAVD 88. Structure and ground elevations in the community must, therefore, be referenced to NAVD 88. It is important to note that adjacent communities may be referenced to NGVD 29. This may result in differences in base flood elevations across the corporate limits between the communities.
Prior versions of the FIS report and FIRM were referenced to NGVD 29. When a datum conversion is effected for an FIS report and FIRM, the Flood Profiles, Base Flood Elevations (BFEs), and Elevation Reference Marks (ERM) reflect the new datum values. To compare structure and ground elevations to 1-percent annual chance flood elevation shown in the FIS report and on the FIRM, the subject and ground elevations must be referenced to the new datum values.
As noted above, the elevations shown in the FIS report and on the FIRM for New York City are referenced to NAVD 88. Ground, structure, and flood elevations may be compared and/or referenced to NGVD 29 by applying a standard conversion factor. The conversion factor to NGVD 29 is +1.1 feet, where:
NGVD 29 = NAVD 88 + 1.1 ft
The BFEs shown on the FIRM represent whole-foot rounded values. For example, a BFE of 102.4 will appear as 102 on the FIRM and 102.6 will appear as 103. Therefore, users that wish to convert the elevations in this FIS to NGVD 29 should apply the stated conversion factor(s) to elevations shown on the Flood Profiles and supporting data tables in the FIS report, which are shown at a minimum to the nearest 0.1 foot.
For more information on NAVD of 1988, see Converting the National Flood Insurance Program to the North American Vertical Datum of 1988, FEMA Publication FIA-20/June 1992, or contact the Vertical Network Branch, National Geodetic Survey, Coast and Geodetic Survey, National Oceanic and Atmospheric Administration, Rockville, Maryland 20910 (Internet address http://www.ngs.noaa.gov).
4.0 FLOODPLAIN MANAGEMENT APPLICATIONS
The NFIP encourages State and local governments to adopt sound floodplain management programs. To assist in this endeavor, each FIS provides 1-percent-annual-chance flood data, which may include a combination of the following: 10-, 2-, 1-, and 0.2-percent-annual-chance flood elevations; delineations of the 1-percent and 0.2-percent floodplains; and 1-percent floodway. This information is presented on the FIRM and in many components of the FIS, including Flood Profiles, Floodway Data tables, and Summary of Stillwater Elevation tables. Users should reference the data presented in the FIS as well as

58
additional information that may be available at the local community map repository before making flood elevation and/or floodplain boundary determinations.
4.1 Floodplain Boundaries
To provide a national standard without regional discrimination, the 1-percent annual chance (100-year) flood has been adopted by FEMA as the base flood for floodplain management purposes. The 0.2-percent annual chance (500-year) flood is employed to indicate additional areas of flood risk in the community. For the streams studied in detail, the 100- and 500-year floodplains have been delineated using the flood elevations determined at each cross section.
For the approximate analysis in the July 5, 1994, revision, the 1-percent-annual-chance floodplain boundaries were delineated using maps supplied by the city and topographic information from maps at a scale of 1:24,000 with a contour interval of 10 feet (USGS, 1975, et cetera). For the Borough of Staten Island, the boundaries were interpolated between cross sections using topographic maps at a scale of 1:960 with a contour interval of 2 feet (Aerial Data Reduction Associates, Inc., 1989).
For the approximate analysis on Staten Island in the May 21, 2001, revision, the 1-percent-annual-chance floodplain boundaries were delineated using topographic maps supplied by the NYCDEP, at a scale of 1:400, with a contour interval of 2 feet (NYCDEP, 1999).
For the September 5, 2007, revision, all unrevised, detailed study flood hazard boundaries were redelineated using topographic maps at a scale of 1:1,200, with a contour interval of 2 feet as well as a 3 meter digital elevation model (NYC DOITT). For the revised analyses of the Bronx River, D Street Brook, Forest Hill Road Tributary, Richmond Creek as well as Eibs Pond and Stump Pond, the 3 meter digital elevation model was used to delineate boundaries between hydraulic cross sections. The remaining revised analyses were delineated using topographic maps at a scale of 1:2,400, with a contour interval of 2 feet (NYCDEP).
For the [date] revision, all detailed study flood hazard boundaries were delineated using updated topographic information generated by LiDAR (Light Detection and Ranging) for the City of New York. The LiDAR data were collected and processed by Sanborn Map Company from April 14 to May 1, 2010.
The 1- and 0.2-percent-annual-chance floodplain boundaries are shown on the FIRM (Exhibit 2). On these maps, the 1-percent-annual-chance floodplain boundary corresponds to the boundary of the areas of special flood hazards (Zones A, AE, and VE), and the 0.2% annual chance floodplain boundary corresponds to the boundary of areas of moderate flood hazards. In cases where the 1- and 0.2-percent annual chance floodplain boundaries are close together, only the 1-percent-annual-chance floodplain boundary has been shown. Small areas within the floodplain boundaries may lie above the flood elevations but cannot be shown due to limitations of the map scale and/or lack of detailed topographic data.
4.2 Floodways
Encroachment on floodplains, such as structures and fill, reduces flood-carrying capacity, increases flood heights and velocities, and increases flood hazards in areas beyond the encroachment itself. One aspect of floodplain management involves balancing the economic gain from floodplain development against the resulting

59
increase in flood hazard. For purposes of the NFIP, a floodway is used as a tool to assist local communities in this aspect of floodplain management. Under this concept, the area of the 1-percent-annual-chance floodplain is divided into a floodway and a floodway fringe. The floodway is the channel of a stream, plus any adjacent floodplain areas, that must be kept free of encroachment so that the 1-percent-annual-chance flood can be carried without substantial increases in flood heights. Minimum Federal standards limit such increases to 1.0 foot, provided that hazardous velocities are not produced. The floodways in this study are presented to local agencies as a minimum standard that can be adopted directly or that can be used as a basis for additional floodway studies.
The floodways presented in this study were computed for certain stream segments on the basis of equal conveyance reduction from each side of the floodplain. Floodway widths were computed at cross sections. Between cross sections, the floodway boundaries were interpolated. The results of the floodway computations are tabulated for selected cross sections (Table 6). The computed floodways are shown on the revised FIRM (Exhibit 2). In cases where the floodway and 1-percent-annual-chance floodplain boundaries are either close together or collinear, only the floodway boundary is shown. Portions of the floodway for the Bronx River extend beyond the corporate limits. The 1-percent-annual-chance flood discharges for Colon Tributary are contained within the storm drain. Therefore, a floodway was not computed.
Encroachment into areas subject to inundation by floodwaters having hazardous velocities aggravates the risk of flood damage, and heightens potential flood hazards by further increasing velocities. A listing of stream velocities at selected cross sections is provided in Table 6, "Floodway Data." To reduce the risk of property damage in areas where the stream velocities are high, the community may wish to restrict development in areas outside the floodway.

60
FLOODING SOURCE FLOODWAY BASE FLOOD
WATER-SURFACE ELEVATION (FEET NAVD)
CROSS SECTION DISTANCE1 WIDTH (FEET)
SECTIONAREA
(SQUAREFEET)
MEANVELOCITY(FEET PERSECOND)
REGULATORY WITHOUT FLOODWAY
WITH FLOODWAY INCREASE
Arbutus Creek A 350 414 * * * * * *B 1,100 254 1,140 0.4 11.9 7.42 7.4 0.0 C 2,136 68 446 1.1 14.1 14.1 14.1 0.0D 2,496 56 212 1.6 14.1 14.1 14.1 0.0E 3,170 116 98 3.5 20.5 20.5 20.5 0.0F 3,690 12 47 6.5 25.7 25.7 26.1 0.4G 3,860 25 79 3.9 29.3 29.3 29.3 0.0H 4,620 16 61 5.0 30.4 30.4 31.2 0.8I 5,340 87 76 3.3 35.8 35.8 35.8 0.0J 5,940 15 41 6.1 39.0 39.0 39.0 0.0K 6,460 10 28 8.9 46.7 46.7 46.8 0.1L 6,850 46 165 1.2 51.4 51.4 52.0 0.6M 7,130 24 53 3.6 51.5 51.5 52.0 0.5N 7,690 77 180 1.1 55.5 55.5 55.5 0.0
1Feet above confluence with Raritan Bay 2Elevation computed without consideration of backwater effects from Raritan Bay *Cross section (A) Not Mapped; Superseded By New Coastal Analyses
TAB
LE 6
FEDERAL EMERGENCY MANAGEMENT AGENCY
CITY OF NEW YORK, NY(BRONX, KINGS, NEW YORK,
QUEENS, AND RICHMOND COS.)
FLOODWAY DATA
ARBUTUS CREEK

61
FLOODING SOURCE FLOODWAY BASE FLOOD
WATER-SURFACE ELEVATION (FEET NAVD)
CROSS SECTION DISTANCE WIDTH (FEET)
SECTIONAREA
(SQUAREFEET)
MEANVELOCITY(FEET PERSECOND)
REGULATORY WITHOUT FLOODWAY
WITH FLOODWAY INCREASE
Blue Heron Main Branch A 9001 96 433 0.8 12.4 6.43 7.3 0.9B 13221 80 669 0.5 16.0 16.0 16.0 0.0C 15701 10 38 9.0 16.0 15.9 16.2 0.3D 2,0501 38 131 2.6 24.0 24.0 25.0 1.0E 2,5101 55 62 5.5 30.6 30.6 30.7 0.1F 3,0001 85 151 1.3 35.1 35.1 35.9 0.8G 3,5901 22 30 6.7 41.1 41.1 41.1 0.0H 3,9001 16 26 7.3 44.5 44.5 44.7 0.2I 4,5401 32 130 1.5 46.7 46.7 46.7 0.0J 5,0301 50 276 0.6 53.1 53.1 53.7 0.6K 5,6001 10 13 6.6 62.2 62.2 62.2 0.0L 6,2001 10 22 3.9 66.0 66.0 66.3 0.3M 6,5001 140 593 0.1 68.4 68.4 68.5 0.1
Blue Heron Tributary
A 4902 7 23 5.5 34.5 34.5 35.5 1.0B 6402 30 16 3.4 39.2 39.2 39.2 0.0C 1,3202 40 20 2.6 47.1 47.1 47.2 0.1D 1,5202 204 903 0.1 48.5 48.5 48.7 0.2E 2,0202 7 16 5.2 55.1 55.1 55.7 0.7F 2,2732 15 15 5.6 63.9 63.9 63.9 0.0
1Feet above confluence with Raritan Bay 2Feet above confluence with Blue Heron Main Branch 3Elevation computed without consideration of backwater effects from Raritan Bay
TAB
LE 6
FEDERAL EMERGENCY MANAGEMENT AGENCY
CITY OF NEW YORK, NY(BRONX, KINGS, NEW YORK,
QUEENS, AND RICHMOND COS.)
FLOODWAY DATA
BLUE HERON MAIN BRANCH – BLUE HERON TRIBUTARY

62
FLOODING SOURCE FLOODWAY BASE FLOOD
WATER-SURFACE ELEVATION (FEET NAVD)
CROSS SECTION DISTANCE1 WIDTH (FEET)
SECTIONAREA
(SQUAREFEET)
MEANVELOCITY(FEET PERSECOND)
REGULATORY WITHOUT FLOODWAY
WITH FLOODWAY INCREASE
Bronx RiverA 3,600 169 4,008 1.0 13.1 11.93 12.9 1.0B 6,900 160 3,166 1.3 13.1 11.93 12.9 1.0C 8,390 180 3,929 1.0 13.1 12.03 13.0 1.0D 9,300 310 4,389 0.9 13.1 12.03 13.0 1.0E 10,900 90 1,578 2.6 13.1 12.23 13.2 1.0F 12,200 138 2,353 1.7 13.1 12.43 13.4 1.0G 13,820 86 1,214 3.4 13.1 12.83 13.8 1.0H 14,970 75 763 5.4 13.3 13.3 14.3 1.0I 16,040 94 768 5.3 27.6 27.6 28.2 0.6J 18,430 203 1,890 2.2 28.8 28.8 29.2 0.4K 19,600 99 776 5.3 29.5 29.5 29.8 0.3L 21,850 89 472 8.7 40.0 40.0 40.3 0.3M 23,390 110 648 6.3 52.6 52.6 52.6 0.0N 25,000 117 776 5.3 55.2 55.2 55.3 0.1O 27,320 82 572 7.2 56.5 56.5 56.8 0.3P 28,720 63 700 5.9 60.0 60.0 60.2 0.2Q 29,960 69 798 5.1 60.9 60.9 61.7 0.8R 30,960 91 1,090 3.6 63.1 63.1 63.7 0.6S 33,150 91 856 4.5 64.0 64.0 64.7 0.7T 35,150 63 755 5.1 65.4 65.4 66.1 0.7U 36,270 63 803 4.8 66.0 66.0 66.8 0.8V 37,260 100 1,005 3.9 68.2 68.2 68.9 0.7W 38,310 86 943 4.1 68.9 68.9 69.7 0.8X 39,070 132 1,242 3.0 69.6 69.6 70.3 0.7Y 40,180 922 860 4.5 70.1 70.1 70.8 0.7Z 41,310 912 1,053 3.7 71.1 71.1 71.8 0.7
1Feet above confluence with the East River 2Width extends beyond county boundary 3Elevation computed without consideration of backwater effects from the East River
TAB
LE 6
FEDERAL EMERGENCY MANAGEMENT AGENCY
CITY OF NEW YORK, NY(BRONX, KINGS, NEW YORK,
QUEENS, AND RICHMOND COS.)
FLOODWAY DATA
BRONX RIVER

63
FLOODING SOURCE FLOODWAY BASE FLOOD
WATER-SURFACE ELEVATION (FEET NAVD)
CROSS SECTION DISTANCE WIDTH (FEET)
SECTIONAREA
(SQUAREFEET)
MEANVELOCITY(FEET PERSECOND)
REGULATORY WITHOUT FLOODWAY
WITH FLOODWAY INCREASE
Bronx River (Continued) AA 42,4401 215 1,549 2.5 72.1 72.1 72.7 0.6
Butler ManorA 1,5502 152 387 0.3 12.6 8.85 9.8 1.0B 1,8382 13 17 5.3 12.6 9.75 9.8 0.1C 2,1702 11 25 2.4 13.7 13.7 14.2 0.5D 2,4402 8 17 3.8 23.1 23.1 23.4 0.3E 2,6002 20 15 4.1 25.4 25.4 25.4 0.0F 2,9352 330 1,315 0.1 32.2 32.2 32.4 0.2
D Street Brook A 03 154 69 2.8 95.4 95.4 95.4 0.0B 3563 64 42 4.6 101.7 101.7 101.7 0.0C 6953 20 28 6.8 111.4 111.4 111.4 0.0D 9903 33 33 5.8 124.3 124.3 124.3 0.0E 1,2373 27 31 6.1 137.3 137.3 137.3 0.0F 1,5323 49 32 6.0 153.6 153.6 153.6 0.0
Denise Tributary A 4604 38 24 4.6 22.1 22.1 22.1 0.0B 6404 40 95 1.1 26.4 26.4 26.7 0.3C 8804 9 19 5.8 27.9 27.9 28.2 0.3D 1,2004 6 19 5.8 32.6 32.6 33.4 0.8E 1,5304 26 21 5.2 38.1 38.1 38.1 0.0F 2,0004 23 28 3.9 50.0 50.0 50.0 0.0
1Feet above confluence with the East River 5Elevation computed without consideration of backwater effects from Raritan Bay 2Feet above confluence with Raritan Bay 3Feet above ‘D” Street culvert 4Feet above confluence with Arbutus Creek
TAB
LE 6
FEDERAL EMERGENCY MANAGEMENT AGENCY
CITY OF NEW YORK, NY(BRONX, KINGS, NEW YORK,
QUEENS, AND RICHMOND COS.)
FLOODWAY DATA
BUTLER MANOR – D STREET BROOK – DENISE TRIBUTARY

64
FLOODING SOURCE FLOODWAY BASE FLOOD
WATER-SURFACE ELEVATION (FEET NAVD)
CROSS SECTION DISTANCE WIDTH (FEET)
SECTIONAREA
(SQUAREFEET)
MEANVELOCITY(FEET PERSECOND)
REGULATORY WITHOUT FLOODWAY
WITH FLOODWAY INCREASE
Eltingville Tributary A 1701 20 58 9.7 37.2 34.44 37.2 0.0B 3601 18 86 6.5 38.5 38.5 38.7 0.2
Forest Hill Road Brook A 4402 30 106 5.2 10.9 3.95 4.7 0.8B 1,4672 44 144 3.1 10.9 4.95 5.9 1.0C 3,0612 26 77 2.6 12.5 12.5 12.5 0.0D 3,3442 26 53 3.7 12.8 12.8 12.9 0.1E 3,7372 24 31 6.5 23.8 23.8 23.8 0.0F 4,0102 22 30 6.7 31.6 31.6 31.7 0.1G 4,2472 30 45 4.5 38.3 38.3 38.8 0.5H 4,4622 22 30 6.6 45.8 45.8 45.8 0.0I 4,6642 21 30 6.8 50.6 50.6 50.8 0.2J 5,0402 26 45 4.4 56.0 56.0 56.9 0.9K 5,2362 33 36 5.6 56.9 56.9 57.7 0.8L 5,6152 74 146 1.4 59.3 59.3 59.8 0.5M 5,9532 71 69 2.9 61.4 61.4 61.7 0.3N 6,2322 40 41 4.9 64.9 64.9 65.1 0.2O 6,6522 20 29 6.9 72.5 72.5 72.6 0.1
Jansen Tributary A 3403 40 13 3.1 23.8 23.8 23.8 0.0B 8003 48 24 1.7 28.8 28.8 28.8 0.0C 1,0803 48 13 3.0 31.3 31.3 31.3 0.0D 1,3403 44 13 3.1 39.9 39.9 39.9 0.0
1Feet above confluence with Sweet Brook 5Elevation computed without consideration of backwater effects from Richmond Creek 2Feet above confluence with Richmond Creek 3Feet above confluence with Arbutus Creek 4Elevation computed without consideration of backwater effects from Sweet Brook
TAB
LE 6
FEDERAL EMERGENCY MANAGEMENT AGENCY
CITY OF NEW YORK, NY(BRONX, KINGS, NEW YORK,
QUEENS, AND RICHMOND COS.)
FLOODWAY DATA
ELTINGVILLE TRIBUTARY – FOREST HILL ROAD BROOK – JANSEN TRIBUTARY
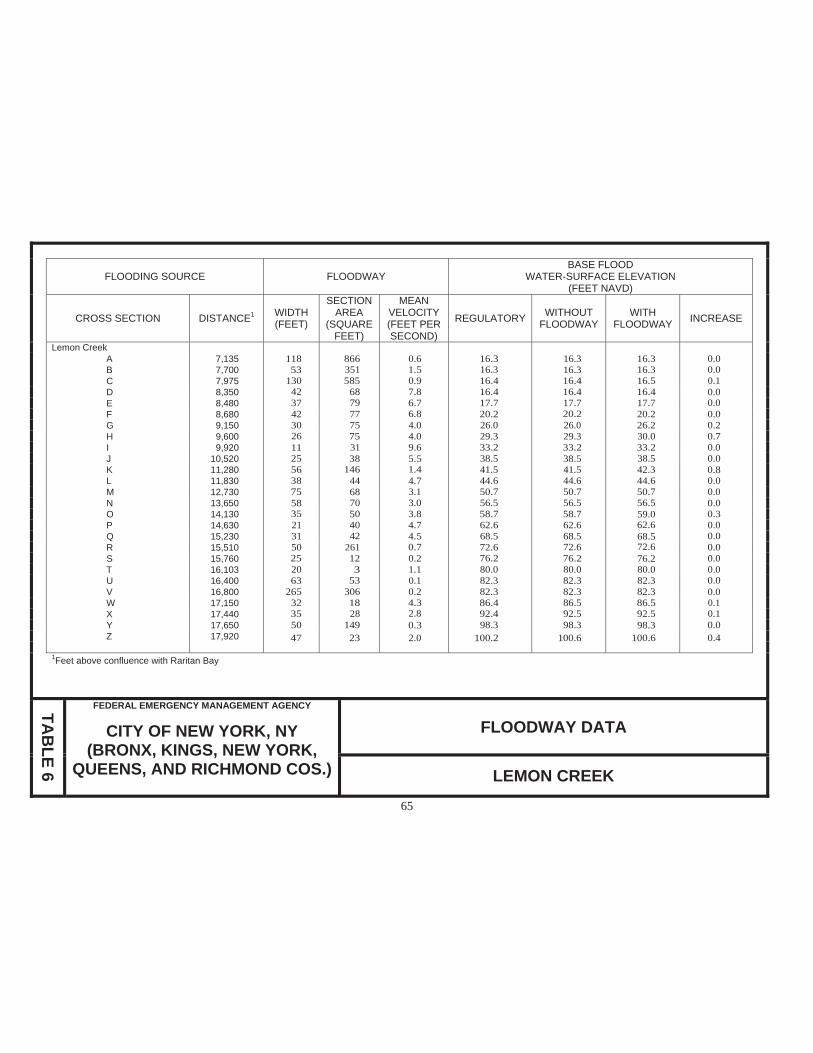
65
FLOODING SOURCE FLOODWAY BASE FLOOD
WATER-SURFACE ELEVATION (FEET NAVD)
CROSS SECTION DISTANCE1 WIDTH (FEET)
SECTIONAREA
(SQUAREFEET)
MEANVELOCITY(FEET PERSECOND)
REGULATORY WITHOUT FLOODWAY
WITH FLOODWAY INCREASE
Lemon Creek A 7,135 118 866 0.6 16.3 16.3 16.3 0.0B 7,700 53 351 1.5 16.3 16.3 16.3 0.0C 7,975 130 585 0.9 16.4 16.4 16.5 0.1D 8,350 42 68 7.8 16.4 16.4 16.4 0.0E 8,480 37 79 6.7 17.7 17.7 17.7 0.0F 8,680 42 77 6.8 20.2 20.2 20.2 0.0G 9,150 30 75 4.0 26.0 26.0 26.2 0.2H 9,600 26 75 4.0 29.3 29.3 30.0 0.7I 9,920 11 31 9.6 33.2 33.2 33.2 0.0J 10,520 25 38 5.5 38.5 38.5 38.5 0.0K 11,280 56 146 1.4 41.5 41.5 42.3 0.8L 11,830 38 44 4.7 44.6 44.6 44.6 0.0M 12,730 75 68 3.1 50.7 50.7 50.7 0.0N 13,650 58 70 3.0 56.5 56.5 56.5 0.0O 14,130 35 50 3.8 58.7 58.7 59.0 0.3P 14,630 21 40 4.7 62.6 62.6 62.6 0.0Q 15,230 31 42 4.5 68.5 68.5 68.5 0.0R 15,510 50 261 0.7 72.6 72.6 72.6 0.0S 15,760 25 12 0.2 76.2 76.2 76.2 0.0T 16,103 20 3 1.1 80.0 80.0 80.0 0.0U 16,400 63 53 0.1 82.3 82.3 82.3 0.0V 16,800 265 306 0.2 82.3 82.3 82.3 0.0W 17,150 32 18 4.3 86.4 86.5 86.5 0.1X 17,440 35 28 2.8 92.4 92.5 92.5 0.1Y 17,650 50 149 0.3 98.3 98.3 98.3 0.0Z 17,920 47 23 2.0 100.2 100.6 100.6 0.4
1Feet above confluence with Raritan Bay
TAB
LE 6
FEDERAL EMERGENCY MANAGEMENT AGENCY
CITY OF NEW YORK, NY(BRONX, KINGS, NEW YORK,
QUEENS, AND RICHMOND COS.)
FLOODWAY DATA
LEMON CREEK

66
FLOODING SOURCE FLOODWAY BASE FLOOD
WATER-SURFACE ELEVATION (FEET NAVD)
CROSS SECTION DISTANCE WIDTH (FEET)
SECTIONAREA
(SQUAREFEET)
MEANVELOCITY(FEET PERSECOND)
REGULATORY WITHOUT FLOODWAY
WITH FLOODWAY INCREASE
Mill Creek A 1,7751 200 * * * * * * B 2,7801 254 * * * * * * C 3,8151 43 100 8.6 13.7 13.7 13.9 0.2D 4,5001 107 189 4.4 21.2 21.2 21.4 0.2E 5,2401 25 111 7.5 26.2 26.2 26.4 0.2 F 5,7101 49 503 1.3 34.7 34.7 34.9 0.2G 6,3501 110 447 1.1 39.4 39.4 39.7 0.3 H 6,6401 41 126 2.1 40.2 40.2 40.5 0.3 I 6,9651 11 43 6.1 40.4 40.4 40.6 0.2J 7,5701 18 21 5.5 50.1 50.1 50.1 0.0K 8,2151 50 32 3.6 65.0 65.0 65.0 0.0L 8,8051 90 36 3.1 76.3 76.3 76.3 0.0
Mill Creek Tributary 1 A 3702 14 29 8.4 43.6 43.6 43.6 0.0B 8002 20 45 5.5 48.7 48.7 48.7 0.0C 1,2602 36 42 5.9 53.2 53.2 53.2 0.0D 1,6302 35 40 6.2 59.2 59.2 59.2 0.0
Mill Creek Tributary 2 A 4502 50 101 8.2 12.4 10.74 10.7 0.0B 1,4502 87 161 3.7 12.4 11.44 11.9 0.5
Mill Creek Tributary 3 A 3003 38 43 6.1 14.8 14.8 14.8 0.0 B 8603 40 78 3.4 21.2 21.2 21.2 0.0
1Feet above confluence with Arthur Kill **Cross sections (A and B) are Not Mapped; Superseded By New Coastal Analyses 2Feet above confluence with Mill Creek 3Feet above confluence with Mill Creek Tributary 2 4Elevation computed without consideration of backwater effects from Mill Creek
TAB
LE 6
FEDERAL EMERGENCY MANAGEMENT AGENCY
CITY OF NEW YORK, NY(BRONX, KINGS, NEW YORK,
QUEENS, AND RICHMOND COS.)
FLOODWAY DATA
MILL CREEK – MILL CREEK TRIBUTARY 1 – MILL CREEK TRIBUTARY 2 – MILL CREEK TRIBUTARY 3

67
FLOODING SOURCE FLOODWAY BASE FLOOD
WATER-SURFACE ELEVATION (FEET NAVD)
CROSS SECTION DISTANCE1 WIDTH (FEET)
SECTIONAREA
(SQUAREFEET)
MEANVELOCITY(FEET PERSECOND)
REGULATORY WITHOUT FLOODWAY
WITH FLOODWAY INCREASE
Richmond Creek A 14,999 99 348 3.4 10.9 4.72 5.7 1.0B 15,345 42 249 4.7 10.9 6.62 7.6 1.0C 15,887 121 762 1.5 11.5 11.5 12.4 0.9D 16,246 160 238 4.9 12.5 12.5 12.5 0.0E 16,600 97 538 2.2 13.5 13.5 13.5 0.0F 17,669 37 156 7.5 15.6 15.6 16.2 0.6G 18,227 231 937 1.3 18.1 18.1 19.1 1.0H 19,019 47 139 8.4 21.4 21.4 21.7 0.3I 19,526 47 242 4.8 25.4 25.4 26.4 1.0J 20,060 28 111 10.5 29.8 29.8 30.8 1.0K 20,534 41 159 7.4 36.7 36.7 37.4 0.7L 20,822 52 148 7.9 41.9 41.9 42.4 0.5M 21,212 25 102 11.5 49.6 49.6 49.8 0.2N 21,746 50 76 6.8 60.0 60.0 60.0 0.0O 22,138 12 51 10.0 75.4 75.4 75.5 0.1P 22,743 25 58 8.8 90.6 90.6 90.6 0.0Q 23,368 23 67 7.7 104.9 104.9 105.3 0.4R 23,847 41 166 3.1 115.5 115.5 115.6 0.1S 24,203 28 64 3.6 120.2 120.2 121.2 1.0T 24,931 41 47 4.9 130.2 130.2 130.2 0.0U 25,605 35 48 4.8 145.5 145.5 145.5 0.0V 26,079 5 20 11.6 164.1 164.1 164.5 0.4W 26,679 15 29 8.0 185.3 185.3 185.3 0.0X 27,319 13 28 8.4 214.6 214.6 214.6 0.0Y 28,065 12 26 8.7 244.4 244.4 244.4 0.0Z 28,664 18 69 3.4 253.3 253.3 253.4 0.1
1Feet above confluence with Fresh Kills 2Elevation computed without consideration of backwater effects from Fresh Kills
TAB
LE 6
FEDERAL EMERGENCY MANAGEMENT AGENCY
CITY OF NEW YORK, NY(BRONX, KINGS, NEW YORK,
QUEENS, AND RICHMOND COS.)
FLOODWAY DATA
RICHMOND CREEK

68
FLOODING SOURCE FLOODWAY BASE FLOOD
WATER-SURFACE ELEVATION (FEET NAVD)
CROSS SECTION DISTANCE WIDTH (FEET)
SECTIONAREA
(SQUAREFEET)
MEANVELOCITY(FEET PERSECOND)
REGULATORY WITHOUT FLOODWAY
WITH FLOODWAY INCREASE
Sandy Brook A 4801 12 24 3.5 38.1 38.1 38.1 0.0B 8501 14 15 5.4 42.2 42.2 42.2 0.0C 1,2001 12 18 4.6 47.7 47.7 47.8 0.1D 1,6001 10 13 6.5 51.2 51.2 51.2 0.0E 2,0001 63 45 1.8 56.9 56.9 57.0 0.1F 2,4001 123 52 1.6 62.3 62.3 62.4 0.1G 2,8901 14 11 5.1 68.3 68.3 68.3 0.0H 3,2201 13 15 3.9 72.5 72.5 72.5 0.0I 3,6001 10 10 5.6 80.2 80.2 80.2 0.0
Sweet Brook A 3,4202 25 96 11.1 14.0 14.0 14.0 0.0B 3,6902 34 146 7.3 17.3 17.3 17.3 0.0C 4,2752 68 131 6.9 28.1 28.1 28.2 0.1D 4,8652 58 253 3.6 29.2 29.2 29.7 0.5E 5,2802 75 586 1.7 29.6 29.6 30.5 0.9F 5,7152 129 709 1.4 29.7 29.7 30.6 0.9G 6,2502 50 292 3.5 30.5 30.5 31.1 0.6H 6,7602 95 741 1.3 37.2 37.2 37.5 0.3I 7,2202 90 523 0.8 37.3 37.3 37.5 0.2J 8,1002 72 54 4.9 45.8 45.8 45.8 0.0K 8,6002 50 47 5.6 50.8 50.8 50.9 0.1L 9,4502 50 47 5.6 55.8 55.8 55.8 0.0M 10,2592 55 43 5.1 64.0 64.0 64.0 0.0N 10,4552 48 74 4.8 65.0 65.0 65.4 0.4O 11,1252 21 69 5.1 70.1 70.1 70.7 0.6
1Feet above confluence with Lemon Creek 2Feet above confluence with Richmond Creek
TAB
LE 6
FEDERAL EMERGENCY MANAGEMENT AGENCY
CITY OF NEW YORK, NY(BRONX, KINGS, NEW YORK,
QUEENS, AND RICHMOND COS.)
FLOODWAY DATA
SANDY BROOK – SWEET BROOK

69
FLOODING SOURCE FLOODWAY BASE FLOOD
WATER-SURFACE ELEVATION (FEET NAVD)
CROSS SECTION DISTANCE WIDTH (FEET)
SECTIONAREA
(SQUAREFEET)
MEANVELOCITY(FEET PERSECOND)
REGULATORY WITHOUT FLOODWAY
WITH FLOODWAY INCREASE
Sweet Brook (continued) P 12,0201 28 63 5.6 75.2 75.2 75.4 0.2Q 12,5851 49 251 1.2 80.5 80.5 80.8 0.3R 12,8701 24 106 2.9 80.7 80.7 81.1 0.4S 13,3891 55 368 0.2 81.0 81.0 81.8 0.8T 13,7751 68 261 0.2 81.0 81.0 81.8 0.8U 14,3951 94 498 0.1 81.0 81.0 81.8 0.8V 14,7951 142 256 1.2 81.1 81.1 81.9 0.8W 15,0551 42 83 3.6 82.2 82.2 83.1 0.9X 15,3401 10 47 5.9 83.4 83.4 83.9 0.5Y 15,9451 108 306 0.9 85.9 85.9 86.5 0.6Z 16,2201 17 52 4.9 87.1 87.1 87.6 0.5
Wolfe’s Pond A 1,2202 120 * * * * * *B 1,9402 610 * * * * * *C 2,6102 304 1,634 0.3 12.4 8.23 8.9 0.7D 3,9502 20 47 8.7 12.4 8.93 8.9 0.0E 4,4002 23 53 7.7 15.7 15.7 15.8 0.1F 4,5802 40 153 2.7 17.4 17.4 17.6 0.2G 4,9302 43 248 1.4 20.3 20.3 21.3 1.0
1Feet above confluence with Richmond Creek 2Feet above confluence with Raritan Bay 3Elevation computed without consideration of backwater effects from Raritan Bay *Cross Sections (A-B) are Not Mapped; Superseded By New Coastal Analyses
TAB
LE 6
FEDERAL EMERGENCY MANAGEMENT AGENCY
CITY OF NEW YORK, NY(BRONX, KINGS, NEW YORK,
QUEENS, AND RICHMOND COS.)
FLOODWAY DATA
SWEET BROOK – WOLFE’S POND

70
Near the mouths of streams studied in detail, floodway computations are made without regard to flood elevations on the receiving water body. Therefore, "Without Floodway" elevations presented in Table 6 for certain downstream cross sections of Arbutus Creek, Blue Heron Main Branch, Butler Manor, Mill Creek, Mill Creek Tributary 2, and Wolfe’s Pond are lower than the regulatory flood elevations in that area, which must take into account the 1-percent-annual-chance flooding due to backwater from other sources.
The area between the floodway and 1-percent-annual-chance floodplain boundaries is termed the floodway fringe. The floodway fringe encompasses the portion of the floodplain that could be completely obstructed without increasing the water-surface elevation of the 1-percent-annual-chance flood by more than 1.0 foot at any point. Typical relationships between the floodway and the floodway fringe and their significance to floodplain development are shown in Figure 3, "Floodway Schematic."
Figure 3: Floodway Schematic

71
5.0 INSURANCE APPLICATIONS
For flood insurance rating purposes, flood insurance zone designations are assigned to a community based on the results of the engineering analyses. The zones are as follows:
Zone A
Zone A is the flood insurance rate zone that corresponds to the 1-percent-annual-chance floodplains that are determined in the FIS by approximate methods. Because detailed hydraulic analyses are not performed for such areas, no base flood elevations or depths are shown within this zone.
Zone AE
Zone AE is the flood insurance rate zone that corresponds to the 1-percent-annual-chance floodplains that are determined in the FIS by detailed methods. In most instances, whole-foot base flood elevations derived from the detailed hydraulic analyses are shown at selected intervals within this zone.
Zone AH
Zone AH is the flood insurance rate zone that corresponds to the areas of 1-percent-annual-chance shallow flooding (usually areas of ponding) where average depths are between 1 and 3 feet. Whole-foot base flood elevations derived from the detailed hydraulic analyses are shown at selected intervals within this zone.
Zone AO
Zone AO is the flood insurance rate zone that corresponds to the areas of 1-percent-annual-chance shallow flooding (usually sheet flow on sloping terrain) where average depths are between 1 and 3 feet. Average whole-foot depths derived from the detailed hydraulic analyses are shown within this zone.
Zone A99
Zone A99 is the flood insurance rate zone that corresponds to areas of the 1-percent-annual-chance floodplain that will be protected by a Federal flood protection system where construction has reached specified statutory milestones. No base flood elevations or depths are shown within this zone.
Zone V
Zone V is the flood insurance rate zone that corresponds to the 1-percent-annual-chance coastal floodplains that have additional hazards associated with storm waves. Because approximate hydraulic analyses are performed for such areas, no base flood elevations are shown within this zone.

72
Zone VE
Zone VE is the flood insurance rate zone that corresponds to the 1-percent-annual-chance coastal floodplains that have additional hazards associated with storm waves. Whole-foot base flood elevations derived from the detailed hydraulic analyses are shown at selected intervals within this zone.
Zone X
Zone X is the flood insurance rate zone that corresponds to areas outside the 0.2-percent-annual-chance floodplain, areas within the 0.2-percent-annual-chance floodplain, and areas of 1-percent-annual-chance flooding where average depths are less than 1 foot, areas of 1-percent-annual-chance flooding where the contributing drainage area is less than 1 square mile, and areas protected from the 1-percent-annual-chance flood by levees. No base flood elevations or depths are shown within this zone.
Zone D
Zone D is the flood insurance rate zone that corresponds to unstudied areas where flood hazards are undetermined, but possible.
6.0 FLOOD INSURANCE RATE MAP
The FIRM is designed for flood insurance and floodplain management applications.
For flood insurance applications, the map designates flood insurance rate zones as described in Section 5.0 and, in the 1-percent-annual-chance floodplains that were studied by detailed methods, shows selected whole-foot base flood elevations or average depths. Insurance agents use the zones and base flood elevations in conjunction with information on structures and their contents to assign premium rates for flood insurance policies.
For floodplain management applications, the map shows by tints, screens, and symbols, the 1- and 0.2-percent-annual-chance floodplains. On selected FIRM panels, floodways and the locations of selected cross sections used in the hydraulic analyses and floodway computations are shown where applicable.
7.0 OTHER STUDIES
Due to its political and economic importance, and history of flood-related problems, the City of New York and surrounding areas have undergone numerous other hydrologic studies. A summary of these studies is provided in Study Overview (Camp, Dresser and McKee, 1983).
Because it is based on more up-to-date topographic information, this FIS supersedes the previously printed FIS for the City of New York (FEMA, 2007).

73
8.0 LOCATION OF DATA
Information concerning the pertinent data used in preparation of this study can be obtained by contacting FEMA, Mitigation Division, 26 Federal Plaza, Room 1337, New York, New York 10278.
9.0 BIBLIOGRAPHY AND REFERENCES
Aerial Data Reduction Associates, Inc. (July 1989). New Jersey, Topographic Maps,Scale 1:960, Contour Interval 2 Feet. Borough of Staten Island, New York.
American Society of Civil Engineers. (November 1964). Journal of Hydraulic Division, Hydraulic Studies of Jamaica Bay. Armando Balloffet and A. Kupterman (authors).
Benjamin, J. R., and C. A. Cornell. (1970). Probability, Statistics, and Decision for Engineers. New York: McGraw-Hill.
Booij, N., R.C. Ris and L.H. Holthuijsen. (1999). A third-generation wave model for coastal regions, Part I, Model description and validation. J.Geoph.Research C4, 104, 7649-7666.
Camp, Dresser and McKee, prepared for State of New York, Department of Environmental Conservation. (January 1983). Study Overview, Report No. 2. Annandale, Virginia.
Camp, Dresser and McKee, prepared for State of New York, Department of Environmental Conservation. (January 1982). Statistical Methodology - Statistical Analysis of Hurricanes, Report No. 3. Annandale, Virginia.
Camp, Dresser and McKee, prepared for State of New York, Department of Environmental Conservation. (April 1981). Analysis of Fluvial Flooding, Report No. 4. Annandale, Virginia.
Camp, Dresser and McKee, prepared for State of New York, Department of Environmental Conservation. (December 1981). Simulation Methodology for Northeasters, Report No. 6. Annandale, Virginia.
Camp, Dresser and McKee, prepared for State of New York, Department of Environmental Conservation. (November 1981). Total Stillwater Elevations -Implementation and Results, Report No. 7. Annandale, Virginia.
Camp, Dresser and McKee, prepared for State of New York, Department of Environmental Conservation. (November 1981). Wave Crest Analysis, Report No. 8. Annandale, Virginia.

74
Camp, Dresser and McKee, prepared for State of New York, Department of Environmental Conservation. (November 1980). Simulation of Hurricanes, Report No. 5. Annandale, Virginia.
Camp, Dresser and McKee, prepared for State of New York, Department of Environmental Conservation. (November 1979). Review of Existing Conditions and Preliminary Assessment, Report No. 1. Annandale, Virginia.
Camp, Dresser and McKee, Inc. (1977). Background Data for the City of Yonkers Flood Insurance Study. (Unpublished). Annandale, Virginia.
Camp, Dresser and McKee, Inc. (December 1977). Dynamic Estuary Model (DEM),prepared for Berkeley, Charleston and Dorchester Counties, South Carolina. Annandale, Virginia.
Chow, Ven Te. (1964). Handbook of Applied Hydrology. New York: McGraw-Hill.
Chow, Ven Te. (1959). Open-Channel Hydraulics. New York: McGraw-Hill.
City of New York, Department of Information Technology and Telecommunications (NYC DOITT) (2004). Topographic maps, Boroughs of the Bronx, Brooklyn, Manhattan, Queens and Staten Island, New York. Scale 1:1,200, Contour Interval 2 feet. New York, New York.
December, 1992 nor’easter Wikimedia Foundation, Inc. (Last update 12/24/2012).
Federal Emergency Management Agency Region II Coastal Storm Surge Study Reports, 2010.
Federal Emergency Management Agency, 2007. Atlantic Ocean and Gulf of Mexico Coastal Guidelines Update, Appendix D of Guidelines and Specifications for Flood Hazard Mapping Partners. Washington, DC.
Federal Emergency Management Agency. (September 5, 2007). Flood Insurance Study, City of New York, Bronx, Queens, New York, Kings, and Richmond Counties, New York, Washington, D.C.
Federal Emergency Management Agency, 2007. Supplementary WHAFIS Documentation, WHAFIS 4.0. Atlanta, GA.
Federal Emergency Management Agency. (January 21, 1998). Flood Insurance Study, City of Yonkers, Westchester County, New York. Washington, D.C.
Federal Emergency Management Agency. (July 5, 1994). Flood Insurance Study, City of New York, Bronx, Queens, New York, Kings, and Richmond Counties, New York,Washington, D.C.

75
Federal Emergency Management Agency. (November 1, 1984). Flood Insurance Study, Town of Rye, Westchester County, New York. Washington, D.C.
Federal Emergency Management Agency. (February 1981). Users Manual for Wave Height Analysis. Washington, D.C.
Federal Emergency Management Agency. (January 1981). Computer Program for Determining Wave Height Elevations for Flood Insurance Studies. Washington, D.C.
Federal Emergency Management Agency. (September 1988). Wave Height Analysis forFlood Insurance Studies (Technical Documetnation for WHAFIS Program Version 3.0).Washington, D.C.
Hammersley, J. M., and D. C. Handscomb. (1967). Monte Carlo Methods. London, England: Methuen and Co., Ltd.
Harris-Toups Associates of Lake Success. (1979). Methodology for Long Island Flood Insurance Studies. New York. (Unpublished).
Hurricane Irene 1 Year Later, New York Daily News, 8/27/12, New York, New York.
Hurricane Sandy, Wikimedia Foundation, Inc. (Last update 7/24/2013)
Keystone Aerial Surveys, Inc., of Philadelphia, Pennsylvania. (City of New York, flown in April 1978 and April 1979). Aerial Photographs, Scale 1:12,000.
Lawler, Matusky & Skelly Engineers of Pearl River, New York. (June 1979). Personnel Communication. (Unpublished).
Leendertste, J. J. (1970-1973). A Water Quality Simulation Model for Well-Mixed Estuaries and Coastal Seas, Volumes I-VI. New York, New York: Rand Corporation.
Leonard Jackson and Associates of Pomona, New York. (November 2005). National Academy of Sciences. (1977). Methodology for Calculating Wave Action Effects Associated with Storm Surges. Washington, D.C.
Luettich, R.A., J.J. Westerink, and N.W. Scheffner. (1992). “ADCIRC: An Advanced Three-dimensional Circulation Model for Shelves, Coasts and Estuaries, Report 1: Theory and Methodology of ADCIRC-2DDI and ADCIRC-3DL.” Tech. Rep. DRP-92-6,U.S. Army Corps of Engineers. Available at: ERDC Vicksburg (WES), U.S. Army Engineer Waterways Experiment Station (WES), ATTN: ERDC-ITL-K, 3909 Halls Ferry Road, Vicksburg, Mississippi, 39180-6199.
National Oceanic and Atmospheric Administration (January 24, 2013). NOAA NOS Water Level & Meteorological Data Report.

76
National Academy of Sciences. (1977). Methodology for Calculating Wave Action Effects Associated with Storm Surges. Washington D.C.
New York City. (June 2013). Coastal Protection (Chapter 3), New York City “A Stonger, More Resilient, New York” Comprehensive Plan. New York, New York.
New York City, Department of Environmental Protection. (1999). Topographic Maps.Scale 1:400, Contour Interval 2 Feet. New York.
New York State, Department of Environmental Conservation. (1979). Topographic Maps, Boroughs of the Bronx, Brooklyn, Queens, and Staten Island, New York. Scale 1:4,800, Contour Interval 2 Feet. Albany, New York.
New York Sea Grant Institute. (1976). MESA New York Bight Atlas, Monograph 6, Storm Surge. N. A. Pore and C. S. Barrientos (authors). Albany, New York.
New York Times. (September 7, 1979). New York, New York.
New York Times. (November 10, 1977). New York, New York.
New York Times. (November 9, 1977). New York, New York.
New York Times. (August 10, 1976). New York, New York.
New York Times. (August 25, 1975). New York, New York.
New York Times. (September 27, 1975). New York, New York.
New York Times. (October 30, 1973). New York, New York.
New York Times. (October 31, 1973). New York, New York.
New York Times. (November 9, 1972). New York, New York.
New York Times. (June 21, 1972). New York, New York.
New York Times. (August 28, 1971). New York, New York.
Phillips & Associates of Liverpool, New York. (July 1980). Topographic Sectional Maps. Scale 1:960, Contour Interval 2 Feet. Borough of Manhattan, New York.
R. A. Murdoff. (1959). The Climate of New York State. Cornell Miscellaneous Bulletin 33. Ithaca, New York.
Ris, R.C., N. Booij and L.H. Holthuijsen. (1999). A third-generation wave model for coastal regions, Part II, Verification. J.Geoph.Research C4, 104, 7667-7681.

77
Sanborn Map Company. (2010). New York City LiDAR. Data collected from April 14, 2010 to May 1, 2010.
State of New Jersey, Department of Environmental Protection, Division of Water Resources, in cooperation with the U.S. Geological Survey. (1974). Magnitude and Frequency of Floods in New Jersey with Effects of Urbanization. Special Report 38. Stephen J. Stankowski (author). Trenton, New Jersey.
State of New York. Freshwater Wetlands Map. Scale 1:28,800.
Southold Town Planning Board. (March 1975). Flood Plain Study for Southold Town, New York. Southold, New York.
State of New York, Economic Development Board. (1973). Land Use and Natural Resources Inventory of New York State. Albany, New York.
Stone & Webster Engineering Corp. of Boston, Massachusetts, prepared for the Federal Insurance Administration. (1978). Development and Verification of Synthetic Northeaster Model for Coastal Flood Analysis. Boston, Massachusetts.
Tetra Tech Inc. of Pasadena, California, prepared for Department of Housing and Urban Development. (May 1977). Coastal Flooding Handbook, Part 1 - Methodology and Part 11 - Code and Users Guide. Washington, D.C.
Texas A&M Research Foundation. (January 1959). The Prediction of Hurricane Storm-Tides in New York Bay. Technical Report No. 165-2. B. W. Wilson (author). College Station, Texas.
Thompson, J. H. (1966). Geography of New York State. Syracuse, New York: Syracuse University Press.
Tropical Cyclone Report Hurricane Irene (AL092011), 21-28 August, 2011, National Hurricane Center, 12/14/2011 (updated 4/11/2002)
U.S. Army Corps of Engineers, Hydrologic Engineering Center. HEC-RAS 3.1.3,Davis, California.
U.S. Army Corps of Engineers, Hydrologic Engineering Center. (September 1990). HEC-2 Water-Surface Profiles, Users Manual. Davis, California.
U.S. Army Corps of Engineers, North Atlantic Division. (1977). Water Resources Development in New York City. New York.
U.S. Army Corps of Engineers, Galveston District. (June 1975). Guidelines for Identifying Coastal High Hazard Zones. Galveston, Texas.

78
U.S. Army Corps of Engineers, Hydrologic Engineering Center. (October 1973). HEC-2 Water Surface Profiles, Generalized Computer Program. Davis, California.
U.S. Army Corps of Engineers, New England Division. (1979). Stage-Frequency Analysis Using Pearson Type III with Expected Probability. Waltham, Massachusetts.
U.S. Army Corps of Engineers, New England Division. (1979). Tidal Gages and Records at Willets Point, Stamford, Bridgeport, New London, Stonington, Providence, and Newport. Waltham, Massachusetts. (Unpublished).
U.S. Army Corps of Engineers, New York District. (1979). Weibull Plotting Positions Analysis for the Battery, Sandy Hook and East Newark. Albany, New York.
U.S. Army Corps of Engineers, New York District. (June 1972). Tidal Flood Plain Information: North Shore of Nassau County Long Island, New York. New York.
U.S. Army Corps of Engineers, North Atlantic Division. (2013). New York. http://www.nan.usace.army.mil/Missions/CivilWorks/ProjectsinNewYork.aspx
U.S. Army Corps of Engineers, North Atlantic Division. (August 1963). Report on Operation Five High, March 1962 Storm. New York, New York.
U.S. Department of Commerce, Environmental Science Services Administration. (April 1970). Joint Probability Method of Tide Frequency Analysis Applied to Atlantic City and Long Beach Island, New Jersey. Technical Memorandum WBTM, Hydro 11. V.A. Myers (author). Washington, D.C.
U.S. Department of Commerce, National Oceanic and Atmospheric Administration. (May 1975). Some Climatological Characteristics of Hurricanes and Tropical Storms.Technical Report NWS-15. Francis P. Ho, R. W. Schwerdt and H. V. Goodyear (authors). Asheville, North Carolina.
U.S. Department of Commerce, National Oceanic and Atmospheric Administration, National Ocean Survey. (June 1974). Tidal Bench Marks in New York. Asheville, North Carolina.
U.S. Department of Commerce, National Oceanic and Atmospheric Administration, National Ocean Survey, prepared for National Weather Service. (1973). Storm Evacuation Map, T-15026 New York City, New York. Asheville, North Carolina.
U.S. Department of Commerce, National Oceanic and Atmospheric Administration. (1973). Tropical Cyclone Data 993. Asheville, North Carolina.
U.S. Department of Commerce, National Bureau of Standards. (1959). Applied Math. Statistical Theory of Extreme Values and Some Practical Application. Series No. 33. E.J. Gumbel (author). Washington, D.C.

79
U.S. Department of Commerce, National Weather Service, Systems Development Office. (October 1980). Significant Northeaster Storm Surge Marigram 1956-1959. Arthur N. Pore (author). Silver Spring, Maryland.
U.S. Department of Commerce, National Weather Service. (September 1960). SurfaceWinds Near the Center of Hurricanes. National Hurricane Research Project, Report No. 39. H. E. Graham and G. N. Hudson (authors). Washington, D.C.
U.S. Department of Commerce, National Weather Service. (1959). Isovel Patterns for Hurricane Carol (1954). Memorandum HUR7-54. Washington, D.C.
U.S. Department of Commerce, National Weather Service. (March 1957). Survey of Meteorological Factors. National Hurricane Research Project, Report No. 5. Washington, D.C.
U.S. Department of Commerce, National Weather Service. (July 1956). Monthly Weather Reviews. Winds and Pressures Over the Sea in the Hurricane of September 1938. V. A. Myers and E. S. Jordan (authors). Boston, Massachusetts.
U.S. Department of Commerce, National Weather Service. (1956). Index of Tide Gage and Tide Gage Records for the Atlantic and Gulf Coasts of the United States. National Hurricane Research Project, Report No. 7. Washington, D.C.
U.S. Department of Commerce, U.S. Census Bureau. (1981). 1980 Census of Population, Number of Inhabitants, New York. Washington, D.C.: U.S. Government Printing Office.
U.S. Department of Commerce, U.S. Census Bureau (2000). http://quickfacts.census.gov
U.S. Department of Commerce, U.S. Census Bureau (2010). http://quickfacts.census.gov
U.S. Department of Commerce, Weather Bureau. (1965). Tropical Cyclones of the North Atlantic Ocean. Technical Paper No. 55. G. W. Cry (author). Washington, D.C.
U.S. Department of Commerce, Weather Bureau. (March 1962). Great Atlantic Coast Storm, 1962, Climatological Data, National Summary. Washington, D.C.
U.S. Department of Housing and Urban Development, Federal Insurance Administration. (November 15, 1979). Flood Insurance Study, City of Eastchester, Westchester County, New York. Washington, D.C.
U.S. Department of Housing and Urban Development, Federal Insurance Administration. (September 29, 1978). Flood Insurance Study, Village of Ardsley, Westchester County, New York. Washington, D.C.

80
U.S. Department of Housing and Urban Development, Federal Insurance Administration. (April 17, 1978 [Flood Insurance Study report]; October 17, 1978 [Flood Insurance Rate Map]). Flood Insurance Study, City of Mount Vernon, Westchester County, New York.Washington, D.C.
U.S. Department of the Interior, Geological Survey. (1979). Water Resources Data at Gage No. 01376500 on the Bronx River at Bronxville: Flood Records and High Water Marks for Floods of June 1972 and September 1975, WATSTORE. Reston, Virginia.
U.S. Department of the Interior, Geological Survey. (1967). Water-Supply Paper 1849,Roughness Characteristics of Natural Channels. Harry H. Barnes, Jr. (author). Washington, D.C.
U.S. Department of the Interior, Geological Survey. (Yonkers, New York, 1979; Lawrence, New York, 1977; Arthur Kill, New York, New Jersey, 1975; The Narrows, New York, New Jersey, 1975; Sea Cliff, New York, 1968; Elizabeth, New York, New Jersey, 1967; Flushing, New York, 1966; Jamaica, New York, 1957; Central Park, New York, New Jersey, 1956; Mount Vernon, New York, 1956; Brooklyn, New York, 1956; Jersey City, New York, New Jersey, 1955; Weekawken, New York, New Jersey, 1955; Coney Island, New York, New Jersey, 1955; Far Rockaway, New York, 1954; Lynbrook, New York, 1954). 7.5-Minute Series Topographic Maps. Scale 1:24,000, Contour Interval 10 Feet.
USGS. http://waterdata.usgs.gov/usa/nwis/uv?01302020. September 24, 2013.
USGS Open File Report: Monitoring Storm Tide and Flooding from Hurricane Sandy Along the Atlantic Coast of the United States, October 2012.
Van Dorn, W. C. (1953). Journal of Marine Research. Wind Stress on an Artificial Pond. Volume 12. New Haven, Connecticut.
Water Resources Council. (June 1977). Guidelines for Determining Flood Flow Frequency. Bulletin 17A. Washington, D.C.