CITY OF MURFREESBORO, TENNESSEE COMPREHENSIVE ANNUAL …
198
Transcript of CITY OF MURFREESBORO, TENNESSEE COMPREHENSIVE ANNUAL …

CITY OF MURFREESBORO, TENNESSEE
COMPREHENSIVE ANNUAL FINANCIAL REPORT
FOR THE YEAR ENDED JUNE 30, 2011
MELISSA B. WRIGHT CITY RECORDER/CITY TREASURER/FINANCE DIRECTOR

C O N T E N T S
INTRODUCTORY SECTION – Letter of Transmittal .................................................................................................................... i - v City Officials ............................................................................................................................... vi Organizational Chart.................................................................................................................... vii Certificate of Achievement.......................................................................................................... viii FINANCIAL SECTION – Independent Auditor's Report .................................................................................................... Page 1 - 2 Management’s Discussion and Analysis.................................................................................... 3 - 22 Basic Financial Statements- Government-wide Financial Statements- Statement of Net Assets .................................................................................................... 23 Statement of Activities...................................................................................................... 24 Fund Financial Statements – Balance Sheet – Governmental Funds .............................................................................. 25 Reconciliation of Total Governmental Fund Balances to Net Assets of Governmental Activities ............................................................................................ 26 Statement of Revenues, Expenditures, and Changes in Fund Balances - Governmental Funds.................................................................................................. 27 Reconciliation of the Statement of Revenues, Expenditures, and Changes in Fund Balances of Governmental Funds to the Statement of Activities...................... 28 Statement of Revenues, Expenditures and Changes in Fund Balance – Budget and Actual – General Fund............................................................................ 29 - 37 Statement of Revenues, Expenditures and Changes in Fund Balance – Budget and Actual – General Purpose School Fund ................................................. 38 Balance Sheet – Proprietary Funds ................................................................................... 39 Statement of Revenues, Expenses, and Changes in Net Assets – Proprietary Funds ......................................................................................................................... 40 Statement of Cash Flows – Proprietary Funds .................................................................. 41 - 42 Statement of Net Assets – Fiduciary Funds ...................................................................... 43 Statement of Changes in Net Assets – Fiduciary Funds .................................................. 44 Notes to Financial Statements ............................................................................................... 45 - 84 Required Supplementary Information – Schedule of Funding Progress – Pension Trust Funds ...................................................... 85 Schedule of Employer Contributions – Pension Trust Funds ........................................... 86 Schedule of Funding Progress – Post-Employment Benefits ........................................... 87 Supplemental Section - Combining Statements and Individual Fund Schedules – Combining Balance Sheet – Nonmajor Governmental Funds........................................... 88 Combining Statement of Revenues, Expenditures, and Changes in Fund Balances – Nonmajor Governmental Funds .............................................................. 89

C O N T E N T S
Combining Statements and Individual Fund Schedules (continued) – Combining Balance Sheet – Nonmajor Special Revenue Funds ...................................... 90 Combining Statement of Revenues, Expenditures, and Changes in Fund Balances – Nonmajor Special Revenue Funds........................................................... 91 Schedule of Revenues, Expenditures, and Changes in Fund Balance - Budget and Actual – State Street Aid Fund.......................................................................................... 92 Airport Fund ....................................................................................................... 93 Drug Enforcement Fund ..................................................................................... 94 Community Development Fund.......................................................................... 95 Extended School Program Fund ......................................................................... 96 School Cafeteria Fund ........................................................................................ 97 School Federal and State Program Funds ........................................................... 98 Combining Balance Sheet – Nonmajor Capital Project Funds.......................................... 99 Combining Statement of Revenues, Expenditures, and Changes in Fund Balances – Nonmajor Capital Project Funds ............................................................. 100 Schedule of Revenues, Expenditures, and Changes in Fund Balance – Budget and Actual – Capital Improvement and Contingency Fund ..................................................... 101 Gateway Project Fund ........................................................................................ 102 1998 TML Fund ................................................................................................. 103 1999 TML Fund ................................................................................................. 104 2001 TML Fund ................................................................................................. 105 2004 TML Fund ................................................................................................. 106 2008 TML Fund ................................................................................................. 107 2010 TML Fund ................................................................................................. 108 Debt Service Fund .............................................................................................. 109 School Debt Service Fund .................................................................................. 110 Combining Balance Sheet – Nonmajor Enterprise Funds ................................................. 111 Combining Statement of Revenues, Expenses, and Changes in Net Assets – Nonmajor Enterprise Funds ....................................................................................... 112 Combining Statement of Cash Flows – Nonmajor Enterprise Funds................................ 113 Combining Balance Sheet – Internal Service Funds ......................................................... 114 Combining Statement of Revenues, Expenses, and Changes in Net Assets – Internal Service Funds ............................................................................................... 115 Combining Statement of Cash Flows – Internal Service Funds ........................................ 116 Combining Statement of Fiduciary Net Assets – Pension Trust Funds............................. 117 Combining Statement of Changes in Fiduciary Net Assets – Pension Trust Funds ................................................................................................................ 118 Statement of Changes in Assets and Liabilities – School Activity Agency Fund............. 119
Financial Schedules -
Schedule of Certificates of Deposit by Fund .................................................................... 120 Schedule of Investments by Fund ..................................................................................... 121 - 129 Schedule of Debt Service Requirements by Fiscal Year................................................... 130 - 134 Solid Waste – Supplemental Schedule of Activities and Balances ................................... 135 Senior Citizens – Supplemental Schedule of Activities .................................................... 136

C O N T E N T S
STATISTICAL SECTION - Net Assets by Component ........................................................................................................... 137 Changes in Net Assets ................................................................................................................. 138 - 140 Governmental Activities Tax Revenue by Source....................................................................... 141 Fund Balances of Governmental Funds....................................................................................... 142 Changes in Fund Balances of Governmental Funds .................................................................... 143 - 144 General Governmental Tax Revenues by Source ........................................................................ 144 Assessed Value and Estimated Actual Value of Taxable Property.............................................. 145 Property Tax Rates and Levies - Direct and Overlapping Governments ..................................... 146 Principal Taxpayers ..................................................................................................................... 147 Property Tax Levies and Collections........................................................................................... 148 Ratios of Outstanding Debt by Type ........................................................................................... 149 Ratios of General Bonded Debt Outstanding............................................................................... 150 Direct and Overlapping Governmental Activities Debt............................................................... 151 Legal Debt Margin Information................................................................................................... 152 Revenue Bond Coverage ............................................................................................................. 153 Demographic and Economic Statistics ........................................................................................ 154 Principal Employers .................................................................................................................... 155 Full-time Equivalent City Government Employees by Function ................................................. 156 Operating Indicators by Function ................................................................................................ 157 Capital Asset Statistics by Function ............................................................................................ 158 Schedule of Customers and Rate Structure.................................................................................. 159 - 161 Schedule of Unaccounted for Water............................................................................................ 162 SINGLE AUDIT SECTION - Schedule of Expenditures of Federal Awards.............................................................................. 163 - 165 Schedule of Expenditures of State Awards.................................................................................. 166 Independent Auditor's Reports on Compliance and on Internal Control ..................................... 167 - 170 Schedule of Findings and Questioned Costs................................................................................ 171 - 172 Summary Schedule of Prior Audit Findings ................................................................................ 173 - 174

- i -
200YEARS 181l-20n
ft' .~ . ~ I PJ.'. A.... ~' rv' I I " - - I , ."j
MURFREESBORO ' TEN N E SSE E
crt'OIing a ht-tlf!/' quality of life
January 20. 2012
To the Honorable Mayor, Members orCity Council and Citizens ofMurfrecsboro City of Murfreesboro Murfreesboro, Tennessee
The Comprehensive Annual Financial Report of the City of Murfreesboro, Tennessee for the fiscal year June 30, 2011, is hereby submitted as required by state statutes. These statutes require that all general-purpose local governments publish a complete sct of financial statements presented in conformity with accounting principles generally accepted in the United States of America (GAAP) and audited in accordance with auditing standards generally accepted in the United Slates of America by a firm of licensed certified public accountants. Pursuant to thai requirement, we hereby issue the Comprehensive Annua l Financial Report of the City of Murfreesboro for the fiscal year ended June 30, 2011.
Management assumes full responsibility for the completeness and reliability of the information contained in this report, based upon a comprehensive framework of internal control that it has established for this purpose. Because the cost of internal control should not exceed anticipated benefit s, the objective is to provide reasonable, rather than absolute, assurance that the financial statements are free of any material misstatements.
Jobe, Hastings & Associates, Certified Public Accountants, have issued an unqualified ("clean") opinion on the City of Murfreesboro's financial statements for the year ended June 30, 2011. The independent auditor's report is located at the front of the financial section of this report.
Management's discussion and analysis (MD&A) immediately follows the independent auditor 's report and provides a narrative introduction, overview, and analysis of the basic financial statements. The MD&A complements this letter of transmittal and should be read in conjunction with it.
PROFILE OF THE GOVERNMENT
The City operates under a Council-Manager form of government. The governing body is the City Council, which consists of a Mayor and six members who serve four-year terms of office. Non-partisan elections for City Council are held in even numbered years on a staggered basis. City Council members are elected at large. The City Council is responsible for adopting ordinances, the annual budget, appointing committees and establishing policies. The City Council appoints a City Manager, who is responsible for carrying out the policies and ordinances of the City Council and the day-to-day operations. The City Manager appoints and supervises the various department heads of the City.
LOCAL ECONOMY
The City's strong and diverse economy has continued to propel population growth in the City and in surrounding Rutherford County. New 2010 Census figures were released in March 2011 showing that Murfreesboro has grown in population to 108,755 residents. This makes Murfreesboro the sixth largcst city in Tennessee. The 42 percent increase in population over the decade also made Murfreesboro the second fastest growing city in Tennessee for the period.
Administration Department 111 West Vine Street· P. O. Box 1139 • Murfreesboro, Tennessee 37133-1139 Phone 615 849 2629 - Fax 615 849 2679
TOO 615 849 2689 wv..w.murfreesboroln.gov
- ii -
Murfreesboro and Middle Tennessee have not been immune to the national economic slowdown. However, the June 30, 2011 unemployment rate of 9.1 percent is lower by 0.2 percent from the June 2010 data. The 9.1 percent unemployment rate is lower than comparable national and state figures. Murfreesboro depends on the Local Option Sales Tax to provide approximately 28 percent of the FY 2012 budget’s income. After peaking in FY 2008 at $30.4 million, the national economy accounted for a drop of 6.5 percent in local sales tax collections to $27.9 million in FY 2010. After discounting for a situs related correction, local sales taxes improved in FY 2011 by approximately $1.6 million or 5.8 percent from the previous year. For the first five months of FY 2012, local sales tax receipts are up over 7.2 percent. LONG TERM FINANCIAL PLANNING The City’s new defined contribution pension plan opened to employees hired after July 1, 2010. The new plan has both mandatory and voluntary contributions from employees that are matched by the City. The now-closed defined benefit plan required the City to accept all risk of investment performance, salary growth and improvements in the longevity of retirees. The defined contribution plan shares a portion of those risks with the City’s employees and offers portability for employees that leave the City’s service prior to full retirement age. For the City, the new plan offers surety in the budget process for future City retirement contributions. As of June 30, 2011, thirty-nine employees were covered by the defined contribution pension plan. The City also moved to better control costs of employee benefits. The Sherrill Morgan firm of Cincinnati, Ohio was selected as benefits consultant to advise the City on its health, life and disability insurance coverages. Sherrill Morgan has proposed a three year strategic review of the complete employee benefit offerings, beginning with competitive pricing of existing products. During FY 2011, fifty two proposals were received by the City for the variety of employee benefit types currently offered to employees. This competitive process is anticipated to reduce the fixed costs of administration and the benefit packages by over $400,000 annually. Years two and three of the study will focus on reshaping the health insurance plan to more closely match trends observed in the marketplace and with local businesses. City Council adopted a comprehensive set of financial policies during FY 2011. The financial policies set forth guidelines against which current budgetary performance can be measured and proposals for future programs can be evaluated. These publicly adopted financial policies are also intended to demonstrate to residents, the credit rating industry, municipal bond investors, auditors and the State Comptroller that the City is committed to sound financial management and fiscal integrity. The financial policies also improve the City’s fiscal stability by helping City officials plan fiscal strategy with a consistent approach. Adherence to adopted financial policies promotes sound financial management, which can improve City bond ratings, lower the cost of capital, manage interest rate risk exposure, and preserve financial flexibility. The FY 2011 operating budget continued the City’s effort to reduce the expenses of providing needed services in order to match lowered operating revenue caused by the economy. In early FY 2011, eleven full time positions were abolished from City departmentsBudget cuts were analyzed to ensure that quality services to the citizens were not compromised. ACCOMPLISHMENTS GATEWAY DISTRICT In the Gateway district, the new Middle Tennessee Medical Center (MTMC) opened for business on October 10, 2010. The $267 million facility replaced an aging hospital landlocked in the center of Murfreesboro. The hospital is licensed for 286 beds (a 27 percent capacity increase from the previous building) in two patient towers, one a seven story wing and the other a five story structure. The new building is 556,000 square feet and was designed in a manner that future expansions can occur as needed. The new hospital is one of the anchors to the City’s Gateway District.

- iii -
MTMC broke ground on their second medical office building in November 2010. The Seton Medical Office building is proposed as an 113,100 square foot, four story structure to the west of the main hospital and to the north of the original DePaul Medical Office Building. Also in the Gateway, the new Rutherford County Visitors Center and Chamber of Commerce opened on Medical Center Parkway in December 2010. This 33,000 square foot building houses the offices of the Chamber, a Visitors Center and gift shop and the Small Business Center of Middle Tennessee State University. Total cost of the project was $6.6 million from a variety of Federal, State and local funding sources. In March 2011, Murfreesboro Medical Clinic (MMC) announced their plans for a 155,043 square feet, three story addition to the existing 78,549 square feet building on the 19.95 acre campus fronting Garrison Drive with access to Carl Adams Drive. MMC will utilize the new addition in conjunction with the existing structure to provide over 204,000 usable square feet of medical treatment and office building. The City successfully sold a 2.29 acre tract in the Gateway to Middle Tennessee Medical Center for future uses at a price of approximately $220,000. Several other smaller projects such as the First National Bank of McMinnville, Dialysis Clinic Incorporated and a daycare facility either began their planning, started construction or completed construction during the year. ROAD IMPROVEMENTS As part of the American Recovery and Reinvestment Act (ARRA), the Transportation Department completed the resurfacing of Thompson Lane and an upgrade and expansion of Murfreesboro’s integrated traffic signal system reached the ninety percent completed mark. A significant travel improvement was opened in February 2011 when the completion of the Manson Pike/Gresham Lane and Fortress Boulevard realignment was finished. This nearly $10 million project eliminated several confusing intersections and improved connections from I-24 to the northwest side of Murfreesboro. RECOGNITIONS Murfreesboro’s Embassy Suite and adjoining 89,000 square foot Conference Center was selected to serve as host of its first annual meeting of the Tennessee Municipal League, bringing over 1,300 municipal elected and appointed officials to the City for a four day conference in the June 2011. The City also hosted the annual meeting of the Tennessee Recreation Association in September 2010. The City began preparation for the celebration of its Bicentennial. A team of community leaders developed a theme per month for the yearlong celebration to begin in October of 2011. The Bicentennial corresponds with the Sesquicentennial anniversary of the Battle of Stones River in December 30, 2012 through January 2, 2013 and the Centennial celebration for Middle Tennessee State University in October of 2011. OTHER CAPITAL INVESTMENTS NHK Seating of North America broke ground on their $54 million dollar plant on Joe B. Jackson Parkway in November 2010. The plant supplies seat frames for Nissan and other auto manufacturers and will employ over 125 people. The City assisted the location of the facility through State grants to extend water and sewer utilities and minor road improvements totaling over $317,000. OPERATING IMPROVEMENTS In keeping with the format of the City’s operating budget document, these categorized improvements are being implemented by various City departments.
- iv -
SAFE AND LIVEABLE NEIGHBORHOODS Continued focus on funding police and fire departments Developing a design for drainage improvements in the Mitchell Neilson neighborhood Completing construction of the Maney Avenue improvements Completing the zoning study of the Maney Avenue area Establishing community landscape awards and a tree appreciation program Initiating planning for a park in western Murfreesboro Renovating the Ag Center building, Kids Castle, McFadden Community Center, Oaklands Park and Stones
River Greenway STRONG AND SUSTAINABLE ECONOMIC AND FINANCIAL HEALTH
Maintaining the existing level of property tax, which is the 13th consecutive year without a property tax increase;
Updating compensation plan that makes starting pay more competitive by dropping the old Step 1 and providing for pay growth by adding a new top step
Implementing of the new health insurance program and other employee benefits to reduce fixed costs Revising of fund transfers to more accurately account for general fund activities that benefit other funds of
the City Completing City Hall energy efficiency improvements through a $961K grant
EXCELLENT SERVICES WITH A FOCUS ON CUSTOMER SERVICE
Creating a new Information Technology Department to centralize the maintenance, operation, acquisition and planning for computers, GIS, technology, radio communications, mobile data and office equipment
Developing an information technology master plan that will create a roadmap for the acquisition of computer hardware and software, including the replacement of the legacy system currently used for the general ledger and human resources information systems
Continuing of “Service Excellence,” the City’s new customer service training program for city employees and promotion for a new position, Service Excellence Coordinator, that will be responsible for customer service training, a streamlining of certain development reviews and permitting and social media
Funding pay increases for full-time personnel Providing longevity pay, including an increase of $60/employee over last year’s amount and adding a
“catch up” provision for the one year that longevity pay was frozen for the majority of employees ENGAGING OUR COMMUNITY
Continuing the City’s Facebook presence, Police and Fire academies, CityTV and other tools to reach out to our residents
Conducting of neighborhood meetings on critical issues facing a neighborhood or the city Considering other social media to help increase the dialogue and flow of communications with our
residents Relocating the Public Information Officer to the Cable TV Department to consolidate the City’s public
information programs that can utilize the website, CityTV, social media and newspaper and television media
Implementing an electronic agenda system for City Council that will significantly decrease staff preparation of the council meeting packets as well as making the complete packet available to our residents via the website
AWARDS AND ACKNOWLEDGEMENTS The Government Finance Officers Association (GFOA) awarded a certificate of Achievement for Excellence in Financial Reporting to the City of Murfreesboro for its comprehensive annual financial report (CAFR) for the fiscal year ended June 30, 2010. This is the thirteenth consecutive year the City of Murfreesboro has received this

- v -
prestigious award. In order to be awarded a Certificate of Achievement, the government had to publish an easily readable and efficiently organized CAFR that satisfied both generally accepted accounting principles and applicable legal requirements.
A Certificate of Achievement is valid for a period of one year only. We believe that our current CAFR continues to meet the Certificate of Achievement Program's requirements and we are submitting it to the GFOA to determine its eligibility for another certificate.
The preparation of this report could not have been accomplished without the efficient and dedicated services of the entire staff of the finance and administration departmenl Appreciation is expressed to City employees throughout the organization, especially those who were instrumental in the successful completion of this report.
We are also grateful for the outstanding work performed by City employees every day. Without their efforts, Murfreesboro would not be a comffiWlity focused on the livability of its citizens.
We would like to thank the City Council for their interest and support in planning and conducting the financial operation of the City in a responsible and progressive manner.
Respectfully submitted,
Melissa B. Wright. CPA • ~ City RecorderfFinance Director
~
'--_-Erin E. Tuck". CPA ~ Assistant City Recorder/Chief Accountant

vi
CITY OF MURFREESBORO, TENNESSEE CITY OFFICIALS
JUNE 30, 2011 MAYOR Tommy Bragg CITY COUNCIL Chris Bratcher Doug Young Madelyn Scales Harris Tolbert Gilley, III Ronald Washington Shane McFarland CITY MANAGER Robert J. Lyons ASSISTANT CITY MANAGER James Crumley CITY RECORDER/CITY TREASURER/FINANCE DIRECTOR Melissa B. Wright CITY ATTORNEY Susan McGannon HUMAN RESOURCE DIRECTOR Glen Godwin SUPERINTENDENT OF SCHOOLS Linda Gilbert PLANNING DIRECTOR Joseph Aydelott DIRECTOR OF BUILDING DEPARTMENT Gary Whitaker POLICE CHIEF Glenn Chrisman RECREATION DIRECTOR Lanny Goodwin GOLF COURSE DIRECTOR Tracy Wilkins CITY ENGINEER Chris Griffith COMMUNITY DEVELOPMENT COORDINATOR John Callow FIRE CHIEF Cumbey Gaines, Jr. SOLID WASTE DIRECTOR Joey Smith WATER AND SEWER DIRECTOR Joe Kirchner ELECTRIC DEPARTMENT DIRECTOR Steve Sax SENIOR CITIZENS CENTER DIRECTOR Linda Burt DIRECTOR OF URBAN ENVIRONMENT Cynthia Holloway CITY JUDGE Ewing Sellers CABLE TELEVISION COORDINATOR Alan Bozeman AIRPORT MANAGER Chad Gehrke DIRECTOR OF STREET AND SIGN DEPARTMENT Rick Templeton DIRECTOR OF FLEET SERVICES Jack Hyatt TRANSPORTATION DIRECTOR Dana Richardson

Legislative Body
Tommy Bragg, Mayor; Chris Bratcher, Vice Mayor; Toby Gilley, Madelyn Scales Harris
Shane McFarland, Ron Washington, Doug Young
City Recorder/City Treasurer
Melissa Wright
City Judge
Ewing Sellers
City Attorney
Susan McGannon
Building Director
Gary Whitaker
Recreation
Director
Lanny Goodwin
Chief of Police
Glenn Chrisman
Transportation
Director
Dana Richardson
Golf Course
Director
Tracy Wilkins
Fire Chief
Cumbey Gaines
Senior Citizens
Director
Linda Burt
Airport Manager
Chad Gehrke
City Manager
Robert J. Lyons
Fleet Services
Director
Jack Hyatt
Urban Environmental
Director
Cynthia Holloway
Community
Development Director
John Callow
Cable TV
Coordinator
Alan Bozeman
Planning Director
Joseph Aydelott
Street & Sign
Director
Rick Templeton
City Engineer
Chris Griffith
Solid Waste
Director
Joey Smith
City of Murfreesboro—Organization Chart
Assistant City
Manager
James Crumley
Water & Sewer
Director
Joe Kirchner
Human Resources
Director
Glen Godwin
dnickerson
Typewritten Text
vii
Certificate of Achievement for Excellence
in Financial Reporting
Presented to
City of Murfreesboro Tennessee
For its Comprehensive Annual
Financial Report
for the Fiscal Year Ended
June 30, 2010
A Certificate of Achievement for Excellence in Financial Reporting is presented by the Government Finance Officers
Association of the United States and Canada to government units and public employee retirement
systems whose comprehensive annual financial reports (CAFRs) achieve the highest standards in government accounting
and financial reporting.
Executive Director
dnickerson
Typewritten Text
dnickerson
Typewritten Text
viii
- 1 -
INDEPENDENT AUDITOR'S REPORT
Honorable Mayor and City Council City of Murfreesboro, Tennessee
We have audited the accompanying financial statements of the governmental activities, the business-type activities, each major fund, and the aggregate remaining fund information of the City of Murfreesboro, Tennessee, as of and for the year ended June 30, 2011, which collectively comprise the City’s basic financial statements as listed in the table of contents. These financial statements are the responsibility of the City of Murfreesboro, Tennessee's management. Our responsibility is to express opinions on these financial statements based on our audit. We did not audit the financial statements of the Murfreesboro City Schools, the Murfreesboro Electric Department, the Murfreesboro Water and Sewer Department, the Murfreesboro Stormwater Fund, the Murfreesboro Electric Department Pension Plan, and the Evergreen Cemetery Commission whose statements reflect total assets of $84,630,076, $162,537,691, $411,242,895, $11,159,663, $14,979,684, and $2,311,902 respectively, and total revenues of $60,310,951, $160,158,760, $37,288,338 $2,506,369, $3,418,477, and $676,799 respectively. Those financial statements were audited by other auditors whose reports thereon have been furnished to us, and our opinion, insofar as it relates to the amounts included for the Murfreesboro City Schools, the Murfreesboro Electric Department, the Murfreesboro Water and Sewer Department, the Murfreesboro Stormwater Fund, the Murfreesboro Electric Department Pension Plan, and the Evergreen Cemetery Commission, is based on the reports of the other auditors.
We conducted our audit in accordance with auditing standards generally accepted in the United States of America and the standards applicable to financial audits contained in Government Auditing Standards, issued by the Comptroller General of the United States. Those standards require that we plan and perform the audit to obtain reasonable assurance about whether the financial statements are free of material misstatement. An audit includes examining, on a test basis, evidence supporting the amounts and disclosures in the financial statements. An audit also includes assessing the accounting principles used and significant estimates made by management, as well as evaluating the overall financial statement presentation. We believe that our audit and the reports of the other auditors provide a reasonable basis for our opinions.
In our opinion, based on our audit and the reports of other auditors, the financial statements referred to above present fairly, in all material respects, the respective financial position of the governmental activities, the business-type activities, each major fund, and the aggregate remaining fund information of the City of Murfreesboro, Tennessee, as of June 30, 2011, and the respective changes in financial position, and cash flows, where applicable, thereof and the respective budgetary comparisons for the General Fund and the General Purpose School Fund for the year then ended in conformity with accounting principles generally accepted in the United States of America.
As described in Note P to the financial statements, the City adopted the provisions of Governmental Accounting Standards Board Statement No. 54, Fund Balance Reporting and Governmental Fund Type Definitions, which became effective for the year ended June 30, 2011.
In accordance with Government Auditing Standards, we have also issued our report dated January 20, 2012 on our consideration of the City of Murfreesboro, Tennessee’s internal control over financial reporting and on our tests of its compliance with certain provisions of laws, regulations, contracts and grant agreements and other matters. The purpose of that report is to describe the scope of our testing of internal control over financial reporting and compliance and the results of that testing, and not to provide an opinion on the internal control over financial
JOBE, HASTINGS & ASSOCIATES
Certified Public Accountants Donna K. Hastings, CPA, CSEP 745 S 745 SOUTH CHURCH STREET – BELMONT PARK James R. Jobe, CPA P.O. BOX 1175 MURFREESBORO, TN 37133-1175 Joel H. Jobe (1944 – 2006) (615) 893-7777 FAX: (615) 896-5990 www.jobehastings.com
- 2 -
Honorable Mayor and City Council City of Murfreesboro, Tennessee Page 2
reporting or on compliance. That report is an integral part of an audit performed in accordance with Government Auditing Standards and should be considered in assessing the results of our audit.
Accounting principles generally accepted in the United States of America require that the management’s discussion and analysis, pension trend data, and post-employment benefit data, on pages three (3) through twenty-two (22) and eighty-five (85) through eighty-seven (87) be presented to supplement the basic financial statements. Such information, although not a part of the basic financial statements, is required by the Governmental Accounting Standards Board, who considers it to be an essential part of financial reporting for placing the basic financial statements in an appropriate operational, economic, or historical context. We and the other auditors have applied certain limited procedures to the required supplementary information in accordance with auditing standards generally accepted in the United States of America, which consisted of inquiries of management about the methods of preparing the information and comparing the information for consistency with management’s responses to our inquiries, the basic financial statements, and other knowledge we obtained during our audit of the basic financial statements. We do not express an opinion or provide any assurance on the information because the limited procedures do not provide us with sufficient evidence to express an opinion or provide any assurance.
Our audit was conducted for the purpose of forming opinions on the financial statements that collectively comprise the City of Murfreesboro, Tennessee’s financial statements as a whole. The introductory section, the combining and individual nonmajor fund financial statements and financial schedules listed in the supplemental section, and the statistical section are presented for purposes of additional analysis and are not a required part of the financial statements. The accompanying schedules of expenditures of federal and state awards are presented for purposes of additional analysis as required by U.S. Office of Management and Budget Circular A-133, Audits of States, Local Governments, and Non-Profit Organizations, and are also not a required part of the financial statements. The combining and individual nonmajor fund financial statements and the financial schedules as listed in the supplemental section, and the schedules of expenditures of federal and state awards are the responsibility of management and were derived from and relate directly to the underlying accounting and other records used to prepare the financial statements. The information has been subjected to the auditing procedures applied by us and the other auditors in the audit of the financial statements and certain additional procedures, including comparing and reconciling such information directly to the underlying accounting and other records used to prepare the financial statements or to the financial statements themselves, and other additional procedures in accordance with auditing standards generally accepted in the United States of America. In our opinion, based on our audit and the reports of other auditors, the information is fairly stated in all material respects in relation to the financial statements as a whole. The introductory and statistical sections have not been subjected to the auditing procedures applied by us and the other auditors in the audit of the basic financial statements and, accordingly, we do not express an opinion or provide any assurance on them.
Certified Public Accountants
Murfreesboro, Tennessee January 20, 2012
Jobe, Hastings & Associates

- 3 -
CITY OF MURFREESBORO
Management’s Discussion and Analysis
June 30, 2011
The following discussion and analysis of the City of Murfreesboro’s financial performance
provides an overview of the City’s financial activities for the fiscal year ended June 30, 2011.
Management encourages readers to consider the information presented here in conjunction
with the additional information presented in our letter of transmittal, which can be found on
pages i – v of this report.
FINANCIAL HIGHLIGHTS
The assets of the City of Murfreesboro exceeded its liabilities at June 30, 2011 by
$913,693,101. Of this amount $42,347,714 is unrestricted and may be used to meet the
City’s ongoing obligations to citizens and creditors.
The City’s total net assets increased by $25,991,766 (2.9 percent) during the year. The
governmental net assets increased by $4,626,220 (.91 percent) and the business-type net
assets increased by $21,365,546 (5.6 percent).
As of June 30, 2011 the City’s governmental funds reported combined fund balances of
$91,408,700, an increase of $35,166,529 (62.5 percent) in comparison with the prior
year. The 2010 TML fund balance realized an increase of $34,894,228 from the prior
year due to expenses that were recognized in FY 10 while the loan proceeds were
recognized in FY 11. The unassigned portion of the total governmental funds fund
balance is $39,902,510 and is available for spending at the City’s discretion.
At the end of the year the unassigned fund balance for the general fund was $42,230,413,
or 58.5 percent of the total general fund expenditures.
The City of Murfreesboro’s total long-term liabilities increased by $34,851,170 (9.6
percent) during the year ended June 30, 2011. A new fixed rate loan (2010 TML) was
issued in FY 11 totaling $47,600,000 for the City’s capital projects. Unlike previous
variable rate loans obtained through the Tennessee Municipal Bond Fund, the loan
proceeds from this loan were received in a lump sum payment, instead of requiring draw
requests through a third party trustee.
OVERVIEW OF THE FINANCIAL STATEMENTS
The City of Murfreesboro’s basic financial statements are comprised of three components: 1)
government-wide financial statements, 2) fund financial statements, and 3) notes to the
financial statements. This report also contains other supplementary information.

- 4 -
Government-wide Financial Statements
The government-wide financial statements are designed to provide a broad overview of the
City’s finances, in a manner similar to a private-sector business. These statements present
governmental activities and business-type activities separately. Governmental activities are
principally supported by taxes and intergovernmental revenues and include general
government, police, fire protection, judicial, legal, human resources, streets and signs,
planning and engineering, building and codes, solid waste, urban environmental, public
health, education and welfare, community services, recreation, community and economic
development, education, and food service. Business-type activities are supported through
user fees and charges and include a water and sewer operation, a stormwater fund, an
electrical distribution operation, and a cemetery. The government-wide financial statements
can be found on pages 23-24 of this report.
The statement of net assets presents information on all of the City’s assets and liabilities,
with the difference between the two reported as net assets. Over time, increases or decreases
in net assets may serve as a useful indicator of whether the financial position of the City of
Murfreesboro is improving or deteriorating.
The statement of activities presents information showing how the government’s net assets
changed during the most recent fiscal year. All changes in net assets are reported as soon as
the underlying event giving rise to the change occurs, regardless of the timing of the related
cash flows. Thus, revenues and expenses are reported in this statement for some items that
will only result in cash flows in future fiscal periods (e.g. uncollected taxes and earned but
unused vacation leave).
Fund Financial Statements
A fund is established to account for a specific activity or purpose. Law mandates the
creation of some funds. Other funds are established by management to demonstrate financial
compliance with budget or legal requirements. All of the funds of the City of Murfreesboro
can be divided into three categories: governmental funds, proprietary funds, and fiduciary
funds.
Governmental Funds
Governmental funds are used to account for most of the City’s basic services. The
governmental fund statements provide a detailed short-term view of the City’s general
government operations by using a modified accrual accounting method, which measures cash
and all other financial assets that can be readily converted to cash. Governmental fund
information is useful in determining whether there are more or fewer financial resources that
can be spent in the near future to finance the City’s programs. The differences of results in
the governmental fund financial statements to those of the government-wide financial
statements are explained in a reconciliation following each governmental fund statement.
The City of Murfreesboro maintains twenty (20) individual governmental funds. Information
is presented separately in the governmental fund statements for the general fund, the general
purpose school fund, the debt service fund and the 2010 TML Loan fund which are
considered to be major funds. Data from the other sixteen (16) governmental funds are
combined into a single, aggregated presentation. Individual fund data for each of these non-

- 5 -
major governmental funds is provided in combining statements in the supplemental section
of this report. The basic governmental fund financial statements can be found on pages 25 -
28 of this report.
Proprietary Funds
There are two types of proprietary funds: enterprise funds and internal service funds.
Enterprise funds are used to account for operations that are financed and operated in a
manner similar to private business enterprises. Enterprise funds are used to report the same
functions presented as business-type activities in the government-wide financial statements,
only in more detail. The City’s water and sewer department and electric department are
considered to be major funds and are displayed separately in the proprietary fund statements
on pages 39-42 of this report. The City’s other four (4) enterprise funds are combined into a
single column for non-major funds.
Internal service funds are used to account for activities that provide supplies and services for
the City’s other programs and activities. Because these services predominantly benefit
governmental functions, they have been included within governmental activities in the
government-wide financial statements. The City of Murfreesboro uses internal service funds
to account for its fleet maintenance of vehicles and for its self-insurance programs. They
have been combined into a single column in the proprietary fund financial statements on
pages 39–42 of this report. Detailed financial data for those funds can be found in the
combining statements in the supplemental section of this report.
Fiduciary Funds
Fiduciary funds are used to account for resources held for the benefit of parties outside of the
government. Fiduciary funds are not reflected in the government-wide financial statements
because the resources of those funds are not available to support the City’s own programs.
The accounting used for fiduciary funds is much like that used for proprietary funds. The
fiduciary fund statements can be found on pages 43 - 44 of this report.
Notes to the Financial Statements
The notes provide additional information that is essential to a full understanding of the data
provided in the government-wide and fund financial statements. The notes to the financial
statements can be found on pages 45 - 84 of this report.
Other Information
In addition to the basic financial statements and accompanying notes, this report also presents
certain required supplementary information concerning the City’s progress in funding its
obligation to provide pension benefits to its employees. Required supplementary information
can be found on pages 85 - 86 of this report. In compliance with GASB 45, the City adopted
the reporting requirements for post-employment benefits. Required supplementary
information can be found on page 87 of this report.
The combining statements referred to earlier in connection with the non-major governmental
funds, non-major enterprise funds and internal service funds are presented immediately
following the required supplementary information on pensions and certain budgetary
- 6 -
comparison schedules as supplementary information. Combining statements and individual
fund schedules can be found on pages 88 - 119 of this report.
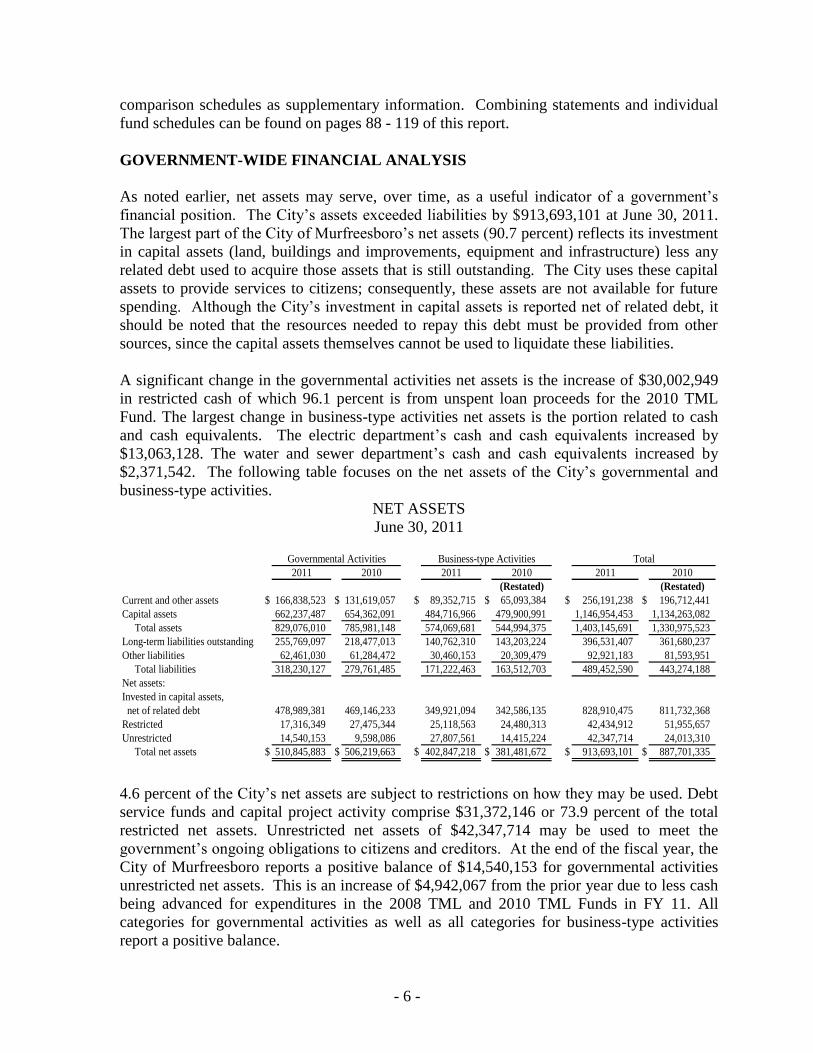
GOVERNMENT-WIDE FINANCIAL ANALYSIS
As noted earlier, net assets may serve, over time, as a useful indicator of a government’s
financial position. The City’s assets exceeded liabilities by $913,693,101 at June 30, 2011.
The largest part of the City of Murfreesboro’s net assets (90.7 percent) reflects its investment
in capital assets (land, buildings and improvements, equipment and infrastructure) less any
related debt used to acquire those assets that is still outstanding. The City uses these capital
assets to provide services to citizens; consequently, these assets are not available for future
spending. Although the City’s investment in capital assets is reported net of related debt, it
should be noted that the resources needed to repay this debt must be provided from other
sources, since the capital assets themselves cannot be used to liquidate these liabilities.
A significant change in the governmental activities net assets is the increase of $30,002,949
in restricted cash of which 96.1 percent is from unspent loan proceeds for the 2010 TML
Fund. The largest change in business-type activities net assets is the portion related to cash
and cash equivalents. The electric department’s cash and cash equivalents increased by
$13,063,128. The water and sewer department’s cash and cash equivalents increased by
$2,371,542. The following table focuses on the net assets of the City’s governmental and
business-type activities.
NET ASSETS
June 30, 2011
2011 2010 2011 2010 2011 2010
(Restated) (Restated)
Current and other assets $ 166,838,523 $ 131,619,057 $ 89,352,715 $ 65,093,384 $ 256,191,238 $ 196,712,441
Capital assets 662,237,487 654,362,091 484,716,966 479,900,991 1,146,954,453 1,134,263,082
Total assets 829,076,010 785,981,148 574,069,681 544,994,375 1,403,145,691 1,330,975,523
Long-term liabilities outstanding 255,769,097 218,477,013 140,762,310 143,203,224 396,531,407 361,680,237
Other liabilities 62,461,030 61,284,472 30,460,153 20,309,479 92,921,183 81,593,951
Total liabilities 318,230,127 279,761,485 171,222,463 163,512,703 489,452,590 443,274,188
Net assets:
Invested in capital assets,
net of related debt 478,989,381 469,146,233 349,921,094 342,586,135 828,910,475 811,732,368
Restricted 17,316,349 27,475,344 25,118,563 24,480,313 42,434,912 51,955,657
Unrestricted 14,540,153 9,598,086 27,807,561 14,415,224 42,347,714 24,013,310
Total net assets $ 510,845,883 $ 506,219,663 $ 402,847,218 $ 381,481,672 $ 913,693,101 $ 887,701,335
Governmental Activities Business-type Activities Total
4.6 percent of the City’s net assets are subject to restrictions on how they may be used. Debt
service funds and capital project activity comprise $31,372,146 or 73.9 percent of the total
restricted net assets. Unrestricted net assets of $42,347,714 may be used to meet the
government’s ongoing obligations to citizens and creditors. At the end of the fiscal year, the
City of Murfreesboro reports a positive balance of $14,540,153 for governmental activities
unrestricted net assets. This is an increase of $4,942,067 from the prior year due to less cash
being advanced for expenditures in the 2008 TML and 2010 TML Funds in FY 11. All
categories for governmental activities as well as all categories for business-type activities
report a positive balance.
- 7 -
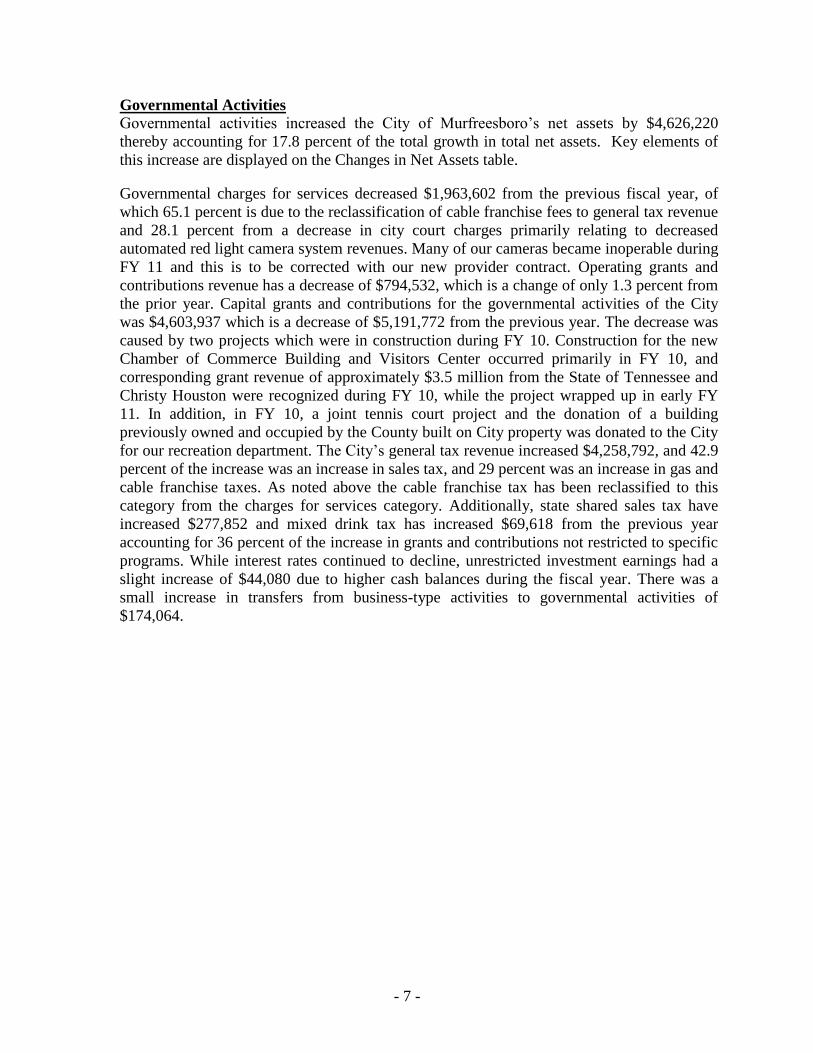
Governmental Activities
Governmental activities increased the City of Murfreesboro’s net assets by $4,626,220
thereby accounting for 17.8 percent of the total growth in total net assets. Key elements of
this increase are displayed on the Changes in Net Assets table.
Governmental charges for services decreased $1,963,602 from the previous fiscal year, of
which 65.1 percent is due to the reclassification of cable franchise fees to general tax revenue
and 28.1 percent from a decrease in city court charges primarily relating to decreased
automated red light camera system revenues. Many of our cameras became inoperable during
FY 11 and this is to be corrected with our new provider contract. Operating grants and
contributions revenue has a decrease of $794,532, which is a change of only 1.3 percent from
the prior year. Capital grants and contributions for the governmental activities of the City
was $4,603,937 which is a decrease of $5,191,772 from the previous year. The decrease was
caused by two projects which were in construction during FY 10. Construction for the new
Chamber of Commerce Building and Visitors Center occurred primarily in FY 10, and
corresponding grant revenue of approximately $3.5 million from the State of Tennessee and
Christy Houston were recognized during FY 10, while the project wrapped up in early FY
11. In addition, in FY 10, a joint tennis court project and the donation of a building
previously owned and occupied by the County built on City property was donated to the City
for our recreation department. The City’s general tax revenue increased $4,258,792, and 42.9
percent of the increase was an increase in sales tax, and 29 percent was an increase in gas and
cable franchise taxes. As noted above the cable franchise tax has been reclassified to this
category from the charges for services category. Additionally, state shared sales tax have
increased $277,852 and mixed drink tax has increased $69,618 from the previous year
accounting for 36 percent of the increase in grants and contributions not restricted to specific
programs. While interest rates continued to decline, unrestricted investment earnings had a
slight increase of $44,080 due to higher cash balances during the fiscal year. There was a
small increase in transfers from business-type activities to governmental activities of
$174,064.

- 8 -
CHANGES IN NET ASSETS
June 30, 2011
2011 2010 2011 2010 2011 2010
(Restated) (Restated)
Revenues:
Program revenues:
Charges for services $ 12,812,010 $ 14,775,612 $ 194,366,495 $ 166,208,592 $ 207,178,505 $ 180,984,204
Operating grants & contributions 62,827,946 63,622,478 311,112 146,238 63,139,058 63,768,716
Capital grants & contributions 4,603,937 9,795,709 5,533,215 8,042,948 10,137,152 17,838,657
General revenues:
Property taxes 35,703,069 35,205,314 35,703,069 35,205,314
Other taxes 38,936,677 35,175,640 38,936,677 35,175,640
Grants & contributions not
restricted to specific programs 9,981,203 9,024,361 9,981,203 9,024,361
Other 927,087 374,460 387,778 371,857 1,314,865 746,317
Total revenues $ 165,791,929 $ 167,973,574 $ 200,598,600 $ 174,769,635 $ 366,390,529 $ 342,743,209
Expenses:
General government $ 11,856,868 $ 11,036,656 $ 11,856,868 $ 11,036,656
Police 22,201,545 21,357,988 22,201,545 21,357,988
Fire protection 14,608,541 13,879,753 14,608,541 13,879,753
Judicial 362,930 392,199 362,930 392,199
Legal 727,927 708,421 727,927 708,421
Human resources 765,914 691,601 765,914 691,601
Streets and signs 13,617,876 13,146,938 13,617,876 13,146,938
Planning and engineering 1,811,333 1,710,957 1,811,333 1,710,957
Building and codes 1,651,344 1,712,753 1,651,344 1,712,753
Solid waste 4,905,651 4,657,751 4,905,651 4,657,751
Transportation 2,339,168 3,264,921 2,339,168 3,264,921
Urban environmental 939,172 964,579 939,172 964,579
Public health, educ. and welfare 1,782,425 1,664,492 1,782,425 1,664,492
Community services 6,374,845 6,288,522 6,374,845 6,288,522
Recreation 12,184,112 11,255,539 12,184,112 11,255,539
Community/economic develop. 1,541,107 2,325,940 1,541,107 2,325,940
Education 58,805,049 55,979,544 58,805,049 55,979,544
Food service 3,399,774 3,263,223 3,399,774 3,263,223
Interest on long-term debt 4,189,688 2,956,845 4,189,688 2,956,845
Water and sewer and stormwater $ 29,964,693 $ 28,950,257 29,964,693 28,950,257
Electric 145,950,961 123,401,884 145,950,961 123,401,884
Cemetery 484,801 592,384 484,801 592,384
Total expenses $ 164,065,269 $ 157,258,622 $ 176,400,455 $ 152,944,525 $ 340,465,724 $ 310,203,147
Increase in net assets before
contributions and transfers $ 1,726,660 $ 10,714,952 $ 24,198,145 $ 21,825,110 $ 25,924,805 $ 32,540,062
Contributions to permanent funds 66,961 65,138 66,961 65,138
Transfers 2,899,560 2,725,496 (2,899,560) (2,725,496)
Increase in net assets $ 4,626,220 $ 13,440,448 $ 21,365,546 $ 19,164,752 $ 25,991,766 $ 32,605,200
Net assets - beginning, as
previously reported $ 506,219,663 $ 491,705,415 $ 380,744,745 $ 361,579,993 $ 886,964,408 $ 853,285,408
Prior period adjustment 1,073,800 736,927 736,927 1,073,800
Net assets - beginning, as
restated $ 506,219,663 $ 492,779,215 $ 381,481,672 $ 361,579,993 $ 887,701,335 $ 854,359,208
Net assets at end of year $ 510,845,883 $ 506,219,663 $ 402,847,218 $ 380,744,745 $ 913,693,101 $ 886,964,408
Governmental Activities Business-type Activities Total
The cost of all governmental activities was $164,065,269. However, as shown in the
Changes in Net Assets table, 48.9 percent ($80,243,893) of these costs were paid by those
who directly benefited from the programs, or by other governments and organizations that
subsidized certain programs with operating grants and contributions and capital grants and

- 9 -
contributions. The City paid for the remaining “public benefit” portion of governmental
activities with taxes, general grants and contributions, and other miscellaneous revenue.
Each program’s net cost to taxpayers is presented on page 10.
In comparison to the previous year, the percentages noted above have only increased or
decreased 1 percent, in all categories except for Capital Grants and Contributions which has
decreased 3 percent. As noted previously, the majority of the decrease in FY 11 is due to the
recognition of the $3.5 million in grant revenue for the Visitor’s Center grant in FY 10. The
following table displays program costs to the taxpayers.
Charges for services 8%
Operating grants & contributions
38%
Capital grants & contributions
3%
Property taxes 22%
Sales taxes 18%
Other taxes 5%
Grants & contributions not restricted to specific
programs 6%
Other 0%
Revenues by Source Governmental Activities

- 10 -
Net Program Cost to Taxpayers
Governmental activities: Net (Expense)
Revenue Expense Revenue
General government $ 306,797 $ 11,856,868 $ (11,550,071)
Police 419,240 22,201,545 (21,782,305)
Fire protection 872,630 14,608,541 (13,735,911)
Judicial 1,615,803 362,930 1,252,873
Legal 727,927 (727,927)
Human resources 765,914 (765,914)
Streets and signs 4,906,267 13,617,876 (8,711,609)
Planning and engineering 182,276 1,811,333 (1,629,057)
Building and codes 1,348,831 1,651,344 (302,513)
Solid waste 17,762 4,905,651 (4,887,889)
Transportation 2,455,038 2,339,168 115,870
Urban environmental 939,172 (939,172)
Public health, educ. and welfare 1,782,425 (1,782,425)
Community services 5,638,675 6,374,845 (736,170)
Recreation 3,752,820 12,184,112 (8,431,292)
Community development 2,459,255 1,541,107 918,148
Education 52,676,052 58,805,049 (6,128,997)
Food service 3,592,447 3,399,774 192,673
Interest on long-term debt 4,189,688 (4,189,688)
Total governmental activities $ 80,243,893 $ 164,065,269 $ (83,821,376)
Governmental net assets for FY 11 increased by $4,626,220 after payment of governmental
activities expenses of $164,065,269 with program revenues of $80,243,893, general revenues
of $85,548,036 and transfers from other funds of $2,899,560. Governmental net assets at
June 30, 2011 were $510,845,883.
Program Expenses
Governmental Activities
Total Percent Total Percent
Governmental activities: Expense of Total Expense of Total
General government $ 11,856,868 7% Transportation 2,339,168 1%
Police 22,201,545 14% Urban environmental 939,172 1%
Fire protection 14,608,541 9% Public health, educ. and welfare 1,782,425 1%
Judicial 362,930 0% Community servcies 6,374,845 4%
Legal 727,927 0% Recreation 12,184,112 7%
Human resources 765,914 1% Community/economic development 1,541,107 1%
Streets and signs 13,617,876 8% Education 58,805,049 36%
Planning and engineering 1,811,333 1% Food service 3,399,774 2%
Building and codes 1,651,344 1% Interest on long-term debt 4,189,688 3%
Solid waste 4,905,651 3% Total governmental activities $ 164,065,269 100%
- 11 -
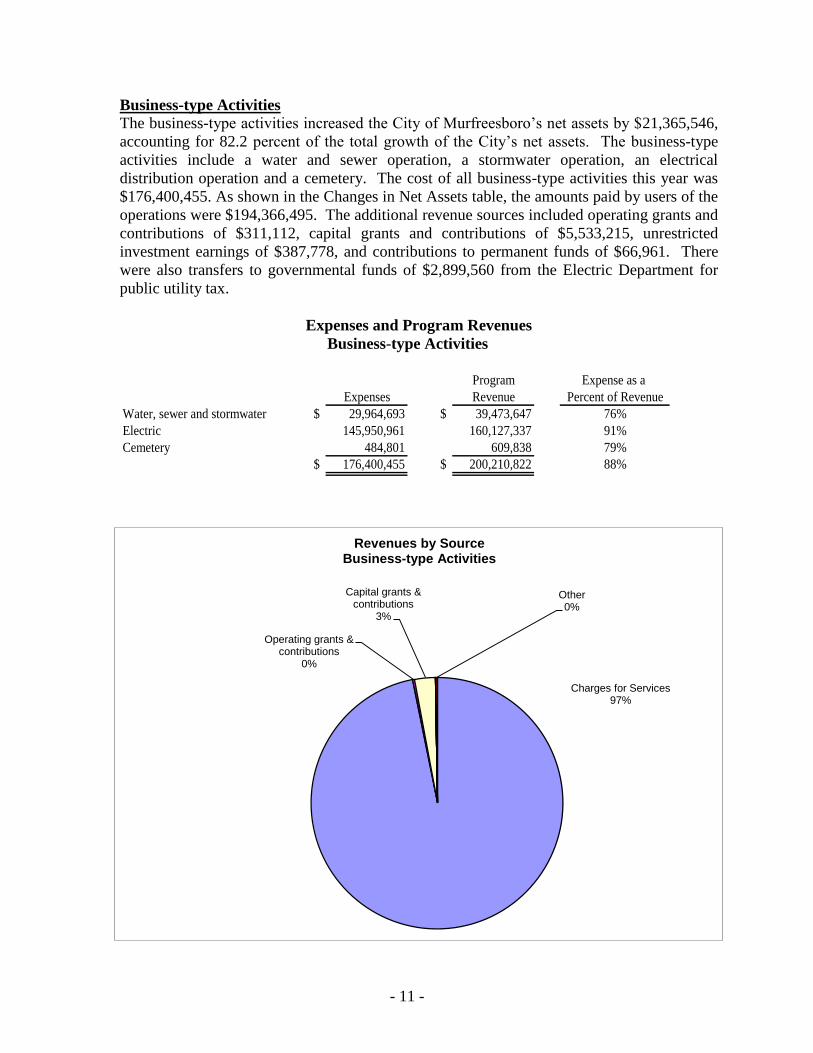
Business-type Activities
The business-type activities increased the City of Murfreesboro’s net assets by $21,365,546,
accounting for 82.2 percent of the total growth of the City’s net assets. The business-type
activities include a water and sewer operation, a stormwater operation, an electrical
distribution operation and a cemetery. The cost of all business-type activities this year was
$176,400,455. As shown in the Changes in Net Assets table, the amounts paid by users of the
operations were $194,366,495. The additional revenue sources included operating grants and
contributions of $311,112, capital grants and contributions of $5,533,215, unrestricted
investment earnings of $387,778, and contributions to permanent funds of $66,961. There
were also transfers to governmental funds of $2,899,560 from the Electric Department for
public utility tax.
Expenses and Program Revenues
Business-type Activities
Program Expense as a
Expenses Revenue Percent of Revenue
Water, sewer and stormwater $ 29,964,693 $ 39,473,647 76%
Electric 145,950,961 160,127,337 91%
Cemetery 484,801 609,838 79%
$ 176,400,455 $ 200,210,822 88%
Charges for Services 97%
Operating grants & contributions
0%
Capital grants & contributions
3%
Other 0%
Revenues by Source Business-type Activities

- 12 -
The Water and Sewer Department experienced a $1,919,748 (6.5 percent) growth in
operating revenues due to rate design changes to the minimum allowances for consumption.
The allowance was decreased by 50 cubic feet per month so that every customer paid water
and sewer monthly charges for an additional 50 cubic feet each month. Operating and
maintenance expenses increased $953,563 (6.2 percent) from the prior year as the department
experienced increases in both chemical treatments and power. The capital contributions from
developers, which include the tap fees less the tap fee expense and the contributions in aid of
construction, totaled $5,478,570, a decrease of $2,564,378 compared to last year. This
decline can be attributed to the decline in the economy which has resulted in fewer additions
to water and sewer infrastructure being installed by developers for new subdivisions. The
Stormwater Fund has now completed its fourth year of operations. Established in 2008 in
accordance with federal mandates, the fund is primarily financed from charges to the Water
& Sewer customer base for the study and management of stormwater runoff in the City of
Murfreesboro. The charges collected by the Stormwater Fund were $2,506,369, an increase
of 6.5 percent from last year. Management attributes this increase to commercial
development continuing to occur in the City. Operating and maintenance expenses totaled
$809,354, an increase of 71.52 percent. Engineering and inspection service costs of $198,419
which were recognized in 2011, made up the majority of this increase.
Water and Sewer and Stormwater department employees participate in the City of
Murfreesboro Pension Plan which is discussed in the Financial Analysis of Governmental
Funds.
The Electric Department experienced a $26,048,279 (19.45 percent) increase in operating
revenue. This increase is due primarily to quarterly fuel cost adjustment (FCA) increases by
TVA of $12.6 million this fiscal year as compared to last year. In addition, the Electric
Department also changed billing cycles as prompted by TVA which resulted in
approximately $7.5 million in additional revenue. Purchased power expense of
$128,838,097 reflects an increase of 21.36 percent in 2011 as a result of the large FCA
increases and increases in kilowatt hours (kWh) purchased. Purchased power increased more
significantly than operating revenue due to the FCA increases which are passed straight
through with no margin for the Electric Department. Approximately $6 million of the
purchased power increase was a result of the change in billing policy by TVA. Property
taxes and depreciation increased due to the increased level of plant while non-operating
expenses decreased due to reduced interest rates on debt service. The Electric Department
experienced relatively no customer growth during 2011. The customer base increased by 147
customers, or 0.3 percent. This trend is expected to continue through June 30, 2012.
The Electric Department contributes to a single-employer defined benefit pension plan
separate from the City of Murfreesboro’s pension plan. The plan’s net assets increased by
$2,774,244 or 22.73 percent during FY 11 compared to a FY 10 increase of $1,939,619. The
primary reason of this increase can be attributed to the improved stock market conditions
during FY 11. Benefit payments increased by $40,911 or 6.78 percent during the year. The
plan’s actuary recommends the advised retirement contribution amount based on the annual
actuary report. All contributions to the plan are made by the employer. Additional
information regarding the Murfreesboro Electric Department Employee Pension Plan can be
found in footnote I.

- 13 -
FINANCIAL ANALYSIS OF THE GOVERNMENT’S FUNDS
Governmental Funds
The City of Murfreesboro implemented GASB Statement No. 54 for FY 11 as required by
the Governmental Accounting Standards Board. As a result, funds that had been stand alone
Special Revenue funds were combined into the General Fund, these were: the Recreation
Fund, the Old Fort Golf Course Fund, the Solid Waste Fund, the Television Fund and the
Senior Citizens Fund. Additionally, an account previously reported in a Capital Improvement
Fund for shared revenue from county school bonds was moved into the General Fund for use
to pay on school debt service. As of June 30, 2011 the City of Murfreesboro’s governmental
funds reported combined ending fund balances of $91,408,700, an increase of $35,166,529 in
comparison with the prior year.
The General Fund is the chief operating fund of the City of Murfreesboro. At June 30, 2011,
the fund balance was $48,451,934, a decrease of $796,801. Management strove to maintain
efforts in controlling costs in a continued difficult economic environment for governments.
Our local sales tax revenue numbers increased $1,828,921 or 6.5 percent over FY 10 as our
area remained attractive to new shopping venues and partially due to some adjustments made
on the state level to correct situs locations. Our local option sales tax had a positive budget
variance of $1,762,214. Our license, permits and fees category had $976,541 less revenue
than FY 10 as the construction industry continues to remain flat, with a negative FY 11
budget variance of $1,009,605. Our court fines and red light camera fees had a negative
budget variance of $718,451 and $379,715 less revenue than FY 10. About half of both
variances were due to inoperable automated red light enforcement cameras. This is expected
to be corrected in FY 12 under a new system contract. Additionally, a new contract began
with a collection agency in FY 11 that is expected to enhance court collections. We realized a
negative budget variance of $1,236,613 in our federal funds as project timelines varied for
greenways and public transit projects as well as ARRA stimulus spending. Accordingly,
corresponding expenditures for these projects would have been changed to the same
timelines. Our street and sign department recognized $597,235 in a negative budget variance
caused almost entirely by higher than anticipated street lighting costs and more street repairs
needed than originally planned for in FY 11. As we are a service based organization, our
largest expense is for wages and related benefits, which equaled 68.3 percent of our FY 11
expenditures. In the general fund, labor and related accounts totaled $49,303,797 for FY 11,
versus $47,971,459 for FY 10. This equated to an increase of $1,332,338 or 2.8 percent.
Labor and related taxes increased by $732,931, health insurance costs increased by $612,619
and retirement contributions decreased by $12,672. In FY 11 the police department
implemented a new crime prevention unit to be proactive in the schools as well as on the
streets in an effort to reduce crime from gang and other similar activities. Increased costs
from FY 10 for labor and related accounts for the police department were $955,082. City
management continued to carefully monitor and consider hiring requests for all departments
to ensure funds were being allocated appropriately. During the budget process, all
departments were asked to search for budget cuts that would not affect basic service to our
citizens and to monitor all expenses through the year to be sure costs were being contained
and savings realized.

- 14 -
The General Purpose School Fund budgetary basis fund balance decreased by $1,945,170
which was less than the $2,170,046 anticipated in the budget. Revenues increased in FY 11
as compared to FY 10 by $1,741,522 because of additional Federal and State stimulus grants
and increased shared property tax revenue. Expenditures decreased in FY 11 by $3,349,473
primarily due to reductions in administration and business, maintenance and operations,
transportation and food service. Instruction costs increased mainly due to an annual step
increase for professional educators and retirement plan contributions.
The Debt Service Fund experienced a small increase in fund balance of $8,522. Principal
payments were $628,324 less than in FY 10, a 3.4 percent decrease, interest payments were
$1,004,224 more than in FY 10, a 36.9 percent increase, and debt issuance costs decreased
$428,102 in FY 11, a 79.7 percent decrease. Financed debt has increased $31,581,331 for
governmental activities debt, including school debt service from FY 10. In November 2010
the City obtained a new fixed rate $47.6 million loan and continued to make draws on the
existing 2008 TML loan for capital improvement projects, while making scheduled principal
payments on all debt. At June 30, 2011, the fixed rate to variable rate loan ratio is 45.5
percent fixed rate compared to 54.5 variable rate. Additionally, the City Schools agreed to
accept an interest free loan through the State of Tennessee for upgrades to the schools to
decrease energy costs. After the fiscal year-end, the school energy loan became effective and
the schools began making loan repayments which will continue for 10 years.
In accordance with guidance from the State and the AICPA, the city schools debt service and
capital outlay paid for by the City of Murfreesboro is recorded on the schools department-
wide report. On page 27, under Other Governmental Funds, $3,568,050 is included for debt
principal and interest costs, which is for funds paid out by the City of Murfreesboro on debt
that was issued by the City of Murfreesboro and used on school buildings and equipment in
addition to other city projects. The school report also includes the buildings (which are titled
to the City of Murfreesboro) and equipment with their own asset and capital outlay
information. The City has deleted these same numbers from the asset and capital outlay
information. This information was booked through the use of transfers as seen in the Other
Financing Sources (Uses) section of page 27.
The 2008 TML Fund is a capital project fund that expends variable rate loan proceeds,
received on a reimbursement basis, from the Tennessee Municipal Bond Fund (TMBF). It
has a deficit balance at June 30, 2011 of $642,487 which results from funds spent through the
General Fund to be repaid through loan proceeds. The overwhelming majority of
expenditures for FY 11 were for street projects.
The 2010 TML Fund is a capital project fund that expends fixed rate loan proceeds from the
Tennessee Municipal Bond Fund (TMBF). The loan proceeds were received in November
2010 and the majority of funds have been used for road projects (70.1 percent of funds
expended through June 30, 2011), and recreation and greenway projects (23.8 percent
expended through June 30, 2011). The fund balance for FY 11 is $25,840,456.
Less active TML Funds have a positive fund balance as a result of funds held in escrow for
state match on road projects.

- 15 -
The Gateway Project Fund was established to record the development of an area of land
purchased by the City to bring new jobs and companies to our area. This has been an
overwhelming success as the City has a new hospital that was built in the area and many
medical facilities have moved here from both inside our City and from other areas not
previously a part of our business community. Both retail and office developments have
located in this area as well as new concepts of mixed retail and living space. The City still
has land for sell in this area and is being very selective for the types of development we
would like to see here. The General Fund is fronting all costs associated with the capital
outlay for street development as may be agreed upon with sale contracts and is reimbursed as
the property is sold. Currently this fund has a fund balance deficit of $1,073,980 and
management believes the remaining property to be sold is more than adequate to reimburse
the General Fund.
The City’s Pension Fund, a defined benefit plan, had an increase of $15,393,906 in net assets
held in trust through June 30, 2011. This is a 20.3 percent increase from the previous year.
The pension committee has been working with third-party consultants and our investment
managers to closely monitor the stock market and to mitigate future asset decreases by
ensuring the plan is properly diversified and that investment managers are meeting set
benchmarks. The City’s actuary recommends the advised retirement contribution rate based
on the annual actuary report. The City receives this rate after the budget has been set for the
following year, so the rate is implemented one year later in the next budget year, causing a
timing difference for implementation. If the advised contribution rate increases, this can
cause a temporary underfunding of the pension obligation, which can also be affected by the
actuarial assumptions and activity within the plan. After the fiscal year-ended, City
management was set to re-evaluate all assumptions of the plan with the actuary and the third-
party consultant to be sure the assumptions are reasonable and attainable and to implement
changes as advised. The Pension Committee, a seven member board, met with the actuary
and third-party consultant in late fall of 2011 to hear recommendations on assumptions and
how these changes would affect recommended investment policy decisions to assist in
attaining projected earnings. The defined benefit plan was closed to new participants as of
June 30, 2010, and a new defined contribution plan was implemented for new hires
beginning July 1, 2010. Additional information regarding the pension plans can be found in
note I on pages 65 - 71, including the pension plan information for the city schools which is
administered by the State of Tennessee and a separate defined benefit plan for the
Murfreesboro Electric Department.
Proprietary Funds
The City of Murfreesboro’s proprietary funds provide the same type of information found in
the government-wide financial statements, but in more detail.
Net assets of the Water and Sewer Department at June 30, 2011 were $282,643,095, which is
an increase of $7,606,486. The Electric Department had net assets of $110,962,720 at June
30, 2011, which is an increase of $11,477,620. Net assets for the other proprietary funds at
June 30, 2011 were $6,301,259, which is an increase of $1,750,220. The Stormwater Fund is
responsible for $1,751,660 of this increase while the Cemetery Fund is responsible for a
decrease in net assets of $1,440.

- 16 -
Other factors concerning the finances of these funds have already been addressed in the
discussion of the City’s business-type activities.
GENERAL FUND BUDGETARY HIGHLIGHTS
No budget amendments were necessary for the General Fund during the fiscal year ended
June 30, 2011.
Overall, budget exceeded general fund revenues by $800,657 and expenditures were less than
budget by $3,792,890. However, transfers from the general fund to other funds were more
than anticipated by $2,160,090, most of which was for debt service fund transfers. The
budget anticipated a $3,230,258 shortfall to be funded from available fund balance, but
instead the actual amount was only a decrease to fund balance of $796,801. As a result, the
City only used 24.6 percent of the budgeted fund balance.
CAPITAL ASSET AND DEBT ADMINISTRATION
Capital Assets
The City of Murfreesboro’s investment in capital assets for its governmental and business-
type activities as of June 30, 2011 amounted to $1,146,954,453 (net of accumulated
depreciation). This investment in capital assets includes land, buildings and improvements,
equipment, certain infrastructure, and utility distribution systems. The total increase in the
City of Murfreesboro’s investment in capital assets for the current fiscal year was 1.1 percent
(a 1.2 percent increase for governmental activities and a 0.08 percent increase for business-
type activities).
Governmental activities:
Land increased by $3,499,523 in FY 11 of which $3,106,610 (88.8 percent) was for right-of-
way increases for road construction, annexation and drainage easements.
Construction in progress at June 30, 2011 is composed largely of road projects (92.3
percent). The recreation greenway extension, city schools energy efficiency project, a police
precinct, wetland improvements, the city hall energy efficiency ARRA project, the new bus
system transit shelter and the new office building/visitor’s center make up the remaining 7.7
percent of total construction in progress.
Government buildings increased $4,231,750 or $1,597,675, net of depreciation, in FY 11.
The new Chamber of Commerce building and Visitors Center cost $4,209,304 and makes up
99 percent of this increase.
Government improvements other than buildings increased $4,530,300 or $1,627,571 net of
depreciation. The renovated outdoor pool in our recreation department made up $3,293,513
of this increase, while the greenway extension additions of $713,479 were added as well.
Storm and sanitary sewer, irrigation, paving and landscaping additions of $474,732 were also
added to the new Chamber of Commerce building and Visitors Center.
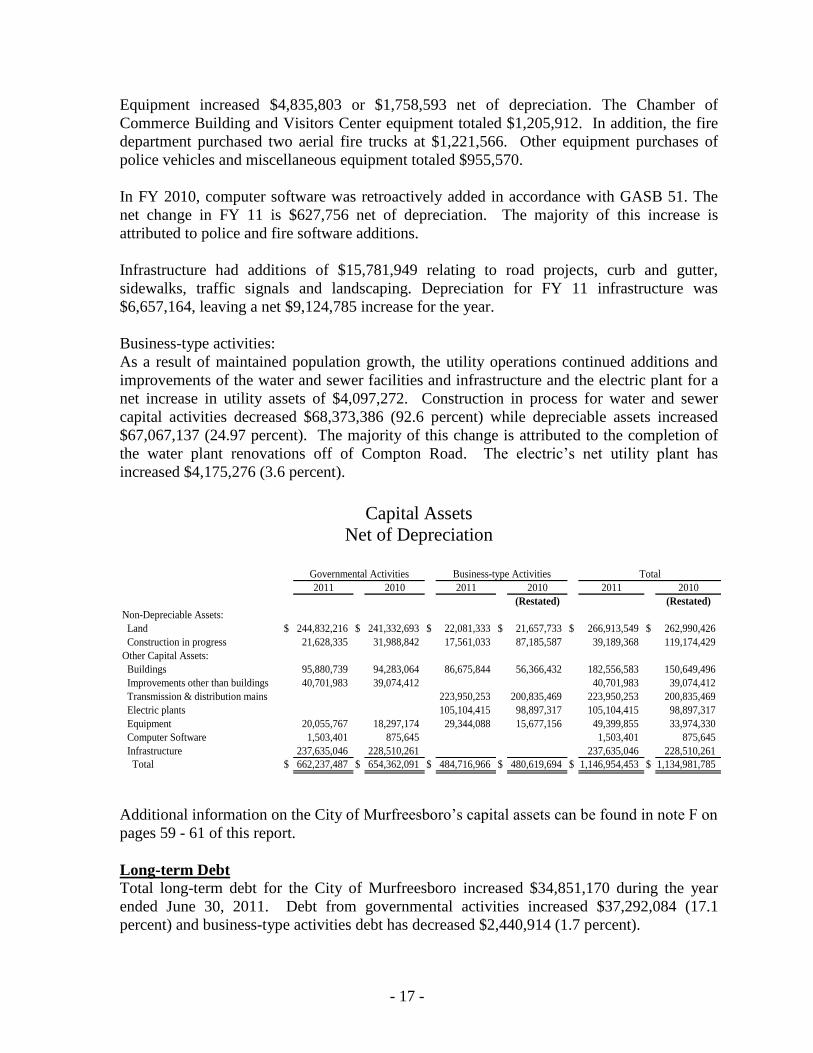
- 17 -
Equipment increased $4,835,803 or $1,758,593 net of depreciation. The Chamber of
Commerce Building and Visitors Center equipment totaled $1,205,912. In addition, the fire
department purchased two aerial fire trucks at $1,221,566. Other equipment purchases of
police vehicles and miscellaneous equipment totaled $955,570.
In FY 2010, computer software was retroactively added in accordance with GASB 51. The
net change in FY 11 is $627,756 net of depreciation. The majority of this increase is
attributed to police and fire software additions.
Infrastructure had additions of $15,781,949 relating to road projects, curb and gutter,
sidewalks, traffic signals and landscaping. Depreciation for FY 11 infrastructure was
$6,657,164, leaving a net $9,124,785 increase for the year.
Business-type activities:
As a result of maintained population growth, the utility operations continued additions and
improvements of the water and sewer facilities and infrastructure and the electric plant for a
net increase in utility assets of $4,097,272. Construction in process for water and sewer
capital activities decreased $68,373,386 (92.6 percent) while depreciable assets increased
$67,067,137 (24.97 percent). The majority of this change is attributed to the completion of
the water plant renovations off of Compton Road. The electric’s net utility plant has
increased $4,175,276 (3.6 percent).
Capital Assets
Net of Depreciation
2011 2010 2011 2010 2011 2010
(Restated) (Restated)
Non-Depreciable Assets:
Land $ 244,832,216 $ 241,332,693 $ 22,081,333 $ 21,657,733 $ 266,913,549 $ 262,990,426
Construction in progress 21,628,335 31,988,842 17,561,033 87,185,587 39,189,368 119,174,429
Other Capital Assets:
Buildings 95,880,739 94,283,064 86,675,844 56,366,432 182,556,583 150,649,496
Improvements other than buildings 40,701,983 39,074,412 40,701,983 39,074,412
Transmission & distribution mains 223,950,253 200,835,469 223,950,253 200,835,469
Electric plants 105,104,415 98,897,317 105,104,415 98,897,317
Equipment 20,055,767 18,297,174 29,344,088 15,677,156 49,399,855 33,974,330
Computer Software 1,503,401 875,645 1,503,401 875,645
Infrastructure 237,635,046 228,510,261 237,635,046 228,510,261
Total $ 662,237,487 $ 654,362,091 $ 484,716,966 $ 480,619,694 $ 1,146,954,453 $ 1,134,981,785
Governmental Activities Business-type Activities Total
Additional information on the City of Murfreesboro’s capital assets can be found in note F on
pages 59 - 61 of this report.
Long-term Debt
Total long-term debt for the City of Murfreesboro increased $34,851,170 during the year
ended June 30, 2011. Debt from governmental activities increased $37,292,084 (17.1
percent) and business-type activities debt has decreased $2,440,914 (1.7 percent).

- 18 -
The City acquired a loan in November 2010 with the assistance of the Tennessee Municipal
Bond Fund and the 2.89 percent interest rate was privately negotiated. Along with other
fixed rate debt, including refinanced variable rate debt, the governmental funds have 45.5
percent of its debt in fixed rates.
The City has 54.5 percent of its governmental long-term debt in the form of variable rate
loans from the Tennessee Municipal Bond Fund (TMBF); the variable interest rate varies by
loan and the rates as of June 30, 2011 ranged from 0.37 percent to .57 percent for
governmental activities. The 2008 TML loan is the only active variable loan and requires a
draw down from a third-party administrator as the money is needed for reimbursement.
Street construction and improvements are the dominant governmental uses of the current
loans in process. A new debt issuance will be discussed as management works through the
capital improvement projects in January/February 2012 as submitted by the City departments
for consideration.
The Water and Sewer Department long term debt decreased by $6,686,818 during FY 11.
The Electric Department drew down $6,871,491 from the Tennessee Municipal Bond Fund
2007 loan issue in order to fund capital projects including additions and renovations to the
Jones Boulevard Substation. The net change to the Electric Department’s long term debt was
an increase of $3,393,669.
The Electric Department anticipates additional borrowing of approximately $10-15 million
over the next 3 years for construction of substations in the Gateway, South/Joe B. Jackson
and West/Veteran’s Parkway areas.
Additional information on the City of Murfreesboro’s long-term liabilities can be found in
note G on pages 61 - 65 of this report.
The City adopted the requirements of GASB Statement No. 45 in FY 08 regarding post-
employment benefits which recognizes the cost of post-employment benefits in the year
when the employee services are received, reports the accumulated liability from prior years,
and provides information useful in assessing potential demands on the City’s future cash
flows. Prior year liabilities are being recognized over a 30 year period and, together with
current benefits earned, the liability recognized through June 30, 2011 is $25,072,673, an
increase of $6,593,272 (35.7 percent) from the previous year. The benefits offered to the
governmental and water and sewer employees are on an annual basis, with an option to
cancel, modify or reduce benefits by authority of the City Council and are currently funded
on current benefits only. As a part of the budget process, the Council decides if they are
going to continue to offer this benefit to retirees. The electric department has its own
administered plan and only current benefits are being funded under that plan as well. The
city schools’ plan is administered by the State of Tennessee. Additional information on the
City of Murfreesboro’s post-employment benefits can be found in note K on pages 72 - 77 of
this report.
The following table has comparative information for governmental and business-type
activities.

- 19 -
Long-term Debt Outstanding
June 30, 2011
2011 2010 2011 2010 2011 2010
General obligation bonds $ 45,510,000 $ 54,851,875 $ 363,125 $ 45,510,000 $ 55,215,000
Add: Premium on refunding 5,378,343 5,975,937 5,378,343 5,975,937
Tennessee Municipal Bond Fund loans 167,584,136 126,243,230 $ 47,378,691 42,903,203 214,962,827 169,146,433
Revenue bonds 46,290,000 51,270,000 46,290,000 51,270,000
Add: Premium on refunding 2,639,014 2,878,792 2,639,014 2,878,792
Matured bonds payable 36,000 36,000 36,000 36,000
Less: Deferred amounts (98,107) (104,576) (98,107) (104,576)
Capital Lease Obligation 403,894 403,894
Capital outlay notes 2,354,350 2,578,350 2,354,350 2,578,350
State revolving loan 35,581,591 38,366,654 35,581,591 38,366,654
Estimated landfill closure costs 1,425,000 1,425,000 1,425,000 1,425,000
Compensated absences 7,067,721 6,668,923 3,094,260 2,901,893 10,161,981 9,570,816
Post-employment benefit obligation 20,061,653 14,854,698 5,011,020 3,624,703 25,072,673 18,479,401
Loans payable - Utility plant acquisition 829,841 963,430 829,841 963,430
Claims and judgements 5,984,000 5,879,000 5,984,000 5,879,000
$ 255,769,097 $ 218,477,013 $ 140,762,310 $ 143,203,224 $ 396,531,407 $ 361,680,237
Governmental Activities Business-type Activities Total
ECONOMIC FACTORS AND NEXT YEAR’S BUDGET
The City of Murfreesboro continues to be one of the fastest growing areas in the State of
Tennessee. Murfreesboro is the home of Middle Tennessee State University which is the
largest undergraduate school in the state of Tennessee. The City continues to make street
improvements leading to and around the University campus. The City is fortunate to have a
good working relationship with the leaders of the University and partners with them in many
community projects to benefit the welfare of its students and our citizens. Their athletic
facilities are used to draw tourism dollars to Murfreesboro when the City hosts high school
tournaments through a contract with Tennessee Secondary School Athletic Association and
the Chamber of Commerce. These events have a significant impact on the local economy.
The City has several projects on the horizon that we feel will be for the betterment of service
delivery, both to our external customers as well as our staff. One of these projects is the
development of an Information Technology Department. This project is intended to bring
together our talented staff members under one department to allow them to become more
cohesive in the manner in which the City's software, hardware and upgrades to technology
are managed. The first major project of this department will be to assist in the replacement of
many of our software packages beginning with our General Ledger, Payroll and Human
Resources, Fixed Assets and Court packages. We feel this software replacement package will
give our employees the ability to work more efficiently and provide opportunities for better
service delivery. Management will strive to get software that is the best fit for our
organization while trying to minimize, to the extent possible, the impact on our budget. The
timeframe for this project will be determined after the new department director is hired.
Our engineers have been heavily involved in major road projects in and around the City.
Street projects (including land costs associated with the new infrastructure) of $18,181,263

- 20 -
were completed and capitalized in FY 11. Major construction-in-progress projects include
construction of Maney Avenue improvements, as well as a zoning study for the Maney
Avenue area. The City is constructing new phases of the road project named Veteran’s
Parkway Phase 2A from Barfield Crescent Park to Barfield Road which, once complete, will
connect roads near interstate exits and State Route 840. This loop on the southwest side of
Murfreesboro is expected to increase development in this area of Murfreesboro because of
the access it will afford to commercial and local traffic. The Joe B. Jackson Parkway is a
road project being developed to connect Interstate 24 to Highway 231. Phase 2 of this project
is currently in the planning phase including purchasing right-of-way, and upon completion
this project should help manage traffic that is causing congestion on Highway 231. The City
is currently waiting on final right of way certifications to be followed by a notice to proceed
with construction. Additionally, the City engineers are working with staff of the stormwater
fund to manage drainage problems in our city.
In conjunction with federal grants (80 percent funding) the City has also continued work on
its greenway system. The Greenway Phase 3 opened in the spring of 2011. The Greenway
Phase 4 extension to Barfield Crescent Park is expected to be bid in the spring of 2012.
Appraisals of right of way acquisitions are currently under review, as well.
The economy appeared to have begun a slow rebound at the time planning began for the
2012 fiscal year budget. Staff re-evaluated departmental projects and their expected
timelines. As in the year before, employee vacancies were evaluated carefully to determine if
they could be deleted and responsibilities redistributed. In addition, the City’s Classification
and Compensation Plan was updated by Burris and Associates for the first time since 2004.
The pay plan targets the 60th
percentile of the salary survey data for comparable jobs in other
municipalities instead of the average or 50th
percentile. In order to remain competitive, it
was recommended that the City drop the first step and add a new top step. This
recommendation increased entry level pay and top out pay for all positions by 3.5 percent.
City Council approved this recommendation, making the updated pay plan effective July 1,
2011.
The City Manager continues to closely monitor large purchases and projects as well as all
hiring decisions. During the first five months of the 2011-2012 fiscal year, our local option
sales tax dollars are approximately $1 million more than last year for the same time period
and approximately $0.5 million than budgeted. In addition, local beer and liquor taxes have
increased by approximately $75,000 combined for the first five months of the fiscal year
compared to FY 11 and by approximately $67,000 combined as compared to budget. Our
position in middle Tennessee has helped insulate our community from many of the problems
that those counties that border our state have experienced as a result of residents going across
the state-line to buy their goods. In this uncertain economy, many residents continue to be
careful with spending their discretionary dollars.
With the hiring of a new collection agency, it is anticipated that collection of court fines will
improve. Steps are being taken to collect delinquent fines from previous fiscal years while
maintaining a better collection of current receivables. Additionally, our new automated red
light camera enforcement contract includes incentives for the vendor to improve collections
of newly issued citations. Our legal department is also currently working on amending our

- 21 -
previously bid contract to include the collection of delinquent citations. The goal for FY 12 is
to reduce court receivables by 25 percent.
In FY 12, many of our American Recovery and Reinvestment Act (ARRA) grants will be
coming to a close, with the exception of reporting requirements. In an effort to find and
manage state and federal grants of the City, a new software package is being leased
beginning in FY 12. It is possible to recoup, in value, the cost of the software if just one new
grant is obtained to assist the City. It also has the capability to guide staff to be sure reporting
is done timely.
Our Building and Codes Department is working with various City Hall departments in FY 12
to manage and oversee the implementation of the Energy Efficient Block Grant through the
Department of Energy. The work done through this stimulus grant is expected to save the
City thousands of dollars in energy savings annually in our lighting and cooling/heating
costs. The impact on the FY 12 budget should begin in the later part of the fiscal year.
In the fall of 2011, Amazon announced plans to open two new fulfillment centers in
Tennessee, one of which will be in Murfreesboro. The centers are expected to bring a $135
million investment to the state as well as over 1,200 jobs to the City. As part of this project,
the City Council authorized a construction project which totals $7,227,046. The City
received a Fast Track grant from the State of Tennessee of $3,500,000 to partially fund the
construction project. The balance of the project will be paid by Amazon. In addition, the
State of Tennessee granted the City $1,316,503 for construction of a turn lane on Joe B.
Jackson Parkway, a new four lane public street to provide additional access to Amazon and
NHK Seating and the cost of signalizing two intersections leading to the Amazon and NHK
Seating facilities. So, while the City will reap the rewards of additional property tax
revenues, sales tax revenues and jobs, there will be little to no expected financial contribution
by the City.
During the last quarter of FY 11, the Human Resources Department worked with a consultant
to bid and select new insurance contracts for the City, including medical, dental, life, and
accidental death and dismemberment (AD&D). The City is confident savings will be realized
for life and AD&D currently paid for through our Defined Pension Plan, and will monitor
health and dental plans with the information regarding costs our new administrator has been
contracted to provide. In FY 13, it is anticipated we will pay these costs out of the General
Fund rather than the Pension Plan to be consistent with where costs for participants in the
Defined Contribution Plan are recorded.
The City will evaluate and adjust, if necessary, its Defined Benefit Pension Plan assumptions
during FY 12 to be effective in FY 13. At this time, the plan continues to be stable and
funded at actuarially prescribed rates. The recommended percentage of salary for the plan
participants increased from 12.17 percent to 12.57 percent in FY 12, which was budgeted and
implemented effective July 1, 2011.
The rising costs of replacement for an aging infrastructure as well as increased costs of
commodities such as electricity, natural gas and chemicals influence the cost of water and
sewer services and, in effect, costs to customers, as well. While rates are projected to remain
- 22 -
flat in FY 12, the reduction in minimum bill allowances is expected to continue. This is
expected to result in higher revenues with lower consumption.
Based on the 2007 Cost of Service study, the reduction of the minimum bill allowance for
FY 12 should result in an increase to sales revenues by $1,260,000. In addition, management
expects sewer sales to grow while water sales will remain relatively flat. The increased
sewer sales will come from Consolidated Utility Department (CUD) customers.
Based on results from the Hazen and Sawyer study, the Southwest Regional Pumping Station
and force main as well as a new headworks building at the Sinking Creek Wastewater
Treatment Plant are all being prepared for bid in FY 12. In addition, several replacement and
reconstruction commitments totaling $5 million of working capital are committed from the
department’s working capital reserves.
TVA initiated a wholesale rate redesign which is driving the market towards a seasonal, time
of use, rate structure that became effective April 1, 2011. In addition, TVA is moving
towards a demand and energy wholesale structure rather than the current set-up which
account for sales under the wholesale methodology. This change will likely equate to the
Electric Department assuming more financial risk and the possibility of negative net income
a couple of months out of each fiscal year is highly likely. This restructuring is intended to
more accurately charge customers for their usage. Customers will see the highest charges in
the summer, mid-level charges in the winter, and the lowest charges should be in the spring
and fall. This approach will give customers the opportunity to shift their usage patterns to
lower their overall bill.
The Electric Department expects customer growth to remain relatively flat and sales growth
to decrease slightly in FY 12. At this time, a local rate increase is not expected. However,
TVA announced a 2 percent wholesale increase effective October 1, 2011. This increase will
be passed to the Electric Department’s customers.
REQUESTS FOR INFORMATION
This financial report is designed to provide a general overview of the City of Murfreesboro’s
finances for all those with an interest in the government’s finances. Questions concerning
any of the information provided in this report or requests for additional financial information
should be addressed to the Office of the Finance Director, P.O. Box 1139, Murfreesboro, TN
37133-1139.

Cash and cash equivalents $ 66,127,965 $ 38,901,639 $ 105,029,604 Certificates of deposit 369,534 369,534 Receivables, net of allowance for uncollectibles 67,399,862 18,193,580 85,593,442 Internal balances (2,636,704) 2,636,704 Inventories 562,391 2,796,953 3,359,344 Prepaid items and other assets 49,717 403,788 453,505 Deferred charges 1,228,899 1,301,488 2,530,387 Restricted assets -
Cash and cash equivalents 31,449,226 25,118,563 56,567,789 Certificate of deposit 500,000 500,000 Investments, at fair value 1,787,633 1,787,633
Capital assets - Land and construction in progress 266,460,551 39,642,366 306,102,917 Other capital assets, net of depreciation 395,776,936 445,074,600 840,851,536
Total Assets $ 829,076,010 $ 574,069,681 $ 1,403,145,691
Accounts payable and accrued expenses $ 11,743,194 $ 22,994,116 $ 34,737,310 Net pension obligation 31,740 31,740 Unearned revenue 48,909,600 48,909,600 Deposits held 1,687,086 5,888,049 7,575,135 Other deposits 38,129 38,129 Matured bond interest payable 806 806 Other liabilities 50,475 1,577,988 1,628,463 Long-term liabilities -
Due within one year 26,108,980 10,902,803 37,011,783 Due in more than one year 229,660,117 129,859,507 359,519,624
Total Liabilities $ 318,230,127 $ 171,222,463 $ 489,452,590
Invested in capital assets, net of related debt $ 478,989,381 $ 349,921,094 $ 828,910,475 Restricted for -
Education 6,792,410 6,792,410 Capital activity and debt service 6,253,583 25,118,563 31,372,146 Highways and streets 1,796,360 1,796,360 Law enforcement 452,357 452,357 Other purposes 117,416 117,416 Perpetual care -
Expendable 228,943 228,943 Nonexpendable 1,675,280 1,675,280
Unrestricted 14,540,153 27,807,561 42,347,714 Total Net Assets $ 510,845,883 $ 402,847,218 $ 913,693,101
See notes to financial statements.
Business-TypeActivities
NET ASSETS
CITY OF MURFREESBORO, TENNESSEE
Statement of Net Assets
June 30, 2011
LIABILITIES
ASSETS
TotalActivitiesGovernmental
- 23 -
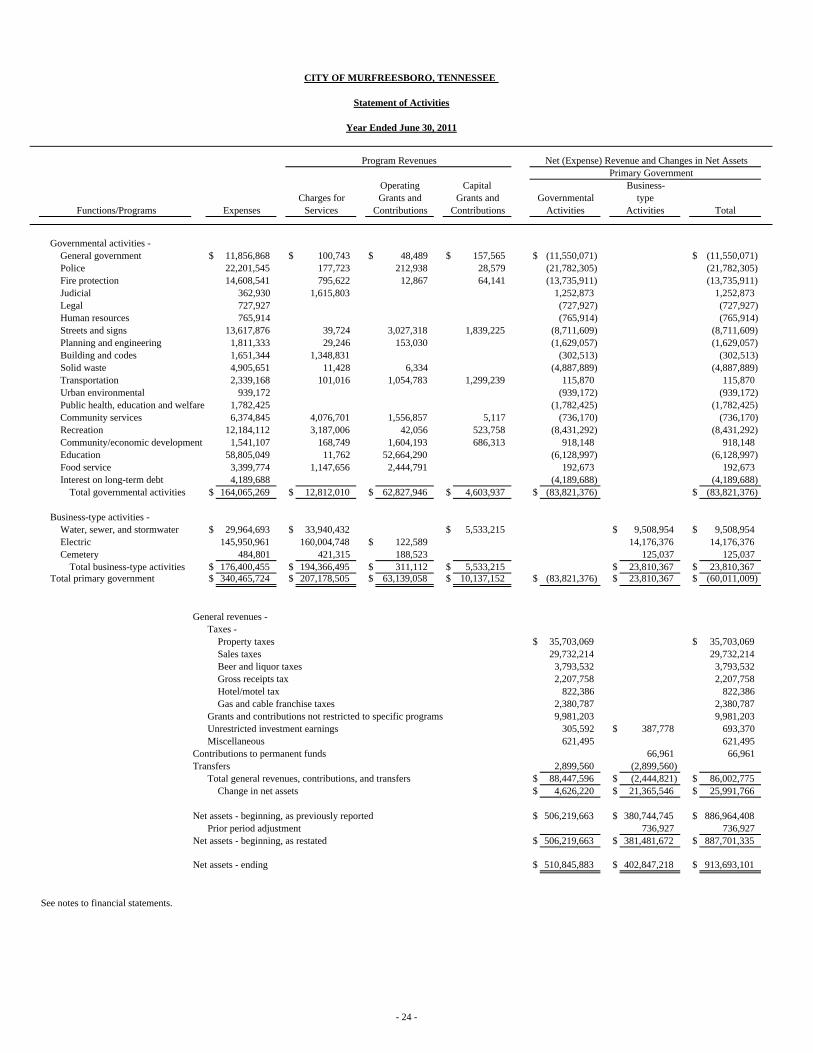
Governmental activities - General government $ 11,856,868 $ 100,743 $ 48,489 $ 157,565 $ (11,550,071) $ (11,550,071) Police 22,201,545 177,723 212,938 28,579 (21,782,305) (21,782,305) Fire protection 14,608,541 795,622 12,867 64,141 (13,735,911) (13,735,911) Judicial 362,930 1,615,803 1,252,873 1,252,873 Legal 727,927 (727,927) (727,927) Human resources 765,914 (765,914) (765,914) Streets and signs 13,617,876 39,724 3,027,318 1,839,225 (8,711,609) (8,711,609) Planning and engineering 1,811,333 29,246 153,030 (1,629,057) (1,629,057) Building and codes 1,651,344 1,348,831 (302,513) (302,513) Solid waste 4,905,651 11,428 6,334 (4,887,889) (4,887,889) Transportation 2,339,168 101,016 1,054,783 1,299,239 115,870 115,870 Urban environmental 939,172 (939,172) (939,172) Public health, education and welfare 1,782,425 (1,782,425) (1,782,425) Community services 6,374,845 4,076,701 1,556,857 5,117 (736,170) (736,170) Recreation 12,184,112 3,187,006 42,056 523,758 (8,431,292) (8,431,292) Community/economic development 1,541,107 168,749 1,604,193 686,313 918,148 918,148 Education 58,805,049 11,762 52,664,290 (6,128,997) (6,128,997) Food service 3,399,774 1,147,656 2,444,791 192,673 192,673 Interest on long-term debt 4,189,688 (4,189,688) (4,189,688)
Total governmental activities $ 164,065,269 $ 12,812,010 $ 62,827,946 $ 4,603,937 $ (83,821,376) $ (83,821,376)
Business-type activities - Water, sewer, and stormwater $ 29,964,693 $ 33,940,432 $ 5,533,215 $ 9,508,954 $ 9,508,954 Electric 145,950,961 160,004,748 $ 122,589 14,176,376 14,176,376 Cemetery 484,801 421,315 188,523 125,037 125,037
Total business-type activities $ 176,400,455 $ 194,366,495 $ 311,112 $ 5,533,215 $ 23,810,367 $ 23,810,367 Total primary government $ 340,465,724 $ 207,178,505 $ 63,139,058 $ 10,137,152 $ (83,821,376) $ 23,810,367 $ (60,011,009)
General revenues - Taxes -
Property taxes $ 35,703,069 $ 35,703,069 Sales taxes 29,732,214 29,732,214 Beer and liquor taxes 3,793,532 3,793,532 Gross receipts tax 2,207,758 2,207,758 Hotel/motel tax 822,386 822,386 Gas and cable franchise taxes 2,380,787 2,380,787
Grants and contributions not restricted to specific programs 9,981,203 9,981,203 Unrestricted investment earnings 305,592 $ 387,778 693,370 Miscellaneous 621,495 621,495
Contributions to permanent funds 66,961 66,961 Transfers 2,899,560 (2,899,560)
Total general revenues, contributions, and transfers $ 88,447,596 $ (2,444,821) $ 86,002,775 Change in net assets $ 4,626,220 $ 21,365,546 $ 25,991,766
Net assets - beginning, as previously reported $ 506,219,663 $ 380,744,745 $ 886,964,408 Prior period adjustment 736,927 736,927
Net assets - beginning, as restated $ 506,219,663 $ 381,481,672 $ 887,701,335
Net assets - ending $ 510,845,883 $ 402,847,218 $ 913,693,101
See notes to financial statements.
typeFunctions/Programs Expenses Services
Charges forContributions
Grants andOperatingGrants and
Primary Government
Contributions Total
Capital
ActivitiesGovernmental
Business-
Activities
Net (Expense) Revenue and Changes in Net AssetsProgram Revenues
CITY OF MURFREESBORO, TENNESSEE
Statement of Activities
Year Ended June 30, 2011
- 24 -
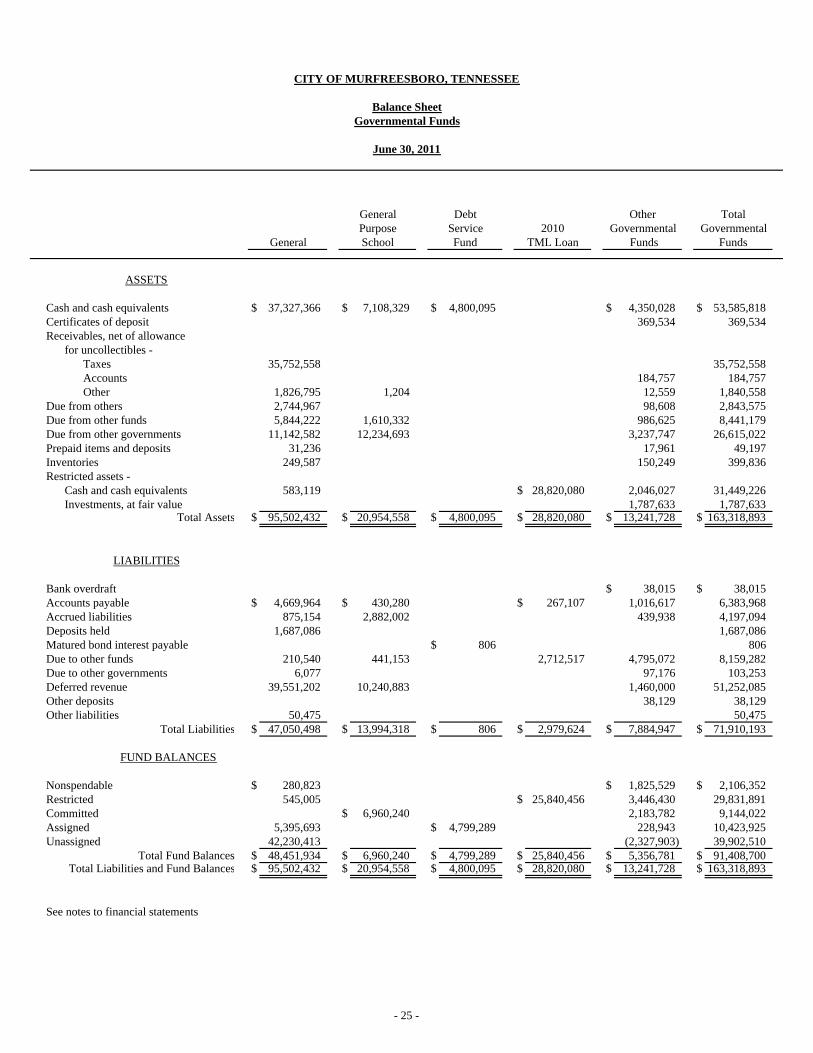
ASSETS
Cash and cash equivalents $ 37,327,366 $ 7,108,329 $ 4,800,095 $ 4,350,028 $ 53,585,818Certificates of deposit 369,534 369,534Receivables, net of allowance
for uncollectibles - Taxes 35,752,558 35,752,558Accounts 184,757 184,757Other 1,826,795 1,204 12,559 1,840,558
Due from others 2,744,967 98,608 2,843,575Due from other funds 5,844,222 1,610,332 986,625 8,441,179Due from other governments 11,142,582 12,234,693 3,237,747 26,615,022Prepaid items and deposits 31,236 17,961 49,197Inventories 249,587 150,249 399,836
Restricted assets - Cash and cash equivalents 583,119 $ 28,820,080 2,046,027 31,449,226
Investments, at fair value 1,787,633 1,787,633Total Assets $ 95,502,432 $ 20,954,558 $ 4,800,095 $ 28,820,080 $ 13,241,728 $ 163,318,893
LIABILITIES
Bank overdraft $ 38,015 $ 38,015Accounts payable $ 4,669,964 $ 430,280 $ 267,107 1,016,617 6,383,968Accrued liabilities 875,154 2,882,002 439,938 4,197,094Deposits held 1,687,086 1,687,086Matured bond interest payable $ 806 806Due to other funds 210,540 441,153 2,712,517 4,795,072 8,159,282Due to other governments 6,077 97,176 103,253Deferred revenue 39,551,202 10,240,883 1,460,000 51,252,085Other deposits 38,129 38,129Other liabilities 50,475 50,475
Total Liabilities $ 47,050,498 $ 13,994,318 $ 806 $ 2,979,624 $ 7,884,947 $ 71,910,193
FUND BALANCES
Nonspendable $ 280,823 $ 1,825,529 $ 2,106,352Restricted 545,005 $ 25,840,456 3,446,430 29,831,891Committed $ 6,960,240 2,183,782 9,144,022Assigned 5,395,693 $ 4,799,289 228,943 10,423,925Unassigned 42,230,413 (2,327,903) 39,902,510
Total Fund Balances $ 48,451,934 $ 6,960,240 $ 4,799,289 $ 25,840,456 $ 5,356,781 $ 91,408,700 Total Liabilities and Fund Balances $ 95,502,432 $ 20,954,558 $ 4,800,095 $ 28,820,080 $ 13,241,728 $ 163,318,893
See notes to financial statements
Governmental Funds
2010TML LoanSchool
PurposeGeneral
ServiceFund
GovernmentalFunds
CITY OF MURFREESBORO, TENNESSEE
Balance SheetGovernmental Funds
General Other Total
June 30, 2011
Debt
- 25 -

Total Governmental Fund Balances $ 91,408,700
Amounts reported for governmental activities in the statement of net assets are different because:
Capital assets used in governmental activities are not financial resources and, therefore, are not reported in the funds. 662,237,487
Internal service funds are used by management to charge costs of employee health insurance, worker's compensation benefits, liability insurance, and fleet and equipment maintenance to individual funds. The assets and liabilities of the internal service funds are included in governmental activities in the statement of net assets. 6,297,895
Charges are made by the general fund to other funds for costs of certain salaries and overhead costs. Internal balances related to charges to business-type funds are eliminated in the government-wide statements. (2,852,733)
Prepaid pension costs are not available for current-period expenditures and, therefore, are not reported in the funds. (31,740)
Other assets are not available to pay for current-period expenditures and, therefore, are deferred or not reported in the funds. 3,571,371
Long-term liabilities, including bonds and loans payable, are not due and payable in the current period and, therefore, are not reported in the funds. (249,785,097)
Net Assets of Governmental Activities $ 510,845,883
See notes to financial statements.
to Net Assets of Governmental Activities
CITY OF MURFREESBORO, TENNESSEE
Reconciliation of Total Governmental Fund Balances
June 30, 2011
- 26 -
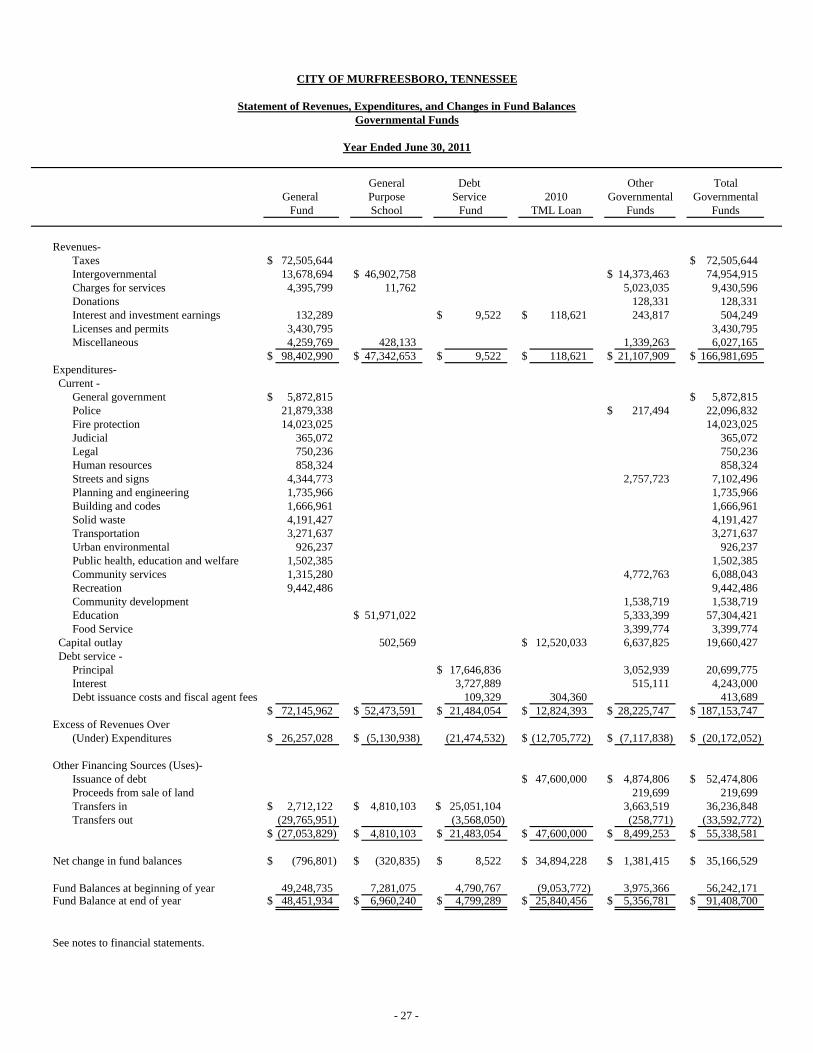
Revenues- Taxes $ 72,505,644 $ 72,505,644Intergovernmental 13,678,694 $ 46,902,758 $ 14,373,463 74,954,915Charges for services 4,395,799 11,762 5,023,035 9,430,596Donations 128,331 128,331Interest and investment earnings 132,289 $ 9,522 $ 118,621 243,817 504,249Licenses and permits 3,430,795 3,430,795Miscellaneous 4,259,769 428,133 1,339,263 6,027,165
$ 98,402,990 $ 47,342,653 $ 9,522 $ 118,621 $ 21,107,909 $ 166,981,695Expenditures- Current -
General government $ 5,872,815 $ 5,872,815Police 21,879,338 $ 217,494 22,096,832Fire protection 14,023,025 14,023,025Judicial 365,072 365,072Legal 750,236 750,236Human resources 858,324 858,324Streets and signs 4,344,773 2,757,723 7,102,496Planning and engineering 1,735,966 1,735,966Building and codes 1,666,961 1,666,961Solid waste 4,191,427 4,191,427Transportation 3,271,637 3,271,637Urban environmental 926,237 926,237Public health, education and welfare 1,502,385 1,502,385Community services 1,315,280 4,772,763 6,088,043Recreation 9,442,486 9,442,486Community development 1,538,719 1,538,719Education $ 51,971,022 5,333,399 57,304,421Food Service 3,399,774 3,399,774
Capital outlay 502,569 $ 12,520,033 6,637,825 19,660,427 Debt service -
Principal $ 17,646,836 3,052,939 20,699,775Interest 3,727,889 515,111 4,243,000Debt issuance costs and fiscal agent fees 109,329 304,360 413,689
$ 72,145,962 $ 52,473,591 $ 21,484,054 $ 12,824,393 $ 28,225,747 $ 187,153,747Excess of Revenues Over
(Under) Expenditures $ 26,257,028 $ (5,130,938) (21,474,532) $ (12,705,772) $ (7,117,838) $ (20,172,052)
Other Financing Sources (Uses)- Issuance of debt $ 47,600,000 $ 4,874,806 $ 52,474,806Proceeds from sale of land 219,699 219,699Transfers in $ 2,712,122 $ 4,810,103 $ 25,051,104 3,663,519 36,236,848Transfers out (29,765,951) (3,568,050) (258,771) (33,592,772)
$ (27,053,829) $ 4,810,103 $ 21,483,054 $ 47,600,000 $ 8,499,253 $ 55,338,581
Net change in fund balances $ (796,801) $ (320,835) $ 8,522 $ 34,894,228 $ 1,381,415 $ 35,166,529
Fund Balances at beginning of year 49,248,735 7,281,075 4,790,767 (9,053,772) 3,975,366 56,242,171Fund Balance at end of year $ 48,451,934 $ 6,960,240 $ 4,799,289 $ 25,840,456 $ 5,356,781 $ 91,408,700
See notes to financial statements.
FundsGovernmental
TotalPurposeSchool
2010TML Loan
OtherGovernmental
Funds
CITY OF MURFREESBORO, TENNESSEE
Statement of Revenues, Expenditures, and Changes in Fund Balances
Year Ended June 30, 2011
Governmental Funds
Debt Service
FundGeneral
Fund
General
- 27 -
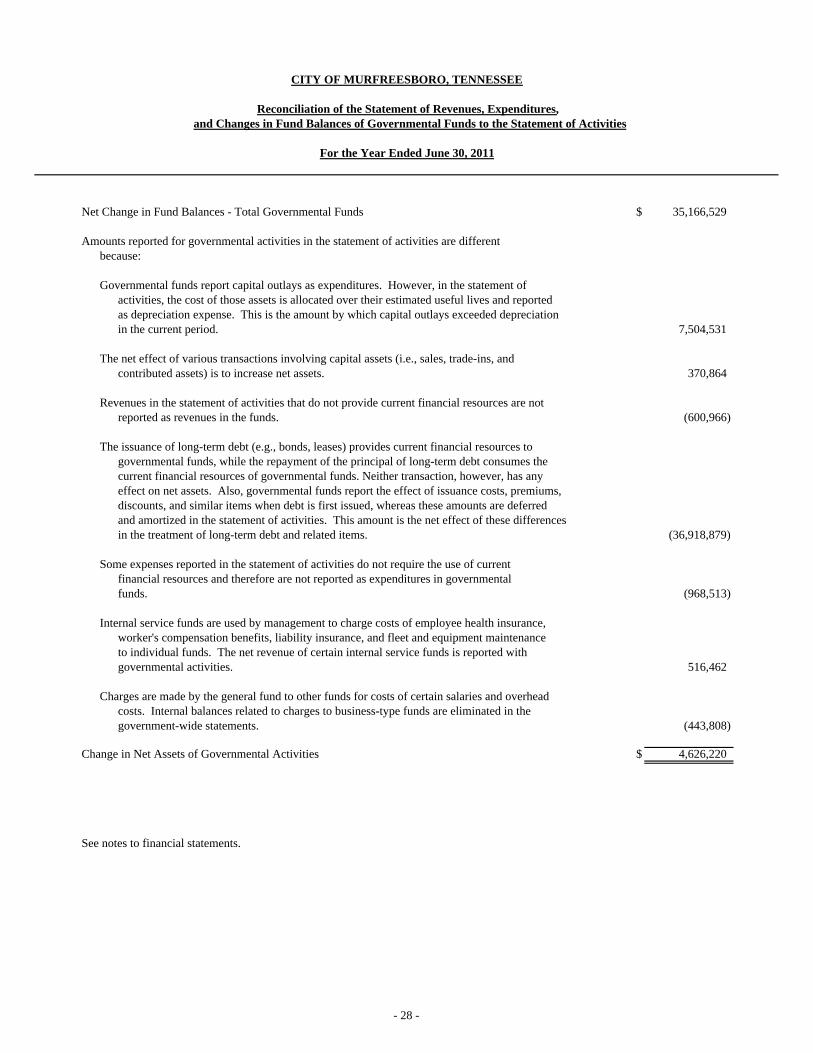
Net Change in Fund Balances - Total Governmental Funds $ 35,166,529
Amounts reported for governmental activities in the statement of activities are different because:
Governmental funds report capital outlays as expenditures. However, in the statement of activities, the cost of those assets is allocated over their estimated useful lives and reported as depreciation expense. This is the amount by which capital outlays exceeded depreciation in the current period. 7,504,531
The net effect of various transactions involving capital assets (i.e., sales, trade-ins, and contributed assets) is to increase net assets. 370,864
Revenues in the statement of activities that do not provide current financial resources are not reported as revenues in the funds. (600,966)
The issuance of long-term debt (e.g., bonds, leases) provides current financial resources to governmental funds, while the repayment of the principal of long-term debt consumes the current financial resources of governmental funds. Neither transaction, however, has any effect on net assets. Also, governmental funds report the effect of issuance costs, premiums, discounts, and similar items when debt is first issued, whereas these amounts are deferred and amortized in the statement of activities. This amount is the net effect of these differences in the treatment of long-term debt and related items. (36,918,879)
Some expenses reported in the statement of activities do not require the use of current financial resources and therefore are not reported as expenditures in governmental funds. (968,513)
Internal service funds are used by management to charge costs of employee health insurance, worker's compensation benefits, liability insurance, and fleet and equipment maintenance to individual funds. The net revenue of certain internal service funds is reported with governmental activities. 516,462
Charges are made by the general fund to other funds for costs of certain salaries and overhead costs. Internal balances related to charges to business-type funds are eliminated in the government-wide statements. (443,808)
Change in Net Assets of Governmental Activities $ 4,626,220
See notes to financial statements.
and Changes in Fund Balances of Governmental Funds to the Statement of Activities
CITY OF MURFREESBORO, TENNESSEE
Reconciliation of the Statement of Revenues, Expenditures,
For the Year Ended June 30, 2011
- 28 -

CITY OF MURFREESBORO, TENNESSEE
General Fund
Statement of Revenues, Expenditures and Changes in Fund Balance Budget (GAAP Basis) and Actual
Year Ended June 30, 2011
Variance withFinal Budget
Budget Actual (Negative)
Revenues -
Taxes - Property $ 33,479,421 $ 33,479,421 $ 33,368,360 $ (111,061) Property in lieu of taxes -
Public utilities 698,665 698,665 721,812 23,147 Murfreesboro Housing Authority 65,000 65,000 93,197 28,197 Other tax equivalents 617,500 617,500 768,347 150,847
Recovery of taxes deemed uncollectible 450,000 450,000 506,023 56,023 Penalty and interest on taxes 175,000 175,000 269,499 94,499 Other local taxes -
Sales tax 27,970,000 27,970,000 29,732,214 1,762,214 Beer tax 2,725,000 2,725,000 2,912,207 187,207 Liquor tax 712,000 712,000 793,004 81,004 Gross receipts tax 1,938,000 1,938,000 2,430,274 492,274 Beer privilege tax 22,000 22,000 27,037 5,037 Liquor privilege tax 50,000 50,000 61,284 11,284 Hotel/motel tax 752,000 752,000 822,386 70,386
$ 69,654,586 $ 69,654,586 $ 72,505,644 $ 2,851,058
Licenses, Permits and Fines - Electrical licenses $ 70,000 $ 70,000 $ 67,880 $ (2,120) Gas and mechanical licenses 5,000 5,000 6,670 1,670Building permits 1,100,000 1,100,000 855,936 (244,064) Plumbing permits 103,000 103,000 61,673 (41,327) Electrical permits 215,000 215,000 179,170 (35,830) Mechanical permits 92,000 92,000 78,164 (13,836) Gas permits 13,000 13,000 12,625 (375)Land disturbance permits 20,000 20,000 16,250 (3,750)Fireworks permits 500 500 8,000 7,500 Beer application fees 12,000 12,000 14,100 2,100 Burglar alarm permits 54,000 54,000 55,360 1,360 Plat review fee 29,900 29,900 46,077 16,177 Other fees 1,000 1,000 1,196 196 Attorney tax fees 15,000 15,000 29,528 14,528 Court fines 1,895,000 1,895,000 1,541,912 (353,088) Red light cameras 800,000 800,000 434,637 (365,363)Burglar false alarm fees 15,000 15,000 17,485 2,485 Other fines and fees 4,132 4,132
$ 4,440,400 $ 4,440,400 $ 3,430,795 $ (1,009,605)
(continued)
FinalBudget
PositiveOriginal
- 29 -

CITY OF MURFREESBORO, TENNESSEE
General Fund
Statement of Revenues, Expenditures and Changes in Fund Balance (continued)Budget (GAAP Basis) and Actual
Year Ended June 30, 2011
Variance withFinal Budget
Budget Budget (Negative)
Intergovernmental Revenues - Rutherford County $ 347,031 $ 347,031 $ 365,535 $ 18,504 State sales tax allocation 6,486,500 6,486,500 6,720,967 234,467 State beer tax allocation 52,000 52,000 52,469 469 State gasoline tax allocation 215,000 215,000 216,483 1,483 State mixed drink tax 545,000 545,000 658,590 113,590 State gross receipts tax 1,125,000 1,125,000 1,132,786 7,786 State income tax allocation 800,000 800,000 587,087 (212,913) State excise tax 85,000 85,000 32,890 (52,110) State maintenance of streets 277,288 277,288 277,288 State funds 356,867 356,867 276,428 (80,439)Federal funds 4,594,784 4,594,784 3,358,171 (1,236,613)
$ 14,884,470 $ 14,884,470 $ 13,678,694 $ (1,205,776)
Charges for services Office $ 150 $ 150 $ 470 $ 320 Planning department 25,800 25,800 29,246 3,446 Police department 12,000 12,000 14,858 2,858 Fire department 786,096 786,096 795,622 9,526 Street department 28,500 28,500 31,284 2,784 Building department 33,000 33,000 24,386 (8,614) Urban Environmental department 7,000 7,000 (7,000)G.I.S. maintenance 28,500 28,500 24,909 (3,591)Public Transit fares 85,000 85,000 101,016 16,016Recreation - program income 1,072,592 1,072,592 1,411,706 339,114Public Golf - program income 1,782,088 1,782,088 1,775,300 (6,788)Senior Citizens - program income 180,000 180,000 175,069 (4,931)Solid Waste department 12,000 12,000 11,428 (572)Television department 400 400 505 105
$ 4,053,126 $ 4,053,126 $ 4,395,799 $ 342,673
Miscellaneous Revenues - Interest $ 104,000 $ 104,000 $ 132,289 $ 28,289 Gas franchise revenue 1,150,000 1,150,000 1,062,290 (87,710) Cable franchise revenue 1,200,000 1,200,000 1,318,497 118,497Contribution - active funds 1,828,830 1,828,830 1,061,372 (767,458) Miscellaneous revenue 172,239 172,239 639,207 466,968 Donations received 114,682 114,682 178,403 63,721
$ 4,569,751 $ 4,569,751 $ 4,392,058 $ (177,693) TOTAL REVENUES $ 97,602,333 $ 97,602,333 $ 98,402,990 $ 800,657
(continued)
ActualOriginal Final Positive
- 30 -

CITY OF MURFREESBORO, TENNESSEE
General Fund
Statement of Revenues, Expenditures and Changes in Fund Balance (continued)Budget (GAAP Basis) and Actual
Year Ended June 30, 2011
Variance withFinal Budget
Budget Actual (Negative)
Expenditures - General Government -
General and Administrative - Labor $ 1,565,468 $ 1,565,468 $ 1,555,693 $ 9,775Operation and maintenance 1,071,943 1,071,943 357,944 713,999Supplies 150,700 150,700 96,147 54,553 Insurance 278,422 278,422 269,744 8,678Social Security taxes 118,611 118,611 113,310 5,301 Group insurance 1,022,940 1,022,940 1,000,579 22,361 Retirement 553,501 553,501 511,628 41,873 Unemployment insurance 153,000 153,000 76,969 76,031 Utilities 205,000 205,000 218,238 (13,238) Travel and subsistence 25,700 25,700 24,405 1,295Association dues 62,350 62,350 61,426 924 Professional fees 168,300 168,300 171,000 (2,700) Training personnel 15,000 15,000 17,312 (2,312) Additions to fixed assets 37,500 37,500 19,516 17,984 Mixed drink tax allocation 272,500 272,500 325,228 (52,728)Other miscellaneous 493,500 493,500 490,529 2,971
$ 6,194,435 $ 6,194,435 $ 5,309,668 $ 884,767
Other General Government - Civic plaza $ 72,492 $ 72,492 $ 76,043 $ (3,551)Parking garage 111,600 111,600 109,960 1,640Disaster response 235,138 (235,138)Unforeseen miscellaneous and contingencies 500,000 500,000 80,135 419,865Property tax adjustments 100,000 100,000 61,871 38,129
$ 784,092 $ 784,092 $ 563,147 $ 220,945$ 6,978,527 $ 6,978,527 $ 5,872,815 $ 1,105,712
Police Department - Labor $ 12,285,133 $ 12,285,133 $ 12,359,868 $ (74,735)Operation and maintenance 703,882 703,882 789,481 (85,599)Supplies 796,599 796,599 706,658 89,941Uniforms and cleaning 256,997 256,997 272,384 (15,387)Insurance 1,432,679 1,432,679 1,346,572 86,107Social Security taxes 939,813 939,813 905,048 34,765Group insurance 2,417,040 2,417,040 2,335,015 82,025Retirement 1,329,917 1,329,917 1,281,957 47,960Utilities 455,000 455,000 463,565 (8,565)Training personnel 114,000 114,000 142,443 (28,443)Jail fees and state cost 225,000 225,000 178,543 46,457Drug programs 1,500 1,500 1,500D.A.R.E. program 10,000 10,000 12,722 (2,722)Additions to fixed assets 641,385 641,385 525,019 116,366Red light camera program 558,584 558,584 365,633 192,951Other miscellaneous 119,000 119,000 194,430 (75,430)
$ 22,286,529 $ 22,286,529 $ 21,879,338 $ 407,191
(continued)
FinalBudget
Original Positive
- 31 -

Variance withFinal Budget
Budget Budget Actual (Negative)
Fire Department - Labor $ 8,957,656 $ 8,957,656 $ 8,864,951 $ 92,705Operation and maintenance 305,126 305,126 336,927 (31,801)Supplies 279,907 279,907 347,507 (67,600)Uniforms and cleaning 175,225 175,225 172,964 2,261Insurance 228,976 228,976 228,428 548Social Security taxes 685,207 685,207 647,358 37,849Group insurance 1,800,970 1,800,970 1,800,783 187Retirement 992,974 992,974 993,551 (577)Utilities 220,400 220,400 222,641 (2,241)Association dues 1,700 1,700 1,730 (30)Training personnel 67,000 67,000 58,727 8,273Internship programs 16,000 16,000 13,277 2,723Additions to fixed assets 231,020 231,020 267,230 (36,210)Other miscellaneous 23,225 23,225 66,951 (43,726)
$ 13,985,386 $ 13,985,386 $ 14,023,025 $ (37,639)
Judicial Department - Labor $ 232,138 $ 232,138 $ 233,286 $ (1,148) Operation and maintenance 5,000 5,000 3,237 1,763 Supplies 24,500 24,500 16,151 8,349 Insurance 615 615 615Social Security taxes 19,149 19,149 16,640 2,509Group insurance 46,800 46,800 58,451 (11,651)Retirement 27,437 27,437 27,420 17Utilities 1,600 1,600 1,467 133Association dues 400 400 405 (5) Training personnel 2,500 2,500 901 1,599 Outside services 73,000 73,000 6,080 66,920Additions to fixed assets 2,000 2,000 319 1,681Other miscellaneous 500 500 100 400
$ 435,639 $ 435,639 $ 365,072 $ 70,567
Legal Department - Labor $ 531,281 $ 531,281 $ 515,324 $ 15,957Operation and maintenance 3,000 3,000 3,111 (111)Supplies 26,200 26,200 26,583 (383)Insurance 11,602 11,602 11,602Social Security taxes 40,643 40,643 36,190 4,453Group insurance 54,960 54,960 69,223 (14,263)Retirement 58,769 58,769 59,085 (316)Utilities 1,375 1,375 1,279 96Travel and subsistence 250 250 102 148Association dues 5,250 5,250 5,095 155Training personnel 4,750 4,750 6,282 (1,532)Legal expense 24,500 24,500 11,179 13,321Additions to fixed assets 6,500 6,500 1,141 5,359Other miscellaneous 3,750 3,750 4,040 (290)
$ 772,830 $ 772,830 $ 750,236 $ 22,594
(continued)
Original Final Positive
CITY OF MURFREESBORO, TENNESSEE
General Fund
Statement of Revenues, Expenditures and Changes in Fund Balance (continued)Budget (GAAP Basis) and Actual
Year Ended June 30, 2011
- 32 -

Variance withFinal Budget
PositiveBudget Budget Actual (Negative)
Human Resources Department -
Labor $ 500,110 $ 500,110 $ 496,045 $ 4,065 Operation and maintenance 11,500 11,500 16,434 (4,934) Supplies 16,470 16,470 12,977 3,493 Advertising 18,500 18,500 6,596 11,904Insurance 31,754 31,754 31,454 300Social Security taxes 38,258 38,258 35,550 2,708Group insurance 98,350 98,350 106,147 (7,797)Retirement 48,541 48,541 56,847 (8,306)Utilities 1,250 1,250 2,310 (1,060) Travel and subsistence 500 500 267 233 Training personnel 28,750 28,750 23,987 4,763Association dues 180 180 864 (684) Drug programs 36,000 36,000 34,526 1,474Additions to fixed assets 3,180 3,180 3,797 (617) Other miscellaneous 16,300 16,300 30,523 (14,223)
$ 849,643 $ 849,643 $ 858,324 $ (8,681) Street and Sign Department -
Labor $ 1,104,788 $ 1,104,788 $ 1,103,135 $ 1,653Operation and maintenance 237,045 237,045 260,848 (23,803)Materials and supplies 204,100 204,100 185,499 18,601Traffic control devices 30,000 30,000 66,894 (36,894)Insurance 68,493 68,493 63,897 4,596Social Security taxes 84,517 84,517 79,530 4,987Group insurance 264,500 264,500 264,474 26Retirement 123,095 123,095 122,391 704Utilities 40,000 40,000 31,393 8,607Utility service - street lighting 1,500,000 1,500,000 1,724,723 (224,723)Street improvements and maintenance 77,000 77,000 434,731 (357,731)Travel and subsistence 6,900 6,900 3,949 2,951Training personnel 2,000 2,000 2,000Additions to fixed assets 3,500 3,500 2,238 1,262Other miscellaneous 1,600 1,600 1,071 529
$ 3,747,538 $ 3,747,538 $ 4,344,773 $ (597,235)Planning and Engineering Department -
Labor $ 1,069,924 $ 1,069,924 $ 1,075,223 $ (5,299)Operation and maintenance 7,000 7,000 8,840 (1,840)Supplies 43,400 43,400 31,644 11,756Insurance 26,108 26,108 26,108Social Security taxes 84,574 84,574 78,781 5,793Group insurance 169,850 169,850 160,020 9,830Retirement 124,747 124,747 121,665 3,082Utilities 27,300 27,300 18,080 9,220Sampling and testing 45,000 45,000 39,923 5,077Storm drainage 700,000 700,000 700,000Landfill gas management 120,000 120,000 114,021 5,979Travel and subsistence 59,000 59,000 43,600 15,400Association dues 6,000 6,000 3,670 2,330Surveys 75,000 75,000 2,525 72,475Training personnel 6,000 6,000 4,935 1,065Additions to fixed assets 56,500 56,500 5,176 51,324Other miscellaneous 5,500 5,500 1,755 3,745
$ 2,625,903 $ 2,625,903 $ 1,735,966 $ 889,937
(continued)
Original Final
Budget (GAAP Basis) and Actual
CITY OF MURFREESBORO, TENNESSEE
General Fund
Statement of Revenues, Expenditures and Changes in Fund Balance (continued)
Year Ended June 30, 2011
- 33 -

CITY OF MURFREESBORO, TENNESSEE
General Fund
Statement of Revenues, Expenditures and Changes in Fund Balance (continued)Budget (GAAP Basis) and Actual
Year Ended June 30, 2011
Variance withFinal Budget
PositiveBudget Budget Actual (Negative)
Building and Codes Department - Labor $ 1,138,128 $ 1,138,128 $ 1,102,440 $ 35,688Operation and maintenance 10,000 10,000 9,060 940Supplies 29,500 29,500 16,995 12,505Insurance 12,375 12,375 12,375Social Security taxes 93,695 93,695 80,184 13,511Group insurance 228,900 228,900 234,014 (5,114)Retirement 145,546 145,546 122,807 22,739Utilities 17,600 17,600 14,734 2,866Travel and subsistence 71,200 71,200 57,277 13,923Association dues 1,200 1,200 1,819 (619)Training personnel 7,500 7,500 10,355 (2,855)Additions to fixed assets 3,500 3,500 4,750 (1,250)Other miscellaneous 1,700 1,700 151 1,549
$ 1,760,844 $ 1,760,844 $ 1,666,961 $ 93,883
Solid Waste Department - Labor $ 1,650,078 $ 1,650,078 $ 1,558,287 $ 91,791Operations and maintenance 816,080 816,080 946,106 (130,026)Supplies 435,820 435,820 435,834 (14)Insurance 418,498 418,498 403,973 14,525Social Security taxes 142,901 142,901 112,312 30,589Group insurance 503,800 503,800 405,038 98,762Retirement 213,104 213,104 168,265 44,839Utilities 65,000 65,000 47,177 17,823Travel and subsistence 7,200 7,200 6,228 972Training personnel 2,000 2,000 75 1,925License fees 3,500 3,500 2,841 659Disposal carts 130,000 130,000 102,810 27,190Other miscellaneous 3,225 3,225 2,344 881Capital outlay 2,000 2,000 137 1,863
$ 4,393,206 $ 4,393,206 $ 4,191,427 $ 201,779
Transportation Department - Labor $ 782,824 $ 782,824 $ 762,065 $ 20,759 Operation and maintenance 338,472 338,472 377,358 (38,886) Supplies 19,500 19,500 18,649 851 Fuel 84,000 84,000 108,731 (24,731) Insurance 56,687 56,687 46,712 9,975Social Security taxes 59,810 59,810 56,342 3,468Group insurance 118,800 118,800 119,443 (643)Retirement 75,943 75,943 70,866 5,077Utilities 15,650 15,650 15,676 (26)Travel and subsistence 5,500 5,500 4,279 1,221Association and regional dues 21,853 21,853 21,746 107Training and instruction 4,000 4,000 2,477 1,523 Contract services 286,668 286,668 206,502 80,166Capital outlay 1,911,600 1,911,600 1,075,254 836,346 Pass - thru grant expenditures 312,767 (312,767)Marketing 105,413 105,413 70,913 34,500Other miscellaneous 7,800 7,800 1,857 5,943
$ 3,894,520 $ 3,894,520 $ 3,271,637 $ 622,883
(continued)
Original Final
- 34 -

CITY OF MURFREESBORO, TENNESSEE
General Fund
Statement of Revenues, Expenditures and Changes in Fund Balance (continued)Budget (GAAP Basis) and Actual
Year Ended June 30, 2011
Variance withFinal Budget
PositiveBudget Budget Actual (Negative)
Urban Environmental Department - Labor $ 500,091 $ 500,091 $ 475,674 $ 24,417Operation and maintenance 57,617 57,617 59,870 (2,253)Agricultural materials 39,300 39,300 38,001 1,299Supplies 36,938 36,938 36,025 913Insurance 41,745 41,745 37,190 4,555Social Security taxes 38,257 38,257 33,787 4,470Group insurance 146,300 146,300 142,931 3,369Retirement 58,313 58,313 53,030 5,283Utilities 29,200 29,200 37,926 (8,726)Travel and subsistence 1,400 1,400 44 1,356Training personnel 1,000 1,000 723 277Additions to fixed assets 10,350 10,350 10,383 (33) Other miscellaneous 1,150 1,150 653 497
$ 961,661 $ 961,661 $ 926,237 $ 35,424
Public Health, Education and Welfare Linebaugh Public Library $ 705,333 $ 705,333 $ 705,333 Rutherford County Chamber of Commerce 407,850 407,850 451,398 $ (43,548)Rutherford County Paws 65,000 65,000 65,000 Job Vocation Training Center 42,000 42,000 42,000 Main Street Program 37,500 37,500 37,500 Center for the Arts 25,000 25,000 25,000Discovery House 20,000 20,000 20,000 Child Advocacy Center 17,390 17,390 16,470 920Oaklands Association 15,000 15,000 15,000Domestic Violence Program 12,500 12,500 12,500 Rutherford County Health Department 11,000 11,000 11,000 Primary Care Clinic 10,000 10,000 10,000Middle Tennessee Symphony 10,000 10,000 10,000Special Kids Incorporated 10,000 10,000 10,000Meals on Wheels 8,000 8,000 8,000Bradley Academy 7,500 7,500 7,684 (184)Murfreesboro Youth Orchestra 7,500 7,500 7,500Exchange Club Center 6,000 6,000 6,000 Crime Stoppers 5,000 5,000 5,000 Uncle Dave Macon Days 5,000 5,000 5,000 CASA of Rutherford County 5,000 5,000 5,000 Read to Succeed 4,000 4,000 4,000Pregnancy Support 3,500 3,500 3,500Boys and Girls Club 2,500 2,500 2,500Folkfest 2,500 2,500 2,500Adult Activity Center 2,500 2,500 2,500Generation for Creation 2,500 2,500 2,500Martin Luther King Scholarship 2,000 2,000 2,0002nd Harvest Food Bank 2,000 2,000 2,000Special Olympics 2,000 2,000 2,000Beesley Animal Foundation 2,000 2,000 2,000Leadership Rutherford 1,500 1,500 1,500
$ 1,459,573 $ 1,459,573 $ 1,502,385 $ (42,812)
(continued)
Original Final
- 35 -

CITY OF MURFREESBORO, TENNESSEE
General Fund
Statement of Revenues, Expenditures and Changes in Fund Balance (continued)Budget (GAAP Basis) and Actual
Year Ended June 30, 2011
Variance withFinal Budget
PositiveBudget Budget Actual (Negative)
Senior Citizens Department - Labor $ 420,882 $ 420,882 $ 406,708 $ 14,174Operations and maintenance 33,150 33,150 26,532 6,618Supplies 103,000 103,000 84,621 18,379Senior trip expense 75,000 75,000 76,509 (1,509)Insurance 32,926 32,926 32,926Social Security taxes 32,197 32,197 29,783 2,414Group insurance 74,850 74,850 71,196 3,654Retirement 36,065 36,065 36,036 29Utilities 69,500 69,500 55,690 13,810Contractual services 2,400 2,400 2,400Travel and subsistance 1,500 1,500 834 666Training and instruction 21,500 21,500 21,009 491Designated contributions 3,000 3,000 7,430 (4,430)Other miscellaneous 15,400 15,400 4,706 10,694Capital outlay 2,250 2,250 4,624 (2,374) $ 923,620 $ 923,620 $ 861,004 $ 62,616
Television Department - Labor $ 252,814 $ 252,814 $ 243,574 $ 9,240Operation and maintenance 31,800 31,800 13,193 18,607Supplies 3,100 3,100 2,004 1,096Advertising supplies 10,000 10,000 1,252 8,748Audio/video supplies 15,000 15,000 17,390 (2,390)Insurance 5,694 5,694 4,777 917Social Security taxes 18,805 18,805 18,157 648Group insurance 25,500 25,500 28,832 (3,332)Retirement 25,365 25,365 25,360 5Utilities 3,300 3,300 2,933 367Travel and subsistence 2,800 2,800 720 2,080Association dues 2,000 2,000 1,750 250Training personnel 7,000 7,000 1,426 5,574Professional services 6,000 6,000 800 5,200Other miscellaneous 28,100 28,100 22,722 5,378Capital outlay 121,000 121,000 69,386 51,614
$ 558,278 $ 558,278 $ 454,276 $ 104,002
Recreation Department - Labor $ 3,950,591 $ 3,950,591 $ 3,678,770 $ 271,821Operation and maintenance 529,489 529,489 570,351 (40,862)Supplies 292,469 292,469 273,258 19,211Insurance 194,543 194,543 184,109 10,434Social Security taxes 311,452 311,452 269,472 41,980Group insurance 539,175 539,175 528,772 10,403Retirement 286,264 286,264 270,812 15,452Utilities 1,021,770 1,021,770 972,713 49,057Travel and subsistence 25,800 25,800 19,627 6,173Arts and humanities 84,970 84,970 78,584 6,386Training personnel 11,000 11,000 10,873 127Purchases for resale 74,200 74,200 76,679 (2,479)Sales tax 24,000 24,000 26,315 (2,315)Other miscellaneous 17,525 17,525 46,561 (29,036)Capital outlay 1,014,879 1,014,879 599,462 415,417
$ 8,378,127 $ 8,378,127 $ 7,606,358 $ 771,769
(continued)
Original Final
- 36 -

CITY OF MURFREESBORO, TENNESSEE
General Fund
Statement of Revenues, Expenditures and Changes in Fund Balance (continued)Budget (GAAP Basis) and Actual
Year Ended June 30, 2011
Variance withFinal Budget
PositiveBudget Budget Actual (Negative)
Public Golf Department - Labor $ 891,297 $ 891,297 $ 842,864 $ 48,433Operations and maintenance 56,650 56,650 52,427 4,223Material 97,500 97,500 94,386 3,114Supplies 71,050 71,050 58,886 12,164Insurance 49,893 49,893 49,635 258Social Security taxes 68,184 68,184 64,059 4,125Group insurance 130,460 130,460 131,099 (639)Retirement 75,686 75,686 75,650 36Utilities 64,300 64,300 63,355 945Travel and subsistence 3,000 3,000 2,055 945Items for resale 334,188 334,188 327,451 6,737Other miscellaneous expenses 43,820 43,820 38,347 5,473Capital outlay 41,000 41,000 35,914 5,086
$ 1,927,028 $ 1,927,028 $ 1,836,128 $ 90,900
TOTAL EXPENDITURES $ 75,938,852 $ 75,938,852 $ 72,145,962 $ 3,792,890
Excess of Revenues Over (Under) Expenditures $ 21,663,481 $ 21,663,481 $ 26,257,028 $ 4,593,547
Other Financing Sources (Uses) - Transfers in (out) -
Murfreesboro Electric Department $ 2,677,676 $ 2,677,676 $ 2,706,122 $ 28,446Community development fund 6,000 6,000 6,000Debt service fund (22,659,312) (22,659,312) (24,860,379) (2,201,067) Murfreesboro City School System (4,810,103) (4,810,103) (4,810,103) Drug fund (95,000) (95,000) (93,659) 1,341Airport improvement fund (13,000) (13,000) (1,810) 11,190
$ (24,893,739) $ (24,893,739) $ (27,053,829) $ (2,160,090)
Net change in fund balance $ (3,230,258) $ (3,230,258) $ (796,801) $ 2,433,457
Fund Balance at beginning of year 49,248,735Fund Balance at end of year $ 48,451,934
See notes to financial statements.
Original Final
- 37 -

Actual on Final BudgetBudgetary Positive
Basis (Negative)
Revenues - Local intergovernmental revenues $ 17,878,400 $ 18,158,117 $ 18,158,117State program revenues 28,244,201 28,494,091 26,093,946 $ (2,400,145)Federal program revenues 7,000 88,567 2,650,695 2,562,128Charges for services 20,900 11,762 11,762Indigent children revenues 18,221 18,221Other local revenues 236,170 410,019 409,912 (107)
$ 46,386,671 $ 47,180,777 $ 47,342,653 $ 161,876
Expenditures - Regular instruction program $ 30,413,933 $ 32,647,879 $ 32,647,879Special education program 3,114,368 3,073,250 3,073,250Attendance 78,711 73,678 73,678Health services 392,625 504,403 504,403Other student support 950,134 971,637 971,637Regular instruction program - support 1,453,556 1,347,850 1,347,850Special education program - support 641,222 329,090 329,090Board of education 1,068,760 1,010,899 1,010,899Office of superintendent 312,168 290,250 290,250Office of principal 2,425,283 2,771,229 2,771,229Fiscal services 509,042 509,960 509,960Operation of plant 4,724,602 4,506,554 4,506,554Maintenance of plant 1,273,339 1,213,788 1,213,788Transportation 1,534,636 1,804,524 1,804,524Information technology 719,895 1,232,282 1,232,282Community services 261,315 349,303 349,303Early childhod education 543,647 603,004 603,004Indigent children 11,526 11,526Personnel services 251,734 323,200 323,200Capital outlay 500,000 523,620 523,620
$ 51,168,970 $ 54,097,926 $ 54,097,926 $ -0-Excess of Revenues Over (Under) Expenditures $ (4,782,299) $ (6,917,149) $ (6,755,273) $ 161,876
Other Financing Sources and (Uses) - Transfers in 4,810,103 4,810,103 4,810,103
Net change in fund balance (Budgetary basis) $ 27,804 $ (2,107,046) $ (1,945,170) $ 161,876
Adjustment for encumbrances 1,624,335
Net change in fund balance (GAAP basis) $ (320,835)
Fund Balance at beginning of year 7,281,075Fund Balance at end of year $ 6,960,240
See notes to financial statements.
BudgetOriginal
CITY OF MURFREESBORO, TENNESSEE
General Purpose School Fund
Statement of Revenues, Expenditures, and Changes in Fund BalanceBudget and Actual (Budgeting Basis Variance with GAAP)
Year Ended June 30, 2011
Variance with
FinalBudget
-38 -

CITY OF MURFREESBORO, TENNESSEE
Balance SheetProprietary Funds
June 30, 2011
Enterprise ServiceFunds Totals Funds
ASSETSCurrent Assets -
Cash and cash equivalents $ 16,114,603 $ 22,759,950 $ 27,086 $ 38,901,639 $ 12,542,147Receivables -
Accounts 1,690,950 14,659,296 118,365 16,468,611Other capital assets, net of depreciation 153,225
Due from other governments 119,680 122,589 242,269 10,167Due from other funds 5,006,964 8,963,891 13,970,855 22,394Inventories 674,346 2,064,564 58,043 2,796,953 162,555Prepaid items and other assets 118,516 270,889 14,383 403,788 520
Total Current Assets $ 23,725,059 $ 39,877,288 $ 9,181,768 $ 72,784,115 $ 12,891,008Noncurrent Assets -
Restricted assets - Cash and cash equivalents $ 25,118,563 $ 25,118,563Certificates of deposit $ 500,000
Conservation loans receivable $ 1,482,700 1,482,700Deferred charges 535,771 765,717 1,301,488Capital assets -
Land and construction in progress 26,099,029 11,964,481 $ 1,578,856 39,642,366Other capital assets, net of depreciation 335,764,473 108,447,505 862,622 445,074,600Total Noncurrent Assets $ 387,517,836 $ 122,660,403 $ 2,441,478 $ 512,619,717 $ 500,000
Total Assets $ 411,242,895 $ 162,537,691 $ 11,623,246 $ 585,403,832 $ 13,391,008
LIABILITIES AND NET ASSETSCurrent Liabilities -
Accounts payable $ 774,610 $ 21,244,891 $ 244,995 $ 22,264,496 $ 1,013,172Accrued and withheld liabilities 145,218 580,484 3,918 729,620 7,679Due to other funds 9,201,221 5,073,074 14,274,295 851Deposits held 204,106 5,683,943 5,888,049Compensated absences 914,705 914,705Claims and judgments payable 2,295,204Bonds and loans payable 6,459,020 3,529,078 9,988,098
Total Current Liabilities $ 17,698,880 $ 31,038,396 $ 5,321,987 $ 54,059,263 $ 3,316,906Noncurrent Liabilities -
Compensated absences $ 852,206 $ 1,327,349 $ 2,179,555Claims and judgments payable $ 3,688,796Post-employment benefit obligation 3,275,438 1,735,582 5,011,020Bonds and loans payable 106,773,276 15,895,656 122,668,932Advances on conservation loans 1,515,435 1,515,435Other liabilities 62,553 62,553
Total Noncurrent Liabilities $ 110,900,920 $ 20,536,575 $ 131,437,495 $ 3,688,796Total Liabilities $ 128,599,800 $ 51,574,971 $ 5,321,987 $ 185,496,758 $ 7,005,702
Net Assets - Invested in capital assets, net of related debt $ 248,631,206 $ 101,066,686 $ 223,202 $ 349,921,094Restricted for capital activity 23,504,845 23,504,845Restricted for debt service 1,613,718 1,613,718Unrestricted 8,893,326 9,896,034 6,078,057 24,867,417 $ 6,385,306
Total Net Assets $ 282,643,095 $ 110,962,720 $ 6,301,259 $ 399,907,074 $ 6,385,306Total Liabilities and Net Assets $ 411,242,895 $ 162,537,691 $ 11,623,246 $ 585,403,832 $ 13,391,008
Total Net Assets $ 399,907,074Adjustment to reflect the elimination of internal charges
for salaries and overhead related to enterprise funds 2,542,761Adjustment to reflect the consolidation of internal service
fund activities related to enterprise funds 397,383Net Assets of Business-Type Activities $ 402,847,218
See notes to financial statements.
ElectricDepartment
MurfreesboroWater and
Sewer
Murfreesboro
Governmental
Nonmajor InternalBusiness-Type Activities Activities
- 39 -

CITY OF MURFREESBORO, TENNESSEE
Statement of Revenues, Expenses, and Changes in Net AssetsProprietary Funds
Year Ended June 30, 2011
Operating Revenues - Charges for services $ 31,434,063 $ 160,004,748 $ 2,927,684 $ 194,366,495 $ 17,116,339 Intergovernmental revenues 7,241 Other revenues 207,123
$ 31,434,063 $ 160,004,748 $ 2,927,684 $ 194,366,495 $ 17,330,703
Operating Expenses - Power purchases $ 128,838,097 $ 128,838,097 Other operating expenses $ 16,329,022 7,442,864 $ 1,165,647 24,937,533 $ 2,962,066 Claims and administrative 13,796,591 Depreciation and amortization 8,972,678 5,339,737 128,508 14,440,923 Maintenance and repairs 1,013,517 2,880,722 3,894,239 Taxes and tax equivalents 1,111,313 1,111,313
$ 26,315,217 $ 145,612,733 $ 1,294,155 $ 173,222,105 $ 16,758,657 Operating Income (Loss) $ 5,118,846 $ 14,392,015 $ 1,633,529 $ 21,144,390 $ 572,046
Nonoperating Revenues - Interest $ 356,355 $ 31,423 $ 387,778 $ 31,827 Non capital related grants 122,589 122,589 Gain on disposal of assets 19,350 19,350
$ 375,705 $ 154,012 $ 529,717 $ 31,827
Nonoperating Expenses - Interest $ 3,366,635 $ 362,285 $ 3,728,920
Income (Loss) Before Capital Contributions and Transfers $ 2,127,916 $ 14,183,742 $ 1,633,529 $ 17,945,187 $ 603,873
Capital contributions $ 5,478,570 $ 54,645 $ 5,533,215 Transfers in 62,046 62,046 Transfers out $ (2,706,122) (2,706,122)
$ 5,478,570 $ (2,706,122) $ 116,691 $ 2,889,139
Change in Net Assets $ 7,606,486 $ 11,477,620 $ 1,750,220 $ 20,834,326 $ 603,873
Net Assets at beginning of year, as previously stated $ 275,036,609 $ 99,485,100 $ 3,814,112 $ 378,335,821 $ 5,781,433
Prior period adjustment 736,927 736,927 Net Assets at beginning of year,
as restated $ 275,036,609 $ 99,485,100 $ 4,551,039 $ 379,072,748 $ 5,781,433Net Assets at end of year $ 282,643,095 $ 110,962,720 $ 6,301,259 $ 399,907,074 $ 6,385,306
Change in Net Assets $ 20,834,326Adjustment to reflect the elimination of internal charges
for salaries and overhead related to enterprise funds 443,809Adjustment to reflect the consolidation of internal service
fund activities related to enterprise funds 87,411Change in Net Assets of Business-Type Activities $ 21,365,546
See notes to financial statements.
FundsTotals
Business-Type ActivitiesGovernmental
ActivitiesInternalServiceWater and
Sewer
Murfreesboro NonmajorEnterprise
Funds
MurfreesboroElectric
Department
- 40 -

Cash Flows from Operating Activities - Cash received from customers $ 31,592,562 $ 152,221,220 $ 423,150 $ 184,236,932Cash payments to suppliers (9,196,201) (3,335,660) (186,864) (12,718,725) $ (1,553,442)Cash payments to employees (6,133,497) (8,165,636) (280,738) (14,579,871) (772,519)Cash payments to TVA for power (118,148,305) (118,148,305)Cash payments of property taxes (785,648) (785,648)Cash received from interfund services provided 17,106,862Cash payments of claims and administrative
expenses (13,561,508)Other receipts (payments) (448,989)
Net Cash Provided (Used) by Operating Activities $ 16,262,864 $ 21,785,971 $ (44,452) $ 38,004,383 $ 770,404
Cash Flows from Noncapital Financing Activities - Advances on TVA conservation loans $ 430,310 $ 430,310Transfers in $ 62,046 62,046Transfers out (2,706,121) (2,706,121)
Net Cash Provided (Used) by Noncapital Financing Activities $ (2,275,811) $ 62,046 $ (2,213,765)
Cash Flows from Capital and Related Financing Activities - Acquisition and construction of capital assets $ (2,796,603) $ (9,304,664) $ (10,000) $ (12,111,267)Net removal costs of capital assets (204,779) (204,779)Proceeds from sale of assets 19,350 19,350Proceeds from bonds and loans 6,871,489 6,871,489Principal payment on bonds and loans (7,273,189) (3,473,650) (10,746,839)Bond and debt issuance costs (payments) (192,350) (192,350)Interest paid on bonds and loans (3,366,635) (366,851) (3,733,486)
Net Cash Provided (Used) by Capital and Related Financing Activities $ (13,609,427) $ (6,478,455) $ (10,000) $ (20,097,882)
Cash Flows From Investing Activities - Interest received $ 356,355 $ 31,423 $ 387,778 $ 31,827
Net Cash Provided (Used) by Investing Activities $ 356,355 $ 31,423 $ 387,778 $ 31,827
Net Increase (Decrease) in cash and cash equivalents $ 3,009,792 $ 13,063,128 $ 7,594 $ 16,080,514 $ 802,231Cash and Cash Equivalents at beginning of year 38,223,374 9,696,822 19,492 47,939,688 11,739,916Cash and Cash Equivalents at end of year $ 41,233,166 $ 22,759,950 $ 27,086 $ 64,020,202 $ 12,542,147
(continued)
Enterprise
Year Ended June 30, 2011
Proprietary Funds Statement of Cash Flows
InternalMurfreesboro Murfreesboro Nonmajor
Department FundsSewer FundsTotals
CITY OF MURFREESBORO, TENNESSEE
GovernmentalActivities
Water and Service
Business-Type Activities
Electric
- 41 -
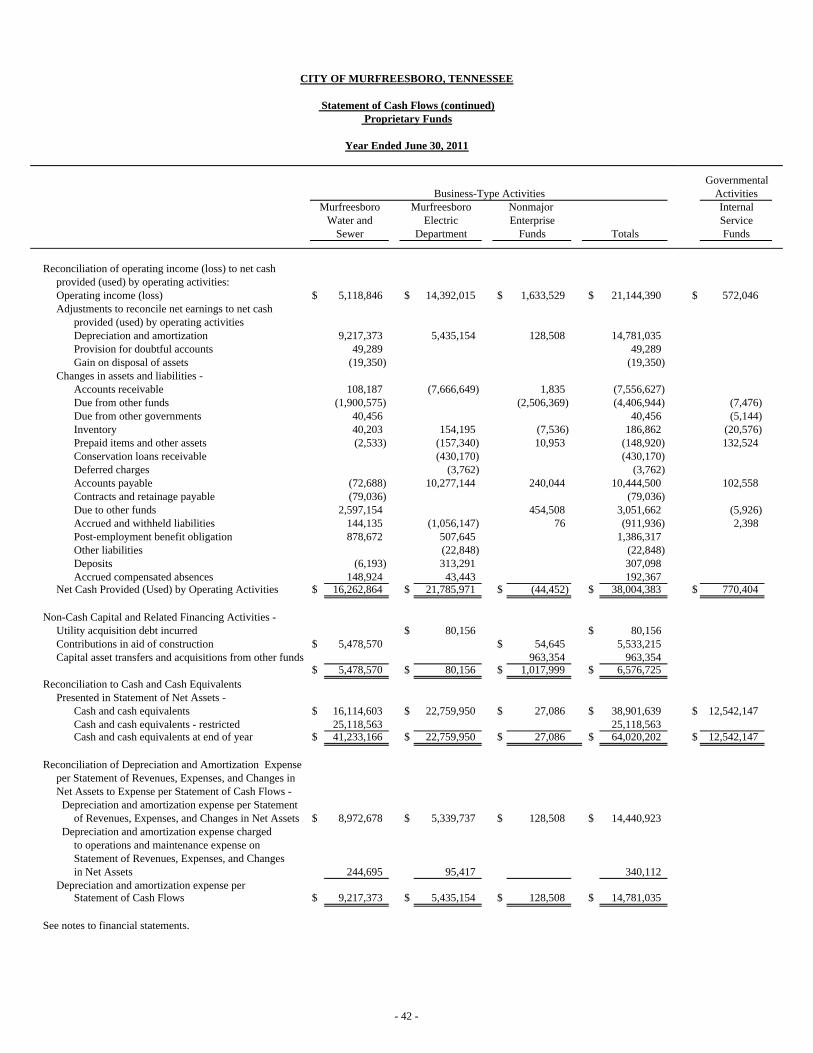
Reconciliation of operating income (loss) to net cash provided (used) by operating activities: Operating income (loss) $ 5,118,846 $ 14,392,015 $ 1,633,529 $ 21,144,390 $ 572,046Adjustments to reconcile net earnings to net cash
provided (used) by operating activities Depreciation and amortization 9,217,373 5,435,154 128,508 14,781,035Provision for doubtful accounts 49,289 49,289Gain on disposal of assets (19,350) (19,350)
Changes in assets and liabilities - Accounts receivable 108,187 (7,666,649) 1,835 (7,556,627)Due from other funds (1,900,575) (2,506,369) (4,406,944) (7,476)Due from other governments 40,456 40,456 (5,144)Inventory 40,203 154,195 (7,536) 186,862 (20,576)Prepaid items and other assets (2,533) (157,340) 10,953 (148,920) 132,524Conservation loans receivable (430,170) (430,170)Deferred charges (3,762) (3,762)Accounts payable (72,688) 10,277,144 240,044 10,444,500 102,558Contracts and retainage payable (79,036) (79,036)Due to other funds 2,597,154 454,508 3,051,662 (5,926)Accrued and withheld liabilities 144,135 (1,056,147) 76 (911,936) 2,398Post-employment benefit obligation 878,672 507,645 1,386,317Other liabilities (22,848) (22,848)Deposits (6,193) 313,291 307,098Accrued compensated absences 148,924 43,443 192,367
Net Cash Provided (Used) by Operating Activities $ 16,262,864 $ 21,785,971 $ (44,452) $ 38,004,383 $ 770,404
Non-Cash Capital and Related Financing Activities - Utility acquisition debt incurred $ 80,156 $ 80,156Contributions in aid of construction $ 5,478,570 $ 54,645 5,533,215Capital asset transfers and acquisitions from other funds 963,354 963,354
$ 5,478,570 $ 80,156 $ 1,017,999 $ 6,576,725Reconciliation to Cash and Cash Equivalents
Presented in Statement of Net Assets - Cash and cash equivalents $ 16,114,603 $ 22,759,950 $ 27,086 $ 38,901,639 $ 12,542,147Cash and cash equivalents - restricted 25,118,563 25,118,563Cash and cash equivalents at end of year $ 41,233,166 $ 22,759,950 $ 27,086 $ 64,020,202 $ 12,542,147
Reconciliation of Depreciation and Amortization Expense per Statement of Revenues, Expenses, and Changes in Net Assets to Expense per Statement of Cash Flows - Depreciation and amortization expense per Statement
of Revenues, Expenses, and Changes in Net Assets $ 8,972,678 $ 5,339,737 $ 128,508 $ 14,440,923 Depreciation and amortization expense charged
to operations and maintenance expense on Statement of Revenues, Expenses, and Changes in Net Assets 244,695 95,417 340,112
Depreciation and amortization expense per Statement of Cash Flows $ 9,217,373 $ 5,435,154 $ 128,508 $ 14,781,035
See notes to financial statements.
GovernmentalActivitiesBusiness-Type Activities
Year Ended June 30, 2011
InternalService
Murfreesboro Murfreesboro Nonmajor
FundsWater and Electric Enterprise
Sewer Department Funds Totals
CITY OF MURFREESBORO, TENNESSEE
Statement of Cash Flows (continued) Proprietary Funds
- 42 -

CITY OF MURFREESBORO, TENNESSEE
Statement of Net AssetsFiduciary Funds
June 30, 2011
Extended SchoolProgram Private
PurposeTrust Fund
ASSETS
Cash and cash equivalents $ 2,706,025 $ 3,122 $ 467,317Certificates of deposit 156,631 80,925Investments, at fair value
Mutual funds 50,219,526U.S. Government notes and bonds 15,060,582Corporate notes and bonds 17,232,314Common stock 20,533,828
Accrued interest receivable 53,833Contributions receivable 290,983Other receivables 5,428Inventory 10,900
$ 106,097,091 $ 159,753 $ 564,570
Due to others $ 564,570$ 564,570
NET ASSETS
Net Assets - Held in trust for pension benefits and
other purposes $ 106,097,091 $ 159,753 $ - 0 -
See notes to financial statements.
SchoolActivity
Agency Fund
LIABILITIES
TrustFunds
Pension
- 43 -

Additions - Contributions -
Employer $ 5,414,900Investment income-
Net appreciation in fair value of investments $ 14,172,974Interest 1,353,425 $ 3,707Dividends 1,442,475
Total investment income $ 16,968,874 $ 3,707Less investment fees (59,738)
Net investment income $ 16,909,136 $ 3,707Total additions $ 22,324,036 $ 3,707
Deductions - Benefits to participants $ 3,639,174Insurance premiums 516,712
Total deductions $ 4,155,886
Net Increase (Decrease) $ 18,168,150 $ 3,707
Net Assets Held in Trust for Pension Benefits - Beginning of year 87,928,941 156,046End of year $ 106,097,091 $ 159,753
See notes to financial statements.
Extended School
CITY OF MURFREESBORO, TENNESSEE
Statement of Changes in Net AssetsFiduciary Funds
Year Ended June 30, 2011
Program PrivatePurposeTrust
Funds Trust Fund
Pension
- 44 -

CITY OF MURFREESBORO, TENNESSEE
Notes to Financial Statements
June 30, 2011
- 45 -
Note A – SUMMARY OF SIGNIFICANT ACCOUNTING POLICIES The City of Murfreesboro, Tennessee (the “City”) was first chartered by the Tennessee General Assembly (State Legislature) in 1811. The present charter was granted in 1931 and has been amended as needed. The City operates under a Council-
Manager form of government. The City’s major operations include police and fire protection, parks, education, recreation, public works and general administrative services. In addition, the City owns and operates a water and sewer system and an electric utility. The accounting and reporting policies of the City relating to the funds included in the accompanying combined financial statements conform to generally accepted accounting principles applicable to state and local governments. Generally accepted accounting principles for local governments include those principles prescribed by the Governmental Accounting Standards Board (GASB), the American Institute of Certified Public Accountants in the publication entitled Audits of State and Local Governmental Units and by the Financial Accounting Standards Board (when applicable). As allowed in Section P80 of GASB's Codification of Governmental Accounting and Financial Reporting Standards, the City has elected not to apply to its business-type activities and enterprise funds Financial Accounting Standards Board Statements and Interpretations, Accounting Principles Board Opinions, and Accounting Research Bulletins of the Committee of Accounting Procedure issued after November 30, 1989. The GASB periodically updates its codification of the existing Governmental Accounting and Standards, which, along with the subsequent GASB pronouncements (Statements and Interpretations), constitutes GAAP for governmental units. The more significant accounting policies of the City are described below. Reporting Entity The City, for financial purposes, includes all the funds relevant to the operations of the City of Murfreesboro, Tennessee (the primary government). The City is also required to include in its financial statements those separately administered organizations (component units) with which the City has significant operational or financial relationships. The criteria for including organizations as component units within the City's reporting entity include whether the organization is legally separate and whether the City holds the corporate powers, whether the City appoints a majority of the organization's board and is able to impose its will, and the ability of the organization to impose a financial benefit or burden on the City. Based on the foregoing criteria, the City of Murfreesboro has no component units. Complete financial statements of individual departments, considered part of the primary government, can be obtained from the administrative offices in the following locations:
Murfreesboro City Schools Central Office Evergreen Cemetery 2552 South Church Street 519 Greenland Drive Murfreesboro Murfreesboro
Murfreesboro Electric Department Murfreesboro Water and Sewer Department 205 North Maple Street 300 Northwest Broad Street Murfreesboro Murfreesboro
Government-wide and Fund Financial Statements The government-wide financial statements (i.e., the statement of net assets and the statement of activities) report information on all of the nonfiduciary activities of the primary government. Governmental activities, which normally are supported by taxes and intergovernmental revenues, are reported separately from business-type activities, which rely to a significant extent on fees and charges for support.
CITY OF MURFREESBORO, TENNESSEE
Notes to Financial Statements (continued)
June 30, 2011
- 46 -
Note A – SUMMARY OF SIGNIFICANT ACCOUNTING POLICIES (continued) Government-wide and Fund Financial Statements (continued)
The statement of activities demonstrates the degree to which the direct expenses of a given function or identifiable activity are offset by program revenues. Direct expenses are those that are clearly identifiable with a specific function or segment. Program revenues include 1) charges to customers or applicants who purchase, use, or directly benefit from goods, services, or privileges provided by the given function or segment and 2) grants and contributions that are restricted to meeting the operational or capital requirements of a particular function or segment. Taxes and other items not properly included among program revenues are reported instead as general revenues. Separate financial statements are provided for governmental funds, proprietary funds, and fiduciary funds, even though the latter are excluded from the government-wide financial statements. Major individual governmental funds and major individual enterprise funds are reported as separate columns in the fund financial statements. Measurement Focus, Basis of Accounting, and Financial Statement Presentation The government-wide financial statements are reported using the economic resources measurement focus and the accrual basis of accounting, as are the proprietary fund and the fiduciary fund financial statements (except for agency funds which have no measurement focus). Revenues are recorded when earned and expenses are recorded when a liability is incurred, regardless of the timing of related cash flows. Property taxes are recognized as revenues in the year for which they are levied. Grants and similar items are recognized as revenue as soon as all eligibility requirements imposed by the provider have been met. Governmental fund financial statements are reported using the current financial resources measurement focus and the modified accrual basis of accounting. Revenues are recognized as soon as they are both measurable and available. Revenues are considered to be available when they are collectible within the current period or soon enough thereafter to pay liabilities of the current period. For this purpose, the government considers revenues to be available if they are collected within 60 days of the end of the current fiscal period. Expenditures generally are recorded when a liability is incurred, as under accrual accounting. However, debt service expenditures as well as expenditures related to compensated absences are recorded only when payment is due.
Property taxes, sales taxes, franchise taxes, licenses, state and federal grants, and interest associated with the current fiscal period are all considered to be susceptible to accrual and so have been recognized as revenues of the current fiscal period. All other revenue items are considered to be measurable and available only when cash is received by the government. Property taxes and accounts receivable are reduced by an allowance for uncollectible accounts. The financial transactions of the City are recorded in individual funds. Each fund is accounted for by providing a separate set of self-balancing accounts that comprise its assets, liabilities, reserves, fund equity, revenues and expenditures/expenses. The various funds are reported by generic classifications within the financial statements.
The City reports the following major governmental funds:
General Fund – The general fund is the primary operating fund of the City. It is used to account for all financial resources of the general government, except those required to be accounted for in another fund. General Purpose School Fund –The general purpose school fund is a special revenue fund used to account for the proceeds of specific revenue sources that are legally restricted to expenditures for education. Debt Service Fund – The debt service fund accounts for the accumulation of resources for, and payment of, general long-term obligations.

CITY OF MURFREESBORO, TENNESSEE
Notes to Financial Statements (continued)
June 30, 2011
- 47 -
Note A – SUMMARY OF SIGNIFICANT ACCOUNTING POLICIES (continued)
Measurement Focus, Basis of Accounting, and Financial Statement Presentation (continued) 2010 TML Loan Fund – The 2010 TML loan fund is a capital projects fund used to account for the acquisition and construction of capital projects which are financed by the issuance of a TML Loan.
The City reports the following major proprietary funds:
Murfreesboro Water and Sewer Fund – The Water and Sewer fund accounts for revenues and expenses related to potable water and sanitary sewer services provided to residents of the City. Murfreesboro Electric Department Fund – The Electric Department fund accounts for the revenue and costs for providing electric utility service for the residential and commercial concerns of the City.
Additionally, the government reports the following fund types:
Internal Service Funds – The internal service funds consist of a fleet services fund that accounts for fleet and equipment management to other departments or agencies of the government on a cost reimbursement basis, a risk management fund that accounts for revenues and costs associated with the City’s self-funded liability and workers’ compensation insurance programs, and an insurance fund that accounts for revenues and costs associated with the City’s self-funded group health insurance plan. Pension Trust Funds – The pension trust funds account for assets held on behalf of City employees. Private-purpose Trust Fund – The private-purpose trust fund accounts for funds donated to the Extended School Program. These funds are to be preserved and maintained so as to produce income to be used for tuition grants. Agency Fund – The agency fund accounts for the assets held by the schools in an agency capacity on behalf of various student, teacher and parent organizations.
As a general rule the effect of interfund activity has been eliminated from the government-wide financial statements. Exceptions to this rule are payments-in-lieu of taxes and other charges between the government’s water and sewer function and various other functions of the government. Elimination of these charges would distort the direct costs and program revenues reported for the various functions concerned. Amounts reported as program revenues include 1) charges to customers or applicants for goods, services, or privileges provided, 2) operating grants and contributions, and 3) capital grants and contributions. Internally dedicated resources are reported as general revenues rather than as program revenues. Likewise, general revenues include all taxes. Proprietary funds distinguish operating revenues and expenses from nonoperating items. Operating revenues and expenses generally result from providing services and producing and delivering goods in connection with a proprietary fund’s principal ongoing operations. The principal operating revenues of the water and sewer fund and the electric department fund and of the City’s internal service funds are charges to customers for sales and services. The water and sewer fund also recognizes as operating revenue the portion of tap fees intended to recover the cost of connecting new customers to the system. Operating expenses of the enterprise funds and internal service funds include the cost of sales and services, administrative expenses, and depreciation on capital assets. All revenues and expenses not meeting this definition are reported as nonoperating revenues and expenses.

CITY OF MURFREESBORO, TENNESSEE
Notes to Financial Statements (continued)
June 30, 2011
- 48 -
Note A – SUMMARY OF SIGNIFICANT ACCOUNTING POLICIES (continued)
Measurement Focus, Basis of Accounting, and Financial Statement Presentation (continued) When both restricted and unrestricted resources are available for use, it is the City’s policy to use restricted resources first and then unrestricted resources as they are needed.
Assets, Liabilities, and Net Assets or Equity Cash and Cash Equivalents – For purposes of reporting cash flows, cash and cash equivalents include cash on hand, cash in checking accounts, interest-bearing deposits, and highly liquid investments (including restricted assets of the Water and Sewer and Electric departments) with an original maturity of three months or less. Investments – Investments are stated at fair value for all funds. Inventories – Inventories held by the Electric Department are stated at average cost on a first-in, first-out basis. Water and Sewer Department and Special Revenue Fund inventories are stated at cost on a first-in, first-out basis. The cost of inventories is recorded as expenditures when consumed. Inventories reported in governmental funds are offset by a fund balance reserve, which indicates that they do not constitute “available spendable resources” even though it is a component of net current assets. Although a reservation of fund balance is not required under the consumption method, this reservation is shown for management purposes only. Prepaid items – Certain payments to vendors reflect costs applicable to future accounting periods and are recorded as prepaid items in both government-wide and fund financial statements. Restricted Assets – The City’s restricted assets consist of the following:
Business-Type Activities
Other MurfreesboroGeneral 2010 TML Governmental Water and
Fund Funds Funds Sewer TotalRestricted assets -
Cash and cash equivalents $ 583,119 $ 28,820,080 $ 2,046,027 $ 25,118,563 $ 56,567,789 Investments 1,787,633 1,787,633
$ 583,119 $ 28,820,080 $ 3,833,660 $ 25,118,563 $ 58,355,422
Governmental Activities
Restricted Assets – Governmental Activities - Certain proceeds from outside sources have been classified as restricted assets on the balance sheet because they are maintained in separate bank accounts and their use is limited by outside sources. The general fund maintains separate bank accounts for the following restricted funds: Equitable sharing, police, 125 plan contributions, and deposits in a local government investment pool for the City’s portion of the cost of the construction of a road. The amount of restricted funds in the general fund at June 30, 2011 is $583,119. Proceeds from the 2010 TML loan are required by the loan agreement to be kept separate and apart from all other funds of the City to be spent for capital projects as outlined in the loan agreement. The amount of restricted funds in the 2010 TML fund at June 30, 2011 is $28,820,080.

CITY OF MURFREESBORO, TENNESSEE
Notes to Financial Statements (continued)
June 30, 2011
- 49 -
Note A – SUMMARY OF SIGNIFICANT ACCOUNTING POLICIES (continued)
Assets, Liabilities, and Net Assets or Equity (continued) Amounts received from outside sources have been classified as restricted assets on the balance sheets of the nonmajor capital project funds. These amounts are maintained in separate bank accounts and their use is limited by outside sources. At June 30, 2011, $360,317 is restricted for payments to engineers for the reconstruction of Middle Tennessee Boulevard. Also, amounts required to be set aside in separate bank accounts by the State of Tennessee for certain road projects in the amount of $1,613,683 have been classified as restricted at June 30, 2011. The Cemetery is required by law to contribute twenty percent of lot sale proceeds into a perpetual care fund. The perpetual care fund is to ensure the maintenance of the Cemetery for future years. The Cemetery had $72,027 in cash on hand and bank accounts, which was restricted in this manner at June 30, 2011. Also, periodically contributions are made in trust to local financial institutions for investments of funds received from the issuance of perpetual care certificates. These contributions held in trust are invested in U.S. Government bonds and other secured investments by the trustee on a continuing basis. The income received from these investments is disbursed by the trustee periodically to the cemetery fund for reimbursement of expenses. During the year ended June 30, 2011, $62,046 was reimbursed to the cemetery fund for expenses incurred in the maintenance of cemetery grounds. The amount of investments restricted in this manner at June 30, 2011 is $1,787,633. Restricted Assets – Business-type Activities – The Water and Sewer Department has restricted certain funds. At June 30, 2011, Water and Sewer connection fees in the amount of $20,971,804 are restricted for new development and construction. The funds are to be appropriated at the recommendation of the Water and Sewer Board to the City Council. The reserve sinking fund was required by the U.S. Army Corp of Engineers in the contract for the Water and Sewer Department to pump water from Percy Priest Lake. The total amount restricted for this purpose is $214,968. The interest income reserve was set up by the Water and Sewer Board to reserve interest earned on non operational funds so it would not be used in the rate structure. The interest income reserve was established to segregate investment earnings from operating cash. This money can be used to fund future construction upon board approval. At June 30, 2011, $2,318,073 was restricted for this purpose. Certain other amounts have been restricted for future year debt payments. The future debt reserve was established by the Water and Sewer Board. At June 30, 1992, the Board determined that the restricted bond fund was adequately funded and therefore, no additional funding has been made. The amount of reserve for future year debt payments at June 30, 2011 is $1,613,718. Restricted Assets – Internal Service Funds – As a self-insured employer for the City’s workers’ compensation obligation, the City of Murfreesboro is required to comply with Tennessee Code Annotated 50-6-405(b) and any applicable rules. As of January 1, 2005, all self-insured are required to maintain security in an amount not less than five hundred thousand ($500,000) pursuant to Tennessee Code Annotated 50-6-405(b)(1). Accordingly at June 30, 2011, the City of Murfreesboro’s Risk Management Fund has $500,000 in a certificate of deposit which is restricted in this manner. Capital Assets and Depreciation – Capital assets, which include property, plant, equipment, and infrastructure assets (e.g., roads, bridges, sidewalks, and similar items), are reported in the applicable governmental or business-type columns in the government-wide financial statements. All capital assets are valued at historical cost or estimated historical cost if actual cost is not available. Donated capital assets are valued at their estimated fair value on the date donated. The City capitalizes assets using a $5,000 capitalization threshold. In the case of the initial capitalization of general infrastructure assets (i.e., those reported by governmental activities) the City chose to include all such items acquired or constructed subsequent to July 1, 1979. The City was able to estimate the historical cost for the initial reporting of these assets through backtrending (i.e., estimating the current replacement cost of the infrastructure to be capitalized and using an appropriate price-level index to deflate the cost to the acquisition year or estimated acquisition year). As the City constructs or acquires additional capital assets each period, including infrastructure assets, they are capitalized and reported at historical cost. The reported value excludes normal maintenance and repairs

CITY OF MURFREESBORO, TENNESSEE
Notes to Financial Statements (continued)
June 30, 2011
- 50 -
Note A – SUMMARY OF SIGNIFICANT ACCOUNTING POLICIES (continued)
Assets, Liabilities, and Net Assets or Equity (continued) which are essentially amounts spent in relation to capital assets that do not increase the capacity or efficiency of the item or extend its useful life beyond the original estimate. In the case of donations, the City values these capital assets at the estimated fair value of the item at the date of its donation. When capital assets are purchased, they are capitalized and depreciated in the government-wide statements and the proprietary fund statements. Capital assets are recorded as expenditures of the current period in the governmental fund financial statements. Depreciation of capital assets is computed and recorded by the straight-line method over the estimated useful lives of the assets. Estimated useful lives of the various classes of depreciable capital assets are as follows:
Buildings and improvements 5-50 yearsImprovements other than buildings 20-50 yearsStructures and improvements 5-50 yearsTransmission and distribution mains 5-50 yearsElectric Plant 5-40 yearsEquipment 3-25 yearsComputer software 3-15 yearsInfrastructure 10-50 years
Total depreciation and amortization expense for proprietary funds amounted to $14,781,035 for the year ended June 30, 2011. Depreciation applicable to transportation equipment is charged to a transportation clearing account and then distributed to utility plant, construction work in progress and operating expenses based on the utilization of the equipment. Depreciation accounted for in this manner results in a difference between depreciation reported in the accompanying statement of cash flows and the amount reported in the statement of revenues, expenses and changes in net assets. A reconciliation of this difference is provided below:
Total Proprietary Funds Depreciation and amortization on statement of cash flows $ 14,781,035
Depreciation and amortization on statement of revenues, expenses, and changes in net assets 14,440,923
Difference (depreciation charged to other operating expense accounts) $ 340,112
Interest cost incurred by the Murfreesboro Electric Department, during the construction of capital assets is normally expensed due to the short duration of the construction period. Long-term Debt –In government-wide financial statements, and proprietary fund types in the fund financial statements, long-term debt or other long-term obligations are reported as liabilities in the applicable governmental activities, business-type activities, or proprietary fund type statement of net assets. Bond premiums and discounts, as well as issuance costs, are deferred and amortized over the life of the bonds using the straight-line method which approximates the effective interest method. Bonds payable are reported net of the applicable bond premium and discount. Bond and loan issuance costs are reported as deferred charges and amortized over the term of the related debt. In the fund financial statements, governmental fund types recognize bond premiums and discounts, as well as bond and loan issuance costs, during the current period. The face amount of debt issued is reported as other financing sources. Premiums received on debt issuances are reported as other financing sources while discounts on debt issuances are reported as other financing uses. Issuance costs, whether or not withheld from the actual debt proceeds received, are reported as expenditures.

CITY OF MURFREESBORO, TENNESSEE
Notes to Financial Statements (continued)
June 30, 2011
- 51 -
Note A – SUMMARY OF SIGNIFICANT ACCOUNTING POLICIES (continued)
Assets, Liabilities, and Net Assets or Equity (continued) Compensated Absences – City employees accrue personal leave, sick leave, or compensated absences, by prescribed formula based on length of service. The value of accumulated benefits earned by employees, which may be used in subsequent years or paid upon termination or retirement, is recorded as long-term debt in the government-wide statements and in proprietary fund statements. The current portion of this debt is estimated based on historical trends. A liability for these amounts is reported in governmental funds only if they have matured, for example, as a result of employee resignations and retirements.
Property Taxes – An enforceable legal claim to taxable property arises on January 1 in the year of levy. Taxes are due on October 1 and are collected by the City Recorder. Taxes not paid by December 31 are declared delinquent. A provision for estimated uncollectible taxes is established based on prior collection experience. The government records all property taxes collected within sixty days of year-end as revenue, with the amount not collected within sixty days of year-end as deferred revenue in the fund financial statements. All property taxes receivable are accrued in the government-wide financial statements, including those for which an enforceable claim to taxable property arises on January 1 of the current fiscal year. Deferred revenue is recorded in the government-wide financial statements for the amount of taxes not due until October 1 following the end of the fiscal year. Allowance for Uncollectible Accounts – The City's allowance for estimated uncollectible receivables at June 30, 2011 is as follows:
General Fund Enterprise Fund Allowance for - Taxes Receivable $ 2,234,031 Other 1,542,830 Accounts Receivable $ 18,076 An allowance for uncollectible accounts was not considered necessary for the Murfreesboro Electric Department and the Murfreesboro Water and Sewer Department at June 30, 2011.
Estimates – Management is required to make estimates and assumptions that may affect the reported amounts of assets and liabilities and the reported amounts of revenues and expenses. Actual results could differ from those estimates. Fund balance – Governmental funds utilitize a fund balance presentation of equity. Fund balance is categorized as nonspendable, restricted, committed, assigned or unassigned. Nonspendable Fund Balance – Nonspendable fund balance represents amounts that cannot be spent because they are either not in a spendable form (such as inventory or prepaids) or legally required to remain intact (such as notes receivable or principal of a permanent fund).
Restricted Fund Balance – Restricted fund balance represents amounts with external constraints placed on the use of these resources (such as debt covenants, grantors, other governments, etc.) or imposed by enabling legislation. Committed Fund Balance – Committed fund balance represents amounts that can only be used for specific purposes imposed by a formal action of the City’s highest level of decision-making authority, the City Council. Committed resources cannot be used for any other purpose unless the City Council removes or changes the specified use by the same type of action previously used to commit those amounts, either by resolution or by ordinance.

CITY OF MURFREESBORO, TENNESSEE
Notes to Financial Statements (continued)
June 30, 2011
- 52 -
Note A – SUMMARY OF SIGNIFICANT ACCOUNTING POLICIES (continued)
Assets, Liabilities, and Net Assets or Equity (continued) Assigned Fund Balance – Assigned fund balance represents the amounts the City intends to use for specific purposes as expressed by the City Council or an official delegated the authority to assign amounts. This is the residual classification for all governmental funds other than the general fund. The City Manager has been granted the ability to assign amounts to a specific purpose in the City’s Financial Policy Statements. Unassigned Fund Balance – Unassigned fund balance represents the residual classification for the general fund or deficit balances in other funds.
GeneralPurpose Debt 2010 Other Total
General School Service TML Loan Governmental GovernmentalFund Fund Fund Fund Funds Funds
Fund balances:Nonspendable
Fuel inventory $ 171,097 $ 171,097 Golf inventory 78,490 78,490 Airport inventory $ 48,292 48,292 Cafeteria inventory 101,957 101,957 Prepaids 31,236 31,236 Permanent fund 1,675,280 1,675,280
RestrictedState road projects 213,215 213,215 Law enforcement 257,236 195,121 452,357 Recreation projects 72,340 72,340 State street aid 1,573,926 1,573,926 125 benefit plan 2,214 2,214 Capital projects $ 25,840,456 1,602,781 27,443,237 School cafeteria 74,602 74,602
CommittedState street aid 9,218 9,218 Law enforcement 93,659 93,659 Airport 303,394 303,394 Community development 83 83 Education $ 6,960,240 6,960,240 School cafeteria 1,045,699 1,045,699 Extended school program 731,729 731,729
AssignedRecreation projects 9,142 9,142 School debt 248,071 248,071 Public golf courses 327,571 327,571 Budgetary assignment 4,810,909 4,810,909 Debt service $ 4,799,289 4,799,289 Cemetery operations 228,943 228,943
Unassigned 42,230,413 (2,327,903) 39,902,510 $ 48,451,934 $ 6,960,240 $ 4,799,289 $ 25,840,456 $ 5,356,781 $ 91,408,700

CITY OF MURFREESBORO, TENNESSEE
Notes to Financial Statements (continued)
June 30, 2011
- 53 -
Note A – SUMMARY OF SIGNIFICANT ACCOUNTING POLICIES (continued)
Assets, Liabilities, and Net Assets or Equity (continued) General Purpose Debt 2010 Other Total
General School Service TML Loan Governmental GovernmentalFund Fund Fund Fund Funds Funds
Summary for GovernmentalFunds Balance Sheet
Nonspendable $ 280,823 $ 1,825,529 $ 2,106,352 Restricted 545,005 $ 25,840,456 3,446,430 29,831,891 Comitted $ 6,960,240 2,183,782 9,144,022 Assigned 5,395,693 $ 4,799,289 228,943 10,423,925 Unassigned 42,230,413 (2,327,903) 39,902,510
Total fund balances $ 48,451,934 $ 6,960,240 $ 4,799,289 $ 25,840,456 $ 5,356,781 $ 91,408,700
Spending Policy – Revenues earned may be restricted, committed, assigned or unassigned depending on the fund type. If there is no provision in a grantor agreement regarding earnings on grant proceeds reported in the general fund, earnings will be unassigned for use of the general fund. If a grant agreement involves a local match, the match will be considered assigned for the purpose of the grant by the Mayor and Council upon approval of the grant. Unless otherwise stated, fund balance will be spent in the following order: Restricted Committed Assigned Unassigned
Reclassifications – Certain reclassifications have been made to the prior year financial statements in order to conform to the current year presentation.
Note B – RECONCILIATION OF GOVERNMENT-WIDE AND FUND FINANCIAL STATEMENTS
The governmental fund balance sheet includes a reconciliation between fund balance – total governmental funds and net assets – governmental activities as reported in the government-wide statement of net assets. One element of that reconciliation explains that “long-term liabilities, including bonds and loans payable, are not due and payable in the current period and, therefore, are not reported in the funds.” The details of this $249,785,097 difference are as follows:

CITY OF MURFREESBORO, TENNESSEE
Notes to Financial Statements (continued)
June 30, 2011
- 54 -
Note B – RECONCILIATION OF GOVERNMENT-WIDE AND FUND FINANCIAL STATEMENTS (continued)
General Government - General Obligation Refunding Bonds $ 45,510,000 Add: Unamortized Premium 5,378,343 TML Notes Payable 167,584,136 Capital lease obligation 403,894 Capital Outlay Note 2,354,350 Compensated absences 6,899,891 Post-employment benefit obligation 20,061,653 Landfill post-closure costs 1,425,000
Murfreesboro City SchoolsCompensated absences 167,830
$ 249,785,097
The governmental fund statement of revenues, expenditures, and changes in fund balances includes a reconciliation between net change in fund balances – total governmental funds and change in net assets of governmental activities as reported in the government-wide financial statement of activities. One element of that reconciliation explains that “Governmental funds report capital outlays as expenditures. However, in the statement of activities, the cost of those assets is allocated over their estimated useful lives and reported as depreciation expense. This is the amount by which capital outlays exceeded depreciation in the current period.”
The details of this $7,504,531 difference are as follows:
Capital outlay $ 23,636,592 Depreciation (16,132,061) Net adjustment $ 7,504,531
Another element of that reconciliation states that “The net effect of various transactions involving capital assets (i.e., sales, trade-ins, and contributed assets) is to increase net assets.” The details of this $370,864 difference are as follows:
In the statement of activities, only the gain on the sale ofcapital assets is reported. However, in the governmentalfunds, the proceeds from the sale increase financial resources.Thus, the change in net assets differs from the change in fund balance by the cost of the capital assets sold. $ (382,739)
Donations of capital assets increase net assets in the state-ment of activities, but do not appear in the governmental funds because they are not financial resources. 753,603 Net adjustment $ 370,864
Another element of that reconciliation states that “The issuance of long-term debt (e.g., bonds, leases) provides current financial resources to governmental funds, while the repayment of the principal of long-term debt consumes the current financial resources of governmental funds. Neither transaction, however, has any effect on net assets. Also, governmental funds report the effect of issuance costs, premiums, discounts, and similar items when debt is first issued, whereas these amounts are deferred and amortized in the statement of activities.” The details of this $(36,918,879) difference are as follows:

CITY OF MURFREESBORO, TENNESSEE
Notes to Financial Statements (continued)
June 30, 2011
- 55 -
Note B – RECONCILIATION OF GOVERNMENT-WIDE AND FUND FINANCIAL STATEMENTS (continued)
Debt issued or incurred $ (52,474,806)Amortization of premium 597,594Principal repayments 20,699,775Amortization of loan costs (130,593)Increase in capital lease obligations (538,526)Payments on capital lease obligations 134,632Increase in OPEB liability (5,206,955) Net adjustment $ (36,918,879)
Note C – STEWARDSHIP, COMPLIANCE, AND ACCOUNTABILITY
Budgets and Budgetary Accounting – General governmental revenue and expenditures accounted for in budgetary funds are controlled by a formal integrated budgetary accounting system in accordance with various legal requirements, which govern the City's operations. Budgets have been adopted for the following funds:
General Fund Debt Service Funds Special Revenue Funds – State Street Aid Fund, Airport Fund, Drug Enforcement Fund, Community Development Fund, General Purpose School Fund, Extended School Program Fund, School Cafeteria Fund and Federal and State Program Funds. Capital Projects Funds – Capital Improvement and Contingency Fund, Gateway Project Fund, 1998 TML Fund, 1999 TML Fund, 2001 TML Fund, 2004 TML Fund, 2008 TML Fund, and 2010 TML Fund.
Annual budgets are adopted on a basis consistent with generally accepted accounting principles for all governmental funds with the exception of those funds of the Murfreesboro Board of Education. The budgets of the General Purpose School Fund, School Cafeteria Fund, the Federal and State Program Funds, and the Extended School Program Fund are prepared on a basis consistent with generally accepted accounting principles except that encumbrances are treated as budgeted expenditures in the year of the commitment to purchase. Budgetary comparisons presented in this report for these funds are on this budgetary basis.
Funds without annual budgets are as follows:
Internal Service Funds School Activity Agency Fund Extended School Private Purpose Trust Fund
Pension Trust Funds Permanent Fund
The City charter provides that the City Council shall adopt the annual budget prepared by City Management. This budget is reviewed by the City Council and is formally adopted by the passage of a budget ordinance. The City Manager is authorized to transfer budgeted amounts between departments within any fund; however, any revision that alters the total expenditures of any fund must be approved by the City Council. All unencumbered and unexpended appropriations lapse at the end of the fiscal year. The budget amounts presented in the accompanying required supplemental information reflect the original and final amounts as revised and approved by the City Council.

CITY OF MURFREESBORO, TENNESSEE
Notes to Financial Statements (continued)
June 30, 2011
- 56 -
Note C – STEWARDSHIP, COMPLIANCE, AND ACCOUNTABILITY (continued)
Encumbrances – Encumbrances represent commitments related to unperformed (executory) contracts for goods and services. Encumbrance accounting, under which purchase orders, contracts, and other commitments for the expenditure of monies are recorded in order to reserve that portion of the applicable appropriation, is used by the General Purpose School Fund, the School Cafeteria Fund, the Federal and State Program Funds, and the Extended School Program Fund. Encumbrances outstanding at year-end are reported as reservations of fund balances and do not constitute expenditures or liabilities since the commitments will be honored during the subsequent year. However, encumbrances constitute the equivalent of expenditures for budgetary purposes and, accordingly, the accompanying financial statements present comparisons of actual results to the budgets on the budget basis for the General Purpose School Fund, the School Cafeteria Fund, the Federal and State Program Funds, and the Extended School Program Fund. Budgetary – GAAP Reporting Reconciliation - The accompanying Schedule of Revenues, Expenditures, and Changes in Fund Balance-Budget and Actual for the General Purpose School Fund presents comparisons of the legally adopted budget (described above) with actual data on a budgetary basis. The accompanying Schedule of Revenues, Expenditures, and Changes in Fund Balance-Budget and Actual for the General Fund are presented in accordance with generally accepted accounting principles (GAAP). Because accounting principles applied for purposes of developing data on a budgetary basis differ significantly from those used to present financial statements in accordance with GAAP, a reconciliation of resultant basis and timing differences in the excess of revenues and other sources over expenditures and other uses for the year ended June 30, 2011 is presented as follows:
Net change in fund balance (Budgetary Basis) $ (1,945,170) Adjustments: To adjust for net change in encumbrances 1,624,335 Net change in fund balance (GAAP Basis) $ (320,835)
General PurposeSchool Fund
Note D – RELATED ORGANIZATIONS
The City Council is also responsible for appointing or approving appointments to the boards of other organizations, but the City's accountability for these organizations does not extend beyond making the appointments. The City appoints or approves appointments to the boards of the Murfreesboro Housing Authority and the Linebaugh Public Library System.

CITY OF MURFREESBORO, TENNESSEE
Notes to Financial Statements (continued)
June 30, 2011
- 57 -
Note E – CASH AND INVESTMENTS
Investments – As of June 30, 2011, the City had the following investments and maturities:
FairValue <1 1-5 6-10 >10
Employee Pension Plan U.S. Treasury Notes $ 2,921,757 $ 1,163,242 $ 1,068,460 $ 690,055 Federal Home Loan Bank 1,008,376 356,522 651,854 Federal Home Loan Mortgage Corp. 1,733,665 $ 1,733,665 Federal National Mortgage Assoc. 4,705,792 126,671 4,579,121 Federal Farm Credit Bank 2,183,611 525,209 1,658,402 Government National Mortgage Assoc. 330,970 330,970 Corporate Bonds & Notes 13,477,677 464,286 8,521,681 3,880,785 610,925
Total $ 26,361,848 $ 1,627,528 $ 10,471,872 $ 7,007,767 $ 7,254,681
Investment Maturities in Years
Electric Department Pension Plan Federal Home Loan Bank $ 568,727 $ 104,481 $ 464,246 Federal Farm Credit Bank 1,407,420 1,407,420 Federal National Mortgage Assoc. 200,264 $ 200,264 Corporate Bonds & Notes 3,754,637 2,884,281 870,356
Total $ 5,931,048 $ 2,988,762 $ 2,742,022 $ 200,264
Perpetual Care Cemetery Fund Federal Home Loan Bank $ 349,945 $ 50,078 $ 77,445 $ 222,422 Federal Farm Credit Bank 309,262 25,004 284,258 Corporate Bonds & Notes 665,725 505,606 160,119
Total $ 1,324,932 $ 50,078 $ 608,055 $ 666,799
State statutes authorize the City to invest operating funds in bonds, notes or treasury bills of the United States or any of its agencies, certificates of deposit at Tennessee state chartered banks and savings and loan associations and federally chartered banks and savings and loan associations, repurchase agreements utilizing obligations of the United States or its agencies as the underlying securities, and state pooled investment fund. Statutes also require that securities underlying repurchase agreements must have a market value at least equal to the amount of funds invested in the repurchase transaction. Investments held by employee pension plans are limited to those types allowed by plan documents.
Interest rate risk – The City does not have a formal policy to limit exposure to interest rate risk for investments.
Credit risk –The City does not have a formal policy related to credit risk. However, the pension committee has an investment directive for its investments to maintain an overall credit quality of “A” for its portfolio. At June 30, 2011, the City had investments in obligations of U.S. government agencies that are only implicitly guaranteed by the U.S. government. The Moody’s rating for these obligations is AAA. At June 30, 2011, the City had investments in corporate bonds rated by Moody’s as presented as follows:

CITY OF MURFREESBORO, TENNESSEE
Notes to Financial Statements (continued)
June 30, 2011
- 58 -
Note E – CASH AND INVESTMENTS (continued)
Electric PerpetualMoody's City's Pension Department CareRating Plan Pension Plan Cemetery
A1 $ 2,313,492 $ 354,646 $ 109,424 A2 4,012,323 1,255,149 241,292 A3 211,031 28,162
AA1 204,292 AA2 1,399,750 601,092 108,590 AA3 579,840 105,869 AAA 336,211 69,211 26,698 BA1 22,669 BA2 52,885
BAA1 1,522,412 1,089,636 26,199 BAA2 1,911,827 102,956 100,206 BAA3 404,742 176,078 25,154
NR 506,203 $ 13,477,677 $ 3,754,637 $ 665,725
NR=not rated
Custodial credit risk - deposits –In the case of deposits, this is the risk that in the event of a bank failure, the government’s deposits may not be returned to it. The City does not have a deposit policy for custodial credit risk. At June 30, 2011, total demand deposits and certificates of deposit for the City were insured and/or collateralized in one of the following ways. Certain deposits were held in financial institutions, which are members of the Tennessee Bank Collateral Pool. The Tennessee Bank Collateral Pool (the pool) is a multiple financial institution collateral pool in which member financial institutions holding public funds pledge collateral securities. In the event any member financial institution fails, the entire collateral pool becomes available to satisfy the claims of governmental entities. The pool also has the ability to make additional assessments on a pro rata basis to the pool if the value of collateral is inadequate to cover a loss. Other deposits were adequately insured either by collateral securities held by the City’s agent in the City’s name or Federal Depository Insurance. The City’s deposits in financial institutions were entirely insured or collateralized at June 30, 2011. Custodial credit risk - investments – For an investment, this is the risk that, in the event of the failure of a counterparty, the government will not be able to recover the value of its investments or collateral securities that are in the possession of an outside party. The City does not have an investment policy for custodial credit risk. Of the investment in corporate bonds and notes and municipal bonds and notes, $13,477,677, $3,754,637 and $665,725 of the City’s Employee Pension Plan, Electric Department Pension Plan and Evergreen Cemetery fund, respectively, are uninsured and unregistered investments for which securities are held by the counterparty or its trust department or agent, but not in the City’s name.

CITY OF MURFREESBORO, TENNESSEE
Notes to Financial Statements (continued)
June 30, 2011
- 59 -
Note F – CAPITAL ASSETS
Capital asset activity for the year ended June 30, 2011, was as follows: Balance Balance Governmental activities - July 1, 2010 Increases Decreases June 30, 2011
Capital assets, not being depreciated - Land $ 241,332,693 $ 3,780,213 $ 280,690 $ 244,832,216 Construction in progress 31,988,842 19,539,638 29,900,145 21,628,335
Subtotal $ 273,321,535 $ 23,319,851 $ 30,180,835 $ 266,460,551
Capital assets, being depreciated - Buildings $ 124,315,712 $ 4,279,479 $ 47,729 $ 128,547,462 Improvements other than buildings 61,220,267 4,619,300 89,000 65,750,567 Equipment 47,275,379 5,573,576 737,773 52,111,182 Computer software 1,289,272 716,186 2,005,458 Infrastructure 286,754,648 15,781,949 302,536,597
Subtotal $ 520,855,278 $ 30,970,490 $ 874,502 $ 550,951,266
Less accumulated depreciation
Buildings $ (30,032,648) $ (2,653,357) $ 19,282 $ (32,666,723) Improvements other than buildings (22,145,855) (2,991,729) 89,000 (25,048,584)
Equipment (28,978,205) (3,741,381) 664,171 (32,055,415) Computer software (413,627) (88,430) (502,057) Infrastructure (58,244,387) (6,657,164) (64,901,551)
Subtotal $ (139,814,722) $ (16,132,061) $ 772,453 $ (155,174,330)
Capital assets, being depreciated, net $ 381,040,556 $ 14,838,429 $ 102,049 $ 395,776,936
Capital assets, net $ 654,362,091 $ 38,158,280 $ 30,282,884 $ 662,237,487

CITY OF MURFREESBORO, TENNESSEE
Notes to Financial Statements (continued)
June 30, 2011
- 60 -
Note F – CAPITAL ASSETS (continued)
Depreciation expense was charged to functions/programs of the primary government as follows:
Balance Balance July 1, 2010 Increases Decreases June 30, 2011Business-type activities - Capital assets, not being depreciated
Land $ 21,657,733 $ 423,600 $ 22,081,333 Construction in progress 87,185,587 8,856,033 $ 78,480,587 17,561,033 Subtotal $ 108,843,320 $ 9,279,633 $ 78,480,587 $ 39,642,366
Capital assets, being depreciated - Structures and improvements $ 68,541,791 $ 31,985,715 $ 19,952 $ 100,507,554 Transmission and distribution mains 263,510,731 28,642,773 368,900 291,784,604 Electric plant 131,692,721 11,033,721 1,139,348 141,587,094 Equipment 35,822,491 16,203,719 291,302 51,734,908 Subtotal $ 499,567,734 $ 87,865,928 $ 1,819,502 $ 585,614,160
Less: accumulated depreciation -Structures and improvements $ (12,175,359) $ (1,674,523) $ (18,172) $ (13,831,710) Transmission and distribution mains (62,675,262) (5,527,989) (368,900) (67,834,351) Electric plant (32,795,404) (5,044,526) (1,357,251) (36,482,679) Equipment (20,145,335) (2,522,076) (276,591) (22,390,820)
$ (127,791,360) $ (14,769,114) $ (2,020,914) $ (140,539,560) Capital assets, being depreciated, net $ 371,776,374 $ 73,096,814 $ (201,412) $ 445,074,600 Capital assets, net $ 480,619,694 $ 82,376,447 $ 78,279,175 $ 484,716,966
Governmental activities - General government $ 460,658 Police 776,741 Fire protection 595,470 Human resources 2,143 Streets and signs 6,800,055 Planning and engineering 26,279 Building and codes 1,841 Solid waste 813,489 Transportation 147,388 Urban environmental 34,951 Public health, safety and other 102,343 Community services 337,003 Recreation 3,150,558 Education 2,883,142 Total governmental activities depreciation expense $ 16,132,061

CITY OF MURFREESBORO, TENNESSEE
Notes to Financial Statements (continued)
June 30, 2011
- 61 -
Note F – CAPITAL ASSETS (continued) The Murfreesboro Electric Department follows the Federal Energy Regulatory Commission’s unique system of accounting which is required for TVA distributors. Accordingly, when a plant asset is of a depreciable class the cost of removal shall be charged to the accumulated provision for depreciation applicable to such property. Removal costs charged to accumulated depreciation for the fiscal year ended June 30, 2011 are $372,157. Depreciation expense was charged to functions/programs of the business-type activities as follows:Business-type activities:
Water and sewer $ 9,217,373 Electric 5,423,231 Cemetery 26,500 Stormwater fund 102,010
Total business-type activities depreciation expense $ 14,769,114
Note G – LONG-TERM LIABILITIES
General Obligation Refunding Bonds – During the year ended June 30, 2010, the City of Murfreesboro refinanced five of its Tennessee Municipal Bond Fund Loans by issuing $65,855,000 in general obligation refunding bonds with a maturity date of June 1, 2020 and bearing fixed rates ranging from 2.00% to 5.00%. Certain bonds are subject to federal arbitrage regulations. The Tennessee Municipal Bond Fund Loans were refinanced to reduce the risk of rising interest rates by converting variable rate debt to fixed rate debt.
Year EndingJune 30, Principal Interest
2012 $ 8,090,000 $ 2,275,500 2013 7,955,000 1,871,000 2014 7,800,000 1,473,250 2015 3,680,000 1,083,250 2016 3,855,000 899,250
2017-2020 14,130,000 1,597,750 $ 45,510,000 $ 9,200,000
Governmental Activities
Revenue and Tax Refunding Bonds – During the year ended June 30, 2010 the Electric Department and the Water and Sewer Department refinanced several of their Tennessee Municipal Fund Bond Loans by issuing $15,445,000 and $40,860,000, respectively, in revenue and tax refunding bonds in conjunction with the City of Murfreesboro with maturity dates the same dates as the original Tennessee Municipal Fund Bonds. The maturities for the revenue and tax bonds for the Electric Department range from 2012-2021 and bear interest at a rates ranging from 2.00% to 3.375%. The maturities for the revenue and tax bonds for the Water and Sewer Department range from 2012-2026 and bear interest at rates ranging from 2.00% to 5.00%. The new bonds are secured by a pledge of net revenues from operations.

CITY OF MURFREESBORO, TENNESSEE
Notes to Financial Statements (continued)
June 30, 2011
- 62 -
Note G – LONG-TERM LIABILITIES (continued)
Revenue bonds outstanding at the end of the year are as follows: Purpose Interest Rates Amount Electric Department – Series 2009 2.00-3.75% $ 10,035,000 Water and Sewer Department – Series 2009 2.00-5.00% 36,255,000 $ 46,290,000 Maturities of the revenue bonds are as follows:
Year Ending June 30, Principal Interest
2012 $ 4,380,000 $ 1,779,038 2013 4,840,000 1,605,738 2014 4,930,000 1,500,338 2015 2,440,000 1,314,312 2016 2,525,000 1,222,300
2017-2021 14,210,000 4,401,274 2022-2026 12,965,000 1,331,200
$ 46,290,000 $ 13,154,200
Tennessee Municipal Bond Fund Loans The City participated in the Tennessee Municipal Bond Fund Loan program and entered into loan agreements from the Public Building Authority of the City of Clarksville, Tennessee. Tennessee Municipal Loans outstanding at year end are as follows: Purpose Interest Rates Amount Governmental activities Variable $ 119,984,136 Governmental activities 2.89% 47,600,000 $ 167,584,136 Business-type activities Variable 47,378,691 $ 214,962,827 Interest rates are set by the remarketing agent and are based on the market price of the bonds underlying the loans. Annual debt service requirements to maturity are as follows:
Year Ending Governmental Activities Business-type Activities June 30, Principal Interest Principal Interest
2012 $ 14,176,310 $ 1,912,942 $ 2,500,000 $ 1,873,979 2013 14,503,440 1,778,647 2,611,000 1,778,267 2014 14,879,860 1,641,100 2,726,000 1,678,304 2015 14,005,480 1,500,421 2,847,000 1,573,928 2016 12,795,925 1,361,326 2,973,000 1,464,909 2017-2021 65,356,907 4,768,206 16,956,000 5,512,810 2022-2026 31,866,214 1,437,908 16,260,000 2,089,270 2027 505,691 22,757
$ 167,584,136 $ 14,400,550 $ 47,378,691 $ 15,994,224
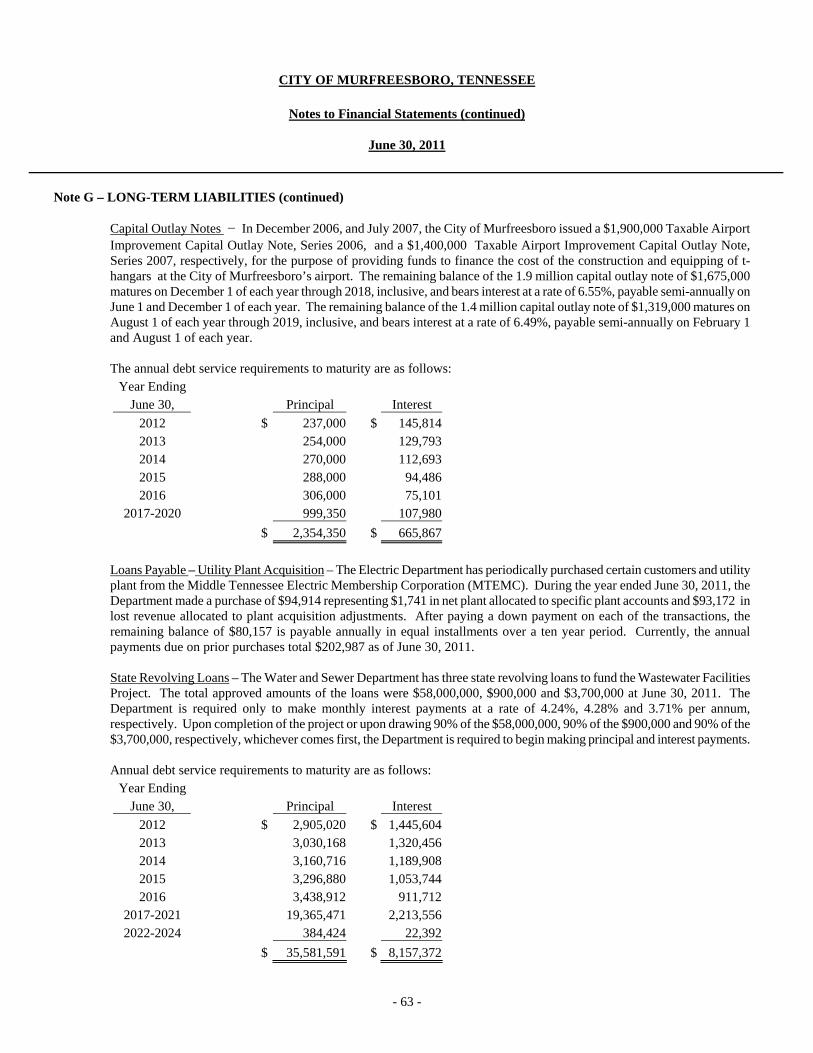
CITY OF MURFREESBORO, TENNESSEE
Notes to Financial Statements (continued)
June 30, 2011
- 63 -
Note G – LONG-TERM LIABILITIES (continued)
Capital Outlay Notes – In December 2006, and July 2007, the City of Murfreesboro issued a $1,900,000 Taxable Airport Improvement Capital Outlay Note, Series 2006, and a $1,400,000 Taxable Airport Improvement Capital Outlay Note, Series 2007, respectively, for the purpose of providing funds to finance the cost of the construction and equipping of t-hangars at the City of Murfreesboro’s airport. The remaining balance of the 1.9 million capital outlay note of $1,675,000 matures on December 1 of each year through 2018, inclusive, and bears interest at a rate of 6.55%, payable semi-annually on June 1 and December 1 of each year. The remaining balance of the 1.4 million capital outlay note of $1,319,000 matures on August 1 of each year through 2019, inclusive, and bears interest at a rate of 6.49%, payable semi-annually on February 1 and August 1 of each year. The annual debt service requirements to maturity are as follows:
Year Ending June 30, Principal Interest
2012 $ 237,000 $ 145,814 2013 254,000 129,793 2014 270,000 112,693 2015 288,000 94,486 2016 306,000 75,101 2017-2020 999,350 107,980
$ 2,354,350 $ 665,867
Loans Payable – Utility Plant Acquisition – The Electric Department has periodically purchased certain customers and utility plant from the Middle Tennessee Electric Membership Corporation (MTEMC). During the year ended June 30, 2011, the Department made a purchase of $94,914 representing $1,741 in net plant allocated to specific plant accounts and $93,172 in lost revenue allocated to plant acquisition adjustments. After paying a down payment on each of the transactions, the remaining balance of $80,157 is payable annually in equal installments over a ten year period. Currently, the annual payments due on prior purchases total $202,987 as of June 30, 2011. State Revolving Loans – The Water and Sewer Department has three state revolving loans to fund the Wastewater Facilities Project. The total approved amounts of the loans were $58,000,000, $900,000 and $3,700,000 at June 30, 2011. The Department is required only to make monthly interest payments at a rate of 4.24%, 4.28% and 3.71% per annum, respectively. Upon completion of the project or upon drawing 90% of the $58,000,000, 90% of the $900,000 and 90% of the $3,700,000, respectively, whichever comes first, the Department is required to begin making principal and interest payments. Annual debt service requirements to maturity are as follows:
Year Ending June 30, Principal Interest
2012 $ 2,905,020 $ 1,445,604 2013 3,030,168 1,320,456 2014 3,160,716 1,189,908 2015 3,296,880 1,053,744 2016 3,438,912 911,712 2017-2021 19,365,471 2,213,556 2022-2024 384,424 22,392
$ 35,581,591 $ 8,157,372

CITY OF MURFREESBORO, TENNESSEE
Notes to Financial Statements (continued)
June 30, 2011
- 64 -
Note G – LONG-TERM LIABILITIES (continued)
Long-term liability activity for the year ended June 30, 2011, was as follows:
Balance Balance Due WithinJuly 1, 2010 Additions Deductions June 30, 2011 One Year
Governmental Activities -
General Obligation refunding bonds $ 55,215,000 $ 9,705,000 $ 45,510,000 $ 8,090,000 Add: Premium on refunding 5,975,937 597,594 5,378,343
General Obligation refunding bondsreported by Water and Sewer Fund (1) (363,125) (363,125)
$ 60,827,812 $ 9,939,469 $ 50,888,343 $ 8,090,000 Capital lease obligation $ 538,526 134,632 403,894 134,600 Capital outlay notes 2,578,350 224,000 2,354,350 237,000 Tennessee Municipal Bond Fund Loans 126,243,230 52,474,806 11,133,900 167,584,136 14,176,310
$ 189,649,392 $ 53,013,332 $ 21,432,001 $ 221,230,723 $ 22,637,910 Estimated landfill closure costs 1,425,000 1,425,000 85,000 Compensated absences 6,668,923 2,044,207 1,645,409 7,067,721 1,090,866 Post-employment benefit obligation 14,854,698 5,206,955 20,061,653 Claims and judgements 5,879,000 2,543,595 2,438,595 5,984,000 2,295,204
Governmental activity - Long-term liabilities $ 218,477,013 $ 62,808,089 $ 25,516,005 $ 255,769,097 $ 26,108,980
Business-type Activities -
Revenue Bonds $ 51,270,000 $ 4,980,000 $ 46,290,000 $ 4,380,000 General Obligation Debt (1) 363,125 363,125 Matured bonds payable 36,000 36,000 Add: premium on refunding 2,878,792 239,778 2,639,014 Less: deferred amount -
on refunding (104,576) (6,469) (98,107) $ 54,443,341 $ 5,576,434 $ 48,866,907 $ 4,380,000
State revolving loan 38,366,654 2,785,063 35,581,591 2,905,020 Compensated absences 2,901,893 $ 483,669 291,302 3,094,260 914,705 Post-employment benefit obligation 3,624,703 1,386,317 5,011,020 Tennessee Municipal Bond Fund Loans 42,903,203 6,871,491 2,396,003 47,378,691 2,500,000 Loans payable - Utility plant
acquisition 963,430 80,156 213,745 829,841 203,078 Business-type activity -
Long-term liabilities $ 143,203,224 $ 8,821,633 $ 11,262,547 $ 140,762,310 $ 10,902,803
Capital Lease – The Murfreesboro City Schools (MCS) lease certain equipment under an agreement that is classified as a capital lease. The remaining capital lease obligation is $403,894 at June 30, 2011. Payments due on the lease are approximately $134,600 due in equal installments in 2012 through 2014. The lease bears no interest and MCS has imputed no interest as the amount is not considered material. The cost of equipment under capital leases is included in the statement of net assets as equipment and was $538,526 at June 30, 2011. Accumulated amortization of leased equipment at June 30, 2011 was $127,900. Amortization of assets under the capital lease is included in depreciation expense.

CITY OF MURFREESBORO, TENNESSEE
Notes to Financial Statements (continued)
June 30, 2011
- 65 -
Note G – LONG-TERM LIABILITIES (continued)
Internal service funds predominantly serve the governmental funds. Accordingly, long-term liabilities for them are included as part of the above totals for governmental activities. At year end, $5,984,000 of internal service funds claims and judgments are included in the above amounts. For governmental activities, compensated absences, net pension obligations and other postemployment benefit obligations are generally liquidated by the general fund and claims and judgments are liquidated by the risk management fund.
Note H – CONSERVATION PROGRAMS
The Murfreesboro Electric Department is a fiscal intermediary for the Tennessee Valley Authority's conservation programs. At June 30, 2011, outstanding funds advanced by TVA totaled $1,515,435 to be used by the customers of the Department in connection with TVA's insulation, water heater, and heat pump conservation programs. At June 30, 2011, the outstanding receivables for loans made from these funds amounted to $1,482,700.
Note I – EMPLOYEE PENSION PLANS
The City maintains two single employer defined benefit pension plans (the City of Murfreesboro Employees' Pension Plan and the Murfreesboro Electric Department Employee Pension). The City also provides one defined contribution plan (the City of Murfreesboro Employees’ Pension Plan – Defined Contribution) and participates in the Tennessee Consolidated Retirement System, an agent, multiple-employer public employee retirement system (PERS). The City of Murfreesboro Employees' Pension Plan and the Murfreesboro Electric Department Employee Pension are included in the accompanying financial statements as pension trust funds. The following is a summary of each of these plans: City of Murfreesboro Administered Pension Plans – Plan Descriptions and Provisions City of Murfreesboro Employees' Pension Plan – Defined Benefit – The defined benefit pension plan covers all City employees except those employees of the school system, the Evergreen Cemetery Commission and electric department. All other departments of the City, including the water and sewer department, are covered by the plan. The funds of the retirement plan are invested in trust funds managed by SunTrust Bank, Nashville, N.A. and Pinnacle National Financial who serve as co-trustees for the plan. Employees hired after June 30, 2010 are not eligible to participate in this plan. In accordance with the City Code, subject to approval by the City Council, pension plan provisions may be established or amended by the pension committee. Contribution rates are recommended by the pension committee based on the annual actuarial valuation report, and must also be approved by City Council. Employees who were regularly employed for at least 30 hours per week for at least six months of the year became eligible to participate upon completion of ninety days of employment. The plan provides for a basic monthly pension beginning at normal retirement age, a disability benefit, and a death benefit prior to retirement, all of which are based upon the monthly compensation of the participant. The plan was amended on July 1, 1988 to make the plan noncontributory whereby the employer contributes the entire amount necessary to fund the system. The current funding policy is to contribute 12.57% of covered salary. Over the years the actual contributions have exceeded the Annual Required Contributions developed under GASB 25/27 resulting in a cumulative negative Net Pension Obligation (NPO) at June 30, 2010 in the amount of $537,975. The amount funded was less than the required amount for the fiscal year ending 2011 resulting in a cumulative positive Net Pension Obligation of $31,740.

CITY OF MURFREESBORO, TENNESSEE
Notes to Financial Statements (continued)
June 30, 2011
- 66 -
Note I – EMPLOYEE PENSION PLANS (continued)
The normal retirement benefit, one twelfth of which is payable monthly for life, with the first 60 payments guaranteed, is equal to 2% of average earnings, multiplied by the total years of employment not in excess of 30 years. “Average earnings” is the average annual basic earnings of a member for the five consecutive years of employment which produce the highest average. The plan was also amended on July 1, 1988 concerning age of retirement. In past years, the plan provided for a basic monthly pension beginning at normal retirement age. The plan as amended provides for a basic monthly pension beginning at age 55, instead of 65, provided the participant has at least 30 years of service. The normal retirement age for a fire fighter or police officer is the member’s 55th birthday. Actuarial assumptions have been revised periodically to reflect actual plan experience and expectations regarding future events. The most recent assumption revision was effective July 1, 2007 and changed the mortality assumption from the 1983 Group Annuity Mortality Table to the RP 2000 Combined Mortality Table. The City has the right to further amend or terminate the plan. The City uses the accrual basis of accounting for the plan. Investment income is recognized when it is earned and expenses are recognized when they are incurred. Contributions are recognized when due. Benefits and refunds are recognized when due and payable under the terms of the plan. The plan does not issue a separate financial report, but is included in the accompanying financial statements as a pension trust fund. There were three investments in a mutual fund representing more than 5% of the net assets available for benefits as shown as follows:
Percentage ofInvestment in Mutual Fund Amount Net Assets
Dodge & Cox International Stock Fund $ 9,073,151 10.27%PIMCO Global Bond Fund $ 6,269,944 7.10%Legg Mason Global Opp Bond Fund $ 6,746,224 7.64%
The costs of administering the plan are financed by the City of Murfreesboro’s general fund. There are no related party transactions involving the pension trust.
Murfreesboro Electric Department Employee Pension - The Murfreesboro Electric Department provides a defined benefit pension plan with contributions made to a separate fund named the Murfreesboro Electric Department Pension Trust. Pension plan provisions may be established or amended by the Board of Trustees under the authority of the pension trust document. The Board approves contribution rates based on recommendations included in the annual actuarial valuation report. The plan covers all full-time employees upon the completion of one year of service and attainment of age 25. The plan does not cover employees that have attained age 60 on the date of hire. Upon retirement, the participant's monthly benefit is determined based upon 2% of the highest five years of average monthly compensation multiplied by years of employment up to thirty years. Normal retirement age is 60, but a participant may retire at age 55 upon the completion of 10 years of service. Participants are fully vested after five years of credited service. The basic form of the retirement payments is a life annuity for single and a joint survivor annuity for married participants. Subject to the application plan conditions, a participant may select an optional method of benefit payments which is actuarially equivalent to the basic benefit payment. Lump sum payments of deferred vested benefits valued at less than $10,000 can be made to terminated participants at the discretion of the Retirement Committee. Benefit payments to participants are recorded upon distribution. The Plan has received and maintains a favorable determination letter from the Internal Revenue Service concerning its tax-exempt status. The cost of the plan is borne solely by the employer. Participant contributions are not allowed.
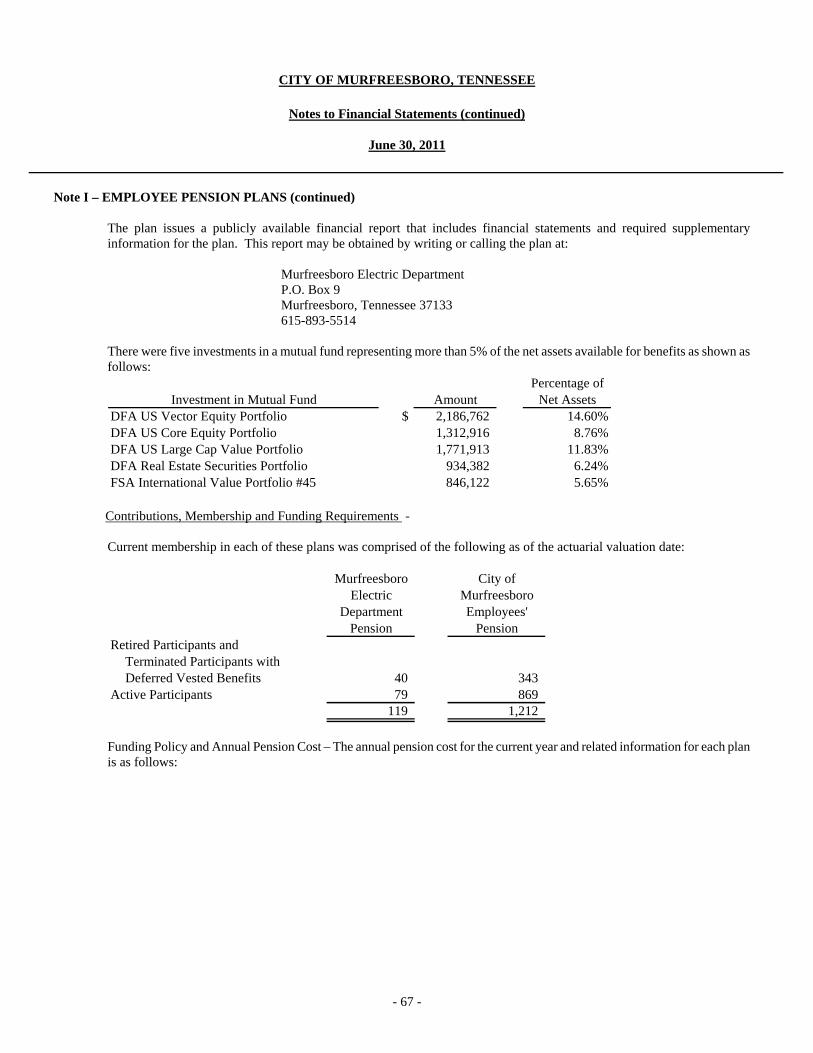
CITY OF MURFREESBORO, TENNESSEE
Notes to Financial Statements (continued)
June 30, 2011
- 67 -
Note I – EMPLOYEE PENSION PLANS (continued)
The plan issues a publicly available financial report that includes financial statements and required supplementary information for the plan. This report may be obtained by writing or calling the plan at:
Murfreesboro Electric Department P.O. Box 9 Murfreesboro, Tennessee 37133 615-893-5514
There were five investments in a mutual fund representing more than 5% of the net assets available for benefits as shown as follows:
Percentage ofInvestment in Mutual Fund Amount Net Assets
DFA US Vector Equity Portfolio $ 2,186,762 14.60%DFA US Core Equity Portfolio 1,312,916 8.76%DFA US Large Cap Value Portfolio 1,771,913 11.83%DFA Real Estate Securities Portfolio 934,382 6.24%FSA International Value Portfolio #45 846,122 5.65%
Contributions, Membership and Funding Requirements - Current membership in each of these plans was comprised of the following as of the actuarial valuation date:
Murfreesboro City ofElectric Murfreesboro
Department Employees'Pension Pension
Retired Participants and Terminated Participants withDeferred Vested Benefits 40 343
Active Participants 79 869 119 1,212
Funding Policy and Annual Pension Cost – The annual pension cost for the current year and related information for each plan is as follows:

CITY OF MURFREESBORO, TENNESSEE
Notes to Financial Statements (continued)
June 30, 2011
- 68 -
Note I – EMPLOYEE PENSION PLANS (continued)
Murfreesboro City ofElectric Murfreesboro
Department Employees'Pension Pension
Annual pension cost $ 930,409 $ 5,130,945
Contributions made $ 930,409 $ 4,561,230
Actuarial valuation date July 1, 2011 July 1, 2011
Actuarial cost method Entry Age Normal Entry Age Normal
Amortization method Level dollar Level dollar
Amortization period - open 30 years 30 years
Remaining amortization period 14 years 26 years
Asset valuation method Market Five-year Smoothing Actuarial assumptions: Investment rate of return 7.0% 7.3% Projected salary increases 4.5% 4.0% Inflation rate N/A N/A
Annual Percentage Net PensionYear Pension of APC Obligation
Ended Cost (APC) Contributed (Benefit)Murfreesboro Electric 06/30/09 $ 793,813 100.00% $ -0-
Department Pension 06/30/10 $ 1,145,337 100.00% $ -0-06/30/11 $ 930,409 100.00% $ -0-
City of Murfreesboro 07/01/09 $ 4,453,252 100.97% $ (1,096,887) Employee's Pension 07/01/10 $ 5,007,182 88.84% $ (537,975)
07/01/11 $ 5,130,945 88.90% $ 31,740
Three-Year Trend Information

CITY OF MURFREESBORO, TENNESSEE
Notes to Financial Statements (continued)
June 30, 2011
- 69 -
Note I – EMPLOYEE PENSION PLANS (continued)
Actuarial UAAL as aActuarial Accrued Unfunded Annual Percentage of
Actuarial Value of Liability AAL Funded Covered CoveredValuation Plan Assets (AAL) (UAAL) Ratio Payroll Payroll
Date ( a ) ( b ) ( b-a ) (a/b ) ( c ) (b-a )/( c )
Murfreesboro Electric Department Pension:
07/01/09 $ 10,265,821 $ 11,482,378 $ 1,216,557 89.4% $ 4,080,267 29.8%07/01/10 $ 12,205,440 $ 13,378,372 $ 1,172,932 91.2% $ 4,146,459 28.3%07/01/11 $ 14,979,684 $ 16,476,417 $ 1,496,733 90.9% $ 4,744,690 31.5%
City of Murfreesboro Employees' Pension
07/01/09 $ 80,040,594 $ 99,166,582 $ 19,125,988 80.7% $ 40,384,320 47.4%07/01/10 $ 83,658,491 $ 105,022,974 $ 21,364,483 79.7% $ 39,994,629 53.4%07/01/11 $ 89,430,262 $ 104,868,389 $ 15,438,127 85.3% $ 37,539,589 41.1%
Schedule of Funding Progress
The net pension obligation has been calculated for the City of Murfreesboro Employees’ Pension plan as follows:
Annual Required Contribution $ 5,123,682 Interest on net pension obligation (40,348) Adjustment to annual required contribution 47,611 Annual pension cost $ 5,130,945 Contributions made (4,561,230) Increase in net pension obligation $ 569,715 Net pension obligation beginning of year (537,975) Net pension obligation end of year $ 31,740
City of Murfreesboro Employees’ Pension Plan – Defined Contribution – Effective July 1, 2010, a defined contribution plan has been implemented by the City. In accordance with the City code, subject to approval by the City Council, pension plan provisions (including contribution requirements) may be established or amended by the pension committee. The defined contribution plan covers all full-time City employees, except those employees of the school system, Evergreen Cemetery Commission and the electric department, hired on or after July 1, 2010. The provisions of this plan require a three percent mandatory employee contribution, with a maximum employee contribution set at eight percent. The City matches 100% of the employee contributions up to eight percent. Employees become 100% vested in the plan after five years of full-time employment. Both the member contribution and the employer contribution for the year ended June 30, 2011 is $15,011. Tennessee Consolidated Retirement System Plan Description – Employees of the Murfreesboro City School System are members of the Political Subdivision Pension Plan (PSPP), an agent multiple-employer defined benefit pension plan administered by the Tennessee Consolidated Retirement System (TCRS). TCRS provides retirement benefits as well as death and disability benefits. Benefits are determined by a formula using the member’s high five-year average salary and years of service. Members become eligible to retire at the age of 60 with 5 (five) years of service or at any age with 30 years of service. A reduced retirement benefit is available to vested members at the age of 55. Disability benefits are available to active members with five years of service who became disabled and cannot engage in gainful employment. There is no service requirement for disability that is the result of an accident or injury occurring while the member was in the performance of duty.

CITY OF MURFREESBORO, TENNESSEE
Notes to Financial Statements (continued)
June 30, 2011
- 70 -
Note I – EMPLOYEE PENSION PLANS (continued)
Members joining the system after July 1, 1979 become vested after 5 (five) years of service and members joining prior to July 1, 1979 were vested after 4 years of service. Benefit provisions are established in state statute found in Title 8, Chapter 34-37 of the Tennessee Code Annotated (TCA). State statutes are amended by the Tennessee General Assembly. Political subdivisions such as the Murfreesboro City School System participate in the TCRS as individual entities and are liable for all costs associated with the operation and administration of their plan. Benefit improvements are not applicable to a political subdivision unless approved by the chief governing body. The TCRS issues a publicly available financial report that includes financial statements and required supplementary information for the PSPP. That report may be obtained by writing to Tennessee Treasury Department, Consolidated Retirement System, 10th Floor, Andrew Jackson Building, Nashville, Tennessee 37243-0230 or can be accessed at www.tn.gov/treasury/tcrs/ps/. Funding Policy – The Murfreesboro City School System plan is noncontributory and has assumed employee contributions up to 5.0 percent of annual covered payroll. The Murfreesboro City School System is required to contribute at an actuarially determined rate; the rate for the fiscal year ended June 30, 2011 was 12.82% of annual covered payroll. The contribution requirement by plan members is set by state statute. The contribution requirement for the Murfreesboro City School System is established and may be amended by the TCRS Board of Trustees.
Annual Pension Cost – For the year ended June 30, 2011, the Murfreesboro City School System’s annual pension cost of $932,148 to TCRS was equal to the Murfreesboro City School System’s required and actual contributions.
The required contribution was determined as a part of the July 1, 2007 actuarial valuation using the frozen entry age actuarial cost method. Significant actuarial assumptions used in the valuation include (a) rate of return on investment of present and future assets of 7.5 percent a year compounded annually, (b) projected 3.0 percent annual inflation rate (c) projected salary increases of 4.75 percent (graded) annual rate (no explicit assumption is made regarding the portion attributable to the effects of inflation on salaries), (d) projected 3.5 percent annual increase in the Social Security wage base, and (e) projected post retirement increases of 2.5 percent annually. The actuarial value of assets was determined using techniques that smooth the effect of short-term volatility in the market value of total investments over a ten-year period. The Murfreesboro City School System’s unfunded actuarial accrued liability is being amortized as a level dollar amount on a closed basis. The remaining amortization period at July 1, 2009 was 6 years. An actuarial valuation was performed as of July 1, 2009, which established contribution rates effective July 1, 2010.
Fiscal Annual Percentage Year Pension of APC
Ending Cost (APC) Contributed06/30/09 $ 826,038 100.00% $ -0-06/30/10 $ 826,790 100.00% $ -0-06/30/11 $ 932,148 100.00% $ -0-
NetPension
Obligation
As of July 1, 2009, the most recent actuarial valuation date, the plan was 87.57% funded. The actuarial accrued liability for benefits was $16.7 million, and the actuarial value of assets was $14.7 million, resulting in an unfunded actuarial accrued liability (UAAL) of $2.1 million. The covered payroll (annual payroll of active employees covered by the plan) was $6.8 million, and the ratio of the UAAL to the covered payroll was 30.44%.
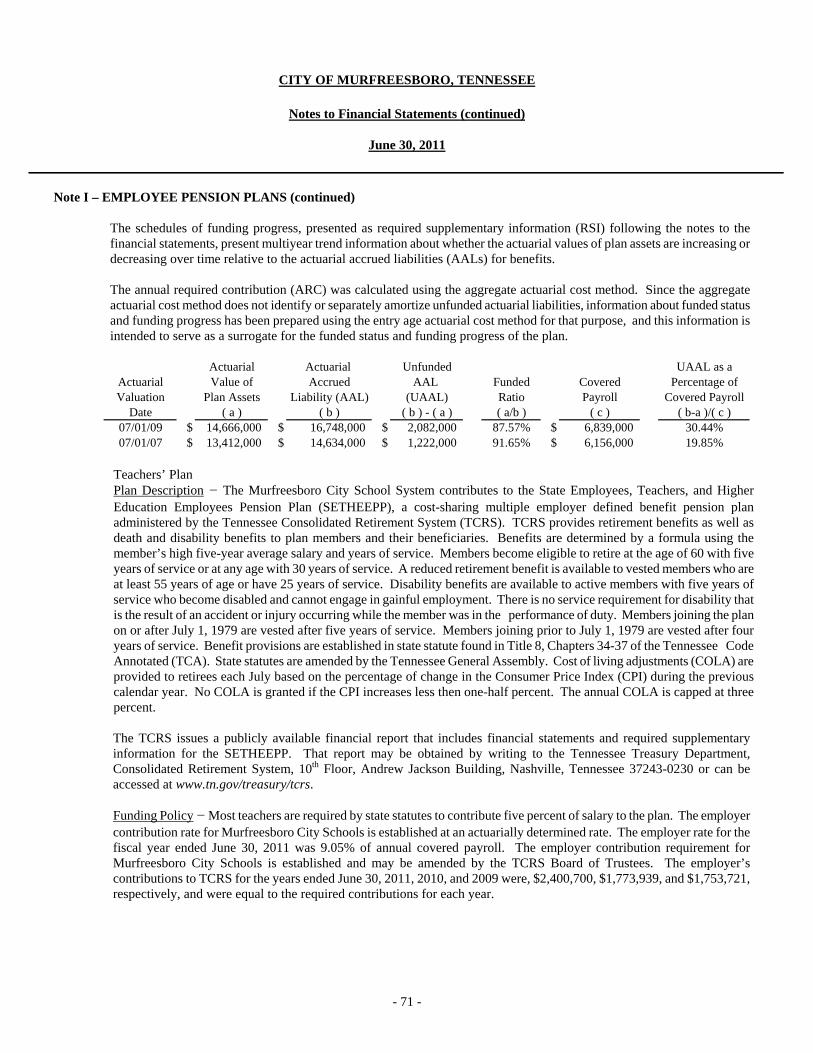
CITY OF MURFREESBORO, TENNESSEE
Notes to Financial Statements (continued)
June 30, 2011
- 71 -
Note I – EMPLOYEE PENSION PLANS (continued)
The schedules of funding progress, presented as required supplementary information (RSI) following the notes to the financial statements, present multiyear trend information about whether the actuarial values of plan assets are increasing or decreasing over time relative to the actuarial accrued liabilities (AALs) for benefits. The annual required contribution (ARC) was calculated using the aggregate actuarial cost method. Since the aggregate actuarial cost method does not identify or separately amortize unfunded actuarial liabilities, information about funded status and funding progress has been prepared using the entry age actuarial cost method for that purpose, and this information is intended to serve as a surrogate for the funded status and funding progress of the plan.
Actuarial Actuarial Unfunded UAAL as aActuarial Value of Accrued AAL Funded Covered Percentage ofValuation Plan Assets Liability (AAL) (UAAL) Ratio Payroll Covered Payroll
Date ( a ) ( b ) ( b ) - ( a ) ( a/b ) ( c ) ( b-a )/( c )07/01/09 $ 14,666,000 $ 16,748,000 $ 2,082,000 87.57% $ 6,839,000 30.44%07/01/07 $ 13,412,000 $ 14,634,000 $ 1,222,000 91.65% $ 6,156,000 19.85%
Teachers’ Plan
Plan Description – The Murfreesboro City School System contributes to the State Employees, Teachers, and Higher Education Employees Pension Plan (SETHEEPP), a cost-sharing multiple employer defined benefit pension plan administered by the Tennessee Consolidated Retirement System (TCRS). TCRS provides retirement benefits as well as death and disability benefits to plan members and their beneficiaries. Benefits are determined by a formula using the member’s high five-year average salary and years of service. Members become eligible to retire at the age of 60 with five years of service or at any age with 30 years of service. A reduced retirement benefit is available to vested members who are at least 55 years of age or have 25 years of service. Disability benefits are available to active members with five years of service who become disabled and cannot engage in gainful employment. There is no service requirement for disability that is the result of an accident or injury occurring while the member was in the performance of duty. Members joining the plan on or after July 1, 1979 are vested after five years of service. Members joining prior to July 1, 1979 are vested after four years of service. Benefit provisions are established in state statute found in Title 8, Chapters 34-37 of the Tennessee Code Annotated (TCA). State statutes are amended by the Tennessee General Assembly. Cost of living adjustments (COLA) are provided to retirees each July based on the percentage of change in the Consumer Price Index (CPI) during the previous calendar year. No COLA is granted if the CPI increases less then one-half percent. The annual COLA is capped at three percent.
The TCRS issues a publicly available financial report that includes financial statements and required supplementary information for the SETHEEPP. That report may be obtained by writing to the Tennessee Treasury Department, Consolidated Retirement System, 10th Floor, Andrew Jackson Building, Nashville, Tennessee 37243-0230 or can be accessed at www.tn.gov/treasury/tcrs. Funding Policy – Most teachers are required by state statutes to contribute five percent of salary to the plan. The employer contribution rate for Murfreesboro City Schools is established at an actuarially determined rate. The employer rate for the fiscal year ended June 30, 2011 was 9.05% of annual covered payroll. The employer contribution requirement for Murfreesboro City Schools is established and may be amended by the TCRS Board of Trustees. The employer’s contributions to TCRS for the years ended June 30, 2011, 2010, and 2009 were, $2,400,700, $1,773,939, and $1,753,721, respectively, and were equal to the required contributions for each year.
CITY OF MURFREESBORO, TENNESSEE
Notes to Financial Statements (continued)
June 30, 2011
- 72 -
Note J – DEFERRED COMPENSATION PLANS
The City of Murfreesboro and the Murfreesboro Electric Department offer employees deferred compensation plans created in accordance with Internal Revenue Code Section 457. The plans, available to all City and Department employees, permit them to defer a portion of their salary until future years. As of July 1, 1998, the City and the Murfreesboro Electric Department implemented a new standard requiring changes to the accounting and financial reporting for the deferred compensation plans created in accordance with Internal Revenue Code 457. The plans are administered by an independent plan administrator. The City’s administrative involvement is limited to transmitting amounts withheld from payroll to the plan administrator who performs investing functions.
Amendments to the laws governing Section 457 plans require that plan assets are held in trust for the benefit of the plan participants and their beneficiaries. The assets will not be diverted to any other purpose. Therefore, the financial activity of these plans is no longer reported in the City’s financial statements.
Note K – POST-EMPLOYMENT BENEFITS
From an accrual accounting perspective, the cost of post-employment healthcare benefits, like the cost of pension benefits, generally should be associated with the periods in which the cost occurs, rather than in the future year when it will be paid. In adopting the requirements of GASB Statement No. 45 during the year ended June 30, 2008, the City recognizes the cost of post-employment benefits in the year when the employee services are received, reports the accumulated liability from prior years, and provides information useful in assessing potential demands on the City’s future cash flows. Recognition of the liability accumulated from prior years will be phased in over 30 years which commenced with the 2008 liability. The City offers benefits under two separate arrangements within the City and the Murfreesboro Electric Department. The City, including Water and Sewer, offers retirees post-employment healthcare benefits on an annual basis with the option to cancel, modify, or reduce benefits by authority of the Mayor and City Council. The following is a summary of each of these plans:
City of Murfreesboro Administered Benefits In addition to pension benefits described in Note I, the City provides certain healthcare benefits for retired employees. Plan benefits and any amendments are under the authority of City Council. The current retiree’s share of premiums is 20%. Police and Firefighters are eligible to retire at age 55 without regard to years of service. General employees are eligible to retire at age 55 with 30 years of service, or at age 62 with twenty or more years of service with an actuarially reduced retirement benefit, or age 65 without regard to years of service. If an employee has met one of these standards and retired, and has 15 years of continuous service with the City with 5 years of continuous coverage in a City health insurance plan, the retired employee is currently eligible to continue such health insurance coverage until the retired employee is eligible for Medicare. As of June 30, 2011, there were 178 participants receiving these benefits. Murfreesboro Electric Department Administered Plan Plan Description In addition to the pension benefits described in Note I, the Murfreesboro Electric Department provides certain healthcare and life insurance benefits for retired employees. The current retiree’s share of the premiums is 10%. Substantially all of the Department’s employees may become eligible for those benefits if they reach normal retirement age (65) or reach age 55 and have 10 years of service. Currently, 22 retirees are receiving benefits. The number of participants of the City Administered Plan as of July 1, 2009 and the Murfreesboro Electric Department plan as of July 1, 2010, the effective dates of the biannual OPEB valuations for each plan, respectively, follows.
CITY OF MURFREESBORO, TENNESSEE
Notes to Financial Statements (continued)
June 30, 2011
- 73 -
Note K – POST-EMPLOYMENT BENEFITS (continued)
MurfreesboroWater & ElectricSewer Other Department
Actives 133 729 84Disableds 8Retirees/Beneficiaries 33 81 22
Total 166 818 106
City Administered Plan
Funding Policy and Annual OPEB Cost – Contribution requirements of the City and plan members are determined by the City Council under the City administered plan and by the Board of Directors of the Murfreesboro Electric Department for the Murfreesboro Electric Department’s plan. Currently, only current benefits payable are being funded under the plans.
Both plans’ other post-employment benefit (OPEB) cost is calculated based on the annual required contribution of the
employer (ARC), an amount actuarially determined in accordance with the parameters of GASB Statement 45. The ARC represents a funding level that, if paid on an ongoing basis, is projected to cover normal costs each year and amortize any unfunded actuarial liabilities over a period not to exceed 30 years. The components of the annual required contribution and the net OPEB obligation are as follows:
MurfreesboroElectric
Water & Sewer City DepartmentNormal Cost $ 680,226 $ 3,708,600 $ 395,995 Amortization of Unfunded Accrued Liabilitiy 401,965 1,980,073 258,227 Interest 24,081 126,587 14,558
Annual Required Contribution $ 1,106,272 $ 5,815,260 $ 668,780
Contribution as a percentage of projected pay 19.39% 18.61% 14.24%
City Administered Plan
The following table shows the City's annual OPEB cost for the year, and the amount actually contributed:
MurfreesboroElectric
Water & Sewer City DepartmentAnnual required contribution $ 1,106,272 $ 5,815,260 $ 668,780 Interest on net OPEB obligation 107,854 637,274 55,257 Adjustment to annual required contribution (76,144) (449,906) (44,817) Annual OPEB cost $ 1,137,982 $ 6,002,628 $ 679,220 Contributions made (259,310) (703,332) (171,575) Increase in net OPEB obligation $ 878,672 $ 5,299,296 $ 507,645
Net OPEB obligation at beginning of year 2,396,766 14,330,784 1,227,937 Net OPEB obligation at end of year $ 3,275,438 $ 19,630,080 $ 1,735,582
City Administered Plan
CITY OF MURFREESBORO, TENNESSEE
Notes to Financial Statements (continued)
June 30, 2011
- 74 -
Note K – POST-EMPLOYMENT BENEFITS (continued)
The City’s annual OPEB cost, the percentage of the annual OPEB cost contributed to the plan, and the net OPEB obligation for the current year and preceding two years is as follows:
Annual Net OPEBAnnual OPEB Cost Obligation
Year End Plan OPEB Cost Contributed at Year-end06/30/09 Water & Sewer $ 969,436 19.8% $ 1,539,919 06/30/10 Water & Sewer $ 1,053,981 18.7% $ 2,396,766 06/30/11 Water & Sewer $ 1,137,982 22.8% $ 3,275,438
06/30/09 City $ 5,238,634 9.9% $ 9,373,194 06/30/10 City $ 5,572,709 11.0% $ 14,330,784 06/30/11 City $ 6,002,628 11.7% 19,630,080
06/30/09 Electric Department $ 538,146 26.5% $ 760,494 06/30/10 Electric Department $ 626,309 25.4% $ 1,227,937 06/30/11 Electric Department $ 679,220 25.3% $ 1,735,582
As of July 1, 2009 and July 1, 2010, the effective dates of the biannual OPEB valuations for the City Administered Plan
and the Murfreesboro Electric Department, respectively, the plan was 0% funded. The actuarial accrued unfunded liability (UAAL) for benefit at June 30, 2011, as well as actuarial methods and assumptions for both plans was as follows:
Murfreesboro
Water & Sewer City Electric Department
Unfunded Actuarial Accrued Liability (UAAL) 12,934,167$ 63,713,547$ 7,232,593$
Covered payroll 5,706,904$ 31,245,659$ 4,696,177$
Ratio of UAAL to covered payroll 227% 204% 154%
Actuarial Valuation Method Entry Age Normal Entry Age Normal Entry Age NormalActuarial Cost Actuarial Cost Actuarial Cost
Method Method Method
Amortization Period - open 30 yrs 30 yrs 30 yrs
Actuarial assumptions: Discount rate 4.50% 4.50% 4.50% Projected salary increases 5.00% 5.00% 4.00%
City Administered Plan

CITY OF MURFREESBORO, TENNESSEE
Notes to Financial Statements (continued)
June 30, 2011
- 75 -
Note K – POST-EMPLOYMENT BENEFITS (continued)
Actuarial valuations of an ongoing plan involve estimates of the value of reported amounts and assumptions about the probability of occurrence of events far into the future. Examples include assumptions about future employment, mortality, and healthcare cost trends. Amounts determined regarding the funded status of the plan and the annual required contributions of the employer are subject to continual revision as actual results are compared with past expectations and new estimates are made about the future. The schedule of funding progress, presented as required supplementary information following the notes to the financial statements presents multiyear trend information about whether the actuarial value of plan assets is increasing or decreasing over time relative to the actuarial accrued liability for benefits. Projections of benefits for financial reporting purposes are based on the substantive plan as understood by the employer and included the types of benefits provided at the time of each valuation and on the historical pattern of sharing of benefit costs between the employer and plan members to that point. The actuarial methods and assumptions used include techniques that are designed to reduce the effects of short-term volatility in actuarial accrued liabilities.
The OPEB was set at $-0- at the transition to GASB 45 for both plans. The actuarial method used was the entry age normal
actuarial cost method. The plans were assumed to be unfunded. Health care cost trend rates are assumed to increase 8% to 10% in the first year and future increases are assumed to grade uniformly to 5% over a five to ten year period. Claims were adjusted downward 3% each year for aging until age 55, while claims were increased 3% per year until age 75 for the City. Claims were adjusted downward 3% from attained age 55 to 65, while claims were increased 3% each year from 65 to 75 for the Electric Department.
Murfreesboro City Schools Plan Description Murfreesboro City Schools participates in the state-administered Teacher Group Insurance Plan, a state-administered plan for healthcare benefits. For accounting purposes, the plan is an agent multiple-employer defined benefit OPEB plan. Benefits are established and amended by an insurance committee created by Tennessee Code Annotated (TCA) 8-27-302 (teachers) or TCA 8-27-701 (Medicare Supplement). Prior to reaching the age of 65, all members have the option of choosing a preferred provider organization (PPO), point of service (POS), or health maintenance organization (HMO) plan for healthcare benefits. Subsequent to age 65, members who are also in the state’s retirement system may participate in a state-administered Medicare supplement plan that does not include pharmacy. The plans are reported in the State of Tennessee Comprehensive Annual Financial Report (CAFR). The CAFR is available on the state’s website at http://tennessee.gov/finance/act/cafr.html. Funding Policy The premium requirements of plan members are established and may be amended by the insurance committee. The plans are self-insured and financed on a pay-as-you-go basis with the risk shared equally among the participants. Claims liabilities of the plan are periodically computed using actuarial and statistical techniques to establish premium rates. The employers in each plan develop their own contribution policy in terms of subsidizing active employees or retired employees’ premiums since the committee is not prescriptive on that issue. The state provides a premium subsidy to Local Education Agency pre-65 teachers and a premium subsidy based on years of service for post-65 teachers in the Medicare Supplement Plan. For plan members electing family coverage, plan members contribute on average 42.05% of premiums and Murfreesboro City Schools contributes on average 57.95% of premiums. For plan members electing single coverage, Murfreesboro City Schools contributes 100% of premiums.

CITY OF MURFREESBORO, TENNESSEE
Notes to Financial Statements (continued)
June 30, 2011
- 76 -
Note K – POST-EMPLOYMENT BENEFITS (continued)
Teacher Group
Annual OPEB cost and Net OPEB Obligation Plan
ARC $ 379,000 Interest on the net OPEB obligation 24,000 Adjustment to the ARC (22,000) Annual OPEB cost $ 381,000 Amount of contribution (473,341) Increase/(Decrease) in net OPEB obligation $ (92,341) Net OPEB obligation - beginning of year 523,914 Net OPEB obligation - end of year $ 431,573
Percentage ofAnnual Net OPEB
Annual OPEB Cost ObligationYear End Plan OPEB Cost Contributed at Year-end
06/30/09 Teachers Group $ 571,000 53.5% $ 488,494 06/30/10 Teachers Group $ 509,000 93.0% $ 523,914 06/30/11 Teachers Group $ 381,000 124.2% $ 431,573
Funded Status and Funding Progress
The funded status of the plan was as follows: Teacher
Group Plan
Actuarial valuation date July 1, 2010Actuarial accrued liability (AAL) $2,570,000Actuarial value of plan assets -0-Unfunded actuarial accrued liability (UAAL) $2,570,000Actuarial Value of Assets as a % of the AAL 0.00%Covered payroll (active plan members) $40,603,000UAAL as a percentage of covered payroll 6.33%
Actuarial valuations involve estimates of the value of reported amounts and assumptions about the probability of events far into the future, and actuarially determined amounts are subject to continual revision as actual results are compared to past expectations and new estimates are made about the future. The schedule of funding progress, presented as RSI following the notes to the financial statements, presents multiyear trend information about whether the actuarial value of plan assets is increasing or decreasing over time relative to actuarial accrued liability for benefits.
CITY OF MURFREESBORO, TENNESSEE
Notes to Financial Statements (continued)
June 30, 2011
- 77 -
Note K – POST-EMPLOYMENT BENEFITS (continued)
Actuarial Methods and Assumptions Calculations are based on the types of benefits provided under the terms of the substantive plan at the time of each valuation and on the pattern of sharing costs between the employer and plan members to that point. Actuarial calculations reflect a long-term perspective. Consistent with that perspective, actuarial methods and assumptions used include techniques that are designed to reduce short-term volatility in actuarial accrued liabilities and the actuarial value of assets. In the July 1, 2010, actuarial valuation, the projected unit credit actuarial cost method was used. The actuarial assumptions included a 4.5 percent investment rate of return (net of administrative expenses) and an annual healthcare cost trend rate of 10 percent for fiscal year 2011. The trend will decrease to 9.5 percent in fiscal year 2012 and then will be reduced by decrements to an ultimate rate of 5.0 percent by fiscal year 2021. The rate includes a 3.0 percent inflation assumption. The unfunded actuarial accrued liability is being amortized as a level percentage of payroll on a closed basis over a 30-year period beginning with June 30, 2008.
Note L – INFORMATION ON INDIVIDUAL PENSION PLAN
Fiduciary funds as reported in the basic financial statements include a single column for the City’s two pension trust funds. A separately issued report is available for the Murfreesboro Electric Department Pension Trust. Separate financial information related to the Murfreesboro Employees' Pension Plan is presented below:
STATEMENT OF NET ASSETS
Assets -Cash and cash equivalents $ 2,468,537 Investments, at fair value 88,357,887 Contributions receivable 290,983
$ 91,117,407
Net Assets -Held in trust for pension benefits $ 91,117,407
STATEMENT OF CHANGES IN NET ASSETS
Additions -Employer contributions $ 4,484,491 Investment income 14,421,068
$ 18,905,559
Deductions -Benefits to participants $ 2,994,941 Insurance premiums 516,712
$ 3,511,653 Net increase $ 15,393,906
Net Assets Held in Trust for Pension Benefits -Beginning of year 75,723,501 End of year $ 91,117,407

CITY OF MURFREESBORO, TENNESSEE
Notes to Financial Statements (continued)
June 30, 2011
- 78 -
Note M – COMMITMENTS AND CONTINGENCIES
Landfill Closure – The City has been notified by the State of Tennessee that certain tests and closure are necessary in connection with a landfill that was operated by the City during the period of 1968 through 1974. The City has also been notified that another site used as a waste dump by the City between 1940 and 1965 has been investigated by the Tennessee Superfund and was found to contain toxic waste. The City is currently performing required cleanup operations on these sites. Additionally, there was no change in this estimated liability from the previous year. The City’s engineer estimates that additional costs required will approximate $1,425,000. Accordingly, this amount has been accrued as a liability on the government-wide statement of net assets. A Contract in Lieu of Performance Bonds, dated December 17, 2009, was entered into between the City and the State of Tennessee in the amount of $1,851,051. In the event the City fails to perform operation and maintenance of the closed dump site as part of the cleanup of the site, after giving the City notice and opportunity to cure the violation, the Commissioner of the Department of Environment and Conservation may collect any amount up to the total penal sum from any funds that would otherwise be disbursed from the State of Tennessee to the City and will be assigned any such forfeited funds from the City to the Tennessee Department of Environment and Conservation.
Construction – The City has entered into agreements for construction as follows:
Project Expended RemainingAuthorization To Date Commitment
City Hall Energy Efficiency Retrofits $ 725,700 $ 137,023 $ 588,677 Energy Efficient School Initiative 997,967 435,986 561,981 Fortress Blvd - Puckett to Blaze 2,575,023 1,981,286 593,737 Maney Avenue Improvements 4,156,072 1,822,207 2,333,865 Manson/Gresham/Fortress 6,474,883 4,828,175 1,646,708 Manson Pike Area Fire Hydrants 57,000 54,648 2,352 CCTV Expansion 848,417 834,538 13,879 Stones River Greenway Bridge 69,000 58,865 10,135 Veterans Parkway Phase 2 4,857,080 505,420 4,351,660
$ 20,761,142 $ 10,658,148 $ 10,102,994
Also, the Murfreesboro City School System has contracted a janitorial service company to provide the custodial services for certain school facilities. Total commitments for the fiscal year ending June 30, 2011 approximate $817,000. In the event of non-performance under the contract, the School System is only liable for the amount of services rendered. Eminent Domain – The City has pending multiple lawsuits involving the acquisition of real property. Interests being acquired include temporary construction easements, permanent easements, fee simple title to portions of improved and unimproved land, and fee simple title to entire parcels of improved and unimproved land. Land is being acquired for current and future projects. In each case the City has tendered into Court the amount it reasonably believes the interest in land being acquired is worth and for which it can reasonably determine a value. Payments of additional material amounts may result from negotiated settlements or the award of additional amounts. While the City intends to vigorously litigate these cases, management believes there is a reasonable possibility that the City may pay an estimated additional amount of $114,390. Grantor Agencies – Amounts received or receivable from grantor agencies are subject to audit and adjustment by grantor agencies, principally the federal government. Any disallowed claims, including amounts already collected, may constitute a liability of the applicable funds.

CITY OF MURFREESBORO, TENNESSEE
Notes to Financial Statements (continued)
June 30, 2011
- 79 -
Note M – COMMITMENTS AND CONTINGENCIES (continued)
Pending Lawsuits – The City is a party to various lawsuits claiming damages for personal injury and property damage in automobile and general liability cases, as well as miscellaneous other litigation. Some amounts in these matters are substantial. In the opinion of the City attorney, the City should prevail in most of the litigation that is not fully insured or barred by the statute of limitations. In any event, the likelihood that the City would incur aggregate liability arising from such litigation in an amount that would be material in relation to its financial position is remote.
Note N – LEASES
The City receives rental income principally for real property from various agencies. Future minimum rental commitments under these leases are insignificant except for the lease of the Rutherford County Chamber of Commerce building as outlined below. Rental income from these sources totaled approximately $500,247 for the year ended June 30, 2011. In September 2009, the City of Murfreesboro entered into an agreement with the Rutherford County Chamber of Commerce, (the “Chamber”) in which the Chamber would operate a Visitor’s Center and lease the land after the building and the parking area had been constructed (the “Leased Premises”). The cost and carrying amount of the leased premises was $5,889,948 and $5,815,620, respectively. Accumulated deprecation at June 30, 2011 was $74,328. The Chamber moved into the building in December 2010. The final completion date was January 31, 2011. Upon the completion of construction of the Leased Premises or occupancy by the Chamber, the Chamber was obligated to pay the City rent. This rent was based on the final cost to the City of the facility in excess of funds received from grants not to exceed $1,500,000. The Chamber made a lump sum initial payment of $400,000 in January 2011. In addition to the lump sum payment, the Chamber is to pay the City $5,764 per month for fifteen years. The $400,000 lump sum amount received has been deferred and is being amortized as lease income over the same 15 year period.
The future minimum lease receipts are as follows:
Year EndingJune 30: Total
2012 $ 69,166 2013 69,166 2014 69,166 2015 69,166 2016 69,166
2017-2025 657,080 $ 1,002,910
Following the full amount of the payments above by the Chamber over fifteen years, the Chamber is required to pay annual rental of $100 until the transfer of land or the expiration of the Agreement, whichever occurs first. If after full payment the Chamber has fully complied with all of the other terms and conditions of the lease agreement, it may request that the City transfer title of the land and the Leased premises to the Chamber. Any transfer would be subject to certain clauses and requirements of the grant and the operation of the Visitor’s Center. The Agreement is for twenty eight years from the signing of the Agreement unless terminated sooner due to the transfer of the Leased Premises.
Note O – INTERFUND TRANSACTIONS
During the course of normal operations, the City has numerous transactions between funds including expenditures and transfers of resources primarily to provide services. The governmental and proprietary fund financial statements generally reflect such transactions as transfers.

CITY OF MURFREESBORO, TENNESSEE
Notes to Financial Statements (continued)
June 30, 2011
- 80 -
Note O – INTERFUND TRANSACTIONS (continued)
Interfund receivable and payable balances at June 30, 2011, arising from these transactions were as follows:
Due From Due ToGeneral Fund
Water and Sewer fund $ 249,837 2010 TML fund 2,712,517 Nonmajor governmental funds 2,681,672 $ 176,812 Nonmajor enterprise funds 199,569 32,412 Internal service funds 627 1,316
$ 5,844,222 $ 210,540 General Purpose School Fund
Nonmajor governmental funds $ 1,610,332 $ 441,153
2010 TML FundGeneral fund $ 2,712,517
Nonmajor Governmental FundsGeneral fund $ 176,812 $ 2,681,672 General purpose school fund 441,153 1,610,332 Water and Sewer fund 133,459 Nonmajor governmental funds 368,660 368,660 Internal service funds 949
$ 986,625 $ 4,795,072 Water and Sewer Fund
General fund $ 249,837 Nonmajor governmental funds $ 133,459 Nonmajor enterprise funds 4,873,505 8,931,479 Internal service funds 19,905
$ 5,006,964 $ 9,201,221 Nonmajor Enterprise Funds
General fund $ 32,412 $ 199,569 Water and Sewer fund 8,931,479 4,873,505 $ 8,963,891 $ 5,073,074
Internal Service FundsGeneral fund $ 1,316 $ 627 Water and Sewer fund 19,905 Nonmajor governmental funds 949 Internal service funds 224 224
$ 22,394 $ 851 $ 22,434,428 $ 22,434,428
The outstanding balances between funds result mainly from the time lag between the dates that (1) interfund goods and services are provided or reimbursable expenditures occur, (2) transactions are recorded in the accounting system, and (3) the payments between funds are made. These balances also include the amount of working capital loans made to internal service funds that the general fund expects to collect in the subsequent year.

CITY OF MURFREESBORO, TENNESSEE
Notes to Financial Statements (continued)
June 30, 2011
- 81 -
Note O – INTERFUND TRANSACTIONS (continued)
Interfund transfers during the year ended June 30, 2011 were as follows:
Nonmajor Electric DebtGeneral Governmental Department Service
Fund Funds Fund Fund TotalGeneral Fund $ 6,000 $ 2,706,121 $ 2,712,121 General Purpose School Fund $ 4,810,103 4,810,103 Debt Service Fund 24,860,379 190,725 25,051,104 Nonmajor Governmental Funds 95,469 $ 3,568,050 3,663,519 Nonmajor Enterprise Fund 62,046 62,046
$ 29,765,951 $ 258,771 $ 2,706,121 $ 3,568,050 $ 36,298,893
Transfer From
Tra
nsfe
r T
o
Transfers among funds are provided for as part of the annual budget process. Transfers are used to move revenues from the fund required to collect the revenue to the fund required or authorized to expend them. All interfund transfers for the fiscal year were routine in nature.
Note P – ACCOUNTING CHANGE
At June 30, 2010, the City implemented GASB Statement No. 54, “Fund Balance Reporting and Governmental Fund Type Definitions”. GASB Statement No. 54 establishes fund balance classifications that comprise a hierarchy based primarily on the extent to which a government is bound to observe constraints imposed upon the use of the resources reported in the governmental funds. These classifications include nonspendable, restricted, committed, assigned and unassigned and are based on the constraints that control how specific amounts can be spent. GASB Statement No. 54 also clarified the definitions of governmental fund types. As a result of the clarification of governmental fund type definitions, the Solid Waste Fund, City Recreation Fund, Old Fort Golf Course Fund, Television Fund and Senior Citizens Fund (formerly special revenue funds) have been reclassified to the General Fund. A portion of the Capital Improvement and Contingency Fund was also reclassified to the General Fund. The Community Development Fund was reclassified from a capital projects fund to a special revenue fund. The impact of the reclassifications of fund balance as previously reported is as follows:
OtherGeneral Governmental
Fund FundsFund balance at June 30, 2010, as previously reported $ 39,895,480 $ 4,274,849 Fund reclassifications 9,353,255 (9,353,255) Fund balance at June 30, 2010, as restated $ 49,248,735 $ (5,078,406)

CITY OF MURFREESBORO, TENNESSEE
Notes to Financial Statements (continued)
June 30, 2011
- 82 -
Note Q – RISK MANAGEMENT PROGRAM
General, Workers' Compensation, and Auto Liability – The City established a self-insurance program for general liability and workers' compensation during the fiscal year ended June 30, 1986. The automobile liability was added to the self-insurance program during the fiscal year ended June 30, 1988. Premiums are paid into the Risk Management Fund by all City funds requiring insurance and the public library and are available to pay claims, claim reserves, and administrative costs of the program. As of July 1, 2008, the City no longer provided workers’ compensation coverage for Murfreesboro Electric Department. Claims for the fiscal year ended June 30, 2011 were $2,543,595. Specific claims for workers’ compensation in excess of $500,000 up to $1,000,000 are covered under an excess insurance policy effective April 1, 2011. Claims for fire and extended coverage in excess of $100,000 are covered through commercial insurance. Claims for law enforcement are covered by commercial insurance with a $25,000 deductible. There are no other excess coverage insurance policies. Amounts reserved in the fund are designated for future claims not yet made and not accrued. Group Health – The City provides medical insurance through a group self- insurance program plan. Blue Cross/Blue Shield of Tennessee acts as the administrator of the plan. Insurance premiums are paid into the Insurance Fund from various City funds and the Water and Sewer Department. In addition, employees and retired employees pay for a portion of the total premiums paid into the fund. Claims are paid to Blue Cross/Blue Shield from the Insurance Fund up to a maximum of $125,000 for each medical claim. A rider policy covers claims for certain transplant surgery (heart, heart and lung, liver and pancreas). Administrative costs and claims for the fiscal year ended June 30, 2011 were $11,099,125. As of February 1, 1998, the City no longer provided medical coverage for employees of the City School System. The City is responsible for any City Schools’ claims dated prior to February 1, 1998. Claims Liability –The claims liability reported in the Insurance Fund and the Risk Management Fund at June 30, 2011 is based on the requirements of Governmental Accounting Standards Board Statement No. 10, which requires that a liability for claims be reported if information prior to the issuance of the financial statements indicates that it is probable that a liability has been incurred at the date of the financial statements and the amount of the loss can be reasonably estimated.
Claim liabilities do not include nonincremental claims adjustment expenses. Changes in the Funds' claims liability amounts during the year ended June 30, 2011 were as follows:
Current
Liability Year Claimsat and Change Claim Liability
Fiscal Year Beginning in Estimate Payments at End
Risk Management Fund -
2010 $ 5,176,000 $ 2,694,694 $ 1,991,694 $ 5,879,000 2011 $ 5,879,000 $ 2,543,595 $ 2,438,595 $ 5,984,000
Insurance Fund -
2010 $ 875,092 $ 11,016,291 $ 11,131,648 $ 759,735 2011 $ 759,735 $ 11,102,051 $ 11,099,125 $ 762,661
The City had no significant reductions in insurance coverage from coverage in the prior year. Settled claims have not exceeded commercial insurance coverage in any of the past three years.

CITY OF MURFREESBORO, TENNESSEE
Notes to Financial Statements (continued)
June 30, 2011
- 83 -
Note R – FAIR VALUE MEASUREMENTS
The fair values of assets measured on a recurring basis at June 30, 2011 are as follows:
Employee Pension PlanMututal funds $ 41,462,211 U.S. Government notes and bonds 12,884,171 Corporate notes and bonds 13,477,677 Common stock 20,533,828
$ 88,357,887
Electric Department Pension PlanMututal funds $ 8,757,315 U.S. Government notes and bonds 2,176,411 Corporate notes and bonds 3,754,637
$ 14,688,363
Perpetual Care Cemetery FundMututal funds $ 462,701 U.S. Government notes and bonds 685,905 Corporate notes and bonds 639,027
$ 1,787,633
Quoted Pricesin Active Markets
for Identical Assets(Level 1 inputs)
Note S – DEFICIT FUND BALANCES
Various nonmajor capital projects funds had deficit fund balances at June 30, 2011. The Capital Improvement and Contingency fund had a deficit balance of $611,436. The Capital Improvement and Contingency fund incurred expenditures related to the Rutherford County Chamber of Commerce Building. This project was funded by the General Fund and is to be reimbursed by the Capital Improvement and Contingency Fund upon the receipt of rental income from the Rutherford County Chamber of Commerce. The Gateway Project fund had a deficit fund balance of $1,073,980 as of June 30, 2011. The Gateway Project fund incurred expenditures related to the development of the Gateway Project, specifically, streets such as Medical Center Parkway and the Manson Pike Interchange. The monies have currently been funded by the General Fund to be reimbursed by the Gateway Project Fund upon the sale of land acquired by the fund. In addition, the 2008 TML funds had a deficit fund balance of $642,487. The TML funds incurred expenditures related to various capital projects. The money has been funded by the General Fund to be reimbursed from future debt issuance.
CITY OF MURFREESBORO, TENNESSEE
Notes to Financial Statements (continued)
June 30, 2011
- 84 -
Note T – PRIOR PERIOD ADJUSTMENT
During the year ended June 30, 2010, the Murfreesboro Stormwater Fund overstated the amount “Due to Murfreesboro Water and Sewer Department” and “Operating expense”. A restatement is therefore necessary for reporting purposes. The restatement increased net assets of the nonmajor enterprise funds at June 30, 2010 by $736,927.
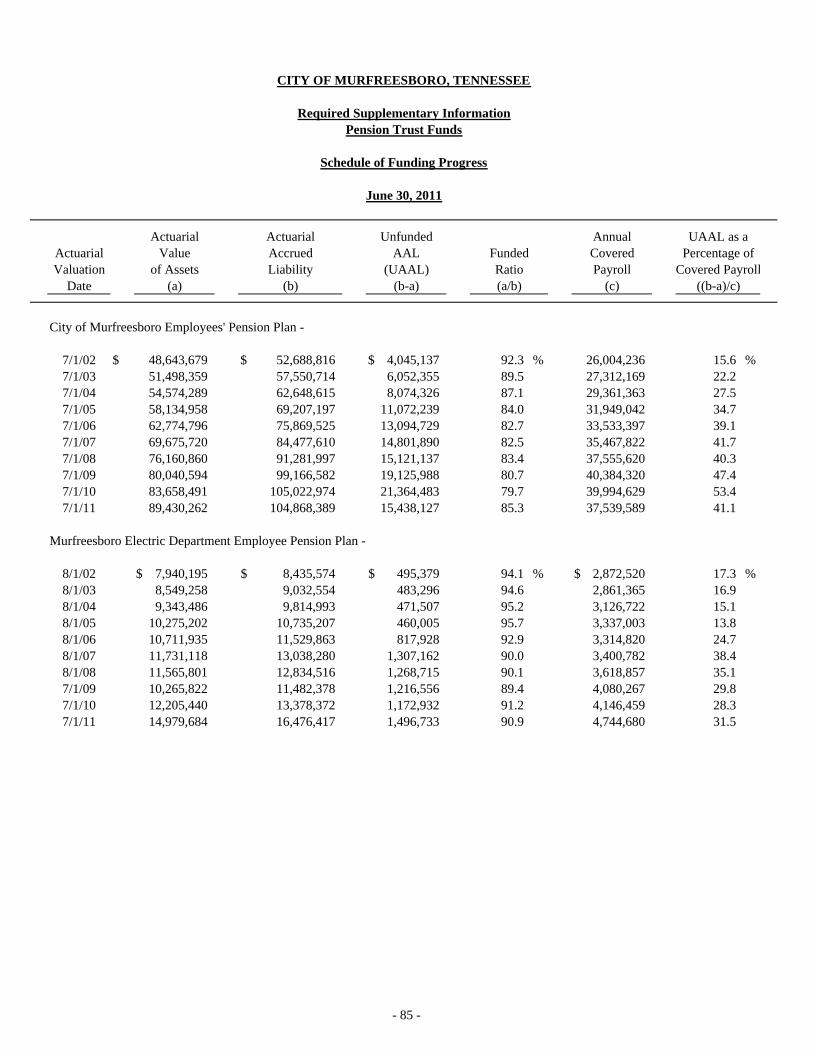
ActuarialValuation
Date (b-a)
City of Murfreesboro Employees' Pension Plan -
7/1/02 $ 48,643,679 $ 52,688,816 $ 4,045,137 92.3 % 26,004,236 15.6 %7/1/03 51,498,359 57,550,714 6,052,355 89.5 27,312,169 22.27/1/04 54,574,289 62,648,615 8,074,326 87.1 29,361,363 27.57/1/05 58,134,958 69,207,197 11,072,239 84.0 31,949,042 34.77/1/06 62,774,796 75,869,525 13,094,729 82.7 33,533,397 39.17/1/07 69,675,720 84,477,610 14,801,890 82.5 35,467,822 41.77/1/08 76,160,860 91,281,997 15,121,137 83.4 37,555,620 40.37/1/09 80,040,594 99,166,582 19,125,988 80.7 40,384,320 47.47/1/10 83,658,491 105,022,974 21,364,483 79.7 39,994,629 53.47/1/11 89,430,262 104,868,389 15,438,127 85.3 37,539,589 41.1
Murfreesboro Electric Department Employee Pension Plan -
8/1/02 $ 7,940,195 $ 8,435,574 $ 495,379 94.1 % $ 2,872,520 17.3 %8/1/03 8,549,258 9,032,554 483,296 94.6 2,861,365 16.98/1/04 9,343,486 9,814,993 471,507 95.2 3,126,722 15.18/1/05 10,275,202 10,735,207 460,005 95.7 3,337,003 13.88/1/06 10,711,935 11,529,863 817,928 92.9 3,314,820 24.78/1/07 11,731,118 13,038,280 1,307,162 90.0 3,400,782 38.48/1/08 11,565,801 12,834,516 1,268,715 90.1 3,618,857 35.17/1/09 10,265,822 11,482,378 1,216,556 89.4 4,080,267 29.87/1/10 12,205,440 13,378,372 1,172,932 91.2 4,146,459 28.37/1/11 14,979,684 16,476,417 1,496,733 90.9 4,744,680 31.5
ActuarialValue
ActuarialAccrued
UnfundedAAL
(UAAL)FundedRatio
(c)
AnnualCoveredPayroll
UAAL as aPercentage of
Covered Payroll((b-a)/c)(a/b)(a)
of Assets Liability(b)
June 30, 2011
CITY OF MURFREESBORO, TENNESSEE
Required Supplementary InformationPension Trust Funds
Schedule of Funding Progress
- 85 -

CITY OF MURFREESBORO, TENNESSEE
Required Supplementary InformationPension Trust Funds
Schedule of Employer Contributions
June 30, 2011
Fiscal Percentage PercentageYear Contributed Contributed
2002 $ 2,459,161 100 % $ 316,692 100 %2003 2,424,202 107 493,679 1002004 2,721,331 98 485,027 1002005 3,045,036 97 551,578 1002006 3,531,820 93 550,390 1002007 3,852,817 97 608,688 1002008 4,265,880 95 637,785 1002009 4,441,232 101 793,813 1002010 4,993,579 89 1,145,337 1002011 5,123,682 89 930,409 100
AnnualRequired
Contribution
Murfreesboro Employees' Pension Electric Department PensionAnnual
RequiredContribution
- 86 -

ActuarialValuation
Date (b-a)
City of Murfreesboro (excluding Water and Sewer employees)
07/01/08 $ -0- $ 53,704,061 $ 53,704,061 0.0 % $ 27,152,899 197.8 %07/01/09 -0- 58,897,953 58,897,953 0.0 28,201,253 208.807/01/10 -0- 58,233,849 58,233,849 0.0 30,404,899 191.507/01/11 -0- 63,713,547 63,713,547 0.0 31,245,659 203.9
Murfreesboro Water and Sewer Department
07/01/08 $ -0- $ 10,582,267 $ 10,582,267 0.0 % $ 5,145,460 205.7 %07/01/09 -0- 11,514,086 11,514,086 0.0 5,188,601 221.907/01/10 -0- 11,913,264 11,913,264 0.0 5,569,115 213.907/01/11 -0- 12,934,167 12,934,167 0.0 5,706,904 226.6
Murfreesboro Electric Department
07/01/08 $ -0- $ 6,308,938 $ 6,308,938 0.0 % $ 3,954,739 159.5 %07/01/09 -0- 6,755,215 6,755,215 0.0 3,954,739 170.807/01/10 -0- 6,713,346 6,713,346 0.0 4,696,177 143.007/01/11 -0- 7,232,593 7,232,593 0.0 4,696,177 154.0
Murfreesboro City Schools (1)
6/30/2007 $ -0- $ 4,260,000 $ 4,260,000 0.0 % $ 37,546,000 11.4 %6/30/2009 -0- 3,511,000 3,511,000 0.0 37,384,000 9.46/30/2010 -0- 2,570,000 2,570,000 0.0 40,603,000 6.3
Note: Data is not available for the year prior to June 30, 2007.
(1) An additional year will be reported as data becomes available. The amount reported here for covered payroll relates to the fiscal year in which the valuation was performed.
June 30, 2011
Actuarial Actuarial Unfunded Annual UAAL as a
CITY OF MURFREESBORO, TENNESSEE
Required Supplementary InformationPost-Employment Benefits
Schedule of Funding Progress
Payroll Covered PayrollCovered Percentage ofValue Accrued
of Assets Liability (UAAL) RatioAAL Funded
((b-a)/c)(a) (b) (a/b) (c)
- 87 -
NONMAJOR GOVERNMENTAL FUNDS
SPECIAL REVENUE FUNDS Special Revenue Funds are used to account for the proceeds of specific revenue sources that are legally restricted to expenditures for specific purposes and special purpose funds established by the City Council.
CAPITAL PROJECTS FUNDS Capital Projects Funds are used to account for the acquisition or construction of capital projects, other than those financed by Enterprise Funds or Internal Service Funds. Revenues are derived primarily from the sale of general obligation bonds and notes, intergovernmental revenues, lease of City property, and earnings on investments.
SCHOOL DEBT SERVICE FUND
The School Debt Service Fund accounts for the accumulation of resources for, and payment of, general long-term obligations specifically related to the financing for the Murfreesboro City Schools.
PERMANENT FUND Permanent Funds are used to account for funds that are legally restricted to the extent that only earnings (and not principal) may be used for purposes that support the City or its citizenry. The Perpetual Care Cemetery Fund accounts for the portion of cemetery lot sale proceeds required by law to be deposited into a perpetual care fund. Earnings on the funds may be used for the maintenance of the Evergreen Cemetery grounds.
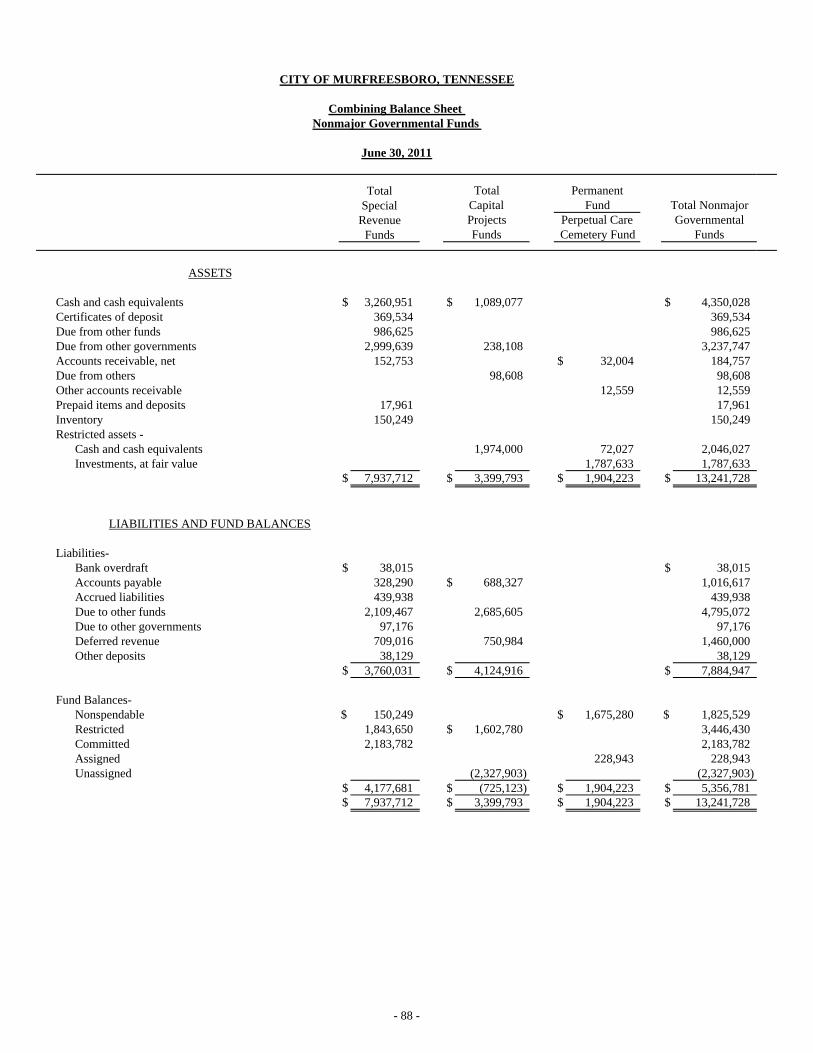
CITY OF MURFREESBORO, TENNESSEE
Combining Balance Sheet Nonmajor Governmental Funds
June 30, 2011
TotalSpecial
RevenueFunds
ASSETS
Cash and cash equivalents $ 3,260,951 $ 1,089,077 $ 4,350,028Certificates of deposit 369,534 369,534Due from other funds 986,625 986,625Due from other governments 2,999,639 238,108 3,237,747Accounts receivable, net 152,753 $ 32,004 184,757Due from others 98,608 98,608Other accounts receivable 12,559 12,559Prepaid items and deposits 17,961 17,961Inventory 150,249 150,249Restricted assets -
Cash and cash equivalents 1,974,000 72,027 2,046,027Investments, at fair value 1,787,633 1,787,633
$ 7,937,712 $ 3,399,793 $ 1,904,223 $ 13,241,728
LIABILITIES AND FUND BALANCES
Liabilities- Bank overdraft $ 38,015 $ 38,015Accounts payable 328,290 $ 688,327 1,016,617Accrued liabilities 439,938 439,938Due to other funds 2,109,467 2,685,605 4,795,072Due to other governments 97,176 97,176Deferred revenue 709,016 750,984 1,460,000Other deposits 38,129 38,129
$ 3,760,031 $ 4,124,916 $ 7,884,947
Fund Balances- Nonspendable $ 150,249 $ 1,675,280 $ 1,825,529Restricted 1,843,650 $ 1,602,780 3,446,430Committed 2,183,782 2,183,782Assigned 228,943 228,943Unassigned (2,327,903) (2,327,903)
$ 4,177,681 $ (725,123) $ 1,904,223 $ 5,356,781$ 7,937,712 $ 3,399,793 $ 1,904,223 $ 13,241,728
Funds
Capital
Cemetery Fund
Total NonmajorGovernmental
Funds
PermanentFund
Perpetual Care
Total
Projects
- 88 -

Revenue ProjectsFunds Funds
Revenues- Intergovernmental $ 13,579,186 $ 794,277 $ 14,373,463Charges for services 5,023,035 5,023,035Donations 103,331 $ 25,000 128,331Interest and investment earnings 3,216 10,117 230,484 243,817Miscellaneous 306,909 1,032,354 1,339,263
$ 18,912,346 $ 1,940,079 $ 255,484 $ 21,107,909Expenditures -
Current- Police $ 217,494 $ 217,494Streets 2,757,723 2,757,723Community services 4,772,763 4,772,763Community development 1,538,719 1,538,719Education 5,333,399 5,333,399Food service 3,399,774 3,399,774
Capital outlay 127,798 $ 6,510,027 6,637,825Debt service -
Principal $ 3,052,939 3,052,939Interest 515,111 515,111
$ 18,147,670 $ 6,510,027 $ 3,568,050 $ 28,225,747Excess of Revenues Over (Under)
Expenditures $ 764,676 $ (4,569,948) $ (3,568,050) $ 255,484 $ (7,117,838)
Other Sources (Uses) - Issuance of debt $ 4,874,806 $ 4,874,806Proceeds from sale of land 219,699 219,699Transfers in $ 95,469 $ 3,568,050 3,663,519Transfers out (196,725) $ (62,046) (258,771)
$ (101,256) $ 5,094,505 $ 3,568,050 $ (62,046) $ 8,499,253
Net change in fund balances $ 663,420 $ 524,557 $ -0- $ 193,438 $ 1,381,415
Fund Balances at beginning of year 3,514,261 (1,249,680) -0- 1,710,785 3,975,366Fund Balances at end of year $ 4,177,681 $ (725,123) $ -0- $ 1,904,223 $ 5,356,781
Total NonmajorGovernmental
Funds
PermanentFund
Perpetual CareCemetery Fund
Year Ended June 30, 2011
CITY OF MURFREESBORO, TENNESSEE
Combining Statement of Revenues, Expenditures, and Changes in Fund Balances Nonmajor Governmental Funds
Special Capital Total Total
SchoolDebt Service
Fund
- 89 -

NONMAJOR SPECIAL REVENUE FUNDS State Street Aid Fund accounts for revenues and expenditures of the City's share of state gasoline taxes. State law requires that gasoline taxes be used to maintain streets. Airport Fund accounts for revenues and expenditures related to the operation of the municipal airport. Drug Enforcement Fund accounts for revenue from drug fines and confiscated property and the use of those funds in the City’s drug enforcement and education programs. Community Development Fund accounts for Community Development Block grants and state grants received and the improvements and expenditures related to the programs. Extended School Program Fund accounts for revenues and expenditures associated with the operation of the School System's before and after school program. School Cafeteria Fund accounts for the revenues and expenditures of the cafeteria operations for all of the schools. School Federal and State Programs Fund accounts for revenues and expenditures associated with state and federally financed school programs.

School State Extended Federal Street School and StateAid Development Program Programs
ASSETS
Cash and cash equivalents $ 1,107,735 $ 191,895 $ 346,342 $ 83 $ 546,669 $ 1,068,227 $ 3,260,951Certificates of deposit 349,534 20,000 369,534Due from other funds 110,559 66,253 434,394 32,815 $ 342,604 986,625Due from other governments 531,701 38,750 31,518 249,242 13,900 76,787 2,057,741 2,999,639Accounts receivable, net 74,286 78,467 152,753Prepaid items and deposits 17,961 17,961Inventory 48,292 101,957 150,249
$ 1,749,995 $ 437,437 $ 377,860 $ 249,325 $ 1,422,964 $ 1,299,786 $ 2,400,345 $ 7,937,712
LIABILITIES AND FUND BALANCES
Liabilities- Bank overdraft $ 38,015 $ 38,015Accounts payable $ 166,850 $ 44,927 $ 46,341 $ 10,217 $ 13,068 46,887 328,290Accrued liabilities 2,369 $ 802 87,151 44,131 305,485 439,938Due to other funds 326 6,449 123,700 24,042 786 1,954,164 2,109,467Due to other governments 95,678 1,498 97,176Deferred revenue 36,290 124,740 474,147 19,543 54,296 709,016Deposits 38,129 38,129
$ 166,850 $ 85,751 $ 89,080 $ 249,242 $ 691,235 $ 77,528 $ 2,400,345 $ 3,760,031
Fund Balances- Nonspendable $ 48,292 $ 101,957 $ 150,249Restricted $ 1,573,927 $ 195,121 74,602 1,843,650Committed 9,218 303,394 93,659 $ 83 $ 731,729 1,045,699 2,183,782
$ 1,583,145 $ 351,686 $ 288,780 $ 83 $ 731,729 $ 1,222,258 $ 4,177,681$ 1,749,995 $ 437,437 $ 377,860 $ 249,325 $ 1,422,964 $ 1,299,786 $ 2,400,345 $ 7,937,712
Special RevenueTotal Nonmajor
AirportDrug
Enforcement CafeteriaCommunity School
Funds
CITY OF MURFREESBORO, TENNESSEE
Combining Balance Sheet Nonmajor Special Revenue Funds
June 30, 2011
- 90 -

SchoolExtended Federal
Community School School and StateDevelopment Program Cafeteria Programs
Revenues- Intergovernmental $ 2,866,362 $ 50,449 $ 1,423,887 $ 19,774 $ 2,444,791 $ 6,773,923 $ 13,579,186Charges for services 1,303,199 2,572,180 1,147,656 5,023,035Interest 778 1,295 $ 1,143 3,216Miscellaneous 8,440 839 162,865 120,832 13,933 306,909
$ 2,875,580 $ 1,355,782 $ 164,008 $ 1,544,719 $ 2,605,887 $ 3,592,447 $ 6,773,923 $ 18,912,346
Expenditures- Education $ 5,333,399 $ 5,333,399Streets $ 2,757,723 2,757,723Police $ 217,494 217,494Community services $ 1,106,237 $ 2,226,002 1,440,524 4,772,763Community development $ 1,538,719 1,538,719Food service $ 3,399,774 3,399,774Capital outlay 8,054 119,744 127,798
$ 2,757,723 $ 1,114,291 $ 337,238 $ 1,538,719 $ 2,226,002 $ 3,399,774 $ 6,773,923 $ 18,147,670Excess of Revenues Over
(Under) Expenditures $ 117,857 $ 241,491 $ (173,230) $ 6,000 $ 379,885 $ 192,673 $ -0- $ 764,676
Other Sources (Uses)- Transfers in $ 1,810 $ 93,659 $ 95,469Transfers out (190,725) $ (6,000) (196,725)
$ (188,915) $ 93,659 $ (6,000) $ (101,256) Net change in fund balances $ 117,857 $ 52,576 $ (79,571) $ -0- $ 379,885 $ 192,673 $ -0- $ 663,420
Fund Balances at beginning of year 1,465,288 299,110 368,351 83 351,844 1,029,585 -0- 3,514,261Fund Balances at end of year $ 1,583,145 $ 351,686 $ 288,780 $ 83 $ 731,729 $ 1,222,258 $ -0- $ 4,177,681
Drug
CITY OF MURFREESBORO, TENNESSEE
Combining Statement of Revenues, Expenditures, and Changes in Fund Balances Nonmajor Special Revenue Funds
Year Ended June 30, 2011
EnforcementAirport
Total Nonmajor
StreetAid
State
FundsSpecial Revenue
- 91 -

State Street Aid Fund
Schedule of Revenues, Expenditures, and Changes in Fund Balance Budget (GAAP Basis) and Actual
Year Ended June 30, 2011
PositiveActual (Negative)
Revenues- Tennessee state gasoline tax
apportionment $ 2,780,576 $ 2,780,576 $ 2,750,030 $ (30,546)Interest 700 700 778 78Federal funds 116,332 116,332Miscellaneous 8,440 8,440
$ 2,781,276 $ 2,781,276 $ 2,875,580 $ 94,304
Expenditures- Traffic signals $ 100,000 $ 100,000 $ 61,362 $ 38,638Curbs and gutters 140,000 140,000 191,929 (51,929)Sidewalks 50,000 50,000 50,227 (227)Rights-of-way 100,000 100,000 93,066 6,934Street paving 1,813,276 1,813,276 1,633,209 180,067Street markings 180,000 180,000 259,354 (79,354)Storm drainage 140,000 140,000 175,636 (35,636)Intersections 50,000 50,000 42,808 7,192Traffic signal lighting 78,000 78,000 75,747 2,253Street construction 50,000 50,000 50,000Street project 116,332 (116,332)Surveys and engineering 80,000 80,000 58,053 21,947 $ 2,781,276 $ 2,781,276 $ 2,757,723 $ 23,553
Excess of Revenues Over (Under) Expenditures $ -0- $ -0- $ 117,857 $ 117,857
Fund Balance at beginning of year 1,465,288Fund Balance at end of year $ 1,583,145
CITY OF MURFREESBORO, TENNESSEE
OriginalBudget
FinalBudget
Variance withFinal Budget
- 92 -

CITY OF MURFREESBORO, TENNESSEE
Airport Fund
Schedule of Revenues, Expenditures, and Changes in Fund BalanceBudget (GAAP Basis) and Actual
Year Ended June 30, 2011
Final BudgetPositive
Actual (Negative)
Revenues - State maintenance funds $ 13,000 $ 13,000 $ (13,000)Federal funds $ 6,967 6,967State funds 198,810 198,810 43,482 (155,328)Interest 1,080 1,080 1,295 215Rental income 382,867 382,867 428,184 45,317Fuel sales 674,000 684,000 875,015 191,015Miscellaneous 850 850 839 (11)
$ 1,270,607 $ 1,280,607 $ 1,355,782 $ 75,175Expenditures -
Labor $ 124,744 $ 124,744 $ 129,731 $ (4,987)Operations and maintenance 152,000 152,000 66,358 85,642Supplies 9,650 9,650 8,584 1,066Insurance 13,970 13,970 13,438 532Social Security taxes 9,175 9,175 9,723 (548)Group insurance 11,700 11,700 11,693 7Retirement 8,489 8,489 8,489Utilities 36,160 36,160 42,875 (6,715)Travel and subsistence 3,675 3,675 2,845 830Purchases for resale 553,400 563,400 723,047 (159,647)Fuel rebates 38,000 38,000 36,367 1,633Surveys and studies 122,400 122,400 36,903 85,497Other miscellaneous 23,500 23,500 16,184 7,316Capital outlay 500 500 8,054 (7,554)
$ 1,107,363 $ 1,117,363 $ 1,114,291 $ 3,072
Excess of Revenues Over (Under) Expenditures $ 163,244 $ 163,244 $ 241,491 $ 78,247
Other Financing Sources and (Uses) - Transfers in $ 13,000 $ 13,000 $ 1,810 $ (11,190)Transfers out (190,725) (190,725) (190,725)
$ (177,725) $ (177,725) $ (188,915) $ (11,190)
Net change in fund balance $ (14,481) $ (14,481) $ $ 67,057
Fund Balance at beginning of year 299,110Fund Balance at end of year $ 299,110
Variance with
OriginalBudget
FinalBudget
- 93 -

CITY OF MURFREESBORO, TENNESSEE
Drug Enforcement Fund
Schedule of Revenues, Expenditures, and Changes in Fund BalanceBudget (GAAP Basis) and Actual
Year Ended June 30, 2011
Variance withFinal Budget
PositiveActual (Negative)
Revenues - Court fines $ 95,000 $ 95,000 $ 93,659 $ (1,341)Seizure awards 61,000 61,000 42,325 (18,675)Interest 1,500 1,500 1,143 (357)Miscellaneous 3,500 6,500 26,881 20,381
$ 161,000 $ 164,000 $ 164,008 $ 8Expenditures -
Labor $ 90,000 $ 90,000 $ 69,915 $ 20,085Operations and maintenance 25,100 25,100 19,950 5,150Supplies 9,525 9,525 4,067 5,458Utilities 35,700 35,700 27,732 7,968Rent 27,600 (27,600)Undercover operations 80,000 80,000 43,000 37,000Other miscellaneous 2,585 2,585 25,230 (22,645)Capital outlay 2,500 94,500 119,744 (25,244)
$ 245,410 $ 337,410 $ 337,238 $ 172
Excess of Revenues Over (Under) Expenditures $ (84,410) $ (173,410) $ (173,230) $ 180
Other Financing Sources - Transfers in 95,000 95,000 93,659 (1,341)
Net change in fund balance $ 10,590 $ (78,410) $ (79,571) $ (1,161)
Fund Balance at beginning of year 368,351Fund Balance at end of year $ 288,780
OriginalBudget
FinalBudget
- 94 -

Final Budget Positive
Actual (Negative)
Revenues- Revenue from federal government $ 1,215,080 $ 1,514,834 $ 1,423,887 $ (90,947) Program income 30,000 30,000 120,832 90,832
$ 1,245,080 $ 1,544,834 $ 1,544,719 $ (115)
Expenditures- Administration $ 132,350 $ 138,218 $ 135,319 $ 2,899Housing rehabilitation 255,979 295,817 415,177 (119,360)Housing assistance 192,309 118,922 73,689 45,233Neighborhood stabilization program 130,000 130,000 253,228 (123,228)Emergency shelter grant 110,412 110,412 110,543 (131)Homeless prevention 174,506 389,006 389,064 (58)Other 249,524 356,459 161,699 194,760
$ 1,245,080 $ 1,538,834 $ 1,538,719 $ 115
Excess of Revenues Over (Under) Expenditures $ -0- $ 6,000 $ 6,000 $ -0-
Other Financing Sources (Uses) Transfers out (6,000) (6,000)
Net change in fund balance $ -0- $ -0- $ -0- $ -0-
Fund Balance at beginning of year 83 Fund Balance at end of year $ 83
CITY OF MURFREESBORO, TENNESSEE
Community Development Fund
Schedule of Revenues, Expenditures, and Changes in Fund Balance Budget (GAAP Basis) and Actual
Budget Budget
Year Ended June 30, 2011
Variance with
Original Final
- 95 -
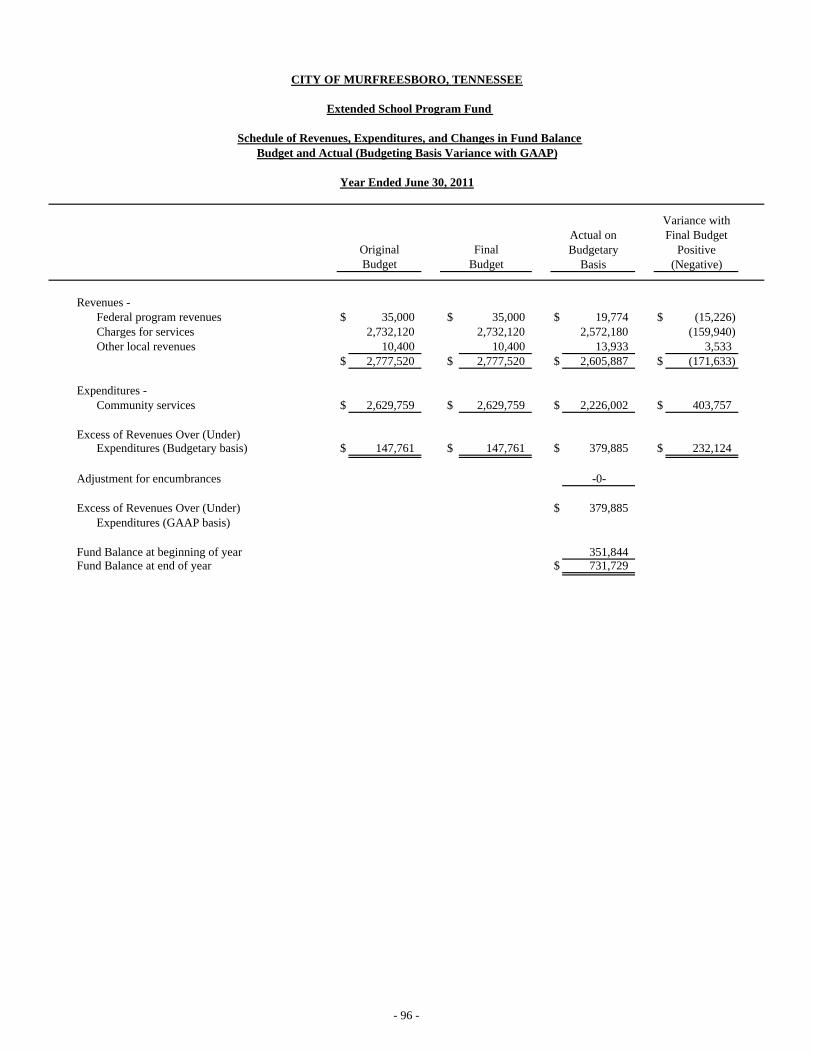
Extended School Program Fund
Schedule of Revenues, Expenditures, and Changes in Fund Balance
Year Ended June 30, 2011
Variance withActual on Final BudgetBudgetary Positive
Basis (Negative)
Revenues - Federal program revenues $ 35,000 $ 35,000 $ 19,774 $ (15,226)Charges for services 2,732,120 2,732,120 2,572,180 (159,940)Other local revenues 10,400 10,400 13,933 3,533
$ 2,777,520 $ 2,777,520 $ 2,605,887 $ (171,633)
Expenditures - Community services $ 2,629,759 $ 2,629,759 $ 2,226,002 $ 403,757
Excess of Revenues Over (Under) Expenditures (Budgetary basis) $ 147,761 $ 147,761 $ 379,885 $ 232,124
Adjustment for encumbrances -0-
Excess of Revenues Over (Under) $ 379,885Expenditures (GAAP basis)
Fund Balance at beginning of year 351,844Fund Balance at end of year $ 731,729
CITY OF MURFREESBORO, TENNESSEE
OriginalBudget
FinalBudget
Budget and Actual (Budgeting Basis Variance with GAAP)
- 96 -

School Cafeteria Fund
Schedule of Revenues, Expenditures, and Changes in Fund Balance Budget and Actual (Budgeting Basis Variance with GAAP)
Year Ended June 30, 2011
Variance withActual on Final BudgetBudgetary Positive
Basis (Negative)
Revenues - Federal program revenues $ 1,893,046 $ 1,903,446 $ 2,406,190 $ 502,744State program revenues 50,000 50,000 38,601 (11,399)Charges for services 1,596,912 1,596,912 1,147,656 (449,256)
$ 3,539,958 $ 3,550,358 $ 3,592,447 $ 42,089
Expenditures - Food service $ 3,389,419 $ 3,399,819 $ 3,399,774 $ 45
Excess of Revenues Over (Under) Expenditures (Budgetary basis) $ 150,539 $ 150,539 $ 192,673 $ 42,134
Adjustment for encumbrances -0-
Excess of Revenues Over (Under) Expenditures (GAAP basis) $ 192,673
Fund Balance at beginning of year 1,029,585Fund Balance at end of year $ 1,222,258
CITY OF MURFREESBORO, TENNESSEE
Original FinalBudget Budget
- 97 -
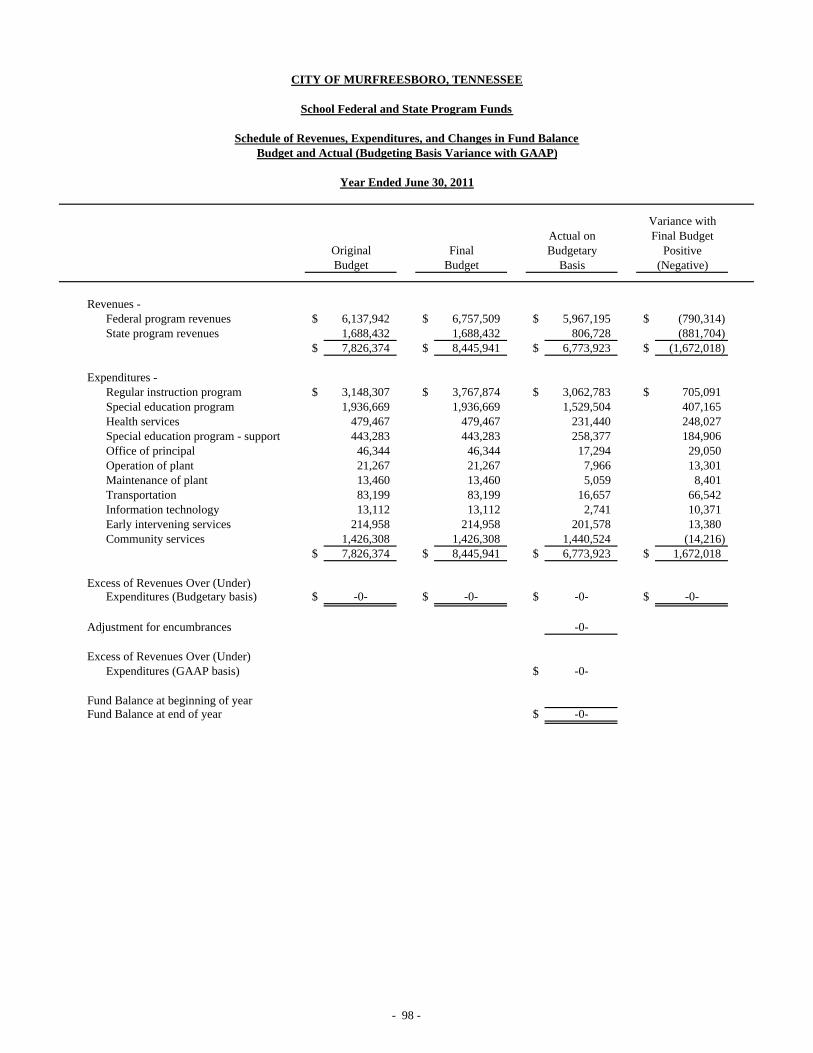
CITY OF MURFREESBORO, TENNESSEE
School Federal and State Program Funds
Schedule of Revenues, Expenditures, and Changes in Fund Balance Budget and Actual (Budgeting Basis Variance with GAAP)
Year Ended June 30, 2011
Actual on Final BudgetBudgetary Positive
Basis (Negative)
Revenues - Federal program revenues $ 6,137,942 $ 6,757,509 $ 5,967,195 $ (790,314)State program revenues 1,688,432 1,688,432 806,728 (881,704)
$ 7,826,374 $ 8,445,941 $ 6,773,923 $ (1,672,018)
Expenditures - Regular instruction program $ 3,148,307 $ 3,767,874 $ 3,062,783 $ 705,091Special education program 1,936,669 1,936,669 1,529,504 407,165Health services 479,467 479,467 231,440 248,027Special education program - support 443,283 443,283 258,377 184,906Office of principal 46,344 46,344 17,294 29,050Operation of plant 21,267 21,267 7,966 13,301Maintenance of plant 13,460 13,460 5,059 8,401Transportation 83,199 83,199 16,657 66,542Information technology 13,112 13,112 2,741 10,371Early intervening services 214,958 214,958 201,578 13,380Community services 1,426,308 1,426,308 1,440,524 (14,216)
$ 7,826,374 $ 8,445,941 $ 6,773,923 $ 1,672,018
Excess of Revenues Over (Under) Expenditures (Budgetary basis) $ -0- $ -0- $ -0- $ -0-
Adjustment for encumbrances -0-
Excess of Revenues Over (Under) Expenditures (GAAP basis) $ -0-
Fund Balance at beginning of year Fund Balance at end of year $ -0-
Variance with
Original FinalBudget Budget
- 98 -

NONMAJOR CAPITAL PROJECTS FUNDS Capital Improvement and Contingency Fund accounts for revenues and expenditures associated with the acquisition or construction of various capital projects for general government activities. Gateway Project Fund accounts for the City’s development of land to be used in future projects. TML Loan Funds accounts for the proceeds of loans through the Tennessee Municipal Bond Fund and the expenditures related to various projects funded by the loans. The funds included are, 1998 TML Loan, 1999 TML Loan, 2001 TML Loan, 2004 TML Loan, and 2008 TML Loan.

ASSETS
Cash and cash equivalents $ 1,067,100 $ 21,977 $ 1,089,077 Due from other governments 238,108 238,108 Due from others 74,135 24,473 98,608 Restricted cash 360,317 $ 183,092 $ 104,781 $ 1,227,631 $ 98,179 1,974,000
$ 1,739,660 $ 183,092 $ 104,781 $ 1,227,631 $ 98,179 $ 46,450 $ 3,399,793
LIABILITIES AND FUND BALANCES
Liabilities- Accounts payable $ 30,165 $ 10,903 $ 647,259 $ 688,327 Due to other funds 1,569,947 $ 1,073,980 41,678 2,685,605 Deferred revenue 750,984 750,984
$ 2,351,096 $ 1,073,980 $ 10,903 $ 688,937 $ 4,124,916
Fund Balances- Restricted $ 183,092 $ 104,781 $ 1,227,631 $ 87,276 $ 1,602,780 Unassigned $ (611,436) $ (1,073,980) $ (642,487) (2,327,903)
$ (611,436) $ (1,073,980) $ 183,092 $ 104,781 $ 1,227,631 $ 87,276 $ (642,487) $ (725,123) $ 1,739,660 $ -0- $ 183,092 $ 104,781 $ 1,227,631 $ 98,179 $ 46,450 $ 3,399,793
Loan FundLoan FundLoan FundLoan Fund
Capital
ProjectGateway
Contingencyand
Fund Fund
1999TML
1998TML
Improvement
TML 2004 2008
TML FundsLoan Fund
CITY OF MURFREESBORO, TENNESSEE
Combining Balance Sheet Nonmajor Capital Project Funds
June 30, 2011
2001TML Capital Projects
Total Nonmajor
- 99 -

Revenues- Intergovernmental $ 794,277 $ 794,277 Donations 103,331 103,331 Interest income 6,048 $ 377 $ 215 $ 2,526 $ 202 $ 749 10,117 Rental income 47,917 47,917 Miscellaneous 984,437 984,437
$ 951,573 $ 377 $ 215 $ 2,526 $ 202 $ 985,186 $ 1,940,079
Expenditures- Capital outlay -
Street construction and drainage $ 36,977 $ 25,091 $ 2,684,241 $ 2,746,309 Other projects and costs 2,583,527 2,419 $ 327 1,177,445 3,763,718 $ 2,620,504 $ 27,510 $ 327 $ 3,861,686 $ 6,510,027
Excess of Revenues Over (Under) Expenditures $ (1,668,931) $ (27,510) $ 377 $ 215 $ 2,526 $ (125) $ (2,876,500) $ (4,569,948)
Other Financing Sources (Uses)- Issuance of debt $ 4,874,806 $ 4,874,806 Proceeds from sale of land $ 219,699 219,699
$ 219,699 $ 4,874,806 $ 5,094,505
Net change in fund balances $ (1,668,931) $ 192,189 $ 377 $ 215 $ 2,526 $ (125) $ 1,998,306 $ 524,557
Fund Balances at beginning of year 1,057,495 (1,266,169) 182,715 104,566 1,225,105 87,401 (2,640,793) (1,249,680) Fund Balances at end of year $ (611,436) $ (1,073,980) $ 183,092 $ 104,781 $ 1,227,631 $ 87,276 $ (642,487) $ (725,123)
FundContingency TML
Loan FundLoan FundFund Loan Fund Funds
Capital
Gateway Improvement
TMLProject2001and Total Nonmajor
Capital Projects2004TML TML
2008
CITY OF MURFREESBORO, TENNESSEE
Combining Statement of Revenues, Expenditures, and Changes in Fund Balances Nonmajor Capital Project Funds
Year Ended June 30, 2011
19991998
Loan Fund Loan FundTML
- 100 -

Revenues- Interest income $ 44,500 $ 44,500 $ 6,048 $ (38,452) Federal funds 4,623,990 4,623,990 560,167 (4,063,823) State funds 234,110 234,110 Rental income 47,917 47,917 Donations received 103,331 103,331
$ 4,668,490 $ 4,668,490 $ 951,573 $ (3,716,917)
Expenditures- Street construction $ 36,977 $ (36,977)Capital outlay and other projects $ 6,139,345 $ 6,139,345 2,583,527 3,555,818
$ 6,139,345 $ 6,139,345 $ 2,620,504 $ 3,518,841
Excess of Revenues Over (Under) Expenditures $ (1,470,855) $ (1,470,855) $ (1,668,931) $ (198,076)
Other Financing Sources (Uses)- Transfers out (3,000,000) (3,000,000) 3,000,000
Net change in fund balance $ (4,470,855) $ (4,470,855) $ (1,668,931) $ 2,801,924
Fund Balance at beginning of year 1,057,495 Fund Balance at end of year $ (611,436)
Variance with
Original FinalBudget Budget Actual (Negative)
PositiveFinal Budget
Year Ended June 30, 2011
CITY OF MURFREESBORO, TENNESSEE
Capital Improvement and Contingency Fund
Schedule of Revenues, Expenditures, and Changes in Fund Balance Budget (GAAP Basis) and Actual
- 101 -

Revenues- Interest income $ -0- $ -0- $ -0- $ -0-
Expenditures- Street construction $ 25,091 $ (25,091) Capital outlay and other projects $ 50,000 $ 50,000 2,419 47,581
$ 50,000 $ 50,000 $ 27,510 $ 22,490
Excess of Revenues Over (Under) Expenditures $ (50,000) $ (50,000) $ (27,510) $ 22,490
Other Financing Sources (Uses) - Proceeds from sale of land 219,699 219,699
Net change in fund balance $ (50,000) $ (50,000) $ 192,189 $ 242,189
Fund Balance at beginning of year (1,266,169) Fund Balance at end of year $ (1,073,980)
Year Ended June 30, 2011
CITY OF MURFREESBORO, TENNESSEE
Gateway Project
Schedule of Revenues, Expenditures, and Changes in Fund Balance Budget (GAAP Basis) and Actual
Variance with
Original FinalBudget Budget Actual (Negative)
PositiveFinal Budget
- 102 -

Revenues- Interest income $ -0- $ -0- $ 377 $ 377
Expenditures- Capital Outlay
Excess of Revenues Over (Under) Expenditures $ -0- $ -0- $ 377 $ 377
Fund Balance at beginning of year 182,715 Fund Balance at end of year $ 183,092
FinalBudget Budget
CITY OF MURFREESBORO, TENNESSEE
Variance with
Original
1998 TML Fund
Schedule of Revenues, Expenditures, and Changes in Fund Balance Budget (GAAP Basis) and Actual
Year Ended June 30, 2011
(Negative)Positive
Final Budget
Actual
- 103 -

Revenues- Interest income $ -0- $ -0- $ 215 $ 215
Expenditures- Capital outlay and other projects
Excess of Revenues Over (Under) Expenditures $ -0- $ -0- $ 215 $ 215
Fund Balance at beginning of year 104,566 Fund Balance at end of year $ 104,781
Variance with
Original FinalBudget
Budget (GAAP Basis) and Actual
Budget
CITY OF MURFREESBORO, TENNESSEE
1999 TML Fund
Schedule of Revenues, Expenditures, and Changes in Fund Balance
(Negative)Positive
Final Budget
Actual
Year Ended June 30, 2011
- 104 -

Revenues- Interest income $ 2,100 $ 2,100 $ 2,526 $ 426
Expenditures- Capital outlay and other projects 1,224,959 1,224,959 1,224,959
Excess of Revenues Over (Under) Expenditures $ (1,222,859) $ (1,222,859) $ 2,526 $ 1,225,385
Fund Balance at beginning of year 1,225,105 Fund Balance at end of year $ 1,227,631
Budget Budget
CITY OF MURFREESBORO, TENNESSEE
2001 TML Fund
Schedule of Revenues, Expenditures, and Changes in Fund Balance Budget (GAAP Basis) and Actual
Year Ended June 30, 2011
Variance with
Original Final(Negative)
PositiveFinal Budget
Actual
- 105 -

Revenues- Interest revenue $ 120 $ 120 $ 202 $ 82
Expenditures- Capital outlay and other projects 98,394 98,394 327 98,067
Excess of Revenues Over (Under) Expenditures $ (98,274) $ (98,274) $ (125) $ 98,149
Fund Balance at beginning of year 87,401 Fund Balance at end of year $ 87,276
Year Ended June 30, 2011
CITY OF MURFREESBORO, TENNESSEE
2004 TML Fund
Schedule of Revenues, Expenditures, and Changes in Fund BalanceBudget (GAAP Basis) and Actual
Variance with
Original FinalBudget Budget Actual (Negative)
PositiveFinal Budget
- 106 -

Revenues- Interest income $ -0- $ -0- $ 749 $ 749 Miscellaneous revenue 984,437 984,437
$ -0- $ -0- $ 985,186 $ 985,186
Expenditures- Street construction and drainage $ 2,684,241 $ (2,684,241) Capital outlay and other projects $ 2,596,644 $ 3,862,644 1,177,445 2,685,199
$ 2,596,644 $ 3,862,644 $ 3,861,686 $ 958
Excess of Revenues Over (Under) Expenditures $ (2,596,644) $ (3,862,644) $ (2,876,500) $ 986,144
Other Financing Sources (Uses)- Issuance of debt $ 2,596,645 $ 3,862,645 $ 4,874,806 $ 1,012,161 Transfers out (25,000) (25,000) 25,000
$ 2,571,645 $ 3,837,645 $ 4,874,806 $ 1,037,161
Net change in fund balance $ (24,999) $ (24,999) $ 1,998,306 $ 2,023,305
Fund Balance at beginning of year (2,640,793) Fund Balance at end of year $ (642,487)
Budget Budget
Year Ended June 30, 2011
Variance with
Original FinalActual (Negative)
PositiveFinal Budget
CITY OF MURFREESBORO, TENNESSEE
2008 TML Fund
Schedule of Revenues, Expenditures, and Changes in Fund Balance Budget (GAAP Basis) and Actual
- 107 -
MAJOR CAPITAL PROJECTS FUND The City has one capital projects fund which it considers to be a major fund. 2010 TML Fund accounts for the proceeds of a loan through the Tennessee Municipal Bond Fund and the expenditures related to various projects funded by the loan.
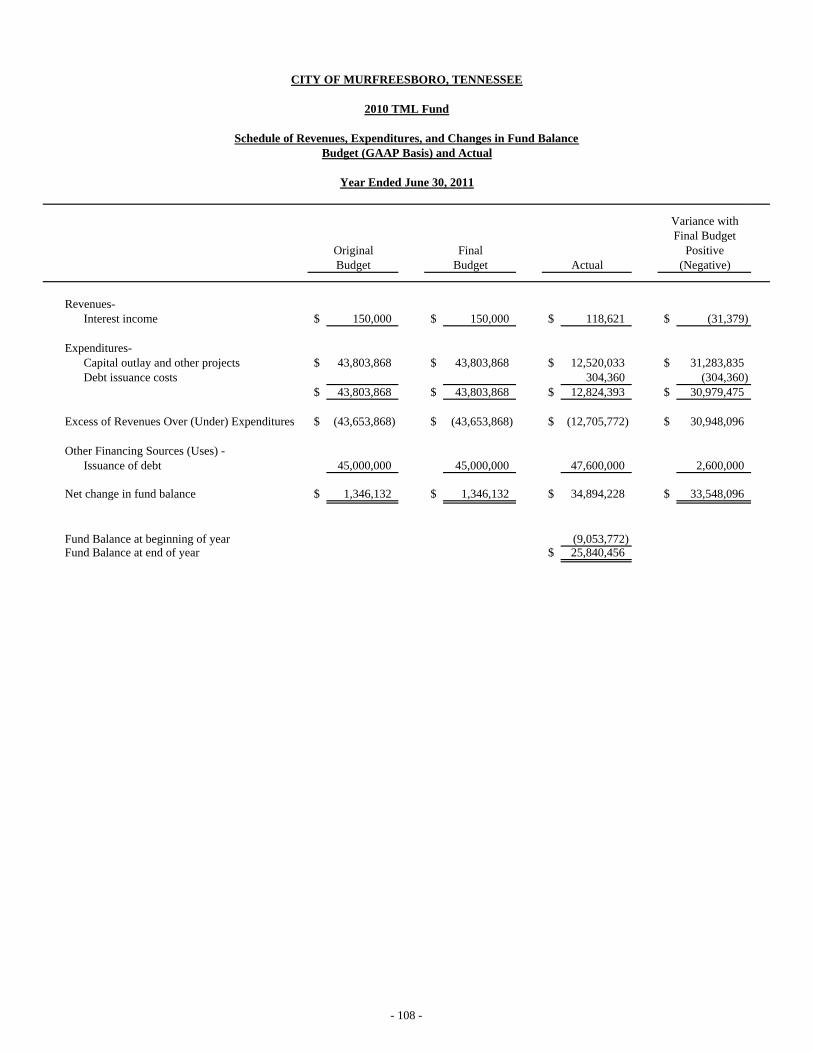
Revenues- Interest income $ 150,000 $ 150,000 $ 118,621 $ (31,379)
Expenditures- Capital outlay and other projects $ 43,803,868 $ 43,803,868 $ 12,520,033 $ 31,283,835 Debt issuance costs 304,360 (304,360)
$ 43,803,868 $ 43,803,868 $ 12,824,393 $ 30,979,475
Excess of Revenues Over (Under) Expenditures $ (43,653,868) $ (43,653,868) $ (12,705,772) $ 30,948,096
Other Financing Sources (Uses) - Issuance of debt 45,000,000 45,000,000 47,600,000 2,600,000
Net change in fund balance $ 1,346,132 $ 1,346,132 $ 34,894,228 $ 33,548,096
Fund Balance at beginning of year (9,053,772) Fund Balance at end of year $ 25,840,456
Budget Budget
Year Ended June 30, 2011
Variance with
Original FinalActual (Negative)
PositiveFinal Budget
CITY OF MURFREESBORO, TENNESSEE
2010 TML Fund
Schedule of Revenues, Expenditures, and Changes in Fund Balance Budget (GAAP Basis) and Actual
- 108 -

MAJOR DEBT SERVICE FUND The Debt Service Fund accounts for the accumulation of resources for, and payment of, general long-term obligations(with the exception of general long-term obligations related to the Murfreesboro City Schools).
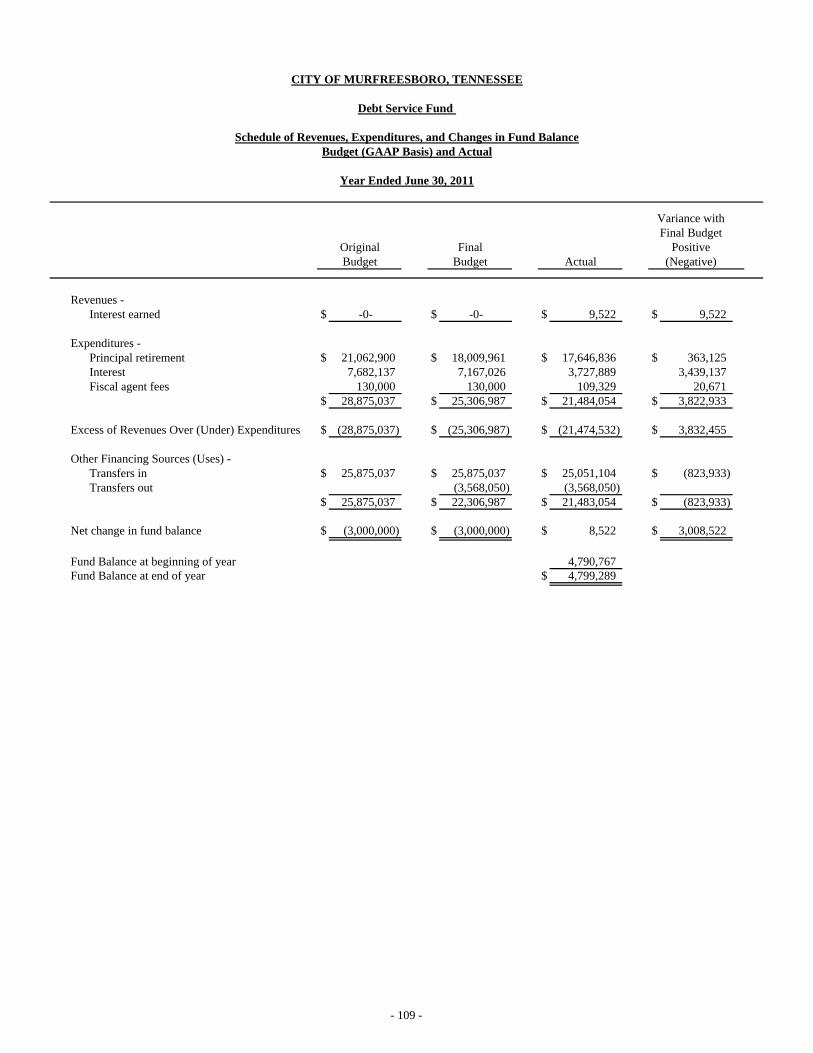
Debt Service Fund
Schedule of Revenues, Expenditures, and Changes in Fund BalanceBudget (GAAP Basis) and Actual
Year Ended June 30, 2011
Revenues - Interest earned $ -0- $ -0- $ 9,522 $ 9,522
Expenditures - Principal retirement $ 21,062,900 $ 18,009,961 $ 17,646,836 $ 363,125Interest 7,682,137 7,167,026 3,727,889 3,439,137Fiscal agent fees 130,000 130,000 109,329 20,671
$ 28,875,037 $ 25,306,987 $ 21,484,054 $ 3,822,933
Excess of Revenues Over (Under) Expenditures $ (28,875,037) $ (25,306,987) $ (21,474,532) $ 3,832,455
Other Financing Sources (Uses) - Transfers in $ 25,875,037 $ 25,875,037 $ 25,051,104 $ (823,933)Transfers out (3,568,050) (3,568,050)
$ 25,875,037 $ 22,306,987 $ 21,483,054 $ (823,933)
Net change in fund balance $ (3,000,000) $ (3,000,000) $ 8,522 $ 3,008,522
Fund Balance at beginning of year 4,790,767Fund Balance at end of year $ 4,799,289
CITY OF MURFREESBORO, TENNESSEE
Variance with
OriginalBudget
FinalBudget (Negative)
PositiveFinal Budget
Actual
- 109 -

NONMAJOR DEBT SERVICE FUND The School Debt Service Fund accounts for the accumulation of resources for, and payment of, general long-term obligations specifically related to the financing for the Murfreesboro City Schools.
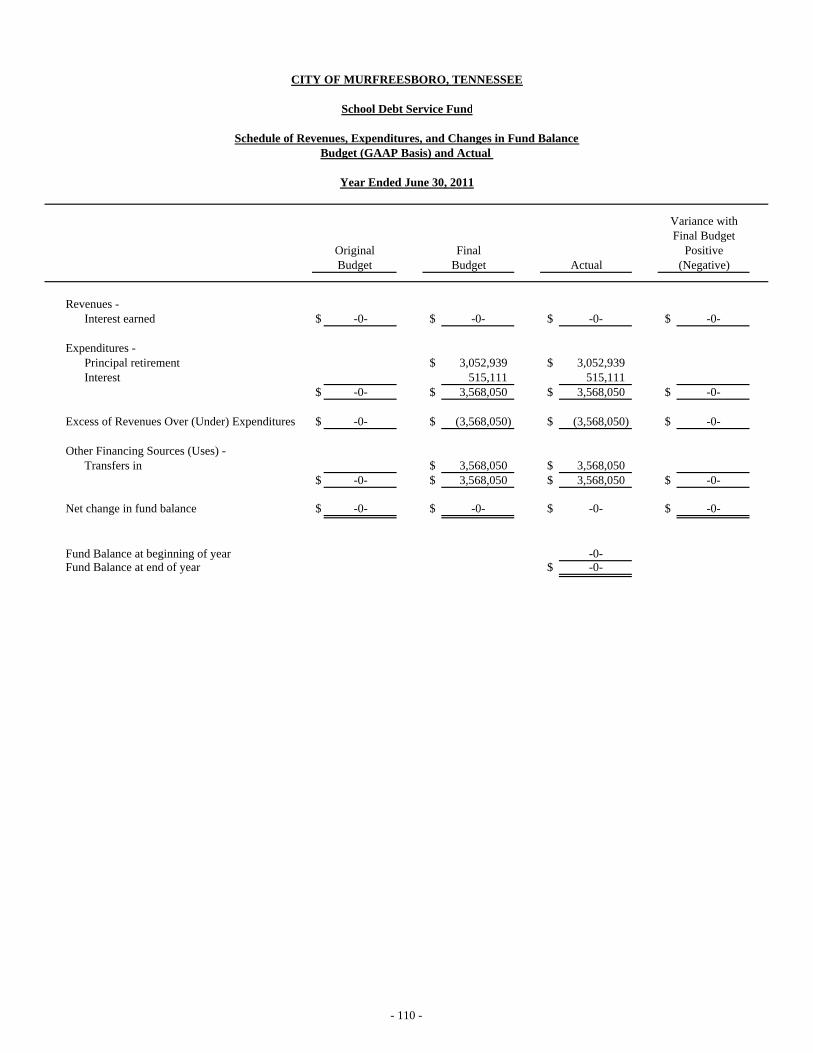
School Debt Service Fund
Schedule of Revenues, Expenditures, and Changes in Fund Balance Budget (GAAP Basis) and Actual
Year Ended June 30, 2011
Revenues - Interest earned $ -0- $ -0- $ -0- $ -0-
Expenditures - Principal retirement $ 3,052,939 $ 3,052,939Interest 515,111 515,111
$ -0- $ 3,568,050 $ 3,568,050 $ -0-
Excess of Revenues Over (Under) Expenditures $ -0- $ (3,568,050) $ (3,568,050) $ -0-
Other Financing Sources (Uses) - Transfers in $ 3,568,050 $ 3,568,050
$ -0- $ 3,568,050 $ 3,568,050 $ -0-
Net change in fund balance $ -0- $ -0- $ -0- $ -0-
Fund Balance at beginning of year -0-Fund Balance at end of year $ -0-
Budget Budget
CITY OF MURFREESBORO, TENNESSEE
Variance with
Original Final(Negative)
PositiveFinal Budget
Actual
- 110 -

NONMAJOR ENTERPRISE FUNDS
Enterprise Funds are used to account for the operation of self-sustaining agencies rendering services to the general public on a user-charge basis. Activities necessary to provide these services are accounted for in such a manner as to show a profit or loss similar to comparable private enterprises. Stormwater Fund accounts for the study and management of stormwater runoff in the City of Murfreesboro in accordance with federal mandates. Revenues are derived from charges to the Water and Sewer customer base. Industrial Building Funds account for land and buildings owned by the City, which were formerly leased to Foremost Dairies, Inc. and Alton Box Board Company. These funds are generally inactive. Evergreen Cemetery Fund accounts for the operation and maintenance of the Evergreen Cemetery. Revenues are derived primarily from sales of lots, charges for services, and investment earnings.

CITY OF MURFREESBORO, TENNESSEE
Combining Balance Sheet Nonmajor Enterprise Funds
June 30, 2011
Murfressboro Foremost Alton BoxStormwater Dairies, Inc. Board Co. Evergreen
Fund Plant Plant Cemetery
ASSETS
Current Assets - Cash and cash equivalents $ 27,086 $ 27,086Accounts receivable 118,365 118,365Due from other funds $ 8,931,479 $ 21,910 $ 10,502 8,963,891Inventories 58,043 58,043Prepaid items 9,908 4,475 14,383
Total Current Assets $ 8,941,387 $ 21,910 $ 10,502 $ 207,969 $ 9,181,768Noncurrent Assets -
Land and construction in progress $ 1,554,429 $ 12,492 $ 11,000 $ 935 $ 1,578,856Other capital assets, net of depreciation 663,847 198,775 862,622
Total Noncurrent Assets $ 2,218,276 $ 12,492 $ 11,000 $ 199,710 $ 2,441,478Total Assets $ 11,159,663 $ 34,402 $ 21,502 $ 407,679 $ 11,623,246
LIABILITIES AND NET ASSETS
Current Liabilities - Accounts payable $ 238,897 $ 6,098 $ 244,995Accrued and withheld liabilities 702 3,216 3,918Due to other funds 5,073,074 5,073,074
Total Current Liabilities $ 5,312,673 $ 9,314 $ 5,321,987
Net Assets - Invested in capital assets $ 12,492 $ 11,000 $ 199,710 $ 223,202Unrestricted $ 5,846,990 21,910 10,502 198,655 6,078,057
Total Net Assets $ 5,846,990 $ 34,402 $ 21,502 $ 398,365 $ 6,301,259Total Liabilities and Net Assets $ 11,159,663 $ 34,402 $ 21,502 $ 407,679 $ 11,623,246
Totals
- 111 -
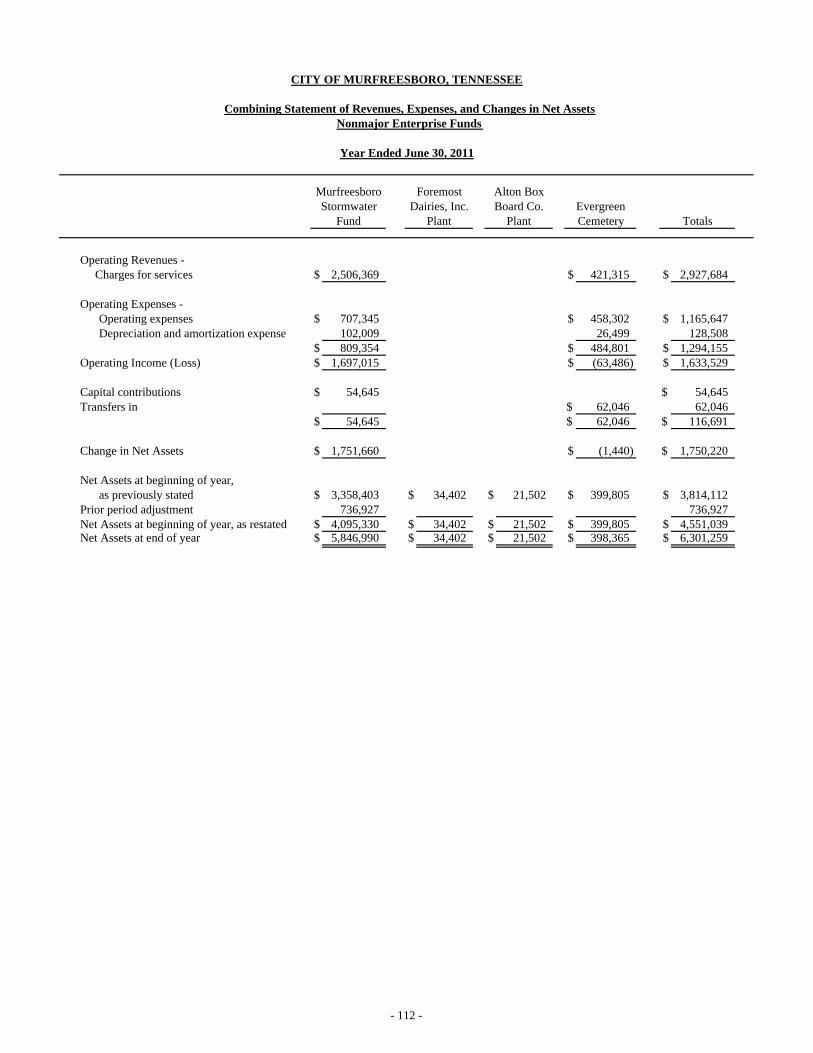
CITY OF MURFREESBORO, TENNESSEE
Combining Statement of Revenues, Expenses, and Changes in Net Assets Nonmajor Enterprise Funds
Year Ended June 30, 2011
Operating Revenues - Charges for services $ 2,506,369 $ 421,315 $ 2,927,684
Operating Expenses - Operating expenses $ 707,345 $ 458,302 $ 1,165,647Depreciation and amortization expense 102,009 26,499 128,508
$ 809,354 $ 484,801 $ 1,294,155Operating Income (Loss) $ 1,697,015 $ (63,486) $ 1,633,529
Capital contributions $ 54,645 $ 54,645Transfers in $ 62,046 62,046
$ 54,645 $ 62,046 $ 116,691
Change in Net Assets $ 1,751,660 $ (1,440) $ 1,750,220
Net Assets at beginning of year, as previously stated $ 3,358,403 $ 34,402 $ 21,502 $ 399,805 $ 3,814,112
Prior period adjustment 736,927 736,927Net Assets at beginning of year, as restated $ 4,095,330 $ 34,402 $ 21,502 $ 399,805 $ 4,551,039Net Assets at end of year $ 5,846,990 $ 34,402 $ 21,502 $ 398,365 $ 6,301,259
TotalsPlantBoard Co.Alton Box
CemeteryEvergreen
FundStormwater
Murfreesboro
PlantDairies, Inc.
Foremost
- 112 -

MurfreesboroStormwater
Fund
Cash Flows from Operating Activities - Cash received from customers $ 423,150 $ 423,150Cash payments to suppliers (186,864) (186,864)Cash payments to employees (280,738) (280,738)
Net Cash Used by Operating Activities $ (44,452) $ (44,452)
Cash Flows from Noncapital Financing Activities - Transfers in $ 62,046 $ 62,046
Net Cash Provided by Noncapital Financing Activities $ 62,046 $ 62,046
Cash Flows From Capital and Related Financing Activities - Acquisition and construction of capital assets $ (10,000) $ (10,000)
Net Cash Used by Capital and Related Financing Activities $ (10,000) $ (10,000)
Net Increase in Cash and Cash Equivalents $ -0- $ -0- $ -0- $ 7,594 $ 7,594Cash and Cash Equivalents at beginning of year 19,492 19,492Cash and Cash Equivalents at end of year $ -0- $ -0- $ -0- $ 27,086 $ 27,086
Reconciliation of operating income (loss) to net cash provided by operating activities: Operating income (loss) $ 1,697,015 $ (63,486) $ 1,633,529Adjustments to reconcile operating income to
net cash provided by operating activities - Depreciation 102,009 26,499 128,508Changes in assets and liabilities -
Accounts receivable 1,835 1,835Inventory (7,536) (7,536)Prepaid expenses 13,940 (2,987) 10,953Due from other funds (2,506,369) (2,506,369)Accounts payable 238,897 1,147 240,044Accrued and withheld liabilities 76 76Due to other funds 454,508 454,508
Net Cash Used by Operating Activities $ -0- $ (44,452) $ (44,452)
Non-Cash Capital and Related Financing Activities - Assets acquired by contributions in aid of
construction $ 54,645 $ 54,645Capital assets acquired with due to other fund 963,354 963,354
$ 1,017,999 $ 1,017,999
Year Ended June 30, 2011
Nonmajor Enterprise FundsCombining Statement of Cash Flows
CITY OF MURFREESBORO, TENNESSEE
Foremost
Plant
Alton BoxBoard Co.
Plant TotalsCemeteryEvergreenDairies, Inc.
- 113 -
INTERNAL SERVICE FUNDS Internal Service Funds are used to provide goods and services to other governmental operating units such as departments or agencies on a cost reimbursement basis. Insurance Fund accounts for revenues and costs associated with the City's self-funded group health insurance plan. Revenues are derived from premiums collected from the various City departments. Costs include medical claims and administrative expenses. Risk Management Fund accounts for revenues and costs associated with the City's self-funded liability and workers’ compensation insurance programs. Fleet Services Fund accounts for fleet and equipment management to other departments or agencies of the City on a cost reimbursement basis.

CITY OF MURFREESBORO, TENNESSEE
Combining Balance SheetInternal Service Funds
June 30, 2011
Insurance Totals
ASSETS
Current Assets - Cash and cash equivalents $ 3,184,694 $ 9,357,453 $ 12,542,147Accrued interest receivable 9,315 9,315Due from other funds 1,306 10 $ 21,078 22,394Due from other governments 9,484 683 10,167Due from others 120,052 23,858 143,910Prepaid items 520 520Inventory 162,555 162,555
Total Current Assets $ 3,306,572 $ 9,400,120 $ 184,316 $ 12,891,008Noncurrent Asset -
Restricted certificates of deposit 500,000 500,000Total Assets $ 3,306,572 $ 9,900,120 $ 184,316 $ 13,391,008
LIABILITIES AND NET ASSETS
Current Liabilities - Accounts payable $ 762,661 $ 250,511 $ 1,013,172Accrued liabilities $ 7,679 7,679Due to other funds 168 683 851Claims and judgments payable 2,295,204 2,295,204
Total Current Liabilities $ 762,661 $ 2,545,883 $ 8,362 $ 3,316,906Noncurrent Liabilities -
Claims and judgments payable 3,688,796 3,688,796Total Liabilities $ 762,661 $ 6,234,679 $ 8,362 $ 7,005,702
Net Assets - Unrestricted $ 2,543,911 $ 3,665,441 $ 175,954 $ 6,385,306
Total Net Assets $ 2,543,911 $ 3,665,441 $ 175,954 $ 6,385,306Total Liabilities and Net Assets $ 3,306,572 $ 9,900,120 $ 184,316 $ 13,391,008
RiskManagement
FleetServices
- 114 -
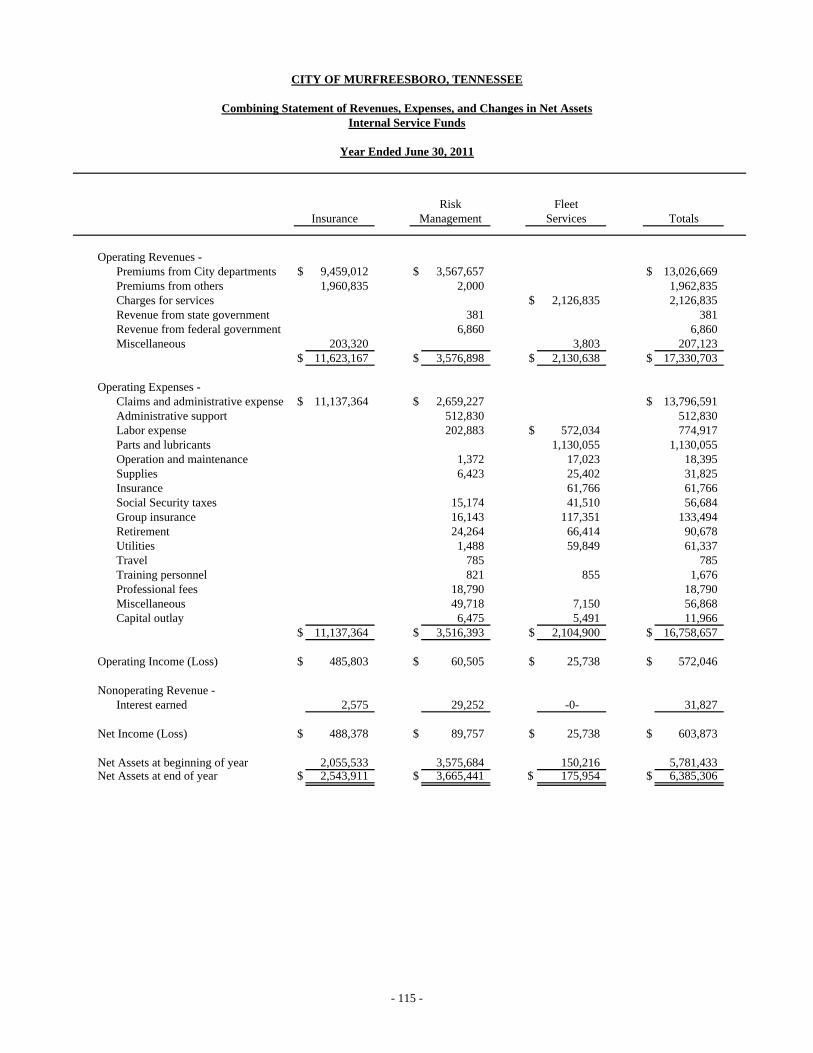
Operating Revenues - Premiums from City departments $ 9,459,012 $ 3,567,657 $ 13,026,669Premiums from others 1,960,835 2,000 1,962,835 Charges for services $ 2,126,835 2,126,835 Revenue from state government 381 381 Revenue from federal government 6,860 6,860 Miscellaneous 203,320 3,803 207,123
$ 11,623,167 $ 3,576,898 $ 2,130,638 $ 17,330,703
Operating Expenses - Claims and administrative expense $ 11,137,364 $ 2,659,227 $ 13,796,591Administrative support 512,830 512,830 Labor expense 202,883 $ 572,034 774,917 Parts and lubricants 1,130,055 1,130,055 Operation and maintenance 1,372 17,023 18,395 Supplies 6,423 25,402 31,825 Insurance 61,766 61,766 Social Security taxes 15,174 41,510 56,684 Group insurance 16,143 117,351 133,494 Retirement 24,264 66,414 90,678 Utilities 1,488 59,849 61,337 Travel 785 785 Training personnel 821 855 1,676 Professional fees 18,790 18,790 Miscellaneous 49,718 7,150 56,868 Capital outlay 6,475 5,491 11,966
$ 11,137,364 $ 3,516,393 $ 2,104,900 $ 16,758,657
Operating Income (Loss) $ 485,803 $ 60,505 $ 25,738 $ 572,046
Nonoperating Revenue - Interest earned 2,575 29,252 -0- 31,827
Net Income (Loss) $ 488,378 $ 89,757 $ 25,738 $ 603,873
Net Assets at beginning of year 2,055,533 3,575,684 150,216 5,781,433 Net Assets at end of year $ 2,543,911 $ 3,665,441 $ 175,954 $ 6,385,306
Internal Service Funds
Year Ended June 30, 2011
CITY OF MURFREESBORO, TENNESSEE
Combining Statement of Revenues, Expenses, and Changes in Net Assets
Insurance TotalsRisk
ManagementFleet
Services
- 115 -
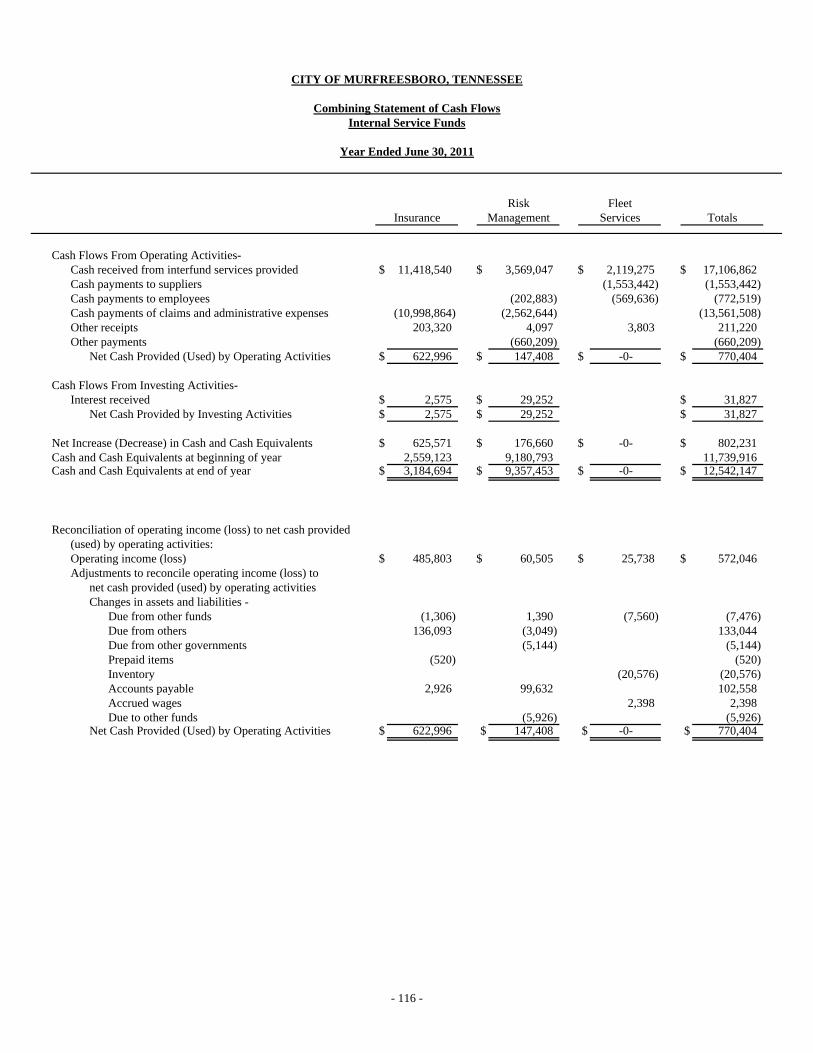
Cash Flows From Operating Activities- Cash received from interfund services provided $ 11,418,540 $ 3,569,047 $ 2,119,275 $ 17,106,862Cash payments to suppliers (1,553,442) (1,553,442) Cash payments to employees (202,883) (569,636) (772,519) Cash payments of claims and administrative expenses (10,998,864) (2,562,644) (13,561,508)Other receipts 203,320 4,097 3,803 211,220 Other payments (660,209) (660,209)
Net Cash Provided (Used) by Operating Activities $ 622,996 $ 147,408 $ -0- $ 770,404
Cash Flows From Investing Activities- Interest received $ 2,575 $ 29,252 $ 31,827
Net Cash Provided by Investing Activities $ 2,575 $ 29,252 $ 31,827
Net Increase (Decrease) in Cash and Cash Equivalents $ 625,571 $ 176,660 $ -0- $ 802,231Cash and Cash Equivalents at beginning of year 2,559,123 9,180,793 11,739,916Cash and Cash Equivalents at end of year $ 3,184,694 $ 9,357,453 $ -0- $ 12,542,147
Reconciliation of operating income (loss) to net cash provided (used) by operating activities: Operating income (loss) $ 485,803 $ 60,505 $ 25,738 $ 572,046 Adjustments to reconcile operating income (loss) to
net cash provided (used) by operating activities Changes in assets and liabilities -
Due from other funds (1,306) 1,390 (7,560) (7,476) Due from others 136,093 (3,049) 133,044 Due from other governments (5,144) (5,144) Prepaid items (520) (520) Inventory (20,576) (20,576) Accounts payable 2,926 99,632 102,558 Accrued wages 2,398 2,398 Due to other funds (5,926) (5,926)
Net Cash Provided (Used) by Operating Activities $ 622,996 $ 147,408 $ -0- $ 770,404
Totals
CITY OF MURFREESBORO, TENNESSEE
Combining Statement of Cash FlowsInternal Service Funds
Year Ended June 30, 2011
FleetServicesInsurance
Risk
Management
- 116 -

PENSION TRUST FUNDS
Pension Trust Funds account for assets held in trust on behalf of City employees. The funds are accounted for in the same manner as proprietary funds. Employees' Pension Trust Fund accounts for revenues and expenses associated with the City's defined benefit employee pension plan. Revenues are derived primarily from contributions made by the City, employees, and earnings on investments. Electric Department Employee Pension Fund accounts for revenues and expenses associated with the administration of the pension plan on behalf of the employees of the Murfreesboro Electric Department. Revenues are derived primarily from contributions made by the employer, employees, and investment earnings.
AGENCY FUND
The Agency Fund accounts for the assets held by the schools in an agency capacity on behalf of various student, teacher and parent organizations.
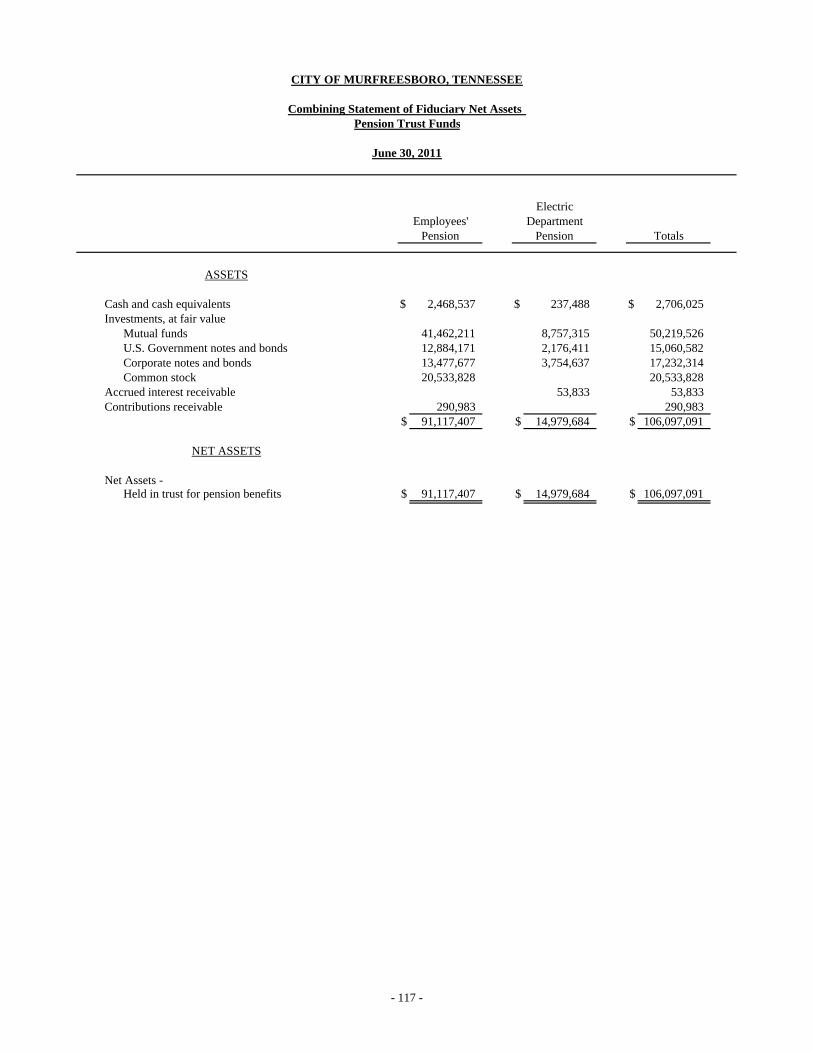
CITY OF MURFREESBORO, TENNESSEE
Combining Statement of Fiduciary Net Assets Pension Trust Funds
June 30, 2011
ElectricEmployees' Department
Pension Pension Totals
ASSETS
Cash and cash equivalents $ 2,468,537 $ 237,488 $ 2,706,025Investments, at fair value
Mutual funds 41,462,211 8,757,315 50,219,526U.S. Government notes and bonds 12,884,171 2,176,411 15,060,582Corporate notes and bonds 13,477,677 3,754,637 17,232,314Common stock 20,533,828 20,533,828
Accrued interest receivable 53,833 53,833Contributions receivable 290,983 290,983
$ 91,117,407 $ 14,979,684 $ 106,097,091
NET ASSETS
Net Assets - Held in trust for pension benefits $ 91,117,407 $ 14,979,684 $ 106,097,091
- 117 -

CITY OF MURFREESBORO, TENNESSEE
Combining Statement of Changes in Fiduciary Net Assets Pension Trust Funds
Year Ended June 30, 2011
ElectricEmployees' Department
Pension Pension
Additions - Contributions -
Employer $ 4,484,491 $ 930,409 $ 5,414,900Investment income-
Net appreciation in fair value of investments $ 11,977,154 $ 2,195,820 $ 14,172,974Interest 1,143,544 209,881 1,353,425Dividends 1,300,370 142,105 1,442,475
Total investment income $ 14,421,068 $ 2,547,806 $ 16,968,874Less investment fees (59,738) (59,738)
Net investment income $ 14,421,068 $ 2,488,068 $ 16,909,136Total additions $ 18,905,559 $ 3,418,477 $ 22,324,036
Deductions - Benefits to participants $ 2,994,941 $ 644,233 $ 3,639,174Insurance premiums 516,712 516,712
Total deductions $ 3,511,653 $ 644,233 $ 4,155,886
Net Increase (Decrease) $ 15,393,906 $ 2,774,244 $ 18,168,150
Net Assets Held in Trust for Pension Benefits - Beginning of year 75,723,501 12,205,440 87,928,941End of year $ 91,117,407 $ 14,979,684 $ 106,097,091
Totals
- 118 -
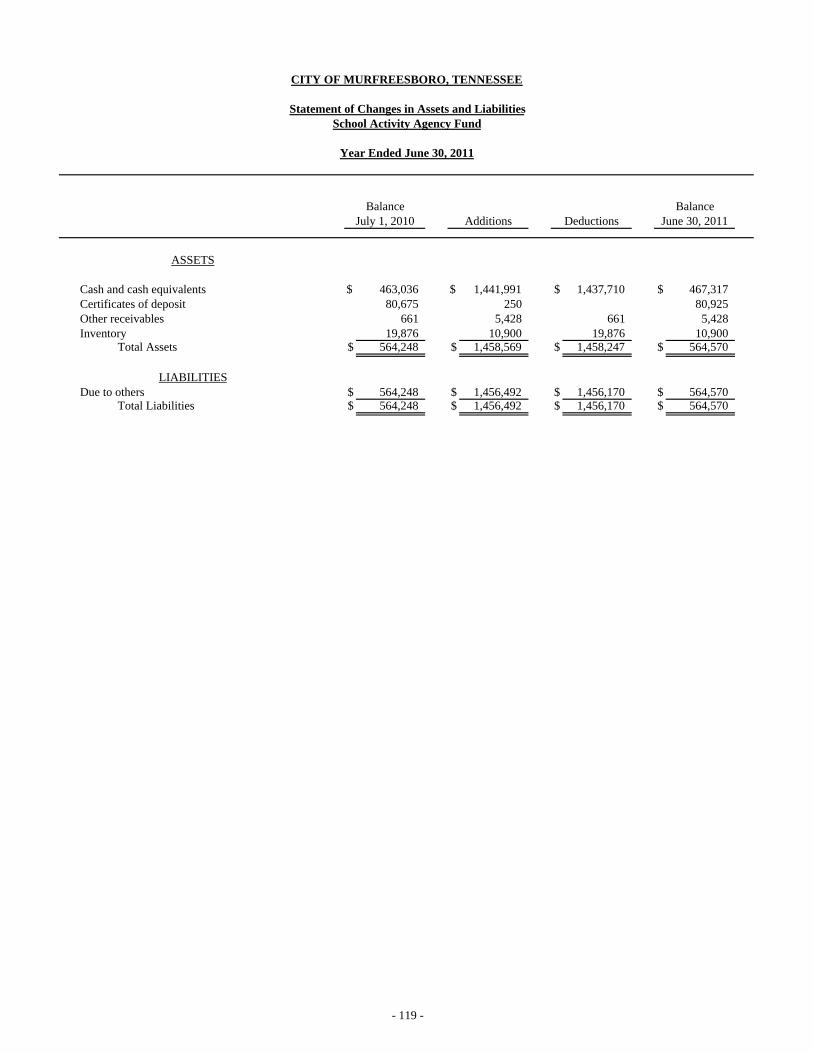
ASSETS
Cash and cash equivalents $ 463,036 $ 1,441,991 $ 1,437,710 $ 467,317Certificates of deposit 80,675 250 80,925Other receivables 661 5,428 661 5,428Inventory 19,876 10,900 19,876 10,900
Total Assets $ 564,248 $ 1,458,569 $ 1,458,247 $ 564,570
Due to others $ 564,248 $ 1,456,492 $ 1,456,170 $ 564,570Total Liabilities $ 564,248 $ 1,456,492 $ 1,456,170 $ 564,570
June 30, 2011DeductionsBalance
CITY OF MURFREESBORO, TENNESSEE
Statement of Changes in Assets and LiabilitiesSchool Activity Agency Fund
Year Ended June 30, 2011
AdditionsJuly 1, 2010Balance
LIABILITIES
- 119 -

FINANCIAL SCHEDULES Financial Schedules are presented to demonstrate finance related legal and contractual compliance, provide details of data summarized in the financial statements, and present other information deemed useful.

CITY OF MURFREESBORO, TENNESSEE
Schedule of Certificates of Deposit by Fund
June 30, 2011
Interest MaturityRate Date Amount
Governmental Funds - Extended School Program Fund
Pinnacle National Bank 1.05 % 03/03/2012 $ 100,000Pinnacle National Bank 0.55 09/20/2011 124,767Pinnacle National Bank 0.55 09/20/2011 124,767
$ 349,534School Cafeteria Fund
Pinnacle National Bank 1.10 % 11/04/2011 $ 20,000
Enterprise Funds - Evergreen Cemetery Commission -
Pinnacle National Bank 0.55 % 07/03/2011 $ 7,465
Internal Service Funds - Risk Management Fund -
Midsouth Bank, Murfreesboro 2.42 % 09/23/2011 $ 500,000
Fiduciary Funds - Extended School Program Private Purpose Trust Fund
Pinnacle National Bank 1.05 % 03/03/2012 $ 156,631
School Activity Agency Fund Suntrust Bank 0.10 % 12/12/2011 $ 26,706Pinnacle National Bank 0.70 12/11/2011 5,000Pinnacle National Bank 0.70 03/22/2012 10,000
$ 41,706
Total Certificates of Deposit $ 1,075,336
- 120 -
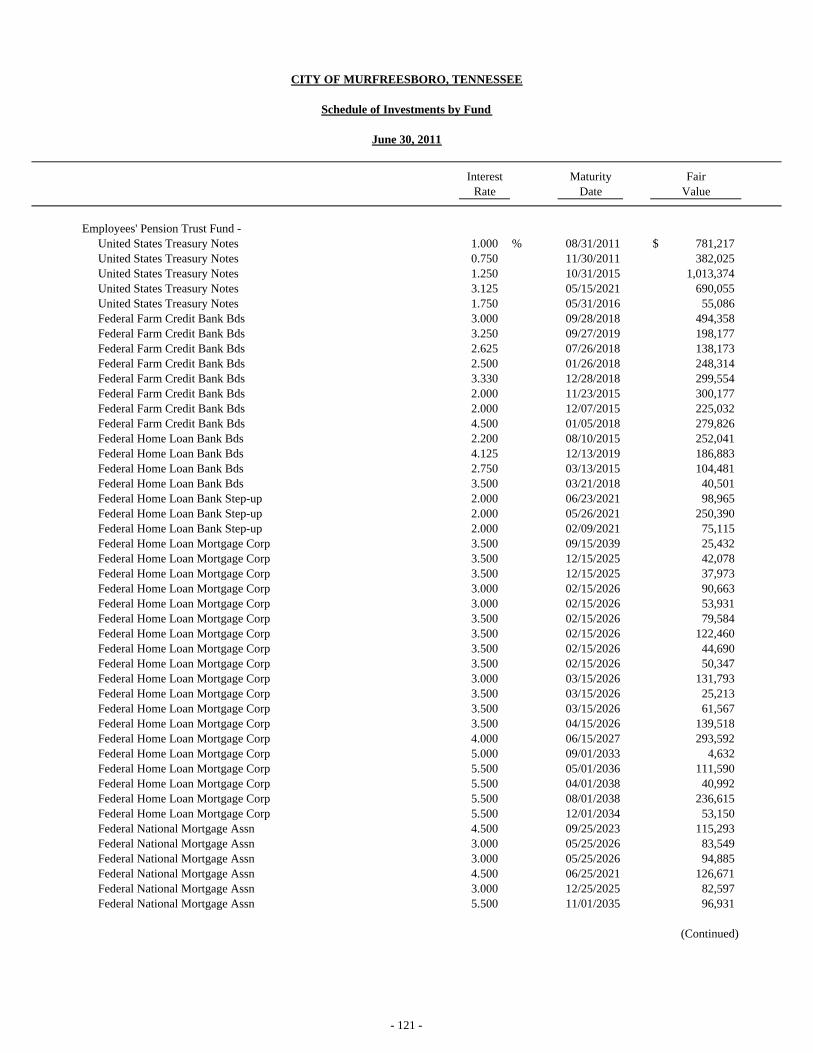
Interest MaturityRate Date Value
Employees' Pension Trust Fund - United States Treasury Notes 1.000 % 08/31/2011 $ 781,217United States Treasury Notes 0.750 11/30/2011 382,025United States Treasury Notes 1.250 10/31/2015 1,013,374United States Treasury Notes 3.125 05/15/2021 690,055United States Treasury Notes 1.750 05/31/2016 55,086Federal Farm Credit Bank Bds 3.000 09/28/2018 494,358Federal Farm Credit Bank Bds 3.250 09/27/2019 198,177Federal Farm Credit Bank Bds 2.625 07/26/2018 138,173Federal Farm Credit Bank Bds 2.500 01/26/2018 248,314Federal Farm Credit Bank Bds 3.330 12/28/2018 299,554Federal Farm Credit Bank Bds 2.000 11/23/2015 300,177Federal Farm Credit Bank Bds 2.000 12/07/2015 225,032Federal Farm Credit Bank Bds 4.500 01/05/2018 279,826Federal Home Loan Bank Bds 2.200 08/10/2015 252,041Federal Home Loan Bank Bds 4.125 12/13/2019 186,883Federal Home Loan Bank Bds 2.750 03/13/2015 104,481Federal Home Loan Bank Bds 3.500 03/21/2018 40,501Federal Home Loan Bank Step-up 2.000 06/23/2021 98,965Federal Home Loan Bank Step-up 2.000 05/26/2021 250,390Federal Home Loan Bank Step-up 2.000 02/09/2021 75,115Federal Home Loan Mortgage Corp 3.500 09/15/2039 25,432Federal Home Loan Mortgage Corp 3.500 12/15/2025 42,078Federal Home Loan Mortgage Corp 3.500 12/15/2025 37,973Federal Home Loan Mortgage Corp 3.000 02/15/2026 90,663Federal Home Loan Mortgage Corp 3.000 02/15/2026 53,931Federal Home Loan Mortgage Corp 3.500 02/15/2026 79,584Federal Home Loan Mortgage Corp 3.500 02/15/2026 122,460Federal Home Loan Mortgage Corp 3.500 02/15/2026 44,690Federal Home Loan Mortgage Corp 3.500 02/15/2026 50,347Federal Home Loan Mortgage Corp 3.000 03/15/2026 131,793Federal Home Loan Mortgage Corp 3.500 03/15/2026 25,213Federal Home Loan Mortgage Corp 3.500 03/15/2026 61,567Federal Home Loan Mortgage Corp 3.500 04/15/2026 139,518Federal Home Loan Mortgage Corp 4.000 06/15/2027 293,592Federal Home Loan Mortgage Corp 5.000 09/01/2033 4,632Federal Home Loan Mortgage Corp 5.500 05/01/2036 111,590Federal Home Loan Mortgage Corp 5.500 04/01/2038 40,992Federal Home Loan Mortgage Corp 5.500 08/01/2038 236,615Federal Home Loan Mortgage Corp 5.500 12/01/2034 53,150Federal National Mortgage Assn 4.500 09/25/2023 115,293Federal National Mortgage Assn 3.000 05/25/2026 83,549Federal National Mortgage Assn 3.000 05/25/2026 94,885Federal National Mortgage Assn 4.500 06/25/2021 126,671Federal National Mortgage Assn 3.000 12/25/2025 82,597Federal National Mortgage Assn 5.500 11/01/2035 96,931
(Continued)
CITY OF MURFREESBORO, TENNESSEE
Schedule of Investments by Fund
June 30, 2011
Fair
- 121 -

Interest MaturityRate Date Value
Employees' Pension Trust Fund (continued) - Federal National Mortgage Assn 6.000 % 06/01/2036 $ 460,836Federal National Mortgage Assn 5.500 12/01/2032 107,658Federal National Mortgage Assn 5.000 05/01/2033 16,886Federal National Mortgage Assn 5.500 06/01/2033 104,090Federal National Mortgage Assn 5.500 09/01/2034 100,164Federal National Mortgage Assn 5.000 03/01/2035 36,230Federal National Mortgage Assn 5.500 05/01/2035 117,062Federal National Mortgage Assn 5.000 06/01/2035 12,934Federal National Mortgage Assn 5.500 01/01/2036 109,092Federal National Mortgage Assn 5.000 02/01/2036 502,498Federal National Mortgage Assn 5.500 04/01/2036 25,463Federal National Mortgage Assn 6.000 11/01/2036 282,508Federal National Mortgage Assn 5.500 01/01/2035 35,303Federal National Mortgage Assn 5.500 05/01/2036 390Federal National Mortgage Assn 6.000 03/01/2037 41,570Federal National Mortgage Assn 5.000 10/01/2035 106,043Federal National Mortgage Assn 5.500 05/01/2037 172,323Federal National Mortgage Assn 6.000 03/01/2037 130,530Federal National Mortgage Assn 6.000 08/01/2037 152,598Federal National Mortgage Assn 5.500 08/01/2037 4,552Federal National Mortgage Assn 5.500 09/01/2038 94,113Federal National Mortgage Assn 6.000 10/01/2038 56,008Federal National Mortgage Assn 6.000 02/01/2039 64,012Federal National Mortgage Assn 5.500 02/01/2037 926Federal National Mortgage Assn 6.000 07/01/2038 151,160Federal National Mortgage Assn 5.000 05/01/2038 100,578Federal National Mortgage Assn 6.000 04/01/2039 306,540Federal National Mortgage Assn 6.000 10/01/2038 20,013Federal National Mortgage Assn 5.000 07/01/2040 868Federal National Mortgage Assn 5.500 12/01/2035 438,159Federal National Mortgage Assn 6.000 10/01/2040 126,940Federal National Mortgage Assn 6.000 01/01/2039 61,700Federal National Mortgage Assn 3.500 10/01/2040 166,119Government National Mortgage Assn 6.000 12/20/2036 83,231Government National Mortgage Assn 4.743 01/20/2061 167,620Government National Mortgage Assn 5.500 10/20/2033 49,136Government National Mortgage Assn 6.000 06/20/2037 30,983FHLMC Gold TBA 30Yr. 3.500 N/A 87,845Abbot Labs 5.125 04/01/2019 385,049American Express Bk Fsb Medium Term Bk Nts Tranche 5.500 04/16/2013 534,900Appalachian Pwr Co. Sr Nt K 5.000 06/01/2017 107,729Atmos Energy Corp. Sr Nt 4.950 10/15/2014 328,011Autozone Inc. Sr Nt 5.750 01/15/2015 223,080Autozone Inc. 4.000 11/15/2020 95,555BB&T Corporation 6.500 08/01/2011 50,211
(Continued)
CITY OF MURFREESBORO, TENNESSEE
Schedule of Investments by Fund (continued)
June 30, 2011
Fair
- 122 -

Interest MaturityRate Date Value
Employees' Pension Trust Fund (continued) - BB&T Corp. Sr Nt 3.950 % 04/29/2016 $ 313,953BP Capital Markets PLC 3.875 03/10/2015 78,986Bank Amer Corp. Sr Global Nt 5.125 11/15/2014 159,168Bank of America Corp. 4.875 01/15/2013 398,483Bank of America Senior 3.625 03/17/2016 25,072Bank New York Inc Medium Term Sr Nts 4.500 04/01/2013 265,622Bellsouth Corp. Nt 6.000 10/15/2011 253,797Bellsouth Corp. Nt 5.200 09/15/2014 385,595Caterpillar Finl Corp Pwr Nt Be Fr 4.050 07/15/2011 100,074Caterpillar Finl Svcs Corp Medium 4.900 08/15/2013 323,070Citigroup Inc. Sub Nt 5.000 09/15/2014 209,592Comcast Corp. New Nt 4.950 06/15/2016 164,661Dell Inc. Nt 2.300 09/10/2015 150,606Express Scripts 3.125 05/15/2016 176,078General Elec Co. Nt 5.250 12/06/2017 553,910General Elec Cap Corp Medium Term Nt Tranche 5.625 05/01/2018 273,430General Electric Capital 2.950 05/09/2016 100,551Goldman Sachs Group Inc. Nt 6.150 04/01/2018 136,043Goldman Sachs Group Inc. Sr Nt 6.250 09/01/2017 441,364Hewlett Packard Co. Global Nt 4.750 06/02/2014 381,941IBM Intl Group Cap Llc Nt 5.050 10/22/2012 264,673Kinder Morgan Energy Partners 3.500 03/01/2016 308,868Kraft Foods 4.125 02/09/2016 181,781McDonalds Corp. Medium Term Nts Tranche 4.300 03/01/2013 264,495Merrill Lynch & Co. Sub Nt 6.050 05/16/2016 262,098Morgan Stanley Nt 5.450 01/09/2017 370,136Morgan Stanley Step-up Sr Mtn 4.000 07/20/2020 200,374National Rural Util Coop Fin Corp. 7.200 10/01/2015 293,015NationsBank Corp. Sub Nt 7.750 08/15/2015 283,790Oracle Corp. / Ozark Holding Inc. Nt 5.250 01/15/2016 394,979Sunoco Inc. Nt 4.875 10/15/2014 107,583Verizon Virginia Inc. 4.625 03/15/2013 263,665Wells Fargo & Co. New Nt 5.250 10/23/2012 105,509Wells Fargo Bk Natl Assn Sub Bk Nt 4.750 02/09/2015 320,874AT&T Inc 4.950 01/15/2013 40,281Abbott Labs 5.600 11/30/2017 75,328Air Products & Chemicals 4.150 02/01/2013 16,802Alabama Power Co. 5.800 11/15/2013 29,882Analog Devices, Inc. 3.000 04/15/2016 7,173Becton Dickinson 3.250 11/12/2020 8,567Berkshire Hathaway Fin 4.600 05/15/2013 32,003Berkshire Hathaway Inc. 3.200 02/11/2015 48,986Biomed Realty LP 3.850 04/15/2016 18,142Boeing Co. 5.125 02/15/2013 34,172Cme Group Inc. 5.400 08/01/2013 28,290
(Continued)
CITY OF MURFREESBORO, TENNESSEE
Schedule of Investments by Fund (continued)
June 30, 2011
Fair
- 123 -
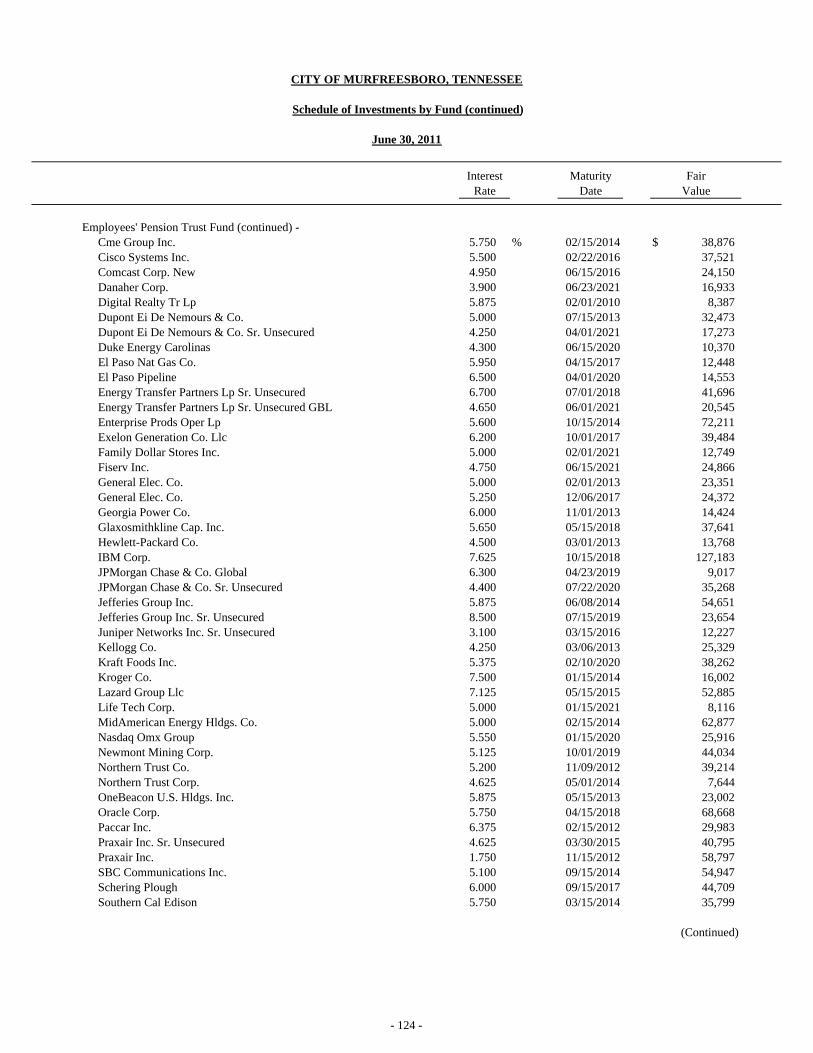
Interest MaturityRate Date Value
Employees' Pension Trust Fund (continued) - Cme Group Inc. 5.750 % 02/15/2014 $ 38,876Cisco Systems Inc. 5.500 02/22/2016 37,521Comcast Corp. New 4.950 06/15/2016 24,150Danaher Corp. 3.900 06/23/2021 16,933Digital Realty Tr Lp 5.875 02/01/2010 8,387Dupont Ei De Nemours & Co. 5.000 07/15/2013 32,473Dupont Ei De Nemours & Co. Sr. Unsecured 4.250 04/01/2021 17,273Duke Energy Carolinas 4.300 06/15/2020 10,370El Paso Nat Gas Co. 5.950 04/15/2017 12,448El Paso Pipeline 6.500 04/01/2020 14,553Energy Transfer Partners Lp Sr. Unsecured 6.700 07/01/2018 41,696Energy Transfer Partners Lp Sr. Unsecured GBL 4.650 06/01/2021 20,545Enterprise Prods Oper Lp 5.600 10/15/2014 72,211Exelon Generation Co. Llc 6.200 10/01/2017 39,484Family Dollar Stores Inc. 5.000 02/01/2021 12,749Fiserv Inc. 4.750 06/15/2021 24,866General Elec. Co. 5.000 02/01/2013 23,351General Elec. Co. 5.250 12/06/2017 24,372Georgia Power Co. 6.000 11/01/2013 14,424Glaxosmithkline Cap. Inc. 5.650 05/15/2018 37,641Hewlett-Packard Co. 4.500 03/01/2013 13,768IBM Corp. 7.625 10/15/2018 127,183JPMorgan Chase & Co. Global 6.300 04/23/2019 9,017JPMorgan Chase & Co. Sr. Unsecured 4.400 07/22/2020 35,268Jefferies Group Inc. 5.875 06/08/2014 54,651Jefferies Group Inc. Sr. Unsecured 8.500 07/15/2019 23,654Juniper Networks Inc. Sr. Unsecured 3.100 03/15/2016 12,227Kellogg Co. 4.250 03/06/2013 25,329Kraft Foods Inc. 5.375 02/10/2020 38,262Kroger Co. 7.500 01/15/2014 16,002Lazard Group Llc 7.125 05/15/2015 52,885Life Tech Corp. 5.000 01/15/2021 8,116MidAmerican Energy Hldgs. Co. 5.000 02/15/2014 62,877Nasdaq Omx Group 5.550 01/15/2020 25,916Newmont Mining Corp. 5.125 10/01/2019 44,034Northern Trust Co. 5.200 11/09/2012 39,214Northern Trust Corp. 4.625 05/01/2014 7,644OneBeacon U.S. Hldgs. Inc. 5.875 05/15/2013 23,002Oracle Corp. 5.750 04/15/2018 68,668Paccar Inc. 6.375 02/15/2012 29,983Praxair Inc. Sr. Unsecured 4.625 03/30/2015 40,795Praxair Inc. 1.750 11/15/2012 58,797SBC Communications Inc. 5.100 09/15/2014 54,947Schering Plough 6.000 09/15/2017 44,709Southern Cal Edison 5.750 03/15/2014 35,799
(Continued)
CITY OF MURFREESBORO, TENNESSEE
Schedule of Investments by Fund (continued)
June 30, 2011
Fair
- 124 -

Interest MaturityRate Date Value
Employees' Pension Trust Fund (continued) - TC Pipelines Lp 4.650 % 06/15/2021 $ 24,866Teva Pharmaceutical Fin. Llc 5.550 02/01/2016 24,762Time Warner Inc. 4.875 03/15/2020 5,178Time Warner Cable Inc. 5.850 05/01/2017 89,964Time Waner Cable Inc. 8.250 02/14/2014 38,384Toyota Motor Credit Corp. 3.200 06/17/2015 16,629Transcontinental Gas Pipe Corp. 6.050 06/15/2018 7,926United Parcel Service Inc. 3.125 01/15/2021 15,195United Technologies Corp. 6.125 02/01/2019 70,168Verizon Communications Inc. 5.250 04/15/2013 22,549Wal Mart Stores Inc. 1.625 04/15/2014 9,119Wal Mart Stores Inc. Sr. Unsecured 4.250 04/15/2021 68,406Walgreen Co. 4.875 08/01/2013 23,814Williams Partners Lp 4.125 11/15/2020 24,957Xerox Corp. 5.500 05/15/2012 21,834Xerox Corp. 6.350 05/15/2018 30,949Banc Amer Cmbs 5.090 07/10/2043 51,224Banc Amer Coml Mtg. Inc. Variable 09/10/2047 74,753Delta Air Lines Inc. 4.950 05/23/2019 9,832Household Home Equity Ln Tr Variable 01/20/2034 30,314Household Home Equity Ln Tr Variable 03/20/2036 70,677LB-UBS Commercial Mtg Tr 5.156 02/15/2031 73,574LB-UBS Commercial Mtg Tr 5.263 11/15/2040 61,381Wachovia Bank Commercial Mtg Tr 5.179 07/15/2042 109,445Wachovia Bank Commercial Mtg Tr Variable 10/15/2044 139,557Bank of Nova Scotia Sr. Unsecured 3.400 01/22/2015 27,315Bank of Nova Scotia 2.375 12/17/2013 20,572Barrick Australia Finance 4.950 01/15/2020 41,055Covidien Intl. 6.000 10/15/2017 40,904Diageo Capital Plc 5.200 01/30/2013 20,263Ensco Plc 4.700 03/15/2021 9,092Rogers Wireless Inc. 7.500 03/15/2015 18,942Sanofi-Aventis 4.000 03/29/2021 40,004Thomson Reuters Corp. 5.950 07/15/2013 15,313Total Capital Sa 3.000 06/24/2015 16,646Trans-Canada Pipelines 3.800 10/01/2020 27,702Veolia Environment 6.000 06/01/2018 29,345Caterpillar Inc. Del Com N/A N/A 319,380Fluor Corp. New Com N/A N/A 420,290General Elec Co. Com N/A N/A 264,040Goodrich Corp. Com N/A N/A 191,000Honeywell Intl. Inc. Com N/A N/A 595,900Quanta Services Inc. Com N/A N/A 101,000Sigma-Aldrich Corp. Com N/A N/A 330,210Union Pacific Corp. Com N/A N/A 469,800
(Continued)
CITY OF MURFREESBORO, TENNESSEE
Schedule of Investments by Fund (continued)
June 30, 2011
Fair
- 125 -

Interest MaturityRate Date Value
Employees' Pension Trust Fund (continued) - Amazon.com Inc. Com N/A N/A $ 613,470American Tower Corporation N/A N/A 418,640Disney Walt Co. Com N/A N/A 390,400Home Depot Inc. Com N/A N/A 362,200McDonalds Corp. Com N/A N/A 421,600Nike Inc. Cl B N/A N/A 449,900Verizon Communications Inc. Com N/A N/A 409,530Wal Mart Stores Inc. Com N/A N/A 318,840Yum! Brands Inc Com N/A N/A 331,440American Express Co. Com N/A N/A 347,683Apache Corp. Com N/A N/A 493,560Apple, Inc. Com N/A N/A 386,021Bank of America Corp. Com N/A N/A 241,120Chesapeake Energy Corp. Com N/A N/A 267,210Chubb Corp. Com N/A N/A 187,830Cisco Systems Inc. Com N/A N/A 312,200Corning Inc. Com N/A N/A 381,150E M C Corp. Mass Com N/A N/A 551,000Exxon Mobil Corp Com N/A N/A 447,590Goldman Sachs Group Inc. Com N/A N/A 485,778Google Inc. Cl A N/A N/A 303,828Intel Corp Com N/A N/A 620,480JP Morgan Chase & Company Com N/A N/A 511,750Morgan Stanely Com New N/A N/A 276,120National Oilwell Varco Inc. Com N/A N/A 391,050Oracle Corporation Com N/A N/A 658,200Prudental Financial Inc. Com N/A N/A 394,258Qualcomm Inc. Com N/A N/A 624,690Schlumberger Ltd Com N/A N/A 475,200Southern Co. Com N/A N/A 242,280Wells Fargo & Company New Com N/A N/A 364,780Colgate Palmolive Co. Com N/A N/A 349,640Costco Whsl Corp. New Com N/A N/A 243,720Kimberly Clark Corp. Com N/A N/A 266,240Kraft Foods Inc. Cl A N/A N/A 281,840Pepsico Inc. Com N/A N/A 683,171Phillip Morris International Com. N/A N/A 467,390Ishares Tr S&P Midcap Value Index N/A N/A 420,000Amgen Inc. Com N/A N/A 262,575Bristol Myers Squibb Co. Com N/A N/A 231,680Express Scripts Inc. Com N/A N/A 380,559Gilead Sciences Inc. Com N/A N/A 372,690Johnson & Johnson Com N/A N/A 332,600Medtronic Inc. Com N/A N/A 250,445Merck & Co. Inc. New Com N/A N/A 282,320Teva Pharmaceutical-Sp Adr N/A N/A 337,540Vangrd Sml-Cap Growth N/A N/A 3,554,972
(Continued)
CITY OF MURFREESBORO, TENNESSEE
Schedule of Investments by Fund (continued)
June 30, 2011
Fair
- 126 -

Interest MaturityRate Date Value
Employees' Pension Trust Fund (continued) - Blackrock Global Resources Port Fund Instl #368 N/A N/A $ 2,393,680Ridgeworth Fd-Smallcap Val Equity I Shs #RGD6 N/A N/A 4,051,254Ridgeworth Fd-Seix Fltg Rt High Incm I Shs #RGCJ N/A N/A 813,648Legg Mason Global Opp Bond Fund N/A N/A 6,746,224PIMCO Global Bond Fund US Dollar FD #249 N/A N/A 6,269,944Amer. Funds - Cap. World Growth and Inc. FD #2633 N/A N/A 3,951,013Dodge & Cox International Stock Fund #1048 N/A N/A 9,073,151Janus Global Research Fund #1175 N/A N/A 2,250,435Van Eck Global Hard Assets Fund N/A N/A 2,357,890
$ 88,357,887Electric Department Employee Pension Fund -
Federal Farm Credit Bank 5.500 % 10/22/2018 $ 116,618Federal Farm Credit Bank 3.000 09/28/2018 494,358Federal Farm Credit Bank 2.500 01/26/2018 148,988Federal Farm Credit Bank 3.000 03/30/2017 100,795Federal Farm Credit Bank 3.330 12/28/2018 99,851Federal Farm Credit Bank 2.625 06/21/2017 200,073Federal Farm Credit Bank 2.625 07/26/2018 246,737Federal Home Loan Bank 2.250 08/26/2020 147,769Federal Home Loan Bank 5.000 08/24/2016 52,373Federal Home Loan Bank 2.750 03/13/2015 104,481Federal Home Loan Bank 2.000 02/09/2021 50,077Federal Home Loan Bank 3.125 12/08/2017 112,775Federal Home Loan Bank 3.500 03/21/2018 101,252Fannie Mae 1.000 12/09/2022 200,264General Electric Capital Corporation 5.625 05/01/2018 109,372General Electric Company 5.250 12/06/2017 332,346Goldman Sachs 6.250 09/01/2017 159,994Hewlett Packard Company 4.750 06/02/2014 125,495IBM International Group 5.050 10/22/2012 105,869Kinder Morgan Energy Partners 3.500 03/01/2016 102,956Morgan Stanley 5.450 01/09/2017 158,630Oracle Corporation 5.250 01/15/2016 84,638University of Notre Dame 4.141 09/01/2013 69,211Wells Fargo Corporation 4.375 01/31/2013 104,952Abbott Laboratories 5.125 04/01/2019 110,014American Express Bank 5.500 04/16/2013 267,450Atmos Energy Corporation 4.950 10/15/2014 273,343Bank of America 5.125 11/15/2014 106,112Bank of New York Mellon 4.500 04/01/2013 159,374Bank of America 4.875 01/15/2013 162,539Bank of America 4.750 05/15/2016 278,185BB&T 3.950 04/29/2016 104,651
(Continued)
CITY OF MURFREESBORO, TENNESSEE
Schedule of Investments by Fund (continued)
June 30, 2011
Fair
- 127 -
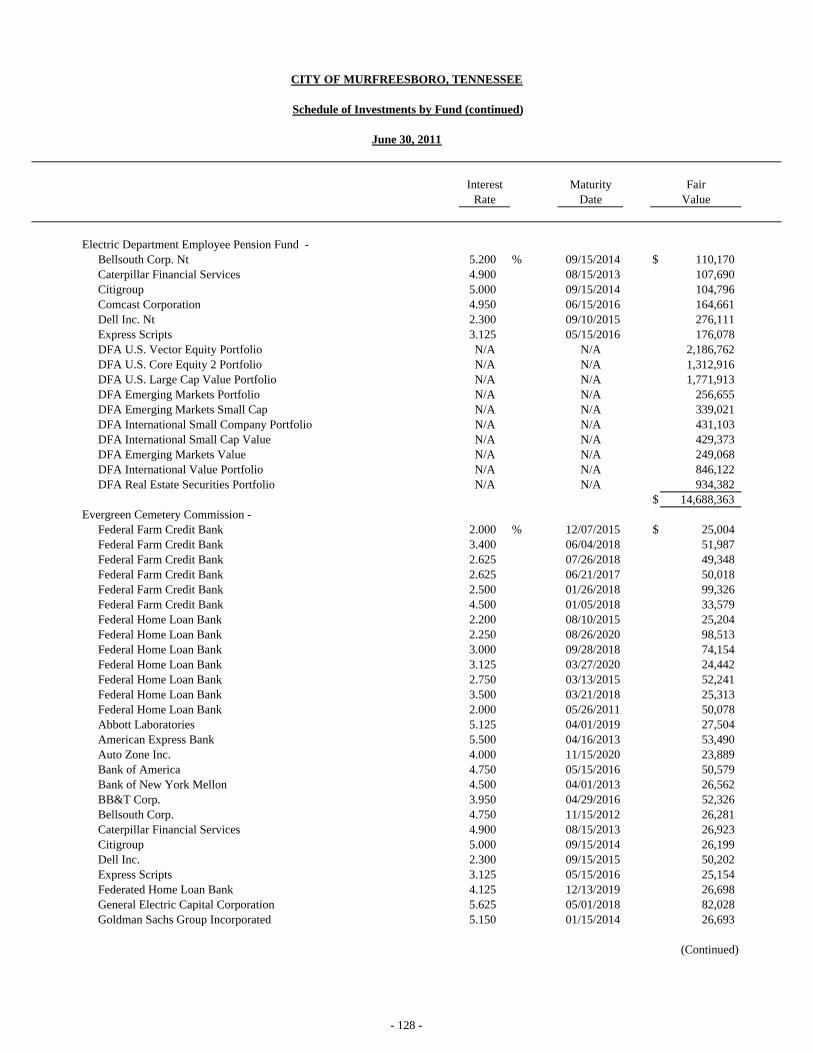
Interest MaturityRate Date Value
Electric Department Employee Pension Fund - Bellsouth Corp. Nt 5.200 % 09/15/2014 $ 110,170Caterpillar Financial Services 4.900 08/15/2013 107,690Citigroup 5.000 09/15/2014 104,796Comcast Corporation 4.950 06/15/2016 164,661Dell Inc. Nt 2.300 09/10/2015 276,111Express Scripts 3.125 05/15/2016 176,078DFA U.S. Vector Equity Portfolio N/A N/A 2,186,762DFA U.S. Core Equity 2 Portfolio N/A N/A 1,312,916DFA U.S. Large Cap Value Portfolio N/A N/A 1,771,913DFA Emerging Markets Portfolio N/A N/A 256,655DFA Emerging Markets Small Cap N/A N/A 339,021DFA International Small Company Portfolio N/A N/A 431,103DFA International Small Cap Value N/A N/A 429,373DFA Emerging Markets Value N/A N/A 249,068DFA International Value Portfolio N/A N/A 846,122DFA Real Estate Securities Portfolio N/A N/A 934,382
$ 14,688,363Evergreen Cemetery Commission -
Federal Farm Credit Bank 2.000 % 12/07/2015 $ 25,004Federal Farm Credit Bank 3.400 06/04/2018 51,987Federal Farm Credit Bank 2.625 07/26/2018 49,348Federal Farm Credit Bank 2.625 06/21/2017 50,018Federal Farm Credit Bank 2.500 01/26/2018 99,326Federal Farm Credit Bank 4.500 01/05/2018 33,579Federal Home Loan Bank 2.200 08/10/2015 25,204Federal Home Loan Bank 2.250 08/26/2020 98,513Federal Home Loan Bank 3.000 09/28/2018 74,154Federal Home Loan Bank 3.125 03/27/2020 24,442Federal Home Loan Bank 2.750 03/13/2015 52,241Federal Home Loan Bank 3.500 03/21/2018 25,313Federal Home Loan Bank 2.000 05/26/2011 50,078Abbott Laboratories 5.125 04/01/2019 27,504American Express Bank 5.500 04/16/2013 53,490Auto Zone Inc. 4.000 11/15/2020 23,889Bank of America 4.750 05/15/2016 50,579Bank of New York Mellon 4.500 04/01/2013 26,562BB&T Corp. 3.950 04/29/2016 52,326Bellsouth Corp. 4.750 11/15/2012 26,281Caterpillar Financial Services 4.900 08/15/2013 26,923Citigroup 5.000 09/15/2014 26,199Dell Inc. 2.300 09/15/2015 50,202Express Scripts 3.125 05/15/2016 25,154Federated Home Loan Bank 4.125 12/13/2019 26,698General Electric Capital Corporation 5.625 05/01/2018 82,028Goldman Sachs Group Incorporated 5.150 01/15/2014 26,693
(Continued)
CITY OF MURFREESBORO, TENNESSEE
Schedule of Investments by Fund (continued)
June 30, 2011
Fair
- 128 -

Interest MaturityRate Date Value
Evergreen Cemetery Commission (continued) - JP Morgan & Chase & Company 5.125 % 09/15/2014 $ 27,015Kinder Morgan Energy Partners 3.500 03/01/2016 25,738Morgan Stanley 5.375 10/15/2015 32,070Oracle Corporation 5.250 01/15/2016 28,212Verizon Communications 5.550 02/15/2016 28,162Vanguard Total Stock Market Index N/A N/A 376,200Ishares Tr Msci EAFE Index N/A N/A 39,091Ishares Tr Msci Emerging Markets N/A N/A 4,760Federated Prime Obligation Fund N/A N/A 4,755Federated Prime Obligation Fund N/A N/A 37,895
$ 1,787,633Total Investments $ 104,833,883
CITY OF MURFREESBORO, TENNESSEE
Schedule of Investments by Fund (continued)
June 30, 2011
Fair
- 129 -

CITY OF MURFREESBORO, TENNESSEE
Schedule of Debt Service Requirements by Fiscal Year
June 30, 2011
Fiscal YearEnded Interest
June 30, Issue Rate Principal Interest
General Long-Term Debt -
2012 2009 General Obligation Refunding % $ 8,090,000 $ 2,275,500 $ 10,365,5002013 Bonds 7,955,000 1,871,000 9,826,0002014 7,800,000 1,473,250 9,273,2502015 3,680,000 1,083,250 4,763,2502016 3,855,000 899,250 4,754,2502017 4,030,000 706,500 4,736,5002018 4,215,000 505,000 4,720,0002019 4,045,000 294,250 4,339,2502020 1,840,000 92,000 1,932,000
$ 45,510,000 $ 9,200,000 $ 54,710,000
2012 Tennessee Municipal Bond Fund $ 2,434,310 $ 64,027 $ 2,498,3372013 Loan (1) 2,531,440 50,105 2,581,5452014 2,632,440 35,628 2,668,0682015 2,737,480 20,573 2,758,0532016 1,099,925 5,747 1,105,672
$ 11,435,595 $ 176,080 $ 11,611,675
2012 Tennessee Municipal Bond Fund $ 447,000 $ 6,624 $ 453,6242013 Loan (1) 462,000 4,069 466,0692014 290,420 1,517 291,937
$ 1,199,420 $ 12,210 $ 1,211,630
2012 Tennessee Municipal Bond Fund $ 4,606,000 $ 291,863 $ 4,897,8632013 Loan (1) 4,545,000 265,638 4,810,6382014 4,704,000 239,656 4,943,6562015 4,869,000 212,765 5,081,7652016 5,040,000 184,930 5,224,9302017 5,216,000 156,119 5,372,1192018 5,398,000 126,301 5,524,3012019 5,587,000 95,443 5,682,4432020 5,783,000 63,504 5,846,5042021 5,839,907 30,513 5,870,420
$ 51,587,907 $ 1,666,732 $ 53,254,639
2012 Tennessee Municipal Bond Fund $ 297,000 $ 20,168 $ 317,1682013 Loan (1) 309,000 18,469 327,4692014 321,000 16,702 337,7022015 334,000 14,867 348,8672016 347,000 12,957 359,9572017 361,000 10,972 371,9722018 375,000 8,908 383,9082019 391,000 6,763 397,7632020 406,000 4,527 410,5272021 422,000 2,205 424,205
$ 3,563,000 $ 116,538 $ 3,679,538
(Continued)
TotalPrincipal and
Interest
2.00-5.00
- 130 -

Fiscal YearEnded Interest
June 30, Issue Rate
General Long-Term Debt (continued) -
2012 Tennessee Municipal Bond Fund $ 3,808,000 $ 191,959 $ 3,999,9592013 Loan (2) 3,998,000 177,811 4,175,8112014 4,198,000 162,957 4,360,9572015 3,253,000 147,716 3,400,7162016 3,416,000 135,629 3,551,6292017 3,586,000 122,938 3,708,9382018 3,766,000 109,614 3,875,6142019 3,954,000 95,621 4,049,6212020 4,152,000 80,931 4,232,9312021 4,359,000 65,505 4,424,5052022 4,577,000 49,309 4,626,3092023 4,806,000 32,304 4,838,3042024 4,325,214 14,670 4,339,884
$ 52,198,214 $ 1,386,964 $ 53,585,178
2012 Tennessee Municipal Bond Fund 2.89 % $ 2,584,000 $ 1,338,301 $ 3,922,3012013 Loan 2,658,000 1,262,555 3,920,5552014 2,734,000 1,184,640 3,918,6402015 2,812,000 1,104,500 3,916,5002016 2,893,000 1,022,063 3,915,0632017 2,976,000 937,256 3,913,2562018 3,062,000 850,007 3,912,0072019 3,150,000 760,243 3,910,2432020 3,240,000 667,908 3,907,9082021 3,333,000 572,928 3,905,9282022 3,429,000 475,217 3,904,2172023 3,527,000 374,703 3,901,7032024 3,629,000 271,299 3,900,2992025 3,733,000 164,918 3,897,9182026 3,840,000 55,488 3,895,488
$ 47,600,000 $ 11,042,026 $ 58,642,026
2012 Capital Outlay Note 6.55 % $ 140,000 $ 74,889 $ 214,8892013 150,000 65,392 215,3922014 160,000 55,239 215,2392015 170,000 44,432 214,4322016 181,000 32,936 213,9362017 193,000 20,688 213,6882018 206,000 7,621 213,6212019 13,350 437 13,787
$ 1,213,350 $ 301,634 $ 1,514,984
2012 Capital Outlay Note 6.49 $ 97,000 $ 70,925 $ 167,9252013 104,000 64,401 168,4012014 110,000 57,454 167,4542015 118,000 50,054 168,0542016 125,000 42,165 167,1652017 133,000 33,791 166,7912018 142,000 24,864 166,8642019 151,000 15,353 166,3532020 161,000 5,226 166,226
$ 1,141,000 $ 364,233 $ 1,505,233Total General Long-Term Debt $ 215,448,486 $ 24,266,417 $ 239,714,903
(Continued)
Principal andInterestPrincipal Interest
Total
CITY OF MURFREESBORO, TENNESSEE
Schedule of Debt Service Requirements by Fiscal Year (continued)
June 30, 2011
- 131 -

Fiscal YearEnded Interest
June 30, Issue Rate
Murfreesboro Water and Sewer -
2012 Tennessee Municipal Bond Fund (3) $ 389,000 $ 164,493 $ 553,4932013 402,000 153,056 555,0562014 415,000 141,238 556,2382015 428,000 129,037 557,0372016 442,000 116,453 558,4532017 456,000 103,459 559,4592018 471,000 90,052 561,0522019 486,000 76,205 562,2052020 502,000 61,916 563,9162021 518,000 47,158 565,1582022 534,000 31,928 565,9282023 552,000 16,228 568,228
$ 5,595,000 $ 1,131,223 $ 6,726,223
2012 Tennessee Municipal Bond Fund (3) $ 1,575,000 $ 1,496,011 $ 3,071,0112013 1,646,000 1,425,136 3,071,1362014 1,720,000 1,351,066 3,071,0662015 1,798,000 1,273,666 3,071,6662016 1,879,000 1,192,756 3,071,7562017 1,963,000 1,108,201 3,071,2012018 2,051,000 1,019,866 3,070,8662019 2,144,000 927,571 3,071,5712020 2,240,000 831,091 3,071,0912021 2,341,000 730,291 3,071,2912022 2,446,000 624,946 3,070,9462023 2,556,000 514,876 3,070,8762024 2,671,000 399,857 3,070,8572025 2,792,000 279,662 3,071,6622026 2,917,000 154,023 3,071,0232027 505,691 22,757 528,448
$ 33,244,691 $ 13,351,776 $ 46,596,467
2012 State Revolving Loan 4.24 % $ 2,768,232 $ 1,377,120 $ 4,145,3522013 2,887,920 1,257,444 4,145,3642014 3,012,768 1,132,584 4,145,3522015 3,143,028 1,002,336 4,145,3642016 3,278,904 866,448 4,145,3522017 3,420,672 724,692 4,145,3642018 3,568,560 576,804 4,145,3642019 3,722,844 422,520 4,145,3642020 3,883,788 261,564 4,145,3522021 4,051,709 93,660 4,145,369
$ 33,738,425 $ 7,715,172 $ 41,453,597
2012 State Revolving Loan 4.28 % $ 51,564 $ 18,096 $ 69,6602013 53,808 15,840 69,6482014 56,160 13,488 69,6482015 58,608 11,040 69,6482016 61,164 8,484 69,6482017 63,840 5,808 69,6482018 66,624 3,024 69,6482019 34,390 432 34,822
$ 446,158 $ 76,212 $ 522,370
(Continued)
Total
InterestPrincipal InterestPrincipal and
CITY OF MURFREESBORO, TENNESSEE
Schedule of Debt Service Requirements by Fiscal Year (continued)
June 30, 2011
- 132 -
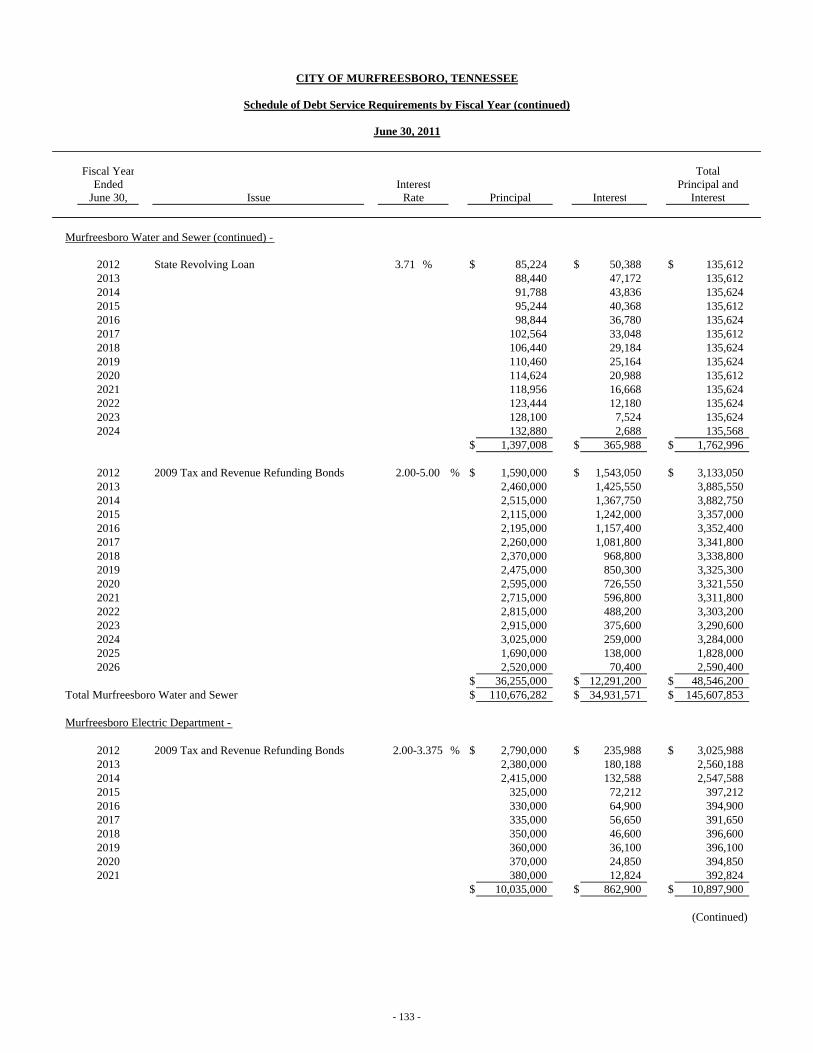
Fiscal YearEnded Interest
June 30, Issue Rate
Murfreesboro Water and Sewer (continued) -
2012 State Revolving Loan 3.71 % $ 85,224 $ 50,388 $ 135,6122013 88,440 47,172 135,6122014 91,788 43,836 135,6242015 95,244 40,368 135,6122016 98,844 36,780 135,6242017 102,564 33,048 135,6122018 106,440 29,184 135,6242019 110,460 25,164 135,6242020 114,624 20,988 135,6122021 118,956 16,668 135,6242022 123,444 12,180 135,6242023 128,100 7,524 135,6242024 132,880 2,688 135,568
$ 1,397,008 $ 365,988 $ 1,762,996
2012 2009 Tax and Revenue Refunding Bonds % $ 1,590,000 $ 1,543,050 $ 3,133,0502013 2,460,000 1,425,550 3,885,5502014 2,515,000 1,367,750 3,882,7502015 2,115,000 1,242,000 3,357,0002016 2,195,000 1,157,400 3,352,4002017 2,260,000 1,081,800 3,341,8002018 2,370,000 968,800 3,338,8002019 2,475,000 850,300 3,325,3002020 2,595,000 726,550 3,321,5502021 2,715,000 596,800 3,311,8002022 2,815,000 488,200 3,303,2002023 2,915,000 375,600 3,290,6002024 3,025,000 259,000 3,284,0002025 1,690,000 138,000 1,828,0002026 2,520,000 70,400 2,590,400
$ 36,255,000 $ 12,291,200 $ 48,546,200Total Murfreesboro Water and Sewer $ 110,676,282 $ 34,931,571 $ 145,607,853
Murfreesboro Electric Department -
2012 2009 Tax and Revenue Refunding Bonds % $ 2,790,000 $ 235,988 $ 3,025,9882013 2,380,000 180,188 2,560,1882014 2,415,000 132,588 2,547,5882015 325,000 72,212 397,2122016 330,000 64,900 394,9002017 335,000 56,650 391,6502018 350,000 46,600 396,6002019 360,000 36,100 396,1002020 370,000 24,850 394,8502021 380,000 12,824 392,824
$ 10,035,000 $ 862,900 $ 10,897,900
(Continued)
2.00-3.375
CITY OF MURFREESBORO, TENNESSEE
Schedule of Debt Service Requirements by Fiscal Year (continued)
June 30, 2011
2.00-5.00
TotalPrincipal and
Principal Interest Interest
- 133 -

Fiscal YearEnded Interest
June 30, Issue Rate
Murfreesboro Electric Department (continued)-
2012 Tennessee Municipal Bond Fund (4) $ 536,000 $ 213,475 $ 749,4752013 563,000 200,075 763,0752014 591,000 186,000 777,0002015 621,000 171,225 792,2252016 652,000 155,700 807,7002017 685,000 139,400 824,4002018 719,000 122,275 841,2752019 755,000 104,300 859,3002020 793,000 85,425 878,4252021 832,000 65,600 897,6002022 874,000 44,800 918,8002023 918,000 22,950 940,950
$ 8,539,000 $ 1,511,225 $ 10,050,225Total Murfreesboro Electric Department $ 18,574,000 $ 2,374,125 $ 20,948,125
Total Indebtedness $ 344,698,768 $ 61,572,113 $ 406,270,881
(1) Interest payments are subject to fluctuation since interest is accrued based on an adjustable rate. For purposes of this schedule, an interest rate of .57% was used which was the rate in effect at June 30, 2011.
(2) Interest payments are subject to fluctuation since interest is accrued based on an adjustable rate. For purposes of this schedule, an interest rate of .37% was used which was the rate in effect at June 30, 2011.
(3) Interest payments are subject to fluctuation since interest is accrued based on an adjustable rate. For purposes of this schedule, an interest rate of 5.00% was used.
(4) Interest payments are subject to fluctuation since interest is accrued based on an adjustable rate. For purposes of this schedule, an interest rate of 2.5% was used.
Schedule of Debt Service Requirements by Fiscal Year (continued)
CITY OF MURFREESBORO, TENNESSEE
June 30, 2011
TotalPrincipal and
Principal Interest Interest
- 134 -

Revenues -Federal funds $ 265State funds 6,069Charges for services 11,428Miscellaneous 30,827
$ 48,589
Expenditures -Labor $ 1,558,287Operations and maintenance 946,106Supplies 435,834Insurance 403,973Social Security taxes 112,312Group insurance 405,038Retirement 168,265Utilities 47,177Travel and subsistence 6,228Training personnel 75License fees 2,841Disposal carts 102,810Other miscellaneous 2,481
$ 4,191,427
Amount funded with general governmental revenues $ (4,142,838)
Balances at June 30, 2011 -Accounts receivable $ 3,081Due from other governments 191,091Accrued liabilities (21,075)
NOTE
Fund of the basic financial statements in accordance with GASB 54.
The above supplemental schedule has been presented to reflect solid waste activities and balances to demonstrate compliancewith Tennessee Code Annotated (TCA). The solid waste “fund” is operated and maintained separately by the City ofMurfreesboro in compliance with TCA. However, the activities and balances shown above have been reported in the General
(as required by Tennessee Code Annotated)
Year Ended June 30, 2011
CITY OF MURFREESBORO, TENNESSEE
Solid WasteSupplemental Schedule of Activities and Balances
- 135 -

Revenues -Interest $ 773County funds 155,000State funds 11,100Federal funds 26,194Revenue from other agencies 51,495Program income 175,069Donations received 8,207Miscellaneous 53
$ 427,891
Expenditures -Labor $ 406,708Operations and maintenance 26,532Supplies 84,621Senior trip expense 76,509Insurance 32,926Social Security taxes 29,783Group insurance 71,196Retirement 36,036Utilities 55,690Contractual services 2,400Travel and subsistance 834Training and instruction 21,009Designated contributions 7,430Other miscellaneous 4,706Capital outlay 4,624
$ 861,004
Excess of Revenues Over (Under) Expenditures $ (433,113)
Other Financing Sources - Transfers in 6,000
Amount funded with general governmental revenues $ (427,113)
NOTE :The above schedule has been presented to reflect the activities of the Senior Citizens Center as a supplement for the Summaryof Financial Activities of a Charitable Organization for the State of Tennessee Division of Charitable Solicitations and Gaming.The activities of the Senior Citizens Department have been reported in the General Fund.
Year Ended June 30, 2011
CITY OF MURFREESBORO, TENNESSEE
Senior Citizens
Supplemental Schedule of Activities
- 136 -

STATISTICAL SECTION (UNAUDITED)
This part of the City of Murfreesboro’s comprehensive annual financial report presents detailed information as a context for understanding what the information in the financial statements, note disclosures, and required supplementary information says about the government’s overall financial health. Contents Financial Trends
These schedules contain information to help the reader understand how the government’s financial performance and well-being have changed over time.
Revenue Capacity
These schedules contain information to help the reader assess the government’s most significant local revenue source, the property tax.
Debt Capacity
These schedules present information to help the reader assess the affordability of the government’s current levels of outstanding debt and the government’s ability to issue additional debt in the future.
Demographic and Economic Information
These schedules offer demographic and economic indicators to help the reader understand the environment within which the government’s financial activities take place.
Operating Information
These schedules contain service and infrastructure data to help the reader understand how the information in the government’s financial report relates to the services the government provides and the activities it performs.
Utility Services Information
Page
137
145
149
154
156
159 These schedules contain information regarding the utility services provided by the City including its rate structure.
Sources: Unless otherwise noted, the information in these schedules is derived from the comprehensive annual financial reports for the relevant year.

2002 2004 2005 2006 2007 2008
Governmental activities Invested in capital assets, net of related debt $ 64,817,590 $ 103,037,574 $ 130,951,307 $ 175,428,453 $ 380,452,965 ** $ 426,343,309 $ 441,657,459 $ 447,516,415 $ 469,146,233 $ 478,989,381 Restricted 17,716,528 22,481,893 25,137,765 24,322,534 27,177,051 24,216,623 25,620,279 28,342,279 27,475,344 17,316,349 Unrestricted 48,059,269 45,734,887 45,201,963 2,820,969 * 14,128,705 1,179,169 1,728,536 15,846,721 9,598,086 14,540,153
Total governmental activities net assets $ 130,593,387 $ 171,254,354 $ 201,291,035 $ 202,571,956 $ 421,758,721 $ 451,739,101 $ 469,006,274 $ 491,705,415 $ 506,219,663 $ 510,845,883
Business-type activities Invested in capital assets, net of related debt $ 180,697,510 $ 195,102,675 $ 215,897,440 $ 236,151,787 $ 253,510,019 $ 278,420,182 $ 305,980,547 $ 326,924,482 $ 342,586,135 $ 349,921,094 Restricted 20,345,827 14,906,523 11,293,939 12,339,799 20,608,993 23,549,545 27,152,115 23,665,932 24,480,313 25,118,563 Unrestricted 6,287,687 7,352,672 4,657,462 5,286,813 7,268,772 7,354,573 7,536,734 10,989,579 13,678,297 27,807,561
Total business-type activities net assets $ 207,331,024 $ 217,361,870 $ 231,848,841 $ 253,778,399 $ 281,387,784 $ 309,324,300 $ 340,669,396 $ 361,579,993 $ 380,744,745 $ 402,847,218
Primary Government Invested in capital assets, net of related debt $ 245,515,100 $ 298,140,249 $ 346,848,747 $ 411,580,240 $ 633,962,984 $ 704,763,491 $ 747,638,006 $ 774,440,897 $ 811,732,368 $ 828,910,475 Restricted 38,062,355 37,388,416 36,431,704 36,662,333 47,786,044 47,766,168 52,772,394 52,008,211 51,955,657 42,434,912 Unrestricted 54,346,956 53,087,559 49,859,425 8,107,782 21,397,477 8,533,742 9,265,270 26,836,300 23,276,383 42,347,714
Total primary government net assets $ 337,924,411 $ 388,616,224 $ 433,139,876 $ 456,350,355 $ 703,146,505 $ 761,063,401 $ 809,675,670 $ 853,285,408 $ 886,964,408 $ 913,693,101
* The large decrease in unrestricted net assets in 2005 is due to a prior period adjustment for property tax revenue in the amount of $33,281,708. ** The large increase in invested in capital assets, net of related debt for governmental activities is due to the retroactive reporting of infrastructure
in 2006.
2011
CITY OF MURFREESBORO, TENNESSEE
Net Assets by Component
Last Ten Fiscal Years(accrual basis of accounting)
201020092003
- 137 -
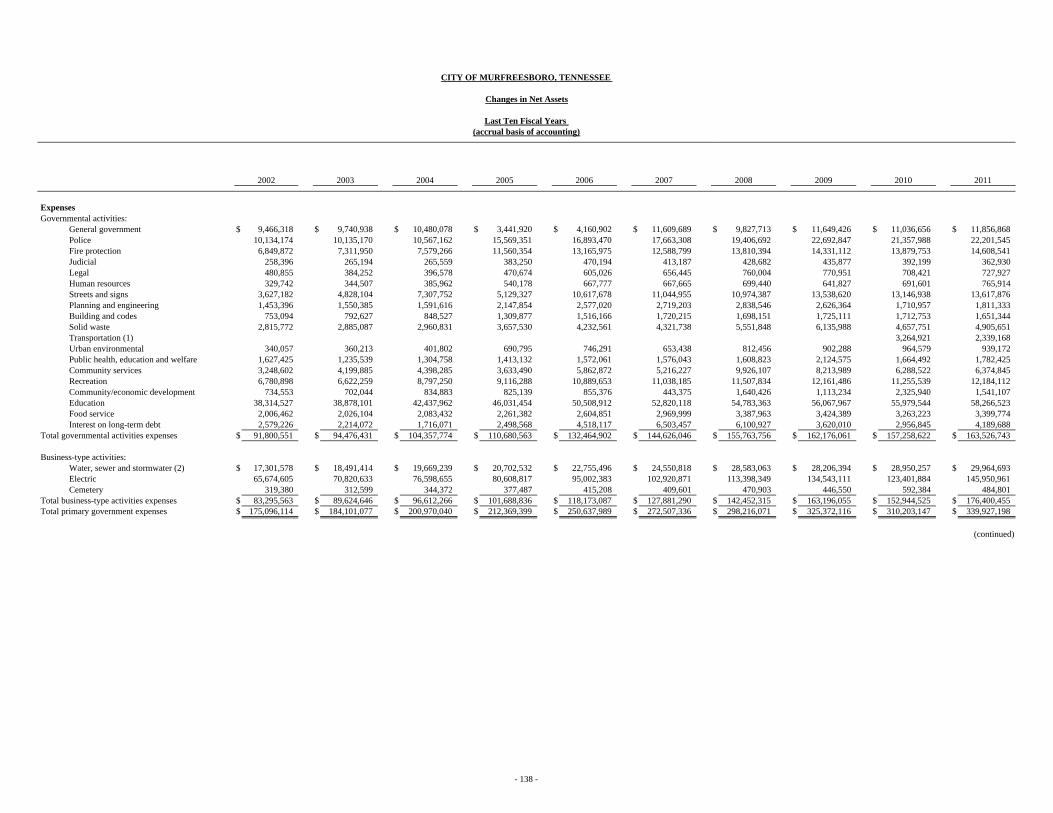
Expenses Governmental activities:
General government $ 9,466,318 $ 9,740,938 $ 10,480,078 $ 3,441,920 $ 4,160,902 $ 11,609,689 $ 9,827,713 $ 11,649,426 $ 11,036,656 $ 11,856,868Police 10,134,174 10,135,170 10,567,162 15,569,351 16,893,470 17,663,308 19,406,692 22,692,847 21,357,988 22,201,545Fire protection 6,849,872 7,311,950 7,579,266 11,560,354 13,165,975 12,588,799 13,810,394 14,331,112 13,879,753 14,608,541Judicial 258,396 265,194 265,559 383,250 470,194 413,187 428,682 435,877 392,199 362,930Legal 480,855 384,252 396,578 470,674 605,026 656,445 760,004 770,951 708,421 727,927Human resources 329,742 344,507 385,962 540,178 667,777 667,665 699,440 641,827 691,601 765,914Streets and signs 3,627,182 4,828,104 7,307,752 5,129,327 10,617,678 11,044,955 10,974,387 13,538,620 13,146,938 13,617,876Planning and engineering 1,453,396 1,550,385 1,591,616 2,147,854 2,577,020 2,719,203 2,838,546 2,626,364 1,710,957 1,811,333Building and codes 753,094 792,627 848,527 1,309,877 1,516,166 1,720,215 1,698,151 1,725,111 1,712,753 1,651,344Solid waste 2,815,772 2,885,087 2,960,831 3,657,530 4,232,561 4,321,738 5,551,848 6,135,988 4,657,751 4,905,651Transportation (1) 3,264,921 2,339,168Urban environmental 340,057 360,213 401,802 690,795 746,291 653,438 812,456 902,288 964,579 939,172Public health, education and welfare 1,627,425 1,235,539 1,304,758 1,413,132 1,572,061 1,576,043 1,608,823 2,124,575 1,664,492 1,782,425Community services 3,248,602 4,199,885 4,398,285 3,633,490 5,862,872 5,216,227 9,926,107 8,213,989 6,288,522 6,374,845Recreation 6,780,898 6,622,259 8,797,250 9,116,288 10,889,653 11,038,185 11,507,834 12,161,486 11,255,539 12,184,112Community/economic development 734,553 702,044 834,883 825,139 855,376 443,375 1,640,426 1,113,234 2,325,940 1,541,107Education 38,314,527 38,878,101 42,437,962 46,031,454 50,508,912 52,820,118 54,783,363 56,067,967 55,979,544 58,266,523Food service 2,006,462 2,026,104 2,083,432 2,261,382 2,604,851 2,969,999 3,387,963 3,424,389 3,263,223 3,399,774Interest on long-term debt 2,579,226 2,214,072 1,716,071 2,498,568 4,518,117 6,503,457 6,100,927 3,620,010 2,956,845 4,189,688
Total governmental activities expenses $ 91,800,551 $ 94,476,431 $ 104,357,774 $ 110,680,563 $ 132,464,902 $ 144,626,046 $ 155,763,756 $ 162,176,061 $ 157,258,622 $ 163,526,743
Business-type activities: Water, sewer and stormwater (2) $ 17,301,578 $ 18,491,414 $ 19,669,239 $ 20,702,532 $ 22,755,496 $ 24,550,818 $ 28,583,063 $ 28,206,394 $ 28,950,257 $ 29,964,693Electric 65,674,605 70,820,633 76,598,655 80,608,817 95,002,383 102,920,871 113,398,349 134,543,111 123,401,884 145,950,961Cemetery 319,380 312,599 344,372 377,487 415,208 409,601 470,903 446,550 592,384 484,801
Total business-type activities expenses $ 83,295,563 $ 89,624,646 $ 96,612,266 $ 101,688,836 $ 118,173,087 $ 127,881,290 $ 142,452,315 $ 163,196,055 $ 152,944,525 $ 176,400,455 Total primary government expenses $ 175,096,114 $ 184,101,077 $ 200,970,040 $ 212,369,399 $ 250,637,989 $ 272,507,336 $ 298,216,071 $ 325,372,116 $ 310,203,147 $ 339,927,198
(continued)
CITY OF MURFREESBORO, TENNESSEE
Changes in Net Assets
Last Ten Fiscal Years (accrual basis of accounting)
20042003 201020082006 2007 2009 20112002 2005
- 138 -

Program Revenues Governmental activities:
Charges for services: General government $ 157,521 $ 276,038 $ 219,347 $ 154,249 $ 203,514 $ 187,806 $ 227,562 $ 232,252 $ 238,822 $ 100,743Police 368,771 301,597 293,093 251,479 201,209 206,978 268,899 336,801 217,038 177,723Fire protection 239,617 373,627 366,113 372,120 385,833 389,146 430,312 621,785 767,033 795,622Judicial 1,983,892 1,786,322 1,746,298 1,594,058 1,659,996 1,640,284 2,793,451 4,829,049 2,167,575 1,615,803Streets and signs 9,607 14,382 25,666 12,726 20,508 42,776 18,525 43,846 38,813 39,724Planning and engineering 19,659 26,781 27,074 69,549 59,094 72,543 43,769 31,327 29,778 29,246Building and codes 1,666,083 1,914,342 2,680,715 2,920,015 3,342,738 3,513,589 2,318,682 2,699,656 1,817,128 1,348,831Solid waste 15,529 47,209 49,441 41,568 28,502 45,011 31,988 70,379 35,058 11,428Transportation (1) 86,498 101,016Urban environmental 4,635 733 3,939 3,335Community services 1,421,814 1,258,406 1,763,362 1,591,030 1,953,102 2,127,197 2,591,282 2,699,471 5,243,992 4,076,701Recreation 2,410,568 1,921,342 2,026,364 2,694,653 2,719,500 2,824,577 2,984,452 2,912,708 2,863,486 3,187,006Community/economic development 224 96,044 63,593 102,094 91,528 91,879 34,178 38,436 35,199 168,749Education 1,529,442 1,660,386 2,013,851 2,160,500 2,157,619 2,497,306 2,740,414 2,467,801 22,425 11,762Food service 1,047,967 1,073,184 1,118,259 1,156,877 1,225,607 1,342,876 1,240,116 1,271,818 1,209,432 1,147,656Interest on long-term debt 83,973 32,110 36,053 28,161 23,416 3,818 4,667 3,818
Operating grants and contributions 36,035,340 38,795,216 41,163,018 42,948,523 46,551,338 49,527,119 57,771,476 67,462,074 63,622,478 62,827,946Capital grants and contributions 17,491,210 19,385,562 14,642,477 22,108,525 17,774,729 30,178,990 17,451,108 15,863,275 9,795,709 4,603,937
Total governmental activities program revenues $ 64,481,217 $ 68,962,548 $ 68,234,724 $ 78,206,127 $ 78,398,233 $ 94,696,530 $ 90,951,614 $ 101,588,435 $ 88,193,799 $ 80,243,893
Business-type activities: Charges for services:
Water, sewer and stormwater (2) $ 17,011,842 $ 17,875,337 $ 18,501,861 $ 20,913,599 $ 23,164,912 $ 24,845,239 $ 27,857,208 $ 30,226,096 $ 31,867,204 $ 33,940,432Electric 67,698,553 72,951,488 80,121,947 83,693,947 99,549,498 110,253,090 124,542,827 144,887,286 133,956,469 160,004,748Cemetery 255,088 312,331 332,604 377,258 354,435 319,566 324,331 386,470 384,919 421,315
Operating grants and contributions 85,815 68,341 14,931 43,458 15,413 76,203 69,514 68,994 146,238 311,112Capital grants and contributions 7,856,270 7,726,149 11,866,450 18,274,459 21,864,924 18,831,734 19,826,819 8,119,244 8,042,948 5,533,215
Total business-type activities program revenues $ 92,907,568 $ 98,933,646 $ 110,837,793 $ 123,302,721 $ 144,949,182 $ 154,325,832 $ 172,620,699 $ 183,688,090 $ 174,397,778 $ 200,210,822 Total primary government program revenues $ 157,388,785 $ 167,896,194 $ 179,072,517 $ 201,508,848 $ 223,347,415 $ 249,022,362 $ 263,572,313 $ 285,276,525 $ 262,591,577 $ 280,454,715
Net (expense)/revenue Governmental activities $ (27,319,334) $ (25,513,883) $ (36,123,050) $ (32,474,436) $ (54,066,669) $ (49,929,516) $ (64,812,142) $ (60,587,626) $ (69,064,823) $ (83,282,850) Business-type activities 9,612,005 9,309,000 14,225,527 21,613,885 26,776,095 26,444,542 30,168,384 20,492,035 21,453,253 23,810,367 Total primary government net expense $ (17,707,329) $ (16,204,883) $ (21,897,523) $ (10,860,551) $ (27,290,574) $ (23,484,974) $ (34,643,758) $ (40,095,591) $ (47,611,570) $ (59,472,483)
(continued)
CITY OF MURFREESBORO, TENNESSEE
Changes in Net Assets (continued)
Last Ten Fiscal Years
2002 20112004 2009 20102008
(accrual basis of accounting)
2003 2005 2006 2007
- 139 -
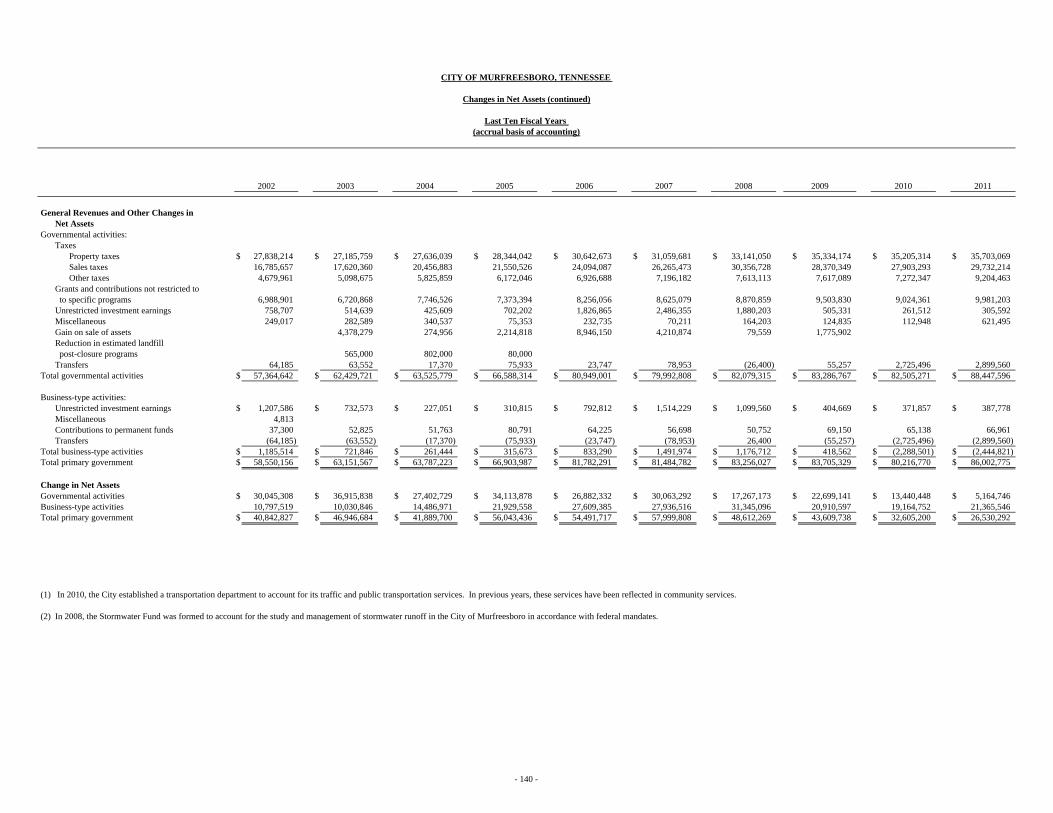
General Revenues and Other Changes in Net Assets
Governmental activities: Taxes
Property taxes $ 27,838,214 $ 27,185,759 $ 27,636,039 $ 28,344,042 $ 30,642,673 $ 31,059,681 $ 33,141,050 $ 35,334,174 $ 35,205,314 $ 35,703,069Sales taxes 16,785,657 17,620,360 20,456,883 21,550,526 24,094,087 26,265,473 30,356,728 28,370,349 27,903,293 29,732,214Other taxes 4,679,961 5,098,675 5,825,859 6,172,046 6,926,688 7,196,182 7,613,113 7,617,089 7,272,347 9,204,463
Grants and contributions not restricted to to specific programs 6,988,901 6,720,868 7,746,526 7,373,394 8,256,056 8,625,079 8,870,859 9,503,830 9,024,361 9,981,203Unrestricted investment earnings 758,707 514,639 425,609 702,202 1,826,865 2,486,355 1,880,203 505,331 261,512 305,592Miscellaneous 249,017 282,589 340,537 75,353 232,735 70,211 164,203 124,835 112,948 621,495Gain on sale of assets 4,378,279 274,956 2,214,818 8,946,150 4,210,874 79,559 1,775,902Reduction in estimated landfill post-closure programs 565,000 802,000 80,000Transfers 64,185 63,552 17,370 75,933 23,747 78,953 (26,400) 55,257 2,725,496 2,899,560
Total governmental activities $ 57,364,642 $ 62,429,721 $ 63,525,779 $ 66,588,314 $ 80,949,001 $ 79,992,808 $ 82,079,315 $ 83,286,767 $ 82,505,271 $ 88,447,596
Business-type activities: Unrestricted investment earnings $ 1,207,586 $ 732,573 $ 227,051 $ 310,815 $ 792,812 $ 1,514,229 $ 1,099,560 $ 404,669 $ 371,857 $ 387,778Miscellaneous 4,813Contributions to permanent funds 37,300 52,825 51,763 80,791 64,225 56,698 50,752 69,150 65,138 66,961Transfers (64,185) (63,552) (17,370) (75,933) (23,747) (78,953) 26,400 (55,257) (2,725,496) (2,899,560)
Total business-type activities $ 1,185,514 $ 721,846 $ 261,444 $ 315,673 $ 833,290 $ 1,491,974 $ 1,176,712 $ 418,562 $ (2,288,501) $ (2,444,821)Total primary government $ 58,550,156 $ 63,151,567 $ 63,787,223 $ 66,903,987 $ 81,782,291 $ 81,484,782 $ 83,256,027 $ 83,705,329 $ 80,216,770 $ 86,002,775
Change in Net Assets Governmental activities $ 30,045,308 $ 36,915,838 $ 27,402,729 $ 34,113,878 $ 26,882,332 $ 30,063,292 $ 17,267,173 $ 22,699,141 $ 13,440,448 $ 5,164,746Business-type activities 10,797,519 10,030,846 14,486,971 21,929,558 27,609,385 27,936,516 31,345,096 20,910,597 19,164,752 21,365,546Total primary government $ 40,842,827 $ 46,946,684 $ 41,889,700 $ 56,043,436 $ 54,491,717 $ 57,999,808 $ 48,612,269 $ 43,609,738 $ 32,605,200 $ 26,530,292
(1) In 2010, the City established a transportation department to account for its traffic and public transportation services. In previous years, these services have been reflected in community services.
(2) In 2008, the Stormwater Fund was formed to account for the study and management of stormwater runoff in the City of Murfreesboro in accordance with federal mandates.
2011
CITY OF MURFREESBORO, TENNESSEE
2002
Changes in Net Assets (continued)
Last Ten Fiscal Years (accrual basis of accounting)
20102004 2009200820072003 2005 2006
- 140 -
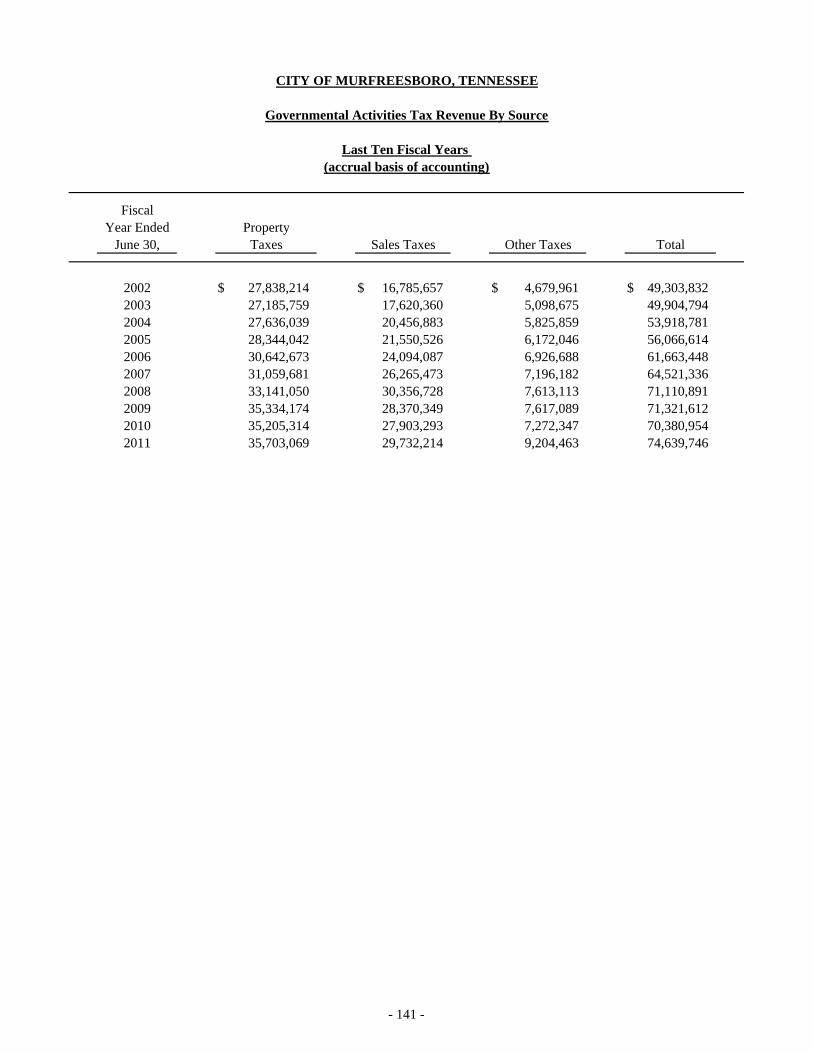
CITY OF MURFREESBORO, TENNESSEE
Governmental Activities Tax Revenue By Source
Last Ten Fiscal Years (accrual basis of accounting)
FiscalYear Ended
June 30,
2002 $ 27,838,214 $ 16,785,657 $ 4,679,961 $ 49,303,8322003 27,185,759 17,620,360 5,098,675 49,904,7942004 27,636,039 20,456,883 5,825,859 53,918,7812005 28,344,042 21,550,526 6,172,046 56,066,6142006 30,642,673 24,094,087 6,926,688 61,663,4482007 31,059,681 26,265,473 7,196,182 64,521,3362008 33,141,050 30,356,728 7,613,113 71,110,8912009 35,334,174 28,370,349 7,617,089 71,321,6122010 35,205,314 27,903,293 7,272,347 70,380,9542011 35,703,069 29,732,214 9,204,463 74,639,746
PropertySales Taxes Other Taxes TotalTaxes
- 141 -

CITY OF MURFREESBORO, TENNESSEE
Fund Balances of Governmental Funds
Last Ten Fiscal Years
General fund Reserved $ 86,277 $ 104,570 $ 141,536 $ 264,004 $ 2,866,482 $ 2,251,222 $ 1,089,753 $ 540,669 $ 486,661 Unreserved 22,685,686 22,086,973 27,379,072 30,912,311 32,596,314 28,461,940 33,424,938 38,052,920 39,408,819 Nonspendable $ 280,823 Restricted 545,005 Committed Assigned 5,395,693 Unassigned 42,230,413
Total general fund $ 22,771,963 $ 22,191,543 $ 27,520,608 $ 31,176,315 $ 35,462,796 $ 30,713,162 $ 34,514,691 $ 38,593,589 $ 39,895,480 $ 48,451,934
All other governmental funds Reserved $ 2,711,084 $ 2,643,769 $ 3,145,398 $ 2,901,392 $ 1,940,854 $ 2,355,315 $ 1,762,700 $ 1,905,955 $ 2,213,917 Unreserved, reported in:
Special revenue funds 7,764,893 8,914,132 10,108,544 10,797,880 8,696,080 7,911,903 10,835,989 13,122,871 16,326,009 Debt service fund 3,048,805 3,101,068 2,538,936 2,573,675 3,604,560 3,805,487 3,893,462 4,245,654 4,790,767 Capital projects funds 3,666,483 3,043,521 (5,469,262) (15,072,098) (165,292) (7,590,144) (3,758,551) 6,278,857 (7,086,468) Permanent funds 137,692 148,419 114,026 109,169 68,691 90,946 13,795 18,660 102,466
Nonspendable $ 1,825,529 Restricted 29,286,886 Committed 9,144,022 Assigned 5,028,232 Unassigned (2,327,903)
Total all other governmental funds $ 17,328,957 $ 17,850,909 $ 10,437,642 $ 1,310,018 $ 14,144,893 $ 6,573,507 $ 12,747,395 $ 25,571,997 $ 16,346,691 $ 42,956,766
Note: The City implemented GASB 54 in fiscal year 2011.
2009 2010 2011
(modified accrual basis of accounting)
2002 2003 2004 2005 2006 2007 2008
- 142 -

Revenues - Taxes $ 45,440,633 $ 47,724,128 $ 53,270,607 $ 55,756,343 $ 60,863,834 $ 64,556,511 $ 70,890,458 $ 71,160,024 $ 70,292,556 $ 72,505,644 Intergovernmental 43,131,242 44,206,914 48,507,093 55,825,684 58,780,055 58,715,084 71,729,397 82,202,742 75,896,666 74,954,915 Charges for services 5,554,663 5,397,770 5,907,855 6,842,495 6,966,806 7,587,841 8,134,453 8,081,553 8,243,478 9,430,596 Donations 483,125 477,339 1,941,617 128,331 Interest and investment earnings 809,012 587,604 446,717 741,017 1,710,245 2,380,139 1,775,554 558,217 439,174 504,249 Licenses and permits 3,697,069 3,887,346 4,599,889 4,631,835 5,155,404 5,289,916 5,280,673 5,634,636 4,407,336 3,430,795 Miscellaneous 7,630,870 4,072,410 7,836,385 6,099,685 6,131,933 4,969,123 6,346,050 5,628,082 4,636,379 6,027,165
$ 106,263,489 $ 105,876,172 $ 120,568,546 $ 129,897,059 $ 139,608,277 $ 143,498,614 $ 164,639,710 $ 173,742,593 $ 165,857,206 $ 166,981,695
Expenditures - General government $ 9,168,864 $ 10,101,354 $ 10,492,519 $ 3,021,553 * $ 3,332,008 $ 11,414,689 $ 4,595,923 $ 6,847,627 $ 5,547,009 $ 5,872,815 Police 9,200,399 9,539,903 9,700,595 15,596,243 15,568,305 17,755,914 18,412,254 21,026,722 20,553,607 22,096,832 Fire protection 6,544,473 6,983,588 7,260,949 11,236,417 11,953,554 12,604,596 13,403,457 13,831,170 13,316,531 14,023,025 Judicial 240,725 253,961 265,283 377,283 424,378 412,307 477,728 452,758 351,734 365,072 Legal 482,339 381,265 392,291 477,862 594,253 649,162 754,962 760,019 681,668 750,236 Human resources 316,453 350,039 377,661 527,178 574,204 643,941 711,621 732,321 646,870 858,324 Streets and signs 3,315,588 4,052,180 5,189,850 4,170,663 6,443,037 6,168,437 6,216,345 6,060,873 6,838,460 7,102,496 Planning and engineering 1,397,471 1,522,269 1,589,272 2,133,009 2,575,185 2,712,370 2,795,308 2,657,470 1,705,063 1,735,966 Building and codes 750,636 789,533 856,370 1,290,743 1,513,775 1,705,737 1,740,183 1,717,686 1,700,106 1,666,961Solid waste 2,516,470 2,773,945 2,688,687 3,324,471 3,743,192 3,832,817 4,448,056 4,474,894 4,289,255 4,191,427 Transportation ** 3,135,125 3,271,637 Urban environmental 311,391 337,918 398,062 666,182 771,954 645,641 780,410 868,624 909,214 926,237 Public health, education and welfare 996,071 1,062,603 1,179,909 1,308,056 1,469,631 1,473,700 1,506,480 1,532,308 1,528,240 1,502,385 Community services 3,044,017 3,950,816 4,302,808 3,339,475 5,230,313 4,701,071 9,346,329 7,498,113 5,799,104 6,088,043 Recreation 5,907,853 5,902,100 6,684,636 7,601,274 8,138,001 8,691,484 9,152,060 9,277,740 8,399,731 9,442,486 Community development 732,989 700,350 852,389 866,010 885,812 441,826 817,301 872,671 2,322,141 1,538,719 Economic development 821,688 255,587 Education 36,782,935 37,854,844 40,827,158 44,139,617 49,680,734 51,587,295 51,009,243 52,770,358 53,552,719 57,304,421 Food service 2,006,462 2,026,104 2,083,432 2,261,382 2,604,851 2,969,999 3,387,963 3,424,389 3,263,223 3,399,774 Capital outlay 22,807,323 21,495,444 30,714,965 53,632,139 38,176,379 57,442,265 40,274,705 32,996,360 24,945,791 19,660,427 Debt service
Principal 11,460,767 16,402,262 20,167,365 12,555,106 14,316,952 15,066,722 20,842,164 21,118,405 21,671,925 20,699,775 Interest 2,454,062 2,092,591 1,607,220 2,384,025 4,361,936 6,265,007 5,847,716 3,345,873 3,159,943 4,243,000 Debt issuance cost 125,164 121,481 163,453 106,543 128,064 178,981 603,242 194,668 625,583 413,689
Total expenditures $ 120,562,452 $ 128,694,550 $ 147,794,874 $ 171,015,231 $ 172,486,518 $ 207,363,961 $ 197,945,138 $ 192,716,636 $ 184,943,042 $ 187,153,747
Excess of revenues over (under) expenditures $ (14,298,963) $ (22,818,378) $ (27,226,328) $ (41,118,172) $ (32,878,241) $ (63,865,347) $ (33,305,428) $ (18,974,043) $ (19,085,836) $ (20,172,052)
(continued)
CITY OF MURFREESBORO, TENNESSEE
Changes in Fund Balances of Governmental Funds
Last Ten Fiscal Years
200520042003 2009200820072006
(modified accrual basis of accounting)
2002 20112010
- 143 -
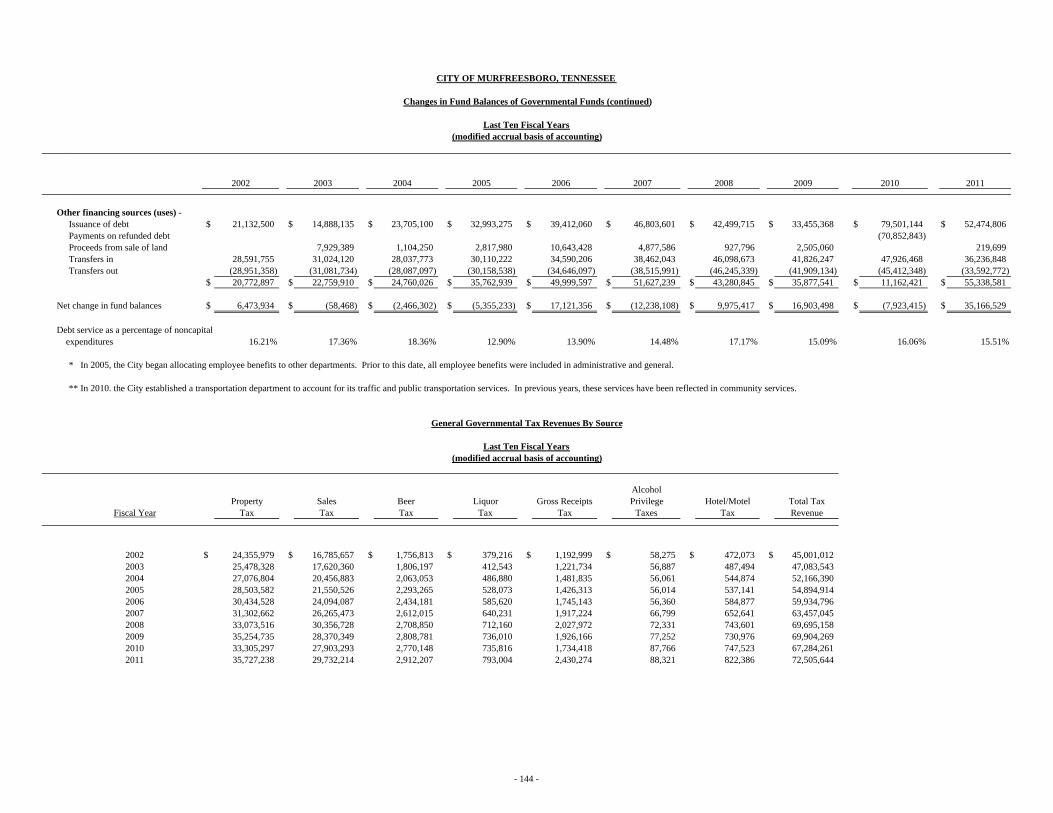
Other financing sources (uses) - Issuance of debt $ 21,132,500 $ 14,888,135 $ 23,705,100 $ 32,993,275 $ 39,412,060 $ 46,803,601 $ 42,499,715 $ 33,455,368 $ 79,501,144 $ 52,474,806 Payments on refunded debt (70,852,843) Proceeds from sale of land 7,929,389 1,104,250 2,817,980 10,643,428 4,877,586 927,796 2,505,060 219,699 Transfers in 28,591,755 31,024,120 28,037,773 30,110,222 34,590,206 38,462,043 46,098,673 41,826,247 47,926,468 36,236,848 Transfers out (28,951,358) (31,081,734) (28,087,097) (30,158,538) (34,646,097) (38,515,991) (46,245,339) (41,909,134) (45,412,348) (33,592,772)
$ 20,772,897 $ 22,759,910 $ 24,760,026 $ 35,762,939 $ 49,999,597 $ 51,627,239 $ 43,280,845 $ 35,877,541 $ 11,162,421 $ 55,338,581
Net change in fund balances $ 6,473,934 $ (58,468) $ (2,466,302) $ (5,355,233) $ 17,121,356 $ (12,238,108) $ 9,975,417 $ 16,903,498 $ (7,923,415) $ 35,166,529
Debt service as a percentage of noncapital expenditures 16.21% 17.36% 18.36% 12.90% 13.90% 14.48% 17.17% 15.09% 16.06% 15.51%
* In 2005, the City began allocating employee benefits to other departments. Prior to this date, all employee benefits were included in administrative and general.
** In 2010. the City established a transportation department to account for its traffic and public transportation services. In previous years, these services have been reflected in community services.
AlcoholProperty Sales Beer Liquor Gross Receipts Privilege Hotel/Motel Total Tax
Fiscal Year Tax Tax Tax Tax Tax Taxes Tax Revenue
2002 $ 24,355,979 $ 16,785,657 $ 1,756,813 $ 379,216 $ 1,192,999 $ 58,275 $ 472,073 $ 45,001,012 2003 25,478,328 17,620,360 1,806,197 412,543 1,221,734 56,887 487,494 47,083,543 2004 27,076,804 20,456,883 2,063,053 486,880 1,481,835 56,061 544,874 52,166,390 2005 28,503,582 21,550,526 2,293,265 528,073 1,426,313 56,014 537,141 54,894,914 2006 30,434,528 24,094,087 2,434,181 585,620 1,745,143 56,360 584,877 59,934,796 2007 31,302,662 26,265,473 2,612,015 640,231 1,917,224 66,799 652,641 63,457,045 2008 33,073,516 30,356,728 2,708,850 712,160 2,027,972 72,331 743,601 69,695,158 2009 35,254,735 28,370,349 2,808,781 736,010 1,926,166 77,252 730,976 69,904,269 2010 33,305,297 27,903,293 2,770,148 735,816 1,734,418 87,766 747,523 67,284,261 2011 35,727,238 29,732,214 2,912,207 793,004 2,430,274 88,321 822,386 72,505,644
CITY OF MURFREESBORO, TENNESSEE
Last Ten Fiscal Years
2006 2007 2008 20092003 2004
(modified accrual basis of accounting)
2010 2011
General Governmental Tax Revenues By Source
(modified accrual basis of accounting)
2002 2005
Changes in Fund Balances of Governmental Funds (continued)
Last Ten Fiscal Years
- 144 -

CITY OF MURFREESBORO, TENNESSEE
Assessed Value and Estimated Actual Value of Taxable Property
Last Ten Fiscal Years
Ratio ofYear Assessed Value
Ended Tax Public to EstimatedJune 30, Rate (1) Property Utilities Actual Value
2002 $ 1.900 $ 1,137,883,832 $ 34,117,576 $ 1,172,001,408 $ 3,804,249,039 30.8%2003 1.720 1,322,192,474 40,258,926 1,362,451,400 4,385,931,670 31.1%2004 1.720 1,386,515,720 37,606,092 1,424,121,812 4,577,797,298 31.1%2005 1.720 1,466,352,090 38,743,254 1,505,095,344 4,889,014,858 30.8%2006 1.720 1,562,310,570 41,092,628 1,603,403,198 5,241,331,422 30.6%2007 1.407 1,951,335,404 46,340,126 1,997,675,530 6,561,383,347 30.4%2008 1.407 2,103,646,717 51,677,754 2,155,324,471 7,525,143,602 28.6%2009 1.407 2,245,292,941 51,277,914 2,296,570,855 8,035,107,314 28.6%2010 1.407 2,372,884,999 52,823,715 2,425,708,714 8,520,678,432 28.5%2011 1.270 2,675,851,829 56,821,961 2,732,673,790 9,371,255,513 29.2%
(1) Per $100 of assessed value.Source: City of Murfreesboro Tax Department
Total
Assessed Valuation
EstimatedActual Value
Total
- 145 -

Tax Rate Per $100 Assessed Value Tax Levies
FiscalYear Ended
June 30, County Total City County Total
2002 $ 1.900 $ 0.590 $ 0.030 $ 1.440 $ 0.720 $ 2.780 $ 4.680 $ 22,268,457 $ 32,581,639 $ 54,850,0962003 1.720 0.530 0.030 1.300 0.650 2.510 4.230 23,434,512 34,197,530 57,632,0422004 1.720 0.625 0.030 $ 0.015 1.460 0.670 2.800 4.520 24,495,265 39,875,411 64,370,6762005 1.720 0.595 0.030 0.015 1.440 0.720 2.800 4.520 25,888,134 42,142,670 68,030,8042006 1.720 0.595 0.030 0.015 1.440 0.720 2.800 4.520 27,579,046 44,895,290 72,474,3362007 1.407 0.470 0.010 1.290 0.670 2.440 3.847 28,107,445 48,743,283 76,850,7282008 1.407 0.500 0.010 1.190 $ 0.050 0.690 2.440 3.847 30,325,680 52,589,917 82,915,5972009 1.407 0.530 0.010 1.230 0.050 0.740 2.560 3.967 32,313,095 58,792,214 91,105,3092010 1.407 0.572 $ 0.098 0.010 1.265 0.050 0.740 2.735 4.142 34,129,964 66,343,133 100,473,0972011 1.270 0.554 0.088 0.009 1.143 0.045 0.626 2.465 3.735 34,709,599 67,365,874 102,075,473
Source: City of Murfreesboro Tax Department
Property Tax Rates and Levies - Direct and Overlapping Governments
CITY OF MURFREESBORO, TENNESSEE
Last Ten Fiscal Years
City General Ambulance RoadsHighway/
EducationTotal
CountyEducation
Capital projectsGeneral
Debt ServiceSolid Waste
- 146 -

2010 2001 % of TotalAssessed Assessed Assessed
Taxpayer Valuation Rank Valuation Rank Valuation
General Mills / Pillsbury Company $ 52,816,041 1 1.93 % $ 24,426,888 1 2.08 %CF Murfreesboro Associates 31,243,835 2 1.14 Embassy Suites 28,982,581 3 1.06
Transwestern Stones River 23,371,640 4 0.86 Gatton C. M. Trustee 19,650,550 5 0.72 Mahle Filter Systems/Tennex Industries 18,488,432 6 0.68 8,610,715 4 0.73 Pointe at Raiders Campus 17,695,592 7 0.65 Middle TN Electric Membership 16,382,567 8 0.60 Adams Place LLC 14,134,900 9 0.52 State Farm Insurance Company 13,340,588 10 0.49 11,471,770 3 0.98 Bellsouth Tellecommunications 13,267,681 2 1.13 Buford C. Throneberry 8,286,630 5 0.71 Stones River Real Estate 8,190,240 6 0.70 Boston Capital University 7,002,680 7 0.60 Atmos Energy Corporation 5,966,586 8 0.51 Chelsea Place Limited Partnership 5,966,480 9 0.51 ORS Real Estate Limited Partnership 5,798,800 10 0.49
$ 236,106,726 8.65 % $ 98,988,470 8.44 %
Source: City of Murfreesboro tax department.
ValuationAssessed
% of Total
CITY OF MURFREESBORO, TENNESSEE
Principal Taxpayers
June 30, 2011
- 147 -

TotalFiscal Total Percent Collections in Collections
Year Ended Tax the Fiscal Year of Levy Subsequent Collections as Percent ofJune 30, Levy of the Levy Collected Years To Date Current Levy
2002 $ 22,268,457 $ 21,462,617 96.38 % $ 774,374 $ 22,236,991 99.86 %2003 23,434,512 22,591,740 96.40 818,667 23,410,407 99.902004 24,495,262 23,783,417 97.09 684,696 24,468,113 99.892005 25,888,134 25,199,793 97.34 652,798 25,852,591 99.862006 27,579,046 26,659,470 96.67 882,679 27,542,149 99.872007 28,107,445 27,444,825 97.64 614,009 28,058,834 99.832008 30,325,680 29,565,591 97.49 684,246 30,249,837 99.752009 32,313,095 31,353,518 97.03 863,147 32,216,665 99.702010 34,129,964 32,987,635 96.65 686,521 33,674,156 98.662011 34,709,599 33,626,350 96.88 33,626,350 96.88
Source: City of Murfreesboro Tax Department
Total Collected within
CITY OF MURFREESBORO, TENNESSEE
Property Tax Levies and Collections
Last Ten Fiscal Years
- 148 -

Fiscal PercentageYear Ended Capital of Personal
June 30, Leases Income (1)
2002 $ 16,770,000 $ 73,085,532 $ 1,585,000 $ 36,002 $ 4,281,741 $ 7,500,000 $ 54,475,283 $ 157,733,558 7.89 % $ 2,075 2003 12,670,000 75,671,405 1,340,000 36,002 9,629,310 6,725,000 53,583,628 159,655,345 7.97 2,126 2004 8,930,000 82,926,540 1,095,000 36,000 19,310,256 5,915,000 53,647,160 171,859,956 7.44 2,046 2005 5,900,000 106,394,710 805,000 36,000 32,719,429 5,065,000 51,417,220 202,337,359 8.68 2,486 2006 3,845,000 133,544,818 $ 921,969 500,000 36,000 50,076,719 4,180,000 49,072,989 242,177,495 9.39 2,790 2007 2,585,000 164,641,697 $ 1,900,000 473,400 335,000 36,000 69,035,189 3,255,000 46,717,955 288,979,241 10.27 3,122 2008 1,305,000 186,288,248 3,191,000 165,000 36,000 94,056,075 2,675,000 44,157,910 331,874,233 10.54 3,300 2009 200,127,211 2,994,000 36,000 96,728,807 2,060,000 41,846,566 343,792,584 10.69 3,379 2010 54,851,875 126,243,230 2,578,350 363,125 36,000 42,903,203 51,270,000 39,330,084 317,575,867 9.61 2,920 2011 45,510,000 167,584,136 2,354,350 403,894 36,000 47,378,691 46,290,000 36,411,432 345,968,503 10.02 3,145
Note: Details regarding the City's outstanding debt can be found in the notes to the financial statements. (1) See the Schedule of Demographic and Economic Statistics on page 154 for personal income and population data.
BondsMatured
LoansTML
CITY OF MURFREESBORO, TENNESSEE
Ratios of Outstanding Debt by Type
Last Ten Fiscal Years
TotalGovernmental Activities Business-Type Activities
Capital
BondsObligation
Bonds
General
Loans
GeneralTML ObligationOutlay
NotesPer
Capita (1)RevenueBonds Other Loans
PrimaryGovernment
State and
- 149 -

CITY OF MURFREESBORO, TENNESSEE
Ratios of General Bonded Debt Outstanding
Fiscal General NetYear Ended Bonded Bonded Debt
June 30, Debt Per Capita
2002 76,012 $ 3,804,249,039 $ 89,855,532 2.36 % 1,182.122003 75,083 4,385,931,670 88,341,405 2.01 1,176.582004 84,000 4,577,797,298 91,856,540 2.01 1,093.532005 81,393 4,889,014,858 112,294,710 2.30 1,379.662006 86,793 5,241,331,422 137,389,818 2.62 1,582.962007 92,559 6,561,383,347 167,226,697 2.55 1,806.702008 100,575 7,525,143,602 187,593,248 2.49 1,865.212009 101,753 8,035,107,314 200,127,211 2.49 1,966.792010 108,755 8,520,678,432 181,095,105 2.13 1,665.172011 110,000 9,371,255,513 213,094,136 2.27 1,937.22
Note: (1) Special Census conducted 2003, 2005, and 2008 and federal census conducted 2010, others are estimated.
Last Ten Fiscal Years
Percentage of
Population (1)Actual ValueEstimatedEstimatedEstimated Total
of PropertyActual Value
- 150 -

CITY OF MURFREESBORO, TENNESSEE
Direct and Overlapping Governmental Activities Debt
June 30, 2011
Estimated Direct and Debt Percentage Overlapping
Taxing Jurisdiction Outstanding (1) Applicable (5) Debt
City of Murfreesboro direct debt $ 215,852,380Rutherford County (2) $ 354,180,000 41.89% 148,366,002
Total direct and overlapping debt $ 364,218,382
Ratio of direct and estimated overlapping debt to 2010 assessed valuation (3) 13.33%
Per capita direct and estimated overlapping debt (4) $ 3,311
(1) As of June 30, 2011. (2) Source: Rutherford County Comprehensive Annual Financial Report, June 30, 2011, Table 12. (3) Based upon 2010 Taxable Assessed Valuation of $2,732,673,790 (4) Based upon estimated population of 110,000 (5) The percentage of overlapping debt applicable is estimated using the city's population as a percentage of the county's population.
- 151 -
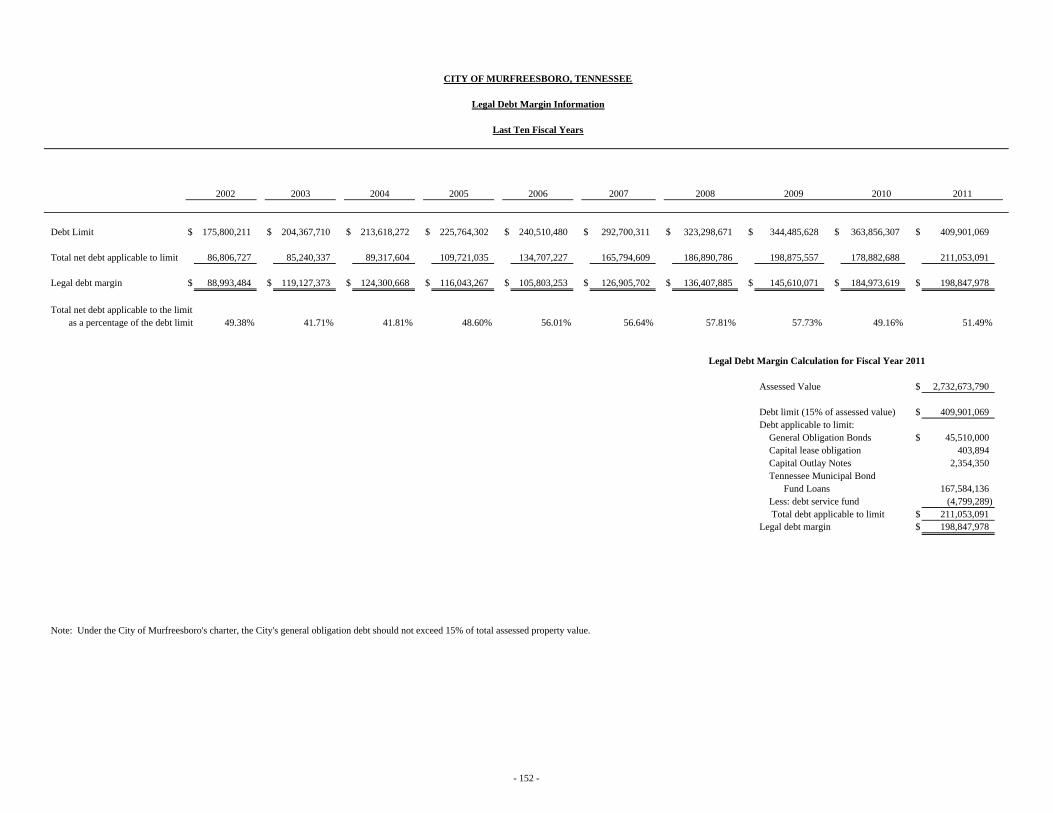
CITY OF MURFREESBORO, TENNESSEE
Legal Debt Margin Information
Last Ten Fiscal Years
2002 2003 2004 2005 2006 2007 2008 2009 2010 2011
Debt Limit $ 175,800,211 $ 204,367,710 $ 213,618,272 $ 225,764,302 $ 240,510,480 $ 292,700,311 $ 323,298,671 $ 344,485,628 $ 363,856,307 $ 409,901,069
Total net debt applicable to limit 86,806,727 85,240,337 89,317,604 109,721,035 134,707,227 165,794,609 186,890,786 198,875,557 178,882,688 211,053,091
Legal debt margin $ 88,993,484 $ 119,127,373 $ 124,300,668 $ 116,043,267 $ 105,803,253 $ 126,905,702 $ 136,407,885 $ 145,610,071 $ 184,973,619 $ 198,847,978
Total net debt applicable to the limitas a percentage of the debt limit 49.38% 41.71% 41.81% 48.60% 56.01% 56.64% 57.81% 57.73% 49.16% 51.49%
Legal Debt Margin Calculation for Fiscal Year 2011
Assessed Value $ 2,732,673,790
Debt limit (15% of assessed value) $ 409,901,069 Debt applicable to limit: General Obligation Bonds $ 45,510,000 Capital lease obligation 403,894 Capital Outlay Notes 2,354,350 Tennessee Municipal Bond Fund Loans 167,584,136 Less: debt service fund (4,799,289) Total debt applicable to limit $ 211,053,091 Legal debt margin $ 198,847,978
Note: Under the City of Murfreesboro's charter, the City's general obligation debt should not exceed 15% of total assessed property value.
- 152 -

Fiscal Net Net RevenuesYear Ended Gross Operating Available for Times
June 30, Revenues (1) Expenses (2) Debt Service Principal Interest Coverage
Water and Sewer - 2002 $ 17,934,536 $ 9,899,664 $ 8,034,872 $ 235,000 $ 98,785 24.072003 18,421,275 10,901,787 7,519,488 245,000 85,061 22.782004 18,619,918 11,743,101 6,876,817 260,000 70,370 20.822005 21,220,250 12,219,404 9,000,846 290,000 30,556 28.082006 23,969,200 13,430,712 10,538,488 305,000 17,816 32.652007 26,101,023 14,550,503 11,550,520 165,000 9,600 66.152008 27,290,810 16,045,581 11,245,229 170,000 6,038 63.882009 27,999,011 16,901,018 11,097,9932010 29,554,367 16,311,214 13,243,153 2,365,000 1,027,156 3.902011 31,790,418 17,342,539 14,447,879 2,240,000 1,655,050 3.71
The Water and Sewer Department did not have any revenue bonds outstanding at June 30, 2009.
Electric Department - 2002 $ 67,984,679 $ 62,924,428 $ 5,060,251 $ 745,000 $ 398,371 4.432003 73,136,230 67,912,598 5,223,632 775,000 363,770 4.592004 80,229,784 73,500,606 6,729,178 810,000 327,770 5.912005 83,838,324 76,804,735 7,033,589 850,000 289,760 6.172006 99,782,994 90,957,776 8,825,218 885,000 249,636 7.782007 110,516,205 98,281,799 12,234,406 925,000 208,443 10.792008 124,723,858 108,589,583 16,134,275 580,000 164,368 21.682009 144,953,670 129,407,626 15,546,044 615,000 135,033 20.732010 133,987,859 117,922,597 16,065,262 4,730,000 277,050 3.212011 160,158,760 140,272,996 19,885,764 2,740,000 290,788 6.56
Source: Current year and prior years combined financial statements. Notes: (1) Includes operating and nonoperating revenues. (2) Includes operating expenses minus depreciation and amortization. (3) Includes principal and interest of revenue bonds only.
Debt Service (3)
CITY OF MURFREESBORO, TENNESSEE
Revenue Bond Coverage
Last Ten Fiscal Years
- 153 -

Fiscal Year CityEnded Personal Median School Unemployment
June 30, Population (1) Income Age (3) Enrollment Rate (2)
2002 76,012 $ 1,999,875,720 $ 26,310 31.2 5,789 4.40 %2003 75,083 2,002,238,361 26,667 31.2 5,850 4.402004 84,000 2,308,656,000 27,484 31.2 6,062 4.502005 81,393 2,331,990,843 28,651 31.2 6,260 4.402006 86,793 2,577,752,100 29,700 31.2 6,600 4.202007 92,559 2,813,793,600 30,400 31.2 6,720 3.702008 100,575 3,147,997,500 31,300 31.2 6,842 4.402009 101,753 3,215,394,800 31,600 31.2 6,900 7.902010 108,755 3,306,152,000 30,400 31.2 6,900 8.902011 110,000 3,454,000,000 31,400 32.1 6,881 8.40
Notes: (1) Special Census conducted 2003, 2005, and 2008, and Federal Census conducted 2010, others are estimated. (2) Source: University of Tennessee, Center for Business & Economic Research, Tennessee Department of Education,
Bureau of Economic Analysis and Business and Economic Research Center. These figures represent the entire County of which Murfreesboro is a part.
(3) The Census Bureau determines the median age for local areas each decade. The last determination was during the 2010 census and will be determined again after the 2020 census. These figures represent the entire County of which Murfreesboro is a part.
Per CapitaIncome (2)
CITY OF MURFREESBORO, TENNESSEE
Demographic and Economic Statistics
Last Ten Fiscal Years
- 154 -
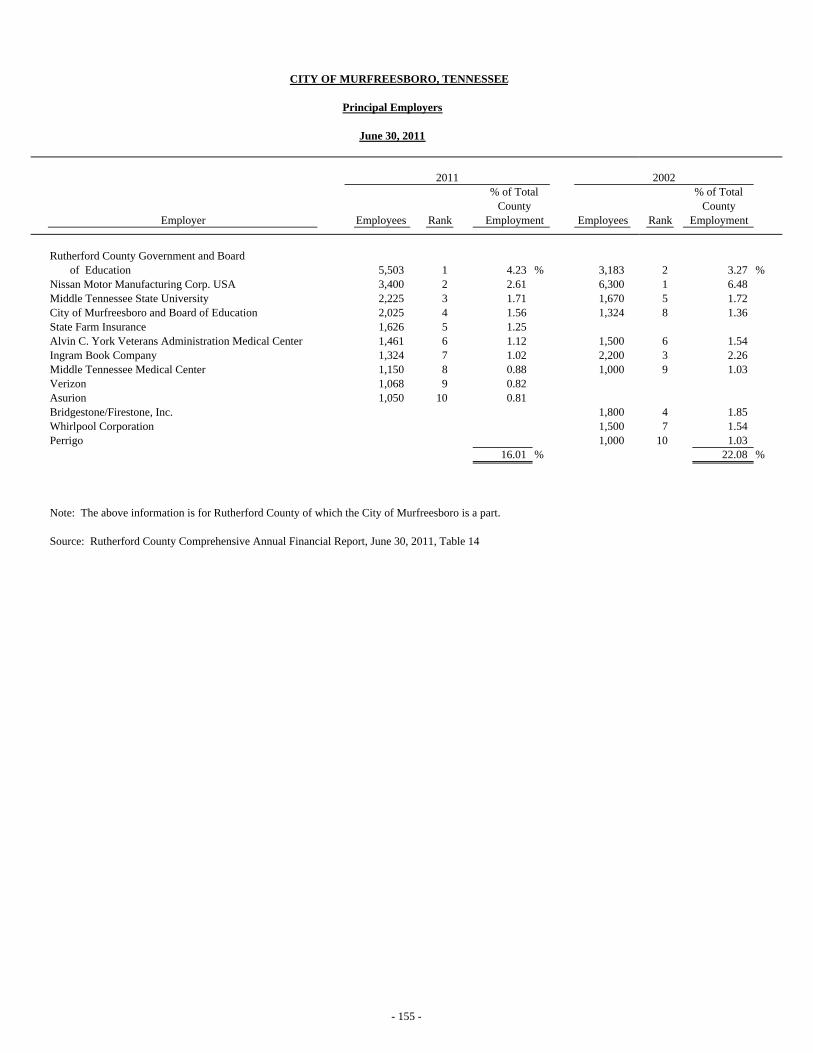
% of TotalCounty
Employer Employees Rank Employment Employees Rank
Rutherford County Government and Board of Education 5,503 1 4.23 % 3,183 2 3.27 %
Nissan Motor Manufacturing Corp. USA 3,400 2 2.61 6,300 1 6.48 Middle Tennessee State University 2,225 3 1.71 1,670 5 1.72 City of Murfreesboro and Board of Education 2,025 4 1.56 1,324 8 1.36 State Farm Insurance 1,626 5 1.25 Alvin C. York Veterans Administration Medical Center 1,461 6 1.12 1,500 6 1.54 Ingram Book Company 1,324 7 1.02 2,200 3 2.26 Middle Tennessee Medical Center 1,150 8 0.88 1,000 9 1.03 Verizon 1,068 9 0.82 Asurion 1,050 10 0.81 Bridgestone/Firestone, Inc. 1,800 4 1.85 Whirlpool Corporation 1,500 7 1.54 Perrigo 1,000 10 1.03
16.01 % 22.08 %
Note: The above information is for Rutherford County of which the City of Murfreesboro is a part.
Source: Rutherford County Comprehensive Annual Financial Report, June 30, 2011, Table 14
20022011
CITY OF MURFREESBORO, TENNESSEE
Principal Employers
June 30, 2011
% of TotalCounty
Employment
- 155 -

2002 2003 2004 2005 2006 2007 2008 2009 2010 2011Function/Program
General government - Administrative and General 21 21 21 20 20 21 23 24 28 28 Civic Plaza 1 1 1 1 1 1 1 1 1 1
Police - Officers 162 161 161 163 182 187 203 239 240 220 Civilians 41 41 41 42 48 48 53 58 57 53
Fire Protection - Firefighters and Officers 166 165 167 176 176 188 187 202 202 184 Civilians 3 3 3 3 3 3 3 3 3 3
Judicial 5 6 6 6 6 6 6 6 6 6 Legal and Risk Management 9 9 9 9 9 10 10 10 10 10 Human Resources 7 7 7 8 8 9 10 9 9 9 Streets and Signs 25 25 25 27 28 28 29 29 29 28 Planning and Engineering 22 22 22 26 27 29 31 30 23 20 Building and Codes 17 17 19 20 23 26 26 25 27 25 Solid Waste 48 45 45 57 58 58 57 57 57 55 Urban Environmental 9 9 10 12 13 13 16 16 16 15 Community Services -
Fleet Services 2 11 11 11 11 12 13 13 13 13 Senior Citizens 9 9 9 9 9 9 9 9 9 9 Airport 1 1 1 1 1 1 1 1 1 1 Cable Television 4 4 4 4 4 4 4 4 4 4
Mass Transit - - - - 1 12 12 12 18 16 Recreation and Golf 79 80 78 78 81 84 84 88 88 87 Community Development 3 3 3 3 3 3 2 2 2 2 Education 652 696 684 715 775 801 859 881 864 920 Food Service 30 31 29 29 25 25 27 28 25 24 Water and Sewer 119 128 130 127 135 143 149 151 147 147 Electric 68 73 74 73 73 73 76 79 87 83 Cemetery 6 6 6 7 7 8 8 9 9 9
Total 1,509 1,574 1,566 1,627 1,727 1,802 1,899 1,986 1,975 1,972
Sources: Various city departments
CITY OF MURFREESBORO, TENNESSEE
Full-time Equivalent City Government Employees by Function
Last Ten Fiscal Years
- 156 -

2002 2003 2004 2005 2006 2007 2008 2009 2010 2011Function/Program
Police - Arrests 7,187 7,562 7,213 7,553 7,741 11,613 8,641 9,111 8,530 7,944 911 calls 30,089 22,737 31,197 33,509 25,922 35,785 37,185 38,664 37,824 39,195 Traffic violations 20,408 20,043 17,002 16,242 13,424 23,360 25,120 26,095 13,059 13,930
Fire Protection - Emergency responses (c) 1,798 2,300 5,535 5,577 6,104 8,035 8,241 8,983 10,354 11,192 Fire safety inspections (a) 5,348 4,770 5,484 5,012 4,555 5,486 5,028 5,391 4,844 4,239 Fire training hours (a) 54,874 61,993 60,184 62,578 63,627 64,107 69,771 73,059 65,895 60,366
Human Resources - Full time positions/applications 55 / 2,036 NA 56 / 2,285 NA 80 /3,277 83/3,879 68/3,460 44/2,564 27/2,096 48/2633Part time positions/applications 93 / 1,371 NA 115 /1,881 NA 102 / 1,590 113/1,604 117/2,489 64/1,594 147/1,954 146/1674
Streets and Signs (a) - Street repaving (lane miles) 28 114 64 43 54 58 20 31 42 61
Planning and Engineering (b) - Preliminary plats reviewed 49 48 83 73 57 55 27 13 8 11
Final plats reviewed 111 89 133 156 128 144 128 75 60 56 Site plans reviewed 107 111 139 134 131 161 184 157 97 105 Annexations studied 13 22 30 35 20 19 10 9 2 1
Building and Codes - Single family home permits issued 1,053 1,514 1,689 1,814 1,922 1,391 711 430 425 329 Total building permits issued 1,696 2,149 2,398 2,582 2,511 2,707 1,824 1,433 1,357 1,277 Substandard and property maintenance complaint notices (d) 1,201 1,131 1,405 2,113 2,102 3,458 3,697 8,425 8,334 10,360
Solid Waste (a) - Refuse collected (tons per year) 29,350 32,247 31,087 32,265 34,321 36,892 35,227 33,900 33,284 33,673
Community services - Airport Gallons of fuel sold (Avgas and Jet A) 166,037 155,895 195,512 208,875 195,244 182,641 184,423 191,152 187,749 191,986 Education - K-6 Enrollment 5,789 5,850 6,062 6,260 6,600 6,720 6,842 6,902 6,876 6,881 Water and Sewer -
Water sold annually in 100 cubic feet 3,325,765 3,350,118 3,333,846 3,411,762 3,690,312 4,338,296 4,427,024 3,702,460 3,538,776 3,424,017 Sewer sold annually in 100 cubic feet 3,078,940 3,175,410 3,265,520 3,431,040 3,685,630 4,771,612 4,177,764 3,809,040 3,733,376 3,722,554
Electric - Number of customers 37,299 38,604 40,298 43,525 46,985 47,858 49,960 50,556 52,001 52,148 Kilowatt hours sold (in thousands) 1,149,358 1,236,829 1,282,229 1,321,732 1,455,524 1,485,484 1,576,120 1,541,000 1,559,000 1,646,877
Sources: Various city departments Note: Operating indicators are not available for Administrative and General, Judicial, Legal (& Risk Management), Urban Environmental, Other operations (Civic Plaza,
Fleet Services, Senior Citizens, and Cable Television), Transportation, Recreation, Community Development, Food Service, and Cemetery Functions. (a) Calendar year information (b) Calendar year information through 2006/ Fiscal Information 2007 through 2011 (c) Fiscal information through 2006/Calendar Information 2007 through 2011 (d) Information is for notices through 2008/Inspections information 2009 through 2011 NA Information is not available
CITY OF MURFREESBORO, TENNESSEE
Operating Indicators by Function
Last Ten Fiscal Years
- 157 -
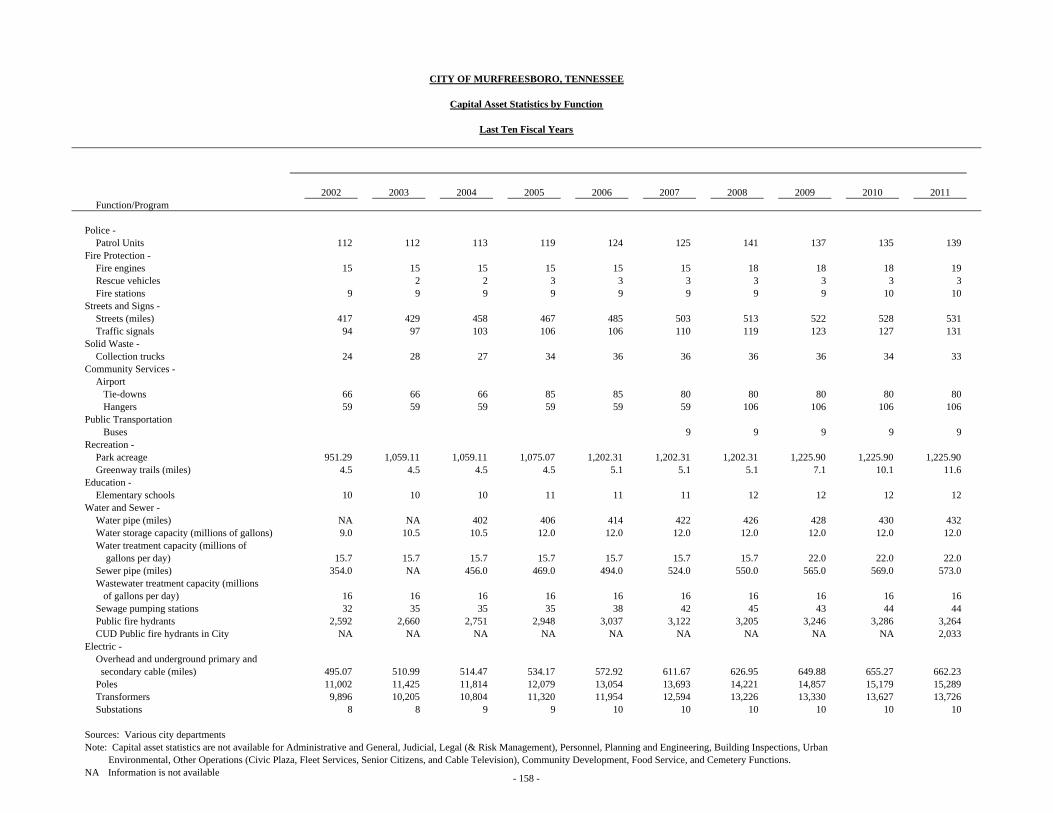
2002 2003 2004 2005 2006 2007 2008 2009 2010 2011Function/Program
Police - Patrol Units 112 112 113 119 124 125 141 137 135 139
Fire Protection - Fire engines 15 15 15 15 15 15 18 18 18 19 Rescue vehicles 2 2 3 3 3 3 3 3 3 Fire stations 9 9 9 9 9 9 9 9 10 10
Streets and Signs - Streets (miles) 417 429 458 467 485 503 513 522 528 531 Traffic signals 94 97 103 106 106 110 119 123 127 131
Solid Waste - Collection trucks 24 28 27 34 36 36 36 36 34 33
Community Services - Airport
Tie-downs 66 66 66 85 85 80 80 80 80 80 Hangers 59 59 59 59 59 59 106 106 106 106
Public Transportation Buses 9 9 9 9 9
Recreation - Park acreage 951.29 1,059.11 1,059.11 1,075.07 1,202.31 1,202.31 1,202.31 1,225.90 1,225.90 1,225.90
Greenway trails (miles) 4.5 4.5 4.5 4.5 5.1 5.1 5.1 7.1 10.1 11.6 Education -
Elementary schools 10 10 10 11 11 11 12 12 12 12 Water and Sewer - Water pipe (miles) NA NA 402 406 414 422 426 428 430 432
Water storage capacity (millions of gallons) 9.0 10.5 10.5 12.0 12.0 12.0 12.0 12.0 12.0 12.0 Water treatment capacity (millions of gallons per day) 15.7 15.7 15.7 15.7 15.7 15.7 15.7 22.0 22.0 22.0 Sewer pipe (miles) 354.0 NA 456.0 469.0 494.0 524.0 550.0 565.0 569.0 573.0 Wastewater treatment capacity (millions of gallons per day) 16 16 16 16 16 16 16 16 16 16 Sewage pumping stations 32 35 35 35 38 42 45 43 44 44
Public fire hydrants 2,592 2,660 2,751 2,948 3,037 3,122 3,205 3,246 3,286 3,264 CUD Public fire hydrants in City NA NA NA NA NA NA NA NA NA 2,033
Electric - Overhead and underground primary and
secondary cable (miles) 495.07 510.99 514.47 534.17 572.92 611.67 626.95 649.88 655.27 662.23 Poles 11,002 11,425 11,814 12,079 13,054 13,693 14,221 14,857 15,179 15,289 Transformers 9,896 10,205 10,804 11,320 11,954 12,594 13,226 13,330 13,627 13,726 Substations 8 8 9 9 10 10 10 10 10 10
Sources: Various city departments Note: Capital asset statistics are not available for Administrative and General, Judicial, Legal (& Risk Management), Personnel, Planning and Engineering, Building Inspections, Urban
Environmental, Other Operations (Civic Plaza, Fleet Services, Senior Citizens, and Cable Television), Community Development, Food Service, and Cemetery Functions. NA Information is not available
CITY OF MURFREESBORO, TENNESSEE
Capital Asset Statistics by Function
Last Ten Fiscal Years
- 158 -
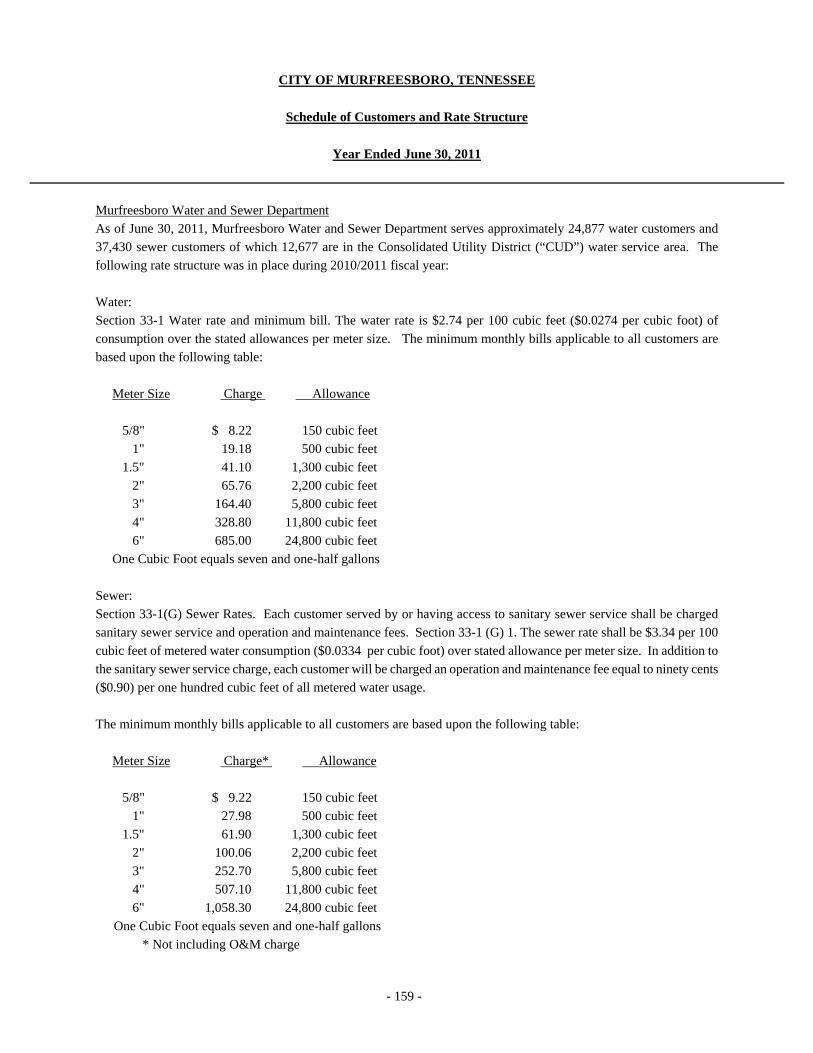
- 159 -
CITY OF MURFREESBORO, TENNESSEE
Schedule of Customers and Rate Structure
Year Ended June 30, 2011
Murfreesboro Water and Sewer Department
As of June 30, 2011, Murfreesboro Water and Sewer Department serves approximately 24,877 water customers and
37,430 sewer customers of which 12,677 are in the Consolidated Utility District (“CUD”) water service area. The
following rate structure was in place during 2010/2011 fiscal year:
Water:
Section 33-1 Water rate and minimum bill. The water rate is $2.74 per 100 cubic feet ($0.0274 per cubic foot) of
consumption over the stated allowances per meter size. The minimum monthly bills applicable to all customers are
based upon the following table:
Meter Size Charge Allowance
5/8" $ 8.22 150 cubic feet
1" 19.18 500 cubic feet
1.5" 41.10 1,300 cubic feet
2" 65.76 2,200 cubic feet
3" 164.40 5,800 cubic feet
4" 328.80 11,800 cubic feet
6" 685.00 24,800 cubic feet
One Cubic Foot equals seven and one-half gallons
Sewer:
Section 33-1(G) Sewer Rates. Each customer served by or having access to sanitary sewer service shall be charged
sanitary sewer service and operation and maintenance fees. Section 33-1 (G) 1. The sewer rate shall be $3.34 per 100
cubic feet of metered water consumption ($0.0334 per cubic foot) over stated allowance per meter size. In addition to
the sanitary sewer service charge, each customer will be charged an operation and maintenance fee equal to ninety cents
($0.90) per one hundred cubic feet of all metered water usage.
The minimum monthly bills applicable to all customers are based upon the following table:
Meter Size Charge* Allowance
5/8" $ 9.22 150 cubic feet
1" 27.98 500 cubic feet
1.5" 61.90 1,300 cubic feet
2" 100.06 2,200 cubic feet
3" 252.70 5,800 cubic feet
4" 507.10 11,800 cubic feet
6" 1,058.30 24,800 cubic feet
One Cubic Foot equals seven and one-half gallons
* Not including O&M charge

- 160 -
CITY OF MURFREESBORO, TENNESSEE
Schedule of Customers and Rate Structure (continued)
Year Ended June 30, 2011
Murfreesboro Water and Sewer Department (continued)
The above rates are net. The gross rate, 10% higher, will apply to accounts not paid by the due date. Rates for service outside the City Limits are 50% higher than the above inside City Limit rates. Effective on bills printed July 1, 2010.
Murfreesboro Electric Department
As of June 30, 2011, Murfreesboro Electric Department serves approximately 52,148 customers and had the following
rate structure in place:
Residential:
Customer Charge - $11.76 per month (also minimum bill)
Energy Charge - $.06565 per KWH
Fuel Cost Adjustment (FCA) - $.02458 per KWH
Commercial:
General Power (GSA)
(1) Not more than 50 KWD (KWH not over 15,000)
Customer Charge $24.86
Energy Charge $.07539 per KWH
Fuel Cost Adjustment $.02437 per KWH
(2) Greater than 50 KWD but not more than 1,000 KWD or less than 50 KWD with KWH over 15,000
Customer Charge $49.00
Energy Charge
1st 15,000 $.07648 per KWH FCA is $.02437 per KWH
over 15,000 $.03679 per KWH FCA is $.02413 per KWH
Demand Charge
1st 50 No Charge
over 50 $11.71 per KWH
(3) Greater than 1,000 KWD but not more than 5,000 KWD
Customer Charge $122.00
Energy Charge $.03958 per KWH
FCA charge $.02413 per KWH
Demand Charge
1st 1,000 KWD $10.78 per KW
over 1,000 KWH $10.74 per KW

- 161 -
CITY OF MURFREESBORO, TENNESSEE
Schedule of Customers and Rate Structure (continued)
Year Ended June 30, 2011
Murfreesboro Electric Department (continued)
General Power (GSB)
Greater than 5,000 KWD but not more than 15,000 KWD
Customer Charge $1,500.00
Admin charge $ 350.00
Energy Charge $.02476 per KWH
FCA charge $.02437 per KWH
Demand Charge $ 21.03 per KWH
General Power (MSC)
Greater than 15,001 KW but not more than 25,000 KW
Customer Charge $1,500.00
Admin charge $ 350.00
Demand Charge $ 17.71
Energy Charge $.01703 per KWH
FCA charge $.02437 per KWH
General Power (MSD)
Customer Charge $1,500.00
Admin charge $ 350.00
Demand Charge $ 18.22
Energy Charge $.01733 per KWH
FCA per KWH $.02437 per KWH
For time of use rates, please contact the Murfreesboro Electric Department.
Since April 2011 rates change based upon the seasons; summer, winter and transitional months.
Fuel cost adjustments (FCA) vary monthly and apply to energy charges only.
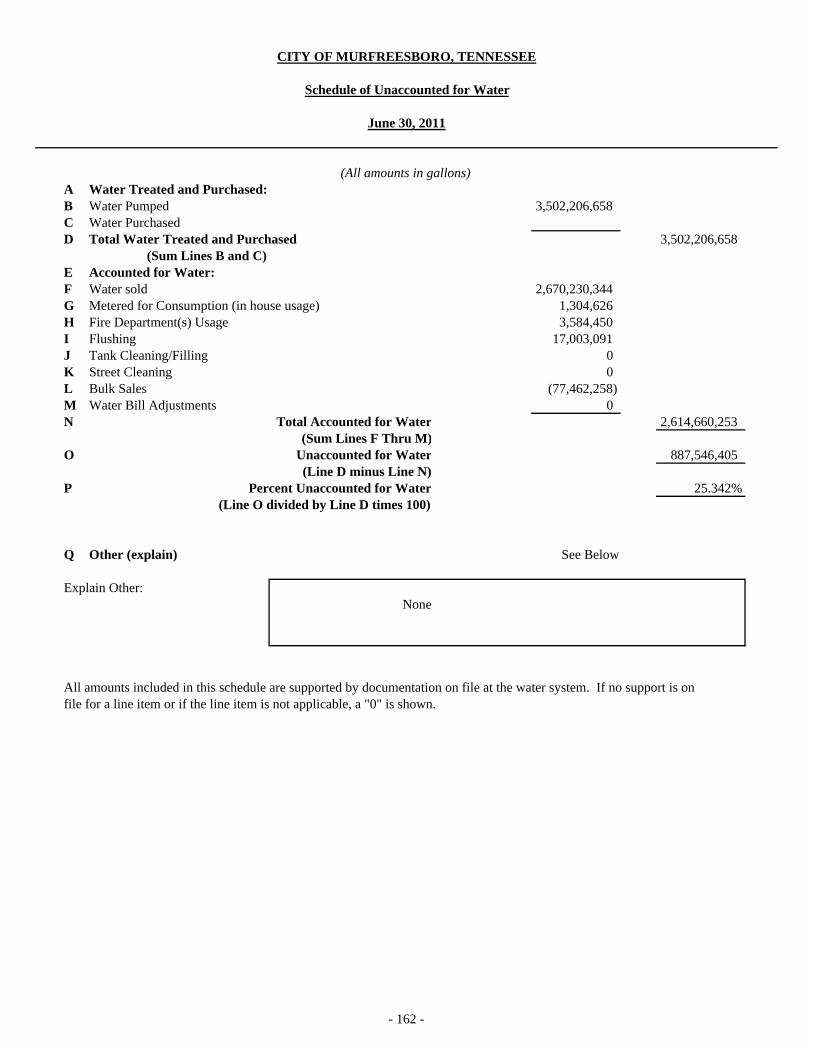
A Water Treated and Purchased:B Water Pumped 3,502,206,658C Water PurchasedD Total Water Treated and Purchased 3,502,206,658
(Sum Lines B and C)E Accounted for Water:F Water sold 2,670,230,344G Metered for Consumption (in house usage) 1,304,626H Fire Department(s) Usage 3,584,450I Flushing 17,003,091J Tank Cleaning/Filling 0K Street Cleaning 0L Bulk Sales (77,462,258)M Water Bill Adjustments 0N Total Accounted for Water 2,614,660,253
(Sum Lines F Thru M)O Unaccounted for Water 887,546,405
(Line D minus Line N)P Percent Unaccounted for Water 25.342%
(Line O divided by Line D times 100)
Q Other (explain) See Below
Explain Other:None
All amounts included in this schedule are supported by documentation on file at the water system. If no support is onfile for a line item or if the line item is not applicable, a "0" is shown.
(All amounts in gallons)
CITY OF MURFREESBORO, TENNESSEE
Schedule of Unaccounted for Water
June 30, 2011
- 162 -

Balance BalanceJune 30, 2010 June 30, 2011
CFDA Contract/Grant (Receivable)/ (Receivable)/Program Name Number Number Deferred Revenue Adjustments Deferred Revenue
DEPARTMENT OF HOUSING AND URBAN DEVELOPMENT Community Development Block Grant 14.218 B-09-MC-47-0009 $ (162,549) $ 354,099 $ 191,550 Community Development Block Grant 14.218 B-10-MC-47-0009 180,776 291,762 $ (110,986)ARRA - Community Development Block Grant 14.253 B-09-MY-47-0009 (800) 65,171 64,371Passed through the Tennessee Housing
Development Agency - Neighborhood Stabilization Program 14.218 NSPI-09-25%-001 (129,273) 335,619 204,202 $ (2,144) (2)Neighborhood Stabilization Program 14.218 NSPI-09-015 (47,975) 60,213 15,591 3,353 (2) ,(1)
Total CDBG - Entitlement Grants Cluster $ (340,597) $ 995,878 $ 767,476 $ 1,209 $ (110,986)
Passed through the Tennessee Housing Development Agency - Emergency Shelter Grant 14.231 ESG-09-30 $ (21,940) $ 21,940Emergency Shelter Grant 14.231 ESG-10-31 86,098 $ 110,543 $ (24,445)
Total CFDA #14.231 $ (21,940) $ 108,038 $ 110,543 $ (24,445)
HOME Program 14.239 HM1036-002 $ 69,628 $ 156,804 $ (87,176)ARRA - Homeless Prevention and Rapid Re-housing Program 14.257 HPRP-09-07 $ 362,429 $ 389,064 $ (26,635)
Passed through the Murfreesboro Housing Authority - Capital Fund Program 14.872 TN43P02050106 $ 39,957 $ 39,957
Total Department of Housing and Urban Development $ (362,537) $ 1,575,930 $ 1,463,844 $ 1,209 $ (249,242)
DEPARTMENT OF JUSTICE Bulletproof Vest Program 16.607 N/A $ (3,107) $ 3,107 Bulletproof Vest Program 16.607 N/A 11,018 $ 15,255 $ (4,237)
Total CFDA #16.607 $ (3,107) $ 14,125 $ 15,255 $ (4,237)
Edward Byrne Memorial Justice Assistance Grant 16.738 2008-DJ-BX-0279 $ 10,536 $ 10 $ 10,546Edward Byrne Memorial Justice Assistance Grant 16.738 2009-DJ-BX-1321 30,554 $ 28,726 1,828Edward Byrne Memorial Justice Assistance Grant 16.738 2010-DJ-BX-0751 46,525 46,525Passed through the Murfreesboro Housing Authority -
Edward Byrne Memorial Justice Assitance Grant 16.738 10899 79,354 102,049 (22,695)Total CFDA #16.738 $ 41,090 $ 125,889 $ 130,775 $ 36,204
Passed through Rutherford County - ARRA - Edward Byrne Memorial Justice Assistance Grant 16.804 2009-SB-B9-2843 $ (32,770) $ 36,693 $ 3,923
$ 5,213 $ 176,707 $ 149,953 $ 31,967
(Continued)
Total Department of Justice
CITY OF MURFREESBORO, TENNESSEE
Schedule of Expenditures of Federal Awards
Year Ended June 30, 2011
ExpendituresReceipts
- 163 -

Balance BalanceJune 30, 2010 June 30, 2011
CFDA Contract/Grant (Receivable)/ (Receivable)/Program Name Number Number Deferred Revenue Adjustments Deferred Revenue
DEPARTMENT OF TRANSPORTATION Passed through the Tennessee Department of Transportation -
Airport Safety Improvement Project 20.106 3-47-SBGP-27 $ 5,117 $ (5,117)Airport Safety Improvement Project 20.106 3-47-SBGP-20 $ 1,850 1,850
Total CFDA #20.106 $ 1,850 $ 6,967 $ (5,117)
Highway Planning and Construction 20.205 1999879 $ (425,647) $ 425,647 (2) Highway Planning and Construction 20.205 040145 (242,874) $ 1,044,903 $ 469,692 (425,647) (2) $ (93,310)Highway Planning and Construction 20.205 090036 (225,282) 234,923 30,989 (21,348)Highway Planning and Construction 20.205 070098 (885,261) 1,441,026 529,178 (26,587) (3)ARRA - Highway Planning and Construction 20.205 090247 (458,665) 574,997 116,332ARRA - Highway Planning and Construction 20.205 090221 827,920 982,267 (154,347)
Total CFDA #20.205 $ (2,237,729) $ 4,123,769 $ 2,128,458 $ (26,587) $ (269,005)
Section 5303 Metro Planning 20.505 TN-80-X002-00 $ (18,875) $ 18,875 $ 61,818 $ (61,818)Total CFDA #20.505 $ (18,875) $ 18,875 $ 61,818 $ (61,818)
Passed through the Tennessee Department of Environment and Conservation - Recreational Trails Program 20.219 $ 49,192 $ (49,192)
Section 5307 Urbanized Area Formula - FY07 20.507 TN-90-X291-00 $ (55,979) $ 57,395 $ 75,131 $ (73,715)Section 5307 Urbanized Area Formula - FY08 20.507 TN-90-X295-00 (661,360) 661,379 19Section 5307 Urbanized Area Formula - FY08 20.507 TN-90-X332-00 132,125 167,137 $ (18,913) (2) (53,925)Section 5307 Urbanized Area Formula - FY09 20.507 TN-90-X315-00 (79,392) 496,756 11,820 (2) (564,328)ARRA - Section 5307 Urbanized Area Formula 20.507 TN-96-X010-00 (90,135) 249,715 312,768 (153,188)
Total CFDA #20.507 $ (886,866) $ 1,100,614 $ 1,051,811 $ (7,093) $ (845,156)$ (3,143,470) $ 5,245,108 $ 3,298,246 $ (33,680) $ (1,230,288)
DEPARTMENT OF ENERGY ARRA - Energy Efficiency and Conservation Block
Grant Program 81.128 DE-SC0002702 $ (8,673) $ 75,004 $ 206,054 $ (139,723)$ (8,673) $ 75,004 $ 206,054 $ (139,723)
DEPARTMENT OF HEALTH AND HUMAN SERVICES Passed through the Greater Nashville Regional Council -
Aging Services - Title IIID 93.043 2010-23 $ 2,500 $ 2,500Aging Services - Title IIIB 93.044 2010-23 22,000 22,000
$ 24,500 $ 24,500
(Continued)
CITY OF MURFREESBORO, TENNESSEE
Receipts Expenditures
Schedule of Expenditures of Federal Awards (continued)
Year Ended June 30, 2011
Total Department of Transportation
Total Department of Energy
Total Department of Health and Human Services
- 164 -

Balance BalanceJune 30, 2010 June 30, 2011
CFDA Contract/Grant (Receivable)/ (Receivable)/Program Name Number Number Deferred Revenue Adjustments Deferred Revenue
DEPARTMENT OF HOMELAND SECURITY Passed through the Tennessee Emergency
Management Agency - Public Assistant Grant 97.036 34101-01210 $ (808,502) $ 4,751 (1) $ (803,751)Public Assistant Grant 97.036 34101-18911 (71,754) $ 183,532 $ 273,517 969 (1) (160,770)
Total CFDA #97.036 $ (880,256) $ 183,532 $ 273,517 $ 5,720 $ (964,521)
Assistance to Firefighters Grant Program 97.044 EMW-2009-FO-09224 $ 77,007 $ 77,007$ (880,256) $ 260,539 $ 350,524 $ 5,720 $ (964,521)$ (4,389,723) $ 7,357,788 $ 5,493,121 $ (26,751) $ (2,551,808)
Notes -
(1) This is to adjust for federal revenue accrued at June 30, 2010 in excess of expenditures eligible for reimbursement from this grant.
(2) This is to reclassify expenditures from one grant number to the grant number being used for reimbursement.
(3) These are expenditures that were incurred in a prior year that were eligible for reimbursement from this federal program; however, federal revenue was not recognized for them in the prior year.
Year Ended June 30, 2011
Schedule of Expenditures of Federal Awards (continued)
TOTAL FEDERAL AWARDSTotal Department of Homeland Security
Expenditures
CITY OF MURFREESBORO, TENNESSEE
Receipts
- 165 -

Balance BalanceJune 30, 2010 June 30, 2011
Contract/Grant (Receivable)/ (Receivable)/Program Name Number Deferred Revenue Receipts Expenditures Adjustments Deferred Revenue
TENNESSEE COMMISSION ON AGING Passed through the Greater Nashville Regional Council -
Aging Services GG-10-29083-00 $ 10,600 $ 10,600
TENNESSEE DEPARTMENT OF ECONOMIC AND COMMUNITY DEVELOPMENT Fasttrack Infrastructure Development GG-11-34683-00 $ 17,350 $ 234,110 $ (216,760)
TENNESSEE DEPARTMENT OF TRANSPORTATION Airport Maintenance 99-555-1206-4 $ 13,000 $ (13,000)Airport Taxiway Lighting Z-09-21-4001-00 $ (7,985) $ 7,985 Airport Layout Plan Z-08-20-0794-00 (14,488) 24,905 30,481 (20,064)State Match - Section 5303 Metro Planning GG-07-26349-00 (2,359) 2,359 7,702 (7,702)State Match - Section 5307 Urbanized Area Formula - FY07 GG-10-29565-00 (246,739) 246,739 9,391 (9,391)State Match - Section 5307 Urbanized Area Formula - FY08 GG-08-31735-00 (213,656) 213,665 20,901 $ (2,364) (2) (23,256)State Match - Section 5307 Urbanized Area Formula - FY09 GG-09-36885-00 (39,696) 216,784 5,910 (2) (250,570)
$ (524,923) $ 495,653 $ 298,259 $ 3,546 $ (323,983)
TENNESSEE EMERGENCY MANAGEMENT AGENCY Public Assistance Grant Award 34101-01210 $ (486,291) $ 44 $ (486,335)Public Assistance Grant Award 34101-18911 (3,986) 14,359 $ 54 (1) (18,291)
$ (490,277) $ 14,403 $ 54 $ (504,626)
TOTAL STATE AWARDS $ (1,015,200) $ 523,603 $ 557,372 $ 3,600 $ (1,045,369)
Notes - (1) This is to adjust for state revenue accrued at June 30, 2010 in excess of expenditures eligible for reimbursement from this grant.
(2) This is to reclassify expenditures from one grant number to the grant number being used for reimbursement.
Information in this schedule is presented on the accrual basis of accounting.
CITY OF MURFREESBORO, TENNESSEE
Schedule of Expenditures of State Awards
Year Ended June 30, 2011
- 166 -

- 167 -
INDEPENDENT AUDITOR’S REPORT ON INTERNAL CONTROLOVER FINANCIAL REPORTING AND ON COMPLIANCE AND OTHER
MATTERS BASED ON AN AUDIT OF FINANCIAL STATEMENTSPERFORMED IN ACCORDANCE WITH GOVERNMENT AUDITING STANDARDS
Honorable Mayor and City Council City of Murfreesboro, Tennessee
We have audited the financial statements of the governmental activities, the business-type activities, each major fund, and the aggregate remaining fund information of the City of Murfreesboro, Tennessee, as of and for the year ended June 30, 2011 which collectively comprise the City of Murfreesboro, Tennessee’s basic financial statements and have issued our report thereon dated January 20, 2012. Our report includes a reference to other auditors. We conducted our audit in accordance with auditing standards generally accepted in the United States of America and the standards applicable to financial audits contained in Government Auditing Standards, issued by the Comptroller General of the United States. Other auditors audited the financial statements of the Murfreesboro City Schools, the Murfreesboro Electric Department, the Murfreesboro Water and Sewer Department, the Murfreesboro Stormwater Fund, the Murfreesboro Electric Department Pension Plan, and the Evergreen Cemetery Commission as described in our report on the City of Murfreesboro’s financial statements. This report includes our consideration of the results of the other auditors’ testing of internal control over financial reporting and compliance and other matters that are reported on separately by those other auditors. However, this report, insofar as it relates to the results of the other auditors, is based solely on the reports of theother auditors.
Internal Control Over Financial ReportingIn planning and performing our audit, we considered the City of Murfreesboro, Tennessee’s internal control over financial reporting as a basis for designing our auditing procedures for the purpose of expressing our opinions on the financial statements, but not for the purpose of expressing an opinion on the effectiveness of the City of Murfreesboro, Tennessee’s internal control over financial reporting. Accordingly, we do not express an opinion on the effectiveness of the City of Murfreesboro, Tennessee’s internal control over financial reporting.
A deficiency in internal control exists when the design or operation of a control does not allow management or employees, in the normal course of performing their assigned functions, to prevent, or detect and correct misstatements on a timely basis. A material weakness is a deficiency, or a combination of deficiencies, in internal control such that there is a reasonable possibility that a material misstatement of the entity’s financial statements will not be prevented, or detected and corrected on a timely basis.
Our consideration of internal control over financial reporting was for the limited purpose described in the first paragraph of this section and was not designed to identify all deficiencies in internal control over financial reporting that might be deficiencies, significant deficiencies, or material weaknesses. We did not identify any deficiencies in internal control over financial reporting that we consider to be material weaknesses, as defined above. However, we identified certain deficiencies in internal control over financial reporting, described in the accompanying schedule of findings and questioned costs that we consider to be significant deficiencies in internal control over financial reporting. (2011-1, 2011-2 and 2011-3). A significant deficiency is a deficiency, or a combination of deficiencies, in internal control that is less severe than a material weakness, yet important enough to merit attention by those charged with governance.
JOBE, HASTINGS & ASSOCIATES
Certified Public Accountants Donna K. Hastings, CPA, CSEP 745 S 745 SOUTH CHURCH STREET – BELMONT PARK James R. Jobe, CPA P.O. BOX 1175 MURFREESBORO, TN 37133-1175 Joel H. Jobe (1944 – 2006) (615) 893-7777 FAX: (615) 896-5990 www.jobehastings.com

- 168 -
Honorable Mayor and City CouncilCity of Murfreesboro, Tennessee Page 2
Compliance and Other MattersAs part of obtaining reasonable assurance about whether the City of Murfreesboro, Tennessee’s financial statements are free of material misstatement, we performed tests of its compliance with certain provisions of laws, regulations, contracts and grant agreements, noncompliance with which could have a direct and material effect on the determination of financial statement amounts. However, providing an opinion on compliance with those provisions was not an objective of our audit, and accordingly, we do not express such an opinion. The results of our tests and those of the other auditors disclosed no instances of noncompliance or other matters that are required to be reported under Government Auditing Standards.
This report is intended solely for the information and use of management, the City Council, others within the entity, the State of Tennessee, and federal awarding agencies and pass-through entities and is not intended to be and should not be used by anyone other than these specified parties.
Certified Public Accountants
Murfreesboro, Tennessee January 20, 2012
Jobe, Hastings & Associates

- 169 -
INDEPENDENT AUDITOR'S REPORT ON COMPLIANCE WITH REQUIREMENTS THAT COULD HAVE A DIRECT AND MATERIAL
EFFECT ON EACH MAJOR PROGRAM AND ON INTERNAL CONTROL OVER COMPLIANCE IN ACCORDANCE WITH OMB CIRCULAR A-133
Honorable Mayor and City CouncilCity of Murfreesboro, Tennessee
ComplianceWe have audited the City of Murfreesboro, Tennessee’s compliance with the types of compliance requirements described in the U.S. Office of Management and Budget (OMB) Circular A-133 Compliance Supplement that could have a direct and material effect on each of the City’s major federal programs for the year ended June 30, 2011. The City of Murfreesboro, Tennessee’s major federal programs are identified in the summary of auditor’s results section of the accompanying schedule of findings and questioned costs. Compliance with the requirements of laws, regulations, contracts, and grants applicable to each of its major federal programs is the responsibility of the City of Murfreesboro, Tennessee’s management. Our responsibility is to express an opinion on the City of Murfreesboro, Tennessee’s compliance based on our audit.
The City of Murfreesboro, Tennessee’s financial statements include the operations of the Murfreesboro City Schools, which received $10,509,947 in federal awards which is not included in the schedule during the year ended June 30, 2011. Our audit, described below, did not include the operations of the Murfreesboro City Schools because this department engaged other auditors to perform an audit in accordance with OMB Circular A-133.
We conducted our audit of compliance in accordance with auditing standards generally accepted in the United States of America; the standards applicable to financial audits contained in Government Auditing Standards, issued by the Comptroller General of the United States; and OMB Circular A-133, Audits of States, Local Governments, and Non-Profit Organizations. Those standards and OMB Circular A-133 require that we plan and perform the audit to obtain reasonable assurance about whether noncompliance with the types of compliance requirements referred to above that could have a direct and material effect on a major federal occurred. An audit includes examining, on a test basis, evidence about the City of Murfreesboro, Tennessee’s compliance with those requirements and performing such other procedures as we considered necessary in the circumstances. We believe that our audit provides a reasonable basis for our opinion. Our audit does not provide a legal determination of the City of Murfreesboro, Tennessee’s compliance with those requirements.
In our opinion, the City of Murfreesboro, Tennessee complied, in all material respects, with the compliance requirements referred to above that could have a direct and material effect on each of its major federal programs for the year ended June 30, 2011.
Internal Control Over Compliance Management of the City of Murfreesboro, Tennessee is responsible for establishing and maintaining effective internal control over compliance with the requirements of laws, regulations, contracts, and grants applicable to federal programs. In planning and performing our audit, we considered the City of Murfreesboro, Tennessee’s internal control over compliance with the requirements that could have a direct and material effect on a major federal program to determine the auditing procedures for the purpose of expressing our opinion on compliance and to test and report on internal control over compliance in accordance with OMB Circular A-133, but not for the purpose of expressing an opinion on the effectiveness of internal control over compliance. Accordingly, we do not express an opinion on the effectiveness of the City of Murfreesboro, Tennessee’s internal control over compliance.
JOBE, HASTINGS & ASSOCIATES
Certified Public Accountants Donna K. Hastings, CPA, CSEP 745 S 745 SOUTH CHURCH STREET – BELMONT PARK James R. Jobe, CPA P.O. BOX 1175 MURFREESBORO, TN 37133-1175 Joel H. Jobe (1944 – 2006) (615) 893-7777 FAX: (615) 896-5990 www.jobehastings.com

- 170 -
Honorable Mayor and City Council City of Murfreesboro, Tennessee Page 2
A deficiency in internal control over compliance exists when the design or operation of a control over compliance does not allow management or employees, in the normal course of performing their assigned functions, to prevent, or detect and correct, noncompliance with a type of compliance requirement of a federal program on a timely basis. A materialweakness in internal control over compliance is a deficiency, or combination of deficiencies, in internal control over compliance, such that there is a reasonable possibility that material noncompliance with a type of compliance requirement of a federal program will not be prevented, or detected and corrected, on a timely basis.
Our consideration of internal control over compliance was for the limited purpose described in the first paragraph of this section and was not designed to identify all deficiencies in internal control over compliance that might be deficiencies, significant deficiencies, or material weaknesses. We did not identify any deficiencies in internal control over compliance that we consider to be material weaknesses, as defined above.
This report is intended solely for the information and use of management, the City Council, others within the entity, the State of Tennessee, and federal awarding agencies and pass-through entities and is not intended to be and should not be used by anyone other than these specified parties.
Certified Public Accountants
Murfreesboro, Tennessee January 20, 2012
Jobe, Hastings & Associates

CITY OF MURFREESBORO, TENNESSEE
Schedule of Findings and Questioned Costs
Year Ended June 30, 2011
- 171 -
A. SUMMARY OF AUDITOR’S RESULTS 1. The auditor’s report expresses an unqualified opinion on the financial statements of the City of
Murfreesboro, Tennessee. 2. Three significant deficiencies disclosed during the audit of the financial statements are reported in the
Independent Auditor’s Report On Internal Control Over Financial Reporting and On Compliance and Other Matters Based On An Audit Of Financial Statements Performed In Accordance With Government Auditing Standards. None of the conditions are reported as material weaknesses.
3. No instances of noncompliance material to the financial statements of the City of Murfreesboro,
Tennessee, which would be required to be reported in accordance with Government Auditing Standards were disclosed during the audit.
4. No significant deficiencies in internal control over major federal award programs are reported in the
Independent Auditor’s Report on Compliance with Requirements that Could Have a Direct and Material Effect on Each Major Program and on Internal Control Over Compliance in Accordance with OMB Circular A-133.
5. The auditor’s report on compliance for the major federal award programs for the City of Murfreesboro,
Tennessee expresses an unqualified opinion on all major federal programs. 6. No audit findings required to be reported in accordance with Section 510(a) of OMB Circular A-133 are
reported in this schedule. 7. The programs tested as major programs include:
Federal Program Name CFDA Numbers CDBG – Entitlement Grants Cluster:
Community Development Block Grant and Neighborhood Stabilization Program 14.218
ARRA – Community Development Block Grant 14.253 ARRA – Homeless Prevention and Rapid Re-housing Program 14.257
Highway Planning and Construction 20.205 ARRA – Highway Planning and Construction 20.205 Section 5307 Urbanized Area Formula 20.507 ARRA – Section 5307 Urbanized Area Formula 20.507
8. The threshold used for distinguishing between Types A and B programs as defined by OMB Circular A-
133 was $300,000. 9. The City of Murfreesboro, Tennessee did not qualify as a low-risk auditee. B. FINDINGS – FINANCIAL STATEMENTS AUDIT
2011-1. Evergreen Cemetery Commission – Separation of Duties
Condition: One employee is currently responsible for executing, recording and controlling all cash transactions
CITY OF MURFREESBORO, TENNESSEE
Schedule of Findings and Questioned Costs (continued)
Year Ended June 30, 2011
- 172 -
B. FINDINGS – FINANCIAL STATEMENTS AUDIT (continued)
2011-1. Evergreen Cemetery Commission – Separation of Duties (continued) Criteria: Proper separation of duties requires that no one employee be responsible for an entire transaction cycle from beginning to end. Effect: An unauthorized cash transaction could be executed and not be promptly discovered by the Commission’s internal control structure. Recommendation: To the extent possible, management should separate the duties of executing, recording and controlling cash transactions.
Views of Responsible Officials and Planned Corrective Actions: Management believes the cost of maintaining this control would exceed its benefits. 2011-2. Evergreen Cemetery Commission – Detailed Inventory
Condition: The Cemetery’s inventory is currently not subject to periodic inventory observations. Some of the inventory is maintained on maps with colored lots representing lots sold, which could result in errors in the available lots which make up the Cemetery’s inventory. Criteria: Periodic physical inventory observations should be performed to ensure the accuracy of the available lots which make up the Cemetery’s inventory. Effect: Cemetery inventory could be misstated due to lack of controls in this area. Recommendation: Periodic physical inventory observations should be performed. Views of Responsible Officials and Planned Corrective Actions: Management concurs with the finding and is in the process of implementing a new software system that was purchased during the 2007 fiscal year to track the Cemetery’s inventory. All inventory has not yet been entered into this system. The software package is expected to be fully operational for the year ended June 30, 2013. 2011-3. Murfreesboro Electric Department – Work Orders
Condition: The auditor found several work orders that were still open that should have been closed into plant. Backlog of work has slowed the process of closing work orders. Criteria: Work orders should be monitored and closed in a timely manner. Effect: Depreciation of plant may be delayed. Recommendation: Management should stress to engineering personnel the importance of closing work orders in a timely manner.
Views of Responsible Officials and Planned Corrective Actions: Management agrees with the finding and will implement procedures to ensure prompt closing of completed work orders.

CITY OF MURFREESBORO, TENNESSEE
Summary Schedule of Prior Audit Findings
Year Ended June 30, 2011
- 173 -
U.S. DEPARTMENT OF HOUSING AND URBAN DEVELOPMENT Community Development Block Grant/ Neighborhood Stabilization Program – CFDA No. 14.218
2010-8. Documentation of Labor Allocations Condition: The Community Development staff did not keep accurate time sheets distributing their time among all the programs that they worked on.
Recommendation: If not working 100 percent on a program, each employee should develop time sheets that reflect all the programs on which time was spent. Copies of the timesheets are to be sent to the Department of Housing and Urban Development office for review.
Current Status: Staff time sheets have been sent to the Department of Housing and Urban Development
for review subsequent to the above recommendation. The time sheets appeared to cover all areas and were acceptable to the Department. These timesheets were used for the current fiscal year and adjusted for new programs.
2010-9. Review of Subrecipient Audits
Condition: The Community Development staff did not review or ask for audits from subrecipients to determine if they met the Federal threshold for requiring audits. The staff did not know which subrecipients were responsible for submitting an audit to the Department of Housing and Urban Development for review.
Recommendation: The staff should implement a process to ensure the required reviews of subrecipients’ audits. Current Status: A new intake sheet has been developed that requires all subgrantees to attach an audit at the time of application, or certify that they do not meet the $500,000 minimum threshold for requiring an audit. This action was reviewed by the Department of Housing and Urban Development Office and was found to be acceptable. The new intake sheet was used during the current fiscal year. As a result, the Department of Housing and Urban Development Office closed and cleared the finding. DEPARTMENT OF TRANSPORTATION Section 5307, Urbanized Area Formula – CFDA No. 20.507 2010-10. Documentation of Labor Allocations
Condition: The Transportation Director’s salary and related benefits are allocated between the public transit operations, which are partially funded by Section 5307 grant funds, and general traffic operations. These costs appear to be allowable under these grant funds to the extent that they meet the requirements as outlined in OMB Circular A-87, attachment B.11 regarding reasonableness as well as the City’s laws and any Federal laws. However, there were no personnel activity reports or equivalent documentation specifically reflecting the distribution of the actual activity of the Director’s time spent on each operation.
CITY OF MURFREESBORO, TENNESSEE
Summary Schedule of Prior Audit Findings (continued)
Year Ended June 30, 2011
- 174 -
DEPARTMENT OF TRANSPORTATION (continued) Section 5307, Urbanized Area Formula – CFDA No. 20.507 2010-10. Documentation of Labor Allocations (continued)
Recommendation: We recommend that the Director maintain either personnel activity reports that reflect an allocation of the Director’s actual time spent on each activity as defined in Attachment B.11.h. or create a substitute system for allocating the salary and benefits, which would be subject to approval by the Federal awarding agency. Current Status: For the fiscal year 2011, the Transportation Director prepared a sample of his time differentiating and quantifying time spent for public transportation versus traffic related activities in order to provide a basis for allocation and the subsequent charge off of federally reimbursable salary and benefit costs.