CITY OF MORGAN HILL
43
CITY OF MORGAN HILL _________________________ FINAL WASTEWATER RATE STUDY REPORT April 2019 OFFICE LOCATIONS: Temecula –Headquarters 32605 Temecula Parkway, Suite 100 Temecula, CA 92592 San Francisco - Regional Office San Francisco, CA 94102 Davis - Regional Office Davis, CA 95616 Phone: 800.676.7516 www.nbsgov.com
Transcript of CITY OF MORGAN HILL

CITY OF MORGAN HILL _________________________
FINAL WASTEWATER RATE STUDY REPORT
April 2019
OFFICE LOCATIONS:
Temecula –Headquarters 32605 Temecula Parkway, Suite
100 Temecula, CA 92592
San Francisco - Regional Office
San Francisco, CA 94102
Davis - Regional Office Davis, CA 95616
Phone: 800.676.7516
www.nbsgov.com

Wastewater Rate Study Report – City of Morgan Hill Prepared by – April 2019
TABLE OF CONTENTS SECTION 1. PURPOSE AND OVERVIEW OF THE STUDY ......................................................................... 1
A. PURPOSE .........................................................................................................................1
B. OVERVIEW OF THE STUDY ................................................................................................1
C. RATE STUDY METHODOLOGY ...........................................................................................1
D. KEY FINANCIAL ASSUMPTIONS .........................................................................................2
SECTION 2. WASTEWATER RATE STUDY .............................................................................................. 3
A. KEY WASTEWATER RATE STUDY ISSUES ............................................................................3
B. WASTEWATER UTILITY REVENUE REQUIREMENTS .............................................................3
C. WASTEWATER CUSTOMER CHARACTERISTICS ...................................................................7
D. CURRENT VS. PROPOSED WASTEWATER RATES ................................................................8
SECTION 3. RECOMMENDATIONS AND NEXT STEPS........................................................................... 12
A. CONSULTANT RECOMMENDATIONS ............................................................................... 12
B. NEXT STEPS .................................................................................................................... 12
C. PRINCIPAL ASSUMPTIONS AND CONSIDERATIONS .......................................................... 12
APPENDIX – WASTEWATER RATE ANALYSIS ...................................................................................... 14

Wastewater Rate Study Report – City of Morgan Hill Prepared by – April 2019
This page intentionally left blank.

Wastewater Rate Study Report – City of Morgan Hill 1 Prepared by – April 2019
SECTION 1. PURPOSE AND OVERVIEW OF THE STUDY
A. PURPOSE In 2018, the City of Morgan Hill (“City”) retained NBS to complete an update of the wastewater rates most recently established in January 2016. The City is now in the in the fourth year of its most recent five-year rate plan, from the 2016 Wastewater Rate Study1 and unexpected capital improvement and rehabilitation projects have become necessary since rates were last updated. In light of these considerations, an updated rate study was needed in order to adjust rates so the City can fund the new capital improvement projects. In developing the updated wastewater rates, NBS and City Staff worked cooperatively to review study results and develop various rate alternatives. The study will be presented to the City Council on February 20, 2019. An overview of the study is provided in this report.
B. OVERVIEW OF THE STUDY As a part of the long-range financial plan, NBS evaluated projected revenues and expenditures to determine net revenue requirements. In light of the wastewater utility’s planned capital improvements, it will be critical to have a plan that maintains and replenishes reserve funds. While the wastewater utility has reasonably healthy reserves, they are not adequate to fund the wastewater treatment plant expansion and other repair and replacement projects. NBS recommends the City adopt the rate adjustments described in this report, as well as secure outside financing (as planned), to fully fund the capital improvements over the next five years.
C. RATE STUDY METHODOLOGY A comprehensive utility rate study typically has three major components: (1) the utility’s overall revenue requirements and financial plan, (2) the cost-of-service for each customer class, and (3) rate structure design, as shown in Figure 1. These components reflect industry standards, primarily from the American Water Works Association (AWWA)2, and address the general requirements for equity and fairness. This study focused on the first component of a rate study, the Financial Plan. NBS recommends that the City complete the other two components of a rate study, the Cost of Service and Rate Design Analyses in the next rate review cycle. The additional analysis is intended to ensure rates reflect the proportionate cost of service for each customer class, and that the rate structure is best suited to the City’s customers and reflect recent industry standards.
1 Referred to throughout this report as the “2016 Rate Study. “ 2 Principles of Water Rates, Fees, and Charges, Manual of Water Supply Practices, M1, AWWA, seventh edition, 2017.

Wastewater Rate Study Report – City of Morgan Hill 2 Prepared by – April 2019
Figure 1. Components of a Rate Study
The following sections in this report present an overview of the methodologies, assumptions, and data used along with the financial plans and rates developed.
D. KEY FINANCIAL ASSUMPTIONS Following are the key assumptions used in the wastewater rate analyses: Funding of Capital Projects – After extensive review of the planned capital improvement projects (CIP) and funding requirements with City staff, the analysis assumes that the City will acquire outside financing to fund the wastewater treatment plant expansion and its other planned capital improvement projects.
Reserve Targets – Target reserves for operations and maintenance (O&M) and capital system replacement, which essentially follow industry standards for utility fund management, are set at the following minimum levels:
Operating Reserve – 90-days of O&M expenses.
System Replacement Reserve – approximately 3.0% of net assets.
Rate Stabilization Reserve – equal to 20% of estimated rate revenue.
Inflation and Growth Projections – In order to project revenue requirements over the next five years, the City’s adopted budget for Fiscal Year 2018/19 was used as base planning year, and the following inflation factors were applied to revenue and expenses:
Customer growth is assumed to be 1.50% annually.
General cost inflation is approximately 2.44% annually.
Operating expenses, which include but are not limited to labor costs, health benefits, and retirement benefits, are inflated at a rate of approximately 3.5% to 5% annually.
Energy costs are expected to inflate at 4% annually.
No inflation is added to other costs.
The next two sections discuss the wastewater rate study in more detail.

Wastewater Rate Study Report – City of Morgan Hill 3 Prepared by – April 2019
SECTION 2. WASTEWATER RATE STUDY
A. KEY WASTEWATER RATE STUDY ISSUES
The specific objectives addressed in the wastewater rate analysis included:
Generating additional revenue needed to meet projected funding requirements.
Continuing the City’s existing rate structure which consists of a fixed monthly charge based on meter size, a volumetric charge for commercial customers that relies on monthly water use, and the volumetric charge for single and multi-family residential customer that is applied to average winter water use.
During the course of this study, NBS developed several financial plan alternatives that will allow the City to meet revenue requirements for the wastewater utility. The proposed rates presented in this report reflect input from City staff, which included the priority of maintaining the existing rate structure and applying an across-the-board increases to the existing rate schedule. The proposed rate structure for residential customers continues to include a fixed monthly charge plus a volumetric rate based on average winter water consumption. This average winter consumption is used to set the volumetric charge each year for the subsequent 12 months and, in this respect, acts like a fixed charge except that it varies based on each customer’s winter water consumption. The rate structure for commercial customers is similar, with a fixed monthly charge based on water meter size plus a volumetric rate based on monthly (not average winter) water consumption.
B. WASTEWATER UTILITY REVENUE REQUIREMENTS Rate increases are governed by the need to meet the operating and capital costs, debt service payments and reserves included in the revenue requirements. The current financial position of the City’s wastewater utility is as follows: Meeting Net Revenue Requirements: The City’s wastewater utility is projected to break even at year end. However, with the capital improvement plans over the next ten years, the City will run a large deficit starting in Fiscal Year 2019/20, without an adjustment to wastewater rates. The City is planning to secure outside financing in the form of bonds or loans to fund the necessary capital improvement projects. The proposed rate increases would stabilize this deficit over the next five years as well as cover the annual debt service payments for the two new debt issues. Net revenue requirements (i.e., total annual expenses less non-rate revenue) increase by approximately 40% in Fiscal Years 2018/19 through 2023/24 from approximately $10.6 million to $14.9 million.
Building and Maintaining Reserve Funds: The City should maintain sufficient reserves for the wastewater utility. NBS recommends that the City maintain the following minimum reserve fund targets, as established in the 2016 Rate Study:
Operating Reserve equal to 25% of the Utility’s budgeted annual operating expenses. This
reserve target is equal to a three-month (or 90-day) cash cushion for normal operations. An Operating Reserve is intended to promote financial viability in the event of any short-term fluctuation in revenues and/or expenditures.

Wastewater Rate Study Report – City of Morgan Hill 4 Prepared by – April 2019
Capital Projects Reserve equal to a minimum of 3% of net depreciable capital assets. This reserve provides for capital repair and replacement needs.
Rate Stabilization Reserve equal to 20% of estimated annual rate revenue, as established by prior City policy. This reserve is used when operating reserves are low and is intended to further promote financial stability in the event of short-term fluctuations in rate revenue.
Debt Reserve equal to the estimated reserve requirement for the planned debt that the City would use to fund capital projects, which is approximately $2,100,000 annually.
Figures 2 and 3 summarize the sources and uses of funds, including net revenue requirements, and the recommended annual percent increases in total rate revenue for the next five years. This figure shows the new debt service payments that begin in Fiscal Year 2020/21, for the debt funded capital improvement projects. Going forward however, the City will be positioned to maintain healthy reserve funds for the future. With the planned rate increases, the City is projected to run a small surplus each year, which will be used to replenish reserve funds, with the intent of meeting the reserve targets described above.
Figure 2. Summary of Revenue Requirements
Budget
FY 2018/19 FY 2019/20 FY 2020/21 FY 2021/22 FY 2022/23 FY 2023/24
Sources of Wastewater Funds
Rate Revenue Under Prevailing Rates 1 10,391,000$ 10,796,865$ 10,958,818$ 11,123,200$ 11,290,048$ 11,459,399$
Other Operating Revenue 318,700 328,660 336,877 345,298 353,932 362,779
Interest Earnings 96,002 164,115 192,054 198,320 215,765 251,014
Use of Impact Fees for Debt Service 232,695 232,635 2,732,740 2,732,980 2,714,020 2,566,255
Total Sources of Funds 11,038,397$ 11,522,275$ 14,220,488$ 14,399,798$ 14,573,765$ 14,639,447$
Uses of Wastewater Funds
Operating Expenses 9,051,382$ 9,177,519$ 9,423,428$ 9,760,289$ 9,931,201$ 10,401,015$
Debt Service 1,939,125 1,938,625 1,939,500 1,941,500 1,783,500 552,125
Planned Debt Service 2- - 4,600,279 4,600,279 4,600,279 4,600,279
Total Use of Funds 10,990,507$ 11,116,144$ 15,963,207$ 16,302,068$ 16,314,980$ 15,553,419$
Surplus (Deficiency) before Rate Increase 47,890$ 406,131$ (1,742,719)$ (1,902,271)$ (1,741,215)$ (913,972)$
Additional Revenue from Rate Increases - 949,218 2,013,623 2,689,301 3,417,554 4,201,961
Surplus (Deficiency) after Rate Increase 47,890$ 1,355,349$ 270,904$ 787,031$ 1,676,339$ 3,287,989$
Projected Annual Increase to Rate Revenue 3 0.00% 9.00% 9.00% 5.00% 5.00% 5.00%
Net Revenue Requirement 4 10,575,805$ 10,623,369$ 15,434,277$ 15,758,451$ 15,745,283$ 14,939,626$
Projected Debt Coverage After Rate Increase 1.65 2.22 1.76 1.90 2.13 3.15
Debt Coverage Requirement 1.25 1.25 1.25 1.25 1.25 1.25 1. Includes additional rate revenue from removal of consumption cap.
2. The City plans to secure two debt issues to fund the wastewater treatment plant expansion and other capital improvement projects; this is the approx. annual payment.
3. Rate adjustments will be effective on July 1st of each year.
4. Total Use of Funds less non-rate revenues and interest earnings. This is the annual amount needed from sewer rates.
Summary of Sources and Uses of Funds and
Net Revenue Requirements
Projected

Wastewater Rate Study Report – City of Morgan Hill 5 Prepared by – April 2019
Figure 3. Summary Revenue Requirements
Figures 4 and 5 summarize the projected reserve fund balances and reserve targets, for the next five years. These figures show that if the proposed rate increases are adopted, and the new debt financing for capital projects are secured, the City will be able to maintain healthy reserve funds for the wastewater utility.
Figure 4. Summary of Projected Reserve Fund Balances and Targets
Budget
FY 2018/19 FY 2019/20 FY 2020/21 FY 2021/22 FY 2022/23 FY 2023/24
Sewer Operations Fund (640) 2,081,319$ 2,294,000$ 2,356,000$ 2,440,000$ 2,483,000$ 2,600,000$
Recommended Minimum Target 2,263,000 2,294,000 2,356,000 2,440,000 2,483,000 2,600,000
Sewer System Replacement Fund (643) 4,046,243$ 5,188,911$ 5,397,816$ 6,142,852$ 7,818,197$ 4,013,187$
Recommended Minimum Target 1,857,900 2,077,900 2,503,000 3,102,100 3,621,100 4,014,300
Rate Stabilization Fund (642) 2,078,200$ 2,119,764$ 2,162,159$ 2,205,402$ 2,249,511$ 2,294,501$
Recommended Minimum Target 2,078,200 2,299,217 2,543,738 2,710,989 2,889,237 3,079,204
New Debt Reserve Fund -$ -$ 2,100,279$ 2,100,279$ 2,100,279$ 2,100,279$
Recommended Minimum Target - - 2,100,279 2,100,279 2,100,279 2,100,279
Total Ending Balance 8,205,762$ 9,602,675$ 12,016,255$ 12,888,534$ 14,650,987$ 11,007,967$
Total Recommended Minimum Target 6,199,100$ 6,671,117$ 9,503,018$ 10,353,368$ 11,093,616$ 11,793,783$
Beginning Reserve Fund Balances and
Recommended Reserve Targets
Projected

Wastewater Rate Study Report – City of Morgan Hill 6 Prepared by – April 2019
Figure 5. Summary of Projected Reserve Fund Balances and Targets
A more detailed version of the wastewater utility’s proposed 5-year financial plan is included in the Appendix to this report. These tables include a projection of revenue requirements, reserve funds, revenue sources and proposed rate increases for the 5-year period, through FY 2023/24.

Wastewater Rate Study Report – City of Morgan Hill 7 Prepared by – April 2019
C. WASTEWATER CUSTOMER CHARACTERISTICS Water consumption data from July 2017 through June 2018 was used to estimate the flows to the City’s wastewater treatment plant. Residential bills reflect average winter consumption because it is correlated to the amount of residential effluent that is sent to the treatment plant. This winter average is then used to estimate the annual volume. Commercial volumetric charges are based on annual water use. Figure 6 shows the estimated wastewater flows produced by each customer class, which is how revenue from volumetric rates is collected.
Figure 6. Estimated Wastewater Flow by Customer Class
FY 2017/18
Avg. WINTER
Water Use
(hcf/month) 1
FY 2017/18
Annual Water
Consumption
(hcf) 1
Estimated
Annual Volume
(hcf/yr.) 2
Percent of
Annual Volume
Single Family 73,059 N/A 876,709 62.7%
Multi Family 19,637 N/A 235,646 16.9%
Commercial Flat N/A 959 959 0.1%
Commercial 1 N/A 29,067 29,067 2.1%
Commercial 2 N/A 88,637 88,637 6.3%
Commercial 3 N/A 65,495 65,495 4.7%
Commercial 4 N/A 31,824 31,824 2.3%
Commercial 5 N/A 12,866 12,866 0.9%
Commercial 6 N/A 56,571 56,571 4.0%
Total 92,696 285,419 1,397,774 100%
1. Consumption data source file: MorganHill_CustomerBillingData_ManipulatedV5.xlsx
2. Estimated annual volume is based on average winter water consumption for SFR and MFR Water customers,
and is equal to the annual water consumption for commercial customers.
Customer Class

Wastewater Rate Study Report – City of Morgan Hill 8 Prepared by – April 2019
Figure 7 compares the total number of accounts by water meter size and customer class. Fixed charges are determined by customer class and meter size.
Figure 7. Number of Accounts by Meter Size and Customer Class
D. CURRENT VS. PROPOSED WASTEWATER RATES As mentioned earlier in this study, the City has chosen to maintain the existing rate structure. Single- and multi- family residential customers with meter sizes between 5/8-inch to 1-inch will pay a fixed monthly service charge, and a volumetric charge per hcf based on average winter water use. All other users will pay a fixed charge based on meter size and a volumetric rate based on actual monthly water consumption. There are six Commercial customer classifications that apply to volumetric rates (for all non-residential customers), that reflect the strength characteristics of each customer class. Figure 8 shows current and proposed wastewater rates for FY 2018/19 through FY 2022/24. Figure 9 compares the average monthly wastewater bills for residential customers under current and proposed rates. Figure 10 compares commercial bills under current vs. proposed rates, for a Commercial 2 customer, with a 1-inch meter. Bill comparisons for a greater range of commercial customers can be found in the Appendix.
5/8 to
3/4 inch 31 inch 4 1.5 inch 2 inch 3 inch 4 inch 6 inch Total
Single Family 2 - 9,673 - - - - - 9,673
Multi Family - 2,222 - 8 - 6 1 2,237
Commercial Flat - 2 - - - - - 2
Commercial 1 16 25 9 21 1 9 - 81
Commercial 2 74 163 55 86 2 2 1 383
Commercial 3 23 21 5 23 2 6 - 80
Commercial 4 11 12 26 47 2 3 - 101
Commercial 5 3 6 4 6 - - - 19
Commercial 6 18 37 21 21 - 2 - 99
Total 145 12,161 120 212 7 28 2 12,675
1. Number of accounts is from the Billed Consumption Report by Month spreadsheets. This is average meter count by size and
customer class for FY 2017/18. Source File: MorganHill_CustomerBillingData_ManipulatedV5.xlsx
2. Single Family meters are 5/8 to 1 inch size, per City customer data.
3. For commercial customers these meters are 5/8 to 3/4 inch, per City customer data.
4. Single Family meters are 5/8 to 1 inch size and Commercial meters are 1", per City's customer data.
Number of Accounts by
Customer Class and
Meter Size 1

Wastewater Rate Study Report – City of Morgan Hill 9 Prepared by – April 2019
Figure 8. Current vs. Proposed Wastewater Rates
7/1/2019 7/1/2020 7/1/2021 7/1/2022 7/1/2023
9.00% 9.00% 5.00% 5.00% 5.00%
Monthly Fixed Charges:
Residential (5/8-1 inch meters) $19.67 $21.44 $23.37 $24.54 $25.77 $27.05
All Other Customers:
5/8 inch $19.67 $21.44 $23.37 $24.54 $25.77 $27.05
3/4 inch $19.67 $21.44 $23.37 $24.54 $25.77 $27.05
1 inch $19.67 $21.44 $23.37 $24.54 $25.77 $27.05
1.5 inch $73.63 $80.26 $87.48 $91.85 $96.45 $101.27
2 inch $117.23 $127.78 $139.28 $146.25 $153.56 $161.24
3 inch $255.39 $278.38 $303.43 $318.60 $334.53 $351.26
4 inch $458.73 $500.02 $545.02 $572.27 $600.88 $630.93
6 inch $1,018.18 $1,109.82 $1,209.70 $1,270.18 $1,333.69 $1,400.38
8 inch $1,572.90 $1,714.46 $1,868.76 $1,962.20 $2,060.31 $2,163.33
10 inch $1,966.13 $2,143.08 $2,335.96 $2,452.76 $2,575.39 $2,704.16
Monthly Volumetric Charges:
$4.17 $4.55 $4.95 $5.20 $5.46 $5.74
$4.17 $4.55 $4.95 $5.20 $5.46 $5.74
Commercial 1 $3.99 $4.35 $4.74 $4.98 $5.23 $5.49
Commercial 2 $4.67 $5.09 $5.55 $5.83 $6.12 $6.42
Commercial 3 $5.68 $6.19 $6.75 $7.09 $7.44 $7.81
Commercial 4 $6.44 $7.02 $7.65 $8.03 $8.44 $8.86
Commercial 5 $7.65 $8.34 $9.09 $9.54 $10.02 $10.52
Commercial 6 $12.77 $13.92 $15.17 $15.93 $16.73 $17.56
1. Source file: 2016 Water and Wastewater Adopted Rates.pdf, Page 2.
2. Proposed rates will be effective on July 1st of each year.
Multi-Family
(Applied to Avg. Winter Water Use)
Commercial
(Applied to Monthly Water Use):
Sewer Rate Schedule
Current
Rates
Effective
1/1/19 1
Proposed Rates 2
Single-Family
(Applied to Avg. Winter Water Use)

Wastewater Rate Study Report – City of Morgan Hill 10 Prepared by – April 2019
Figure 9. Residential Wastewater Bill Comparison – Current vs. Proposed Rates

Wastewater Rate Study Report – City of Morgan Hill 11 Prepared by – April 2019
Figure 10. Commercial Wastewater Bill Comparison – Current vs. Proposed Rates

Wastewater Rate Study Report – City of Morgan Hill 12 Prepared by – April 2019
SECTION 3. RECOMMENDATIONS AND NEXT STEPS
A. CONSULTANT RECOMMENDATIONS
Over the last three years since the 2016 Rate Study was completed, the City of Morgan Hill has become aware of unexpected capital improvements that are needed to maintain current service levels and provide capacity for future customers. In light of these factors, NBS has updated the financial plan and rate analysis to develop a new five-year rate plan that will achieve the City’s funding objectives.
The following are NBS’ recommendations for the City following careful review of this report:
Approve and Accept This Study Report: NBS recommends the City Council formally approve and adopt this report, its recommendations, and accompanying appendix. This will document the rate study analyses and the basis for updated rates.
Complete a Legal Review: This rate study outlines proposed new rates. Particularly in light of changing legal requirements, these rates should be reviewed by competent legal counsel with respect to compliance with Proposition 218 and related State laws prior to adoption, including language for new resolutions and public notices required to implement these rates.
Implement Recommended Levels of Rate Increases and Proposed Rates: Based on the analysis presented in this report, the City Council should implement the rates proposed in this report for the next five years. These rate adjustments are structured to ensure that the financial health of the City’s wastewater utility is maintained.
Adopt Reserve Fund Targets: NBS recommends the City Council adopt the proposed reserve fund targets described in Section 2 of this report. The City should periodically evaluate reserve fund levels and make it a long-term goal to achieve and maintain these levels for the Operating, Capital, Rate Stabilization and Debt Reserves.
B. NEXT STEPS
Annually Review Rates and Revenue – Any time an Agency adopts new utility rates or rate structures, those new rates should be closely monitored over the next several years to ensure the revenue generated is sufficient to meet the annual revenue requirements. Changing economic, water consumption patterns, new regulatory mandates, and unplanned capital improvements all underscore the need for this annual review.
Note: The attached Technical Appendix provides more detailed information on the analysis of the wastewater revenue requirements that have been summarized in this report.
C. PRINCIPAL ASSUMPTIONS AND CONSIDERATIONS
In preparing this report and the recommendations included herein, NBS has relied on a number of principal assumptions and considerations with regard to financial matters, number of customer accounts, billing records, and other conditions and events that may occur in the future. This information and assumptions, including the City’s budgets and customer account information provided by City staff, are sources we believe to be reliable, although NBS has not independently verified this data. While we believe NBS’ use of such information and assumptions is reasonable for the purpose of this report and its recommendations, some assumptions will invariably not materialize as stated herein or may

Wastewater Rate Study Report – City of Morgan Hill 13 Prepared by – April 2019
vary significantly due to unanticipated events and circumstances. Therefore, the actual results can be expected to vary from those projected to the extent that actual future conditions differ from those assumed by us or provided to us by others

Wastewater Rate Study Report – City of Morgan Hill 14 Prepared by – April 2019
APPENDIX – WASTEWATER RATE ANALYSIS

CITY OF MORGAN HILL Financial Plan & Reserve SummaryWASTEWATER RATE STUDY
Financial Plan and Reserve Projections
TABLE 1 : FINANCIAL PLAN AND SUMMARY OF REVENUE REQUIREMENTS
Budget
FY 2018/19 FY 2019/20 FY 2020/21 FY 2021/22 FY 2022/23 FY 2023/24 FY 2024/25 FY 2025/26 FY 2026/27 FY 2027/28
Sources of Wastewater Funds 1
Sewer Operations Fund (640) Rate Revenue
Estimated Rate Revenue from Existing Rates 2 10,391,000$ 10,546,865$ 10,705,068$ 10,865,644$ 11,028,629$ 11,194,058$ 11,361,969$ 11,532,398$ 11,705,384$ 11,880,965$
Additional Revenue from Removal of Cons. Cap - 250,000 253,750 257,556 261,420 265,341 269,321 273,361 277,461 281,623 Non-Rate Revenue in Operations & System Replacement Funds
Other Operating Revenue 318,700 331,665 345,580 360,109 375,284 391,130 407,682 424,968 443,024 461,887
Interest Earnings (in Operating & Unrestricted ) 3 96,002 164,115 192,114 198,555 216,301 251,988 179,714 165,038 171,998 235,924
Use of Impact Fee Fund for Debt Service 4 232,695 232,635 2,732,740 2,732,980 2,714,020 2,566,255 2,566,210 2,566,075 2,565,640 2,565,700
Total Sources of Funds 11,038,397$ 11,525,280$ 14,229,252$ 14,414,844$ 14,595,654$ 14,668,773$ 14,784,896$ 14,961,840$ 15,163,508$ 15,426,099$
Uses of Wastewater Funds
Operating Expenses 5
Sewer Operations
Salaries 2,089,145$ 2,170,633$ 2,255,368$ 2,330,248$ 2,404,964$ 2,477,810$ 2,551,206$ 2,623,306$ 2,697,605$ 2,774,179$
Supplies (incl. Treatment by SCRWA) 5,105,942 5,355,221 5,489,103 5,626,328 5,766,984 5,911,165 6,058,943 6,210,415 6,365,675 6,524,817
Capital 345,000 120,250 107,881 110,579 113,343 116,176 119,080 122,057 125,109 128,237
Internal Services 629,976 631,031 649,545 667,256 685,481 704,241 723,550 743,428 763,891 784,959
Transfers 867,302 885,766 906,484 1,010,456 944,621 1,048,699 1,068,112 1,087,554 1,197,635 1,218,381
Rate Stabilization Fund (Internal Services, GF Admin) 1,027 1,078 1,111 1,138 1,167 1,196 1,226 1,257 1,288 1,320
System Replace. Fund (Debt Service Fees, GF Admin) 12,990 13,540 13,936 14,284 14,641 15,008 15,383 15,767 16,161 16,565
Master Plan O&M Projects -Sewer System CCTV - - - - - 126,720 129,812 132,979 136,224 139,548
Subtotal: Operating Expenses 9,051,382$ 9,177,519$ 9,423,428$ 9,760,289$ 9,931,201$ 10,401,015$ 10,667,312$ 10,936,763$ 11,303,588$ 11,588,006$
Other Expenditures:
Existing Debt Service (Operations & Replacement Fund) 1,939,125$ 1,938,625$ 1,939,500$ 1,941,500$ 1,783,500$ 552,125$ 551,750$ 550,625$ 547,000$ 547,500$
Planned Debt Service for Treatment Plant Expansion - - 2,500,000 2,500,000 2,500,000 2,500,000 2,500,000 2,500,000 2,500,000 2,500,000
Future Debt Service for Master Plan Projects - - 2,100,279 2,100,279 2,100,279 2,100,279 2,100,279 2,100,279 2,100,279 2,100,279
Rate-Funded Capital Expenses - - - - - - - - - -
Subtotal: Other Expenditures 1,939,125$ 1,938,625$ 6,539,779$ 6,541,779$ 6,383,779$ 5,152,404$ 5,152,029$ 5,150,904$ 5,147,279$ 5,147,779$
Total Uses of Wastewater Funds 10,990,507$ 11,116,144$ 15,963,207$ 16,302,068$ 16,314,980$ 15,553,419$ 15,819,341$ 16,087,668$ 16,450,867$ 16,735,785$
plus: Revenue from Rate Increases 6 - 949,218 2,013,623 2,689,301 3,417,554 4,201,961 4,264,991 4,328,966 4,393,900 4,459,809
Increase/(Decrease) to Reserves 47,890$ 1,358,354$ 279,668$ 802,077$ 1,698,228$ 3,317,315$ 3,230,545$ 3,203,138$ 3,106,541$ 3,150,123$
Net Revenue Req't. (Total Uses less Non-Rate Revenue) 10,575,805$ 10,620,364$ 15,425,514$ 15,743,404$ 15,723,395$ 14,910,301$ 15,231,945$ 15,497,662$ 15,835,845$ 16,037,974$
Total Rate Revenue After Rate Increases 10,391,000$ 11,496,083$ 12,718,691$ 13,554,945$ 14,446,183$ 15,396,019$ 15,626,960$ 15,861,364$ 16,099,285$ 16,340,774$
Projected Annual Rate Revenue Increase 0.00% 9.00% 9.00% 5.00% 5.00% 5.00% 0.00% 0.00% 0.00% 0.00%
Cumulative Increase from Annual Revenue Increases 0.00% 9.00% 18.81% 24.75% 30.99% 37.54% 37.54% 37.54% 37.54% 37.54%
Debt Coverage After Rate Increase 7 1.65 2.22 1.76 1.91 2.13 3.16 3.14 3.13 3.14 3.16
Target Debt Coverage 1.25 1.25 1.25 1.25 1.25 1.25 1.25 1.25 1.25 1.25
RATE REVENUE REQUIREMENTS SUMMARY Projected
NBS - Local Government Solutions
Web: www.nbsgov.com Toll-Free 800.676.7516
Financial Plan
Page 1 of 26

CITY OF MORGAN HILL Financial Plan & Reserve SummaryWASTEWATER RATE STUDY
Financial Plan and Reserve Projections
TABLE 2 : RESERVE FUND SUMMARY
Budget
FY 2018/19 FY 2019/20 FY 2020/21 FY 2021/22 FY 2022/23 FY 2023/24 FY 2024/25 FY 2025/26 FY 2026/27 FY 2027/28
Total Beginning Cash 1 30,717,925$
Sewer Operations Fund (640)
Beginning Reserve Balance 1 1,505,059$ 2,081,319$ 2,294,000$ 2,356,000$ 2,440,000$ 2,483,000$ 2,600,000$ 2,667,000$ 2,734,000$ 2,826,000$
Plus: Net Cash Flow (After Rate Increases) 47,890 1,358,354 279,668 802,077 1,698,228 3,317,315 3,230,545 3,203,138 3,106,541 3,150,123
Plus: Transfer of Rate Stabilization Fund Surplus 528,370 - - - - - - - - -
Plus: Transfer of Surplus in Bond Debt Reserve - - - 42,006 42,006 42,006 42,006 42,006 42,006 42,006
Less: Transfer Out to Rate Stabilization Fund - - - - - - - - - -
Less: Transfer Out to Sewer Capital Project Fund - (1,145,674) (217,668) (760,083) (1,697,234) (3,242,320) (3,205,551) (3,178,144) (3,056,546) (3,121,128)
Ending Operating Fund Balance 2,081,319$ 2,294,000$ 2,356,000$ 2,440,000$ 2,483,000$ 2,600,000$ 2,667,000$ 2,734,000$ 2,826,000$ 2,897,000$
Target Ending Balance (90-days of O&M) 2,263,000$ 2,294,000$ 2,356,000$ 2,440,000$ 2,483,000$ 2,600,000$ 2,667,000$ 2,734,000$ 2,826,000$ 2,897,000$
Sewer Capital Projects Fund (643)
Beginning Reserve Balance 1 10,733,194$ 4,046,243$ 5,191,916$ 5,409,584$ 6,169,667$ 7,866,900$ 4,091,216$ 3,244,511$ 3,478,706$ 6,535,252$
Plus: Grant Proceeds - - - - - - - - - -
Plus: Transfer of Operating Fund Surplus - 1,145,674 217,668 760,083 1,697,234 3,242,320 3,205,551 3,178,144 3,056,546 3,121,128
Less: Use of Reserves for Capital Projects (6,686,951) - - - - (7,018,005) (4,052,255) (2,943,949) - (521,909)
Ending Capital Projects Fund Balance 4,046,243$ 5,191,916$ 5,409,584$ 6,169,667$ 7,866,900$ 4,091,216$ 3,244,511$ 3,478,706$ 6,535,252$ 9,134,471$
Target Ending Balance (3% of Assets) 2 1,857,900$ 2,077,900$ 2,503,000$ 3,102,100$ 3,621,100$ 4,014,300$ 4,016,600$ 4,034,200$ 3,929,900$ 3,844,500$
Sewer Rate Stabilization Fund (642)
Beginning Reserve Balance 1 2,567,929$ 2,078,200$ 2,119,764$ 2,162,159$ 2,205,402$ 2,249,511$ 2,294,501$ 2,340,391$ 2,387,199$ 2,434,943$
Plus: Contributions from Sewer Operations Fund - - - - - - - - - -
Plus: Interest Earnings 3 38,641 41,564 42,395 43,243 44,108 44,990 45,890 46,808 47,744 48,699
Plus: Other Rate Stabilization Fund Revenue - - - - - - - - - -
Less: Transfer of Surplus to Operating Fund (528,370) - - - - - - - - -
Ending Sewer Rate Stabilization Reserve Balance 2,078,200$ 2,119,764$ 2,162,159$ 2,205,402$ 2,249,511$ 2,294,501$ 2,340,391$ 2,387,199$ 2,434,943$ 2,483,641$
Target Ending Balance (20% of Estimated Rate Revenue) 2,078,200$ 2,299,217$ 2,543,738$ 2,710,989$ 2,889,237$ 3,079,204$ 3,125,392$ 3,172,273$ 3,219,857$ 3,268,155$
Ending Balance - Excludes Restricted Reserves 8,205,762$ 9,605,680$ 9,927,743$ 10,815,069$ 12,599,411$ 8,985,716$ 8,251,902$ 8,599,904$ 11,796,195$ 14,515,113$
Min. Target Ending Balance - Excludes Restricted Reserves 6,199,100$ 6,671,117$ 7,402,738$ 8,253,089$ 8,993,337$ 9,693,504$ 9,808,992$ 9,940,473$ 9,975,757$ 10,009,655$
Ending Surplus/(Deficit) Compared to Reserve Targets 2,006,662$ 2,934,564$ 2,525,005$ 2,561,980$ 3,606,074$ (707,788)$ (1,557,090)$ (1,340,568)$ 1,820,438$ 4,505,458$
Days Cash on Hand 4 273 316 262 278 324 244 220 225 301 362
ProjectedSUMMARY OF CASH ACTIVITY
NBS - Local Government Solutions
Web: www.nbsgov.com Toll-Free 800.676.7516
Financial Plan
Page 2 of 26

CITY OF MORGAN HILL Financial Plan & Reserve SummaryWASTEWATER RATE STUDY
Financial Plan and Reserve Projections
TABLE 3: RESERVE FUND SUMMARY, continued
BudgetFY 2018/19 FY 2019/20 FY 2020/21 FY 2021/22 FY 2022/23 FY 2023/24 FY 2024/25 FY 2025/26 FY 2026/27 FY 2027/28
Restricted Reserves:Impact Fee Fund (641)
Beginning Reserve Balance 7 15,911,743$ 19,731,924$ 23,740,207$ 23,002,469$ 17,387,035$ 10,464,784$ 3,684,800$ 3,981,794$ 2,644,196$ 2,504,839$
Plus: Interest Earnings 3 215,856 394,638 474,804 460,049 347,741 209,296 73,696 79,636 52,884 50,097
Plus: Impact Fee Revenue 5 4,717,263 4,801,041 2,951,607 3,561,567 3,640,401 3,721,205 3,000,000 3,000,000 3,000,000 3,000,000
Plus: Other Impact Fee Fund Revenue - - - - - - - - - -
Less: Annual Operating Expenditures (70,671) (73,395) (75,323) (77,013) (78,747) (80,522) (82,343) (84,209) (86,122) (88,082)
Less: Use of Reserves for Capital Projects (809,572) (881,367) (1,356,086) (6,827,058) (8,117,625) (8,063,708) (128,149) (1,766,949) (540,479) (556,693)
Less: Debt Service (Impact Fee Fund Allocation) (232,695) (232,635) (2,732,740) (2,732,980) (2,714,020) (2,566,255) (2,566,210) (2,566,075) (2,565,640) (2,565,700)
Ending Impact Fee Fund Balance 19,731,924$ 23,740,207$ 23,002,469$ 17,387,035$ 10,464,784$ 3,684,800$ 3,981,794$ 2,644,196$ 2,504,839$ 2,344,461$
Bond Project Fund
Beginning Reserve Balance -$ -$ 46,669,771$ 31,311,392$ 15,007,474$ 2,126,706$ (0)$ (0)$ (0)$ (0)$
Plus: New SRF Loan Proceeds - - - - - - - - - -
Plus: New Revenue Bond Proceeds - 55,231,511 - - - - - - - -
Less: Use of Bond & Loan Funds for Capital Projects - (8,561,740) (15,358,379) (16,303,917) (12,880,769) (2,126,706) - - - -
Ending Bond Project Fund Balance -$ 46,669,771$ 31,311,392$ 15,007,474$ 2,126,706$ (0)$ (0)$ (0)$ (0)$ (0)$
Target Ending Balance -$ -$ -$ -$ -$ -$ -$ -$ -$ -$
New Debt Reserve
Beginning Reserve Balance -$ -$ -$ 2,100,279$ 2,100,279$ 2,100,279$ 2,100,279$ 2,100,279$ 2,100,279$ 2,100,279$
Plus: Reserve Funding from New Debt Obligations - - 2,100,279 - - - - - - -
Plus: Interest Earnings - - - 42,006 42,006 42,006 42,006 42,006 42,006 42,006
Less: Transfer of Surplus to Operating Reserve - - - (42,006) (42,006) (42,006) (42,006) (42,006) (42,006) (42,006)
Ending Debt Reserve Balance -$ -$ 2,100,279$ 2,100,279$ 2,100,279$ 2,100,279$ 2,100,279$ 2,100,279$ 2,100,279$ 2,100,279$
Target Ending Balance -$ -$ 2,100,279$ 2,100,279$ 2,100,279$ 2,100,279$ 2,100,279$ 2,100,279$ 2,100,279$ 2,100,279$
Annual Interest Earnings Rate 6 2.00% 2.00% 2.00% 2.00% 2.00% 2.00% 2.00% 2.00% 2.00% 2.00%1. Total beginning cash is the sum of the cash balances in Funds 640, 642, and 643, as of 06/30/2018. Source file: trial balances fy17-18 fund 640 through 643 revised 020619.pdf.
2. The Sewer System Replacement reserve target is set to 3% of net assets.
3. Interest earnings for FY 2018/19 are projected in City budgets and are calculated thereafter. Calculations found in source file: Item 1, 2, 3, 12 Wastewater Rate Study Data_jt.manipulated.xlsx.
4. Days cash on hand represents the number of days cash the City has available to cover operating expenses and debt service payments.
5. Impact fee revenue projections for FY 2018/19 - 2019/20 are from the following file: Item 1, 2, 3, 12 Wastewater Rate Study Data.xlsx
6. Interest earning rates were provided by City staff on 1/28/19 conference call.
7. Beginning cash balance for Impact Fee Fund (641) found in source file: trial balances fy17-18 fund 640 through 643 revised 092618.pdf, Page 5.
SUMMARY OF CASH ACTIVITY, continuedProjected
NBS - Local Government Solutions
Web: www.nbsgov.com Toll-Free 800.676.7516
Financial Plan
Page 3 of 26

CITY OF MORGAN HILLWASTEWATER RATE STUDYRate Adjustment Charts and Report Tables
CHART 1
$.Mil.
$5.Mil.
$10.Mil.
$15.Mil.
$20.Mil.
$25.Mil.
2019 2020 2021 2022 2023 2024 2025 2026 2027 2028
An
nu
al O
blig
atio
ns
Fiscal Year Ending June 30
Wastewater Revenue Requirements vs.Revenue From Existing and Increased Rates
Cash-Funded Capital Expenses
Debt Service
O&M Expenses
Revenues under Existing Rates
Revenues under Increased Rates
NBS - Local Government Solutions
Web: www.nbsgov.com Toll-Free 800.676.7516
Charts and Tables
Page 4 of 26

CITY OF MORGAN HILLWASTEWATER RATE STUDYRate Adjustment Charts and Report Tables
CHART 2
1.65
2.22
1.76
1.91
2.13
3.16 3.14 3.13 3.14 3.16
0.00
0.50
1.00
1.50
2.00
2.50
3.00
3.50
2019 2020 2021 2022 2023 2024 2025 2026 2027 2028
De
bt
Co
vera
ge R
atio
Fiscal Year Ending June 30
Debt Coverage Ratios
Debt Coverage After Rate Increase Target Debt Coverage
NBS - Local Government Solutions
Web: www.nbsgov.com Toll-Free 800.676.7516
Charts and Tables
Page 5 of 26

CITY OF MORGAN HILLWASTEWATER RATE STUDYRate Adjustment Charts and Report Tables
CHART 3
$.Mil.
$2.Mil.
$4.Mil.
$6.Mil.
$8.Mil.
$10.Mil.
$12.Mil.
$14.Mil.
$16.Mil.
$18.Mil.
2019 2020 2021 2022 2023 2024 2025 2026 2027 2028
End
ing
Cas
h B
alan
ce
Fiscal Year Ending June 30
Ending Cash Balances vs.Recommended Reserve Targets
Projected Ending Cash Reserve Balance
Recommended Minimum Reserve Target
City's Minimum Reserve Target
Note: cash reserve balance and targets include funds 640, 642, 643 and the new debt reserve.
NBS - Local Government Solutions
Web: www.nbsgov.com Toll-Free 800.676.7516
Charts and Tables
Page 6 of 26

CITY OF MORGAN HILLWASTEWATER RATE STUDYRate Adjustment Charts and Report Tables
CHART 4
0%
9% 9%
5% 5% 5%
0% 0% 0% 0%0%
1%
2%
3%
4%
5%
6%
7%
8%
9%
10%
2019 2020 2021 2022 2023 2024 2025 2026 2027 2028
Fiscal Year Ending June 30
Projected Increases to Rate Revenue
NBS - Local Government Solutions
Web: www.nbsgov.com Toll-Free 800.676.7516
Charts and Tables
Page 7 of 26

CITY OF MORGAN HILL EXHIBIT 1WASTEWATER RATE STUDYOperating Revenue and Expenses
TABLE 4 : REVENUE FORECAST 1
SOURCES OF REVENUE Basis 2019 2020 2021 2022 2023 2024 2025 2026 2027 2028
Sewer Operations Fund (640)
INTEREST INCOME See FP 37,151$ -$ -$ -$ -$ -$ -$ -$ -$ -$
SEWER SERVICE FEES 1 10,391,000 10,546,865 10,705,068 10,865,644 11,028,629 11,194,058 11,361,969 11,532,398 11,705,384 11,880,965
ADDITIONAL REVENUE FROM REMOVAL OF CAP 2
1 - 250,000 253,750 257,556 261,420 265,341 269,321 273,361 277,461 281,623
FRONT FOOTAGE/OFFSITE 2 61,200 62,500 64,063 65,664 67,306 68,988 70,713 72,481 74,293 76,150
UB COLLECTIONS 2 2,000 2,000 2,050 2,101 2,154 2,208 2,263 2,319 2,377 2,437
LIFT STATION CHARGES 4 237,500 248,805 260,648 273,055 286,052 299,668 313,933 328,876 344,530 360,930
UTILITY BILL DELINQ CHR 2 18,000 18,360 18,819 19,289 19,772 20,266 20,773 21,292 21,824 22,370
Subtotal: Sewer Ops Fund (640) 10,746,851$ 11,128,530$ 11,304,398$ 11,483,309$ 11,665,333$ 11,850,529$ 12,038,972$ 12,230,727$ 12,425,870$ 12,624,475$
Sewer Impact Fund (641)
INTEREST INCOME See FP 215,856 - - - - - - - - -
DEVELOPMENT IMPACT FEES (AB1600) 8 4,717,263 4,801,041 2,951,607 3,561,567 3,640,401 3,721,205 3,000,000 3,000,000 3,000,000 3,000,000
Subtotal: Sewer Imp. Fund (641) 4,933,119$ 4,801,041$ 2,951,607$ 3,561,567$ 3,640,401$ 3,721,205$ 3,000,000$ 3,000,000$ 3,000,000$ 3,000,000$
Sewer Rate Stabilization Fund (642)
INTEREST INCOME See FP 38,641 52,262 53,307 54,373 55,461 56,570 57,701 58,856 60,033 61,233
Subtotal: Swr. Rate Stab. Fund (642) 38,641$ 52,262$ 53,307$ 54,373$ 55,461$ 56,570$ 57,701$ 58,856$ 60,033$ 61,233$
Sewer System Replacement Fund (643)
INTEREST INCOME See FP 58,851 - - - - - - - - -
Subtotal: Swr. Sys. Rep. Fund (641) 58,851$ -$ -$ -$ -$ -$ -$ -$ -$ -$
TOTAL: REVENUE 15,777,462$ 15,981,833$ 14,309,312$ 15,099,249$ 15,361,195$ 15,628,304$ 15,096,673$ 15,289,583$ 15,485,903$ 15,685,708$
1. Data sources for the FY 2018/19 adopted budget is from the following files: Item 1, 2, 3, 12 Wastewater Rate Study Data.xlsx, and MorganHill_FY18-19_Budget.pdf, Page 91, 270 . Budget data for FY 2018/19 - FY 2027/28 is forecasted by the City.
Inflationary factors are applied to project revenue and expenses in all future years.
2. Per City Staff 1/7/19, increase in rate revenue due to removal of cap on consumption/volumetric charges.
NBS - Local Government Solutions
Web: www.nbsgov.com Toll-Free 800.676.7516
Exhibit 1 (O&M)
Page 8 of 26
CITY OF MORGAN HILL EXHIBIT 1WASTEWATER RATE STUDYOperating Revenue and Expenses
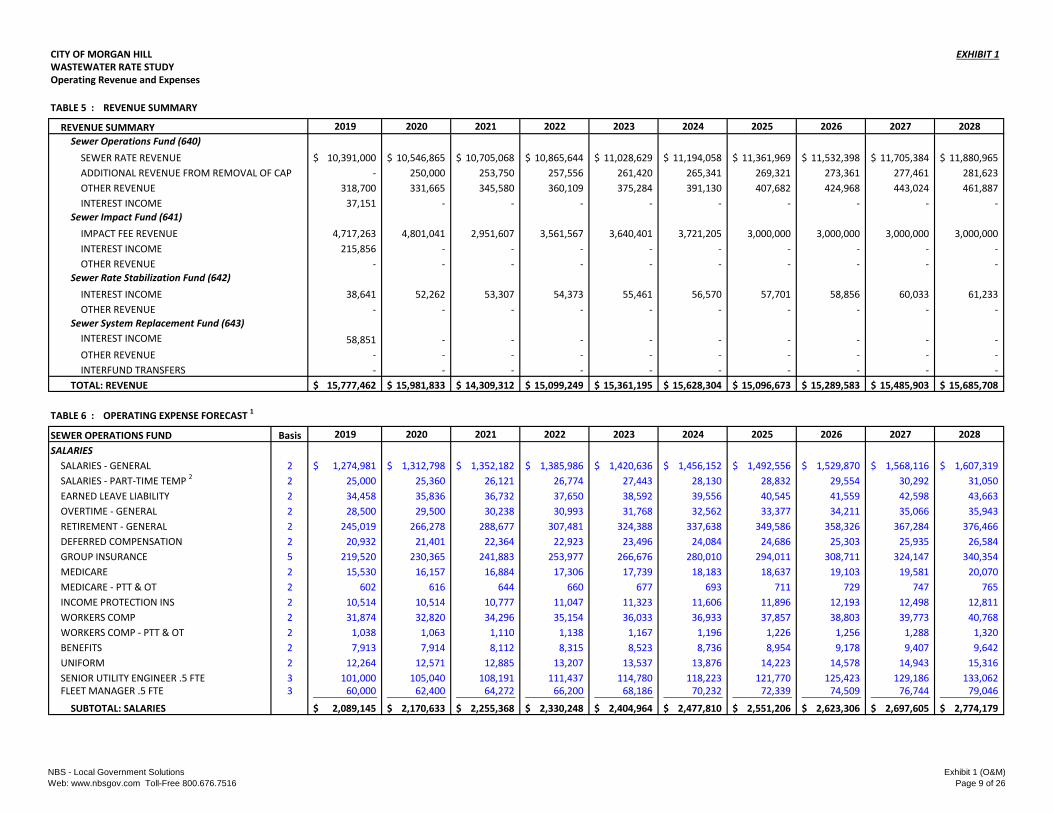
TABLE 5 : REVENUE SUMMARY
REVENUE SUMMARY 2019 2020 2021 2022 2023 2024 2025 2026 2027 2028
Sewer Operations Fund (640)
SEWER RATE REVENUE 10,391,000$ 10,546,865$ 10,705,068$ 10,865,644$ 11,028,629$ 11,194,058$ 11,361,969$ 11,532,398$ 11,705,384$ 11,880,965$
ADDITIONAL REVENUE FROM REMOVAL OF CAP - 250,000 253,750 257,556 261,420 265,341 269,321 273,361 277,461 281,623
OTHER REVENUE 318,700 331,665 345,580 360,109 375,284 391,130 407,682 424,968 443,024 461,887
INTEREST INCOME 37,151 - - - - - - - - -
Sewer Impact Fund (641)
IMPACT FEE REVENUE 4,717,263 4,801,041 2,951,607 3,561,567 3,640,401 3,721,205 3,000,000 3,000,000 3,000,000 3,000,000
INTEREST INCOME 215,856 - - - - - - - - -
OTHER REVENUE - - - - - - - - - -
Sewer Rate Stabilization Fund (642)
INTEREST INCOME 38,641 52,262 53,307 54,373 55,461 56,570 57,701 58,856 60,033 61,233
OTHER REVENUE - - - - - - - - - -
Sewer System Replacement Fund (643)
INTEREST INCOME 58,851 - - - - - - - - -
OTHER REVENUE - - - - - - - - - -
INTERFUND TRANSFERS - - - - - - - - - -
TOTAL: REVENUE 15,777,462$ 15,981,833$ 14,309,312$ 15,099,249$ 15,361,195$ 15,628,304$ 15,096,673$ 15,289,583$ 15,485,903$ 15,685,708$
TABLE 6 : OPERATING EXPENSE FORECAST 1
SEWER OPERATIONS FUND Basis 2019 2020 2021 2022 2023 2024 2025 2026 2027 2028
SALARIES
SALARIES - GENERAL 2 1,274,981$ 1,312,798$ 1,352,182$ 1,385,986$ 1,420,636$ 1,456,152$ 1,492,556$ 1,529,870$ 1,568,116$ 1,607,319$
SALARIES - PART-TIME TEMP 2
2 25,000 25,360 26,121 26,774 27,443 28,130 28,832 29,554 30,292 31,050
EARNED LEAVE LIABILITY 2 34,458 35,836 36,732 37,650 38,592 39,556 40,545 41,559 42,598 43,663
OVERTIME - GENERAL 2 28,500 29,500 30,238 30,993 31,768 32,562 33,377 34,211 35,066 35,943
RETIREMENT - GENERAL 2 245,019 266,278 288,677 307,481 324,388 337,638 349,586 358,326 367,284 376,466
DEFERRED COMPENSATION 2 20,932 21,401 22,364 22,923 23,496 24,084 24,686 25,303 25,935 26,584
GROUP INSURANCE 5 219,520 230,365 241,883 253,977 266,676 280,010 294,011 308,711 324,147 340,354
MEDICARE 2 15,530 16,157 16,884 17,306 17,739 18,183 18,637 19,103 19,581 20,070
MEDICARE - PTT & OT 2 602 616 644 660 677 693 711 729 747 765
INCOME PROTECTION INS 2 10,514 10,514 10,777 11,047 11,323 11,606 11,896 12,193 12,498 12,811
WORKERS COMP 2 31,874 32,820 34,296 35,154 36,033 36,933 37,857 38,803 39,773 40,768
WORKERS COMP - PTT & OT 2 1,038 1,063 1,110 1,138 1,167 1,196 1,226 1,256 1,288 1,320
BENEFITS 2 7,913 7,914 8,112 8,315 8,523 8,736 8,954 9,178 9,407 9,642
UNIFORM 2 12,264 12,571 12,885 13,207 13,537 13,876 14,223 14,578 14,943 15,316
SENIOR UTILITY ENGINEER .5 FTE (SHARED WITH WATER OPS)3 101,000 105,040 108,191 111,437 114,780 118,223 121,770 125,423 129,186 133,062 FLEET MANAGER .5 FTE (SHARED WITH WATER OPS)3 60,000 62,400 64,272 66,200 68,186 70,232 72,339 74,509 76,744 79,046
SUBTOTAL: SALARIES 2,089,145$ 2,170,633$ 2,255,368$ 2,330,248$ 2,404,964$ 2,477,810$ 2,551,206$ 2,623,306$ 2,697,605$ 2,774,179$
NBS - Local Government Solutions
Web: www.nbsgov.com Toll-Free 800.676.7516
Exhibit 1 (O&M)
Page 9 of 26

CITY OF MORGAN HILL EXHIBIT 1WASTEWATER RATE STUDYOperating Revenue and Expenses
TABLE 7 : OPERATING EXPENSE FORECAST, continued 1
SEWER OPERATIONS FUND, continued Basis 2019 2020 2021 2022 2023 2024 2025 2026 2027 2028
SUPPLIES
ELECTRIC 2 27,414 27,689 28,381 29,091 29,818 30,563 31,328 32,111 32,914 33,736
WATER/SEWER 2 4,796 5,026 5,152 5,280 5,412 5,548 5,686 5,829 5,974 6,124
TELEPHONE 2 19,570 20,157 20,661 21,177 21,707 22,250 22,806 23,376 23,960 24,559
GASOLINE & OIL 2 13,458 13,862 14,209 14,564 14,928 15,301 15,684 16,076 16,478 16,890
CONTRACT SERVICES 2 310,000 267,500 274,188 281,042 288,068 295,270 302,652 310,218 317,973 325,923
BANK CARD SERVICE FEES 2 500 500 513 525 538 552 566 580 594 609
RENTALS - OUTSIDE 2 2,781 2,871 2,943 3,016 3,092 3,169 3,248 3,329 3,413 3,498
STATIONERY & OFFICE SUPPLIES 2 3,250 3,500 3,588 3,677 3,769 3,863 3,960 4,059 4,160 4,264
COMPUTER HARDWARE-NON CAPITAL 2 8,919 9,186 9,416 9,651 9,892 10,140 10,393 10,653 10,919 11,192
COMPUTER SOFTWARE-NON CAPITAL 2 2,500 2,500 2,563 2,627 2,692 2,760 2,829 2,899 2,972 3,046
OTHER SUPPLIES 2 99,800 102,795 105,365 107,999 110,699 113,466 116,303 119,211 122,191 125,246
ADVERTISING 2 2,186 2,251 2,307 2,365 2,424 2,485 2,547 2,610 2,676 2,743
PHOTOCOPYING 2 530 530 543 557 571 585 600 615 630 646
POSTAGE & FREIGHT 2 279 288 295 303 310 318 326 334 342 351
PRINTING 2 1,673 1,723 1,766 1,810 1,855 1,902 1,949 1,998 2,048 2,099
AUTO MILEAGE 2 206 212 217 223 228 234 240 246 252 258
SEWER CHRGS MAINT/OPS (SCRWA) 2 4,339,302 4,618,421 4,733,882 4,852,229 4,973,534 5,097,873 5,225,319 5,355,952 5,489,851 5,627,098
WATER/SEWER MAINTENANCE SVS 2 115,250 118,708 121,676 124,718 127,836 131,031 134,307 137,665 141,107 144,634
SMALL TOOLS 2 4,460 4,594 4,709 4,827 4,947 5,071 5,198 5,328 5,461 5,597
OTHER EXPENSE 2 8,198 8,444 8,655 8,871 9,093 9,321 9,554 9,792 10,037 10,288
TRAINING & EDUCATION 2 10,900 10,900 11,173 11,452 11,738 12,032 12,332 12,641 12,957 13,281
CONFERENCE & MEETINGS 2 5,380 5,380 5,515 5,652 5,794 5,939 6,087 6,239 6,395 6,555
MEMBERSHIP & DUES 2 4,590 4,590 4,705 4,822 4,943 5,067 5,193 5,323 5,456 5,592
SUBSCRIPTION & PUBLICATIONS 2 200 200 205 210 215 221 226 232 238 244
MAINT - BLDGS/IMPROVEMENTS 2 10,000 10,300 10,558 10,821 11,092 11,369 11,654 11,945 12,243 12,550
MAINT - MACHINE/EQUIPMENT 2 48,000 49,440 50,676 51,943 53,241 54,573 55,937 57,335 58,769 60,238 MAINT - AUTO/TRUCKS 2 61,800 63,654 65,242 66,876 68,548 70,262 72,019 73,819 75,665 77,556
SUBTOTAL: SUPPLIES 5,105,942$ 5,355,221$ 5,489,103$ 5,626,328$ 5,766,984$ 5,911,165$ 6,058,943$ 6,210,415$ 6,365,675$ 6,524,817$
SUB-TOTAL: 7,195,087$ 7,525,854$ 7,744,471$ 7,956,576$ 8,171,948$ 8,388,975$ 8,610,149$ 8,833,721$ 9,063,280$ 9,298,996$
NBS - Local Government Solutions
Web: www.nbsgov.com Toll-Free 800.676.7516
Exhibit 1 (O&M)
Page 10 of 26

CITY OF MORGAN HILL EXHIBIT 1WASTEWATER RATE STUDYOperating Revenue and Expenses
TABLE 8 : OPERATING EXPENSE FORECAST, continued 1
SEWER OPERATIONS FUND, continued Basis 2019 2020 2021 2022 2023 2024 2025 2026 2027 2028
CAPITAL
MACHINERY/EQUIPMENT 2 75,000$ 77,250$ 79,181$ 81,161$ 83,190$ 85,270$ 87,401$ 89,586$ 91,826$ 94,122$
RADIO SYSTEM 2 135,000 3,000 3,075 3,152 3,231 3,311 3,394 3,479 3,566 3,655
WORK ORDER MANAGEMENT SYST. 2 135,000 25,000 25,625 26,266 26,922 27,595 28,285 28,992 29,717 30,460
COMPUTER EQUIPMENT 2 - 15,000 - - - - - - - - COMPUTER SOFTWARE 2 - - - - - - - - - -
SUBTOTAL: CAPITAL 345,000$ 120,250$ 107,881$ 110,579$ 113,343$ 116,176$ 119,080$ 122,057$ 125,109$ 128,237$
DEBT
SERVICE FEES 2 - - - - - - - -
INTERNAL SERVICES
GENERAL LIABILITY INSURANCE 5 53,072 55,726 58,512 61,437 64,509 67,735 71,122 74,678 78,412 82,332
BUILDING MAINT - CURRENT 2 60,061 50,695 51,963 53,262 54,593 55,958 57,357 58,791 60,261 61,767
BUILDING MAINT - FUTURE 3 1,691 1,742 1,794 1,848 1,904 1,961 2,019 2,080 2,142 2,207
FLEET REPLACEMENT 2 124,163 124,163 127,267 130,449 133,710 137,053 140,479 143,991 147,591 151,281
GIS 2 15,626 12,432 12,743 13,062 13,388 13,723 14,066 14,418 14,778 15,148
INFO SYSTEM SERVICES 2 120,947 119,136 122,115 125,168 128,297 131,504 134,792 138,162 141,616 145,156 GF ADMIN 2 254,416 267,137 275,151 282,030 289,080 296,307 303,715 311,308 319,091 327,068
SUBTOTAL: INTERNAL SERVICES 629,976$ 631,031$ 649,545$ 667,256$ 685,481$ 704,241$ 723,550$ 743,428$ 763,891$ 784,959$
TRANSFERS
TRANS. OUT-010 (GENERAL FUND)2 349,376 351,845 354,437 357,159 360,017 363,018 366,169 369,477 372,951 376,599
TRANS. OUT-232 (ENVIRONMENTAL PROGRAMS)2 97,689 101,327 104,990 108,224 111,459 114,632 117,832 120,992 124,241 127,584
TRANS. OUT - SWR RATE STABILIZE 2 - - - 85,000 - 85,000 85,000 85,000 175,000 175,000
TRANS. OUT-650 (WATER OPS)2 398,098 410,455 424,918 437,934 451,006 463,910 476,972 489,946 503,304 517,059 TRANS. OUT - EMP. BENEFITS FUND 3 22,139 22,139 22,139 22,139 22,139 22,139 22,139 22,139 22,139 22,139
SUBTOTAL: TRANSFERS 867,302$ 885,766$ 906,484$ 1,010,456$ 944,621$ 1,048,699$ 1,068,112$ 1,087,554$ 1,197,635$ 1,218,381$
SUB-TOTAL: 1,842,278$ 1,637,047$ 1,663,910$ 1,788,291$ 1,743,445$ 1,869,116$ 1,910,742$ 1,953,039$ 2,086,635$ 2,131,577$
TOTAL: SEWER OPS FUND (640), EXPENSES 9,037,365$ 9,162,901$ 9,408,381$ 9,744,867$ 9,915,393$ 10,258,091$ 10,520,891$ 10,786,760$ 11,149,915$ 11,430,573$
TABLE 9 : OPERATING EXPENSE FORECAST, continued 1
SEWER IMPACT FUND Basis 2019 2020 2021 2022 2023 2024 2025 2026 2027 2028
SUPPLIES
CONTRACT SERVICES 2 -$ -$ -$ -$ -$ -$ -$ -$ -$ -$
BANK CARD SERVICE FEES 2 8,500 8,500 8,713 8,930 9,154 9,382 9,617 9,857 10,104 10,356
INTERNAL SERVICES
GF ADMIN 2 54,471 57,195 58,910 60,383 61,893 63,440 65,026 66,652 68,318 70,026
TRANSFERS
TRANSFER OUT-207 (GENL PLAN UPDATE)2 7,700 7,700 7,700 7,700 7,700 7,700 7,700 7,700 7,700 7,700
TOTAL: SEWER IMP. FUND (641), EXPENSES 70,671$ 73,395$ 75,323$ 77,013$ 78,747$ 80,522$ 82,343$ 84,209$ 86,122$ 88,082$
NBS - Local Government Solutions
Web: www.nbsgov.com Toll-Free 800.676.7516
Exhibit 1 (O&M)
Page 11 of 26

CITY OF MORGAN HILL EXHIBIT 1WASTEWATER RATE STUDYOperating Revenue and Expenses
TABLE 10 : OPERATING EXPENSE FORECAST, continued 1
SEWER RATE STABILIZATION FUND Basis 2019 2020 2021 2022 2023 2024 2025 2026 2027 2028
INTERNAL SERVICES
GF ADMIN 2 1,027 1,078 1,111 1,138 1,167 1,196 1,226 1,257 1,288 1,320
TOTAL: SWR RATE STAB. (642), EXPENSES 1,027$ 1,078$ 1,111$ 1,138$ 1,167$ 1,196$ 1,226$ 1,257$ 1,288$ 1,320$
TABLE 11 : OPERATING EXPENSE FORECAST, continued 1
SEWER SYSTEM REPLACEMENT FUND Basis 2019 2020 2021 2022 2023 2024 2025 2026 2027 2028
DEBT
SERVICE FEES 8 2,000 2,000 2,050 2,101 2,154 2,208 2,263 2,319 2,377 2,437
INTERNAL SERVICES
GF ADMIN 2 10,990 11,540 11,886 12,183 12,487 12,800 13,120 13,448 13,784 14,128
TOTAL: SWR SYSTM REP. FUND (643), EXPENSES 12,990$ 13,540$ 13,936$ 14,284$ 14,641$ 15,008$ 15,383$ 15,767$ 16,161$ 16,565$
TABLE 12 : MASTER PLAN O&M PROJECTS
ADDITIONAL EXPENSES Basis 2019 2020 2021 2022 2023 2024 2025 2026 2027 2028
On-Going CCTV Sewer System (10 mi/year) 2 -$ -$ -$ -$ -$ 126,720$ 129,812 132,979 136,224 139,548
TOTAL: MASTER PLAN O&M PROJECTS -$ -$ -$ -$ -$ 126,720$ 129,812$ 132,979$ 136,224$ 139,548$
Grand Total: Operating Expenses 9,122,053$ 9,250,914$ 9,498,751$ 9,837,302$ 10,009,948$ 10,481,537$ 10,749,655$ 11,020,972$ 11,389,710$ 11,676,088$
TABLE 13 : FORECASTING ASSUMPTIONS
INFLATION FACTORS 5 2019 2020 2021 2022 2023 2024 2025 2026 2027 2028
1 Customer Growth - 1.50% 1.50% 1.50% 1.50% 1.50% 1.50% 1.50% 1.50% 1.50%
2 General Cost Inflation - 2.44% 2.44% 2.44% 2.44% 2.44% 2.44% 2.44% 2.44% 2.44%
3 Labor Cost Inflation - 3.55% 3.55% 3.55% 3.55% 3.55% 3.55% 3.55% 3.55% 3.55%
4 Lift Station Charges Inflation - - 3.60% 3.60% 3.60% 3.60% 3.60% 3.60% 3.60% 3.60%
5 Insurance Cost Inflation - 4.76% 4.76% 4.76% 4.76% 4.76% 4.76% 4.76% 4.76% 4.76%
6 Energy Cost Inflation - 4.00% 4.00% 4.00% 4.00% 4.00% 4.00% 4.00% 4.00% 4.00%
7 Other Cost Inflation - 2.00% 2.00% 2.00% 2.00% 2.00% 2.00% 2.00% 2.00% 2.00%
8 No Escalation - 0.00% 0.00% 0.00% 0.00% 0.00% 0.00% 0.00% 0.00% 0.00%1. Data sources for the FY 2018/19 adopted budget is from the following files: Item 1, 2, 3, 12 Wastewater Rate Study Data.xlsx, and MorganHill_FY18-19_Budget.pdf, Page 91, 270 . Budget data for FY 2018/19 - FY 2027/28 is forecasted by the City.
Inflationary factors are applied to project revenue and expenses in all future years.
2. Part time salaries include two line items in budget. Combined for this study. Source file: Item 1, 2, 3, 12 Wastewater Rate Study Data.xlsx, Tab 2.
3. Construction expenses are excluded from this analysis and are handled in Exhibit 2 (CIP).
4. The following revenues and expenses have been excluded from this analysis since they do not represent actual cash expenses,
or are handled in the model elsewhere (i.e. Debt is on Exhibit 3)
5. Inflation factors calculated by NBS off of District budget. Source file: Item 1, 2, 3, 12 Wastewater Rate Study Data_jt.manipulated.xlsx, Tabs 2 and 3.
NBS - Local Government Solutions
Web: www.nbsgov.com Toll-Free 800.676.7516
Exhibit 1 (O&M)
Page 12 of 26

CITY OF MORGAN HILL EXHIBIT 2WASTEWATER RATE STUDYCapital Improvement Plan Expenditures
TABLE 14 : CAPITAL FUNDING SUMMARY
CAPITAL FUNDING FORECAST Budget
FY 2018/19 FY 2019/20 FY 2020/21 FY 2021/22 FY 2022/23 FY 2023/24 FY 2024/25 FY 2025/26 FY 2026/27 FY 2027/28
Grants -$ -$ -$ -$ -$ -$ -$ -$ -$ -$
Use of SRF Loan Funding - - - - - - - - - -
Use of New Revenue Bond Proceeds 2 - 8,561,740 15,358,379 16,303,917 12,880,769 2,126,706 - - - -
Use of Impact Fee Reserves (Fund 641) 1 809,572 881,367 1,356,086 6,827,058 8,117,625 8,063,708 128,149 1,766,949 540,479 556,693
Use of Sewer System Replacement Reserve (Fund 643) 6,686,951 - - - - 7,018,005 4,052,255 2,943,949 - 521,909
Rate Revenue - - - - - - - - - -
Total Sources of Capital Funds 7,496,523$ 9,443,107$ 16,714,465$ 23,130,975$ 20,998,394$ 17,208,419$ 4,180,405$ 4,710,898$ 540,479$ 1,078,602$
Uses of Capital Funds:
Total Project Costs 7,496,523$ 9,443,107$ 16,714,465$ 23,130,975$ 20,998,394$ 17,208,419$ 4,180,405$ 4,710,898$ 540,479$ 1,078,602$
Capital Funding Surplus (Deficiency) -$ -$ -$ -$ -$ -$ -$ -$ -$ -$
New SRF Loan Funding -$ -$ -$ -$ -$ -$ -$ -$ -$ -$
New Revenue Bond Proceeds for Sewer Plant Expansion -$ 29,000,000$ -$ -$ -$ -$ -$ -$ -$ -$
New Revenue Bond Proceeds -$ 26,231,511$ -$ -$ -$ -$ -$ -$ -$ -$ 1. To the extent that impact fees are available, they will be used to fund project costs allocated to Fund 641 (Impact Fees)/Future customers.
2. Per email from City staff 10/23/2018, the City is planning to fund $29 million in treatment plant expansion costs with a revenue bond.
TABLE 15 : CAPITAL IMPROVEMENT PROGRAM FUNDING OPTIONS
Policy Choice : Funding from new bond proceeds for Fund 643 projects. 2019 2020 2021 2022 2023 2024 2025 2026 2027 2028
1 Full Funding of Capital Improvement Program -$ 8,072,490$ 4,749,379$ 7,146,865$ 6,262,777$ -$ -$ -$ -$ -$
2 $19M Funding of Capital Improvement Program (about 75%) -$ 4,750,000$ 4,750,000$ 4,750,000$ 4,750,000$ -$ -$ -$ -$ -$
3 $14M Funding of Capital Improvement Program (about 50%) -$ 3,500,000$ 3,500,000$ 3,500,000$ 3,500,000$ -$ -$ -$ -$ -$
4 $10M Funding of Capital Improvement Program (about 40%) -$ 2,500,000$ 2,500,000$ 2,500,000$ 2,500,000$ -$ -$ -$ -$ -$
1
Capital Improvement Program Funding Choice 2019 2020 2021 2022 2023 2024 2025 2026 2027 2028
Effective Annual Funding Amount -$ 8,072,490$ 4,749,379$ 7,146,865$ 6,262,777$ -$ -$ -$ -$ -$
Funding Sources:
Projected
Insert policy choice in box to right, based on options listed above:
NBS - Local Government Solutions
Web: www.nbsgov.com Toll-Free 800.676.7516
Exhibit 2 (CIP)
Page 13 of 26

CITY OF MORGAN HILL EXHIBIT 2WASTEWATER RATE STUDYCapital Improvement Plan Expenditures
TABLE 16 : CAPITAL IMPROVEMENT PROGRAM
Capital Improvement Program Costs (in Current-Year Dollars ) 2
Project Description Fund 2019 2020 2021 2022 2023 2024 2025 2026 2027 2028
Currently Planned Projects:
302018 Sewer System Repair and Replacements 643 40,000$ 5,869,869$ 3,713,267$ 4,396,786$ 2,393,700$ 2,393,700$ 2,393,700$ 2,393,700$ -$ -$
302m15 Vault Lining Project 643 25,000 - - - - - - - - -
302n15 Trouble Spot Evaluation and Repair 643 996,154 50,000 - - - - - - - -
302t17 East Dunne Ave & Tennant Ave Sewer Mains 643 2,285,000 1,600,000 - - - - - - - -
304k15 Lift Station Improvements 643 1,523,000 - - - - - - - - -
308A08 New Trunk Line - CIP Funded 643 137,500 162,500 250,000 2,068,608 2,318,608 2,318,608 - - - -
315006 Sewer Capacity - CIP Funded 643 525,297 - 438,478 - 452,088 - - - - -
317a18 Wastewater Planning 643 735,000 155,000 75,000 75,000 400,000 - - - - 400,000
303093 Sewer Plant Expansion (SCRWA) 643 420,000 475,000 10,000,000 8,380,000 5,880,000 3,176,000 1,000,000 - - -
303a11 Sewer Plant Improvements 641 351,394 368,196 357,721 41,900 8,380 - - - - -
308a08 New Trunk Line - Impact Funded 641 412,500 487,500 750,000 6,205,825 6,955,825 6,955,825 - - - -
315006 Sewer Capacity - Impact Funded 641 45,678 - 170,520 - 248,200 - - - - -
Master Plan Projects:
Pipeline Capacity Improvements 641 - - - - - - 107,323 1,436,691 426,659 426,659
Total: Capital Improvement Program Costs (Current-Year Dollars) 7,496,523$ 9,168,065$ 15,754,986$ 21,168,119$ 18,656,801$ 14,844,133$ 3,501,023$ 3,830,391$ 426,659$ 826,659$
Total: CIP Costs (Current Year) Paid with Impact Fees 641 809,572$ 855,696$ 1,278,241$ 6,247,725$ 7,212,405$ 6,955,825$ 107,323$ 1,436,691$ 426,659$ 426,659$
Total: CIP Costs (Current Year) Paid with Sewer CIP Fund 643 6,686,951$ 8,312,369$ 14,476,745$ 14,920,394$ 11,444,396$ 7,888,308$ 3,393,700$ 2,393,700$ -$ 400,000$
NBS - Local Government Solutions
Web: www.nbsgov.com Toll-Free 800.676.7516
Exhibit 2 (CIP)
Page 14 of 26

CITY OF MORGAN HILL EXHIBIT 2WASTEWATER RATE STUDYCapital Improvement Plan Expenditures
TABLE 17 : CAPITAL IMPROVEMENT PROGRAM
Capital Improvement Program Costs (in Future-Year Dollars ) 3
Project Description Fund 2019 2020 2021 2022 2023 2024 2025 2026 2027 2028
Currently Planned Projects:
302018 Sewer System Repair and Replacements 643 40,000$ 6,045,965$ 3,939,405$ 4,804,487$ 2,694,130$ 2,774,954$ 2,858,203$ 2,943,949$ -$ -$
302m15 Vault Lining Project 643 25,000 - - - - - - - - -
302n15 Trouble Spot Evaluation and Repair 643 996,154 51,500 - - - - - - - -
302t17 East Dunne Ave & Tennant Ave Sewer Mains 643 2,285,000 1,648,000 - - - - - - - -
304k15 Lift Station Improvements 643 1,523,000 - - - - - - - - -
308A08 New Trunk Line - CIP Funded 643 137,500 167,375 265,225 2,260,424 2,609,614 2,687,902 - - - -
315006 Sewer Capacity - CIP Funded 643 525,297 - 465,181 - 508,829 - - - - -
317a18 Wastewater Planning 643 735,000 159,650 79,568 81,955 450,204 - - - - 521,909
303093 Sewer Plant Expansion (SCRWA) 643 420,000 489,250 10,609,000 9,157,052 6,617,992 3,681,854 1,194,052 - - -
303a11 Sewer Plant Improvements 641 351,394 379,242 379,506 45,785 9,432 - - - - -
308a08 New Trunk Line - Impact Funded 641 412,500 502,125 795,675 6,781,273 7,828,842 8,063,708 - - - -
315006 Sewer Capacity - Impact Funded 641 45,678 - 180,905 - 279,351 - - - - -
Master Plan Projects:
Pipeline Capacity Improvements 641 - - - - - - 128,149 1,766,949 540,479 556,693
Total: Capital Improvement Program Costs (Future-Year Dollars) 7,496,523$ 9,443,107$ 16,714,465$ 23,130,975$ 20,998,394$ 17,208,419$ 4,180,405$ 4,710,898$ 540,479$ 1,078,602$
Total: CIP Costs (Future Years) Paid with Impact Fees 641 809,572$ 881,367$ 1,356,086$ 6,827,058$ 8,117,625$ 8,063,708$ 128,149$ 1,766,949$ 540,479$ 556,693$
Total: CIP Costs (Future Years) Paid with Sewer CIP 643 6,686,951$ 8,561,740$ 15,358,379$ 16,303,917$ 12,880,769$ 9,144,711$ 4,052,255$ 2,943,949$ -$ 521,909$
TABLE 18 : FORECASTING ASSUMPTIONS
Economic Variables 2019 2020 2021 2022 2023 2024 2025 2026 2027 2028
Annual Construction Cost Inflation, Per Engineering News Record 4 0.00% 3.00% 3.00% 3.00% 3.00% 3.00% 3.00% 3.00% 3.00% 3.00%
Cumulative Construction Cost Multiplier from 2019 1.00 1.03 1.06 1.09 1.13 1.16 1.19 1.23 1.27 1.30 1. Use of 2015 Revenue Bond Proceeds used for capital funding from last study.
2. Capital Improvement Program projects found in Source File: Item 13-CIP Projects-Adopted.pdf, Pages 79-102 and CIP - Wastewater.pdf.
Updated per City in source file: MorganHill_Wastewater Rate Model_01.18.19 vDat.pdf
3. Project costs are inflated by 3.00% per year, Engineering News Record estimates of construction cost inflation.
4. For reference purposes, the annual Construction Cost Inflation percentage is the 10 year average change in the Construction Cost Index for
for January 2008 to January 2018. Source: Engineering News Record website (http://enr.construction.com).
NBS - Local Government Solutions
Web: www.nbsgov.com Toll-Free 800.676.7516
Exhibit 2 (CIP)
Page 15 of 26

CITY OF MORGAN HILL EXHIBIT 3WASTEWATER RATE STUDYDebt Service
TABLE 19 : OPEN DEBT SERVICE
EXISTING & PLANNED DEBT OBLIGATIONS Budget
Annual Repayment Schedules: FY 2018/19 FY 2019/20 FY 2020/21 FY 2021/22 FY 2022/23 FY 2023/24 FY 2024/25 FY 2025/26 FY 2026/27 FY 2027/28
Sewer Revenue Bonds - 2015 - $15,690,000 1
Principal Payment 1,375,000$ 1,445,000$ 1,520,000$ 1,600,000$ 1,520,000$ 335,000$ 350,000$ 365,000$ 380,000$ 400,000$
Interest Payment 564,125 493,625 419,500 341,500 263,500 217,125 201,750 185,625 167,000 147,500
Subtotal: Annual Debt Service 1,939,125$ 1,938,625$ 1,939,500$ 1,941,500$ 1,783,500$ 552,125$ 551,750$ 550,625$ 547,000$ 547,500$
Coverage Requirement ($-Amnt. above annual payment) 2 125% 125% 125% 125% 125% 125% 125% 125% 125% 125%
Reserve Requirement (total fund balance) 3
-$ -$ -$ -$ -$ -$ -$ -$ -$ -$
Planned Bond Funding for Treatment Plant Expansion 4
Estimated Principal and Interest Payment - - 2,500,000 2,500,000 2,500,000 2,500,000 2,500,000 2,500,000 2,500,000 2,500,000
New Bond Proceeds for CIP 5
Principal Payment -$ -$ 365,680$ 387,621$ 410,878$ 435,531$ 461,662$ 489,362$ 518,724$ 549,847$
Interest Payment - - 1,734,599 1,712,659 1,689,401 1,664,749 1,638,617 1,610,917 1,581,555 1,550,432
Subtotal: Annual Debt Service -$ -$ 2,100,279$ 2,100,279$ 2,100,279$ 2,100,279$ 2,100,279$ 2,100,279$ 2,100,279$ 2,100,279$
Coverage Requirement ($-Amnt. above annual payment) 125% 125% 125% 125% 125% 125% 125% 125% 125% 125%
Reserve Requirement (total fund balance) -$ -$ 2,100,279$ 2,100,279$ 2,100,279$ 2,100,279$ 2,100,279$ 2,100,279$ 2,100,279$ 2,100,279$
Grand Total: Existing & Planned Annual Debt Service 1,939,125$ 1,938,625$ 6,539,779$ 6,541,779$ 6,383,779$ 5,152,404$ 5,152,029$ 5,150,904$ 5,147,279$ 5,147,779$
Grand Total: Existing Debt Reserve Target -$ -$ 2,100,279$ 2,100,279$ 2,100,279$ 2,100,279$ 2,100,279$ 2,100,279$ 2,100,279$ 2,100,279$ 1. The 2015 Sewer Bonds refunded the 2002 Bonds. File: Item 8 - Morgan Hill 2015 Bond Document.pdf and Item 1, 2, 3, 12 Wastewater Rate Study Data.xlsx, Tab 5.
2. The Coverage Requirement for the 2015 Sewer Bonds is at least equal to 125% of the Maximum Annual Debt Service,
taking into account all Parity Debt. Source file: 8. Bond Document- Morgan Hill Sewer Series 2015.pdf, Page 19.
3. There is no Reserve Requirement for the 2015 Sewer Bonds. Source file: 8. Bond Document- Morgan Hill Sewer Series 2015.pdf, Page 19.
4. Estimated debt service for treatment plant expansion per email from City Staff 10/23/2018. Assumes $29 million issue at 6%, with 20-year payoff.
5. This debt service is dependant on the funding option chosen in Exhibit 2 in cell D35.
Projected
NBS - Local Government Solutions
Web: www.nbsgov.com Toll-Free 800.676.7516
Exhibit 3 (Debt)
Page 16 of 26

CITY OF MORGAN HILL EXHIBIT 4WASTEWATER RATE STUDYProjected Water Rates Under Existing Rate Schedule
TABLE 20 : CURRENT WASTEWATER RATES
As of 4/1/16 As of 1/1/17 As of 1/1/18 As of 1/1/19 As of 1/1/20
Fixed Monthly Charge 2.0% 2.0% 2.0% 2.0%
Service Charge:
Residential (5/8-1 inch meters) $18.54 $18.91 $19.29 $19.67 $20.07
All Other Customers:
5/8 inch $18.54 $18.91 $19.29 $19.67 $20.07
3/4 inch $18.54 $18.91 $19.29 $19.67 $20.07
1 inch $18.54 $18.91 $19.29 $19.67 $20.07
1.5 inch $69.38 $70.77 $72.18 $73.63 $75.10
2 inch $110.47 $112.68 $114.93 $117.23 $119.58
3 inch $240.66 $245.47 $250.38 $255.39 $260.50
4 inch $432.27 $440.92 $449.73 $458.73 $467.90
6 inch $959.45 $978.64 $998.21 $1,018.18 $1,038.54
8 inch $1,482.18 $1,511.82 $1,542.06 $1,572.90 $1,604.36
10 inch $1,852.73 $1,889.78 $1,927.58 $1,966.13 $2,005.45
Variable Consumption Monthly Charge (per hcf)
Residential:
Residential - all units $3.93 $4.01 $4.09 $4.17 $4.25
Commercial: Customer Class
Churches/schools Commercial 1 $3.84 $3.91 $3.99 $4.07
Membership organizations Commercial 1 $3.84 $3.91 $3.99 $4.07
Governments Commercial 1 $3.84 $3.91 $3.99 $4.07
Car wash & laundromats Commercial 2 $4.49 $4.58 $4.67 $4.76
Barber & beauty shops Commercial 2 $4.49 $4.58 $4.67 $4.76
Department stores, retail stores & general commercial Commercial 2 $4.49 $4.58 $4.67 $4.76
Medical offices Commercial 2 $4.49 $4.58 $4.67 $4.76
Warehouses Commercial 2 $4.49 $4.58 $4.67 $4.76
Hospitals & convalescent Commercial 2 $4.49 $4.58 $4.67 $4.76
Hotels w/o dining Commercial 3 $5.46 $5.57 $5.68 $5.79
Auto repair/sales/service Commercial 3 $5.46 $5.57 $5.68 $5.79
Shopping centers Commercial 3 $5.46 $5.57 $5.68 $5.79
Bars w/o dining Commercial 3 $5.46 $5.57 $5.68 $5.79Nurseries Commercial 3 $5.46 $5.57 $5.68 $5.79
RV parks Commercial 3 $5.46 $5.57 $5.68 $5.79
Movie theatres Commercial 3 $5.46 $5.57 $5.68 $5.79
Photo finishers/printers Commercial 3 $5.46 $5.57 $5.68 $5.79
Laundry/dry cleaning Commercial 3 $5.46 $5.57 $5.68 $5.79Light industry Commercial 4 $6.19 $6.32 $6.44 $6.57Convenience/liquor with deli Commercial 5 $7.35 $7.50 $7.65 $7.80Lumber yards Commercial 5 $7.35 $7.50 $7.65 $7.80Industrial laundry Commercial 5 $7.35 $7.50 $7.65 $7.80Bakeries Commercial 6 $12.27 $12.52 $12.77 $13.02Food processors Commercial 6 $12.27 $12.52 $12.77 $13.02Restaurants & bars with food Commercial 6 $12.27 $12.52 $12.77 $13.02Groceries Commercial 6 $12.27 $12.52 $12.77 $13.02Mortuaries Commercial 6 $12.27 $12.52 $12.77 $13.02Auto repair w/steam Commercial 6 $12.27 $12.52 $12.77 $13.02
Source file: 2016 Water and Wastewater Adopted Rates.pdf, Page 2.
Existing Sewer Rate ScheduleCurrent Adopted Rates
NBS - Local Government Solutions
Web: www.nbsgov.com Toll-Free 800.676.7516
Exhibit 4 (Current Rates)
Page 17 of 26

CITY OF MORGAN HILL Customer Statistics
WASTEWATER RATE STUDY
Wastewater Customer Statistics
TABLE 21 : ESTIMATED WASTEWATER FLOW BY CUSTOMER CLASS
FY 2017/18
Avg. WINTER
Water Use
(hcf/month) 1
FY 2017/18
Annual
Water
Consumption
(hcf) 1
Estimated
Annual
Volume
(hcf/yr.) 2
Percent of
Annual
Volume
Single Family 73,059 N/A 876,709 62.7%
Multi Family 19,637 N/A 235,646 16.9%
Commercial Flat N/A 959 959 0.1%
Commercial 1 N/A 29,067 29,067 2.1%
Commercial 2 N/A 88,637 88,637 6.3%
Commercial 3 N/A 65,495 65,495 4.7%
Commercial 4 N/A 31,824 31,824 2.3%
Commercial 5 N/A 12,866 12,866 0.9%
Commercial 6 N/A 56,571 56,571 4.0%
Total 92,696 285,419 1,397,774 100%1. Consumption data source file: MorganHill_CustomerBillingData_ManipulatedV5.xlsx
2. Estimated annual volume is based on average winter water consumption for SFR and MFR Water customers,
and is equal to the annual water consumption for commercial customers.
TABLE 22 : NUMBER OF ACCOUNTS AND BILLING UNITS BY CUSTOMER CLASS
Customer ClassNumber of
Accounts 1
Percent of
Total
Accounts
Number of
Billing Units 1
Percent of
Total Billing
Units
Single Family 9,673 76.3% 9,896 66.0%
Multi Family 2,237 17.6% 4,321 28.8%
Commercial Flat 2 0.0% 2 0.0%
Commercial 1 81 0.6% 81 0.5%
Commercial 2 383 3.0% 392 2.6%
Commercial 3 80 0.6% 80 0.5%
Commercial 4 101 0.8% 101 0.7%
Commercial 5 19 0.1% 19 0.1%
Commercial 6 99 0.8% 99 0.7%
Total 12,675 100.0% 14,991 100.0%1. Number of accounts and billing units is from the Billed Consumption Report by Month spreadsheets.
Source File: MorganHill_CustomerBillingData_ManipulatedV5.xlsx, "Unit Count" Tab.
Customer Class
NBS - Local Government Solutions
Web: www.nbsgov.com Toll-Free 800.676.7516
Customer Statistics
Page 18 of 26

CITY OF MORGAN HILL Customer Statistics
WASTEWATER RATE STUDY
Wastewater Customer Statistics
TABLE 23 : NUMBER OF METERS BY CUSTOMER CLASS AND METER SIZE
5/8 inch 3/4 inch 3 1 inch 4 1.5 inch 2 inch 3 inch 4 inch 6 inch Total
Single Family 2 - - 9,673 - - - - - 9,673
Multi Family - - 2,222 - 8 - 6 1 2,237
Commercial Flat - - 2 - - - - - 2
Commercial 1 - 16 25 9 21 1 9 - 81
Commercial 2 - 74 163 55 86 2 2 1 383
Commercial 3 - 23 21 5 23 2 6 - 80
Commercial 4 - 11 12 26 47 2 3 - 101
Commercial 5 - 3 6 4 6 - - - 19
Commercial 6 - 18 37 21 21 - 2 - 99
Total - 145 12,161 120 212 7 28 2 12,675 1. Number of accounts is from the Billed Consumption Report by Month spreadsheets. This is average meter count by size and customer class for FY 2017/18.
Source File: MorganHill_CustomerBillingData_ManipulatedV5.xlsx
2. Single Family meters are 5/8 to 1 inch size, per City customer data.
3. For commercial customers these meters are 5/8 to 3/4 inch, per City customer data.
4. Single Family meters are 5/8 to 1 inch size and Commercial meters are 1", per City's customer data.
TABLE 24 : TOTAL REVENUE BY CUSTOMER CLASS
Customer Class
Total
Revenue
FY 2017/18
% of Total
Revenue
Single Family $ 5,243,841 53.6%
Multi Family 1,854,752 19.0%
Commercial Flat 952 0.0%
Commercial 1 213,632 2.2%
Commercial 2 646,468 6.6%
Commercial 3 444,359 4.5%
Commercial 4 311,630 3.2%
Commercial 5 250,960 2.6%
Commercial 6 807,647 8.3%
Total 9,774,240$ 100.0%
Number of Accounts by
Customer Class and Meter
Size 1
NBS - Local Government Solutions
Web: www.nbsgov.com Toll-Free 800.676.7516
Customer Statistics
Page 19 of 26

CITY OF MORGAN HILL Current and Proposed Rates
WASTEWATER RATE STUDY
Wastewater Rate Analysis
TABLE 25 : CURRENT VS. PROPOSED SEWER RATES
7/1/2019 7/1/2020 7/1/2021 7/1/2022 7/1/2023
9.00% 9.00% 5.00% 5.00% 5.00%
Monthly Fixed Charges:
Residential (5/8-1 inch meters) $19.29 $19.67 $21.44 $23.37 $24.54 $25.77 $27.05
All Other Customers:
5/8 inch $19.29 $19.67 $21.44 $23.37 $24.54 $25.77 $27.05
3/4 inch $19.29 $19.67 $21.44 $23.37 $24.54 $25.77 $27.05
1 inch 3 $19.29 $19.67 $21.44 $23.37 $24.54 $25.77 $27.05
1.5 inch $72.18 $73.63 $80.26 $87.48 $91.85 $96.45 $101.27
2 inch $114.93 $117.23 $127.78 $139.28 $146.25 $153.56 $161.24
3 inch $250.38 $255.39 $278.38 $303.43 $318.60 $334.53 $351.26
4 inch $449.73 $458.73 $500.02 $545.02 $572.27 $600.88 $630.93
6 inch $998.21 $1,018.18 $1,109.82 $1,209.70 $1,270.18 $1,333.69 $1,400.38
8 inch $1,542.06 $1,572.90 $1,714.46 $1,868.76 $1,962.20 $2,060.31 $2,163.33
10 inch $1,927.58 $1,966.13 $2,143.08 $2,335.96 $2,452.76 $2,575.39 $2,704.16
Monthly Volumetric Charges:
$4.09 $4.17 $4.55 $4.95 $5.20 $5.46 $5.74
$4.09 $4.17 $4.55 $4.95 $5.20 $5.46 $5.74
Commercial 1 $3.91 $3.99 $4.35 $4.74 $4.98 $5.23 $5.49
Commercial 2 $4.58 $4.67 $5.09 $5.55 $5.83 $6.12 $6.42
Commercial 3 $5.57 $5.68 $6.19 $6.75 $7.09 $7.44 $7.81
Commercial 4 $6.32 $6.44 $7.02 $7.65 $8.03 $8.44 $8.86
Commercial 5 $7.50 $7.65 $8.34 $9.09 $9.54 $10.02 $10.52
Commercial 6 $12.52 $12.77 $13.92 $15.17 $15.93 $16.73 $17.561. Source file: 2016 Water and Wastewater Adopted Rates.pdf, Page 2.
2. The first rate adjustment will be effective on January 1, 2019 and all subsequent increases will be effective on January 1st of each year thereafter.
3. The 1 inch commercial meter fixed charge is the set equal to the residential 1 inch meter charge.
Proposed RatesCurrent
Rates
Effective
1/1/18
New Rates
Effective
1/1/19
Sewer Rate Schedule
Single-Family
(Applied to Avg. Winter Water Use)Multi-Family
(Applied to Avg. Winter Water
Use)Commercial Charge
(Applied to Monthly Water Use):
NBS - Local Government Solutions
Web: www.nbsgov.com Toll-Free 800.676.7516
Current & Proposed Rates
Page 20 of 26

NBS - Local Government Solutions
Web: www.nbsgov.com Toll-Free:800.676.7516 SFR Bill Comp, Page 21 of 26
$1
9.6
7 $2
8.0
1 $3
6.3
5 $4
4.6
9 $5
3.0
3
$6
5.5
4
$7
8.0
5
$9
0.5
6
$1
03
.07 $
11
5.5
8
$2
1.4
4 $3
0.5
3 $3
9.6
2 $4
8.7
1 $5
7.8
0
$7
1.4
4
$8
5.0
7
$9
8.7
1
$1
12
.35
$1
25
.98
$0
$20
$40
$60
$80
$100
$120
$140
0 2 4 6 8 11 14 17 20 23
Mo
nth
ly B
ill
Monthly Water Consumption (HCF)
Single-Family Residential Sewer Bill Comparison Current vs. Proposed Rates in FY 2019/20
SFR Bill - Current Rates
SFR Bill - Proposed Rates (July 2019)
Average Winter Consumption
8 hcf

NBS - Local Government Solutions
Web: www.nbsgov.com Toll-Free:800.676.7516 Commercial 2 Bill Comp, Page 22 of 26
$1
9.6
7 $2
9.0
1
$4
3.0
2
$5
7.0
3 $6
6.3
7 $7
5.7
1 $8
5.0
5 $9
4.3
9
$1
13
.07
$1
36
.42
$2
1.4
4 $3
1.6
2
$4
6.8
9
$6
2.1
6 $7
2.3
4 $8
2.5
2 $9
2.7
0 $1
02
.89
$1
23
.25
$1
48
.70
$0
$20
$40
$60
$80
$100
$120
$140
$160
0 2 5 8 10 12 14 16 20 25
Mo
nth
ly B
ill
Monthly Water Consumption (HCF)
Commercial Sewer Bill Comparison Current vs. Proposed Rates in FY 2019/20 (Commercial 2, 1 inch meter)
Commercial Bill - Current Rates
Commercial Bill - Proposed Rates (July 2019)
Average Monthly Bill (8 hcf/mo)

NBS - Local Government Solutions
Web: www.nbsgov.com Toll-Free:800.676.7516 Commerical 3 Bill Comp, Page 23 of 26
$1
9.6
7
$4
8.0
7
$7
6.4
7 $1
04
.87 $
13
3.2
7 $1
61
.67 $
19
0.0
7 $2
18
.47 $
24
6.8
7 $2
75
.27
$2
1.4
4
$5
2.4
0
$8
3.3
5
$1
14
.31 $
14
5.2
6 $1
76
.22 $
20
7.1
8 $2
38
.13 $
26
9.0
9
$3
00
.04
$0
$50
$100
$150
$200
$250
$300
$350
0 5 10 15 20 25 30 35 40 45
Mo
nth
ly B
ill
Monthly Water Consumption (HCF)
Commercial Sewer Bill Comparison Current vs. Proposed Rates in FY 2019/20 (Commercial 3, 1 inch meter)
Commercial Bill - Current Rates
Commercial Bill - Proposed Rates (July 2019)
Average Monthly Bill (20 hcf/mo)

NBS - Local Government Solutions
Web: www.nbsgov.com Toll-Free:800.676.7516 Commercial 4 Bill Comp, Page 24 of 26
$1
17
.23
$1
49
.43
$1
81
.63
$2
46
.03
$2
78
.23
$3
10
.43 $3
55
.51
$3
74
.83
$4
07
.03
$4
71
.43
$1
27
.78
$1
62
.88
$1
97
.98
$2
68
.17
$3
03
.27
$3
38
.37 $
38
7.5
1
$4
08
.56
$4
43
.66
$5
13
.86
$0
$100
$200
$300
$400
$500
$600
0 5 10 20 25 30 37 40 45 55
Mo
nth
ly B
ill
Monthly Water Consumption (HCF)
Commercial Sewer Bill Comparison Current vs. Proposed Rates in FY 2019/20 (Commercial 4, 2 inch meter)
Commercial Bill - Current Rates
Commercial Bill - Proposed Rates (July 2019)
Average Monthly Bill (37 hcf/mo)

NBS - Local Government Solutions
Web: www.nbsgov.com Toll-Free:800.676.7516 5-Year Avg. SFR Bill, Page 25 of 26
$57.80
$63.00
$66.16
$69.46
$72.94
$53.03
$0
$10
$20
$30
$40
$50
$60
$70
$80
Current Rates 7/1/2019 7/1/2020 7/1/2021 7/1/2022 7/1/2023
Mo
nth
ly B
illAverage Single-Family Residential Bill Comparison
Fiscal Years 2018/19 through 2022/23
Monthly Bills Assume SFR Customer Using 8 hcf (Average Winter Consumption)

NBS - Local Government Solutions
Web: www.nbsgov.com Toll-Free:800.676.7516 Regional Rate Comp, Page 26 of 26
$3
8.6
6
$3
8.9
0
$3
9.5
1
$4
0.8
0
$4
2.9
1
$4
3.2
1
$4
5.1
4
$4
6.2
5
$4
6.6
4
$4
9.3
6 $5
3.0
3 $5
7.8
4
$0
$10
$20
$30
$40
$50
$60
$70
Mo
nth
ly B
illSingle-Family Residential Regional Bill Comparison
Variable Charge
Fixed Charge
Monthly Bills Assume SFR Customers Use 8 hcf (Average Winter Consumption)