
City OF LOS ANGELES: A COMPARATIVE ANALYSIS ...cao.lacity.org/debt/City of Los Angeles Economic...
32
UCLA ANDERSON FORECAST 110 Westwood Plaza, Gold Hall, B305, Los Angeles, CA 90095 310-825-1623 | [email protected] CITY OF LOS ANGELES: A COMPARATIVE ANALYSIS AND ECONOMIC FORECAST MAY, 2015
Transcript of City OF LOS ANGELES: A COMPARATIVE ANALYSIS ...cao.lacity.org/debt/City of Los Angeles Economic...

UCLA ANDERSON FORECAST 110 Westwood Plaza, Gold Hall, B305, Los Angeles, CA 90095
310-825-1623 | [email protected]
CITY OF LOS ANGELES: A COMPARATIVE ANALYSIS AND
ECONOMIC FORECAST
MAY, 2015

Table of Contents
Executive Summary 2
Employment 3
Population 10
Human Capital 11
Income 13
Housing 15
Apartments 19
Taxable Sales 20
Building Permits 23
Commercial Real Estate 25
Business Activities 27
Economic Forecast 2015 to 2020 30
1
The City of Los Angeles: A Comparative Analysis and Economic Forecast
Jerry Nickelsburg, Senior Economist William Yu, Economist UCLA Anderson Forecast May 2015
Executive Summary
Over the past several years, the City of Los Angeles not only experienced a steady economic recovery, but it also experienced a nascent fundamental transformation in the geography and nature of economic activity. Nationwide the aftermath of the Great Recession intensified an inner-city renaissance movement. In Los Angeles this manifested itself in increasing amenities and upscale residences downtown and a new generation of talent gentrifying other communities in the eastern parts of the City. The economy of Los Angeles has and will continue to benefit from this revitalization. Looking forward, one has to consider this transformation of Los Angeles as well as the trends in the aggregate data as they both reflect on the health and viability of the City’s economy.
From this perspective, our forecast for the City of Los Angeles economy is for continued growth over the next five years. After 2017, we forecast that the Los Angeles economy will likely achieve its potential capacity and reach full employment. As a result, growth will then slow down from the current more rapid recovery phase rate. Overall, we foresee the following for the City of Los Angeles: From 2015 to 2020, the City’s payroll employment will grow by 4.7%, population will increase by 3.6%, home prices will grow by 24%, home sales will be up 31%, taxable sales will increase by 13%, residential permits will be up 32%, and nonresidential permit values will grow by 14%1.
1 The City of Los Angeles is considering an ordinance raising the minimum wage in the City in steps to $15 per hour by 2020. There have been a few studies of the economic impact of this proposed policy and they each come to vastly different conclusions. In the analysis and forecast herein, we do not take a position as to the outcome for this particular ordinance as the data are not clear and the studies are highly dependent on their initial assumptions.
2
Employment
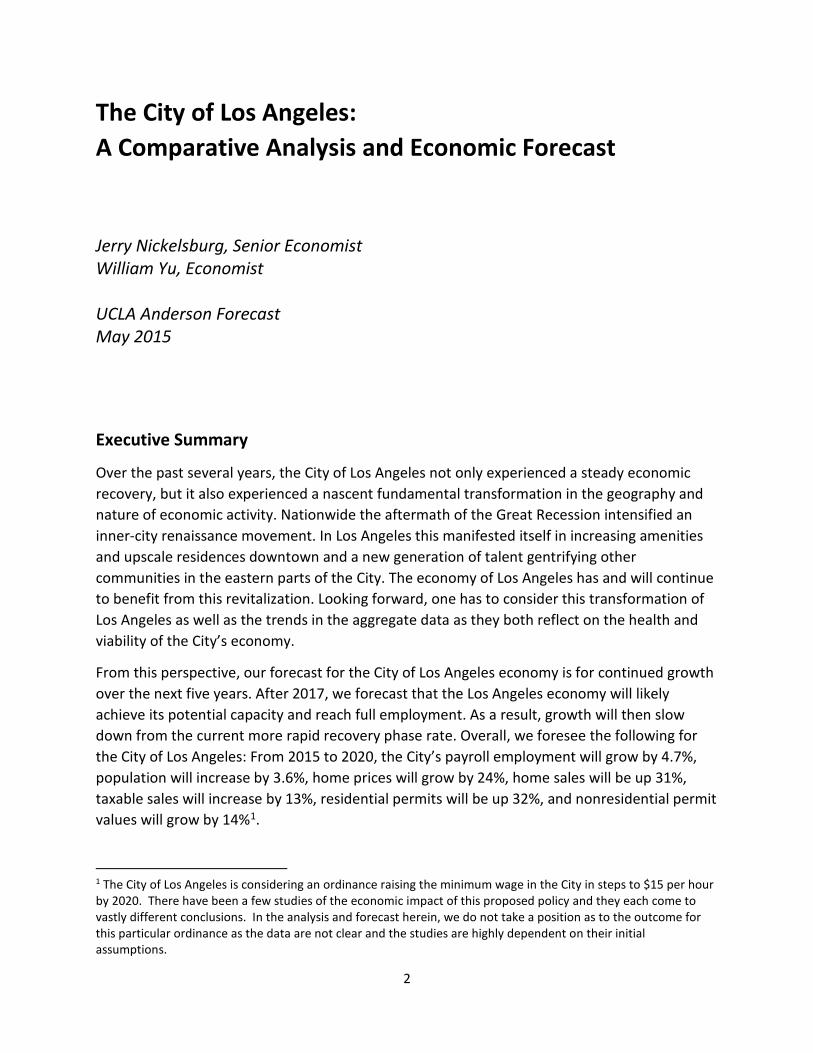
The labor market in the City of Los Angeles has rebounded at a robust pace over the past two years. Figure 1 shows the City’s seasonally adjusted non-farm payroll employment (jobs located in the City from the CES Survey) and household employment (number of employed residents who live in the City from CPS Household Survey) from January 2005 to April 2015. Both labor market indicators show robust growth in recent years.
Figure 1. Payroll and Household Survey of Employment of City of Los Angeles, Seasonally Adjusted, 2005:M01 to 2015:M04
Source: Anderson Forecast based on California Employment Development Department Data
Figures 2 and 3 display the growth of payroll jobs and household survey employment in Los Angeles County2, Orange County, San Diego County, Riverside and San Bernardino Counties. All of these Southern California counties show a resilient recovery similar to that of the City of Los Angeles.
Figure 4 compares the City’s payroll employment with the same Southern California counties from December 2007 to present. The benchmark is the beginning of the Great Recession. Each has surpassed their pre-recession peak level. As of April 2015, San Diego County is leading with 4.6% higher employment than its pre-recession peak, followed by The Inland Empire’s 3.6% (Riverside & San Bernardino Counties), Los Angeles County’s 1.9%, and Orange County’s 1.4%. The City of Los Angeles is at 0.5%.
2 Los Angeles County data includes the City of Los Angeles.
1.40
1.45
1.50
1.55
1.60
1.65
05 06 07 08 09 10 11 12 13 14 15
Nonfarm Payroll Employment(Millions)
1.65
1.70
1.75
1.80
1.85
1.90
05 06 07 08 09 10 11 12 13 14 15
Household Employment(Millions)
3

Figure 2. Payroll Employment of Local Counties, Seasonally Adjusted, 2005:M01 to 2015:M04
Source: California Employment Development Department
3.8
3.9
4.0
4.1
4.2
4.3
4.4
05 06 07 08 09 10 11 12 13 14 15
Los Angeles County(Millions)
1.35
1.40
1.45
1.50
1.55
05 06 07 08 09 10 11 12 13 14 15
Orange County
1.20
1.24
1.28
1.32
1.36
1.40
05 06 07 08 09 10 11 12 13 14 15
San Diego County
1.10
1.15
1.20
1.25
1.30
1.35
05 06 07 08 09 10 11 12 13 14 15
Riverside & San Bernardino Counties
4

Figure 3. Household Employment of Local Counties, Seasonally Adjusted, 2005:M01 to 2015:M04
Source: California Employment Development Department
Figure 4. Payroll Employment Accumulated % Change of City of Los Angeles and Local Counties From 2007:M12 to 2015:M04
Source: California Employment Development Department (EDD)
4.2
4.3
4.4
4.5
4.6
4.7
05 06 07 08 09 10 11 12 13 14 15
Los Angeles County(Millions)
1.35
1.40
1.45
1.50
1.55
1.60
05 06 07 08 09 10 11 12 13 14 15
Orange County
1.32
1.36
1.40
1.44
1.48
05 06 07 08 09 10 11 12 13 14 15
San Diego County
.76
.80
.84
.88
.92
.96
05 06 07 08 09 10 11 12 13 14 15
Riverside County
-12%
-8%
-4%
0%
4%
07 08 09 10 11 12 13 14 15 16
City of Los AngelesLos Angeles CountyOrange CountySan Diego CountyRiverside & San Bernardino Counties
City:0.5%
LA Co:1.9%OC:1.4%
SD:4.6%
RS:3.6%
5

Figure 5 shows the annual growth rates of payroll employment of the City of Los Angeles and other counties. The City’s growth rates were 0.9%, 2.1%, 3.3%, and 2.5% over the past four years, and in 2013 its job growth was higher than all of the other Southern California counties. In 2014, with the exception of Inland Empire, The City was the locus of the most rapid regional growth. This more robust growth in the past two years is emblematic of the aforementioned breakout of The City from a lesser skilled manufacturing center to a city driven by technology, trade, education and health care.
Figure 6 shows The City and Southern California counties labor force annual growth rates. Labor force growth within The City, though greater than population growth, is not as robust as The City’s job growth. This is due to the fact that the labor force is measured by the domicile of the individual while jobs are measured by the domicile of the firm. The constraints on housing growth within The City, discussed later, creates the disparity between the two measures of labor market health. Nevertheless, the growth indicates that far from there being an increasing number of discouraged workers, Angelenos are now returning to the labor force in response to the improved job prospects.
Figure 7 illustrates the household survey annual employment growth. This survey measures the number of residents of the City who are employed including those who are self employed or work in family businesses (not measured in the non-farm payroll numbers). Over the past two years this measure also shows comparatively solid growth in the City with 3.3% in 2013 and 2.7% in 2014.
Figure 5. Payroll Employment Annual Growth Rates, 2011 to 2014
Sources: Anderson Forecast and California Employment Development Department
0.0%
1.0%
2.0%
3.0%
4.0%
5.0%
2011 2012 2013 2014
City of Los AngelesLos Angeles CountyOrange CountySan Diego CountyRiverside and San Bernardino
0.9%
2.1%
3.3%
2.5%
6

Figure 6. Labor Force Annual Growth Rates, 2011 to 2014
Sources: Anderson Forecast and California Employment Development Department
Figure 7. Household Survey of Employment Annual Growth Rates, 2011 to 2014
Sources: Anderson Forecast and California Employment Development Department
-0.5%
0.0%
0.5%
1.0%
1.5%
2.0%
2011 2012 2013 2014
City of Los AngelesLos Angeles CountyOrange CountySan Diego CountyRiverside and San Bernardino
0.4%
-0.4%
1.9%
0.9%
0.5%
1.0%
1.5%
2.0%
2.5%
3.0%
3.5%
2011 2012 2013 2014
City of Los AngelesLos Angeles CountyOrange CountySan Diego CountyRiverside and San Bernardino
0.7%
1.2%
3.3%
2.7%
7

Figure 8 gives unemployment rates for The City and surrounding counties. The City’s unemployment rate has been steadily declining over the past four years. Over the past decade, The City has consistently had a higher unemployment rate than surrounding counties. One of the principal reasons is that the labor force in the City of Los Angeles is younger and on average less skilled than the labor force outside the city. This is expected to change with the previously mentioned migration into The City as evidenced by the concomitant gentrification of many neighborhoods.
Figure 8. Unemployment Rates, 2005:M01 to 2015:M04
Sources: Anderson Forecast and California Employment Development Department
Table 1 lists the percentage of employment by sector in the City of Los Angeles, the rest of Los Angeles County, Orange County, The City of San Diego, the rest of San Diego County, and The Inland Empire for the second quarter of 2014. Table 1 also presents different tiers of wage level in each sector based on different occupations and positions in the particular industry. For example, in the City of Los Angeles we show that there are four tiers in the arts, entertainment, recreation, and real estate sectors ranging from a low wage tier, with an average salary of $27,072 (1%), to a mid-low tier at $32,650 (0.4%), to a mid-high tier at $42,965 (1.3%), and finally to the highest tier at $109,219 (2.3%).
The City and County of Los Angeles have a much larger fraction of low-wage earners in the health care and social assistance sector, with 5.8% in The City (average annual wage of $12,408) and 4.6% in the County (average wage of $11,746) while the other local counties only have 1.6% to 3.2% of workers in this lowest wage sector. On the other hand, the City of Los Angeles has a larger fraction of higher paid jobs than the other regions. For instance, The City has 2.3% of workers in the high wage arts, entertainment, recreation, and real estate sectors with an
2
4
6
8
10
12
14
16
05 06 07 08 09 10 11 12 13 14 15
City of Los AngelesLos Angeles CountyOrange CountySan Diego CountyRiverside County
(%)
8.1%7.6%6.6%
5.1%4.4%
8

average wage of $109,219 while other local regions have smaller proportions (from 0.8% to 1.9%) and lower wages (from $42,001 to $87,552) in this sector. The City also has 17% of jobs in the high wages services sector with salaries averaging $100,665, a larger percentage and higher wage than the other local regions, with the exception of The City of San Diego.
The average wage in the City is $54,523, higher than the rest of Los Angeles County’s $49,319, Orange County’s $52,599, San Diego County’s $41,695, and The Inland Empire’s $38,445. Only The City of San Diego’s average wage ($60,380) is higher than that of The City of Los Angeles.
Table 1. Employment Share by Industry and Annual Wage, 2014:Q2
Note: In each sector, there are 2 to 5 tiers of sub-sectors to reveal the different levels of wages of jobs in each sector. The higher the number of tier, the higher wage in that sub-sector. Source: Anderson Forecast Calculation based on Quarterly Census of Employment and Wages from EDD.
Figure 9 displays nominal wage growth3 in 2013 (from 2012:Q2 to 2013:Q2) and 2014 (from 2013:Q2 to 2014:Q2). All of the regions had negative growth in wages in 2013. The City of Los Angeles’s wage growth in 2014 (2.6%) is higher than all of the other regions, with the exception of the City of San Diego.
3 Not adjusted for inflation
Average Annual Wage ($) 54,523 49,319 52,599 60,380 41,695 38,445
Emp % Wage ($) Emp % Wage ($) Emp % Wage ($) Emp %Wage ($) Emp %Wage ($) Emp % Wage ($)Health Care and Social Assistance (Tier 1) 5.8% 12,408 4.6% 11,746 1.6% 15,698 1.7% 12,502 2.4% 13,370 3.2% 10,820 Accommodation and Food Services (Tier 1) 4.0% 16,716 4.1% 15,267 4.2% 15,392 3.7% 16,015 5.2% 15,023 5.3% 14,173 Retailers and Other Services (Tier 1) 0.8% 21,003 1.1% 17,538 0.9% 16,669 0.9% 15,695 1.2% 15,024 1.2% 15,495 Arts, Entertainment, Recreation, and Real Estate (Tier 1) 1.0% 27,072 0.6% 19,089 0.6% 18,882 0.6% 17,989 1.0% 20,425 0.6% 17,459 Accommodation and Food Services (Tier 2) 4.3% 21,691 4.4% 20,474 4.6% 20,019 5.2% 20,892 5.0% 19,038 4.0% 18,505 Retailers and Other Services (Tier 2) 3.7% 24,238 3.4% 20,430 3.0% 20,930 3.8% 20,345 4.9% 18,814 4.4% 18,718 Public Administration and Education Services (Tier 1) 2.3% 24,500 1.9% 23,472 2.1% 20,342 2.0% 24,268 1.0% 23,949 1.5% 17,254 Health Care and Social Assistance (Tier 2) 1.3% 26,542 1.2% 25,269 1.4% 25,957 1.4% 26,662 2.4% 25,522 1.4% 21,998 Retailers and Other Services (Tier 3) 3.9% 27,925 4.8% 26,790 4.5% 27,903 3.8% 28,177 6.5% 26,426 6.0% 26,814 Food and Apparel Manufacturing (Tier 1) 1.1% 25,939 0.9% 30,123 0.3% 26,925 0.1% 24,609 0.2% 26,222 0.1% 23,531 Arts, Entertainment, Recreation, and Real Estate (Tier 2) 0.4% 32,625 0.8% 32,906 2.3% 25,510 1.0% 22,819 2.8% 33,641 1.4% 30,084 Accommodation and Food Services (Tier 3) 3.0% 31,050 3.4% 26,066 4.6% 32,532 5.4% 32,797 3.5% 29,792 4.6% 24,489 Public Administration and Education Services (Tier 2) 0.7% 36,214 0.9% 24,864 1.8% 29,544 0.7% 37,887 1.5% 31,856 1.2% 28,394 Health Care and Social Assistance (Tier 3) 3.9% 39,598 3.2% 33,265 2.6% 38,863 2.5% 37,003 3.2% 31,869 2.9% 33,041 Transportation and Warehousing (Tier 1) 1.7% 49,331 1.7% 44,207 1.1% 44,027 1.3% 43,351 1.2% 41,492 2.4% 41,087 Retailers and Other Services (Tier 4) 2.5% 39,365 2.6% 40,551 2.4% 40,754 2.2% 38,236 3.3% 37,049 3.1% 37,065 Arts, Entertainment, Recreation, and Real Estate (Tier 3) 1.3% 42,965 0.8% 35,881 1.3% 47,309 1.6% 40,067 1.4% 35,425 0.8% 34,542 Public Administration and Education Services (Tier 3) 6.0% 47,287 6.5% 47,360 5.4% 50,343 5.7% 46,871 7.3% 45,368 9.0% 47,112 Food and Apparel Manufacturing (Tier 2) 1.2% 48,214 1.7% 44,875 0.8% 51,906 0.5% 33,545 0.8% 38,605 0.9% 43,059 Transportation and Warehousing (Tier 2) 2.3% 70,415 2.0% 54,294 1.0% 56,703 1.1% 47,209 0.7% 52,564 4.3% 42,615 Retailers and Other Services (Tier 5) 2.1% 60,175 2.4% 58,294 2.2% 64,736 1.9% 60,441 2.7% 53,415 2.4% 52,764 Mining, Utilities, Construction 3.4% 67,781 3.5% 62,415 5.9% 60,807 3.5% 59,783 7.5% 54,463 6.8% 50,256 Public Administration and Education Services (Tier 4) 6.0% 71,396 3.8% 52,969 4.3% 56,932 7.4% 62,000 2.9% 47,880 3.4% 49,846 Health Care and Social Assistance (Tier 4) 8.8% 69,767 6.9% 63,168 6.1% 64,362 8.1% 75,906 6.7% 62,193 8.0% 65,952 Wholesale Trade and High Wage Manufacturing 8.4% 56,298 13.7% 63,498 15.5% 70,289 9.1% 85,634 12.0% 64,277 11.3% 49,102 Arts, Entertainment, Recreation, and Real Estate (Tier 4) 2.3% 109,219 1.8% 87,552 1.9% 78,640 1.6% 76,996 1.1% 50,952 0.8% 42,001 High Wages Services 17.0% 100,665 16.7% 85,569 17.2% 85,390 22.5% 106,594 10.0% 66,822 7.2% 56,011
City of Los Angeles
Los Angeles County
(excluding City of L.A.)
Orange County San Diego City
San Diego County
(excluding San Diego City)
Riverside & San Bernardino
Counties
9

Figure 9. Wage Annual Growth Rates, 2013 and 2014
Source: Anderson Forecast’s calculation based on Quarterly Census of Employment and Wages (Q2) from EDD
Population
In 2014, the City of Los Angeles’s population reached 3,927,000, about 39% of Los Angeles County’s total population. Los Angeles is the second largest city in the U.S. and its population continues to grow. The speed of population growth has accelerated in recent years. The compound annual growth rate from 2000 to 2014 is 0.4%, but in the last five years, that rate rises to 0.5%, in the last three to 0.9%, and last year to 1.1%. From 2013 to 2014, the City’s growth was higher than that of Long Beach at 0.5%, Anaheim at 0.9%, Santa Ana at 0.9%, and Los Angeles County at 0.8%. It was equal to Orange and San Diego County population growth rates, but lower than that of The City of San Diego at 1.5% and Riverside City at 1.2%.
As a gateway to the growing Mexican and Asia-Pacific economies and with its diversity and established ethnic communities, Los Angeles has been attracting many international immigrants in recent years, especially from Asia.
-2%
-1%
0%
1%
2%
3%
4%
5%
6%
7%
2013 2014
City of Los AngelesL.A. County (excluding City of L.A.)Orange CountySan Diego CitySan Diego County (excluding S.D. City)Riverside & San Bernardino Counties
-1.4%
2.6%
10

Table 2. Population, 2014
Location 2014
(Thousands) Compound Annual Growth Rate
1-Yr. 3-Yr. 5-Yr. ‘00 to ‘14 City of Los Angeles 3,927 1.1% 0.9% 0.5% 0.4% Long Beach City 472 0.5% 0.4% 0.4% 0.2% Anaheim City 348 0.9% 0.7% 0.6% 0.4% Santa Ana City 337 0.9% 0.8% -0.2% 0.0% San Diego City 1,376 1.5% 1.2% 1.0% 0.8% Riverside City 320 1.0% 1.0% 1.4% 1.6% Los Angeles County 10,097 0.8% 0.7% 0.5% 0.4% Orange County 3,149 1.1% 1.0% 0.8% 0.7% San Diego County 3,247 1.1% 1.1% 1.2% 1.0% Riverside County 2,320 1.2% 1.2% 1.8% 2.9%
Sources: Census, American Community Survey, and California Department of Finance
Human Capital
Table 3 displays the educational attainment of the adult population in the City of Los Angeles and surrounding regions. The City of Los Angeles has a larger fraction of residents whose educational attainment is lower than 9th grade (15.4%) compared to that of the other local regions displayed with the exception of Santa Ana (28%). On the other hand, the City of Los Angeles, home to prestigious universities such as UCLA and USC and a vibrant tech industry, also has a larger proportion of more highly educated residents (20.9% with bachelor’s degrees and 10.5% with graduate/professional degrees) than the cities of Long Beach, Anaheim, Santa Ana, and Riverside. The larger share on both ends of the human capital spectrum echoes in the discussion of Table 1 where we saw a bigger percentage both of lowest- and highest-wage jobs.
11

Table 3. Educational Attainment, 2013, % of Adult Population (age 25 years and up)
Location
Less than 9th Grade
(%)
9th to 12th
Grade
High School
Graduate (and GED)
Some College,
No Degree
Associate's Degree
Bachelor's Degree
Graduate or Professional
Degree
City of Los Angeles 15.4 10 19.4 17.9 6 20.9 10.5 Long Beach City 11.8 8.2 18.6 25 8.2 17.3 10.9 Anaheim City 14.1 9.5 23.2 22.2 6.1 17.1 7.9 Santa Ana City 28 17.3 21 16.9 4.4 9.1 3.3 San Diego City 6.3 6.1 16.8 21.4 7.3 24.7 17.2 Riverside City 11.1 10.3 24.1 23.4 7.4 14.1 9.6 Los Angeles County 13.6 9.5 20.4 19.4 7 19.7 10.4 Orange County 8.9 6.9 18 21.1 7.9 24.1 13 San Diego County 7.4 7.1 19.6 22.2 9.1 21.2 13.4 Riverside County 9.2 10.6 25.9 25.4 8 13.5 7.5 Source: American Community Survey
To get a simple comparative analysis of human capital among these regions over time, the Anderson Forecast has developed the First 5 LA/UCLA City Human Capital Index (CHCI) to measure human capital level across cities and counties each year. The CHCI is a weighted average index based on adult resident educational attainment and is shown in Table 3. By and large, the interpretation is that one tenth of the index is an adjusted average schooling year of local residents. Figure 10 illustrates CHCIs from 2006 to 2013. The City of Los Angeles’ CHCI has been steadily improving from 133.3 in 2006 to 136.5 in 2013.
The City of San Diego has a much higher CHCI at 153.9 than Los Angeles. In other local cities Long Beach CHCI at 138.3 is slightly higher, and Riverside City CHCI at 134.4, Anaheim at 132.5 and Santa Ana at 109.5 are lower. The trend in human capital in Southern California over the past decade has been improving. There are two important contributors to this positive trend. First, better educated migrants have moved in to fill high value added jobs (as discussed in the Population section) and less educated residents have moved out due to the increasing cost of living and the decrease of low-value-added employment. Second, public education graduation rates have been improving.
12

Figure 10. City Human Capital Index (Weighted Average Education Attainment Index)
Source: Anderson Forecast based on American Community Survey Data
Income
Figure 11 shows per-capita income for the City of Los Angeles and other local regions from 2005 to 2013. All of the regions saw a decline in per capita income during the Great Recession, and most regions’ incomes started to rebound in 2011. Per capita income in the City of Los Angeles was $27,780 in 2013, similar to Los Angeles County’s $27,490, lower than Orange County’s $33,800, The City of San Diego’s $33,500, and San Diego County’s $30,800. It was higher than Long Beach’s $26,000, Anaheim’s $24,100, Riverside County’s $23,070, Riverside City’s $21,100, and Santa Ana’s $15,690.
By and large, per-capita incomes across these cities reflects the ranking of human capital discussed in the previous section. The City of Los Angeles has a human capital level lower than San Diego, and per-capita income is lower as well. It is higher than Anaheim, and as expected, per-capita income is also higher.
Table 4 lists household median income and the distribution of household income for these regions in 2013. It seems puzzling to see household income in the City of Los Angeles at $48,470, only slightly better than Santa Ana at $47,900 and worse than the rest of the regions. This result is seemingly inconsistent with the human capital and per-capita income discussed earlier. However this differential may be explained by a larger proportion of multiple income earners in one location relative to another. The City of Los Angeles has a higher fraction of single-person households than Los Angeles County and other local regions. The differential mainly consists of young adults in their 20s and 30s.
100
110
120
130
140
150
160
2006 2007 2008 2009 2010 2011 2012 2013
San Diego CityLong Beach CityCity of Los Angeles Riverside CityAnaheim CitySanta Ana City
13

Figure 11. Per Capita Income, Nominal Dollars, 2005 to 2013
Source: American Community Survey
Table 4. Household Median Income and Distribution, 2013
Household Median
Income ($)
% of Household
<$25K $25K-50K
$50K-100K
$100K-200K >$200K
City of Los Angeles 48,466 27.8 23.3 26.2 15.9 6.9 Long Beach City 52,116 26.1 20.9 30.9 17.4 4.7 Anaheim City 57,550 20.8 20.7 31.2 21.7 5.6 Santa Ana City 47,914 22.3 30.1 31.8 13.5 2.3 San Diego City 63,456 18.5 21 29.4 23.3 7.9 Riverside City 54,300 22.6 22.7 33.5 17.7 3.5 Los Angeles County 54,529 24 22.1 28.3 18.8 6.8 Orange County 74,163 16.1 18.2 29.1 26 10.5 San Diego County 61,426 19.5 21.7 29.5 22.2 7.2 Riverside County 54,095 22 24 30.7 19.3 4.1
Source: American Community Survey
12,000
16,000
20,000
24,000
28,000
32,000
36,000
2005 2006 2007 2008 2009 2010 2011 2012 2013
Orange CountySan Diego CitySan Diego CountyCity of Los AngelesLos Angeles CountyLong Beach CityAnaheim CityRiverside CountyRiverside CitySanta Ana City
($) $33,800 (+9%)$33,500 (+14%)
$30,800 (+9%)
$27,780 (+13%)$27,490 (+11%)$26,000 (+12%)$24,100 (+16%)$23,070 (-2%)
$21,100 (+1%)
$15,690 (+11%)
14

Housing
Figure 12 shows median home values for the City of Los Angeles and for surrounding regions as measured by Zillow from January 2005 to March 2015. All of the regions’ home values declined after the housing bubble burst in late 2006. They hit bottom in 2011, and began to recover in 2012. Since 2008, The City of Los Angeles has had the highest median home value of these regions. In March 2015, the median reached $534,900 in Los Angeles—higher than The City of San Diego at $501,800, Los Angeles County at $493,600, Long Beach at $483,100, Anaheim at $476,500, Santa Ana at $420,500, and Riverside City at $299,100. The resurgence of home values in the City of Los Angeles reflects both the strong demand for housing and the limited supply of it.
From March 2014 to March 2015, home values in The City increased 6.1%. For homeowners and the real estate industry it is good to see rising home prices. But for those who hope to be home owners housing affordability is a problem, especially considering the fact that per capita and household income in The City is not high relative to other local regions. Again, these data may echo a city in transition to one with higher educational attainment and higher incomes.
Figure 12. Zillow Home Value Index for All Homes, 2005:M01 to 2015:M03
Source: Zillow Real Estate Research
In Figure 12, Zillow home value index estimate of the current market value of all homes including those not in the market for transactions is shown. To look at an alternative home value index, Figure 12A shows the seasonally adjusted median home sale prices only for those sold in the market4 compiled by CoreLogic (Dataquick). With the exception of Long Beach, the order of home prices in Figures 12 and 12A are basically the same. The highest home price is the City of Los Angles, followed by The City of San Diego. Riverside City is at the bottom.
4 Home sale prices include new and existing, attached and detached single family home sales.
200
300
400
500
600
05 06 07 08 09 10 11 12 13 14 15
City of Los AngelesSan Diego CityLos Angeles CountyLong Beach CityAnaheim CitySanta Ana CityRiverside City
(Thous $)
15

However, the significant difference is that home sale prices in the City of Los Angeles have rebounded rapidly since 2011, reaching $610,800 in March 2015, higher than Zillow’s home value estimate of $534,900 for the same month. Moreover, the current median price has surpassed City’s peak achieved before the Great Recession.
Figure 12A. Home Sale Median Prices, Seasonally Adjusted, 2005:M01 to 2015:M04
100
200
300
400
500
600
700
05 06 07 08 09 10 11 12 13 14 15
City of Los AngelesSan Diego CityLong Beach CityAnaheim CitySanta Ana CityRiverside City
(Thous $)
Source: CoreLogic/DQNews
Figure 13 presents the number of homes foreclosed out of every 10,000 homes in the City of Los Angeles and comparison regions from January 2005 to March 2015. After the housing bubble burst the foreclosure rate skyrocketed. The City’s rate was up to 24, while Santa Ana increased to 76. The foreclosure crisis is now over and the rate has receded to a more normal low level in the range of 1.1 to 2.7. In March 2015, the foreclosure rate in the City of Los Angeles was 2.0, higher than 1.8 in Los Angeles County, 1.5 in Long Beach, 1.3 in The City of San Diego, and 1.1 in Anaheim, but lower than 2.7 in Santa Ana, and 2.6 in Riverside City, however there is significant variation month to month. Figure 13A shows the total monthly numbers of homes foreclosed in six cities. The patterns in Figures 13 and 13A are very similar. There are only 65 foreclosed homes in the city of Los Angeles in April 2015 indicating that distressed housing market is long gone.
16

Figure 13. Monthly Foreclosures per 10K Homes, 2005:M01 to 2015:M03
0
10
20
30
40
50
60
70
80
05 06 07 08 09 10 11 12 13 14 15
Santa Ana CityRiverside CityCity of Los AngelesLos Angeles CountyLong Beach CitySan Diego CityAnaheim City
(Out of 10K)
Source: Zillow Real Estate Research
Figure 13A. Monthly Homes Foreclosed, 2005:M01 to 2015:M04
0
100
200
300
400
500
600
700
05 06 07 08 09 10 11 12 13 14 15
Santa Ana CityRiverside CityCity of Los AngelesLong Beach CitySan Diego CityAnaheim City
Source: CoreLogic/DQNews
17

Figure 14 displays seasonally adjusted home sales in the City of Los Angeles and comparison cities from January 2005 to April 2015. All six cities present a similar pattern: After the home sales slump in 2006 and 2007 and half-way recovery in 2008 and 2009, home sales have been fluctuating rather steadily over the past five years. For instance, sales in the City of Los Angeles have been around 1,000 units per month and sales in The City of San Diego have been around 1,300 per month. With limited inventory available for sale, relatively high prices, and a several year lag in bringing new supply to market these levels are neither surprising nor abnormal.
Figure 14. Monthly Homes Sales, Seasonally Adjusted, 2005:M01 to 2015:M04
0
400
800
1,200
1,600
2,000
2,400
05 06 07 08 09 10 11 12 13 14 15
San Diego City City of Los AngelesRiverside City Long Beach CityAnaheim City Santa Ana City
Source: CoreLogic/DQNews
18

Apartments
Figure 15 illustrates the Zillow Rent Index from November 2010 to March 2015. All the regions shown are experiencing steadily rising rents, reflecting the recovery of the economy in general and housing markets specifically in Southern California. The City of Los Angeles has the highest rents among these regions. In The City of Los Angeles average rents increased from $2,236 in March 2011 to $2,564 in March 2015. After Los Angeles, Anaheim has the highest rents at $2,441, followed by Los Angeles County at $2,402, The City of San Diego at $2,339, Long Beach at $2,312, Santa Ana at $2,282, and Riverside City at $1,692 per unit.
Figure 15. Zillow Rent Index for All Homes, 2010:M11 to 2015:M03
Source: Zillow Real Estate Research
Figure 16 gives apartment vacancy rates for four Southern California counties. Over the past decade, the vacancy rate in Los Angeles County has been below 6.5% on average. This is a reflection of strong demand and limited supply. As of 2014:Q4, the vacancy rate in Los Angeles County was 5.3%, similar to Orange and Riverside Counties at 5.2%, but higher than San Diego County at 4.9%.
1,400
1,600
1,800
2,000
2,200
2,400
2,600
IV I II III IV I II III IV I II III IV I II III IV I II III IV
2011 2012 2013 2014 2015
City of Los AngelesAnaheim CityLos Angeles CountySan Diego CityLong Beach CitySanta Ana CityRiverside City
($)
19

Figure 16. Average Apartment Vacancy Rates, Seasonally Adjusted, 2005:Q1 to 2014:Q4
Source: Real Estate and Construction Report from Real Estate Research Council of Southern California
Taxable Sales
Figure 17 depicts seasonally adjusted quarterly nominal taxable sales in the City of Los Angeles and in other selected regions from 2005:Q1 to 2014:Q4. Taxable sales in the City rebounded from a $8.3 billion trough in 2009:Q2 to the current $10.8 billion and they surpassed the pre-recession peak of $10.2 billion in 2008:Q2. On average, taxable sales grew by 3.5% from 2013 to 2014 in The City of Los Angeles.
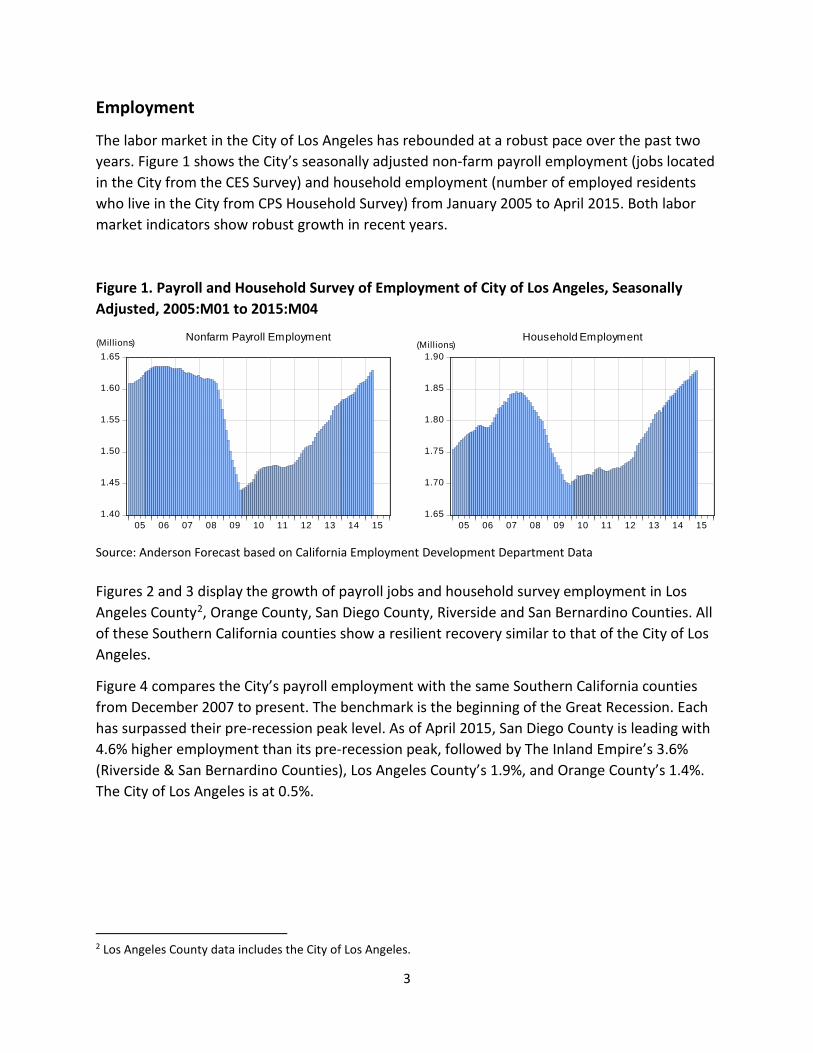
Figure 18 compares the City of Los Angeles to the other regions in terms of the accumulated percentage change of taxable sales from 2005:Q1 up to 2013:Q4. During this period, taxable sales in the City of Los Angeles grew by 17.3%, ranking second to the 18.9% growth in Long Beach and followed by 15.7% in San Diego City, 12.7% in Los Angeles County, 9.7% in Anaheim City, 3.9% in Riverside City, and -3.5% in Santa Ana City. This improvement is due in part to the recovery of the local economy and in part to the fact that Los Angeles is increasingly a destination for tourism.
3
4
5
6
7
8
9
10
05 06 07 08 09 10 11 12 13 14 15
Los Angeles CountyOrange CountySan Diego CountyRiverside County
(%)
20

Figure 17. Quarterly Nominal Taxable Sales, Seasonally Adjusted, 2005:Q1 to 2014:Q4 M$
Source: California Board of Equalization
8,000
8,500
9,000
9,500
10,000
10,500
11,000
05 06 07 08 09 10 11 12 13 14
City of Los Angeles
1,000
1,100
1,200
1,300
1,400
05 06 07 08 09 10 11 12 13 14
Long Beach City
1,100
1,200
1,300
1,400
1,500
1,600
05 06 07 08 09 10 11 12 13 14
Anaheim City
760
800
840
880
920
960
1,000
1,040
05 06 07 08 09 10 11 12 13 14
Santa Ana City
4,000
4,400
4,800
5,200
5,600
05 06 07 08 09 10 11 12 13 14
San Diego City
800
900
1,000
1,100
1,200
1,300
05 06 07 08 09 10 11 12 13 14
Riverside City
26,000
28,000
30,000
32,000
34,000
36,000
05 06 07 08 09 10 11 12 13 14
Los Angeles County
21
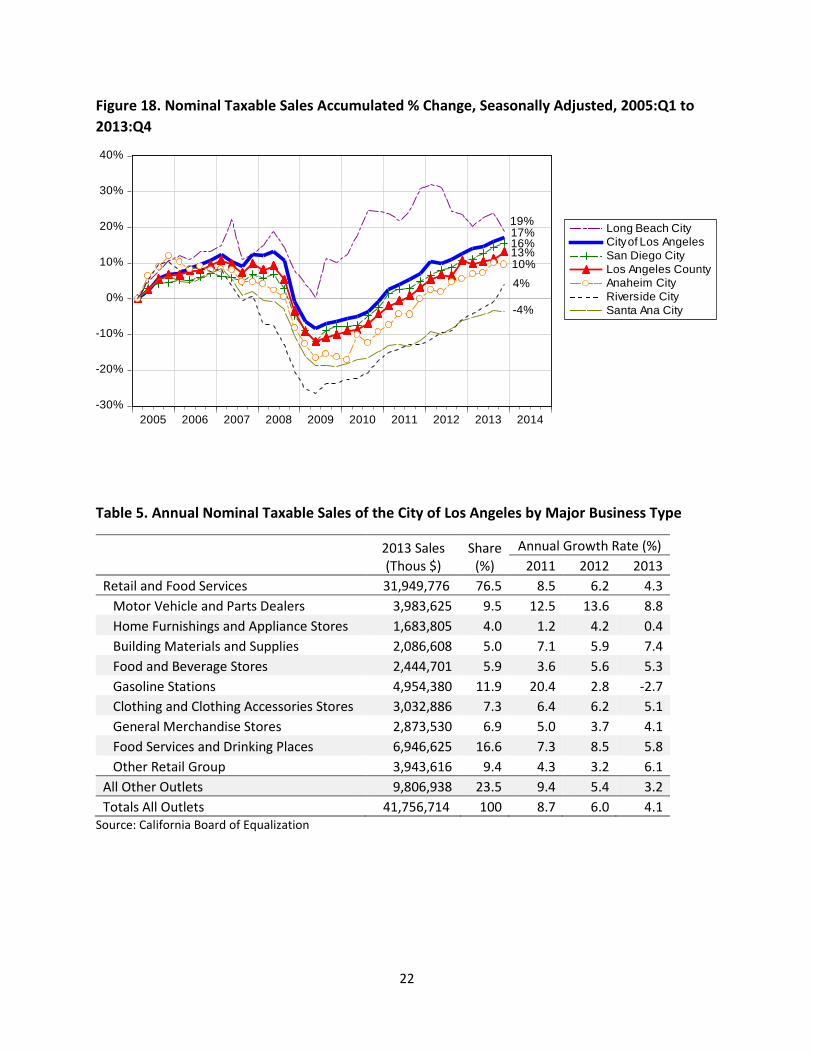
Figure 18. Nominal Taxable Sales Accumulated % Change, Seasonally Adjusted, 2005:Q1 to 2013:Q4
Table 5. Annual Nominal Taxable Sales of the City of Los Angeles by Major Business Type
2013 Sales (Thous $)
Share (%)
Annual Growth Rate (%) 2011 2012 2013 Retail and Food Services 31,949,776 76.5 8.5 6.2 4.3 Motor Vehicle and Parts Dealers 3,983,625 9.5 12.5 13.6 8.8 Home Furnishings and Appliance Stores 1,683,805 4.0 1.2 4.2 0.4 Building Materials and Supplies 2,086,608 5.0 7.1 5.9 7.4 Food and Beverage Stores 2,444,701 5.9 3.6 5.6 5.3 Gasoline Stations 4,954,380 11.9 20.4 2.8 -2.7 Clothing and Clothing Accessories Stores 3,032,886 7.3 6.4 6.2 5.1 General Merchandise Stores 2,873,530 6.9 5.0 3.7 4.1 Food Services and Drinking Places 6,946,625 16.6 7.3 8.5 5.8 Other Retail Group 3,943,616 9.4 4.3 3.2 6.1 All Other Outlets 9,806,938 23.5 9.4 5.4 3.2 Totals All Outlets 41,756,714 100 8.7 6.0 4.1
Source: California Board of Equalization
-30%
-20%
-10%
0%
10%
20%
30%
40%
2005 2006 2007 2008 2009 2010 2011 2012 2013 2014
Long Beach CityCity of Los AngelesSan Diego CityLos Angeles CountyAnaheim CityRiverside CitySanta Ana City
19%17%16%13%10%4%
-4%
22

Building Permits
Figure 19 displays quarterly seasonally adjusted residential building permits for the City of Los Angeles and four local counties from 2005:Q1 to 2015:Q1. Both the City and County of Los Angeles have seen a surge in building permits in the past few quarters. In 2015:Q1, the County reached 6,575 permits and The City reached 3,512 permits, both quite close to the 2006 peak. In 2014:Q4 Orange County reached 3,064, San Diego County reached 2,160, and Riverside County hit 1,752.
Figure 20 shows seasonally adjusted nonresidential building permit values from 2006:Q1 to 2014:Q4 for the City of Los Angeles and four local counties. The value of permits in both the City and County of Los Angeles’ are much higher than the other regions. In 2014:Q4, nonresidential building permit values reached $1.7 billion in Los Angeles County compared to $0.5B in Orange County, $0.4B in San Diego , and $0.1B in Riverside. Within Los Angeles County’s $1.7 billion, $1.3 billion occurred in the City of Los Angeles.
Figure 21 presents total building permit values, both residential and nonresidential, for the City of Los Angeles and the four counties. Total permit values for The City of Los Angeles have grown from $0.6 billion in 2009:Q3 to $1.8 billion in 2015:Q1. The data supports what we have heard from the media regarding several big development projects, including those of Asian developers, in the downtown L.A. area. An increase in the number and value of building permits is evidence that the developers are optimistic with respect to the future of The City.
Figure 19. Quarterly Residential Building Permits, Seasonally Adjusted, 2005:Q1 to 2015:Q1
0
1,000
2,000
3,000
4,000
5,000
6,000
7,000
8,000
9,000
05 06 07 08 09 10 11 12 13 14 15
Los Angeles CountyCity of Los Angeles Orange CountySan Diego CountyRiverside County
Sources: US Census Building Permits Survey and Real Estate and Construction Report
23

Figure 20. Quarterly Nominal Nonresidential Building Permit Values, Seasonally Adjusted, 2006:Q1 to 2014:Q4, Million $
0
400
800
1,200
1,600
2,000
2006 2007 2008 2009 2010 2011 2012 2013 2014
Los Angeles CountyCity of Los AngelesOrange CountySan Diego CountyRiverside County
(Million $)
Sources: US Census Building Permits Survey, Real Estate and Construction Report, and City of Los Angeles
Figure 21. Quarterly Nominal Total Building Permit Values, Seasonally Adjusted, 2006:Q1 to 2014:Q4, Million $
Sources: Real Estate and Construction Report and City of Los Angeles
0
500
1,000
1,500
2,000
2,500
3,000
3,500
2006 2007 2008 2009 2010 2011 2012 2013 2014
City of Los Angeles Los Angeles CountyOrange CountySan Diego CountyRiverside County
(Million $)
24
Commercial Real Estate
Figure 22 shows office market vacancy rates for the City of Los Angeles and surrounding regions from 2005:Q1 to 2015:Q1. Downtown L.A. has the highest vacancy rate—18.1% in 2015:Q1—followed by 16.5% in The Inland Empire, 15.5% in Los Angeles County, 13.7% in San Diego County and 12.9% in Orange County. West L.A. has the lowest vacancy rate, at 12.7%.
Figure 23 displays average asking rents for Class A office markets in both the City and County of Los Angeles from 2007 to 2014. West L.A. has the highest average rents at $4.47 per square foot (psf) in 2014:Q4, as compared to $3.36 psf in Downtown L.A, and $3.11 psf for Los Angeles County as a whole.
Figure 22. Office Market Average Vacancy Rates, 2005:Q1 to 2015:Q1
Source: Real Estate and Construction Report and CBRE Research
5.0
7.5
10.0
12.5
15.0
17.5
20.0
22.5
25.0
05 06 07 08 09 10 11 12 13 14 15
City of Los Angeles (Downtown LA)City of Los Angeles (West LA)Los Angeles CountyOrange CountyRiverside & San Bernardino CountiesSan Diego County
(%)
25

Figure 23. Office Market Average Asking Rents: Class A, 2007:Q2 to 2014:Q4, $ Per Square Foot
Source: Real Estate and Construction Report
Figure 24 shows industrial market vacancy rates for The City of Los Angeles and selected regions from 2005 to 2014. San Diego County has the highest vacancy rate at 6.8% followed by Orange County at 4.8%, The Inland Empire at 4.6%, and Los Angeles County at 1.6%. The current robust demand for industrial and warehouse space in Central L.A. has driven the vacancy rate to 1.1% and is the driver of new warehouse construction throughout Los Angeles County and The Inland Empire.
Figure 24. Industrial Market Average Vacancy Rates, 2005:Q1 to 2014:Q4
Source: Real Estate and Construction Report
2.8
3.2
3.6
4.0
4.4
4.8
5.2
2007 2008 2009 2010 2011 2012 2013 2014
City of Los Angeles (Downtown LA)City of Los Angeles (West LA)Los Angeles County
($ PSF)
0
2
4
6
8
10
12
14
05 06 07 08 09 10 11 12 13 14 15
Central Los AngelesLos Angeles CountyOrange CountyRiverside & San Bernardio CountiesSan Diego County
(%)
26
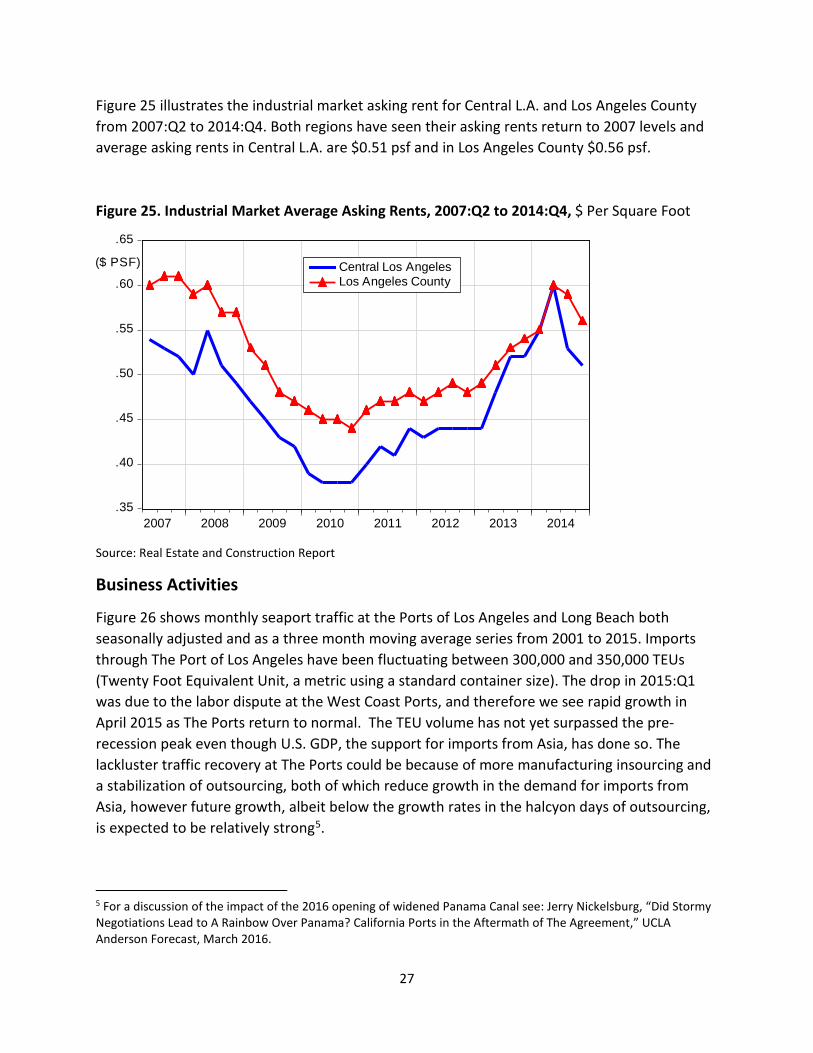
Figure 25 illustrates the industrial market asking rent for Central L.A. and Los Angeles County from 2007:Q2 to 2014:Q4. Both regions have seen their asking rents return to 2007 levels and average asking rents in Central L.A. are $0.51 psf and in Los Angeles County $0.56 psf.
Figure 25. Industrial Market Average Asking Rents, 2007:Q2 to 2014:Q4, $ Per Square Foot
Source: Real Estate and Construction Report
Business Activities
Figure 26 shows monthly seaport traffic at the Ports of Los Angeles and Long Beach both seasonally adjusted and as a three month moving average series from 2001 to 2015. Imports through The Port of Los Angeles have been fluctuating between 300,000 and 350,000 TEUs (Twenty Foot Equivalent Unit, a metric using a standard container size). The drop in 2015:Q1 was due to the labor dispute at the West Coast Ports, and therefore we see rapid growth in April 2015 as The Ports return to normal. The TEU volume has not yet surpassed the pre-recession peak even though U.S. GDP, the support for imports from Asia, has done so. The lackluster traffic recovery at The Ports could be because of more manufacturing insourcing and a stabilization of outsourcing, both of which reduce growth in the demand for imports from Asia, however future growth, albeit below the growth rates in the halcyon days of outsourcing, is expected to be relatively strong5.
5 For a discussion of the impact of the 2016 opening of widened Panama Canal see: Jerry Nickelsburg, “Did Stormy Negotiations Lead to A Rainbow Over Panama? California Ports in the Aftermath of The Agreement,” UCLA Anderson Forecast, March 2016.
.35
.40
.45
.50
.55
.60
.65
2007 2008 2009 2010 2011 2012 2013 2014
Central Los Angeles Los Angeles County
($ PSF)
27

Exports through The Port of Los Angeles show a strong performance in 2011 and 2012. However, recent data are impacted by the slowdown of China’s economy, the labor dispute, and the recent appreciation of the U.S. dollar.
Figure 27 presents air cargo data. Air cargo generally consists of more valuable and time sensitive products. Air cargo arrivals (imports) have risen over the past year but are still below pre-recession peak levels. Air cargo departures have steadily climbed over the past several years and have surpassed pre-recession peak levels. That is an indication that high-value California exports are expanding even though the macroeconomic environment is less favorable to exports in general.
Figure 28 shows monthly passenger traffic through Los Angeles International Airport (LAX). It is clear that over the past six years, passenger traffic increased significantly from 2.2 million travelers per month in 2009 to almost 3 million per month in 2015. This surpassing the pre-recession peak of 2.5 million passengers. This boost of visits to Los Angeles is in part a function of the rapidly growing international tourism industry in Southern California.
Figure 26. Monthly Los Angeles Seaport Traffic, Seasonally Adjusted and Three Month Moving Average
Sources: Ports of Los Angeles and Long Beach Note: A “TEU” is a “twenty-foot equivalent,” a standard shipping container
50
100
150
200
250
300
350
400
01 02 03 04 05 06 07 08 09 10 11 12 13 14 15
Port of Los Angeles ImportsPort of Long Beach ImportsPort of Los Angeles ExportsPort of Long Beach Exports
(Thous TEU)
28

Figure 27. Monthly Los Angeles Airport (LAX) Air Cargo, Seasonally Adjusted and Three Month Moving Average
Source: LA World Airports
Figure 28. Monthly Los Angeles Airport (LAX) Passenger Traffic, Seasonally Adjusted and Three Month Moving Average
2.1
2.2
2.3
2.4
2.5
2.6
2.7
2.8
2.9
3.0
04 05 06 07 08 09 10 11 12 13 14 15
Passenger ArrivalPassenger Departure
(Millions)
Source: LA World Airports, for scheduled carriers only
50
60
70
80
90
100
04 05 06 07 08 09 10 11 12 13 14 15
Air Cargo ArrivalAir Cargo Departure
(Thous Ton)
29

Economic Forecast 2015 to 2020
The City of Los Angeles economy is recovering, just as California and the rest of the nation as a whole. The urban core renaissance in downtown L.A. and the high tech boom in Venice (part of Silicon Beach) has contributed significantly to income and employment growth in the City of Los Angeles.
Looking to the next five years, we forecast The City’s economy will continue to grow. Our predictions are as follows. The detailed forecasts are displayed in Table 6.
• Payroll employment is forecast to grow from 1,623,000 in 2015 to 1,699,000 in 2020 with a total 4.7% growth during the forecast period. We forecast that the growth of high-wage jobs will be mitigated by some loss of low-wage jobs in the City of Los Angeles.
• Population is forecast to grow from 3,958,000 in 2015 to 4,101,000 in 2020 with a total 3.6% growth during the forecast period. In addition to natural growth, immigration, especially from Asian countries, will bolster the Los Angeles population and economy. Nevertheless, the rising cost of living due to expensive homes will push some residents to move to cheaper areas.
• Housing prices are forecast to continue to rise from $642,100 in 2015 to $794,300 in 2020 with a total of 24% growth during the forecast period. Los Angeles house value growth should outpace the U.S. economy because natural amenities like balmy weather and an ideal geographic location make Los Angeles an attractive region for domestic and international buyers. At the same time, a variety of restrictions including CEQA, water, congestion, and zoning should keep supply from growing fast enough to meet the new demand. Home sales are expected to increase from 14,500 in 2015 to 18,900 in 2020 with a total 31% growth during the forecast period as more supply comes to the market.
• Apartment rents are forecast to steadily rise from $2,549 in 2015 to $2,951 in 2020 with a total of 16% growth during the forecast period. Apartment vacancy rates are expected to remain in a low range of 4.5% to 5.1%.
• Taxable sales will grow from $44.5 billion in 2015 to $50.4 billion in 2020 with a total of 13% growth during the forecast period.
• Building permits will continue to expand into 2020 as rental rates and property values rise. Residential permits are expected to grow from 12,300 in 2015 to 16,300 in 2020 with a total of 32% growth during the forecast period. Nonresidential permit values are expected to grow from $4.4 billion in 2015 to $5 billion in 2020 with a total of 14% growth.
• Commercial real estate is forecast remain vibrant with the recovery of the Los Angeles housing market and economy. Office rents (Class A) in Downtown L.A. are forecast rise steadily from $3.20 per square foot in 2015 to $3.50 per square foot in 2020. Office rents (Class A) in West L.A. are expected to steadily rise from $4.30 per square foot in 2015 to
30

$5.10 per square foot in 2020. Office vacancy rates in Downtown L.A. are expected to fluctuate between 13.3% and 18.1% over the forecast period. Office vacancy rates in West L.A. should range between 8.8% and 12.8% over the forecast period. Industrial rents in Central L.A. are forecast to rise from $0.60 per square foot in 2015 to $0.80 in 2020 and Industrial vacancy rates should remain low at approximately 0.8% to 1.3% over the forecast period.
Table 6. Economic Forecast for the City of Los Angeles
Source: Anderson Forecast
31