CITY OF HOLLISTER...
203
C ITY OF H OLLISTER CALIFORNIA COMPREHENSIVE ANNUAL FINANCIAL REPORT FOR THE FISCAL YEAR ENDED JUNE 30, 2010
Transcript of CITY OF HOLLISTER...

CITY OF HOLLISTER CALIFORNIA
COMPREHENSIVE ANNUAL FINANCIAL REPORT FOR THE FISCAL YEAR ENDED
JUNE 30, 2010
____________________________________________________________________________________________
CITY OF HOLLISTERCALIFORNIA
COMPREHENSIVE ANNUAL FINANCIAL REPORT
FOR THE YEAR ENDED JUNE 30, 2010
____________________________________________________________________________________________
PREPARED BYFINANCE DEPARTMENT

CITY OF HOLLISTERFOR THE YEAR ENDED JUNE 30, 2010
TABLE OF CONTENTS
Page
INTRODUCTORY SECTION:
Transmittal Letter i - ix
GFOA Award x
City Council and Principal City Officials xi
Organization Chart xii
FINANCIAL SECTION:
Independent Auditor's Report on Basic Financial Statements 1- 2
Management's Discussion and Analysis 3 - 14
Basic Financial Statements:
Government-wide Financial Statements
Statement of Net Assets 15
Statement of Activities 16
Fund Financial Statements
Balance Sheet - Governmental Funds 17 - 18
Reconciliation of the Governmental Funds Balance Sheet to the Government-wideStatement of Net Assets 19
Statement of Revenues, Expenditures and Changes in Fund Balances - GovernmentalFunds 20 - 21
Reconciliation of the Statement of Revenues, Expenditures and Changes in FundBalances to the Statement of Activities - Governmental Funds 22
Statement of Net Assets - Proprietary Funds 23 - 24
Statement of Revenues, Expenses and Changes in Net Assets - Proprietary Funds 25 - 26
Statement of Cash Flows - Proprietary Funds 27 - 28
Statement of Fiduciary Net Assets - Fiduciary Funds 29
Notes to Basic Financial Statements 30 - 62
Required Supplemental Information:
Schedule of Revenues, Expenditures and Changes in Fund Balance Budget and Actual -General Fund 63 - 66
Schedule of Revenues, Expenditures and Changes in Fund Balance Budget and Actual -Measure T Fund 67 - 68
Schedule of Revenues, Expenditures and Changes in Fund Balance Budget and Actual -Redevelopment Agency Housing Fund 69
Notes to Required Supplemental Information 70
Schedule of Funding Progress for CalPERS Pension Plans 71
Schedule of Funding Progress for Other Post Employment Benefits (OPEB) 72
CITY OF HOLLISTERFOR THE YEAR ENDED JUNE 30, 2010
TABLE OF CONTENTS
Page
Combining Financial Statements and Other Supplemental Information:
Budgetary Comparison Schedule - RDA Capital Projects Fund 73 - 74
Budgetary Comparison Schedule - RDA Debt Service Fund 75
Non-Major Governmental Funds:
Non-Major Fund Descriptions 76 - 78
Combining Balance Sheets 79 - 86
Combining Statements of Revenues, Expenditures and Changes in Fund Balance 87 - 94
Schedule of Revenues, Expenditures, and Changes in Fund Balance - Budget and Actual
CDBG Low Income Housing Rehab 95
Federal HES CalTran 96
Gas Tax 97
Traffic Safety 98
Park Dedication 99
Local Transportation 100
San Benito Loan Program 101
Law Enforcement Program 102
Federal Aviation Admin Grant 103
Hollister Air Show 104
CHRPO 105
EDA 106
Transportation Development Act 107
Spay/Neuter Education 108
Mello-Roos CFD-001 109
Youth Center 110
Oil Recycling Grants 111
Police Special Law Enforcement Safety 112
Office of Traffic Safety 113
Local Law Enforcement 114
COPS More Program 115
Animal Welfare 116
COPS in School Program 117
Airport Building 25 Reimbursement 118

CITY OF HOLLISTERFOR THE YEAR ENDED JUNE 30, 2010
TABLE OF CONTENTS
Page
Combining Financial Statements and Other Supplemental Information (continued):
4th of July Rally 119
Information Systems 120
JAG Grant Equipment 121
JAG Grant Recovery Act 122
Police Office of Traffic Safety 123
Traffic Congestion Relief 124
Airport Master Plan Study 125
RZH River Trail 126
Signal Improvement Fee on Flynn 127
Council of Governments 128
San Felipe Bikeway 129
Home Program Revolving Loans 130
Fire Impact 131
Police Impact 132
Storm Drain Fees 133
Storm Drain Impact Fees 134
Traffic Impact 135
AB 1600 Santa Ana Storm Drain 136
Jail Juvenile Hall 137
Local Street & Road Improvement 138
ARRA 139
Trust and Agency Funds:
Agency Fund Descriptions 140
Combining Schedule of Fiduciary Net Assets 141
Schedule of Changes in Fiduciary Net Assets 142 - 144
STATISTICAL SECTION
Description of Statistical Section 145
Financial Trends
Net Assets by Component 146
Changes in Net Assets 147 - 149

CITY OF HOLLISTERFOR THE YEAR ENDED JUNE 30, 2010
TABLE OF CONTENTS
Page
STATISTICAL SECTION (continued)
Financial Trends (continued)
Fund Balances - Governmental Funds 150
Changes in Fund Balance - Governmental Funds 151
Revenue Capacity
Property Taxes Levies and Collections - Direct and Overlapping Governments 152
Assessed Value of Taxable Property 153
Property Tax Rates - Direct and Overlapping Governments 154
Principal Property Taxpayers 155
Debt Capacity
Legal Debt Margin Information 156
Ratios of Net General Obligation Bonded Debt to Taxable Assessed Value and Net GeneralObligation Bonded Debt per Capita 157
Ratio of Outstanding Debt by Type 158
Overlapping Bonded Debt 159
Ratio of General Bonded Debt Outstanding 160
Economic and Demographic Information
Demographic and Economic Statistics 161
Principal Employers 162
Miscellaneous Statistical Information 163
Operating Information
Operating Indicators by Function 164
Capital Asset Statistics by Function 165
Full-time Equivalent City Government Employees by Function/Program 166
GLOSSARY FOR THE COMPREHENSIVE ANNUAL FINANCIAL REPORT 167 - 174
OTHER REPORTS:
Report on Compliance and Internal Control over Financial Reporting and Other MattersBased on an Audit of Financial Statements Performed in Accordance with GovernmentAuditing Standards 175 - 176
Schedule of Findings and Responses 177
Schedule of Prior Year Findings and Responses 178

INTRODUCTORY SECTION
CITY OF H OLLISTER
375 Fifth Stree t s Hollister, CA 95023·3876
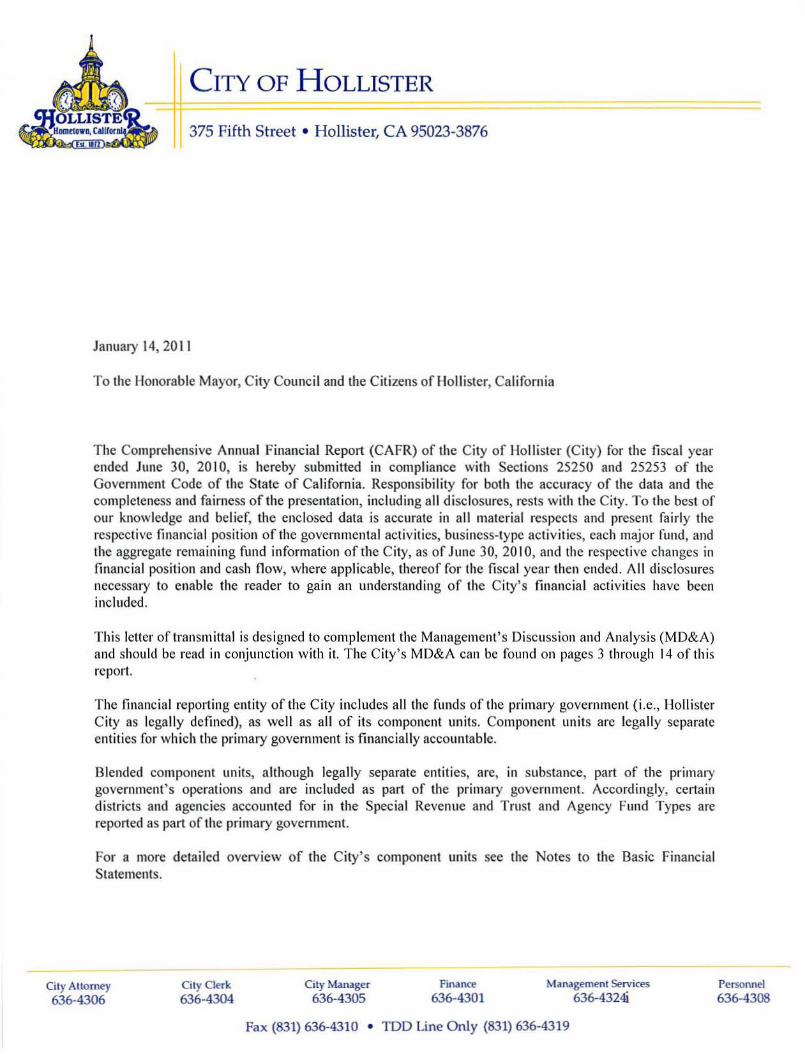
January 14, 201 1
To the Iionorable Mayor, City Co uncil and the Cit izens of Holl ister, Califo r nia
The Comprehensive Annual Financia l Report (CAFR) of the City of Hollister {City} for the fiscal yearended June 3D, 20 10, is hereby submitted in compliance with Sections 25250 and 25253 of theGovernment Code of the State of California. Responsibility for both the accuracy of the data and thecompleteness and fa irness of the presentat ion, including a ll d isclosures, rests with the City. To the best ofou r knowledge and bel ie f, the enclosed data is accurate in a ll material respects and present fairly therespecti ve financial position of the governmental activities, business-type activ ities, each major fund, andthe aggregate remaining fund information of the C ity, as of June 30, 20 I0, and the respective changes infinancial posit ion and cash flow, where applicable, thereof for the fiscal year then ended. All disclosuresnecessary to enable the reader to gain an understanding of the City'S financial activities have beenincluded.
This letter of transmittal is designed to complement thc Management' s Discussion and Analysis (MD&A)and should bc read in conjunction with it. The City ' S MD&A can be found on pages 3 through 14 of thisreport.
The financial reporting entity of the C ity include s all the funds of the primary gove rnment (i.e., Hollis terCity as legally defined), as well as all of its component units, Com pone nt units are legally sepa rateentities for which the primary governme nt is financ ially accountable.
Blended com ponen t units, a lthough legally separate entit ies, arc, in substance, part of the primarygovernment's operations and are included as part of the primary gove rnment. Accordingly, certa indistricts and agencies accounted for in the Spec ial Revenue and Trust and Age ncy Fund Types arereport ed as part of the primary government.
For a more detai led overview of the City ' s component units see the Notes to the Basic FinancialStatements.
City Attorney636-4306
City Cle rk636-4304
City Manage r
636-4305fin.J1lC'l'
636-4301Ma nagement Servic es
636-4324Personnel636-4308
Fax (831) 636-4310 • TDD Line Only (831) 636-4319

ii
PROFILE OF THE GOVERNMENT Hollister is a city in and the county seat of San Benito County, California, United States. The population was 34,413 at the 2000 census and is currently 36,599. Hollister is primarily an agricultural town. The Mutsun Ohlone Indians were the first known inhabitants of the Hollister region. The town, then located in Monterey County, was founded November 19, 1868 originally as the San Justo Homestead Association, established by William Welles Hollister (1818–1886), a group that originally intended to name it San Justo. An association member, Napa vintner Henry Hagen, objected. Hagen argued that place names in California were dominated by Spanish saint names, and suggested that the state should have a town named after someone less holy. The City was incorporated on August 29, 1872. The western portion of San Benito County, including Hollister, was separated from Monterey County in 1874. The county was expanded eastward in 1887 to include portions taken from Merced and Fresno Counties. The City of Hollister is a General Law City and is governed by a “Council Manager” form of government. The Council, as the legislative body, represents the citizens of Hollister, and is empowered by the Municipal Code to formulate citywide policy, enact local legislation, adopt budgets, and appoint the City Manager and City Attorney. The City Council consists of five Council Members who are elected by district by the citizens of Hollister, and serve staggered four-year terms, with elections held in November of even-numbered years. The Council Members elect the Mayor from among themselves every year. The City of Hollister has 123 full time employees and an operating budget of over $53,000,000. The City offices are comprised of the following departments: City Manager, City Attorney, City Clerk, Administrative Services ( Finance and Human Resources), Information Systems, Development Services( Planning, Building, and Redevelopment), Code Enforcement, Engineering, Community Services(Public Works, Operation and Maintenance, Utilities, and Recreation), Airport, Fire, and Police( which includes Animal Control. The City provides a full range of services including law enforcement; fire protection; the construction and maintenance of streets and infrastructure assets; code enforcement; building inspections; water and wastewater; and administration. MAJOR INITIATIVES City of Hollister is undertaking several major initiatives notwithstanding significant fiscal limitations: Issuance of the Redevelopment Agency’s 2009 Tax Allocation Bond and beginning construction of the remodeling of the City’s Fire Station On July 22, 2009, the Redevelopment Agency of the City of Hollister issued $8,000,000 in tax allocation bonds. The proceeds of the bond have been used to start the remodeling of the City’s Fire Station Number one. Construction is planned to be finished by the end of the next fiscal year.

iii
State of California and the Supplemental Educational Revenue Augmentation Fund (SERAF) In July 2009, the California Legislature passed ABX4-26 as part of the State’s budget package which requires redevelopment agencies to remit approximately $2.05 billion in redevelopment revenues back to the State. Under ABX4-26, each redevelopment agency must contribute a proportionate share of revenue to the newly created Supplemental Educational Revenue Augmentation Fund (SERAF). The bill authorizes redevelopment agencies, from July 1, 2009, to June 30, 2010, to suspend all or part of its required 20% allocation to its Low and Moderate Income Housing Fund in order to make the required payments. The Housing Fund must be repaid by June 30, 2015. If the agency fails to repay the Housing Fund, the required allocation of tax increment to the Housing Fund is increased to 25% for most agencies as long as the project area continues to receive tax increment. This will result in the delay or elimination of many affordable housing projects where redevelopment funding is a key funding component. In October 2009, the California Redevelopment Association and two of its members filed a lawsuit to challenge the constitutionality of the bill. A ruling is expected before May 2010, the date redevelopment agencies must make their 2009-2010 payment to the State. The amount payable to the State from the City totals $4,458,626 in 2009-2010 and $917,952 in 2010-2011. Measure T Sales Tax Initiative On November 6, 2007, the citizens of the City of Hollister passed Measure T which increase the City’s sales and use tax by 1%. The measure also required the assemblage of an advisory citizens’ oversight committee which tracks the spending of the tax proceeds. The tax increase will sunset after five years. Other Redevelopment Agency Project The City’s redevelopment agency is working with the County of San Benito and the State of California to locate a new courthouse building on agency/ city owned property in the downtown area. Solar Agreement The City approved a deal with ClearSpot Energy to build a 1.2-megawatt solar plant at the City’s wastewater treatment plant which will provide power for the plant at a reduced rate. Construction is to begin in fiscal year 2010-2011. Vista Meadows Senior Housing The City provided public infrastructure and financing to help in the completion of the Vista Meadows Senior Housing project. The project is a 72 unit very low income senior housing apartment complex. Self-Help Housing The City provided public infrastructure and financing to help in the completion of 25 self-help low income housing units.
iv
FACTORS AFFECTING FINANCIAL CONDITION Foreclosures Foreclosures continue to be a major factor for the City. At one time the City was the second worst City in the State of California for foreclosures based on estimates from Realtytrac.com. Currently 1 in every 187 housing units received a foreclosure filing in 2010. According to Realtytrac.com, there are approximately 603 homes in the City of Hollister that are at some stage of foreclosure as of the end of fiscal year 2010: - 235 Homes are currently-Bank Owned properties - 213 Homes are scheduled for Trustee Sale; and
- 155 Homes are in Pre-Foreclosure process (Notice of Defaults-most of these units will be foreclosed)
The median home sales price for the City of Hollister has increased from $243,000 as of April 1st, 2009 to $271,000 as of June 2010. The current average foreclosure sales price is at $266,277. In addition, according to the California Department of Finance, the estimated residential foreclosure rate for the City of Hollister is 6.0%, based on the total number (603) of foreclosure fillings divided by the total number (10,584) of residential housing units. Abandoned and foreclosed homes have had an adverse impact on various major metropolitan, suburban and rural areas to varying degrees. Specifically, the City of Hollister has been burdened with a correlated rise in blight, vandalism, illegal occupancy, code enforcement violations and declining land values as a result of abandoned and foreclosed homes and the declining housing market. Recently, the City increased the number of code enforcement officers in an effort to properly mitigate the negative impacts caused by code enforcement violations. Based on HUD projections, this matter is only forecasted to worsen due to relaxed underwriting standards in the recent past, for mortgages that are due to have variable interest rates reset in the near future, thus producing an increase in mortgage defaults and eventual foreclosures. Homeowners who can't keep up with their mortgages aren't the only ones being hit by the foreclosure crisis. City and County governments are losing time and money to the problem. Assessors have to look more closely at housing to figure out its market value. Inspectors spend more time citing properties for health and safety sub-standards. Houses are taking longer to sell which keeps them off tax rolls. Unoccupied houses also don't use utilities such as water; sewer and garbage services, meaning the costs have to be spread among fewer people. It takes a significant amount of time and resources to track down the owners of foreclosed properties. It's difficult to find the owners because mortgage loans are resold among lenders and investors. It is much more cost effective for lenders to work with at-risk homeowner’s to keep them in their homes. The Foreclosure Prevention Workshops will be valuable and necessary in meeting the needs of the community by educating at risk homeowners on various options of foreclosure prevention. The public’s concern has expedited the need to develop a pro-active foreclosure prevention program; therefore City staff is exploring the creation of a Hollister Neighborhood Stabilization Pilot-Program, with a multi-approach to developing a local foreclosure prevention strategy. The strategy includes:

v
- Continue the implementation of the City Ordinance requiring Lenders to register foreclosure homes;
- Collaborate with the County of San Benito to conduct Foreclosure Prevention Workshops
in an effort to educate households at risk of loosing their homes and promote awareness of fair housing in the community as well as pursuing additional funding opportunities;
- Stabilize neighborhoods deeply affected by foreclosure crisis by acquiring foreclosed
and/or abandoned homes with limited rehabilitation requirements. Rehabilitate the homes to meet minimum housing quality standards and cost effective energy efficiency if needed and sell them to low and moderate-income households up to 120% of area median income;
- Continue providing Downpayment Assistance to first-time homebuyers to purchase
foreclosure homes; and - Collaborate with the County of San Benito to apply for additional funding.
Unemployment San Benito County’s unemployment rate was 15.6% for June 2010 per the Bureau of Labor Statistics (www.bls.gov/cgi-bin/dsrv). The unemployment rate has been as high as 22.1% this calendar year well above the National’s average of 9.7%. This equated to more than 6,000 individuals that were unemployed (not adjusted for seasonal employment) in the local area in February 2010. Retail Sales Retail sales occurring in the April through June quarter were 3.2% higher than the same period last year for the City. The State of California retail sales tax increase 4.7% higher for the same period. However, this is an 18.4% decrease compared to 2008.
Fiscal Year 2010-2011 second Quarter Financial Forecast
Similar to the vast majority of public agencies and private enterprises around the globe, City of Hollister is experiencing financial crises involving swells of instability in the financial markets, significant delays of cash reimbursement from the State of California for services provided on their behalf, and a budget challenge deeper than the City has seen in decades. Many long-term financial challenges are occurring concurrently and deepening suddenly. The State of California has been delaying or deferring payments to the City of Hollister for mandated costs, Highway User taxes, and other payments. It has caused a cash crunch that is demanding extraordinary cash management efforts be performed by the Finance office. Because of the global liquidity crisis in the financial markets, the State of California and others, including the City of Hollister, do not have access to additional credit at affordable rates. This credit crunch requires staff to seek short-term cash flow borrowing between City operating and special revenue and enterprise funds to ensure sufficient operating capital through the end of the fiscal year. And, last but not least concerning, the City is expecting a $4.5 million budget shortfall in tax revenues, interest earnings, other revenues and unanticipated expenses by fiscal year 2013-2014.

vi
Economy-driven impacts to City provided programs and services will be less severe with proactive management of the City’s budget. A broad array of immediate actions will be taken to ensure sufficient liquidity, by curtailing spending, improving revenue collections, and adjusting to a new economic condition. Actions may include increased advocacy, internal borrowing, extraordinary reviews of proposed hiring, a stringent purchase and contract review procedure, deferment of capital projects, and required cost reductions. While analysis finds substantial department budget shortfalls, which will likely reduce the City General Fund contingency to near zero by the end of the 2010-11 fiscal year, the most concerning trend is the sharp drop in tax and other discretionary revenue trends. Several key revenues are on track to be about $.5 million less than originally anticipated. The cause for the estimated $.5 million shortfall rests entirely on the recently sharpening downturn in the state and local economies. The state, national, and global economies have fallen sharply and the general prognosis, among economists at all levels, is that we are entering into a deepening and prolonged global recession. City tax receipts typically lag behind economic activity, ranging from 6 months for sales taxes to more than a year for property taxes. Economic activity is expected to continue to be flat in 2011. Staff is forecasting further declines in revenues next fiscal year than the City is experiencing this fiscal year. The following fiscal year looks equally bleak or worse, due to the property tax collections lag following re-evaluations, and recent news from the California Public Employees’ Retirement System (CalPERS) that the City can expect a 4% of payroll cost increase to the City’s pension obligations beginning July 1, 2011, to offset CalPERS’ prior asset losses in past fiscal years. The State of California has recently revised their current budget deficit from $8.3 billion. State financial forecasters are clearly responding to similar revenue decline trends and economic data that the City and other California agencies are observing. Since the City relies on State subventions for part of its budget, staff expects additional risk and potentially additional budgetary impacts this fiscal year, if and when the State comes to terms with its increasing budget deficit. One action that the State Legislature has taken in fiscal year 2009-10 was to pass ABX4-26 as part of the State’s budget package which requires redevelopment agencies to remit approximately $2.05 billion in redevelopment revenues back to the State. Under ABX4-26, each redevelopment agency must contribute a proportionate share of revenue to the newly created Supplemental Educational Revenue Augmentation Fund (SERAF). The bill authorizes redevelopment agencies, from July 1, 2009, to June 30, 2010, to suspend all or part of its required 20% allocation to its Low and Moderate Income Housing Fund in order to make the required payments. The Housing Fund must be repaid by June 30, 2015. If the agency fails to repay the Housing Fund, the required allocation of tax increment to the Housing Fund is increased to 25% for most agencies as long as the project area continues to receive tax increment. This will result in the delay or elimination of many affordable housing projects where redevelopment funding is a key funding component. In October 2009, the California Redevelopment Association and two of its members filed a lawsuit to challenge the constitutionality of the bill. A ruling is expected before May 2010, the date redevelopment agencies must make their 2009-2010 payment to the State. The amount payable to the State from the City totals $4,458,626 in 2009-2010 and $917,952 in 2010-2011. The Administrative and Finance offices were joined by fiscal staff in all City departments to conduct a thorough review of the City’s financial condition, including current year budgetary status, cash situation, credit position, and its outlook for the new budget year commencing July 1, 2010. The City is not alone in facing these unprecedented challenges on three tough financial fronts. Governments and businesses, at all levels worldwide, are facing these same challenges. The review of all three fiscal arenas concludes with the following findings:
vii
The City needs to conduct internal short-term cash borrowing to ensure sufficient cash for daily operations through June 30, 2011. The City, and other municipalities, will have new challenges when seeking cash flow loans and selling bonds for capital and/or other obligations. Staff efforts will need to be redirected to minimize new credit costs. The remaining $2.1 million of General Fund contingency will be needed to offset unanticipated department expenses and under-realized department revenues. Much of these adjustments are due to the summer fire responses and recovery efforts. The City needs to find an additional $4.5 million in General Fund budgetary solutions by fiscal year 2013-2014, due to the sharp economic downturn’s impact on tax and other discretionary revenues. Since the City is a service organization that must maintain a balanced budget, these solutions are expected to significantly impact important services, City residents, other customers, and City employees. The City is facing a structural budget deficit by fiscal year 2011-2012 that is currently estimated to be at $0.3 million. This estimate will be revised after the first installment of property taxes is collected in January and closure of the second quarter. The City is fortunate to have an experienced City Council and professional staff to lead our community through these very difficult financial challenges. Collectively, the City will fully and comprehensively respond to the economic downturn, while minimizing short and long-term impacts. We will need to wrestle with the State of California over their delays in reimbursements. We will need to contemplate all ideas for solutions, leaving no rock or stone unturned. Internal Control The management of the City is responsible for establishing and maintaining internal controls designed to ensure that the assets of the government are protected from loss, theft or misuse and to ensure that adequate accounting data is compiled to allow for the preparation of financial statements in conformity with accounting principles generally accepted in the United States of America. Internal controls are designed to provide reasonable, but not absolute, assurance that these objectives are met. The concept of reasonable assurance recognizes that: (1) the cost of a control should not exceed the benefits likely to be derived; and (2) choices between these two concepts often require estimates and judgments by management. Budgeting Controls In addition to accounting controls, the City maintains budgetary controls. The objective of these controls is to ensure compliance with legal provisions embodied in the annual appropriated budget approved by the City Council. In accordance with the provisions of the City’s Municipal Code and other statutory provisions, the City prepares a budget for each fiscal year on or before June 30. Budgeted expenditures are enacted into law through the passage of an Appropriation Ordinance. This ordinance mandates the maximum authorized expenditures for the fiscal year and cannot be exceeded except by subsequent amendments to the budget by the City Council.
viii
An operating budget is adopted each fiscal year for all Governmental Funds. Expenditures are controlled at the major object level within budget units for the City. The major object level within a budget unit is the level at which expenditures may not legally exceed appropriations. Any amendments or transfers of appropriations between object levels within the same budget unit or between departments or funds are authorized by the City Manager and must be approved by the City Council. The City Council must approve supplementary appropriations normally financed by unanticipated revenues during the year. Cash Management Cash temporarily idle during the year was invested in the Local Agency Investment Fund (LAIF) managed by the California State Treasurer’s Office. The first and primary objective of the City Treasurer’s investment of public funds is to safeguard investment principal; second, to maintain sufficient liquidity within the portfolio to meet daily cash flow requirements, and third, to achieve a reasonable rate of return or yield on the portfolio consistent with these objectives. The portfolio is actively managed in a manner that is responsive to the public trust and consistent with State law. Restrictive investment policies are in place to minimize credit and market risks while maintaining a competitive yield on the portfolios. The City Treasurer’s selection of investments is more restrictive than those authorized in Sections 53601 and 53635 of the California Government Code and gives primary consideration to the safety and preservation of the principal amounts invested. On-going cash flow projections are maintained for the coming twelve months to assure that adequate funds are available to meet daily cash expenditure requirements. State statutes, specific debt financing indentures and contractual arrangements generally determine the investment restrictions of City cash and investments not held in the City Treasury. Risk Management The City of Hollister uses a program of self-insurance for workers’ compensation and general liability claims to minimize losses. The City is self-insured for workers' compensation up to $500,000 per occurrence. The City participates in a multi-agency joint powers authority to provide excess insurance coverage for liability coverage. The joint powers authority and the City rely on estimates prepared by professional actuaries to set aside funds adequate to meet potential future losses. Excess coverage purchased through the joint powers authority covers claims in excess of $1,000,000 for general liability claims. Employee Benefit Plans The City participates in and contributes to the employee retirement plans with CalPERS, an agent multiple-employer defined benefit retirement plan that acts as a common investment and administrative agent for various local and state governmental agencies within the state. CalPERS provides retirement, disability, and death benefits based on the employees’ years of service, age, and final compensation. Copies of the CalPERS’ annual financial report are available through CalPERS.
OT IiEll lNFOIlMATION
Indep end en t Aud it
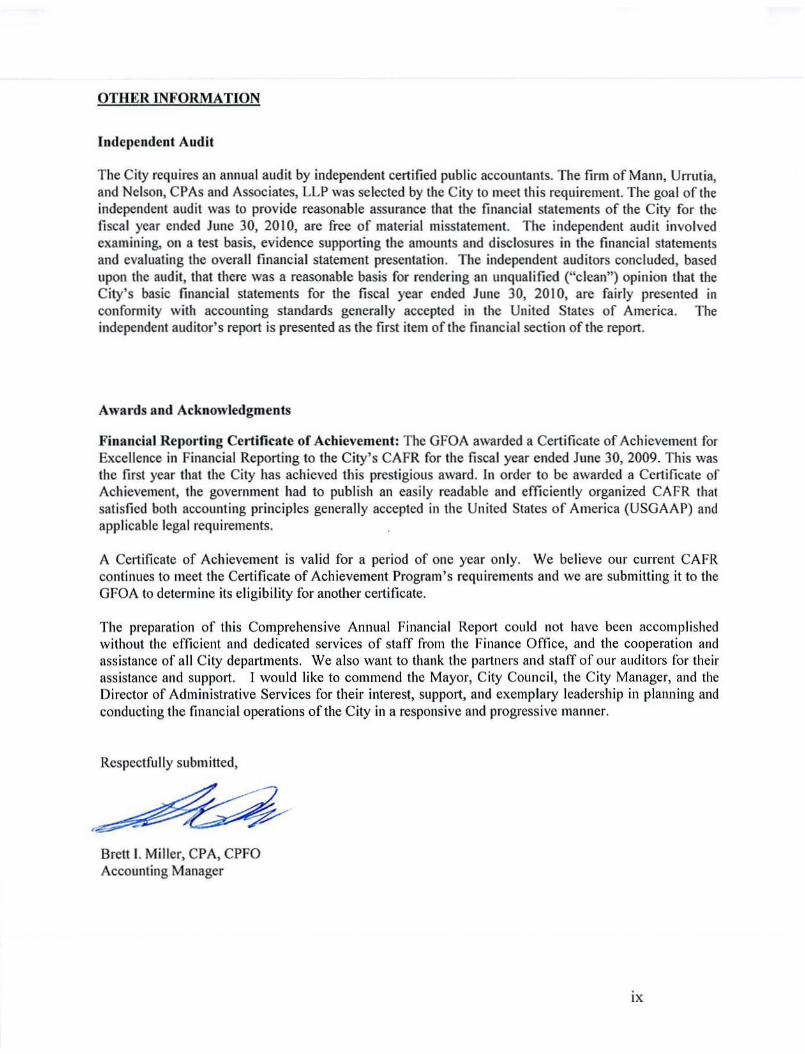
The City requires an annual audit by independent cert ified pub lic accountants. The finn of Mann, Urrutia,and Nelson, C l 'As and Assoc iates, LLP was selected by the City to meet this requirement. The goa l of theindependent audit was to prov ide reasonab le assurance that the financial statements of the City for thefiscal year ended June 30, 2010, arc free of mater ial misstatement. The independent audit involvedexa mining, on a test basis, evidence supporting the amounts and disclosures in the financia l statementsand evaluating the ove rall financia l statement present ation. The independent auditors concluded, basedupon the audit, that there was a reaso nable basis for render ing an unq ualifi ed ("clea n") opinion that theCity's basic financ ial statements for the fiscal year ended June 30, 2010 , are fairly presen ted inconformity with accounting standards generally accepted in the United States of America . Theindependent audito r's report is presented as the first item of the financial section of the report.
Awards and Acknowledg ments
Financial Report ing Ce rt ifica te of Achieve ment : The OFOA awarded a Certificate of Achievement forExce llence in Financial Reporting to the C ity's CAFR for the fisca l year ended Jun e 30, 2009. This wasthe first year that the City has achieved this prestig ious award. In order (0 be awarded a Certificate ofAchievement, the government had to publish an easily readab le and effi ciently organ ized CAFR thatsa tisfied both accounting principles generally accepted in the United States of America (USGAA P) andapplicable legal requi rements.
A Cert ificate of Achieveme nt is valid for a per iod of one year only. We be lieve ou r current CAFRconti nues to meet the Certificate of Achievement Program' s requi rements and we arc submitt ing it to theOrOA to deter mine its eligib ility for another certificate.
The preparation of this Co mprehensive Annual Financia l Report co uld not have been accomplishedwithout the efficient and dedicated services of staff from the Finance Office, and the coope rat ion andassistance of all C ity depart ments. We also want to thank the partners and sta ff of our auditors for theirassistance and support. I would like to commend the Mayor, City Council, the City Manager, and theDirector of Administrative Services for thei r interest, support, and exemplary leadership in planning andconducting the financial ope rations of the C ity in a responsive and progressive manner.
Respect fully submitted,
Brett I. Miller, CPA, CPFOAccount ing Manager
IX

x
Certificate of Achievement for Excellence
in Financial Reporting
Presented to
City of Hollister California
For i ts Comprehensive Annual Financial Report
for the Fiscal Year Ended June 30, 2009
A Certificate of Achievement for Excellence in Financial Reporting is presented by the Government Finance Officers
Association of the United States and Canada to government units and public employee retirement
systems whose comprehensive annual financial reports (CAFRs) achieve the highest
standards in government accounting and financial reporting.
President
Executive Director
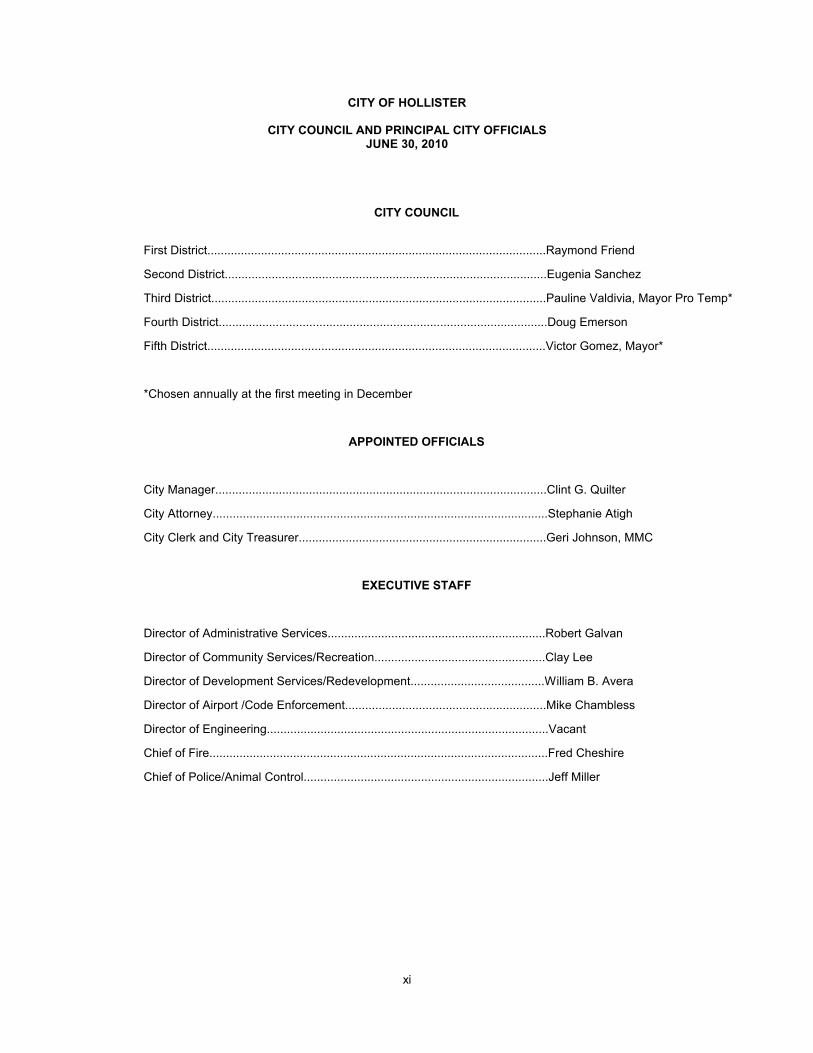
CITY OF HOLLISTER
CITY COUNCIL AND PRINCIPAL CITY OFFICIALSJUNE 30, 2010
CITY COUNCIL
First District.....................................................................................................Raymond Friend
Second District................................................................................................Eugenia Sanchez
Third District....................................................................................................Pauline Valdivia, Mayor Pro Temp*
Fourth District..................................................................................................Doug Emerson
Fifth District.....................................................................................................Victor Gomez, Mayor*
*Chosen annually at the first meeting in December
APPOINTED OFFICIALS
City Manager...................................................................................................Clint G. Quilter
City Attorney....................................................................................................Stephanie Atigh
City Clerk and City Treasurer..........................................................................Geri Johnson, MMC
EXECUTIVE STAFF
Director of Administrative Services.................................................................Robert Galvan
Director of Community Services/Recreation...................................................Clay Lee
Director of Development Services/Redevelopment........................................William B. Avera
Director of Airport /Code Enforcement............................................................Mike Chambless
Director of Engineering....................................................................................Vacant
Chief of Fire.....................................................................................................Fred Cheshire
Chief of Police/Animal Control.........................................................................Jeff Miller
xi

CITY OF HOLLISTER, CALIFORNIA
Organizational Chart
Community (Electorate)
City Council City Treasurer
City Manager City Attorney
Administrative Services
Development Services
Community Services Police Fire
Animal Control Operations and Maintenance
Utilities
Finance
Human Resources/ Risk Management
RDA
Planning
RDA Housing
Building (contract)
Engineering Airport
Recreation
CATV
City Clerk Information Systems
Code Enforcement
ekp
Typewritten Text
ekp
Typewritten Text
xii

FINANCIAL SECTION
ROSEV ILLE OFF ICE
2901 Douglas Boulevard. Suite 290
Roseville, CA 95661
TEL 916774-4208
FAX 916 774-4230
MANNURRU TI A
NELSON
CPAs
ASSOCIATESLLP
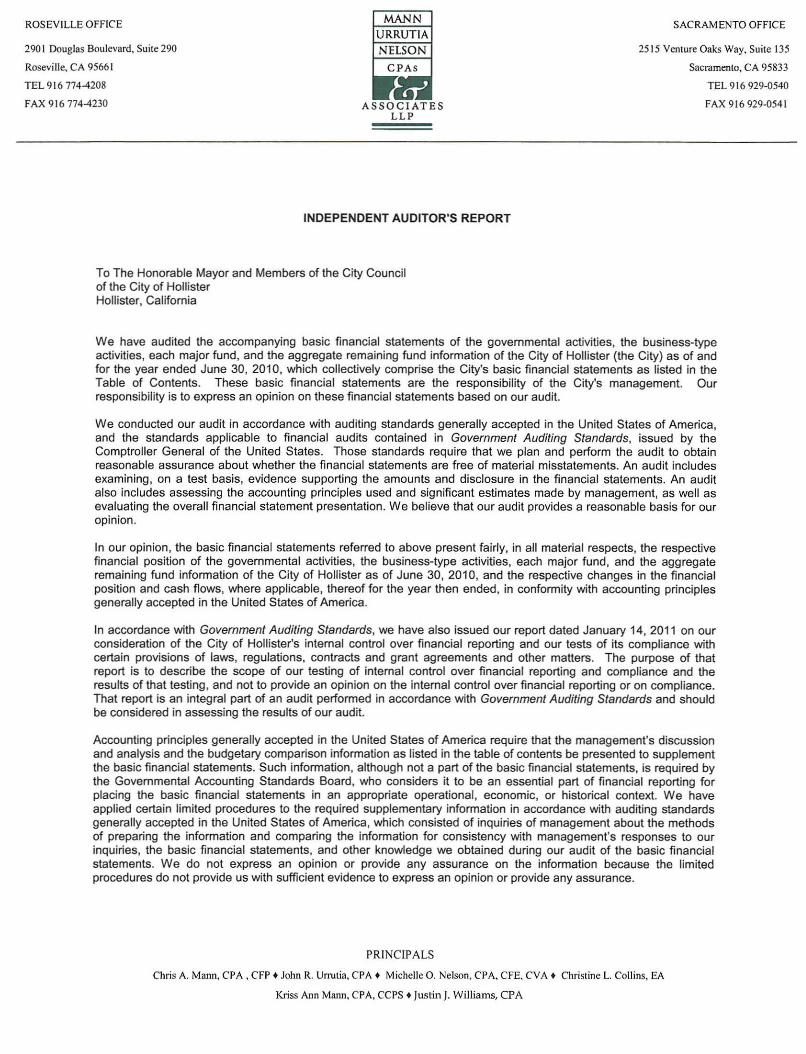
INDEPENDENT AUDITOR'S REPORT
SACRAMENTO OFFICE
2515 Venture OaksWay,Suite 135
Sacramento, CA 95833
TEL 9 I6 929-054 0
FAX 916 929-0541
To The Honorable Mayor and Members of the City Councilof the City of HollisterHollister, California
We have audited the accompanying basic financial statements of the governmental activities, the business-typeactivities, each major fund, and the aggregate remaining fund information of the City of Hollister (the City) as of andfor the year ended June 30, 2010, which collectively comprise the City's basic financial statements as listed in theTable of Contents. These basic financial statements are the responsibility of the City's management. Ourresponsibility is to express an opinion on these financial statements based on our audit.
We conducted our audit in accordance with auditing standards generally accepted in the United States of America,and the standards applicable to financial audits contained in Government Auditing Standards, issued by theComptroller General of the United States. Those standards require that we plan and perform the audit to obtainreasonable assurance about whether the financial statements are free of material misstatements. An audit includesexamining, on a test basis, evidence supporting the amounts and disclosure in the financial statements. An auditalso includes assessing the accounting principles used and significant estimates made by management, as well asevaluating the overall financial statement presentation. We believe that our audit provides a reasonable basis for ouropinion.
In our opinion, the basic financial statements referred to above present fairly, in all material respects, the respectivefinancial position of the governmental activities, the business-type activities, each major fund, and the aggregateremaining fund information of the City of Hollister as of June 30, 2010, and the respective changes in the financialposition and cash flows, where applicable, thereof for the year then ended, in conformity with accounting principlesgenerally accepted in the United States of America.
In accordance with Government Auditing Standards, we have also issued our report dated January 14, 2011 on ourconsideration of the City of Hollister's internal control over financial reporting and our tests of its compliance withcertain provisions of laws, regulations, contracts and grant agreements and other matters. The purpose of thatreport is to describe the scope of our testing of internal control over financial reporting and compliance and theresults of that testing, and not to provide an opinion on the internal control over financial reporting or on compliance.That report is an integral part of an audit performed in accordance with Government Auditing Standards and shouldbe considered in assessing the results of our audit.
Accounting principles generally accepted in the United States of America require that the management's discussionand analysis and the budgetary comparison information as listed in the table of contents be presented to supplementthe basic financial statements. Such information, although not a part of the basic financial statements, is required bythe Governmental Accounting Standards Board, who considers it to be an essential part of financial reporting forplacing the basic financial statements in an appropriate operational, economic, or historical context. We haveapplied certain limited procedures to the required supplementary information in accordance with auditing standardsgenerally accepted in the United States of America, which consisted of inquiries of management about the methodsof preparing the information and comparing the information for consistency with manage ment's responses to ourinquiries, the basic financial statements, and other knowledge we obtained during our audit of the basic financialstatements. We do not express an opinion or provide any assurance on the information because the limitedprocedures do not provide us with sufficient evidence to express an opinion or provide any assurance.
PRINCIPALS
Chris A. Mann. CPA, CFP . John R. Urrutia, CPA . MichelIeO. Nelson. CPA,CFE. eVA . Christine L. Collins,EA
Kriss Ann Mann, CPA, ceps . Justin J. Williams, CPA

Our audit was conducted for the purpose of forming opinions on the financial statements that collectively comprisethe City of Hollister's basic financial statements. The introductory section, combining and individual nonmajor fundfinancial statements, budgetary comparison schedules, and statistical section are presented for purposes ofadditional analysis and are not a required part of the basic financial statements. The combining and individualnonmajor fund financial statements and the budgetary comparison schedules are the responsibility of managementand were derived from and relate directly to the underlying accounting and other records used to prepare thefinancial statements. The information has been subjected to the auditing procedures applied in the audit of thefinancial statements and certain additional procedures, including comparing and reconciling such information directlyto the underlying accounting and other records used to prepare the financial statements or to the financialstatements themselves, and other additional procedures in accordance with auditing standards generally accepted inthe United States of America. In our opinion, the information is fairly stated in all material respects in relation to thefinancial statements as a whole. The introductory and statistical sections have not been subjected to the auditingprocedures applied in the audit of the basic financial statements and, accordingly, we do not express an opinion orprovide any assurance on it.
CITY OF HOLLISTERMANAGEMENT'S DISCUSSION AND ANALYSIS
FOR THE YEAR ENDED JUNE 30, 2010
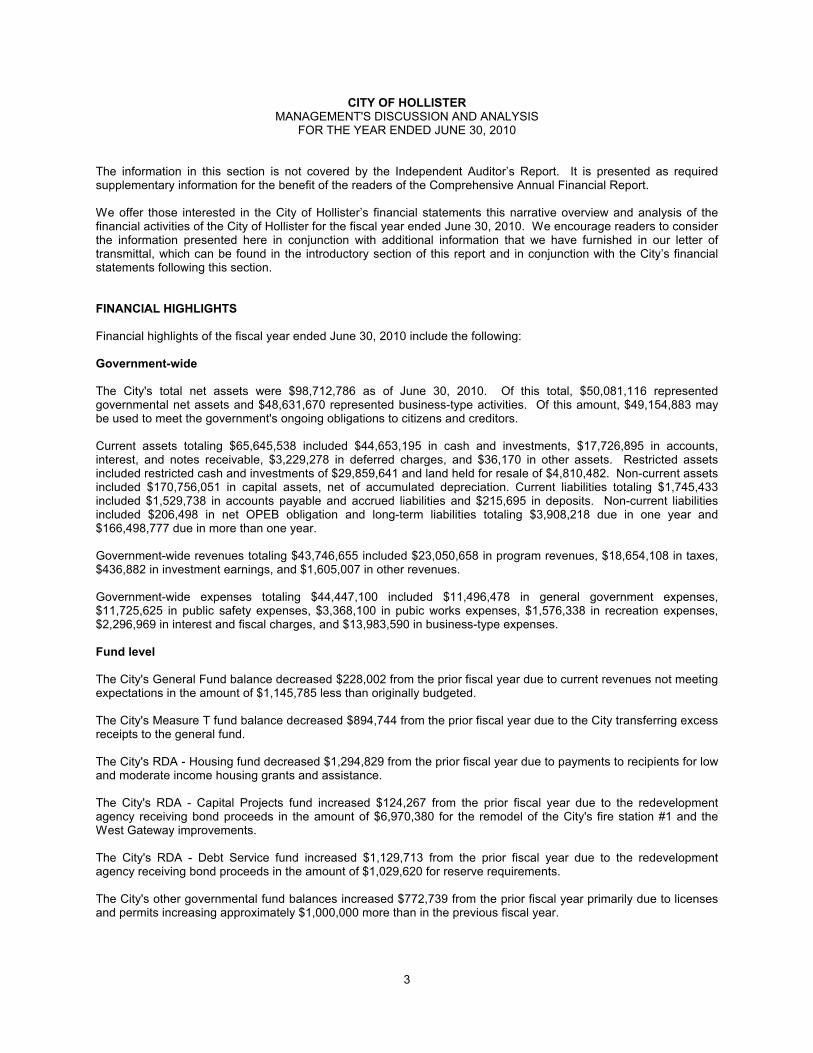
The information in this section is not covered by the Independent Auditor’s Report. It is presented as requiredsupplementary information for the benefit of the readers of the Comprehensive Annual Financial Report.
We offer those interested in the City of Hollister’s financial statements this narrative overview and analysis of thefinancial activities of the City of Hollister for the fiscal year ended June 30, 2010. We encourage readers to considerthe information presented here in conjunction with additional information that we have furnished in our letter oftransmittal, which can be found in the introductory section of this report and in conjunction with the City’s financialstatements following this section.
FINANCIAL HIGHLIGHTS
Financial highlights of the fiscal year ended June 30, 2010 include the following:
Government-wide
The City's total net assets were $98,712,786 as of June 30, 2010. Of this total, $50,081,116 representedgovernmental net assets and $48,631,670 represented business-type activities. Of this amount, $49,154,883 maybe used to meet the government's ongoing obligations to citizens and creditors.
Current assets totaling $65,645,538 included $44,653,195 in cash and investments, $17,726,895 in accounts,interest, and notes receivable, $3,229,278 in deferred charges, and $36,170 in other assets. Restricted assetsincluded restricted cash and investments of $29,859,641 and land held for resale of $4,810,482. Non-current assetsincluded $170,756,051 in capital assets, net of accumulated depreciation. Current liabilities totaling $1,745,433included $1,529,738 in accounts payable and accrued liabilities and $215,695 in deposits. Non-current liabilitiesincluded $206,498 in net OPEB obligation and long-term liabilities totaling $3,908,218 due in one year and$166,498,777 due in more than one year.
Government-wide revenues totaling $43,746,655 included $23,050,658 in program revenues, $18,654,108 in taxes,$436,882 in investment earnings, and $1,605,007 in other revenues.
Government-wide expenses totaling $44,447,100 included $11,496,478 in general government expenses,$11,725,625 in public safety expenses, $3,368,100 in pubic works expenses, $1,576,338 in recreation expenses,$2,296,969 in interest and fiscal charges, and $13,983,590 in business-type expenses.
Fund level
The City's General Fund balance decreased $228,002 from the prior fiscal year due to current revenues not meetingexpectations in the amount of $1,145,785 less than originally budgeted.
The City's Measure T fund balance decreased $894,744 from the prior fiscal year due to the City transferring excessreceipts to the general fund.
The City's RDA - Housing fund decreased $1,294,829 from the prior fiscal year due to payments to recipients for lowand moderate income housing grants and assistance.
The City's RDA - Capital Projects fund increased $124,267 from the prior fiscal year due to the redevelopmentagency receiving bond proceeds in the amount of $6,970,380 for the remodel of the City's fire station #1 and theWest Gateway improvements.
The City's RDA - Debt Service fund increased $1,129,713 from the prior fiscal year due to the redevelopmentagency receiving bond proceeds in the amount of $1,029,620 for reserve requirements.
The City's other governmental fund balances increased $772,739 from the prior fiscal year primarily due to licensesand permits increasing approximately $1,000,000 more than in the previous fiscal year.
3
CITY OF HOLLISTERMANAGEMENT'S DISCUSSION AND ANALYSIS (continued)
FOR THE YEAR ENDED JUNE 30, 2010
OVERVIEW OF THE FINANCIAL STATEMENTS
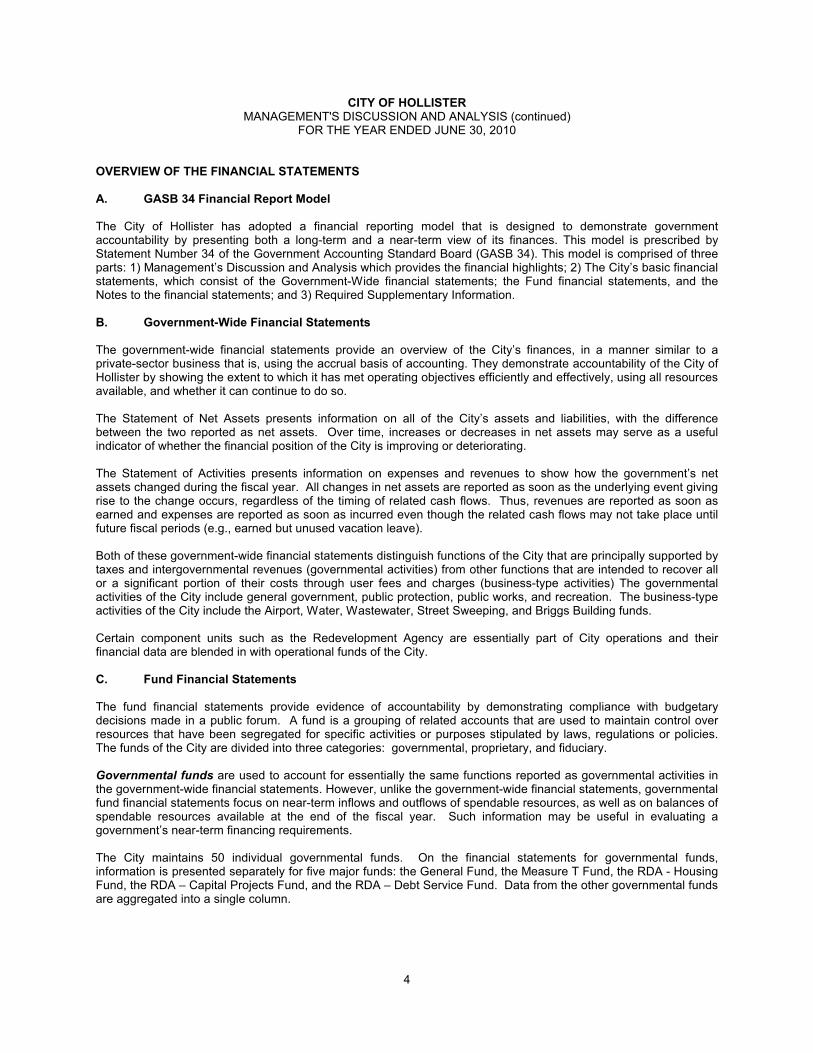
A. GASB 34 Financial Report Model
The City of Hollister has adopted a financial reporting model that is designed to demonstrate governmentaccountability by presenting both a long-term and a near-term view of its finances. This model is prescribed byStatement Number 34 of the Government Accounting Standard Board (GASB 34). This model is comprised of threeparts: 1) Management’s Discussion and Analysis which provides the financial highlights; 2) The City’s basic financialstatements, which consist of the Government-Wide financial statements; the Fund financial statements, and theNotes to the financial statements; and 3) Required Supplementary Information.
B. Government-Wide Financial Statements
The government-wide financial statements provide an overview of the City’s finances, in a manner similar to aprivate-sector business that is, using the accrual basis of accounting. They demonstrate accountability of the City ofHollister by showing the extent to which it has met operating objectives efficiently and effectively, using all resourcesavailable, and whether it can continue to do so.
The Statement of Net Assets presents information on all of the City’s assets and liabilities, with the differencebetween the two reported as net assets. Over time, increases or decreases in net assets may serve as a usefulindicator of whether the financial position of the City is improving or deteriorating.
The Statement of Activities presents information on expenses and revenues to show how the government’s netassets changed during the fiscal year. All changes in net assets are reported as soon as the underlying event givingrise to the change occurs, regardless of the timing of related cash flows. Thus, revenues are reported as soon asearned and expenses are reported as soon as incurred even though the related cash flows may not take place untilfuture fiscal periods (e.g., earned but unused vacation leave).
Both of these government-wide financial statements distinguish functions of the City that are principally supported bytaxes and intergovernmental revenues (governmental activities) from other functions that are intended to recover allor a significant portion of their costs through user fees and charges (business-type activities) The governmentalactivities of the City include general government, public protection, public works, and recreation. The business-typeactivities of the City include the Airport, Water, Wastewater, Street Sweeping, and Briggs Building funds.
Certain component units such as the Redevelopment Agency are essentially part of City operations and theirfinancial data are blended in with operational funds of the City.
C. Fund Financial Statements
The fund financial statements provide evidence of accountability by demonstrating compliance with budgetarydecisions made in a public forum. A fund is a grouping of related accounts that are used to maintain control overresources that have been segregated for specific activities or purposes stipulated by laws, regulations or policies.The funds of the City are divided into three categories: governmental, proprietary, and fiduciary.
Governmental funds are used to account for essentially the same functions reported as governmental activities inthe government-wide financial statements. However, unlike the government-wide financial statements, governmentalfund financial statements focus on near-term inflows and outflows of spendable resources, as well as on balances ofspendable resources available at the end of the fiscal year. Such information may be useful in evaluating agovernment’s near-term financing requirements.
The City maintains 50 individual governmental funds. On the financial statements for governmental funds,information is presented separately for five major funds: the General Fund, the Measure T Fund, the RDA - HousingFund, the RDA – Capital Projects Fund, and the RDA – Debt Service Fund. Data from the other governmental fundsare aggregated into a single column.
4

CITY OF HOLLISTERMANAGEMENT'S DISCUSSION AND ANALYSIS (continued)
FOR THE YEAR ENDED JUNE 30, 2010
Proprietary funds are of two types. Enterprise funds are used to report the same functions presented as business-type activities in the government-wide financial statements. The City uses enterprise funds to account for its Airport,Water, Wastewater, Street Sweeping, and Briggs Building operations. Internal service funds are used to accumulateand allocate costs internally among the City’s various functions. The City does not use internal service funds.
Proprietary funds statements provide the same type of information as the part of government-wide financialstatements pertaining to business-type activities, only in more detail.
Fiduciary funds are used to account for resources held for the benefit of parties outside the government. Fiduciaryfunds are not reflected in the government-wide financial statement because the resources of those funds are notavailable to support the City’s programs.
Notes to the Basic Financial Statements provide additional information that is essential to a full understanding ofthe financial information provided in the government-wide and fund financial statements.
D. Required Supplementary Information
In addition to the basic financial statements, this report presents Required Supplementary Information. The requiredsupplementary information presents the City’s progress in funding its obligation to provide pension benefits to itsemployees as well as the City's General Fund and major special revenue fund's budgetary comparison schedules.
E. Combining Statements and Schedules
The combining and individual fund statements and schedules referred to earlier provide information for nonmajorgovernmental funds and fiduciary funds, and are presented immediately following the required supplementaryinformation.
GOVERNMENT-WIDE FINANCIAL STATEMENTS
This analysis focuses on net assets and the changes in net assets of the City as a whole:
TABLE 1GOVERNMENT-WIDE NET ASSETS JUNE 30, 2010 and 2009
Governmental Activities Business-type Activities Total Government
2010 2009 2010 2009 2010 2009
ASSETSCurrent and other assets $ 63,627,668 $ 60,618,934 $ 36,687,993 $ 38,867,209 $100,315,661 $ 99,486,143Capital assets 34,477,787 34,867,109 136,278,264 111,435,794 170,756,051 146,302,903
Total Assets 98,105,455 95,486,043 172,966,257 150,303,003 271,071,712 245,789,046
LIABILITIESCurrent and other liabilities 1,199,964 1,109,080 545,469 478,600 1,745,433 1,587,680Long-term liabilities 46,824,375 39,475,191 123,789,118 125,932,034 170,613,493 165,407,225
Total Liabilities 48,024,339 40,584,271 124,334,587 126,410,634 172,358,926 166,994,905
NET ASSETSInvested in capital assets,
net of related debt (403,587) (1,238,024) 34,874,146 33,421,263 34,470,559 32,183,239Restricted for debt service 4,019,249 2,889,536 - - 4,019,249 2,889,536Redevelopment activities 11,068,095 12,362,924 - - 11,068,095 12,362,924Unrestricted 35,397,359 40,887,336 13,757,524 10,765,382 49,154,883 51,652,718
Total Net Assets $ 50,081,116 $ 54,901,772 $ 48,631,670 $ 44,186,645 $ 98,712,786 $ 99,088,417
5
CITY OF HOLLISTERMANAGEMENT'S DISCUSSION AND ANALYSIS (continued)
FOR THE YEAR ENDED JUNE 30, 2010
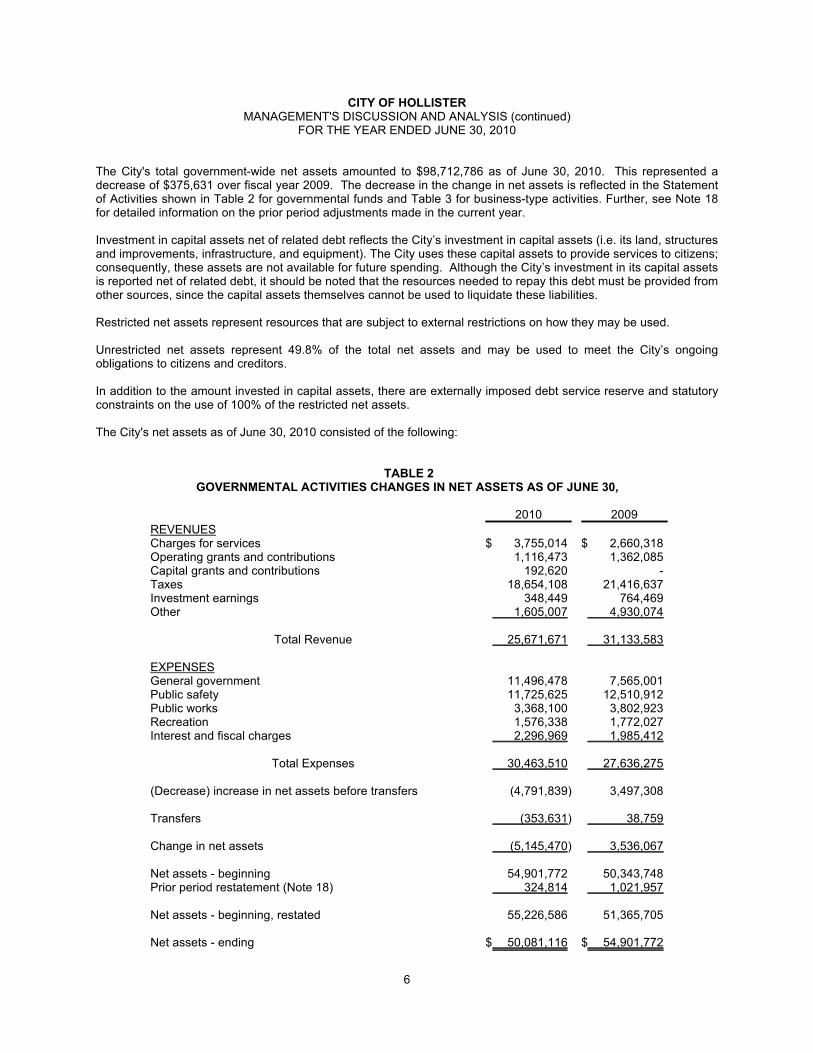
The City's total government-wide net assets amounted to $98,712,786 as of June 30, 2010. This represented adecrease of $375,631 over fiscal year 2009. The decrease in the change in net assets is reflected in the Statementof Activities shown in Table 2 for governmental funds and Table 3 for business-type activities. Further, see Note 18for detailed information on the prior period adjustments made in the current year.
Investment in capital assets net of related debt reflects the City’s investment in capital assets (i.e. its land, structuresand improvements, infrastructure, and equipment). The City uses these capital assets to provide services to citizens;consequently, these assets are not available for future spending. Although the City’s investment in its capital assetsis reported net of related debt, it should be noted that the resources needed to repay this debt must be provided fromother sources, since the capital assets themselves cannot be used to liquidate these liabilities.
Restricted net assets represent resources that are subject to external restrictions on how they may be used.
Unrestricted net assets represent 49.8% of the total net assets and may be used to meet the City’s ongoingobligations to citizens and creditors.
In addition to the amount invested in capital assets, there are externally imposed debt service reserve and statutoryconstraints on the use of 100% of the restricted net assets.
The City's net assets as of June 30, 2010 consisted of the following:
TABLE 2GOVERNMENTAL ACTIVITIES CHANGES IN NET ASSETS AS OF JUNE 30,
2010 2009
REVENUESCharges for services $ 3,755,014 $ 2,660,318Operating grants and contributions 1,116,473 1,362,085Capital grants and contributions 192,620 -Taxes 18,654,108 21,416,637Investment earnings 348,449 764,469Other 1,605,007 4,930,074
Total Revenue 25,671,671 31,133,583
EXPENSESGeneral government 11,496,478 7,565,001Public safety 11,725,625 12,510,912Public works 3,368,100 3,802,923Recreation 1,576,338 1,772,027Interest and fiscal charges 2,296,969 1,985,412
Total Expenses 30,463,510 27,636,275
(Decrease) increase in net assets before transfers (4,791,839) 3,497,308
Transfers (353,631) 38,759
Change in net assets (5,145,470) 3,536,067
Net assets - beginning 54,901,772 50,343,748Prior period restatement (Note 18) 324,814 1,021,957
Net assets - beginning, restated 55,226,586 51,365,705
Net assets - ending $ 50,081,116 $ 54,901,772
6

CITY OF HOLLISTERMANAGEMENT'S DISCUSSION AND ANALYSIS (continued)
FOR THE YEAR ENDED JUNE 30, 2010
15%Charges for Services
4%Operating Grants & Contributions
73% Taxes
1% Investment Earnings6% Other Revenues
1% Capital Grants & Contributions
Sources of RevenuesGovermental Activities
As reflected above, seventy-three percent (73%) or $18,654,108 of the City's governmental activities revenues as ofJune 30, 2010 were comprised of tax increments. Program revenues were twenty percent (20%) of governmentalactivities. Of this amount, four percent (4%) or $1,116,473 were derived from operating grants and contributions,one percent (1%) was derived from capital grants and contributions, and fifteen percent (15%) or $3,755,014 werederived from charges for services. The remaining sources of revenues included one percent (1%) or $348,449 ofinvestment earnings, and six percent (6%) or $1,605,007 of other revenues.
Taxes
The City's overall allocation of tax increments have decreased mainly due to the City's Redevelopment Agency. TheAgency experienced a $1.6 million decrease in property taxes compared to the prior fiscal year. In addition, salestaxes have declined which is associated with the decline in the economy. For this reason, the 12.9% decrease($18,654,108 in FY '09-10 vs. $21,416,637 in prior year FY '08-09) illustrates this point.
7

CITY OF HOLLISTERMANAGEMENT'S DISCUSSION AND ANALYSIS (continued)
FOR THE YEAR ENDED JUNE 30, 2010
38%General Government
38% Public Safety
11% Public Works
5% Recreation8% Interest and Fiscal Charges
Functional ExpensesGovernmental Activities
As identified in the functional expenses chart, thirty-eight percent (38%) or $11,725,625 of the City's expenses werefor public safety. Thirty-eight (38%) or $11,496,478 were for general government expenses. The remainingfunctional expenses included eleven (11%) or $3,368,100 for public works, five percent (5%) or $1,576,338 inrecreation, and eight percent (8%) or $2,296,969 in interest and fiscal charges. The City's total governmentalexpenses increased $2,827,235 from the prior fiscal year.
The change in expenses from prior year is attributable to various factors:
General Government Expenses
General government expenses increased $3,931,477 or 51.9%. The main increase was due to expenses associatedwith the City's Redevelopment Agency's requirement to pay $4,462,862 to the Supplemental Education RevenueAugmentation Fund (SERAF) as part of the State of California's budget package which required redevelopmentagencies to remit approximately $2.05 billion in redevelopment revenues back to the State.
Public Works Expenses
Public works expenses decreased 11.44% or $434,823 from the prior year. This was attributable to the Citydecreasing spending on design and construction of the street overlay projects.
Public Safety Expenses
In addition, public safety expenses decreased 6.3% or $785,287. The main decrease was related to expensesassociated with budget cuts due to declining revenues.
Recreation Expenses
Recreation expenses decreased 11.0% or $195,689 due to budget curs associated with declining revenues.
8

CITY OF HOLLISTERMANAGEMENT'S DISCUSSION AND ANALYSIS (continued)
FOR THE YEAR ENDED JUNE 30, 2010
TABLE 3BUSINESS-TYPE ACTIVITIES CHANGES IN NET ASSETS AS OF JUNE 30,
2010 2009
REVENUESCharges for services $ 17,986,551 $ 16,385,597Investment earnings 88,433 575,313
Total Revenue 18,074,984 16,960,910
EXPENSESAirport 852,930 873,910Water 3,776,513 3,919,817Sewer 8,716,397 7,195,980Street sweeping 409,517 363,054Briggs Building 228,233 223,840
Total Expenses 13,983,590 12,576,601
Increase in net assets before transfers 4,091,394 4,384,309
Transfers 353,631 (38,759)
Change in net assets 4,445,025 4,345,550
Net assets - beginning 44,186,645 39,841,095
Net assets - ending $ 48,631,670 $ 44,186,645
In the fiscal year ended June 30, 2010, business-type activities increased the City's net assets by $4,445,025.
Charges for Services
Charges for services increased $1,600,954 or 9.8% over the prior fiscal year. This was the result of a 10% rateincrease for wastewater charges. The increase in wastewater charges was directly related to the costs associatedwith the debt incurred for the construction of the City's wastewater treatment plant.
Investment Earnings
Investment earnings decreased $486,880 or 84.6% due to the use of bond proceeds for the completion of the City'swastewater treatment plant. Cash related to the bond issuances was invested and yielded $88,433 in earnings.
Expenses
Expenses under the City's water and wastewater enterprise funds were directly attributable to the normal operationcosts associated with the operation of both systems. The additional costs incurred under the wastewater fundcorresponded to the initial implementation costs for the City's wastewater treatment plant.
9

CITY OF HOLLISTERMANAGEMENT'S DISCUSSION AND ANALYSIS (continued)
FOR THE YEAR ENDED JUNE 30, 2010
FINANCIAL ANALYSIS OF FUNDS
As noted earlier, the City uses fund accounting to ensure and demonstrate compliance with budgetary and legalrequirements.
Governmental funds - The general government functions are included in the General, Special Revenue, CapitalProject, and Debt Service Funds. The focus of the City’s governmental funds is to provide information on near-terminflows, outflows, and balances of spendable resources. Such information is useful in assessing the City’s financingrequirements. In particular, the unreserved fund balance may serve as a useful measure of the City’s net resourcesavailable for spending at the end of the fiscal year.
At June 30, 2010, the City’s governmental funds reported combined ending fund balances of $49,360,363.Approximately 59.6% of this total amount ($29,429,789) constitutes the unreserved fund balance, which may beused to meet the City’s ongoing general obligations to citizens and creditors. The remainder of the fund balance isreserved to indicate that it is not available for general obligations because it has been committed in the form of landheld for resale, inventories, debt service reserves, or the funds have statutory restrictions.
The General Fund is the main operating fund of the City. At June 30, 2010, the unreserved fund balance of thegeneral fund was $2,126,112 while the total fund balance amounted to $2,158,860. As measures of the generalfund’s liquidity, it is useful to note that the unreserved fund balance represents 13.8% percent of total fundexpenditures, while the total fund balance represents 14.0% percent of that same amount. The general fund’s fundbalance decreased by $228,002 during the current fiscal year. The City's decrease of $228,002 from the prior fiscalyear was due to current revenues not meeting expectations for property and sales taxes.
The Measure T fund had a total fund balance of $8,480 which is unreserved. The overall fund balance decreased by$894,744 due to the transfer of excess revenues to the general fund.
The RDA - Housing fund has a total fund balance of $11,068,095 which is reserved. The overall fund balancedecreased by $1,294,829 due to payments for low and moderate housing projects in the fiscal year.
The RDA - Capital Projects fund had a total fund balance of $14,050,836. Of this amount, $4,810,482 was reserved,and the balance of $9,240,354 was unreserved. The City's RDA - Capital Projects fund increased $124,267 from theprior fiscal year due to the redevelopment agency’s bond proceeds not being completely expended in the currentfiscal year.
The RDA - Debt Service fund had a total fund balance of $4,019,249 which was reserved. The City's RDA - DebtService fund increased $1,129,713 from the prior fiscal year due to the redevelopment agency’s increase in bondreserves associated with the current year's bond issuance.
The following table presents revenues from various sources as well as reflecting increases or decreases from theprior fiscal year in the governmental funds.
TABLE 4REVENUES IN THE GOVERNMENTAL FUNDS (in thousands)
FY 2010 FY 2009 ChangeRevenue Sources Amount % of Total Amount % of Total Amount % of Change
Taxes $ 18,654 %72.5 $ 21,417 %68.7 $ (2,763) %(12.9)Licenses and permits 2,136 %8.3 1,071 %3.4 1,065 %99.4Intergovernmental 1,309 %5.1 1,362 %4.4 (53) %(3.9)Charges for services 1,434 %5.6 946 %3.0 488 %51.6Fines and forfeitures 185 %0.7 643 %2.1 (458) %(71.2)Investment earnings 348 %1.4 764 %2.5 (416) %(54.5)Others 1,669 %6.5 4,980 %16.0 (3,311) %(66.5)
Total $ 25,735 %100 $ 31,183 %100 $ (5,448) %(17.5)
10
CITY OF HOLLISTERMANAGEMENT'S DISCUSSION AND ANALYSIS (continued)
FOR THE YEAR ENDED JUNE 30, 2010
72%Taxes
8% Licenses and Permits
5% Intergovernmental
6% Charges for Services1% Fines and Forfeitures
1% Investment Earnings6% Other Revenues
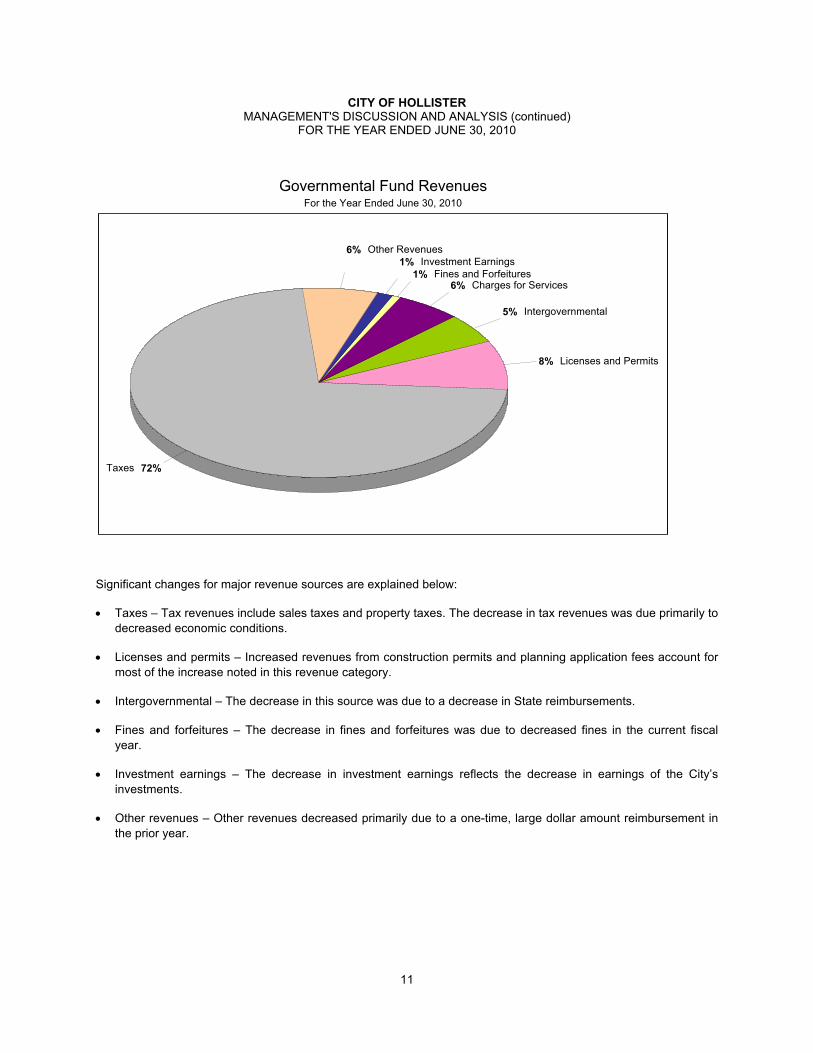
Governmental Fund RevenuesFor the Year Ended June 30, 2010
Significant changes for major revenue sources are explained below:
Taxes – Tax revenues include sales taxes and property taxes. The decrease in tax revenues was due primarily to
decreased economic conditions.
Licenses and permits – Increased revenues from construction permits and planning application fees account for
most of the increase noted in this revenue category.
Intergovernmental – The decrease in this source was due to a decrease in State reimbursements.
Fines and forfeitures – The decrease in fines and forfeitures was due to decreased fines in the current fiscal
year.
Investment earnings – The decrease in investment earnings reflects the decrease in earnings of the City’s
investments.
Other revenues – Other revenues decreased primarily due to a one-time, large dollar amount reimbursement in
the prior year.
11
CITY OF HOLLISTERMANAGEMENT'S DISCUSSION AND ANALYSIS (continued)
FOR THE YEAR ENDED JUNE 30, 2010
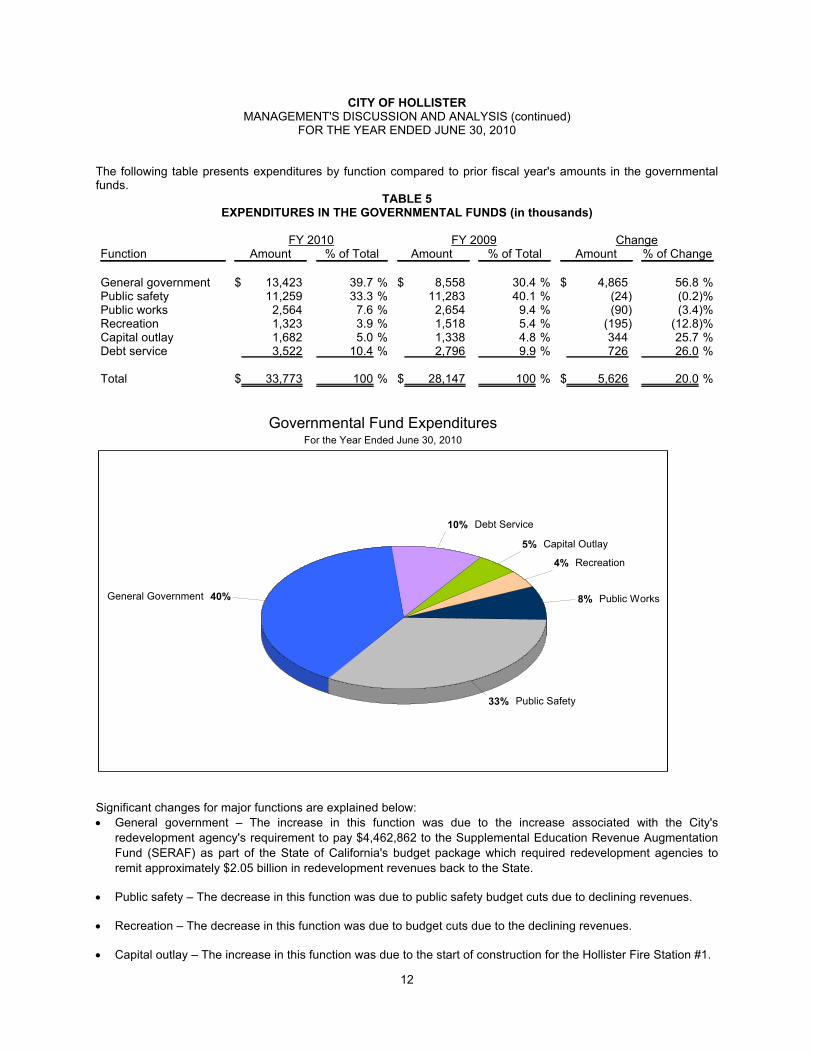
The following table presents expenditures by function compared to prior fiscal year's amounts in the governmentalfunds.
TABLE 5EXPENDITURES IN THE GOVERNMENTAL FUNDS (in thousands)
FY 2010 FY 2009 ChangeFunction Amount % of Total Amount % of Total Amount % of Change
General government $ 13,423 %39.7 $ 8,558 %30.4 $ 4,865 %56.8Public safety 11,259 %33.3 11,283 %40.1 (24) %(0.2)Public works 2,564 %7.6 2,654 %9.4 (90) %(3.4)Recreation 1,323 %3.9 1,518 %5.4 (195) %(12.8)Capital outlay 1,682 %5.0 1,338 %4.8 344 %25.7Debt service 3,522 %10.4 2,796 %9.9 726 %26.0
Total $ 33,773 %100 $ 28,147 %100 $ 5,626 %20.0
40%General Government
33% Public Safety
8% Public Works
4% Recreation
5% Capital Outlay
10% Debt Service
Governmental Fund ExpendituresFor the Year Ended June 30, 2010
Significant changes for major functions are explained below:
General government – The increase in this function was due to the increase associated with the City's
redevelopment agency's requirement to pay $4,462,862 to the Supplemental Education Revenue Augmentation
Fund (SERAF) as part of the State of California's budget package which required redevelopment agencies to
remit approximately $2.05 billion in redevelopment revenues back to the State.
Public safety – The decrease in this function was due to public safety budget cuts due to declining revenues.
Recreation – The decrease in this function was due to budget cuts due to the declining revenues.
Capital outlay – The increase in this function was due to the start of construction for the Hollister Fire Station #1.
12

CITY OF HOLLISTERMANAGEMENT'S DISCUSSION AND ANALYSIS (continued)
FOR THE YEAR ENDED JUNE 30, 2010
Proprietary funds - The City’s proprietary funds provide the same type of information found in the government-widefinancial statements, but in more detail. The funds include the enterprise funds: Airport, Water, Wastewater, StreetSweeping, and Briggs Building operations.
GENERAL FUND BUDGETARY HIGHLIGHTS
Differences between the original budget and the final amended budget for revenues were a decrease of $1,145,785.This decrease was due to the City anticipating decrease in reimbursements from other governments that was notoriginally anticipated and decreases in property and sales taxes.
During the fiscal year, actual revenues were less than budgetary estimates by $1,543,392. The main reason for thedecrease was that taxes were $424,442 less than the estimated amount due to decreased property and sales taxes.Plus, revenues from licenses and permits decreased $21,119 less than estimated amount due to decreases inestimated permits. Actual expenditures were more than budgetary estimates by $286,558. The net effect of under-realization of revenues and under-utilization of appropriations resulted in an unfavorable variance of $(439,453).
CAPITAL ASSETS AND DEBT ADMINISTRATION
A. Capital Assets
The City’s investment in capital assets for its governmental and business-type activities as of June 30, 2010,amounted to $170,756,051 (net of accumulated depreciation). This investment in capital assets included land,structures and improvements, equipment, construction-in-progress, and infrastructure. The total increase in theCity’s net investment in capital assets for the current period was 1.6%. The increase resulted from improvementassets acquired exceeding improvement depreciation by $2,774,000.
Additional information on the City’s capital assets can be found in the Notes to the Financial Statements section ofthis report on page 47, note 6 – Capital Assets.
Key events affecting capital assets during the fiscal year included the following:
Construction in progress capital assets being transferred to structures and improvements and equipment.
For government-wide financial statement presentation, all depreciable capital assets were depreciated from
acquisition date to the end of the current fiscal year. Fund financial statements record capital asset purchases
as expenditures.
TABLE 6CAPITAL ASSETS (NET OF DEPRECIATION) (in thousands)
Governmental Activities Business-type Activities Total2010 2009 2010 2009 2010 2009
Land $ 425 $ 425 $ 5,244 $ 5,244 $ 5,669 $ 5,669Air rights - - 1,385 1,385 1,385 1,385Construction in Progress 569 - 20 20 589 20Buildings 17,751 18,516 8,331 8,799 26,082 27,315Equipment 2,449 2,505 823 854 3,272 3,359Improvements 785 827 120,475 116,814 121,260 117,641Infrastructure 12,499 12,593 - - 12,499 12,593
Total $ 34,478 $ 34,866 $ 136,278 $ 133,116 $ 170,756 $ 167,982
13

CITY OF HOLLISTERMANAGEMENT'S DISCUSSION AND ANALYSIS (continued)
FOR THE YEAR ENDED JUNE 30, 2010
CAPITAL ASSETS AND DEBT ADMINISTRATION (continued)
B. Long-Term Obligations
At June 30, 2010, the City had total long-term obligations outstanding of $170,406,995 consisting of $161,750,000 inbonds, and loan obligations of $653,321. Additional long-term liabilities include bond issuance premium of$6,971,090 and compensated absences payable of $1,032,584.
Additional information on the City’s long-term liabilities can be found in the Notes to the Financial Statements sectionof this report on page 49, note 7 – Long-Term Liabilities.
ECONOMIC CONDITION, OUTLOOK, AND ACTIVITY
The City adopted its fiscal year 2010-2011 Final Budget in the total amount of $46,323,060, with the General Fundusing $325,616 of its reserves. The City will continue to face difficult fiscal challenges in the foreseeable future. Forthe General Fun, the City implemented a 12.5% budget cut for the fiscal year 2010-2011. Although the most criticalfiscal uncertainty facing the City continues to be the impact on local government resulting from actions the State ofCalifornia may take in addressing its own fiscal problems, increasing foreclosures due to the declining economy willalso impact the ability of the City to maintain current service levels as it has caused a decline in property taxes.
The City has experienced slow growth and has experienced a less favorable economic environment as a result ofthe long standing imposition of the building moratorium as mandated by the State Water Quality Control Board. Inaddition, the economic outlook and budget deficit that continues to plague the State of California has also weighedunfavorable on the City's ability to expand in a manner consistent with the ability to sustain the necessary level ofservices required for the entire community.
CONTACTING THE CITY'S FINANCIAL MANAGEMENT
These basic financial statements have been prepared in order to provide the citizens, taxpayers, investors, andcreditors with financial report which is designed to demonstrate accountability of the City of Hollister government byproviding both long-term and near-term views of the City’s finances for the year ended June 30, 2010. Anyquestions pertaining to this report shall be directed to the City's Director of Administrative Services at 375 FifthStreet, Hollister, CA 95023.
14
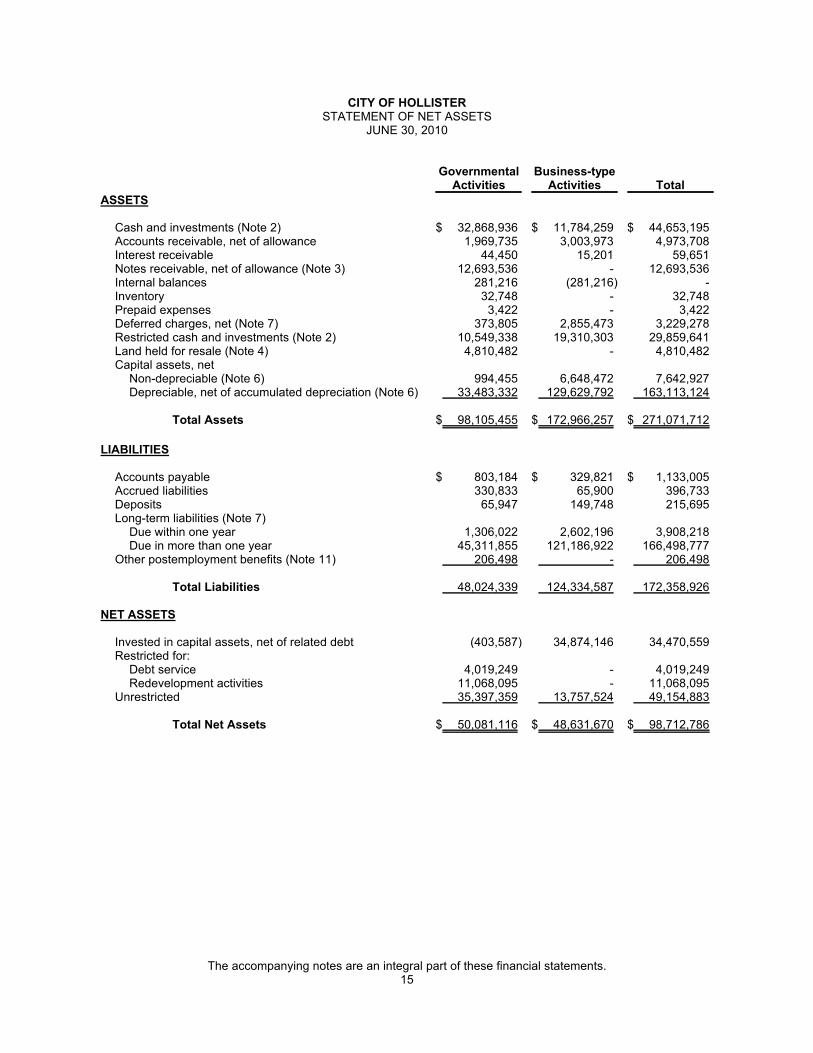
CITY OF HOLLISTERSTATEMENT OF NET ASSETS
JUNE 30, 2010
GovernmentalActivities
Business-typeActivities Total
ASSETS
Cash and investments (Note 2) $ 32,868,936 $ 11,784,259 $ 44,653,195Accounts receivable, net of allowance 1,969,735 3,003,973 4,973,708Interest receivable 44,450 15,201 59,651Notes receivable, net of allowance (Note 3) 12,693,536 - 12,693,536Internal balances 281,216 (281,216) -Inventory 32,748 - 32,748Prepaid expenses 3,422 - 3,422Deferred charges, net (Note 7) 373,805 2,855,473 3,229,278Restricted cash and investments (Note 2) 10,549,338 19,310,303 29,859,641Land held for resale (Note 4) 4,810,482 - 4,810,482Capital assets, net
Non-depreciable (Note 6) 994,455 6,648,472 7,642,927Depreciable, net of accumulated depreciation (Note 6) 33,483,332 129,629,792 163,113,124
Total Assets $ 98,105,455 $ 172,966,257 $ 271,071,712
LIABILITIES
Accounts payable $ 803,184 $ 329,821 $ 1,133,005Accrued liabilities 330,833 65,900 396,733Deposits 65,947 149,748 215,695Long-term liabilities (Note 7)
Due within one year 1,306,022 2,602,196 3,908,218Due in more than one year 45,311,855 121,186,922 166,498,777
Other postemployment benefits (Note 11) 206,498 - 206,498
Total Liabilities 48,024,339 124,334,587 172,358,926
NET ASSETS
Invested in capital assets, net of related debt (403,587) 34,874,146 34,470,559Restricted for:
Debt service 4,019,249 - 4,019,249Redevelopment activities 11,068,095 - 11,068,095
Unrestricted 35,397,359 13,757,524 49,154,883
Total Net Assets $ 50,081,116 $ 48,631,670 $ 98,712,786
The accompanying notes are an integral part of these financial statements.15

CITY OF HOLLISTERSTATEMENT OF ACTIVITIES
FOR THE YEAR ENDED JUNE 30, 2010
Program RevenuesNet (Expense) Revenue and Changes in Net
Assets
Primary Government
Functions/Programs ExpensesCharges for
Services
OperatingGrants and
Contributions
CapitalGrants and
ContributionsGovernmental
Activities
Business-type
Activities Total
PRIMARY GOVERNMENTGovernmental activities:
General government $ 11,496,478 $ 1,121,856 $ 546,158 $ 192,620 $ (9,635,844) $ - $ (9,635,844)Public safety 11,725,625 513,535 210,825 - (11,001,265) - (11,001,265)Public works 3,368,100 1,621,172 359,490 - (1,387,438) - (1,387,438)Recreation 1,576,338 498,451 - - (1,077,887) - (1,077,887)Interest and fiscal charges 2,296,969 - - - (2,296,969) - (2,296,969)
Total governmental activities 30,463,510 3,755,014 1,116,473 192,620 (25,399,403) - (25,399,403)
Business-type activities:Airport 852,930 697,675 - - - (155,255) (155,255)Water 3,776,513 4,117,577 - - - 341,064 341,064Sewer 8,716,397 12,730,842 - - - 4,014,445 4,014,445Street sweeping 409,517 318,057 - - - (91,460) (91,460)Briggs building 228,233 122,400 - - - (105,833) (105,833)
Total business-type activities 13,983,590 17,986,551 - - - 4,002,961 4,002,961
Total primary government $ 44,447,100 $ 21,741,565 $ 1,116,473 $ 192,620 $ (25,399,403) $ 4,002,961 $ (21,396,442)
General revenues:Property taxes $ 12,616,045 $ - $ 12,616,045Sales and use taxes 5,212,029 - 5,212,029Gas taxes 597,268 - 597,268Other taxes 119,185 - 119,185Motor vehicle in lieu 109,581 - 109,581Investment earnings 348,449 88,433 436,882Miscellaneous 1,605,007 - 1,605,007
Transfers (353,631) 353,631 -Total general revenues and transfers 20,253,933 442,064 20,695,997
Change in net assets (5,145,470) 4,445,025 (700,445)
Net assets - July 1, 2009 54,901,772 44,186,645 99,088,417Prior period restatement (Note 18) 324,814 - 324,814Net assets - July 1, 2009, restated $ 55,226,586 $ 44,186,645 $ 99,413,231
Net assets - June 30, 2010 $ 50,081,116 $ 48,631,670 $ 98,712,786
The accompanying notes are an integral part of these financial statements.16
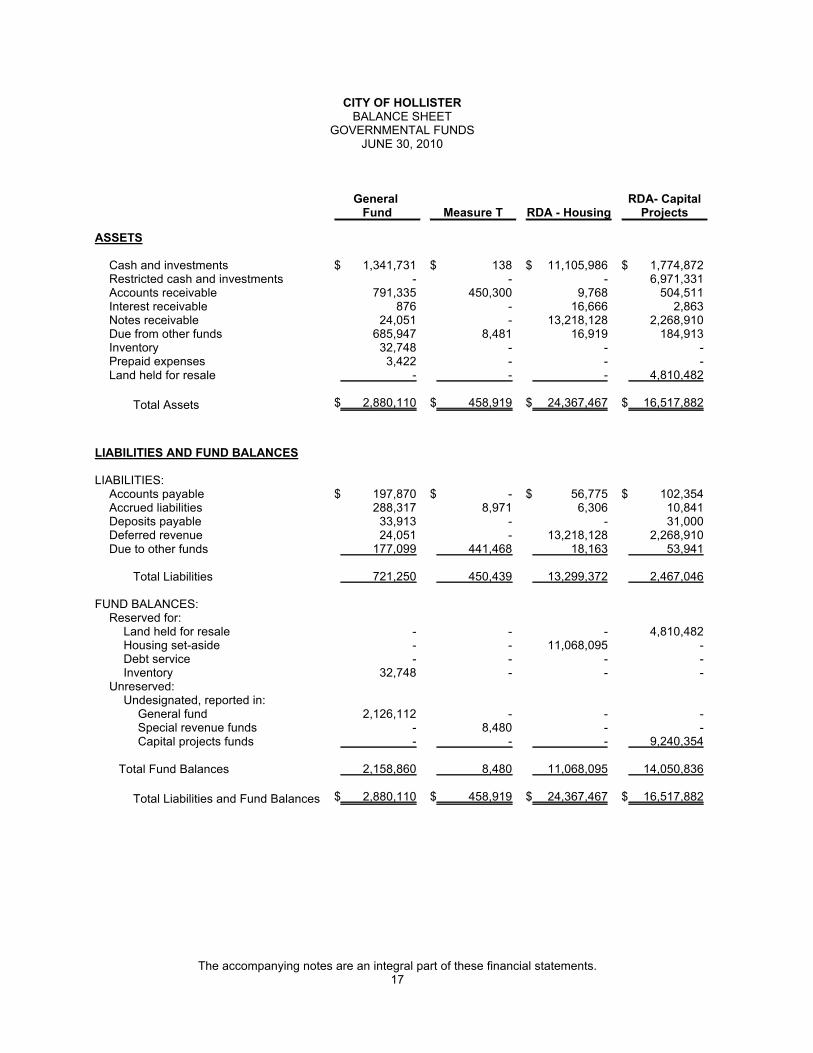
CITY OF HOLLISTERBALANCE SHEET
GOVERNMENTAL FUNDSJUNE 30, 2010
General Fund Measure T RDA - Housing
RDA- CapitalProjects
ASSETS
Cash and investments $ 1,341,731 $ 138 $ 11,105,986 $ 1,774,872Restricted cash and investments - - - 6,971,331Accounts receivable 791,335 450,300 9,768 504,511Interest receivable 876 - 16,666 2,863Notes receivable 24,051 - 13,218,128 2,268,910Due from other funds 685,947 8,481 16,919 184,913Inventory 32,748 - - -Prepaid expenses 3,422 - - -Land held for resale - - - 4,810,482
Total Assets $ 2,880,110 $ 458,919 $ 24,367,467 $ 16,517,882
LIABILITIES AND FUND BALANCES
LIABILITIES:Accounts payable $ 197,870 $ - $ 56,775 $ 102,354Accrued liabilities 288,317 8,971 6,306 10,841Deposits payable 33,913 - - 31,000Deferred revenue 24,051 - 13,218,128 2,268,910Due to other funds 177,099 441,468 18,163 53,941
Total Liabilities 721,250 450,439 13,299,372 2,467,046
FUND BALANCES:Reserved for:
Land held for resale - - - 4,810,482Housing set-aside - - 11,068,095 -Debt service - - - -Inventory 32,748 - - -
Unreserved:Undesignated, reported in:
General fund 2,126,112 - - -Special revenue funds - 8,480 - -Capital projects funds - - - 9,240,354
Total Fund Balances 2,158,860 8,480 11,068,095 14,050,836
Total Liabilities and Fund Balances $ 2,880,110 $ 458,919 $ 24,367,467 $ 16,517,882
The accompanying notes are an integral part of these financial statements.17

CITY OF HOLLISTERBALANCE SHEET (continued)
GOVERNMENTAL FUNDSJUNE 30, 2010
RDA - DebtService
OtherGovernmental
Funds
TotalGovernmental
Funds
ASSETS
Cash and investments $ 441,242 $ 18,204,967 $ 32,868,936Restricted cash and investments 3,578,007 - 10,549,338Accounts receivable - 213,821 1,969,735Interest receivable - 24,045 44,450Notes receivable - 1,700,229 17,211,318Due from other funds - 261,077 1,157,337Inventory - - 32,748Prepaid expenses - - 3,422Land held for resale - - 4,810,482
Total Assets $ 4,019,249 $ 20,404,139 $ 68,647,766
LIABILITIES AND FUND BALANCES
LIABILITIES:Accounts payable $ - $ 446,185 $ 803,184Accrued liabilities - 16,398 330,833Deposits payable - 1,034 65,947Deferred revenue - 1,700,229 17,211,318Due to other funds - 185,450 876,121
Total Liabilities - 2,349,296 19,287,403
FUND BALANCES:Reserved for:
Land held for resale - - 4,810,482Housing set-aside - - 11,068,095Debt service 4,019,249 - 4,019,249Inventory - - 32,748
Unreserved:Undesignated, reported in:
General fund - - 2,126,112Special revenue funds - 6,593,807 6,602,287Capital projects funds - 11,461,036 20,701,390
Total Fund Balances 4,019,249 18,054,843 49,360,363
Total Liabilities and Fund Balances $ 4,019,249 $ 20,404,139 $ 68,647,766
The accompanying notes are an integral part of these financial statements.18

CITY OF HOLLISTERRECONCILIATION OF THE GOVERNMENTAL FUNDS BALANCE SHEET
TO THE GOVERNMENT-WIDE STATEMENT OF NET ASSETSJUNE 30, 2010
Fund balances - total governmental funds $ 49,360,363
Amounts reported for governmental activities in the Statement of Net Assets are differentbecause:
Capital assets used in governmental activities are not financial resources and, therefore,are not reported in the governmental funds.
Governmental capital assets 51,827,833Less: accumulated depreciation (17,350,046)
Deferred revenue and other resources not available to liquidate liabilities of the currentperiod are not recognized in the funds. 12,693,536
Prepaid bond issuance costs are not capitalized and are therefore not reported in theGovernmental Funds 373,805
Long-term liabilities applicable to the City's governmental activities are not due andpayable in the current period and accordingly are not reported in the governmentalfunds.
Bonds payable (45,420,000)Deferred premium (384,517)Net OPEB obligation (206,498)Compensated absences (813,360)
Net assets of governmental activities $ 50,081,116
The accompanying notes are an integral part of these financial statements.19

CITY OF HOLLISTERSTATEMENT OF REVENUES, EXPENDITURES, AND CHANGES IN FUND BALANCES
GOVERNMENTAL FUNDSJUNE 30, 2010
General Fund Measure T RDA - Housing
RDA - CapitalProjects
REVENUES
Taxes $ 6,186,129 $ 3,013,530 $ 2,017,934 $ 2,517,242Licenses and permits 1,033,621 - - -Intergovernmental 454,799 - - -Charges for services 1,039,936 - - -Fines and forfeitures 179,986 - - -Investment earnings 8,574 3,497 81,907 45,257Other 1,582,303 - 47,790 202
Total Revenues 10,485,348 3,017,027 2,147,631 2,562,701
EXPENDITURES
Current:General government 2,284,324 40,880 3,441,361 7,510,028Public safety 10,275,493 183,889 - -Public works 1,778,357 41,078 - 40,467Recreation 1,080,772 148,565 - 93,492
Capital outlay 13,535 - 1,099 570,793Debt service:
Principal - - - -Interest - - - -
Total Expenditures 15,432,481 414,412 3,442,460 8,214,780
Excess (deficiency) of revenues overexpenditures (4,947,133) 2,602,615 (1,294,829) (5,652,079)
OTHER FINANCING SOURCES (USES)
Proceeds from bond issuance - - - 6,970,380Transfers in 4,719,331 - - -Transfers out (200) (3,497,359) - (1,194,034)
Total Other Financing Sources(Uses) 4,719,131 (3,497,359) - 5,776,346
Net change in fund balances (228,002) (894,744) (1,294,829) 124,267
Fund balances - July 1, 2009 2,291,631 903,224 12,362,924 13,926,569Prior period adjustment (Note 18) 95,231 - - -
Fund balances - July 1, 2009 (restated) 2,386,862 903,224 12,362,924 13,926,569
Fund balances - June 30, 2010 $ 2,158,860 $ 8,480 $ 11,068,095 $ 14,050,836
The accompanying notes are an integral part of these financial statements.20
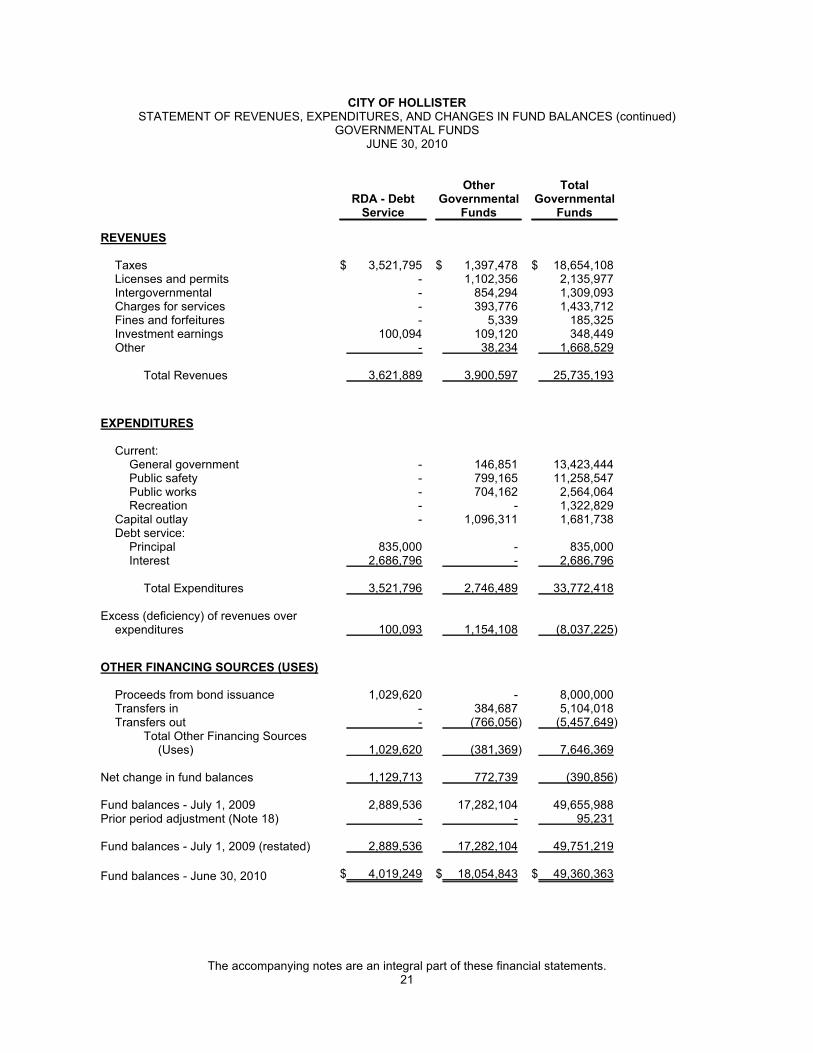
CITY OF HOLLISTERSTATEMENT OF REVENUES, EXPENDITURES, AND CHANGES IN FUND BALANCES (continued)
GOVERNMENTAL FUNDSJUNE 30, 2010
RDA - DebtService
OtherGovernmental
Funds
TotalGovernmental
Funds
REVENUES
Taxes $ 3,521,795 $ 1,397,478 $ 18,654,108Licenses and permits - 1,102,356 2,135,977Intergovernmental - 854,294 1,309,093Charges for services - 393,776 1,433,712Fines and forfeitures - 5,339 185,325Investment earnings 100,094 109,120 348,449Other - 38,234 1,668,529
Total Revenues 3,621,889 3,900,597 25,735,193
EXPENDITURES
Current:General government - 146,851 13,423,444Public safety - 799,165 11,258,547Public works - 704,162 2,564,064Recreation - - 1,322,829
Capital outlay - 1,096,311 1,681,738Debt service:
Principal 835,000 - 835,000Interest 2,686,796 - 2,686,796
Total Expenditures 3,521,796 2,746,489 33,772,418
Excess (deficiency) of revenues overexpenditures 100,093 1,154,108 (8,037,225)
OTHER FINANCING SOURCES (USES)
Proceeds from bond issuance 1,029,620 - 8,000,000Transfers in - 384,687 5,104,018Transfers out - (766,056) (5,457,649)
Total Other Financing Sources(Uses) 1,029,620 (381,369) 7,646,369
Net change in fund balances 1,129,713 772,739 (390,856)
Fund balances - July 1, 2009 2,889,536 17,282,104 49,655,988Prior period adjustment (Note 18) - - 95,231
Fund balances - July 1, 2009 (restated) 2,889,536 17,282,104 49,751,219
Fund balances - June 30, 2010 $ 4,019,249 $ 18,054,843 $ 49,360,363
The accompanying notes are an integral part of these financial statements.21

CITY OF HOLLISTERRECONCILIATION OF THE
STATEMENT OF REVENUES, EXPENDITURES, AND CHANGES IN FUND BALANCESTO THE STATEMENT OF ACTIVITIES - GOVERNMENTAL FUNDS
FOR THE YEAR ENDED JUNE 30, 2010
The schedule below reconciles the net changes in fund balances reported on the governmental funds Statement ofRevenues, Expenditures, and Changes in Fund Balances, which measure only changes in current assets andcurrent liabilities on the modified accrual basis, with the changes in net assets of governmental activities reportedin the Statement of Activities, which is prepared on the full accrual basis.
Net change in fund balances - total governmental funds $ (390,856)
Amounts reported for governmental activities in the Statement of Activities are differentbecause:
Governmental funds report capital outlays as expenditures. However, in the Statement ofActivities, the cost of those assets is capitalized and allocated over their estimateduseful lives and reported as depreciation expense.
Capital outlay expenditures are therefore added back to fund balances 1,314,409Depreciation expense not reported in governmental funds (1,703,731)
Debt proceeds provide current financial resources to governmental funds; howeverissuing debt increases long-term liabilities in the Statement of Net Assets. Costsassociated with the issuance of long-term liabilities are reported as expenditures inthe governmental funds, but in the Statement of Net Assets, the costs are deferredand amortized throughout the period during which the related debt is outstanding.Repayment of debt principal is an expenditure in the governmental funds, but in theStatement of Net Assets, the repayment reduces long-term liabilities.
Issuance of bond proceeds (8,000,000)Bond issuance costs 390,796Principal payments 835,000Accretion of bond premium not reported in governmental funds 16,022Amortization expense of costs of issuance not reported in governmental funds (16,991)
Repayment of long-term receivables is treated as revenues in governmental funds, butthe repayment reduces long-term receivables in the Statement of Net Assets.Issuance of long-term receivables is treated as expenditures in the governmentalfunds, but the issuance increases long-term receivables in the Statement of NetAssets.
Loan program receipts (63,522)Loans made during the year 2,487,443
Under the modified accrual basis of accounting used in the governmental funds,expenditures are not recognized for transactions that are normally paid withexpendable available financial resources. In the Statement of Activities, however,which is presented on the accrual basis, expenses and liabilities are reportedregardless of when financial resources are available (net change).
Compensated absences 6,292Allowance for notes receivable 80,952Other post employment benefits (101,284)
Change in net assets of governmental activities $ (5,145,470)
The accompanying notes are an integral part of these financial statements.22

CITY OF HOLLISTERSTATEMENT OF NET ASSETS
PROPRIETARY FUNDSJUNE 30, 2010
Airport Water Sewer
ASSETS
Current AssetsCash and investments $ 518,680 $ 4,684,475 $ 6,446,165Accounts receivable, net of allowance 17,786 534,927 2,408,538Interest receivable 246 6,082 8,698Due from other funds - - 9,937Deferred charges, net - - 2,855,473
Total Current Assets 536,712 5,225,484 11,728,811
Restricted cash and investments - - 19,310,303Capital assets
Nondepreciable 1,530,872 - 5,000,000Depreciable, net of accumulated depreciation 3,726,229 3,951,021 117,996,645
Total Non-Current Assets 5,257,101 3,951,021 142,306,948
Total Assets $ 5,793,813 $ 9,176,505 $ 154,035,759
LIABILITIES
Current LiabilitiesAccounts payable $ 7,443 $ 76,761 $ 233,106Accrued liabilities 6,021 24,072 30,788Due to other funds 5,581 111,099 4,215Deposits 17,895 131,853 -Compensated absences - current portion 7,000 46,000 55,000Bonds payable - current portion 74,494 - 2,409,702
Total Current Liabilities 118,434 389,785 2,732,811
Non-Current LiabilitiesCompensated absences - noncurrent portion 7,230 46,913 42,108Bonds payable - noncurrent portion 578,827 - 120,506,871
Total Non-Current Liabilities 586,057 46,913 120,548,979
Total Liabilities 704,491 436,698 123,281,790
NET ASSETS
Invested in capital assets, net of related debt 4,603,780 3,951,021 22,245,848Unrestricted 485,542 4,788,786 8,508,121
Total Net Assets $ 5,089,322 $ 8,739,807 $ 30,753,969
The accompanying notes are an integral part of these financial statements.23
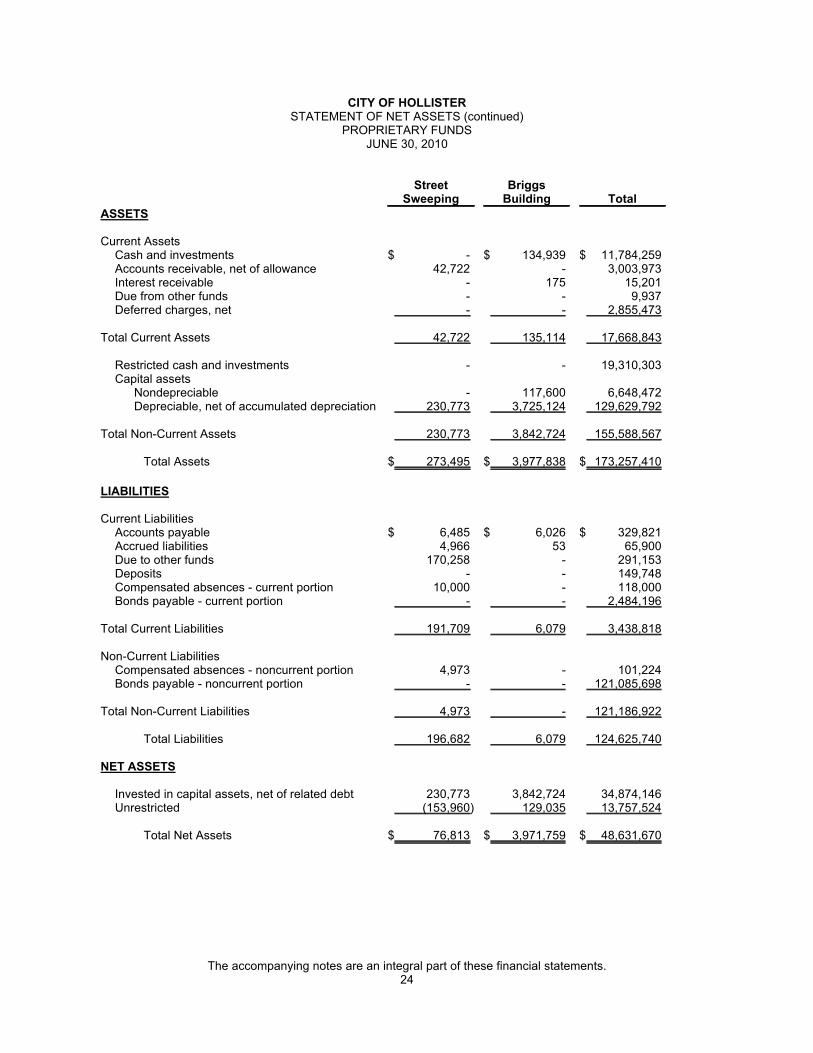
CITY OF HOLLISTERSTATEMENT OF NET ASSETS (continued)
PROPRIETARY FUNDSJUNE 30, 2010
StreetSweeping
BriggsBuilding Total
ASSETS
Current AssetsCash and investments $ - $ 134,939 $ 11,784,259Accounts receivable, net of allowance 42,722 - 3,003,973Interest receivable - 175 15,201Due from other funds - - 9,937Deferred charges, net - - 2,855,473
Total Current Assets 42,722 135,114 17,668,843
Restricted cash and investments - - 19,310,303Capital assets
Nondepreciable - 117,600 6,648,472Depreciable, net of accumulated depreciation 230,773 3,725,124 129,629,792
Total Non-Current Assets 230,773 3,842,724 155,588,567
Total Assets $ 273,495 $ 3,977,838 $ 173,257,410
LIABILITIES
Current LiabilitiesAccounts payable $ 6,485 $ 6,026 $ 329,821Accrued liabilities 4,966 53 65,900Due to other funds 170,258 - 291,153Deposits - - 149,748Compensated absences - current portion 10,000 - 118,000Bonds payable - current portion - - 2,484,196
Total Current Liabilities 191,709 6,079 3,438,818
Non-Current LiabilitiesCompensated absences - noncurrent portion 4,973 - 101,224Bonds payable - noncurrent portion - - 121,085,698
Total Non-Current Liabilities 4,973 - 121,186,922
Total Liabilities 196,682 6,079 124,625,740
NET ASSETS
Invested in capital assets, net of related debt 230,773 3,842,724 34,874,146Unrestricted (153,960) 129,035 13,757,524
Total Net Assets $ 76,813 $ 3,971,759 $ 48,631,670
The accompanying notes are an integral part of these financial statements.24
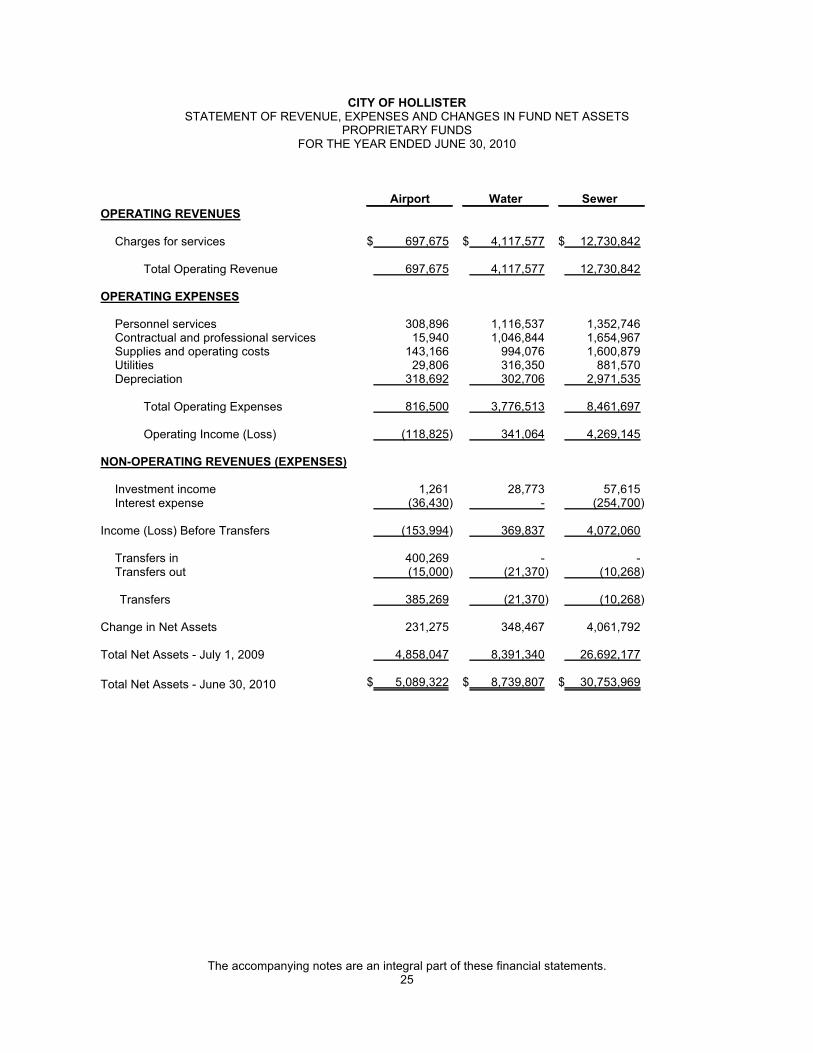
CITY OF HOLLISTERSTATEMENT OF REVENUE, EXPENSES AND CHANGES IN FUND NET ASSETS
PROPRIETARY FUNDSFOR THE YEAR ENDED JUNE 30, 2010
Airport Water Sewer
OPERATING REVENUES
Charges for services $ 697,675 $ 4,117,577 $ 12,730,842
Total Operating Revenue 697,675 4,117,577 12,730,842
OPERATING EXPENSES
Personnel services 308,896 1,116,537 1,352,746Contractual and professional services 15,940 1,046,844 1,654,967Supplies and operating costs 143,166 994,076 1,600,879Utilities 29,806 316,350 881,570Depreciation 318,692 302,706 2,971,535
Total Operating Expenses 816,500 3,776,513 8,461,697
Operating Income (Loss) (118,825) 341,064 4,269,145
NON-OPERATING REVENUES (EXPENSES)
Investment income 1,261 28,773 57,615Interest expense (36,430) - (254,700)
Income (Loss) Before Transfers (153,994) 369,837 4,072,060
Transfers in 400,269 - -Transfers out (15,000) (21,370) (10,268)
Transfers 385,269 (21,370) (10,268)
Change in Net Assets 231,275 348,467 4,061,792
Total Net Assets - July 1, 2009 4,858,047 8,391,340 26,692,177
Total Net Assets - June 30, 2010 $ 5,089,322 $ 8,739,807 $ 30,753,969
The accompanying notes are an integral part of these financial statements.25

CITY OF HOLLISTERSTATEMENT OF REVENUE, EXPENSES AND CHANGES IN FUND NET ASSETS (continued)
PROPRIETARY FUNDSFOR THE YEAR ENDED JUNE 30, 2010
StreetSweeping
BriggsBuilding Total
OPERATING REVENUES
Charges for services $ 318,057 $ 122,400 $ 17,986,551
Total Operating Revenue 318,057 122,400 17,986,551
OPERATING EXPENSES
Personnel services 193,755 5,269 2,977,203Contractual and professional services 12,110 80,414 2,810,275Supplies and operating costs 163,429 21,920 2,923,470Utilities - 11,068 1,238,794Depreciation 40,223 109,562 3,742,718
Total Operating Expenses 409,517 228,233 13,692,460
Operating Income (Loss) (91,460) (105,833) 4,294,091
NON-OPERATING REVENUES (EXPENSES)
Investment income - 784 88,433Interest expense - - (291,130)
Income (Loss) Before Transfers (91,460) (105,049) 4,091,394
Transfers in - - 400,269Transfers out - - (46,638)
Transfers - - 353,631
Change in Net Assets (91,460) (105,049) 4,445,025
Total Net Assets - July 1, 2009 168,273 4,076,808 44,186,645
Total Net Assets - June 30, 2010 $ 76,813 $ 3,971,759 $ 48,631,670
The accompanying notes are an integral part of these financial statements.26

CITY OF HOLLISTERSTATEMENT OF CASH FLOWS
PROPRIETARY FUNDSFOR THE YEAR ENDED JUNE 30, 2010
Airport Water Sewer
CASH FLOWS FROM OPERATING ACTIVITIESCash receipts from customers $ 707,935 $ 3,873,182 $ 11,370,726Cash paid to suppliers for goods and services (181,606) (2,314,036) (4,200,048)Cash paid to employees (304,012) (1,085,604) (1,309,216)
Net Cash Provided (Used) by Operating Activities 222,317 473,542 5,861,462
CASH FLOWS FROM NONCAPITAL FINANCING ACTIVITIESTransfers in 385,269 - -Transfer out - (21,370) (10,268)Interfund receipts (payments) 5,581 111,099 (5,722)
Net Cash Provided (Used) by Noncapital FinancingActivities 390,850 89,729 (15,990)
CASH FLOWS FROM CAPITAL AND RELATED FINANCING ACTIVITIESPrincipal paid on capital debt (70,559) - (1,900,000)Interest paid on capital debt (36,430) - (393,317)Acquisition and construction of capital assets (102,864) - (6,803,464)
Net Cash Used for Capital and Related FinancingActivities (209,853) - (9,096,781)
CASH FLOWS FROM INVESTING ACTIVITIESInterest and dividends received 2,168 35,677 79,985
Net Cash Provided by Investing Activities 2,168 35,677 79,985
Net Increase (Decrease) in Cash and Cash Equivalents 405,482 598,948 (3,171,324)
Cash and Cash Equivalents - July 1, 2009 113,198 4,085,527 28,927,792
Cash and Cash Equivalents - June 30, 2010 $ 518,680 $ 4,684,475 $ 25,756,468
RECONCILIATION OF CASH AND CASH EQUIVALENTS TO THESTATEMENT OF NET ASSETSCash and investments $ 518,680 $ 4,684,475 $ 6,446,165Restricted cash and investments - - 19,310,303
Total Cash and Investments $ 518,680 $ 4,684,475 $ 25,756,468
RECONCILIATION OF OPERATING INCOME (LOSS)TO NET CASH PROVIDED (USED) BY OPERATINGACTIVITIES:
Operating Income (Loss) $ (118,825) $ 341,064 $ 4,269,145
Adjustments to reconcile operating income (loss)to net cash provided (used) by operating activities:
Depreciation expense 318,692 302,706 2,971,535Changes in assets and liabilities:
Decrease (increase) in accounts receivable 8,961 (301,639) (1,360,116)Increase (decrease) in accounts payable 7,306 43,234 (62,632)Increase in deposits payable 1,299 57,244 -Increase in accrued wages 1,091 5,257 6,035Increase in compensated absences 3,793 25,676 37,495
Net Cash Provided (Used) by Operating Activities $ 222,317 $ 473,542 $ 5,861,462
The accompanying notes are an integral part of these financial statements.27

CITY OF HOLLISTERSTATEMENT OF CASH FLOWS (continued)
PROPRIETARY FUNDSFOR THE YEAR ENDED JUNE 30, 2010
Street Sweeping Briggs Building Total
CASH FLOWS FROM OPERATING ACTIVITIESCash receipts from customers $ 320,134 $ 132,600 $ 16,404,577Cash paid to suppliers for goods and services (170,361) (112,891) (6,978,942)Cash paid to employees (186,081) (5,216) (2,890,129)
Net Cash Provided (Used) by Operating Activities (36,308) 14,493 6,535,506
CASH FLOWS FROM NONCAPITAL FINANCING ACTIVITIESTransfers in - - 385,269Transfer out - - (31,638)Interfund receipts (payments) 36,308 - 147,266
Net Cash Provided (Used) by Noncapital FinancingActivities 36,308 - 500,897
CASH FLOWS FROM CAPITAL AND RELATED FINANCING ACTIVITIESPrincipal paid on capital debt - - (1,970,559)Interest paid on capital debt - - (429,747)Acquisition and construction of capital assets - - (6,906,328)
Net Cash Used for Capital and Related FinancingActivities - - (9,306,634)
CASH FLOWS FROM INVESTING ACTIVITIESInterest and dividends received - 978 118,808
Net Cash Provided by Investing Activities - 978 118,808
Net Increase (Decrease) in Cash and Cash Equivalents - 15,471 (2,151,423)
Cash and Cash Equivalents - July 1, 2009 - 119,468 33,245,985
Cash and Cash Equivalents - June 30, 2010 $ - $ 134,939 $ 31,094,562
RECONCILIATION OF CASH AND CASH EQUIVALENTS TO THESTATEMENT OF NET ASSETSCash and investments $ - $ 134,939 $ 11,784,259Restricted cash and investments - - 19,310,303
Total Cash and Investments $ - $ 134,939 $ 31,094,562
RECONCILIATION OF OPERATING INCOME (LOSS)TO NET CASH PROVIDED (USED) BY OPERATINGACTIVITIES:
Operating Income (Loss) $ (91,460) $ (105,833) $ 4,294,091
Adjustments to reconcile operating income (loss)to net cash provided (used) by operating activities:
Depreciation expense 40,223 109,562 3,742,718Changes in assets and liabilities:
Decrease (increase) in accounts receivable 2,077 10,200 (1,640,517)Increase (decrease) in accounts payable 5,178 511 (6,403)Increase in deposits payable - - 58,543Increase in accrued wages 2,293 53 14,729Increase in compensated absences 5,381 - 72,345
Net Cash Provided (Used) by Operating Activities $ (36,308) $ 14,493 $ 6,535,506
The accompanying notes are an integral part of these financial statements.28

CITY OF HOLLISTERSTATEMENT OF FIDUCIARY NET ASSETS
FIDUCIARY FUNDSJUNE 30, 2010
Agency FundsASSETS
Cash and investments (Note 2) $ 1,269,782Accounts receivable 66,213Interest receivable 993
Total Assets $ 1,336,988
LIABILITIES
Accounts payable $ 35,332Accrued liabilities 1,894Deposits in trust 1,299,762
Total Liabilities $ 1,336,988
The accompanying notes are an integral part of these financial statements.29

CITY OF HOLLISTERNOTES TO BASIC FINANCIAL STATEMENTS
JUNE 30, 2010
NOTE 1: SUMMARY OF SIGNIFICANT ACCOUNTING POLICIES
A. The Reporting Entity
The City of Hollister was incorporated in 1872. The City is a general law City located in San Benito County, located100 miles southeast of San Francisco and 40 miles east of Monterey. The City provides the following services:public safety (police and fire), highways and streets, health and social services, culture recreation, publicimprovements, planning and zoning, and general administrative services. The City’s powers are exercised through aCity Council under a Council Manager form of government with five elected Council members served by a full timeCity Manager and staff, which, as the governing body of the City, is responsible for the legislative and executivecontrol of the City. As required by accounting principles generally accepted in the United States of America, thesefinancial statements present the government and its component units; legally separate entities for which the City isconsidered to be financially accountable. Financial accountability is demonstrated by the City Council acting as thegoverning board for the component unit.
Blended component unit, although legally separate entity is, in substance, part of the City’s operations: thereforedata from this unit is combined with data of the primary government. This blended component unit has a June 30,2009 fiscal year-end.
In evaluating how to define the City for financial reporting purposes, management has considered all potentialcomponent units. The decision to include a potential component unit in the reporting entity was made by applyingthe criteria set forth in Governmental Accounting Standards Board (GASB) Statement No. 14 “The FinancialReporting Entity.”
The Redevelopment Agency of the City of Hollister (the Agency) is a separate government entity whose purpose isto prepare and implement plans for improvement, rehabilitation, and development of certain areas within the City.The Agency was formed in 1983 and is controlled by the City and has the same governing board as the City, whichalso performs all accounting and administrative functions for the Agency. The financial activities of the Agency havebeen included in these financial statements in the Redevelopment Funds.
Audited financial statements for the Agency may be obtained from the City of Hollister, 375 Fifth Street, Hollister, CA95023.
B. Basis of Presentation
The City's basic financial statements are prepared in conformity with accounting principles generally accepted in theUnited States of America. The Government Accounting Standards Board is the acknowledged standard setting bodyfor establishing accounting and financial reporting standards followed by governmental entities in the United Statesof America.
These standards require that the financial statements described below be presented.
Government-wide Financial Statements
The Statement of Net Assets and Statement of Activities display information about the primary government (the City)and its blended component units. These statements include the financial activities of the overall City governmentexcept for fiduciary activities. Eliminations have been made to minimize the double counting of internal activities.These statements distinguish between the governmental and business-type activities of the City. Governmentalactivities, which normally are supported by taxes and, intergovernmental revenues, are reported separately frombusiness type activities, which rely to a significant extent on fees charged to external parties.
The Statement of Activities demonstrates the degree to which the program expenses of a given function are offset byprogram revenues. Program expenses include direct expenses, which are clearly identifiable with a specificfunction, and allocated indirect expenses. Program revenues include 1) fees, fines, and charges paid by therecipients of goods or services offered by the programs and 2) grants and contributions that are restricted to meetingthe operational or capital requirements of a particular program. Revenues that are not classified as programrevenues, including all taxes, are presented instead as general revenues.
30

CITY OF HOLLISTERNOTES TO BASIC FINANCIAL STATEMENTS
JUNE 30, 2010
NOTE 1: SUMMARY OF SIGNIFICANT ACCOUNTING POLICIES (CONTINUED)
Fund Financial Statements
The fund financial statements provide information about the City’s funds, including fiduciary funds and blendedcomponent units. Separate statements for each fund category – governmental, proprietary, and fiduciary – arepresented. The emphasis of fund financial statements is on major governmental and enterprise funds, eachdisplayed in a separate column. All remaining governmental funds are separately aggregated and reported as othergovernmental funds.
Proprietary fund operating revenues, such as charges for services, result from exchange transactions associatedwith the principal activity of the fund. Exchange transactions are those in which each party receives and gives upessentially equal values. Nonoperating revenues, such as subsidies and investment earnings, result fromnonexchange transactions or ancillary activities.
GASB Statement No. 34 defines major funds and requires that the City’s major governmental and proprietary fundsare identified and presented separately in the fund financial statements. All other funds, called nonmajor funds, arecombined and reported in a single column, regardless of their fund-type.
Major funds are defined as funds that have assets, liabilities, revenues, or expenditures/expenses equal to or greaterthan ten percent of their fund-type total and five percent of all fund-type totals. The General Fund is always a majorfund. The City may also select other funds it believes should be presented as major funds.
The City reports the following major governmental funds:
The General Fund is used to account for all revenues and expenditures necessary to carry out basic
governmental activities of the City that are not accounted for through other funds. For the City, the General Fund
includes such activities as general government, public safety, public works, and recreation.
The Measure T Fund was established to account for all revenues and expenditures necessary to carry out the
requirements of Measure T. Measure T was a special sales tax approved by special election.
The RDA - Housing Fund was established to account for the activities of the Hollister Redevelopment Agency’s
low and moderate income housing. The Agency provides a wide range of services designed to assist and
enhance the availability of low and moderate income housing to the community.
The RDA Capital Projects Fund was established to account for financial resources used for the acquisition or
construction of major capital facilities of the Hollister Redevelopment Agency.
The RDA Debt Service Fund was established to account for the accumulation of financial resources for the
payment of interest and principal on the long-term liabilities of the Hollister Redevelopment Agency.
The City reports the following major enterprise funds:
The Airport Fund was established to account for the City’s costs of providing airport services to the citizens of the
City of Hollister.
The Water Fund was established to account for the City’s costs of providing water services to the citizens of the
City of Hollister.
The Sewer Fund was established to account for the City’s costs of providing sewer services to the citizens of the
City of Hollister.
The Street Sweeping Fund was established to account for the City’s costs of providing street sweeping services
to the citizens of the City of Hollister.
31
CITY OF HOLLISTERNOTES TO BASIC FINANCIAL STATEMENTS
JUNE 30, 2010
NOTE 1: SUMMARY OF SIGNIFICANT ACCOUNTING POLICIES (CONTINUED)
The Briggs Building Fund was established to account for the City’s costs of running the Briggs Building.
The City reports the following additional fund types:
The Agency Funds are custodial in nature and do not involve measurement of the results of operations. Such
funds have no equity accounts since all assets are due to individuals or entities at some future time. These
funds account for assets held by the City as an agent for other government units or individuals.
C. Basis of Accounting
The government-wide financial statements are reported using the economic resources measurement focus and theaccrual basis of accounting, as are the proprietary fund and fiduciary fund financial statements.
Revenues are recorded when earned and expenses are recorded at the time liabilities are incurred, regardless ofwhen the related cash flows take place. Nonexchange transactions, in which the City gives (or receives) valuewithout directly receiving (or giving) equal value in exchange, include property and sales taxes, grants, entitlements,and donations. On an accrual basis, revenue from property taxes is recognized in the fiscal year for which the taxesare levied. Revenues from sales tax are recognized when the underlying transactions take place. Revenues fromgrants, entitlements, and donations are recognized in the fiscal year in which all eligible requirements have beensatisfied.
Governmental funds are reported using the current financial measurement focus and modified accrual basis ofaccounting. Under this method, revenues are recognized when “susceptible to accrual” (i.e., when they becomeboth measurable and available). “Measurable” means the amount of the transaction can be determined and“available” means that revenues are collectible within the current period or soon enough thereafter to be used to payliabilities of the current period. Property tax revenues are recognized in the current year if they are collected within 60days of fiscal year end. For all other revenues, the City considers revenues to be available if they are collected within60 days of the end of the current fiscal period. Revenues not considered available are recorded as deferred revenue.The City’s other primary revenue sources: investment income, intergovernmental revenues and charges for serviceshave been treated as “susceptible to accrual” under the modified accrual basis. Licenses and permits, fines,forfeitures and penalties, and other revenue are not considered “susceptible to accrual” under the modified accrualbasis and are recorded as revenues when received. Expenditures generally are recorded when a liability is incurred.However, debt service expenditures, as well as expenditures related to compensated absences and claims andjudgments, are recorded when payment is due.
When both restricted and unrestricted net assets are available, unrestricted resources are used only after therestricted resources are depleted.
For its proprietary funds, the City has elected under GASB Statement No. 20, Accounting and Financial Reporting forProprietary Funds and Other Governmental Entities that Use Proprietary Fund Accounting, to apply all applicableGASB pronouncements as well as any applicable pronouncements of the Financial Accounting Standards Board, theAccounting Principles Board or any Accounting Research Bulletins issued on or before November 30, 1989 unlessthose pronouncements conflict with or contradict GASB pronouncements. The GASB periodically updates itscodification of the existing Governmental Accounting and Financial Reporting Standards which, along withsubsequent GASB pronouncements (Statements and Interpretations), are accounting principles generally acceptedin the United States of America.
32
CITY OF HOLLISTERNOTES TO BASIC FINANCIAL STATEMENTS
JUNE 30, 2010
NOTE 1: SUMMARY OF SIGNIFICANT ACCOUNTING POLICIES (CONTINUED)
D. Property Taxes
Property taxes in the State of California (State) are administered for all local agencies at the county level, andconsist of secured, unsecured and utility tax rolls. The following is a summary of major policies and practices relatingto property taxes:
Property Valuation. Valuations are established by the Assessor of the County of San Benito (County) for thesecured and unsecured property tax rolls; the utility property tax roll is valued by the State Board of Equalization.Under the provisions of Article XIIIA of the State Constitution (Proposition 13 adopted by the voters on June 6,1978), properties are assessed at 100% of full value. Proposition 13 also modified the value of taxable real propertyfor fiscal 1979 by rolling back values to fiscal 1976 levels. From this base of assessment, subsequent annualincreases in valuation are limited to a maximum of 2%. However, increases to full value are allowed for propertyimprovements or upon change in ownership. Personal property is excluded from these limitations and is subject toannual reappraisal.
Tax Levies. Under the provisions of Proposition 13, the County-wide tax levy for general revenue purposes is limitedto 1% of full market value, which results in a tax rate of $1.00 per $100 assessed valuation. Tax rates for voter-approved indebtedness are excluded from this limitation.
Tax Levy Dates. All lien dates attach annually on January 1 proceeding the fiscal year for which the taxes arelevied. The fiscal year begins July 1 and ends June 30 of the following year. Taxes are levied on both real andunsecured personal property as it exists at that time. The lien against real estate as well as the tax on personalproperty is not relieved by subsequent renewal or change in ownership.
Tax Collections. The County Treasurer/Tax Collector is responsible for all property tax collections. Taxes andassessments on the secured and utility rolls, which constitute a lien against the property, may be paid in twoinstallments: the first installment is due on November 1 of the fiscal year and is delinquent if not paid by December10; and the second installment is due on March 1 of the fiscal year and is delinquent if not paid by April 10.Unsecured personal property taxes do not constitute a lien against real property. However, if the taxes becomedelinquent the lien is attached against anything the individual owns, which could include real property. Payment mustbe made in one installment, which is delinquent if not paid by August 31 of the fiscal year. Significant penalties areimposed by the County for late payments.
Teeter Plan. In 1993-94, the City elected to receive property tax revenue in accordance with the alternative methodof distribution prescribed by Sections 4701-4717 of the California Revenue and Taxation Code, which is commonlyknown as the “Teeter Plan” whereby the County remits 100% of taxes levied without regard to delinquencies. TheCounty then pursues collection, retaining any delinquent taxes and related penalties and interest.
Tax Levy Apportionments. Due to the nature of the County-wide maximum levy, it is not possible to identify generalpurpose tax rates for specific entities. Under State legislation adopted subsequent to the passage of Proposition 13,apportionments to local agencies are made by the County Auditor-Controller based primarily on two factors: the ratiothat each agency represented of the total County-wide levy for the three years prior to fiscal 1979; and subsequentadjustments to these apportionments and transfers to the “Educational Revenue Augmentation Fund” (ERAF) asdetermined by the State.
City Property Tax Distribution Policy. Property taxes are recorded in the General Fund and Redevelopment Fundas general purpose revenue. Transfers are made from the General Fund as needed to support expenditures in theCapital Outlay and Debt Service Funds. Property taxes receivable at June 30, 2010 are generally insignificant buthave been accrued since they will be collected within 60 days subsequent to year-end.
33
CITY OF HOLLISTERNOTES TO BASIC FINANCIAL STATEMENTS
JUNE 30, 2010
NOTE 1: SUMMARY OF SIGNIFICANT ACCOUNTING POLICIES (CONTINUED)
E. Cash and Investments
The City maintains a cash and investment pool that is available for use by all funds. Each fund's portion of this poolis displayed on the combined balance sheet as cash and investments. Investments held at June 30, 2010 withoriginal maturities greater than one year are stated at fair value. Fair value is estimated based on quoted marketprices at year end. All investments not required to be stated at fair value are stated at cost or amortized cost.
For purposes of the statement of cash flows, the proprietary funds consider all highly liquid investments with amaturity of three months or less and pooled cash when purchased to be cash equivalents.
F. Accounts and Interest Receivable
In the government-wide statements, receivables consist of all revenues earned at year-end and not yet received.Receivables are recorded in the financial statements net of any allowance for doubtful accounts. Major receivablebalances for the governmental activities include sales and use taxes, franchise taxes, grants, police fines and otherfees. Business-type activities report rental fees, charges for services, and interest earnings as their majorreceivables.
In the fund financial statements, material receivables in governmental funds include revenue accruals such as salestax, franchise tax, and grants and other similar intergovernmental revenues since they are usually both measurableand available. Nonexchange transactions collectible but not available are deferred in the fund financial statementsin accordance with modified accrual, but are not deferred in the government-wide financial statements in accordancewith the accrual basis. Interest and investment earnings are recorded when earned only if paid within 60 days sincethey would be considered both measurable and available. Long-term notes in governmental funds are treated asexpenditures in the year advanced and as revenues in the year repayment is measurable and available. Notesreceivable are recorded in the fund statements, but are deferred to indicate they do not represent current financialresources. Proprietary fund material receivables consist of all revenues earned at year-end and not yet received.Rental fees, charges for services, and interest earnings compose the majority of proprietary fund receivables.
G. Prepaid Items and Inventory
Supplies are valued at cost. Supplies of the general fund consist of expendable supplies held for consumption. Thecost is recorded as an expenditure in the general fund at the time individual items are consumed. Reported generalfund prepaid supplies are equally offset by a fund balance reserve which indicates that they do not constituteavailable spendable resources even through they are a component of net current assets.
H. Capital Assets
Capital assets (including infrastructure) are recorded at historical cost or estimated historical cost if actual historicalcost is not available. Contributed capital assets are valued at their estimated fair market value on the datecontributed. Capital assets include public domain (infrastructure) general fixed assets consisting of certainimprovements including roads, bridges, water/sewer, lighting system, drainage systems, and flood control. The Citydefines capital assets excluding infrastructure as assets with an initial, individual cost of more than $15,000 and anestimated useful life in excess of one year. Infrastructure assets with a historical cost of $250,000 or more areaccounted for as capital assets. Capital assets used in operations are depreciated or amortized (assets undercapital leases) using the straight-line method over the lesser of the capital lease period or their estimated useful livesin the government-wide statements and the proprietary funds.
The range of estimated useful lives by type of asset is as follows:
Buildings 20 - 50 yearsWater and Sewer System 30 - 50 yearsInfrastructure 20 - 35 yearsMachinery and Equipment 5 - 10 yearsImprovements 20 years
34

CITY OF HOLLISTERNOTES TO BASIC FINANCIAL STATEMENTS
JUNE 30, 2010
NOTE 1: SUMMARY OF SIGNIFICANT ACCOUNTING POLICIES (CONTINUED)
Major outlays for capital assets and improvements are capitalized as projects are constructed. Interest incurredduring construction phase of debt financed capital assets is included as part of the capitalized value of the assetconstructed.
I. Compensated Absences
The liability for compensated absences is comprised of unused vacation leave and compensatory time off, which areaccrued as earned. In addition, those employees with 10 years of service may cash out sick leave up to a Citymaximum upon termination. The liability has been calculated using the vesting method, in which leave amounts forboth employees who currently are eligible to receive termination payments and other employees who are expectedto become eligible in the future to receive such payments upon termination are included.
J. Long-Term Liabilities
In the government-wide financial statements and the proprietary fund financial statements, long-term liabilities, andother long-term obligations are reported as liabilities in the applicable governmental activities, business-typeactivities, or proprietary fund statement of net assets. Initial issue bond premiums and discounts, as well asissuance costs, are deferred and amortized over the life of the bonds using the straight-line method. The differencebetween the reacquisition prices of refunding bonds and the net carrying amount of refunded debt (deferred amounton refunding) is amortized over the shorter of the lives of the refunding debt or remaining life of the refunded debt.Bond issuance costs, including deferred refunding amounts and underwriters' discounts, are reported as deferredbond issuance costs. Amortization of bond premiums or discounts, issuance costs, and deferred amounts onrefunding are included in interest expense.
In the fund financial statements, governmental funds recognize bond premiums, discounts, and issuance costsduring the period issued. The face amount of debt issued is reported as other financing sources. Premiumsreceived are reported as other financing sources, while discounts are reported as other financing uses. Issuancecosts, whether or not withheld from the actual debt proceeds received, are reported as debt service expenditures.
K. Interfund Transactions
Interfund transactions are reflected as either loans, services provided, reimbursements, or transfers. Loans arereported as receivables and payables as appropriate, are subject to elimination upon consolidation and are referredto as either “due to/from other funds” (i.e., the current portion of interfund loans) or “advances to/from other funds”(i.e., the noncurrent portion of interfund loans). Any residual balances outstanding between the governmentalactivities and the business-type activities are reported in the government-wide financial statements as “internalbalances”. Advances between funds, as reported in the fund financial statements, are offset by a fund balancereserve account in applicable governmental funds to indicate that they are not available for appropriation and are notavailable financial resources.
Services provided, deemed to be at market or near market rates, are treated as revenues andexpenditures/expenses. Reimbursements are when one fund incurs a cost, charges the appropriate benefiting fund,and reduces its related cost as a reimbursement. All other interfund transactions are treated as transfers. Transfersbetween governmental or proprietary funds are netted as part of the reconciliation to the government-widepresentation.
35
CITY OF HOLLISTERNOTES TO BASIC FINANCIAL STATEMENTS
JUNE 30, 2010
NOTE 1: SUMMARY OF SIGNIFICANT ACCOUNTING POLICIES (CONTINUED)
L. Equity Classifications
Government-wide Statements
The government-wide financial statements and proprietary fund financial statements utilize a net assetspresentation. Net assets are categorized as invested in capital assets (net of related debt), restricted net assets, orunrestricted net assets.
Invested In Capital Assets, Net of Related Debt – This category groups all capital assets, including infrastructure,
into one component of net assets. Accumulated depreciation and the outstanding balances of debt that are
attributable to the acquisition, construction, or improvement of these assets reduce the balance in this category.
Restricted Net Assets – This category presents external restrictions imposed by creditors, grantors, contributors
or laws or regulations of other governments and restrictions imposed by law through constitutional provisions or
legislation.
Unrestricted Net Assets – This category represents net assets of the City, not restricted for any project or other
purpose.
Fund Statements
In the fund financial statements, governmental funds report reservations of fund balance for amounts that are notappropriable or legally restricted for a specific purpose. Designations of fund balance represent tentativemanagement plans that are subject to change. Proprietary fund equity is classified the same as in the government-wide statements.
Reserve for land held for resale is the portion of fund balance related to the RDA's purchase of land held for resale.
Reserve for housing set-aside is the portion of fund balance relating to State required low-to-moderate incomehousing.
Reserve for debt service is the portion of fund balance legally restricted for the payment of principal and interest onlong-term liabilities.
Reserve for inventory is the portion of fund balance reserved for inventory.
M. Post Employment Health Care Benefits
The City provides health care, life insurance, dental insurance, and disability income to eligible retirees, terminatedemployees, and their dependents. The benefits are provided in accordance with City ordinances, collectivebargaining agreements, and the Consolidated Omnibus Budget Reconciliation Act of 1985 (COBRA). The criteria todetermine eligibility include: years of service, employee age, disability due to line of duty, and whether the employeehas vested in the respective retirement plan. Currently, the City funds the benefits on a pay-as-you-go basis.Eligible employees are required to pay set premiums for a portion of the cost with the City subsidizing the remainingcosts. See footnote 11 for further information.
36

CITY OF HOLLISTERNOTES TO BASIC FINANCIAL STATEMENTS
JUNE 30, 2010
NOTE 1: SUMMARY OF SIGNIFICANT ACCOUNTING POLICIES (CONTINUED)
N. Budgets and Budgetary Accounting
Budgets are adopted on a basis consistent with accounting principles generally accepted in the United States ofAmerica. Annual appropriated budgets are adopted for all departments within the general, special revenue andcapital project funds. Formal budgets are not employed for debt service funds because debt indenture provisionsspecify payments.
During the period December through February of each fiscal year, department heads prepare estimates of requiredappropriations for the following fiscal year. These estimates are compiled into a proposed operating budget thatincludes a summary of proposed expenditures and financial resources and historical data for the preceding fiscalyear. The operating budget is presented by the City Manager to the City Council for review. Public hearings areconducted to obtain citizen comments. The City Council generally adopts the budget during one of its Junemeetings. The City Manager is legally authorized to transfer budgeted amounts between divisions and accountswithin the same department. Transfer of appropriations between departments or funds and increased appropriationsmust be authorized by the City Council. Expenditures may not legally exceed budgeted appropriations at thedepartmental level within a fund. All appropriations shall lapse at the end of the fiscal year to the extent they havenot been expended or lawfully encumbered, except for appropriations for capital projects which shall continue to theircompletion.
O. Use of Estimates
The preparation of financial statements in conformity with accounting principles generally accepted in the UnitedStates of America requires management to make estimates and assumptions that affect certain reported amountsand disclosures. Accordingly, actual results could differ from those estimates.
P. Reclassifications
Certain accounts in the prior-year financial statements have been reclassified for comparative purposes to conformwith the presentation in the current-year financial statements.
Q. Implementation of Government Accounting Standards Board Statements and Standards
Effective July 1, 2009, the City implemented the following accounting and financial reporting standards:
Government Accounting Standards Board Statement No. 51
In June of 2008, GASB issued Statement No. 51, Accounting and Financial Reporting for Intangible Assets. GASBStatement No. 51 establishes standards for accounting and financial reporting for intangible assets. This statementrequires that an intangible asset be recognized in the Statement of Net Assets only if it is identifiable. Additionally,this statement establishes a specific-conditions approach to recognizing intangible assets that are internallygenerated. This statement also establishes guidance specific to intangible assets related to amortization. Thisstatement provides guidance on determining the useful life of intangible assets when the length of their life is limitedby contractual or legal provisions. The provisions of this statement generally are required to be applied retroactivelyfor intangible assets acquired in fiscal years ending after June 30, 1980. As of June 30, 2010, the City of Hollister isin compliance with GASB No. 51.
Government Accounting Standards Board Statement No. 52
On November 2008, GASB issued Statement No. 52, Land and Other Real Estate Held as Investments byEndowments. The statement improves the quality of financial reporting by requiring endowments to report their landand other real estate investments at fair value, creating consistency in reporting among similar entities that exist toinvest resources for the purpose of generating income. The City has determined that the statement's provisions arenot applicable to them as they do not have any land or other real estate held as investments by endowments.
37

CITY OF HOLLISTERNOTES TO BASIC FINANCIAL STATEMENTS
JUNE 30, 2010
NOTE 1: SUMMARY OF SIGNIFICANT ACCOUNTING POLICIES (CONTINUED)
Government Accounting Standards Board Statement No. 53
In June 2008, GASB issued Statement No. 53, Accounting and Financial Reporting for Derivative Instruments.GASB Statement No. 53, establishes standards for accounting and financial reporting for derivative instruments.This statement addresses the recognition, measurement, and disclosure of information regarding derivativeinstruments Entered into by state and local governments. A key provision in this statement is that derivativeinstruments covered in its scope, with the exception of synthetic guaranteed investment contracts (SGICs) that arefully benefit-responsive are reported at fair value. Much of this statement describes the methods of evaluationeffectiveness. The disclosures required by Technical Bulletin No. 2003-1, "Disclosure Requirements of DerivativesNot Reported a Fair Value on the Statements of Net Assets", have been incorporated into this Statement. The Cityhas determined that the statement's provisions are not applicable to them as they do not invest in derivativeinstruments.
R. Future Government Accounting Standards Board Statements
These statements are not effective until June 30, 2010 or later. The City has not determined the effects on thefinancial statements.
Government Accounting Standards Board Statement No. 54
In March 2009, GASB issued Statement No. 54, Fund Balance Reporting and Governmental Fund Type Definitions.The objective to this statement is to enhance the usefulness of fund balance information by providing clearer fundbalance classifications that can be more consistently applied and by clarifying the existing governmental fund typedefinitions. This statement establishes fund balance classifications that comprise a hierarchy based primarily on theextent to which a government is bound to observe constraints imposed upon the use of the resources reported ingovernmental funds. Application of this statement is effective for the City’s fiscal year ending June 30, 2011.
Government Accounting Standards Board Statement No. 57
In December 2009, GASB issued Statement No. 57, OPEB Measurements by Agent Employers and Agent Multiple-Employer Plans. This statement addresses issues related to the use of the alternative measurement method and thefrequency and timing of measurements by employers that participate in agent multiple-employer otherpostemployment benefit (OPEB) plans. The City has not determined what impact, if any, this pronouncement willhave on the financial statements. Application of this statement is effective for the City's fiscal year ending June 30,2012.
Government Accounting Standards Board Statement No. 58
In December 2009, GASB issued Statement No. 58, Accounting and Financial Reporting for Chapter 9Bankruptcies. This statement provides accounting and financial reporting guidance for governments that havepetitioned for protection from creditors by filing for bankruptcy under Chapter 9 of the United States BankruptcyCode. It requires governments to remeasure liabilities that are adjusted in bankruptcy when the bankruptcy courtconfirms (that is, approves) a new payment plan. The City has not determined what impact, if any, thispronouncement will have on the financial statements. Application of this statement is effective for the City's fiscalyear ending June 30, 2011.
Government Accounting Standards Board Statement No. 59
In June 2010, GASB issued Statement No. 59, Financial Instruments Omnibus. This statement updates and improveexisting standards regarding financial reporting and disclosure requirements of certain financial instruments andexternal investment pools for which significant issues have been identified in practice. Application of this statement iseffective for the City's fiscal year ending June 30, 2011.
38

CITY OF HOLLISTERNOTES TO BASIC FINANCIAL STATEMENTS
JUNE 30, 2010
NOTE 2: CASH AND INVESTMENTS
Cash and investments as of June 30, 2010 were classified in the accompanying financial statements as follows:
Cash andinvestments
Restricted cashand investments Total
Governmental activities $ 32,868,936 $ 10,549,338 $ 43,418,274Business-type activities 11,784,259 19,310,303 31,094,562
Total government-wide cash and investments 44,653,195 29,859,641 74,512,836
Fiduciary activities 1,269,782 - 1,269,782
Total cash and investments $ 45,922,977 $ 29,859,641 $ 75,782,618
Cash and investments were carried at fair value as of June 30, 2010 and consisted of the following:
Local Area Investment Fund (LAIF) $ 42,434,370Cash with fiscal agent 30,364,762Deposits with financial institutions 2,824,207Certificates of deposit 157,563Cash on hand 1,716
Total cash and investments $ 75,782,618
Investments Authorized by the California Government Code and the City's Investment Policy
The table below identifies the investment types that are authorized for the City by the California Government Code(or the City’s investment policy, where more restrictive). The table also identifies certain provisions of the CaliforniaGovernment Code (or the City’s investment policy, where more restrictive) that address interest rate risk, credit risk,and concentration of credit risk. This table does not address investments of debt proceeds held by bond trustee thatare governed by the provisions of debt agreements of the City, rather than the general provisions of the CaliforniaGovernment Code or the City’s investment policy.
Authorized Investment TypeMaximumMaturity
MaximumPercentage of
Portfolio
MaximumInvestment in
one Issuer
Local Agency Investment Fund (LAIF) 5 years 50% 50%U.S. Treasury Bills and Notes 5 years 50% 50%Other Local California Agency Debt 5 years 50% 50%U.S. Agency Securities or Government -Sponsored
Enterprises 5 years 50% 50%Certificates of Deposit 5 years 50% 50%
39

CITY OF HOLLISTERNOTES TO BASIC FINANCIAL STATEMENTS
JUNE 30, 2010
NOTE 2: CASH AND INVESTMENTS (CONTINUED)
Investments Authorized by Debt Agreements
Investment of debt proceeds held by bond trustee are governed by provisions of the debt agreements, rather thanthe general provisions of the California Government Code or the City's investment policy. The table below identifiesthe investment types that are authorized for investments held by bond trustee. The table also identifies certainprovisions of these debt agreements that address interest rate risk, credit risk, and concentration of credit risk.
Authorized Investment TypeMaximumMaturity
MaximumPercentage of
Portfolio
MaximumInvestment in
one Issuer
Governmental Funds:U.S. Treasury Obligations None None NoneU.S. Agency Securities None None NoneMoney Market Funds rated "AAA-m" or better None None NoneCertificates of Deposit 366 days None NoneCommercial Paper rated "AAA" or better 92 days None None
Business Enterprise Funds:Defeasance Securities None None NoneObligations issued by:
Resolution Funding Corporation None None NoneLoan marketing Association None None NoneGovernment National Mortgage Association None None None
Bankers Acceptances rated "AAA" or better 180 days None NoneCommercial Paper (not to represent more than 10% of
the outstanding commercial paper of an issuingcorporation) 270 days None None
Non-negotiable Certificates of Deposit 365 days None NoneDeposit accounts fully insured by the F.D.I.C. None None NoneState or Municipal Bonds or Notes rated "A" or better None None NoneMoney Market Funds rated "AAA-m" or better composed
of obligations of the United States or its Agencies None None NoneGuaranteed Investment Contracts rated "AA" or better None None NoneLocal Agency Investment Fund (LAIF) None None None
Disclosure Relating to Interest Rate Risk
Interest rate risk is the risk that changes in market interest rates will adversely affect the fair value of an investment.Generally, the longer the maturity of an investment, the greater the sensitivity of its fair value to changes in marketinterest rates. One of the ways that the City manages its exposure to interest rate risk is by purchasing acombination of shorter term and longer term investments and by timing cash flows from maturities so that a portionof the portfolio is maturing or coming close to maturity evenly over time as necessary to provide the cash flow andliquidity needed for operations.
40

CITY OF HOLLISTERNOTES TO BASIC FINANCIAL STATEMENTS
JUNE 30, 2010
NOTE 2: CASH AND INVESTMENTS (CONTINUED)
Information about the sensitivity of the fair values of the City's investments (including investments held by bondtrustee) to market rate fluctuations is provided by the following table that shows the distribution of the City'sinvestments by maturity as of June 30, 2010:
Remaining Maturity
Investment Type12 months or
less 1-5 years Fair Value
Local Area Investment Pool (LAIF) $ 42,434,370 $ - $ 42,434,370Certificates of deposit 157,563 - 157,563Held by bond trustee:
Money market funds 30,364,762 - 30,364,762
$ 72,956,695 $ - $ 72,956,695
Investments with Fair Values Highly Sensitive to Interest Rate Fluctuations
The City had no investments (including investments held by bond trustees) that were highly sensitive to interest ratefluctuations as of June 30, 2010.
Disclosures Relating to Credit Risk
Generally, credit risk is the risk that an issuer of an investment will not fulfill its obligation to the holder of theinvestment. This is measured by the assignment of a rating by a nationally recognized statistical rating organization.Presented below is the minimum rating required by (where applicable) the California Government Code, the City'sinvestment policy, or debt agreements, and the actual rating as of the fiscal year for each investment type.
MinimumLegal Rating as of Fiscal Year End
Total Rating S&P Moody's N/A
State Investment Pool (LAIF) $ 42,434,370 N/A Not ratedCertificates of Deposit 157,563 N/A Not ratedHeld by bond trustee:
Money market funds 30,364,762 N/A AAA
$ 72,956,695
Concentration of Credit Risk
The investment policy of the City contains no limitations on the amount that can be invested in any one issuerbeyond that stipulated by the California Government Code. Investments in any one issuer (other than U.S. Treasurysecurities, mutual funds, and external investment pools) that represented 5% or more of total City investments as ofJune 30, 2010 were as follows:
Issuer Investment Type Reported Amount
Blackrock Institutional Funds US Treasury securities $ 30,364,762
41

CITY OF HOLLISTERNOTES TO BASIC FINANCIAL STATEMENTS
JUNE 30, 2010
NOTE 2: CASH AND INVESTMENTS (CONTINUED)
Custodial Credit Risk
Custodial credit risk for deposits is the risk that, in the event of the failure of a depository financial institution, agovernment will not be able to recover its deposits or will not be able to recover collateral securities that are in thepossession of an outside party. The custodial credit risk for investments is the risk that, in the event of the failure ofthe counterparty (e.g. broker-dealer) to a transaction, a government will not be able to recover the value of itsinvestment or collateral securities that are in the possession of another party. The California Government Code andthe City investment policy do not contain legal or policy requirements that would limit the exposure to custodial creditrisk for deposits or investments, other than the following provision for deposits: The California Government Coderequires that a financial institution secure deposits made by state or local governmental units by pledging securitiesin an undivided collateral pool held by a depository regulated under state law (unless so waived by the governmentunit). The market value of the pledged securities in the collateral pool must equal at least 110% of the total amountdeposited by the public agencies. California law also allows financial institutions to secure City's deposits bypledging first trust deed mortgage notes having a value of 150% of the secured public deposits. As of June 30, 2010,the carrying amount of the City's bank balances were $3,814,178, of which $642,977 was insured.
Investment in State Investment Pool
The City is a voluntary participant in the Local Agency Investment Fund (LAIF) that is regulated by the CaliforniaGovernment Code under the oversight of the Treasurer of the State of California. This fund is not registered with theSecurities and Exchange Commission as an investment company, but is required to invest according to CaliforniaState Code. Participants in the pool include voluntary and involuntary participants, such as special districts andschool districts for which there are legal provisions regarding their investments. The Local Investment AdvisoryBoard (Board) has oversight responsibility for LAIF. The Board consists of five members as designated by StateStatute. The fair value of the City's investment in this pool is reported in the accompanying financial statements atamounts based upon the City's pro rata share of the fair value provided by LAIF for the entire portfolio (in relation tothe amortized cost of that portfolio). The balance available for withdrawal is based on the accounting recordsmaintained by LAIF, which is recorded on an amortized cost basis.
Allocation of Interest Income Among Funds
Interest income from pooled investments is allocated to those funds which are required by law or administrativeaction to receive interest. Interest is allocated monthly based on the ending cash balances of the previous month ineach fund receiving interest.
42
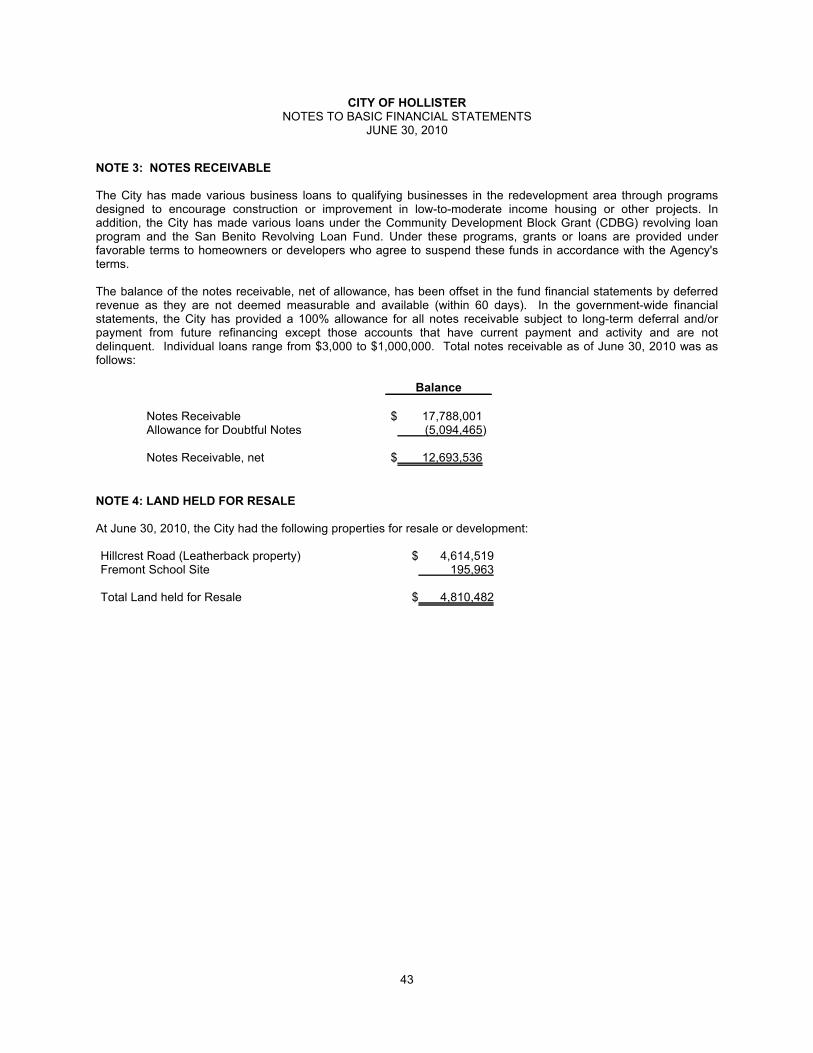
CITY OF HOLLISTERNOTES TO BASIC FINANCIAL STATEMENTS
JUNE 30, 2010
NOTE 3: NOTES RECEIVABLE
The City has made various business loans to qualifying businesses in the redevelopment area through programsdesigned to encourage construction or improvement in low-to-moderate income housing or other projects. Inaddition, the City has made various loans under the Community Development Block Grant (CDBG) revolving loanprogram and the San Benito Revolving Loan Fund. Under these programs, grants or loans are provided underfavorable terms to homeowners or developers who agree to suspend these funds in accordance with the Agency'sterms.
The balance of the notes receivable, net of allowance, has been offset in the fund financial statements by deferredrevenue as they are not deemed measurable and available (within 60 days). In the government-wide financialstatements, the City has provided a 100% allowance for all notes receivable subject to long-term deferral and/orpayment from future refinancing except those accounts that have current payment and activity and are notdelinquent. Individual loans range from $3,000 to $1,000,000. Total notes receivable as of June 30, 2010 was asfollows:
Balance
Notes Receivable $ 17,788,001Allowance for Doubtful Notes (5,094,465)
Notes Receivable, net $ 12,693,536
NOTE 4: LAND HELD FOR RESALE
At June 30, 2010, the City had the following properties for resale or development:
Hillcrest Road (Leatherback property) $ 4,614,519Fremont School Site 195,963
Total Land held for Resale $ 4,810,482
43

CITY OF HOLLISTERNOTES TO BASIC FINANCIAL STATEMENTS
JUNE 30, 2010
NOTE 5: INTERFUND TRANSACTIONS
Interfund Receivables/Payables
The composition of interfund balances as of June 30, 2010 was as follows:
Balances due to/from other funds:
Receivable Fund Payable Fund Amount
General Fund Measure T $ 441,468RDA - Housing 18,163Non-Major Governmental Funds 105,421Airport 5,581Water 111,099Sewer 4,215
685,947
Measure T Non-Major Governmental Funds 8,481
RDA - Housing Non-Major Governmental Funds 16,919
RDA - Capital Projects General Fund 177,099Non-Major Governmental Funds 7,814
184,913
Non-Major Governmental Funds RDA - Capital Projects Fund 53,941Non-Major Governmental Funds 36,878Street Sweeping Fund 170,258
261,077
Sewer Non-Major Governmental Funds 9,937
Total $ 1,167,274
These interfund balances result from the time lag between the dates that (1) interfund goods and services areprovided or reimbursable expenditures occur, and (2) payments between funds are made.
44
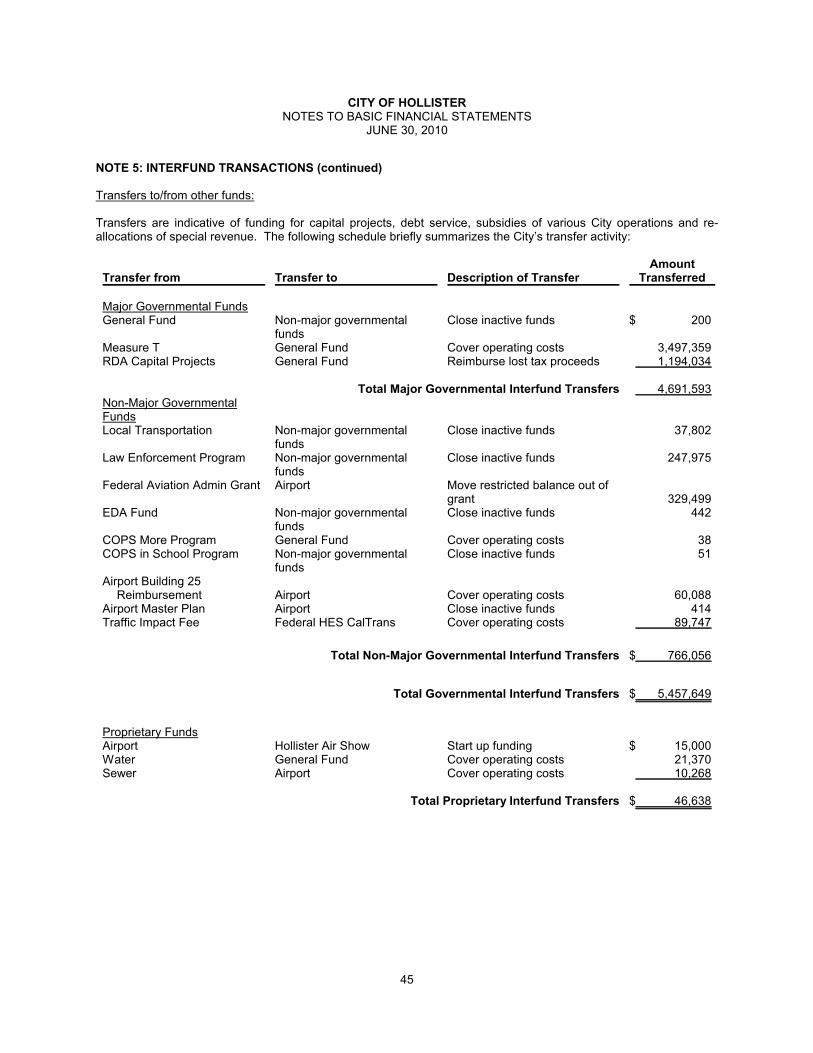
CITY OF HOLLISTERNOTES TO BASIC FINANCIAL STATEMENTS
JUNE 30, 2010
NOTE 5: INTERFUND TRANSACTIONS (continued)
Transfers to/from other funds:
Transfers are indicative of funding for capital projects, debt service, subsidies of various City operations and re-allocations of special revenue. The following schedule briefly summarizes the City’s transfer activity:
Transfer from Transfer to Description of TransferAmount
Transferred
Major Governmental FundsGeneral Fund Non-major governmental
fundsClose inactive funds $ 200
Measure T General Fund Cover operating costs 3,497,359RDA Capital Projects General Fund Reimburse lost tax proceeds 1,194,034
Total Major Governmental Interfund Transfers 4,691,593Non-Major GovernmentalFundsLocal Transportation Non-major governmental
fundsClose inactive funds 37,802
Law Enforcement Program Non-major governmentalfunds
Close inactive funds 247,975
Federal Aviation Admin Grant Airport Move restricted balance out ofgrant 329,499
EDA Fund Non-major governmentalfunds
Close inactive funds 442
COPS More Program General Fund Cover operating costs 38COPS in School Program Non-major governmental
fundsClose inactive funds 51
Airport Building 25Reimbursement Airport Cover operating costs 60,088
Airport Master Plan Airport Close inactive funds 414Traffic Impact Fee Federal HES CalTrans Cover operating costs 89,747
Total Non-Major Governmental Interfund Transfers $ 766,056
Total Governmental Interfund Transfers $ 5,457,649
Proprietary FundsAirport Hollister Air Show Start up funding $ 15,000Water General Fund Cover operating costs 21,370Sewer Airport Cover operating costs 10,268
Total Proprietary Interfund Transfers $ 46,638
45
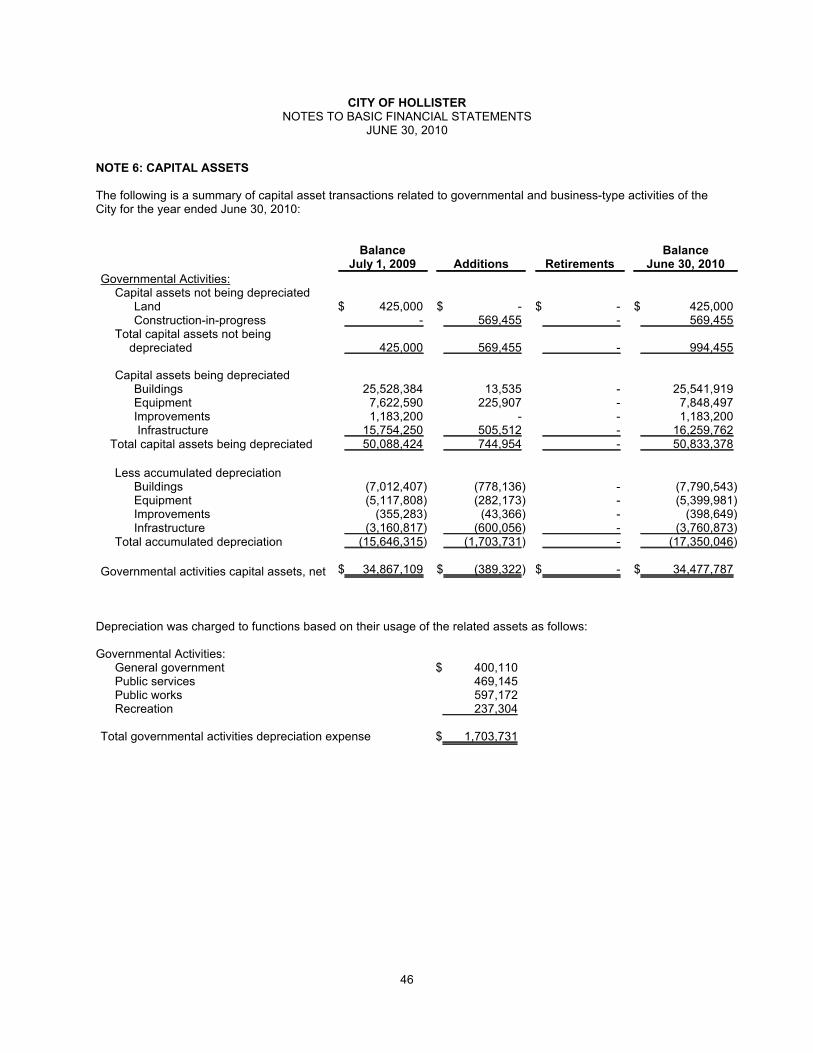
CITY OF HOLLISTERNOTES TO BASIC FINANCIAL STATEMENTS
JUNE 30, 2010
NOTE 6: CAPITAL ASSETS
The following is a summary of capital asset transactions related to governmental and business-type activities of theCity for the year ended June 30, 2010:
BalanceJuly 1, 2009 Additions Retirements
BalanceJune 30, 2010
Governmental Activities:Capital assets not being depreciated
Land $ 425,000 $ - $ - $ 425,000Construction-in-progress - 569,455 - 569,455
Total capital assets not beingdepreciated 425,000 569,455 - 994,455
Capital assets being depreciatedBuildings 25,528,384 13,535 - 25,541,919Equipment 7,622,590 225,907 - 7,848,497Improvements 1,183,200 - - 1,183,200 Infrastructure 15,754,250 505,512 - 16,259,762
Total capital assets being depreciated 50,088,424 744,954 - 50,833,378
Less accumulated depreciationBuildings (7,012,407) (778,136) - (7,790,543)Equipment (5,117,808) (282,173) - (5,399,981)Improvements (355,283) (43,366) - (398,649)Infrastructure (3,160,817) (600,056) - (3,760,873)
Total accumulated depreciation (15,646,315) (1,703,731) - (17,350,046)
Governmental activities capital assets, net $ 34,867,109 $ (389,322) $ - $ 34,477,787
Depreciation was charged to functions based on their usage of the related assets as follows:
Governmental Activities:General government $ 400,110Public services 469,145Public works 597,172Recreation 237,304
Total governmental activities depreciation expense $ 1,703,731
46
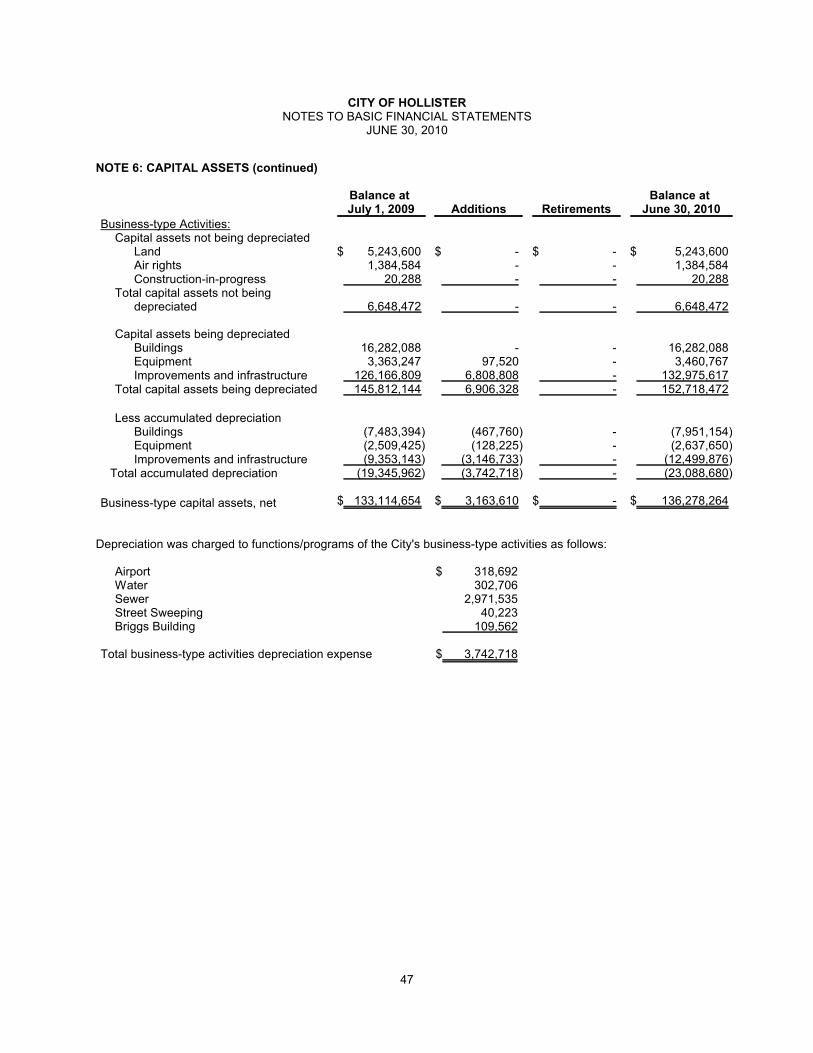
CITY OF HOLLISTERNOTES TO BASIC FINANCIAL STATEMENTS
JUNE 30, 2010
NOTE 6: CAPITAL ASSETS (continued)
Balance at July 1, 2009 Additions Retirements
Balance at June 30, 2010
Business-type Activities:Capital assets not being depreciated
Land $ 5,243,600 $ - $ - $ 5,243,600Air rights 1,384,584 - - 1,384,584Construction-in-progress 20,288 - - 20,288
Total capital assets not beingdepreciated 6,648,472 - - 6,648,472
Capital assets being depreciatedBuildings 16,282,088 - - 16,282,088Equipment 3,363,247 97,520 - 3,460,767Improvements and infrastructure 126,166,809 6,808,808 - 132,975,617
Total capital assets being depreciated 145,812,144 6,906,328 - 152,718,472
Less accumulated depreciationBuildings (7,483,394) (467,760) - (7,951,154)Equipment (2,509,425) (128,225) - (2,637,650)Improvements and infrastructure (9,353,143) (3,146,733) - (12,499,876)
Total accumulated depreciation (19,345,962) (3,742,718) - (23,088,680)
Business-type capital assets, net $ 133,114,654 $ 3,163,610 $ - $ 136,278,264
Depreciation was charged to functions/programs of the City's business-type activities as follows:
Airport $ 318,692Water 302,706Sewer 2,971,535Street Sweeping 40,223Briggs Building 109,562
Total business-type activities depreciation expense $ 3,742,718
47

CITY OF HOLLISTERNOTES TO BASIC FINANCIAL STATEMENTS
JUNE 30, 2010
NOTE 7: LONG-TERM LIABILITIES
Governmental Activities
Long-term obligations of the City consist of bonds, and other liabilities, which are payable from the General, DebtService, Capital Projects, and Enterprise Funds. The following is a summary of long-term liabilities transactionsrelated to governmental activities of the City for the year ended June 30, 2010:
BalanceJuly 1, 2009 Additions Reductions
BalanceJune 30, 2010
Current Portion
1997 Tax allocation bonds $ 4,305,000 $ - $ (775,000) $ 3,530,000 $ 815,0002003 Tax allocation bonds 33,950,000 - (60,000) 33,890,000 60,0002009 Tax allocation bonds - 8,000,000 - 8,000,000 115,000
Total Bonds Payable 38,255,000 8,000,000 (835,000) 45,420,000 990,000
Other liabilities:Bond issuance premium 400,539 - (16,022) 384,517 16,022Compensated absences 819,652 568,890 (575,182) 813,360 300,000
Total Long-term Liabilities $ 39,475,191 $ 8,568,890 $ (1,426,204) $ 46,617,877 $ 1,306,022
A description of the long-term liabilities related to governmental activities at June 30, 2010 follows:
A. 1997 Tax Allocation Bonds
In May 1997, the City authorized the issuance of $9,025,000 of refunding tax allocation bonds to advance refund$9,720,000 outstanding 1988 and 1989 series bonds. The bonds were issued with an average interest rate of5.38%. Principal payments are due annually in October until 2014. Future payments are as follows:
For the Year Ending, June 30 Principal Interest
2011 $ 815,000 $ 167,8352012 860,000 122,8192013 905,000 75,3842014 950,000 25,531
Total $ 3,530,000 $ 391,569
48
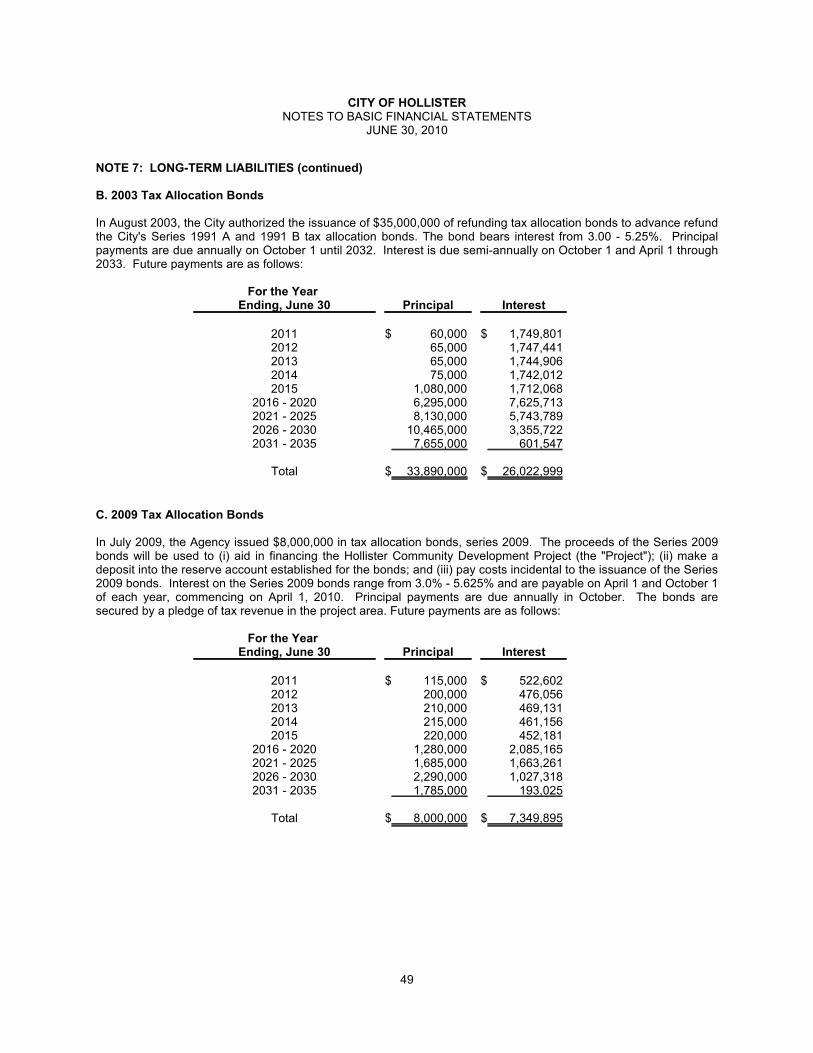
CITY OF HOLLISTERNOTES TO BASIC FINANCIAL STATEMENTS
JUNE 30, 2010
NOTE 7: LONG-TERM LIABILITIES (continued)
B. 2003 Tax Allocation Bonds
In August 2003, the City authorized the issuance of $35,000,000 of refunding tax allocation bonds to advance refundthe City's Series 1991 A and 1991 B tax allocation bonds. The bond bears interest from 3.00 - 5.25%. Principalpayments are due annually on October 1 until 2032. Interest is due semi-annually on October 1 and April 1 through2033. Future payments are as follows:
For the Year Ending, June 30 Principal Interest
2011 $ 60,000 $ 1,749,8012012 65,000 1,747,4412013 65,000 1,744,9062014 75,000 1,742,0122015 1,080,000 1,712,068
2016 - 2020 6,295,000 7,625,7132021 - 2025 8,130,000 5,743,7892026 - 2030 10,465,000 3,355,7222031 - 2035 7,655,000 601,547
Total $ 33,890,000 $ 26,022,999
C. 2009 Tax Allocation Bonds
In July 2009, the Agency issued $8,000,000 in tax allocation bonds, series 2009. The proceeds of the Series 2009bonds will be used to (i) aid in financing the Hollister Community Development Project (the "Project"); (ii) make adeposit into the reserve account established for the bonds; and (iii) pay costs incidental to the issuance of the Series2009 bonds. Interest on the Series 2009 bonds range from 3.0% - 5.625% and are payable on April 1 and October 1of each year, commencing on April 1, 2010. Principal payments are due annually in October. The bonds aresecured by a pledge of tax revenue in the project area. Future payments are as follows:
For the Year Ending, June 30 Principal Interest
2011 $ 115,000 $ 522,6022012 200,000 476,0562013 210,000 469,1312014 215,000 461,1562015 220,000 452,181
2016 - 2020 1,280,000 2,085,1652021 - 2025 1,685,000 1,663,2612026 - 2030 2,290,000 1,027,3182031 - 2035 1,785,000 193,025
Total $ 8,000,000 $ 7,349,895
49

CITY OF HOLLISTERNOTES TO BASIC FINANCIAL STATEMENTS
JUNE 30, 2010
NOTE 7: LONG-TERM LIABILITIES (continued)
D. Debt Service Requirements
Total debt service requirements for the governmental funds are shown below:
For the Year Ending, June 30 Principal Interest
2011 $ 990,000 $ 2,440,2382012 1,125,000 2,346,3162013 1,180,000 2,289,4212014 1,240,000 2,194,1932015 1,300,000 2,164,249
2016 - 2020 7,575,000 9,710,8782021 - 2025 9,815,000 7,407,0502026 - 2030 12,755,000 4,383,0402031 - 2035 9,440,000 794,572
Total $ 45,420,000 $ 33,729,957
E. Bond Issuance Costs and Premiums
Capitalized bond costs related to bond issuances have been recorded as deferred charges of $373,805 and bondpremium in the amount of $384,517. The balances are amortized (accreted) using the straight line method over thebond terms of 30 years. Net accretion for bond costs for the year ended June 30, 2010 totaled $969.
F. Compensated Absences
Compensated absences comprise unused vacation leave and compensatory time off, which are accrued as earned.The liability for compensated absences is determined annually. The City does not accrue for compensated absencesin its governmental fund statements and recognizes liabilities for compensated absences only if they are due andpayable in an event such as termination. However, in the Statement of Activities the expenditure is allocated to eachfunction based on usage. The compensated absences liability attributable to the governmental activities wasliquidated as follows: General Fund 70%, Measure T Fund 5%, RDA – Capital Projects Fund 20%, and Nonmajorfunds 5%.
50

CITY OF HOLLISTERNOTES TO BASIC FINANCIAL STATEMENTS
JUNE 30, 2010
NOTE 7: LONG-TERM LIABILITIES (continued)
Business-type Activities
The following is a summary of long-term liabilities transactions related to business-type activities of the City for theyear ended June 30, 2010
BalanceJuly 1, 2009 Additions Reductions
BalanceJune 30, 2010
CurrentPortion
2006 Wastewater revenue bonds $ 111,960,000 $ - $ (1,585,000) $ 110,375,000 $ 1,840,0002007 Wastewater refunding bonds 6,270,000 - (315,000) 5,955,000 325,000CA Dept. of Transportation loan 723,880 - (70,559) 653,321 74,494
Total bonds and loans payable 118,953,880 - (1,970,559) 116,983,321 2,239,494
Other liabilities:Bond issuance premium 6,831,275 - (244,702) 6,586,573 244,702Compensated absences 146,879 191,838 (119,493) 219,224 118,000
Total Long-Term Liabilities $ 125,932,034 $ 191,838 $ (2,334,754) $ 123,789,118 $ 2,602,196
A description of the long-term liabilities related to business-type activities at June 30, 2010 is as follows:
A. 2006 Wastewater Revenue Bonds
In December 2006, the Hollister Joint Powers Financing Authority authorized the issuance of $120,535,000 ofgeneral obligation bonds to (i) refund a portion of the 1993 revenue bonds; (ii) finance the costs of acquisition andconstruction of wastewater facilities for the City; (iii) fund capitalized interest on the 2006 bonds; (iv) fund a reservefund for the 2006 bonds; and (v) pay costs of issuance of the 2006 bonds. Of the total issuance, $6,290,000 wasused to refund the Authority's $12,965,000 outstanding principal amount of 1993 bonds. Upon the issuance, theRefunded 1993 bonds were defeased pursuant to terms of the trust indenture pursuant to which such refunded 1993bonds were issued. Upon delivery of the 2006 bonds and the refunding of the Refunded 1993 bonds, there was$6,675,000 outstanding principal amount remaining of 1993 bonds. This refunding generated net present valueeconomic savings of $741,450 and average annual savings of approximately $66,360. The 2006 bonds bearinterest from 4.00 - 5.00%. Principal payments are due annually on June 1 until 2037. Interest is due semi-annuallyon June 1 and December 1 through 2037. Future payments are as follows:
For the Year Ending, June 30 Principal Interest
2011 $ 1,840,000 $ 5,434,2502012 1,930,000 5,342,2502013 2,030,000 5,247,5262014 2,125,000 5,147,8742015 2,235,000 5,043,576
2016 - 2020 12,915,000 23,461,7502021 - 2025 17,035,000 19,962,9742026 - 2030 24,450,000 15,018,9262031 - 2035 31,115,000 8,370,3482036 - 2040 14,700,000 1,095,750
Total $ 110,375,000 $ 94,125,224
51
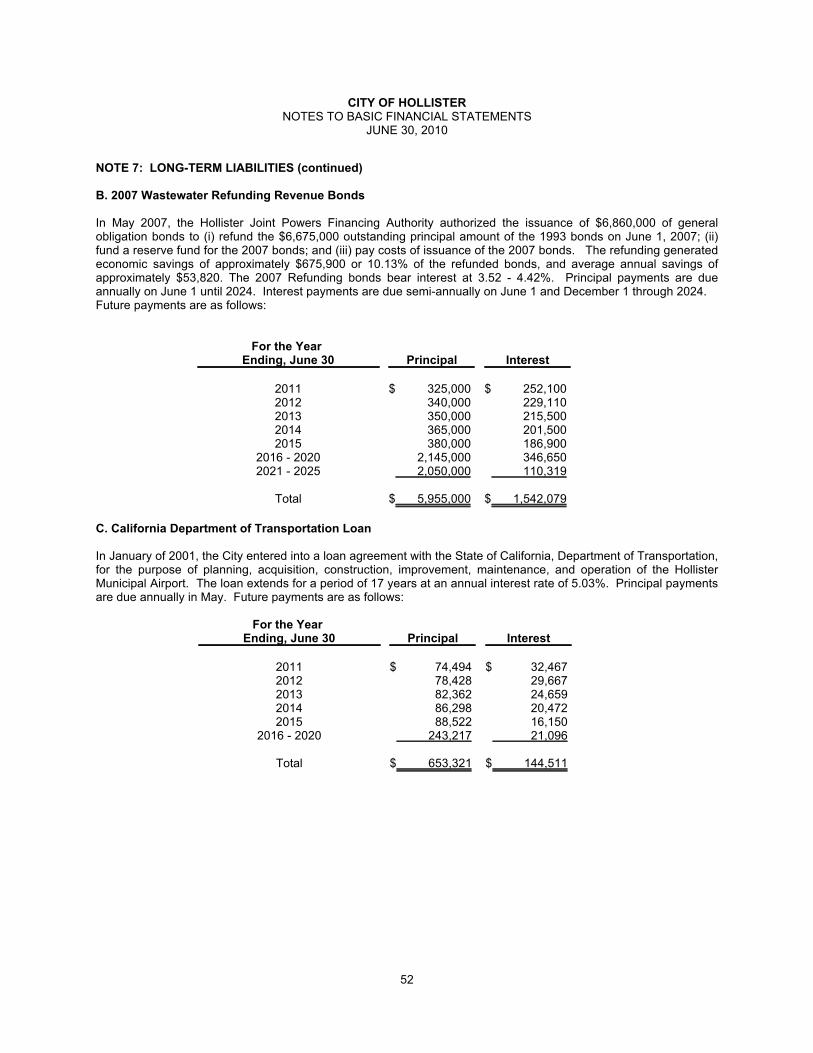
CITY OF HOLLISTERNOTES TO BASIC FINANCIAL STATEMENTS
JUNE 30, 2010
NOTE 7: LONG-TERM LIABILITIES (continued)
B. 2007 Wastewater Refunding Revenue Bonds
In May 2007, the Hollister Joint Powers Financing Authority authorized the issuance of $6,860,000 of generalobligation bonds to (i) refund the $6,675,000 outstanding principal amount of the 1993 bonds on June 1, 2007; (ii)fund a reserve fund for the 2007 bonds; and (iii) pay costs of issuance of the 2007 bonds. The refunding generatedeconomic savings of approximately $675,900 or 10.13% of the refunded bonds, and average annual savings ofapproximately $53,820. The 2007 Refunding bonds bear interest at 3.52 - 4.42%. Principal payments are dueannually on June 1 until 2024. Interest payments are due semi-annually on June 1 and December 1 through 2024.Future payments are as follows:
For the Year Ending, June 30 Principal Interest
2011 $ 325,000 $ 252,1002012 340,000 229,1102013 350,000 215,5002014 365,000 201,5002015 380,000 186,900
2016 - 2020 2,145,000 346,6502021 - 2025 2,050,000 110,319
Total $ 5,955,000 $ 1,542,079
C. California Department of Transportation Loan
In January of 2001, the City entered into a loan agreement with the State of California, Department of Transportation,for the purpose of planning, acquisition, construction, improvement, maintenance, and operation of the HollisterMunicipal Airport. The loan extends for a period of 17 years at an annual interest rate of 5.03%. Principal paymentsare due annually in May. Future payments are as follows:
For the Year Ending, June 30 Principal Interest
2011 $ 74,494 $ 32,4672012 78,428 29,6672013 82,362 24,6592014 86,298 20,4722015 88,522 16,150
2016 - 2020 243,217 21,096
Total $ 653,321 $ 144,511
52

CITY OF HOLLISTERNOTES TO BASIC FINANCIAL STATEMENTS
JUNE 30, 2010
NOTE 7: LONG-TERM LIABILITIES (continued)
D. Debt Service Requirements
Total debt service requirements for business-type activities:
For the Year Ending, June 30 Principal Interest
2011 $ 2,239,494 $ 5,718,8172012 2,348,428 5,601,0272013 2,462,362 5,487,6852014 2,576,298 5,369,8462015 2,703,522 5,246,626
2016 - 2020 15,303,217 23,829,4962021 - 2025 19,085,000 20,073,2932026 - 2030 24,450,000 15,018,9262031 - 2035 31,115,000 8,370,3482036 - 2040 14,700,000 1,095,750
Total $ 116,983,321 $ 95,811,814
E. Deferred Charges
Capitalized bond costs related to the bond issuances have been recorded as deferred charges and bond premium inthe amounts of $2,855,473 and $6,586,573, respectively. The balances are amortized (accreted) using the straightline method over the bond terms of 30 years. Net accretion for bond costs for the year ended June 30, 2010 totaled$138,616.
F. Limitations and Restrictions
There are a number of limitations and restrictions contained in the various debt indentures. The City’s managementbelieves that the City is in compliance with all significant limitations and restrictions.
G. Rebatable Arbitrage Earnings
The Tax Reform Act of 1986 instituted certain arbitrage restrictions with respect to the issuance of tax-exempt bondsafter August 31, 1986. Arbitrage regulations deal with the investment of all tax-exempt bond proceeds at an interestyield greater than the interest yield paid to bondholders. Generally, all interest paid to bondholders can beretroactively rendered taxable if applicable rebates are not reported and paid to the Internal Revenue Service at leastevery five years. During the current year, the City performed calculations of excess investment earnings on variousbonds and financings and at June 30, 2010 does not expect to incur a liability.
53

CITY OF HOLLISTERNOTES TO BASIC FINANCIAL STATEMENTS
JUNE 30, 2010
NOTE 8: DEBT WITHOUT CITY COMMITMENT
Special assessment bonds and related interest costs are payable solely from assessments and interest collectedfrom the property owners benefited by the respective improvements. The City has no liability for payment of thebonds should assessments be insufficient to cover bond principal and interest; however due to the City's oversightrelationship with the Special Assessment Districts, they are included in the City's reporting entity as SpecialAssessment Debt in the Agency Funds. As of June 30, 2010, the outstanding principal amounts of the bonds were:
OriginalPrincipal
OriginationDate Maturity
Balance atJune 30, 2010
Meridian Street District $ 2,335,000 3/2/1994 9/2/2022 $ 1,620,000San Benito Estates 510,000 3/2/1992 9/2/2021 320,000Gateway Center 1,250,000 3/2/1999 9/2/2019 790,000
Total $ 4,095,000 $ 2,730,000
NOTE 9: RESTRICTED NET ASSETS/RESERVED AND DESIGNATED FUND BALANCES
Fund Balances
Fund balances that are not available for appropriation or are not considered “expendable available financialresources” are reserved. Unreserved fund balances that have been earmarked by the Council for a specifiedpurpose are considered designated. Such reserved and designated fund balances at June 30, 2010 were as follows:
Major Funds
General Fund Measure TRDA -
HousingRDA - Capital
ProjectsRDA - Debt
Service
OtherGovernmental
Funds
TotalGovernmental
Funds
Reserved for:Land held for resale $ - $ - $ - $ 4,810,482 $ - $ - $ 4,810,482Housing set-aside - - 11,068,095 - - - 11,068,095Debt service - - - - 4,019,249 - 4,019,249Inventory 32,748 - - - - - 32,748
Total reserved fundbalance 32,748 - 11,068,095 4,810,482 4,019,249 - 19,930,574
Unreserved-undesignatedReported in:
General fund 2,126,112 - - - - - 2,126,112Special revenuefunds - 8,480 - - - 6,593,807 6,602,287
Capital projectfunds - - - 9,240,354 - 11,461,036 20,701,390
Total unreserved fundbalances 2,126,112 8,480 - 9,240,354 - 18,054,843 29,429,789
Total fund balances $ 2,158,860 $ 8,480 $ 11,068,095 $ 14,050,836 $ 4,019,249 $ 18,054,843 $ 49,360,363
Net Assets
The government-wide Statement of Net Assets reports $15,087,344 of restricted net assets, of which $4,019,249 isrestricted by debt covenants and $11,068,095 is restricted by enabling legislation.
54

CITY OF HOLLISTERNOTES TO BASIC FINANCIAL STATEMENTS
JUNE 30, 2010
NOTE 10: PENSION PLAN
Substantially all City employees are eligible to participate in pension plans offered by California Public EmployeesRetirement System (CalPERS), an agent multiple employer defined benefit pension plan which acts as a commoninvestment and administrative agent for its participating member employers. CalPERS provides retirement anddisability benefits, annual cost of living adjustments and death benefits to plan members, who must be publicemployees and beneficiaries. The City's employees participate in the separate Safety (police and fire) andMiscellaneous (all other) Employee Plans. Benefit provisions under both Plans are established by State statute andCity resolution. Benefits are based on years of credited service; one year of credited service is equal to one year offull time employment. Funding contributions for both Plans are determined annually on an actuarial basis as of June30 by CalPERS; the City must contribute these amounts. The Plans' provisions and benefits in effect for the yearended June 30, 2010, are summarized as follows:
Miscellaneous Police Safety Fire Safety
Benefit vesting schedule 5 years of service 5 years of service 5 years of serviceBenefit payments Monthly for life Monthly for life Monthly for lifeRetirement age 55 50 50Monthly benefits, as a % of annual salary 2% 3% 3%Required employee contribution rates 7% 9% 9%Required employer contribution rates 15.178% 35.377% 25.526%Actuarially required contributions $ 879,171 $ 973,366 $ 584,681
CalPERS determines contribution requirements using a modification of the Entry Age Normal Method. Under thismethod, the City's total normal benefit cost for each employee from date of hire to date of retirement is expressedas a level percentage of the total related total payroll cost. Normal benefit cost under this method is the levelamount the City must pay annually to fund an employee's projected retirement benefit. This level percentage ofpayroll method is used to amortize any unfunded actuarial liabilities.
The actuarial assumptions used to compute contribution requirements are also used to compute the actuarialaccrued liability. The City does not have a net pension obligation since it pays these actuarially requiredcontributions monthly.
CalPERS uses the market related value method of valuing the Plan's assets. An investment rate of return of 7.75%is assumed, including inflation at 3.0%. Annual salary increases are assumed to vary by duration of service.Changes in liability due to plan amendments, changes in actuarial assumptions, or changes in actuarial methods areamortized as a level percentage of payroll on a closed basis over twenty years. Investment gains and losses areaccumulated as they are realized and ten percent of the net balance is amortized annually.
Audited annual financial statements and ten-year trend information are available from CalPERS at P.O. Box 942709,Sacramento, CA 94229-2709.
The Plans' actuarial value (which differs from market value) and funding progress over the past three years, asreported by PERS in their most recent actuarial evaluation are set forth below at their most recent actuarial valuationdate of June 30, 2009:
Three Year Trend Information for PERS for all Plans
Fiscal YearAnnual Pension Cost
(APC)Percentage of APC
Contributed Net Pension Obligation
2007 $ 2,213,201 100% -2008 $ 2,196,340 100% -2009 $ 2,437,218 100% -
55

CITY OF HOLLISTERNOTES TO BASIC FINANCIAL STATEMENTS
JUNE 30, 2010
NOTE 10: PENSION PLAN (continued)
The funded status of the plan as of June 30, 2009, the most recent actuarial valuation date, was as follows:
Miscellaneous PlanSchedule of Funding Progress for PERS
(Risk Pool as a Whole)
ActuarialValuation
DateNormal Accrued
LiabilityActuarial Value of
Assets
Liability(ExcessAssets)
Funded Status
AnnualCoveredPayroll
UAAL as a %of Covered
Payroll
6/30/09 $ 1,834,424,640 $ 1,493,430,831 $ 340,993,809 81.4% $ 355,150,151 96.0%
Police Safety PlanSchedule of Funding Progress for PERS
(Risk Pool as a Whole)
ActuarialValuation
DateNormal Accrued
LiabilityActuarial Value of
Assets Liability (Excess
Assets) Funded Status
AnnualCoveredPayroll
UAAL as a %of Covered
Payroll
6/30/09 $ 9,721,675,347 $ 8,027,158,724 $ 1,694,516,623 82.6% $ 973,814,168 174.0%
Fire Safety PlanSchedule of Funding Progress for PERS
(Risk Pool as a Whole)
ActuarialValuation
DateNormal Accrued
LiabilityActuarial Value of
Assets
Liability (ExcessAssets) Funded
Status
AnnualCoveredPayroll
UAAL as a %of Covered
Payroll
6/30/09 $ 9,721,675,347 $ 8,027,158,724 $ 1,694,516,623 82.6% $ 973,814,168 174.0%
The schedule of funding progress, which is presented as required supplementary information immediately followingthe notes to the financial statements, provides multi-year trend information about whether the actuarial value of planassets is increasing or decreasing over time relative to the actuarial accrued liability for benefits.
56
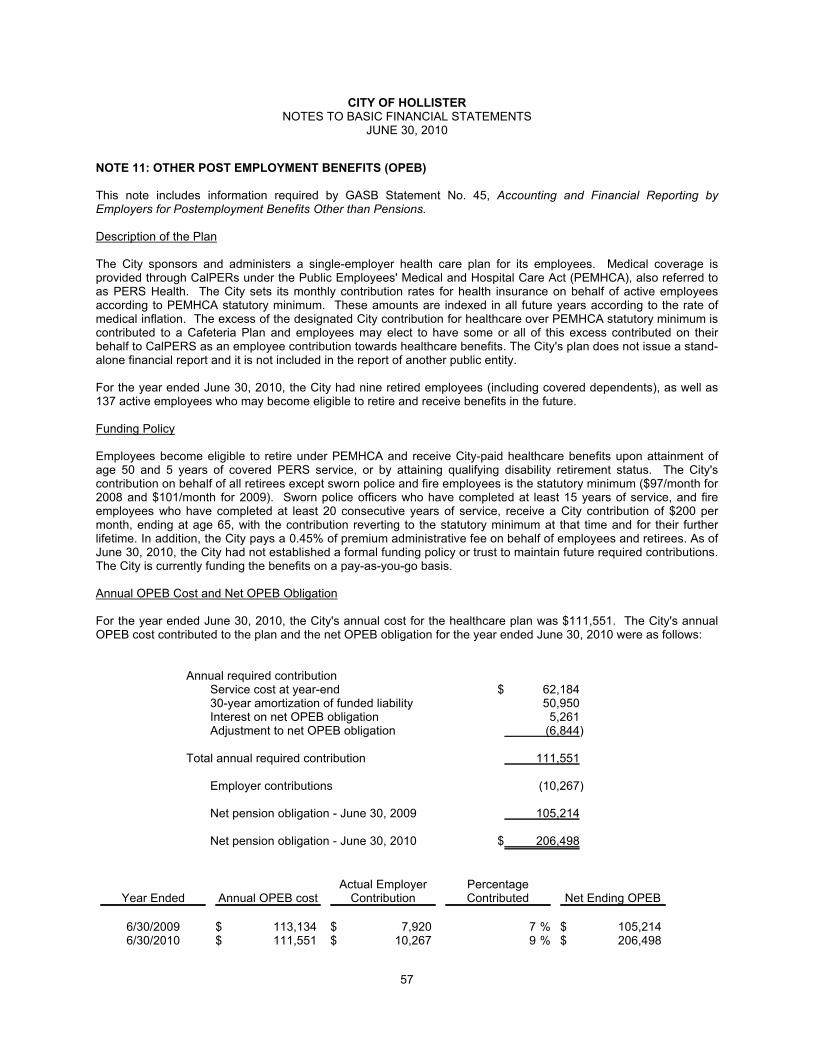
CITY OF HOLLISTERNOTES TO BASIC FINANCIAL STATEMENTS
JUNE 30, 2010
NOTE 11: OTHER POST EMPLOYMENT BENEFITS (OPEB)
This note includes information required by GASB Statement No. 45, Accounting and Financial Reporting byEmployers for Postemployment Benefits Other than Pensions.
Description of the Plan
The City sponsors and administers a single-employer health care plan for its employees. Medical coverage isprovided through CalPERs under the Public Employees' Medical and Hospital Care Act (PEMHCA), also referred toas PERS Health. The City sets its monthly contribution rates for health insurance on behalf of active employeesaccording to PEMHCA statutory minimum. These amounts are indexed in all future years according to the rate ofmedical inflation. The excess of the designated City contribution for healthcare over PEMHCA statutory minimum iscontributed to a Cafeteria Plan and employees may elect to have some or all of this excess contributed on theirbehalf to CalPERS as an employee contribution towards healthcare benefits. The City's plan does not issue a stand-alone financial report and it is not included in the report of another public entity.
For the year ended June 30, 2010, the City had nine retired employees (including covered dependents), as well as137 active employees who may become eligible to retire and receive benefits in the future.
Funding Policy
Employees become eligible to retire under PEMHCA and receive City-paid healthcare benefits upon attainment ofage 50 and 5 years of covered PERS service, or by attaining qualifying disability retirement status. The City'scontribution on behalf of all retirees except sworn police and fire employees is the statutory minimum ($97/month for2008 and $101/month for 2009). Sworn police officers who have completed at least 15 years of service, and fireemployees who have completed at least 20 consecutive years of service, receive a City contribution of $200 permonth, ending at age 65, with the contribution reverting to the statutory minimum at that time and for their furtherlifetime. In addition, the City pays a 0.45% of premium administrative fee on behalf of employees and retirees. As ofJune 30, 2010, the City had not established a formal funding policy or trust to maintain future required contributions.The City is currently funding the benefits on a pay-as-you-go basis.
Annual OPEB Cost and Net OPEB Obligation
For the year ended June 30, 2010, the City's annual cost for the healthcare plan was $111,551. The City's annualOPEB cost contributed to the plan and the net OPEB obligation for the year ended June 30, 2010 were as follows:
Annual required contributionService cost at year-end $ 62,18430-year amortization of funded liability 50,950Interest on net OPEB obligation 5,261Adjustment to net OPEB obligation (6,844)
Total annual required contribution 111,551
Employer contributions (10,267)
Net pension obligation - June 30, 2009 105,214
Net pension obligation - June 30, 2010 $ 206,498
Year Ended Annual OPEB costActual Employer
ContributionPercentageContributed Net Ending OPEB
6/30/2009 $ 113,134 $ 7,920 %7 $ 105,2146/30/2010 $ 111,551 $ 10,267 %9 $ 206,498
57

CITY OF HOLLISTERNOTES TO BASIC FINANCIAL STATEMENTS
JUNE 30, 2010
NOTE 11: OTHER POST EMPLOYMENT BENEFITS (OPEB) (continued)
Fiscal year 2009 was the year of implementation of GASB Statement No. 45, Accounting and Financial Reporting byEmployers for Postemployment Benefits Other than Pensions. Therefore, prior year comparative data is notavailable. In future years, three-year trend information will be presented.
Funded Status and Funding Progress
The funded status of the plan based on an actuarial study using age-adjusted premiums as of June 30, 2010, was asfollows:
Actuarial accrued liability (AAL)Active employees $ 554,600Retired employees 228,624
783,224
Actuarial value of plan assets -
Unfunded actuarial accrued liability (UAAL) $ 783,224
Funded Ratio (actuarial value of plan assets / AAL) 0 %
Covered payroll (active plan members) $ 8,892,778
UAAL as a percentage of covered payroll %9
Actuarial valuations for an ongoing plan involve estimates of the value of reported amounts and assumptions aboutthe probability of occurrence of events far into the future. Actuarially determined amounts are subject to continuousrevision as actual results are compared to past expectations and new estimates about the future are formulated.Although the valuation results are based on the values which the City's actuarial consultant believes are reasonableassumptions, the valuation results reflect a long-term perspective and, as such, are merely an estimate of whatfuture costs may actually be. Deviations in any of several factors, such as future interest rates, medical costinflation, Medicare coverage, and changes in marital status, could result in actual costs being less or greater thanestimated.
The schedule of funding progress, presented as required supplementary information following the notes to thefinancial statements, will present multi-year trend information that shows whether the actuarial value of the planassets is increasing or decreasing over time relative to the actuarial accrued liabilities for benefits. Because 2009was the year of implementation of GASB Statement No. 45 and the City elected to apply the statement prospectively,only one year is presented in the schedule at this time. In future years, required trend data will be presented.
58
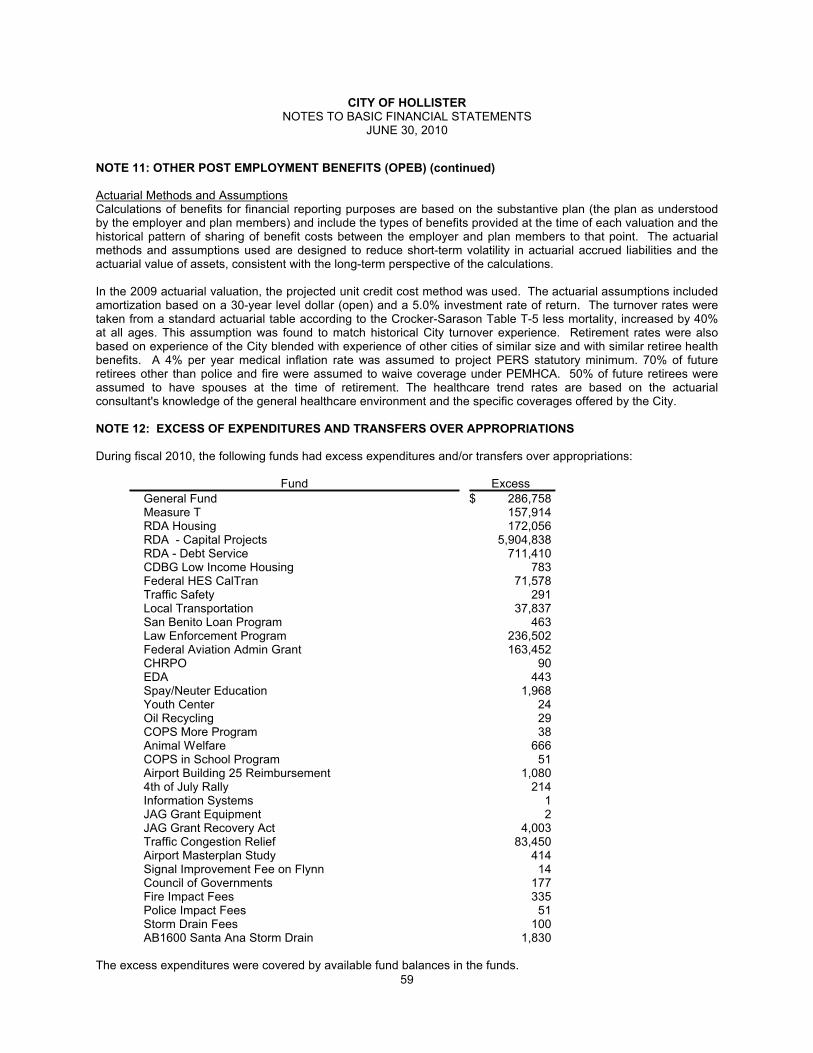
CITY OF HOLLISTERNOTES TO BASIC FINANCIAL STATEMENTS
JUNE 30, 2010
NOTE 11: OTHER POST EMPLOYMENT BENEFITS (OPEB) (continued)
Actuarial Methods and AssumptionsCalculations of benefits for financial reporting purposes are based on the substantive plan (the plan as understoodby the employer and plan members) and include the types of benefits provided at the time of each valuation and thehistorical pattern of sharing of benefit costs between the employer and plan members to that point. The actuarialmethods and assumptions used are designed to reduce short-term volatility in actuarial accrued liabilities and theactuarial value of assets, consistent with the long-term perspective of the calculations.
In the 2009 actuarial valuation, the projected unit credit cost method was used. The actuarial assumptions includedamortization based on a 30-year level dollar (open) and a 5.0% investment rate of return. The turnover rates weretaken from a standard actuarial table according to the Crocker-Sarason Table T-5 less mortality, increased by 40%at all ages. This assumption was found to match historical City turnover experience. Retirement rates were alsobased on experience of the City blended with experience of other cities of similar size and with similar retiree healthbenefits. A 4% per year medical inflation rate was assumed to project PERS statutory minimum. 70% of futureretirees other than police and fire were assumed to waive coverage under PEMHCA. 50% of future retirees wereassumed to have spouses at the time of retirement. The healthcare trend rates are based on the actuarialconsultant's knowledge of the general healthcare environment and the specific coverages offered by the City.
NOTE 12: EXCESS OF EXPENDITURES AND TRANSFERS OVER APPROPRIATIONS
During fiscal 2010, the following funds had excess expenditures and/or transfers over appropriations:
Fund Excess
General Fund $ 286,758Measure T 157,914RDA Housing 172,056RDA - Capital Projects 5,904,838RDA - Debt Service 711,410CDBG Low Income Housing 783Federal HES CalTran 71,578Traffic Safety 291Local Transportation 37,837San Benito Loan Program 463Law Enforcement Program 236,502Federal Aviation Admin Grant 163,452CHRPO 90EDA 443Spay/Neuter Education 1,968Youth Center 24Oil Recycling 29COPS More Program 38Animal Welfare 666COPS in School Program 51Airport Building 25 Reimbursement 1,0804th of July Rally 214Information Systems 1JAG Grant Equipment 2JAG Grant Recovery Act 4,003Traffic Congestion Relief 83,450Airport Masterplan Study 414Signal Improvement Fee on Flynn 14Council of Governments 177Fire Impact Fees 335Police Impact Fees 51Storm Drain Fees 100AB1600 Santa Ana Storm Drain 1,830
The excess expenditures were covered by available fund balances in the funds. 59

CITY OF HOLLISTERNOTES TO BASIC FINANCIAL STATEMENTS
JUNE 30, 2010
NOTE 13: DEFICIT FUND BALANCES
As of June 30, 2010, the following funds had a fund deficit:
Fund Deficit
Mello Roos CFD-1 $ 4,773Jail Juvenile Hall 43,576ARRA 39,390
These deficits were a result of expenditures incurred in advance of receipt of revenue and will be eliminated throughfuture revenues and expenditure reductions.
NOTE 14: RISK MANAGEMENT
The City manages risk of loss related to torts; theft of, damage to, and destruction of assets; errors and omissions;injuries to employees; and natural disasters by participating in the public entity risk pool described below and byretaining certain risks.
Public entity risk pools are formally organized and separate entities established under the Joint Exercise of PowersAct of the State of California which exercise full powers and authorities within the scope of the related Joint PowersAgreements including the preparation of annual budgets, accountability for all funds, the power to make and executecontracts and the right to sue and be sued. Each risk pool is governed by a board consisting of representatives frommember municipalities. Each board controls the operations of the respective risk pool, including selection ofmanagement and approval of operating budgets, independent of any influence by member municipalities beyondtheir representation on that board. Obligations and liabilities of these risk pools are not the member's responsibility.
Risk Coverage
The City is a member of the Monterey Bay Area Self Insurance Authority (MBASIA). MBASIA provides coverageagainst risks under terms of joint-powers agreement with the City and several other cities and governmentalagencies. MBASIA covers losses in excess of $10,000 for members of the liability group and carries excessinsurance for losses between $1,000,000 and $20,000,000. Members of the workers' compensation group paytemporary disability claims, while MBASIA pays for permanent disability claims, medical costs, rehabilitation costs,and legal costs and carries excess workers' compensation coverage for between $500,000 and statutory.
Audited financial statements for MBASIA for the fiscal year ended June 30, 2009 (the most current informationavailable) was as follows:
Total Assets $ 14,512,890Total Liabilities $ 17,455,967
Net Assets $ (2,943,077)Total Revenues $ 4,991,024Total Expenses $ 2,872,734
Change in Net Assets $ 2,118,290
MBASIA is governed by a Board consisting of representatives from member municipalities. The Board controls theoperations of MBASIA, including selection of management and approval of operating budgets, independent of anyinfluence by member municipalities beyond their representation on the Board.
The City's deposits with MBASIA are in accordance with formulas established by MBASIA. Actual surpluses orlosses are shared according to a formula developed from overall loss costs and spread to member entities on apercentage basis after a retrospective rating.
60

CITY OF HOLLISTERNOTES TO BASIC FINANCIAL STATEMENTS
JUNE 30, 2010
NOTE 15: PROPOSITION 1A- BORROWING FROM THE STATE OF CALIFORNIA
Under the provisions of Proposition 1A and as part of the 2009-10 budget package passed by the California statelegislature on July 28, 2009, the State of California borrowed 8% of the amount of property tax revenue, includingthose property taxes associated with the in-lieu motor vehicle license fee, the triple flip in lieu sales tax, andsupplemental property tax, apportioned to cities, counties and special districts (excluding redevelopment agencies).The state is required to repay this borrowing plus interest by June 30, 2013. After repayment of this initial borrowing,the California legislature may consider only one additional borrowing within a ten-year period. The amount of thisborrowing pertaining to the City was $368,588.
Authorized with the 2009-10 State budget package, the Proposition 1A Securitization Program was instituted by theCalifornia Statewide Communities Development Authority (“California Communities”), a joint powers authoritysponsored by the California State Association of Counties and the League of California Cities, to enable localgovernments to sell their Proposition 1A receivables to California Communities. Under the Securitization Program,California Communities simultaneously purchased the Proposition 1A receivables and issued bonds (“Prop 1ABonds”) to provide local agencies with cash proceeds in two equal installments, on January 15, 2010 and May 3,2010. The purchase price paid to the local agencies equaled 100% of the amount of the property tax reduction. Alltransaction costs of issuance and interest were paid by the State of California. Participating local agencies have noobligation on the bonds and no credit exposure to the State. The City participated in the securitization program andaccordingly property taxes have been recorded in the same manner as if the State had not exercised its rights underProposition 1A. The receivable sale proceeds were equal to the book value and, as a result, no gain or loss wasrecorded.
NOTE 16: SUPPLEMENTAL EDUCATIONAL REVENUE AUGMENTATION FUND
In July 2009, the California Legislature passed ABX4-26 as part of the State’s budget package which requiresredevelopment agencies to remit approximately $2.05 billion in redevelopment revenues back to the State. UnderABX4-26, each redevelopment agency must contribute a proportionate share of revenue to the newly createdSupplemental Educational Revenue Augmentation Fund (SERAF). The bill authorizes redevelopment agencies,from July 1, 2009, to June 30, 2010, to suspend all or part of its required 20% allocation to its Low and ModerateIncome Housing Fund in order to make the required payments. The Housing Fund must be repaid by June 30,2015. If the agency fails to repay the Housing Fund, the required allocation of tax increment to the Housing Fund isincreased to 25% for most agencies as long as the project area continues to receive tax increment. This will result inthe delay or elimination of many affordable housing projects where redevelopment funding is a key fundingcomponent. Payments were to be made in two parts, one in FY 2010 and the other in FY 2011. In October 2009, theCalifornia Redevelopment Association and two of its members filed a lawsuit to challenge the constitutionality of thebill. In May 2010, the ruling was upheld and the California Redevelopment Association submitted for another appealin August 2010. The appeal seeks repayment of the funds paid out in FY 2010 and a prohibition of the funds to bepaid in FY 2011. A ruling is expected before May 2011, the date the redevelopment agencies must make their FY2011 payment to the State. The amount paid to the State from the Agency totaled $4,462,882 in FY 2010 and theamount to be paid in FY 2011 totals $917,952.
NOTE 17: COMMITMENTS AND CONTINGENCIES
Litigation
The City is presently involved in certain matters of litigation that have arisen in the normal course of conducting Citybusiness. City management believes, based upon consultation with the City Attorney, that these cases, in theaggregate, are adequately covered by insurance and not expected to result in a material adverse financial impact onthe City.
Grant Awards
Under the terms of Federal and State grants, audits may be required and certain costs may be questioned as notbeing appropriate expenditures under the terms of the grants. Such audits could lead to requests for reimbursementto the grantor agencies. City management believes disallowances, if any, will be immaterial.
61
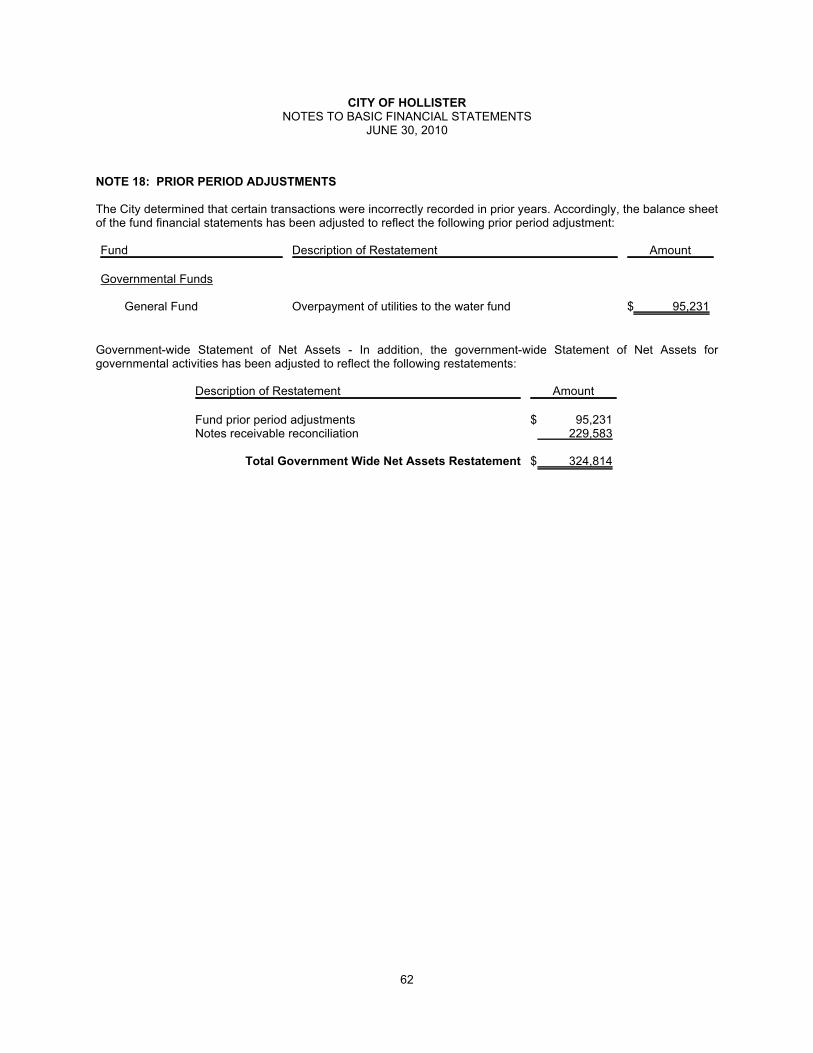
CITY OF HOLLISTERNOTES TO BASIC FINANCIAL STATEMENTS
JUNE 30, 2010
NOTE 18: PRIOR PERIOD ADJUSTMENTS
The City determined that certain transactions were incorrectly recorded in prior years. Accordingly, the balance sheetof the fund financial statements has been adjusted to reflect the following prior period adjustment:
Fund Description of Restatement Amount
Governmental Funds
General Fund Overpayment of utilities to the water fund $ 95,231
Government-wide Statement of Net Assets - In addition, the government-wide Statement of Net Assets forgovernmental activities has been adjusted to reflect the following restatements:
Description of Restatement Amount
Fund prior period adjustments $ 95,231Notes receivable reconciliation 229,583
Total Government Wide Net Assets Restatement $ 324,814
62

REQUIRED SUPPLEMENTARY INFORMATION

CITY OF HOLLISTERGENERAL FUND
SCHEDULE OF REVENUES, EXPENDITURES, AND CHANGES IN FUND BALANCEBUDGET AND ACTUAL
FOR THE YEAR ENDED JUNE 30, 2010
Budgeted Amounts
Original FinalActual
Amounts
Variance withFinal Budget
Positive(Negative)
REVENUESTaxes $ 7,394,863 $ 6,610,571 $ 6,186,129 $ (424,442)License and permits 1,180,941 1,054,740 1,033,621 (21,119)Intergovernmental 385,239 496,061 454,799 (41,262)Charges for services 1,009,211 1,036,779 1,039,936 3,157Fines and forfeitures 136,100 174,250 179,986 5,736Investment earnings 82,472 20,001 8,574 (11,427)Other 1,442,307 2,636,338 1,582,303 (1,054,035)
Total Revenues 11,631,133 12,028,740 10,485,348 (1,543,392)
EXPENDITURESGeneral Government
Non-DepartmentalServices & Supplies 71,482 71,482 102,429 (30,947)Contractual 252,247 249,747 196,713 53,034
Total Non-Departmental 323,729 321,229 299,142 22,087
City CouncilPersonnel 80,406 80,557 92,029 (11,472)Services & Supplies 102,297 142,297 186,211 (43,914)
Total City Council 182,703 222,854 278,240 (55,386)
City ClerkPersonnel 160,712 156,994 155,931 1,063Services & Supplies 12,400 14,900 16,325 (1,425)Contractual 13,300 13,300 11,209 2,091
Total City Clerk 186,412 185,194 183,465 1,729
City ManagerPersonnel 180,858 174,975 172,367 2,608Services & Supplies 6,395 20,915 19,027 1,888Contractual 81,667 81,667 41,425 40,242
Total City Manager 268,920 277,557 232,819 44,738
City AttorneyPersonnel 153,449 160,593 154,867 5,726Services & Supplies 43,875 43,875 25,236 18,639Contractual 24,976 12,276 4,374 7,902
Total City Attorney 222,300 216,744 184,477 32,267
City TreasurerPersonnel 3,000 3,000 3,868 (868)Services & Supplies 150 150 - 150
Total City Treasurer 3,150 3,150 3,868 (718)
63

CITY OF HOLLISTERGENERAL FUND
SCHEDULE OF REVENUES, EXPENDITURES, AND CHANGES IN FUND BALANCEBUDGET AND ACTUAL (continued)
FOR THE YEAR ENDED JUNE 30, 2010
Budgeted Amounts
Original FinalActual
Amounts
Variance withFinal Budget
Positive(Negative)
General Government (continued)Finance
Personnel 365,258 357,832 336,432 21,400Services & Supplies 56,850 56,850 54,148 2,702Contractual 40,900 40,900 31,198 9,702Capital 4,100 4,100 2,622 1,478
Total Finance 467,108 459,682 424,400 35,282
Information SystemsPersonnel 92,055 90,061 89,031 1,030Services & Supplies 8,755 8,755 8,395 360Contractual 7,060 7,060 5,492 1,568Capital 4,800 4,800 4,980 (180)
Total Information Systems 112,670 110,676 107,898 2,778
Human ResourcesPersonnel 143,528 140,597 142,371 (1,774)Services & Supplies 12,130 12,130 18,764 (6,634)Contractual 12,400 12,400 8,714 3,686
Total Human Resources 168,058 165,127 169,849 (4,722)
PlanningPersonnel 327,907 319,890 359,844 (39,954)Services & Supplies 51,166 94,886 38,534 56,352Contractual 1,305 1,305 1,362 (57)Capital 1,400 1,400 426 974
Total Planning 381,778 417,481 400,166 17,315
Total General Government 2,316,828 2,379,694 2,284,324 95,370
Public Safety
Animal ControlPersonnel 398,688 391,241 398,019 (6,778)Services & Supplies 92,258 92,258 84,813 7,445Contractual 19,548 19,548 73,937 (54,389)Capital 19,000 19,000 13,535 5,465
Total Animal Control 529,494 522,047 570,304 (48,257)
FirePersonnel 3,308,422 3,253,396 3,650,972 (397,576)Services & Supplies 245,902 286,140 251,108 35,032Contractual 310,805 310,805 332,347 (21,542)Capital 5,700 2,700 707 1,993
Total Fire 3,870,829 3,853,041 4,235,134 (382,093)
64
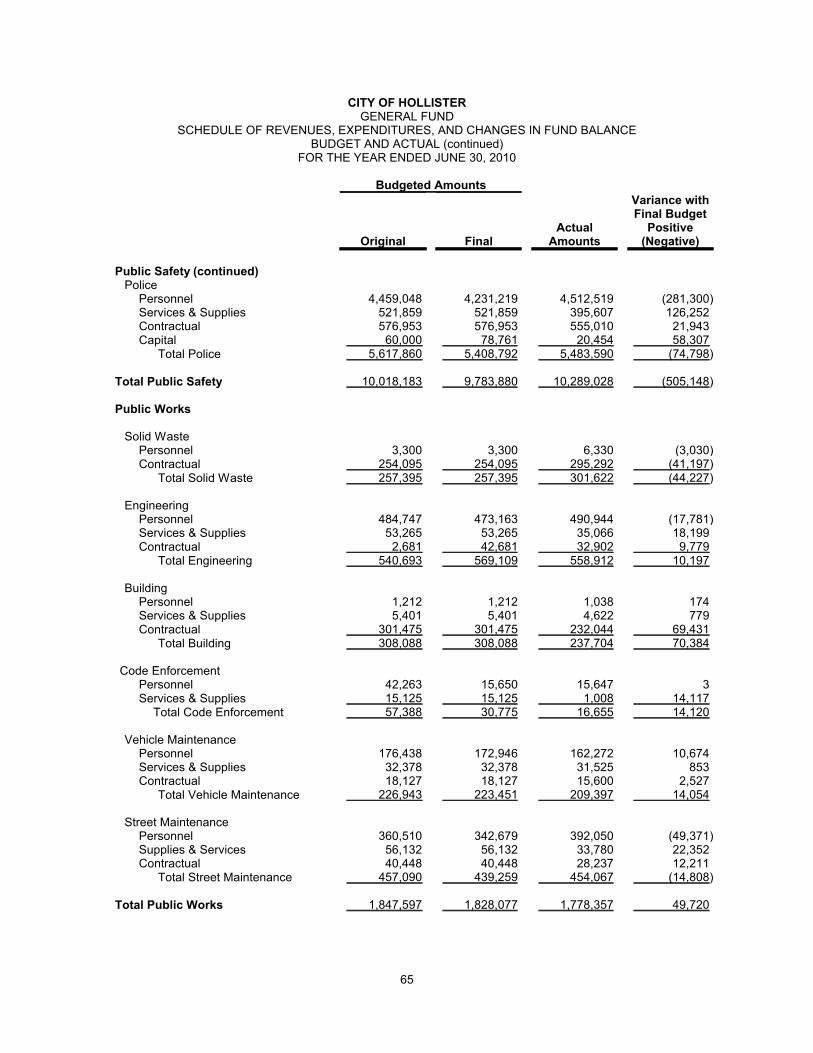
CITY OF HOLLISTERGENERAL FUND
SCHEDULE OF REVENUES, EXPENDITURES, AND CHANGES IN FUND BALANCEBUDGET AND ACTUAL (continued)
FOR THE YEAR ENDED JUNE 30, 2010
Budgeted Amounts
Original FinalActual
Amounts
Variance withFinal Budget
Positive(Negative)
Public Safety (continued)Police
Personnel 4,459,048 4,231,219 4,512,519 (281,300)Services & Supplies 521,859 521,859 395,607 126,252Contractual 576,953 576,953 555,010 21,943Capital 60,000 78,761 20,454 58,307
Total Police 5,617,860 5,408,792 5,483,590 (74,798)
Total Public Safety 10,018,183 9,783,880 10,289,028 (505,148)
Public Works
Solid WastePersonnel 3,300 3,300 6,330 (3,030)Contractual 254,095 254,095 295,292 (41,197)
Total Solid Waste 257,395 257,395 301,622 (44,227)
EngineeringPersonnel 484,747 473,163 490,944 (17,781)Services & Supplies 53,265 53,265 35,066 18,199Contractual 2,681 42,681 32,902 9,779
Total Engineering 540,693 569,109 558,912 10,197
BuildingPersonnel 1,212 1,212 1,038 174Services & Supplies 5,401 5,401 4,622 779Contractual 301,475 301,475 232,044 69,431
Total Building 308,088 308,088 237,704 70,384
Code EnforcementPersonnel 42,263 15,650 15,647 3Services & Supplies 15,125 15,125 1,008 14,117
Total Code Enforcement 57,388 30,775 16,655 14,120
Vehicle MaintenancePersonnel 176,438 172,946 162,272 10,674Services & Supplies 32,378 32,378 31,525 853Contractual 18,127 18,127 15,600 2,527
Total Vehicle Maintenance 226,943 223,451 209,397 14,054
Street MaintenancePersonnel 360,510 342,679 392,050 (49,371)Supplies & Services 56,132 56,132 33,780 22,352Contractual 40,448 40,448 28,237 12,211
Total Street Maintenance 457,090 439,259 454,067 (14,808)
Total Public Works 1,847,597 1,828,077 1,778,357 49,720
65

CITY OF HOLLISTERGENERAL FUND
SCHEDULE OF REVENUES, EXPENDITURES, AND CHANGES IN FUND BALANCEBUDGET AND ACTUAL (continued)
FOR THE YEAR ENDED JUNE 30, 2010
Budgeted Amounts
Original FinalActual
Amounts
Variance withFinal Budget
Positive(Negative)
Recreation
ParksPersonnel 379,672 219,566 269,655 (50,089)Services & Supplies 225,006 225,006 164,278 60,728Contractual 123,454 123,454 118,900 4,554Capital 150 150 90 60
Total Parks 728,282 568,176 552,923 15,253
Veteran's BuildingPersonnel 29,688 13,406 20,893 (7,487)Services & Supplies 77,574 77,574 58,045 19,529Contractual 8,800 8,800 4,683 4,117
Total Veteran's Building 116,062 99,780 83,621 16,159
RecreationPersonnel 270,115 266,891 264,139 2,752Services & Supplies 185,915 185,915 155,241 30,674Contractual 27,510 27,510 24,848 2,662Capital 6,000 6,000 - 6,000
Total Recreation 489,540 486,316 444,228 42,088
Total Recreation 1,333,884 1,154,272 1,080,772 73,500
Total Expenditures 15,516,492 15,145,923 15,432,481 (286,558)
Excess (deficiency) of revenues overexpenditures (3,885,359) (3,117,183) (4,947,133) (1,829,950)
OTHER FINANCING SOURCES (USES)Transfers in 1,650,000 3,328,634 4,719,331 1,390,697Transfers out - - (200) (200)
Total Other Financing Sources(Uses) 1,650,000 3,328,634 4,719,131 1,390,497
Net change in fund balance (2,235,359) 211,451 (228,002) (439,453)
Fund balance - July 1, 2009 2,291,631Prior Period Adjustment 95,231
Fund balance - July 1, 2009, restated 2,386,862
Fund balance - June 30, 2010 $ 2,158,860
66

CITY OF HOLLISTERMEASURE T
SCHEDULE OF REVENUES, EXPENDITURES, AND CHANGES IN FUND BALANCEBUDGET AND ACTUAL
FOR THE YEAR ENDED JUNE 30, 2010
Budgeted Amounts
Original FinalActual
Amounts
Variance withFinal Budget
Positive(Negative)
REVENUESTaxes $ 2,800,000 $ 2,849,000 $ 3,013,530 $ 164,530Investment earnings 1,633 1,633 3,497 1,864
Total Revenues 2,801,633 2,850,633 3,017,027 166,394
EXPENDITURESGeneral Government
Non-DepartmentalContractual - - 39 (39)
City ManagerPersonnel 16,822 16,471 926 15,545
FinancePersonnel 34,498 33,709 39,915 (6,206)
Total General Government 51,320 50,180 40,880 9,300
Public SafetyFire
Personnel 183,736 188,204 180,704 7,500
PolicePersonnel - 56,771 3,185 53,586
Total Public Safety 183,736 244,975 183,889 61,086
Public WorksStreet Maintenance
Personnel 63,579 21,742 41,078 (19,336)
Total Public Works 63,579 21,742 41,078 (19,336)
RecreationParks
Personnel 66,458 20,772 41,811 (21,039)Service & Supplies - - 217 (217)
Total Parks 66,458 20,772 42,028 (21,256)
Veteran's BuildingPersonnel 81,095 72,715 79,963 (7,248)
RecreationPersonnel 15,067 14,839 26,574 (11,735)
Total Recreation 162,620 108,326 148,565 (40,239)
Total Expenditures 461,255 425,223 414,412 10,811
67

CITY OF HOLLISTERMEASURE T
SCHEDULE OF REVENUES, EXPENDITURES, AND CHANGES IN FUND BALANCEBUDGET AND ACTUAL (continued)
FOR THE YEAR ENDED JUNE 30, 2010
Budgeted Amounts
Original FinalActual
Amounts
Variance withFinal Budget
Positive(Negative)
Excess (deficiency) of revenues overexpenditures 2,340,378 2,425,410 2,602,615 177,205
OTHER FINANCING SOURCES (USES)Transfers out (1,650,000) (3,328,634) (3,497,359) (168,725)
Total other financing sources (uses) (1,650,000) (3,328,634) (3,497,359) (168,725)
Net change in fund balance 690,378 (903,224) (894,744) 8,480
Fund balance - July 1, 2009 903,224
Fund balance - June 30, 2010 $ 8,480
68

CITY OF HOLLISTERRDA - HOUSING
SCHEDULE OF REVENUES, EXPENDITURES, AND CHANGES IN FUND BALANCEBUDGET AND ACTUAL
FOR THE YEAR ENDED JUNE 30, 2010
Budgeted Amounts
Original FinalActual
Amounts
Variance withFinal Budget
Positive(Negative)
REVENUESTaxes $ 2,530,843 $ 2,530,843 $ 2,017,934 $ (512,909)Investment earnings 100,000 100,000 81,907 (18,093)Other - - 47,790 47,790
Total Revenues 2,630,843 2,630,843 2,147,631 (483,212)
EXPENDITURESGeneral Government
Non-DepartmentalContractual 11,865 11,865 7,380 4,485Other 322,560 322,560 323,643 (1,083)
Total Non-Departmental 334,425 334,425 331,023 3,402
Affordable HousingPersonnel 399,546 432,811 355,700 77,111Services & Supplies 96,154 1,667,250 116,194 1,551,056Contractual 280,848 781,398 2,592,316 (1,810,918)Capital 3,695 3,695 1,099 2,596
Total Affordable Housing 780,243 2,885,154 3,065,309 (180,155)
FinanceContractual 700 700 - 700
Rental AssistanceContractual - 35,000 40,956 (5,956)
Code EnforcementServices & Supplies 15,125 15,125 5,172 9,953
Total Expenditures 1,130,493 3,270,404 3,442,460 (172,056)
Net change in fund balance 1,500,350 (639,561) (1,294,829) (655,268)
Fund balance - July 1, 2009 12,362,924
Fund balance - June 30, 2010 $ 11,068,095
69

CITY OF HOLLISTERNOTES TO REQUIRED SUPPLEMENTARY INFORMATION
FOR THE YEAR ENDED JUNE 30, 2009
Budgets are adopted on a basis consistent with accounting principles generally accepted in the United States ofAmerica. Annual appropriated budgets are adopted for all departments within the general, special revenue andcapital project funds. Formal budgets are not employed for debt service funds because debt indenture provisionsspecify payments.
During the period December through February of each fiscal year, department heads prepare estimates of requiredappropriations for the following fiscal year. These estimates are compiled into a proposed operating budget thatincludes a summary of proposed expenditures and financial resources and historical data for the preceding fiscalyear. The operating budget is presented by the City Manager to the City Council for review. Public hearings areconducted to obtain citizen comments. The City Council generally adopts the budget during one of its Junemeetings. The City Manager is legally authorized to transfer budgeted amounts between divisions and accountswithin the same department. Transfer of appropriations between departments or funds and increased appropriationsmust be authorized by the City Council. Expenditures may not legally exceed budgeted appropriations at thedepartmental level within a fund. All appropriations shall lapse at the end of the fiscal year to the extent they havenot been expended or lawfully encumbered, except for appropriations for capital projects which shall continue to theircompletion.
70
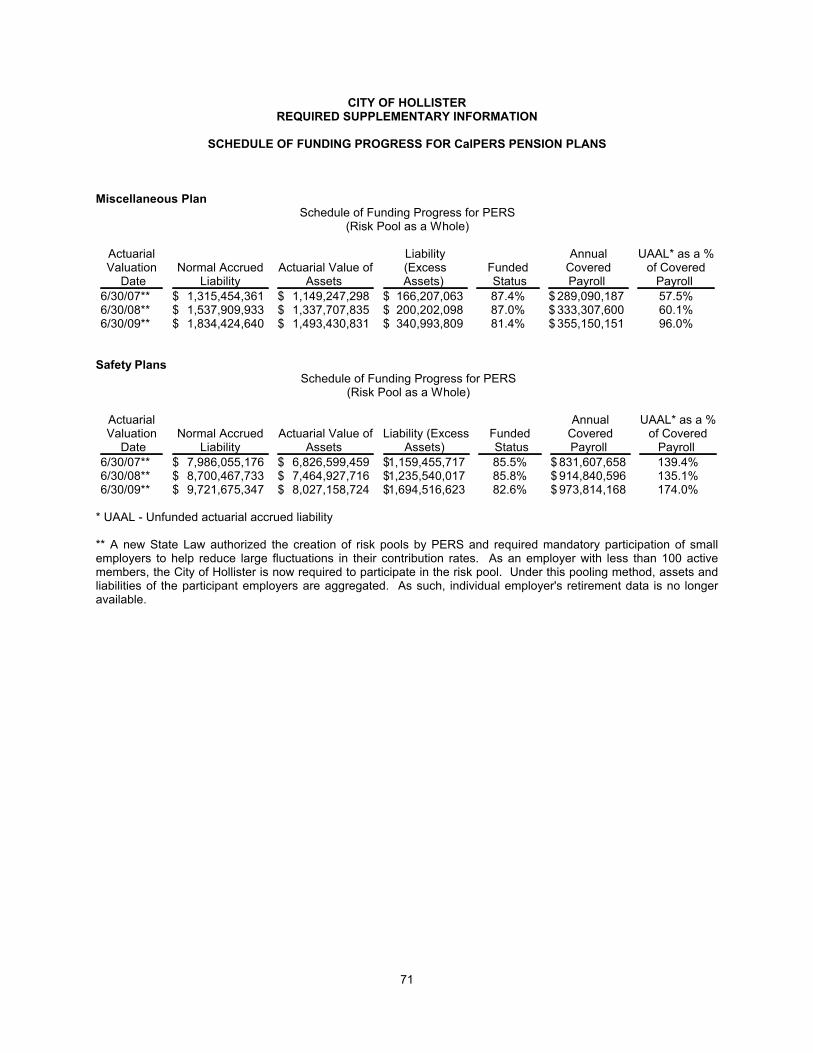
CITY OF HOLLISTERREQUIRED SUPPLEMENTARY INFORMATION
SCHEDULE OF FUNDING PROGRESS FOR CalPERS PENSION PLANS
Miscellaneous PlanSchedule of Funding Progress for PERS
(Risk Pool as a Whole)
ActuarialValuation
DateNormal Accrued
LiabilityActuarial Value of
Assets
Liability(ExcessAssets)
Funded Status
AnnualCoveredPayroll
UAAL* as a %of Covered
Payroll
6/30/07** $ 1,315,454,361 $ 1,149,247,298 $ 166,207,063 87.4% $ 289,090,187 57.5%6/30/08** $ 1,537,909,933 $ 1,337,707,835 $ 200,202,098 87.0% $ 333,307,600 60.1%6/30/09** $ 1,834,424,640 $ 1,493,430,831 $ 340,993,809 81.4% $ 355,150,151 96.0%
Safety PlansSchedule of Funding Progress for PERS
(Risk Pool as a Whole)
ActuarialValuation
DateNormal Accrued
LiabilityActuarial Value of
Assets Liability (Excess
Assets) Funded Status
AnnualCoveredPayroll
UAAL* as a %of Covered
Payroll
6/30/07** $ 7,986,055,176 $ 6,826,599,459 $1,159,455,717 85.5% $ 831,607,658 139.4%6/30/08** $ 8,700,467,733 $ 7,464,927,716 $1,235,540,017 85.8% $ 914,840,596 135.1%6/30/09** $ 9,721,675,347 $ 8,027,158,724 $1,694,516,623 82.6% $ 973,814,168 174.0%
* UAAL - Unfunded actuarial accrued liability
** A new State Law authorized the creation of risk pools by PERS and required mandatory participation of smallemployers to help reduce large fluctuations in their contribution rates. As an employer with less than 100 activemembers, the City of Hollister is now required to participate in the risk pool. Under this pooling method, assets andliabilities of the participant employers are aggregated. As such, individual employer's retirement data is no longeravailable.
71

CITY OF HOLLISTERREQUIRED SUPPLEMENTARY INFORMATION
SCHEDULE OF FUNDING PROGRESS FOR OTHER POST EMPLOYMENT BENEFITS (OPEB)
ActuarialValuation Date
NormalAccruedLiability
ActuarialValue ofAssets
Liability(ExcessAssets) Funded Status
AnnualCoveredPayroll
UAAL as a %of Covered
Payroll
6/30/09 $ 783,224 $ - $ 783,224 0% $ 8,892,778 %9
72

COMBINING FINANCIAL STATEMENTS AND OTHER SUPPLEMENTARY INFORMATION

CITY OF HOLLISTERRDA - CAPITAL PROJECTS - MAJOR CAPITAL PROJECT FUND
SCHEDULE OF REVENUES, EXPENDITURES, AND CHANGES IN FUND BALANCEBUDGET AND ACTUAL
FOR THE YEAR ENDED JUNE 30, 2010
Budgeted Amounts
Original Final Actual Amounts
Variance withFinal Budget
Positive(Negative)
REVENUESTaxes $ 4,865,715 $ 4,865,715 $ 2,517,242 $ (2,348,473)Investment earnings 42,830 43,955 45,257 1,302Other 2,258 2,258 202 (2,056)
Total Revenues 4,910,803 4,911,928 2,562,701 (2,349,227)
EXPENDITURESGeneral Government
Non-DepartmentalServices & Supplies - - 387 (387)Contractual 493,365 495,865 5,304,663 (4,808,798)Other 322,560 322,560 1,269,880 (947,320)
Total Non-Departmental 815,925 818,425 6,574,930 (5,756,505)
City CouncilPersonnel 4,329 4,329 2,640 1,689
City ClerkPersonnel 40,009 39,076 38,780 296Services & Supplies - - 208 (208)
Total City Clerk 40,009 39,076 38,988 88
City ManagerPersonnel 43,792 43,932 42,350 1,582Services & Supplies - - 2,968 (2,968)Contractual - 357 356 1
Total City Manager 43,792 44,289 45,674 (1,385)
RDA GeneralPersonnel 363,548 355,043 312,218 42,825Services & Supplies 111,765 127,765 90,844 36,921Contractual 315,000 315,000 325,939 (10,939)Capital 6,745 6,745 1,991 4,754
Total RDA General 797,058 804,553 730,992 73,561
City AttorneyPersonnel 37,759 39,668 38,216 1,452Services & Supplies - - 241 (241)Contractual 4,056 756 356 400
Total City Attorney 41,815 40,424 38,813 1,611
FinancePersonnel 41,397 40,450 44,534 (4,084)Services & Supplies 700 1,000 968 32Contractual 1,000 700 - 700
Total Finance 43,097 42,150 45,502 (3,352)
Information SystemsPersonnel 33,683 32,959 33,352 (393)Services & Supplies - - 236 (236)
Total Information Systems 33,683 32,959 33,588 (629)
Total General Government 1,819,708 1,826,205 7,511,127 (5,684,922)
73

CITY OF HOLLISTERRDA - CAPITAL PROJECTS - MAJOR CAPITAL PROJECT FUND
SCHEDULE OF REVENUES, EXPENDITURES, AND CHANGES IN FUND BALANCEBUDGET AND ACTUAL (continued)
FOR THE YEAR ENDED JUNE 30, 2010
Budgeted Amounts
Original Final Actual Amounts
Variance withFinal Budget
Positive(Negative)
Public WorksFire Station #1
Personnel - - 526 (526)Services & Supplies - 716,340 528,474 187,866Capital - - 5,000 (5,000)
Total Fire Station #1 - 716,340 534,000 182,340
Leatherback DemolitionServices & Supplies - 127,950 - 127,950Capital - 366,729 - 366,729
Total Leatherback Demolition - 494,679 - 494,679
Fremont School DemolitionServices & Supplies - - 6 (6)
West GatewayPersonnel - - 689 (689)Services & Supplies - - 35,171 (35,171)Capital - 300,000 - 300,000
Total West Gateway - 300,000 35,860 264,140
EngineeringPersonnel 41,961 40,601 14,997 25,604Services & Supplies - 1,041 192 849Contractual 2,031 2,031 12,545 (10,514)
Total Engineering 43,992 43,673 27,734 15,939
Code EnforcementPersonnel 48,979 16,598 11,686 4,912Services & Supplies - 875 875 -
Total Code Enforcement 48,979 17,473 12,561 4,912
Total Public Works 92,971 1,572,165 610,161 962,004
RecreationParks
Personnel 96,296 94,736 84,528 10,208Services & Supplies 10,870 10,870 8,964 1,906
Total Parks 107,166 105,606 93,492 12,114
Total Expenditures 2,019,845 3,503,976 8,214,780 (4,710,804)
Excess (deficiency) of revenues overexpenditures 2,890,958 1,407,952 (5,652,079) (7,060,031)
OTHER FINANCING SOURCES (USES)Proceeds from bond issuance - 6,970,380 6,970,380 -Transfers out - - (1,194,034) (1,194,034)
Total other financing sources (uses) - 6,970,380 5,776,346 (1,194,034)
Net change in fund balance $ 2,890,958 $ 8,378,332 124,267 $ (8,254,065)
Fund balance - July 1, 2009 13,926,569
Fund balance - June 30, 2010 $ 14,050,836
74
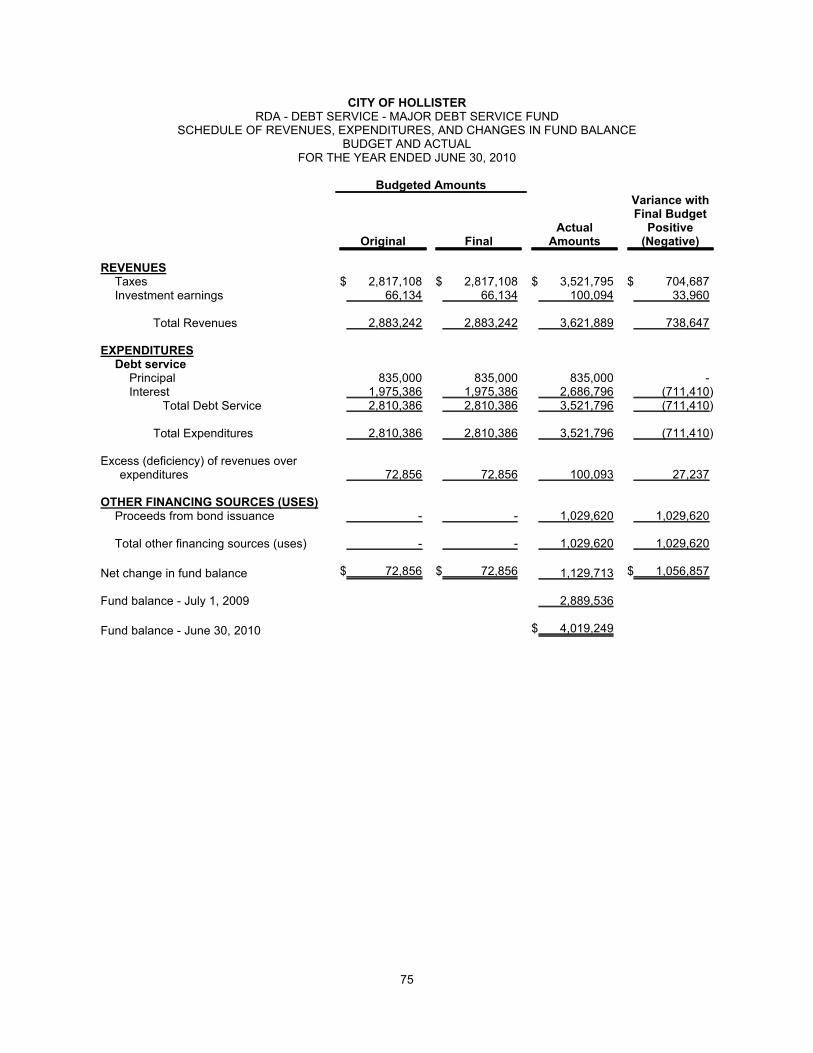
CITY OF HOLLISTERRDA - DEBT SERVICE - MAJOR DEBT SERVICE FUND
SCHEDULE OF REVENUES, EXPENDITURES, AND CHANGES IN FUND BALANCEBUDGET AND ACTUAL
FOR THE YEAR ENDED JUNE 30, 2010
Budgeted Amounts
Original FinalActual
Amounts
Variance withFinal Budget
Positive(Negative)
REVENUESTaxes $ 2,817,108 $ 2,817,108 $ 3,521,795 $ 704,687Investment earnings 66,134 66,134 100,094 33,960
Total Revenues 2,883,242 2,883,242 3,621,889 738,647
EXPENDITURESDebt service
Principal 835,000 835,000 835,000 -Interest 1,975,386 1,975,386 2,686,796 (711,410)
Total Debt Service 2,810,386 2,810,386 3,521,796 (711,410)
Total Expenditures 2,810,386 2,810,386 3,521,796 (711,410)
Excess (deficiency) of revenues overexpenditures 72,856 72,856 100,093 27,237
OTHER FINANCING SOURCES (USES)Proceeds from bond issuance - - 1,029,620 1,029,620
Total other financing sources (uses) - - 1,029,620 1,029,620
Net change in fund balance $ 72,856 $ 72,856 1,129,713 $ 1,056,857
Fund balance - July 1, 2009 2,889,536
Fund balance - June 30, 2010 $ 4,019,249
75
NON-MAJOR GOVERNMENTAL FUNDS
The following funds are reported in total in the Governmental Fund Financial Statements under the column "OtherGovernmental Funds."
SPECIAL REVENUE FUNDS
Special revenue funds are established to finance particular governmental activities and are financed by specifictaxes or other revenues. Such funds are authorized by statutory provisions to pay for certain activities of acontinuing nature. The nonmajor special revenue funds are listed below:
CDBG Low Income Housing Rehab - This fund accounts for accounts for revenues and expenditures relating tocommunity development block grant.
Federal HES CalTran - This fund accounts for revenues and expenditures relating to FED HES CalTran grant.
Gas Tax - This fund provides for planning, design, construction, maintenance, and administration of Citytransportation activities. Revenues consist primarily of the City’s share of state highway user.
Traffic Safety - This fund was established to account for the revenue allocation to the City under Streets andHighways Code Section 2182 and Revenue and Taxation Code Section 7104. Funds must be expended formaintenance or reconstruction of public streets and roads.
Park Dedication - This fund was established to provide financing for parks.
Local Transportation - This fund was established to account for the receipt and disbursement of the City's localtransportation funding provided by State funding.
San Benito Loan Program - This fund accounts for the financial resources provide by the federal government forrehabilitation loans and grants programs.
Law Enforcement Program - This fund was established to account for the receipt and disbursement of the City's lawenforcement grant funding provided by State funding.
Federal Aviation Admin Grant - This fund was established to account for the receipt and disbursement of the federalaviation funding provided by Federal funding.
Hollister Air Show - This fund was established to manage and track all expenditures and corresponding revenuesreceived from the Hollister Air Show.
CHRPO - This fund was established to account for the receipt and disbursement of the CHRPO funding.
EDA - This fund established to account for the receipt and disbursement of the EDA funding provided by Federalfunding.
Transportation Development Act - This fund was established to account for the activities of the TransportationDevelopment Act funding from the State of California.
Spay/Neuter Education - This fund was established to account for the receipt and disbursement of the City's spayand neuter grant and donation funds.
Mello Roos CFD-001 - This fund was established to account for the receipt and disbursement of the CFD-1 funding.
Youth Center - This fund was established to account for the receipt and disbursement of the Youth Center funding.
Oil Recycling Grants - This fund was established to account for the receipt and disbursement of the recycling of oil.
Police Special Law Enforcement Safety - This fund was established to account for the receipt and disbursement ofthe state funding provided by Police Special Law Enforcement Safety grant.
76
NON-MAJOR GOVERNMENTAL FUNDS
SPECIAL REVENUE FUNDS (continued)
Office of Traffic Safety - This fund was established to account for the receipt and disbursement of the City's trafficsafety funding provided by State funding.
Local Law Enforcement - This fund was established to account for the receipt and disbursement of the state fundingprovided by local law enforcement grant.
COPS More Program - This fund was established to account for the receipt and disbursement of the federal fundingprovided by the COPS More grant.
Animal Welfare - This fund was established to account for the receipt and disbursement of the local funding providedby animal welfare grant.
COPS in School Program - This fund was established to account for the receipt and disbursement of the localfunding provided by the COPS in School program.
Airport Building 25 Reimbursement - This fund was established to account for the receipt and disbursement of thereplacement of City's Airport building #25.
4th of July Rally - This fund was established to account for the receipt and disbursement of the local funding of theannual 4th of July Rally.
Information Systems - This fund was established to account for the receipt and disbursements of the costs sharing ofinformation systems between the City and County of San Benito.
JAG Grant Equipment - This fund was established to account for the JAG Program, administered by the Bureau ofJustice Assistance (BJA), to support designated program areas directly related to law enforcement.
JAG Grant Recovery Act - This fund was established to account for the JAG ARRA Program, administered by theBureau of Justice Assistance (BJA), to support designated program areas directly related to law enforcement.
Police Office of Traffic Safety - This fund was established to account for the receipt and disbursement of the Statefunding provided by the Office of Training Safety.
Traffic Congestion Relief - This fund was established to account for the receipt and disbursement of the Statefunding.
Airport Master Plan Study - This fund was established to account for the receipt and disbursement of the localfunding for a master plan surrounding the City’s airport.
RZH River Trail - This fund was established to account for the receipt and disbursement of the local funding for aSan Benito River trail.
Signal Improvement Fee on Flynn - This fund was established to account for the fees collected for the Flynn RoadSignal Improvement.
Council of Governments - This fund was established to account for the receipt and disbursement of the local fundingreceived from the Council of Governments.
San Felipe Bikeway - This fund established as depositories for grant funding for the San Felipe bikeway.
Home Program Revolving Loans - This fund was established to account for the receipt and disbursement of theCity's Federal HOME grant funds.
77

NON-MAJOR GOVERNMENTAL FUNDS
CAPITAL PROJECT FUNDS
Capital project funds are used to account for financial resources to be used for the acquisition of land or acquisitionand construction of major facilities other than those financed by the proprietary fund types. The nonmajor capitalproject funds are listed below:
Fire Impact Fees - This fund was established as depositories for fire development impact fees. The fees are leviedagainst all new development in the City in order to pay for the construction or improvement of fire facilities as a resultof City growth.
Police Impact Fees - This fund was established as depositories for police development impact fees. The fees arelevied against all new development in the City in order to pay for the construction or improvement of police facilitiesas a result of City growth.
Storm Drain Fees - This fund was established as depositories for storm drain development fees. The fees are leviedagainst development in the City in order to pay for the construction or improvement of storm drains.
Storm Drain Impact Fees - This fund was established as depositories for storm drain development impact fees. Thefees are levied against all new development in the City in order to pay for the construction or improvement of stormdrains as a result of City growth.
Traffic Impact Fees - This fund was established as depositories for traffic development impact fees. The fees arelevied against all new development in the City in order to pay for traffic construction or improvements as a result ofCity growth.
AB 1600 Santa Ana Storm Drain - This fund was established as depositories for Santa Ana storm drain developmentimpact fees. The fees are levied against all new development in the Santa Ana Road area in order to pay for theconstruction or improvement of storm drains as a result of City growth.
Jail Juvenile Hall - This fund was established as depositories for Juvenile Hall development impact fees. The feesare levied against all new development in the City in order to pay for Juvenile Hall construction or improvements as aresult of City growth.
Local Street & Road Improvement - This fund was established to account for the revenues and expenditures relatedto State and Local Road funding.
ARRA - This fund was established to account for funding from the Economic Stimulus Package. The City’s receipt offunding under this program has been designated for rehabilitation of major Collector Roadways within the City ofHollister.
78

CITY OF HOLLISTERNON-MAJOR GOVERNMENTAL FUNDS
COMBINING BALANCE SHEETSJUNE 30, 2010
SPECIAL REVENUE FUNDS
CDBG LowIncome
Housing RehabFederal HES
CalTranGas Tax
Traffic Safety Park Dedication
LocalTransportation
ASSETS
Cash and investments $ 720,650 $ 38 $ 226,144 $ 867 $ 251,483 $ -Accounts receivable - - 57,296 - - -Interest receivable 936 182 294 6 327 -Notes receivable 400,634 - - - - -Due from other funds - - 1,630 - - -
Total Assets $ 1,122,220 $ 220 $ 285,364 $ 873 $ 251,810 $ -
LIABILITIES AND FUND BALANCESLIABILITIES:
Accounts payable $ - $ - $ 34,847 $ - $ - $ -Accrued liabilities - 1 961 - - -Deposits - - - - - -Deferred revenue 400,634 - - - - -Due to other funds - 219 - - 53 -
Total Liabilities 400,634 220 35,808 - 53 -
FUND BALANCES (DEFICITS):Unreserved:
Undesignated, reported in:Special revenue funds 721,586 - 249,556 873 251,757 -Capital project funds - - - - - -
Total Fund Balance (Deficits) 721,586 - 249,556 873 251,757 -
Total Liabilities and Fund Balances (Deficits) $ 1,122,220 $ 220 $ 285,364 $ 873 $ 251,810 $ -
79

CITY OF HOLLISTERNON-MAJOR GOVERNMENTAL FUNDS
COMBINING BALANCE SHEETS (continued)JUNE 30, 2010
SPECIAL REVENUE FUNDS
San BenitoLoan Program
LawEnforcement
Program
FederalAviation Admin
GrantHollister Air
Show CHRPO EDA
ASSETS
Cash and investments $ 719,655 $ - $ 11,246 $ 21,435 $ 82,440 $ -Accounts receivable - - - - - -Interest receivable 935 - 84 28 107 -Notes receivable 77,424 - - - - -Due from other funds - - - - - -
Total Assets $ 798,014 $ - $ 11,330 $ 21,463 $ 82,547 $ -
LIABILITIES AND FUND BALANCESLIABILITIES:
Accounts payable $ - $ - $ - $ 1,019 $ - $ -Accrued liabilities - - 273 58 - -Deposits - - - - - -Deferred revenue 77,424 - - - - -Due to other funds - - 27 - - -
Total Liabilities 77,424 - 300 1,077 - -
FUND BALANCES (DEFICITS):Unreserved:
Undesignated, reported in:Special revenue funds 720,590 - 11,030 20,386 82,547 -Capital project funds - - - - - -
Total Fund Balance (Deficits) 720,590 - 11,030 20,386 82,547 -
Total Liabilities and Fund Balances (Deficits) $ 798,014 $ - $ 11,330 $ 21,463 $ 82,547 $ -
80

CITY OF HOLLISTERNON-MAJOR GOVERNMENTAL FUNDS
COMBINING BALANCE SHEETS (continued)JUNE 30, 2010
SPECIAL REVENUE FUNDS
TransportationDevelopment
Act
Spay/Neuter
EducationMello Roos
CFD-1 Youth Center Oil Recycling
Police SpecialLaw
EnforcementSafety
ASSETS
Cash and investments $ 1,276,885 $ 13,551 $ - $ 21,924 $ 26,402 $ 209,072Accounts receivable - - 48,112 - - 15,000Interest receivable 1,669 18 - 28 34 263Notes receivable - - - - - -Due from other funds - - - - - -
Total Assets $ 1,278,554 $ 13,569 $ 48,112 $ 21,952 $ 26,436 $ 224,335
LIABILITIES AND FUND BALANCESLIABILITIES:
Accounts payable $ - $ - $ - $ - $ - $ -Accrued liabilities 58 - - - - -Deposits - 1,034 - - - -Deferred revenue - - - - - -Due to other funds 214 - 52,885 - - -
Total Liabilities 272 1,034 52,885 - - -
FUND BALANCES (DEFICITS):Unreserved:
Undesignated, reported in:Special revenue funds 1,278,282 12,535 (4,773) 21,952 26,436 224,335Capital project funds - - - - - -
Total Fund Balance (Deficits) 1,278,282 12,535 (4,773) 21,952 26,436 224,335
Total Liabilities and Fund Balances (Deficits) $ 1,278,554 $ 13,569 $ 48,112 $ 21,952 $ 26,436 $ 224,335
81

CITY OF HOLLISTERNON-MAJOR GOVERNMENTAL FUNDS
COMBINING BALANCE SHEETS (continued)JUNE 30, 2010
SPECIAL REVENUE FUNDS
Office of TrafficSafety
Local LawEnforcement
COPS MoreProgram Animal Welfare
COPS inSchool
Program
AirportBuilding 25Reimburse-
ment
ASSETS
Cash and investments $ 19,178 $ - $ - $ 30,427 $ - $ 1,743,963Accounts receivable - - - - - -Interest receivable 25 - - 40 - 2,265Notes receivable - - - - - -Due from other funds - - - - - -
Total Assets $ 19,203 $ - $ - $ 30,467 $ - $ 1,746,228
LIABILITIES AND FUND BALANCESLIABILITIES:
Accounts payable $ - $ - $ - $ - $ - $ -Accrued liabilities - - - - - -Deposits - - - - - -Deferred revenue - - - - - -Due to other funds - - - - - -
Total Liabilities - - - - - -
FUND BALANCES (DEFICITS):Unreserved:
Undesignated, reported in:Special revenue funds 19,203 - - 30,467 - 1,746,228Capital project funds - - - - - -
Total Fund Balance (Deficits) 19,203 - - 30,467 - 1,746,228
Total Liabilities and Fund Balances (Deficits) $ 19,203 $ - $ - $ 30,467 $ - $ 1,746,228
82
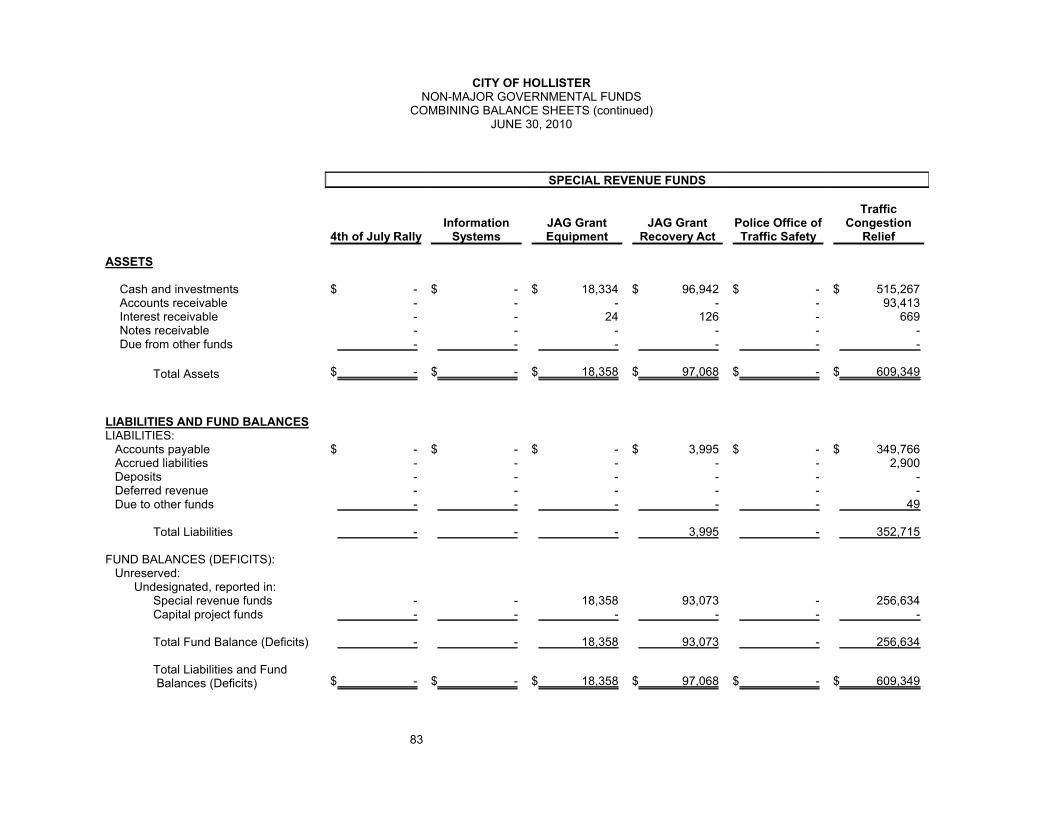
CITY OF HOLLISTERNON-MAJOR GOVERNMENTAL FUNDS
COMBINING BALANCE SHEETS (continued)JUNE 30, 2010
SPECIAL REVENUE FUNDS
4th of July RallyInformation
SystemsJAG GrantEquipment
JAG GrantRecovery Act
Police Office ofTraffic Safety
TrafficCongestion
Relief
ASSETS
Cash and investments $ - $ - $ 18,334 $ 96,942 $ - $ 515,267Accounts receivable - - - - - 93,413Interest receivable - - 24 126 - 669Notes receivable - - - - - -Due from other funds - - - - - -
Total Assets $ - $ - $ 18,358 $ 97,068 $ - $ 609,349
LIABILITIES AND FUND BALANCESLIABILITIES:
Accounts payable $ - $ - $ - $ 3,995 $ - $ 349,766Accrued liabilities - - - - - 2,900Deposits - - - - - -Deferred revenue - - - - - -Due to other funds - - - - - 49
Total Liabilities - - - 3,995 - 352,715
FUND BALANCES (DEFICITS):Unreserved:
Undesignated, reported in:Special revenue funds - - 18,358 93,073 - 256,634Capital project funds - - - - - -
Total Fund Balance (Deficits) - - 18,358 93,073 - 256,634
Total Liabilities and Fund Balances (Deficits) $ - $ - $ 18,358 $ 97,068 $ - $ 609,349
83
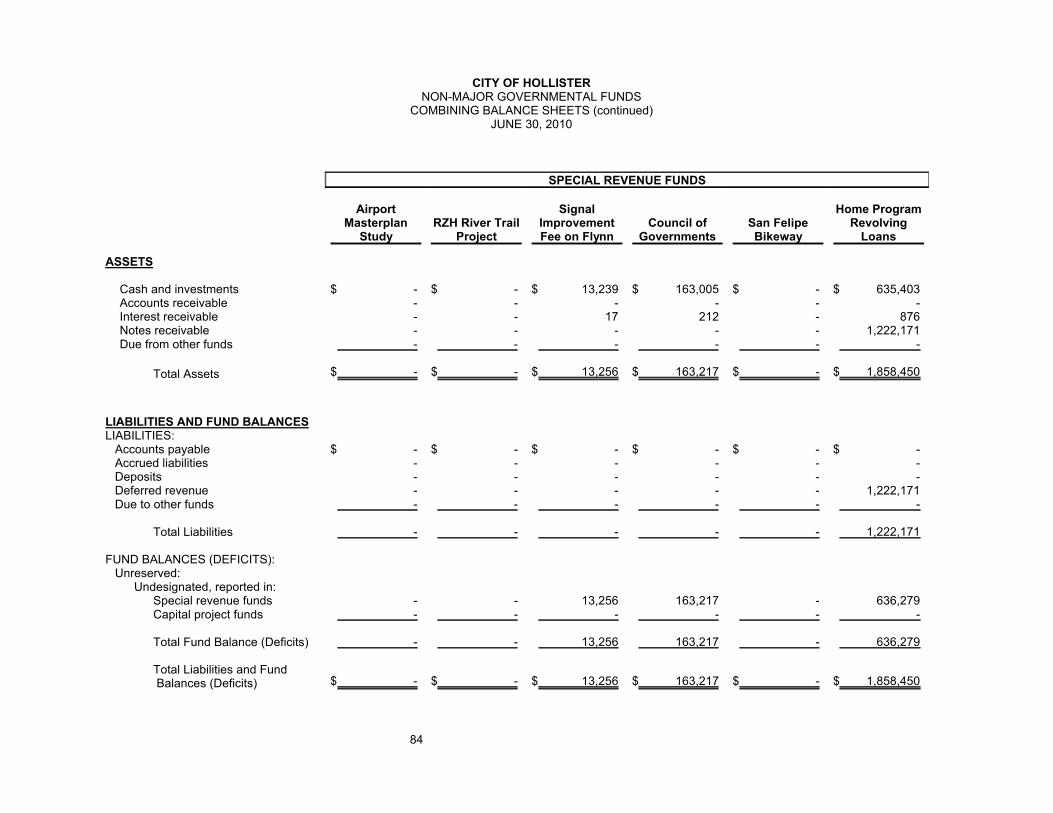
CITY OF HOLLISTERNON-MAJOR GOVERNMENTAL FUNDS
COMBINING BALANCE SHEETS (continued)JUNE 30, 2010
SPECIAL REVENUE FUNDS
AirportMasterplan
StudyRZH River Trail
Project
SignalImprovementFee on Flynn
Council ofGovernments
San FelipeBikeway
Home ProgramRevolving
Loans
ASSETS
Cash and investments $ - $ - $ 13,239 $ 163,005 $ - $ 635,403Accounts receivable - - - - - -Interest receivable - - 17 212 - 876Notes receivable - - - - - 1,222,171Due from other funds - - - - - -
Total Assets $ - $ - $ 13,256 $ 163,217 $ - $ 1,858,450
LIABILITIES AND FUND BALANCESLIABILITIES:
Accounts payable $ - $ - $ - $ - $ - $ -Accrued liabilities - - - - - -Deposits - - - - - -Deferred revenue - - - - - 1,222,171Due to other funds - - - - - -
Total Liabilities - - - - - 1,222,171
FUND BALANCES (DEFICITS):Unreserved:
Undesignated, reported in:Special revenue funds - - 13,256 163,217 - 636,279Capital project funds - - - - - -
Total Fund Balance (Deficits) - - 13,256 163,217 - 636,279
Total Liabilities and Fund Balances (Deficits) $ - $ - $ 13,256 $ 163,217 $ - $ 1,858,450
84
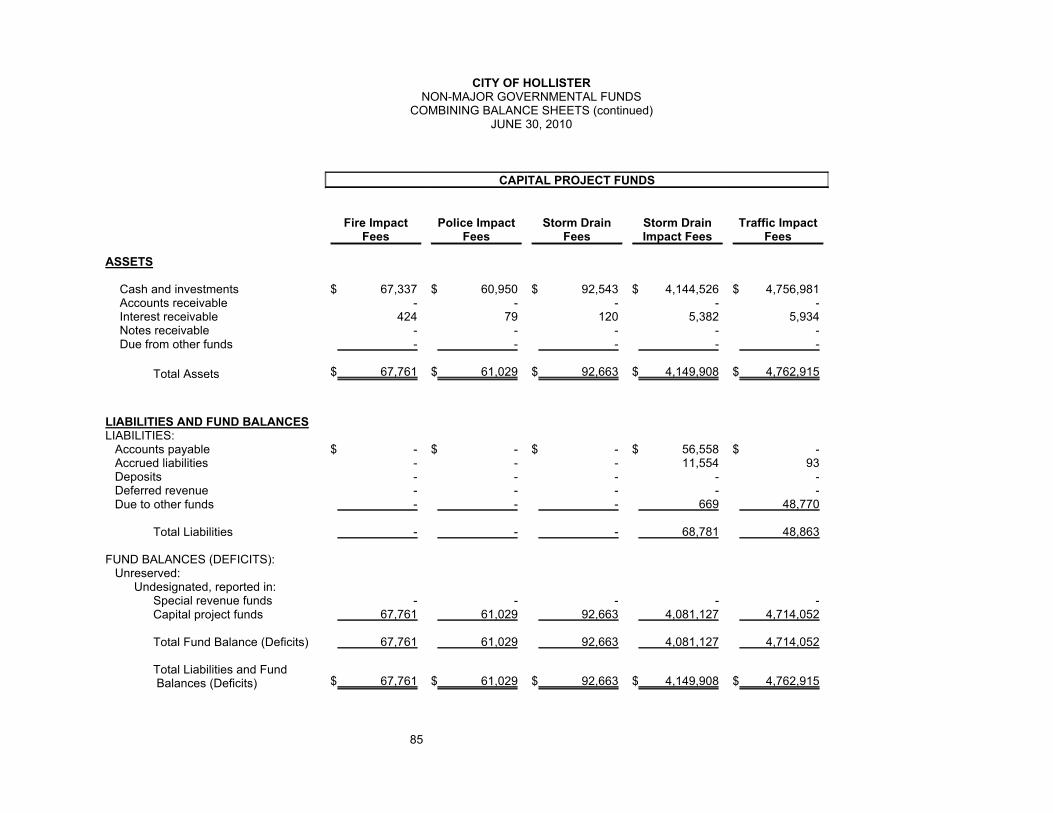
CITY OF HOLLISTERNON-MAJOR GOVERNMENTAL FUNDS
COMBINING BALANCE SHEETS (continued)JUNE 30, 2010
CAPITAL PROJECT FUNDS
Fire ImpactFees
Police ImpactFees
Storm DrainFees
Storm DrainImpact Fees
Traffic ImpactFees
ASSETS
Cash and investments $ 67,337 $ 60,950 $ 92,543 $ 4,144,526 $ 4,756,981Accounts receivable - - - - -Interest receivable 424 79 120 5,382 5,934Notes receivable - - - - -Due from other funds - - - - -
Total Assets $ 67,761 $ 61,029 $ 92,663 $ 4,149,908 $ 4,762,915
LIABILITIES AND FUND BALANCESLIABILITIES:
Accounts payable $ - $ - $ - $ 56,558 $ -Accrued liabilities - - - 11,554 93Deposits - - - - -Deferred revenue - - - - -Due to other funds - - - 669 48,770
Total Liabilities - - - 68,781 48,863
FUND BALANCES (DEFICITS):Unreserved:
Undesignated, reported in:Special revenue funds - - - - -Capital project funds 67,761 61,029 92,663 4,081,127 4,714,052
Total Fund Balance (Deficits) 67,761 61,029 92,663 4,081,127 4,714,052
Total Liabilities and Fund Balances (Deficits) $ 67,761 $ 61,029 $ 92,663 $ 4,149,908 $ 4,762,915
85
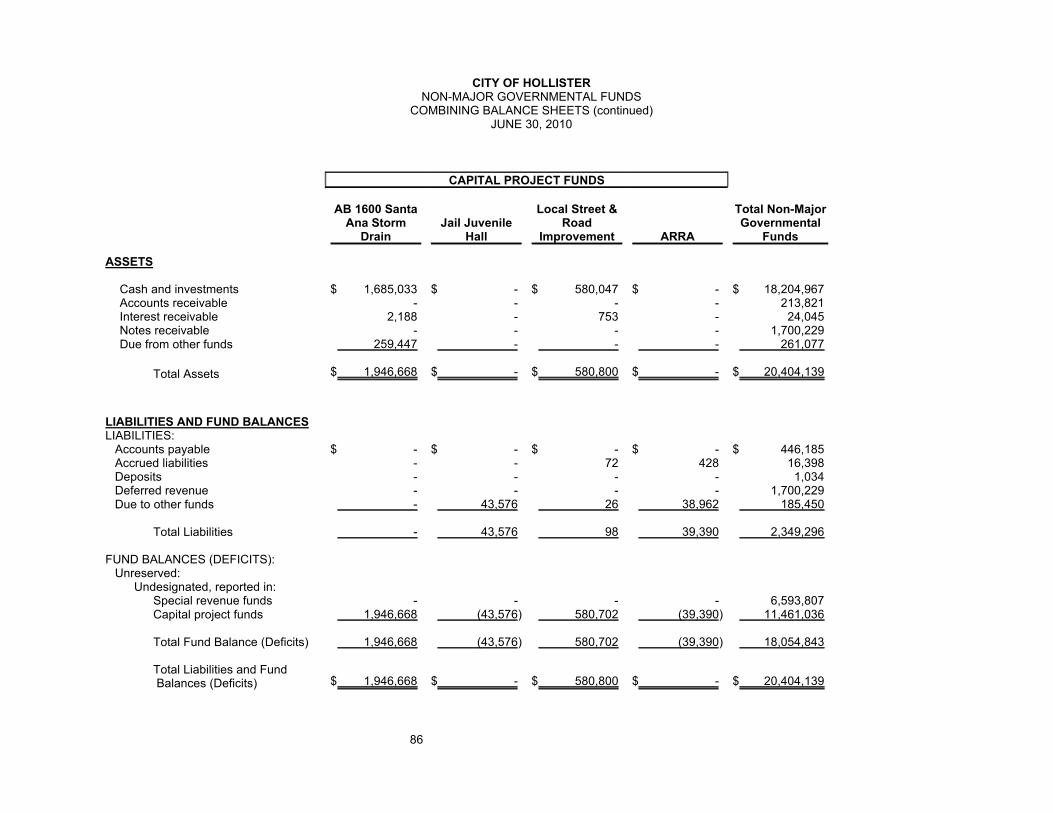
CITY OF HOLLISTERNON-MAJOR GOVERNMENTAL FUNDS
COMBINING BALANCE SHEETS (continued)JUNE 30, 2010
CAPITAL PROJECT FUNDS
AB 1600 SantaAna Storm
DrainJail Juvenile
Hall
Local Street &Road
Improvement ARRA
Total Non-MajorGovernmental
Funds
ASSETS
Cash and investments $ 1,685,033 $ - $ 580,047 $ - $ 18,204,967Accounts receivable - - - - 213,821Interest receivable 2,188 - 753 - 24,045Notes receivable - - - - 1,700,229Due from other funds 259,447 - - - 261,077
Total Assets $ 1,946,668 $ - $ 580,800 $ - $ 20,404,139
LIABILITIES AND FUND BALANCESLIABILITIES:
Accounts payable $ - $ - $ - $ - $ 446,185Accrued liabilities - - 72 428 16,398Deposits - - - - 1,034Deferred revenue - - - - 1,700,229Due to other funds - 43,576 26 38,962 185,450
Total Liabilities - 43,576 98 39,390 2,349,296
FUND BALANCES (DEFICITS):Unreserved:
Undesignated, reported in:Special revenue funds - - - - 6,593,807Capital project funds 1,946,668 (43,576) 580,702 (39,390) 11,461,036
Total Fund Balance (Deficits) 1,946,668 (43,576) 580,702 (39,390) 18,054,843
Total Liabilities and Fund Balances (Deficits) $ 1,946,668 $ - $ 580,800 $ - $ 20,404,139
86

CITY OF HOLLISTERNON-MAJOR GOVERNMENTAL FUNDS
COMBINING STATEMENTS OF REVENUES, EXPENDITURES AND CHANGES IN FUND BALANCESFOR THE YEAR ENDED JUNE 30, 2010
SPECIAL REVENUE FUNDS
CDBG LowIncome
Housing RehabFederal HES
CalTranGas Tax
Traffic Safety
ParkDedication
LocalTransportation
REVENUESTaxes $ - $ - $ 597,268 $ - $ - $ -Licenses and permits - - - - - -Intergovernmental - - - - - -Charges for service - - - - 192,484 -Fines and forfeitures - - - 5,339 - -Investment earnings 4,085 345 303 6 952 122Other - - 3,234 - - -
Total Revenues 4,085 345 600,805 5,345 193,436 122
EXPENDITURESCurrent:
General government 2,283 71,274 - - 163 35Public safety - - - - - -Public works - 304 467,919 932 55 -
Capital Outlay - - - - - -Total Expenditures 2,283 71,578 467,919 932 218 35
Excess (deficiency) of revenues overexpenditures 1,802 (71,233) 132,886 4,413 193,218 87
OTHER FINANCING SOURCES (USES)Transfers in - 89,747 - - - -Transfers out - - - - - (37,802)
Net change in fund balances 1,802 18,514 132,886 4,413 193,218 (37,715)
Fund balances (deficits) - July 1, 2009 719,784 (18,514) 116,670 (3,540) 58,539 37,715
Fund balances (deficits) - June 30, 2010 $ 721,586 $ - $ 249,556 $ 873 $ 251,757 $ -
87

CITY OF HOLLISTERNON-MAJOR GOVERNMENTAL FUNDS
COMBINING STATEMENTS OF REVENUES, EXPENDITURES AND CHANGES IN FUND BALANCES (continued)FOR THE YEAR ENDED JUNE 30, 2010
SPECIAL REVENUE FUNDS
San BenitoLoan Program
LawEnforcement
Program
FederalAviation Admin
GrantHollister Air
Show CHRPO EDA
REVENUESTaxes $ - $ - $ - $ - $ - $ -Licenses and permits - - - - - -Intergovernmental - - 192,620 - - -Charges for service - - - 18,774 - -Fines and forfeitures - - - - - -Investment earnings 6,878 801 672 46 472 1Other 24,338 695 - 1,123 - -
Total Revenues 31,216 1,496 193,292 19,943 472 1
EXPENDITURESCurrent:
General government 1,963 227 107 15 90 -Public safety - 7,497 - - - -Public works - - 13,448 14,542 - -
Capital Outlay - - 192,744 - - -Total Expenditures 1,963 7,724 206,299 14,557 90 -
Excess (deficiency) of revenues overexpenditures 29,253 (6,228) (13,007) 5,386 382 1
OTHER FINANCING SOURCES (USES)Transfers in - - - 15,000 - -Transfers out - (247,975) (329,499) - - (442)
Net change in fund balances 29,253 (254,203) (342,506) 20,386 382 (441)
Fund balances (deficits) - July 1, 2009 691,337 254,203 353,536 - 82,165 441
Fund balances (deficits) - June 30, 2010 $ 720,590 $ - $ 11,030 $ 20,386 $ 82,547 $ -
88
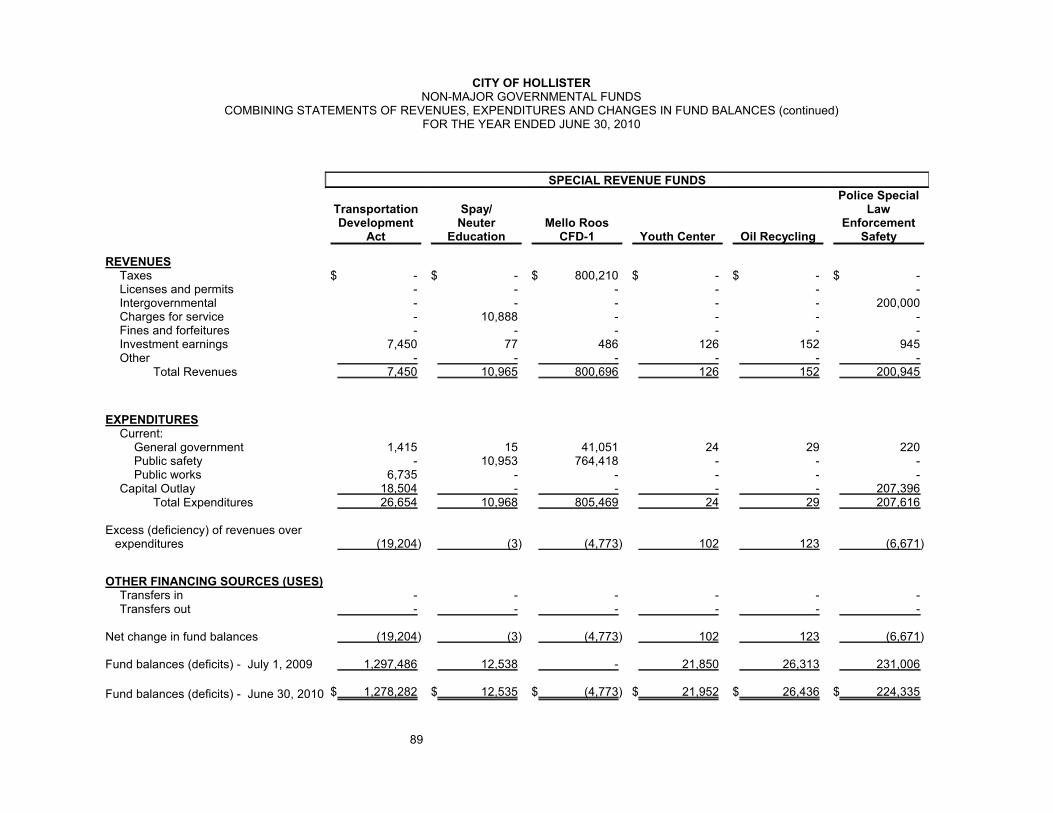
CITY OF HOLLISTERNON-MAJOR GOVERNMENTAL FUNDS
COMBINING STATEMENTS OF REVENUES, EXPENDITURES AND CHANGES IN FUND BALANCES (continued)FOR THE YEAR ENDED JUNE 30, 2010
SPECIAL REVENUE FUNDS
TransportationDevelopment
Act
Spay/Neuter
EducationMello Roos
CFD-1 Youth Center Oil Recycling
Police SpecialLaw
EnforcementSafety
REVENUESTaxes $ - $ - $ 800,210 $ - $ - $ -Licenses and permits - - - - - -Intergovernmental - - - - - 200,000Charges for service - 10,888 - - - -Fines and forfeitures - - - - - -Investment earnings 7,450 77 486 126 152 945Other - - - - - -
Total Revenues 7,450 10,965 800,696 126 152 200,945
EXPENDITURESCurrent:
General government 1,415 15 41,051 24 29 220Public safety - 10,953 764,418 - - -Public works 6,735 - - - - -
Capital Outlay 18,504 - - - - 207,396Total Expenditures 26,654 10,968 805,469 24 29 207,616
Excess (deficiency) of revenues overexpenditures (19,204) (3) (4,773) 102 123 (6,671)
OTHER FINANCING SOURCES (USES)Transfers in - - - - - -Transfers out - - - - - -
Net change in fund balances (19,204) (3) (4,773) 102 123 (6,671)
Fund balances (deficits) - July 1, 2009 1,297,486 12,538 - 21,850 26,313 231,006
Fund balances (deficits) - June 30, 2010 $ 1,278,282 $ 12,535 $ (4,773) $ 21,952 $ 26,436 $ 224,335
89

CITY OF HOLLISTERNON-MAJOR GOVERNMENTAL FUNDS
COMBINING STATEMENTS OF REVENUES, EXPENDITURES AND CHANGES IN FUND BALANCES (continued)FOR THE YEAR ENDED JUNE 30, 2010
SPECIAL REVENUE FUNDS
Office of TrafficSafety
Local LawEnforcement
COPS MoreProgram Animal Welfare
COPS inSchool
Program
AirportBuilding 25Reimburse-
ment
REVENUESTaxes $ - $ - $ - $ - $ - $ -Licenses and permits - - - - - -Intergovernmental 10,825 - - - - -Charges for service - - - - - -Fines and forfeitures - - - - - -Investment earnings 97 - - 185 - 9,987Other - - - 1,853 - -
Total Revenues 10,922 - - 2,038 - 9,987
EXPENDITURESCurrent:
General government 21 - - 33 - 13,680Public safety 4,691 - - 4,833 - -Public works - - - - - -
Capital Outlay - - - - - -Total Expenditures 4,712 - - 4,866 - 13,680
Excess (deficiency) of revenues overexpenditures 6,210 - - (2,828) - (3,693)
OTHER FINANCING SOURCES (USES)Transfers in - 40,400 - - - -Transfers out - - (38) - (51) (60,088)
Net change in fund balances 6,210 40,400 (38) (2,828) (51) (63,781)
Fund balances (deficits) - July 1, 2009 12,993 (40,400) 38 33,295 51 1,810,009
Fund balances (deficits) - June 30, 2010 $ 19,203 $ - $ - $ 30,467 $ - $ 1,746,228
90

CITY OF HOLLISTERNON-MAJOR GOVERNMENTAL FUNDS
COMBINING STATEMENTS OF REVENUES, EXPENDITURES AND CHANGES IN FUND BALANCES (continued)FOR THE YEAR ENDED JUNE 30, 2010
SPECIAL REVENUE FUNDS
4th of July RallyInformation
SystemsJAG GrantEquipment
JAG GrantRecovery Act
Police Office ofTraffic Safety
TrafficCongestion
Relief
REVENUESTaxes $ - $ - $ - $ - $ - $ -Licenses and permits - - - - - -Intergovernmental - - 18,314 96,834 - 335,701Charges for service - - - - - -Fines and forfeitures - - - - - -Investment earnings 849 - 46 242 - 2,083Other 843 - - - - -
Total Revenues 1,692 - 18,360 97,076 - 337,784
EXPENDITURESCurrent:
General government 1,809 1 2 8 - 428Public safety 2,778 - - 3,995 - -Public works - - - - - 20,698
Capital Outlay - - - - - 378,763Total Expenditures 4,587 1 2 4,003 - 399,889
Excess (deficiency) of revenues overexpenditures (2,895) (1) 18,358 93,073 - (62,105)
OTHER FINANCING SOURCES (USES)Transfers in 187,748 15,822 - - 6,417 -Transfers out - - - - - -
Net change in fund balances 184,853 15,821 18,358 93,073 6,417 (62,105)
Fund balances (deficits) - July 1, 2009 (184,853) (15,821) - - (6,417) 318,739
Fund balances (deficits) - June 30, 2010 $ - $ - $ 18,358 $ 93,073 $ - $ 256,634
91

CITY OF HOLLISTERNON-MAJOR GOVERNMENTAL FUNDS
COMBINING STATEMENTS OF REVENUES, EXPENDITURES AND CHANGES IN FUND BALANCES (continued)FOR THE YEAR ENDED JUNE 30, 2010
SPECIAL REVENUE FUNDS
AirportMasterplan
StudyRZH River Trail
Project
SignalImprovementFee on Flynn
Council ofGovernments
San FelipeBikeway
Home ProgramRevolving
Loans
REVENUESTaxes $ - $ - $ - $ - $ - $ -Licenses and permits - - - - - -Intergovernmental - - - - - -Charges for service - - - - - -Fines and forfeitures - - - - - -Investment earnings - - 75 934 - 8,036Other - - - - - 6,148
Total Revenues - - 75 934 - 14,184
EXPENDITURESCurrent:
General government - - 14 177 - -Public safety - - - - - -Public works - - - - - -
Capital Outlay - - - - - -Total Expenditures - - 14 177 - -
Excess (deficiency) of revenues overexpenditures - - 61 757 - 14,184
OTHER FINANCING SOURCES (USES)Transfers in - 7,622 - - 21,931 -Transfers out (414) - - - - -
Net change in fund balances (414) 7,622 61 757 21,931 14,184
Fund balances (deficits) - July 1, 2009 414 (7,622) 13,195 162,460 (21,931) 622,095
Fund balances (deficits) - June 30, 2010 $ - $ - $ 13,256 $ 163,217 $ - $ 636,279
92

CITY OF HOLLISTERNON-MAJOR GOVERNMENTAL FUNDS
COMBINING STATEMENTS OF REVENUES, EXPENDITURES AND CHANGES IN FUND BALANCES (continued)FOR THE YEAR ENDED JUNE 30, 2010
CAPITAL PROJECT FUNDS
Fire ImpactFees
Police ImpactFees
Storm DrainFees
Storm DrainImpact Fees
Traffic ImpactFees
REVENUESTaxes $ - $ - $ - $ - $ -Licenses and permits 33,190 - - - 1,044,210Intergovernmental - - - - -Charges for service - 24,420 21,920 125,290 -Fines and forfeitures - - - - -Investment earnings 1,771 274 522 24,324 22,689Other - - - - -
Total Revenues 34,961 24,694 22,442 149,614 1,066,899
EXPENDITURESCurrent:
General government 335 51 100 4,569 4,227Public safety - - - - -Public works - - - 129,925 5,237
Capital Outlay - - - 283,496 1,253Total Expenditures 335 51 100 417,990 10,717
Excess (deficiency) of revenues overexpenditures 34,626 24,643 22,342 (268,376) 1,056,182
OTHER FINANCING SOURCES (USES)Transfers in - - - - -Transfers out - - - - (89,747)
Net change in fund balances 34,626 24,643 22,342 (268,376) 966,435
Fund balances (deficits) - July 1, 2009 33,135 36,386 70,321 4,349,503 3,747,617
Fund balances (deficits) - June 30, 2010 $ 67,761 $ 61,029 $ 92,663 $ 4,081,127 $ 4,714,052
93

CITY OF HOLLISTERNON-MAJOR GOVERNMENTAL FUNDS
COMBINING STATEMENTS OF REVENUES, EXPENDITURES AND CHANGES IN FUND BALANCES (continued)FOR THE YEAR ENDED JUNE 30, 2010
CAPITAL PROJECT FUNDS
AB 1600 SantaAna Storm
DrainJail Juvenile
Hall
Local Street &Road
Improvement ARRA
Total Non-majorGovernmental
Funds
REVENUESTaxes $ - $ - $ - $ - $ 1,397,478Licenses and permits - 24,956 - - 1,102,356Intergovernmental - - - - 854,294Charges for service - - - - 393,776Fines and forfeitures - - - - 5,339Investment earnings 9,648 - 3,397 42 109,120Other - - - - 38,234
Total Revenues 9,648 24,956 3,397 42 3,900,597
EXPENDITURESCurrent:
General government 1,830 - 646 9 146,851Public safety - - - - 799,165Public works - - 4,944 39,423 704,162
Capital Outlay - - 14,155 - 1,096,311Total Expenditures 1,830 - 19,745 39,432 2,746,489
Excess (deficiency) of revenues overexpenditures 7,818 24,956 (16,348) (39,390) 1,154,108
OTHER FINANCING SOURCES (USES)Transfers in - - - - 384,687Transfers out - - - - (766,056)
Net change in fund balances 7,818 24,956 (16,348) (39,390) 772,739
Fund balances (deficits) - July 1, 2009 1,938,850 (68,532) 597,050 - 17,282,104
Fund balances (deficits) - June 30, 2010 $ 1,946,668 $ (43,576) $ 580,702 $ (39,390) $ 18,054,843
94

CITY OF HOLLISTERCDBG LOW INCOME HOUSING REHAB - SPECIAL REVENUE FUND
SCHEDULE OF REVENUES, EXPENDITURES, AND CHANGES IN FUND BALANCEBUDGET AND ACTUAL
FOR THE YEAR ENDED JUNE 30, 2010
Budgeted Amounts
Original FinalActual
Amounts
Variance withFinal Budget
Positive(Negative)
REVENUESInvestment earnings $ 3,720 $ 3,720 $ 4,085 $ 365
Total Revenues 3,720 3,720 4,085 365
EXPENDITURESGeneral Government
Non-DepartmentalContractual - 1,500 2,283 (783)
Total Expenditures - 1,500 2,283 (783)
Net change in fund balance $ 3,720 $ 2,220 1,802 $ (418)
Fund balance - July 1, 2009 719,784
Fund balance - June 30, 2010 $ 721,586
95

CITY OF HOLLISTERFEDERAL HES CALTRAN - SPECIAL REVENUE FUND
SCHEDULE OF REVENUES, EXPENDITURES, AND CHANGES IN FUND BALANCEBUDGET AND ACTUAL
FOR THE YEAR ENDED JUNE 30, 2010
Budgeted Amounts
Original* Final*Actual
Amounts
Variance withFinal Budget
Positive(Negative)
REVENUESInvestment earnings $ - $ - $ 345 $ 345
Total Revenues - - 345 345
EXPENDITURESGeneral Government
Non-DepartmentalServices & Supplies - - 71,234 (71,234)Contractual - - 40 (40)
Total Non-Departmental - - 71,274 (71,274)
Public WorksSan Felipe
Personnel - - 304 (304)
Total Expenditures - - 71,578 (71,578)
Excess (deficiency) of revenues overexpenditures - - (71,233) (71,233)
OTHER FINANCING SOURCES (USES)Transfers in - - 89,747 89,747
Total other financing sources (uses) - - 89,747 89,747
Net change in fund balance $ - $ - 18,514 $ 18,514
Fund balance (deficit) - July 1, 2009 (18,514)
Fund balance - June 30, 2010 $ -
The City did not adopt a budget for the Federal HES Caltran fund for the year ended June 30, 2010.
96

CITY OF HOLLISTERGAS TAX - SPECIAL REVENUE FUND
SCHEDULE OF REVENUES, EXPENDITURES, AND CHANGES IN FUND BALANCEBUDGET AND ACTUAL
FOR THE YEAR ENDED JUNE 30, 2010
Budgeted Amounts
Original FinalActual
Amounts
Variance withFinal Budget
Positive(Negative)
REVENUESTaxes $ 653,372 $ 653,372 $ 597,268 $ (56,104)Investment earnings 631 631 303 (328)Other - - 3,234 3,234
Total Revenues 654,003 654,003 600,805 (53,198)
EXPENDITURESPublic Works
Street MaintenancePersonnel 113,622 112,666 71,822 40,844Services & Supplies 440,464 440,464 322,221 118,243Contractual 105,263 105,263 72,976 32,287Contractual 900 900 900 -
Total Street Maintenance 660,249 659,293 467,919 191,374
Total Expenditures 660,249 659,293 467,919 191,374
Net change in fund balance $ (6,246) $ (5,290) 132,886 $ 138,176
Fund balance - July 1, 2009 116,670
Fund balance - June 30, 2010 $ 249,556
97

CITY OF HOLLISTERTRAFFIC SAFETY - SPECIAL REVENUE FUND
SCHEDULE OF REVENUES, EXPENDITURES, AND CHANGES IN FUND BALANCEBUDGET AND ACTUAL
FOR THE YEAR ENDED JUNE 30, 2010
Budgeted Amounts
Original FinalActual
Amounts
Variance withFinal Budget
Positive(Negative)
REVENUESFines and forfeitures $ - $ - $ 5,339 $ 5,339Investment earnings 1 1 6 5
Total Revenues 1 1 5,345 5,344
EXPENDITURESPublic Works
EngineeringPersonnel - - 932 (932)Services & Supplies 641 641 - 641
Total Street Maintenance 641 641 932 (291)
Total Expenditures 641 641 932 (291)
Net change in fund balance $ (640) $ (640) 4,413 $ 5,053
Fund balance(deficit) - July 1, 2009 (3,540)
Fund balance - June 30, 2010 $ 873
98
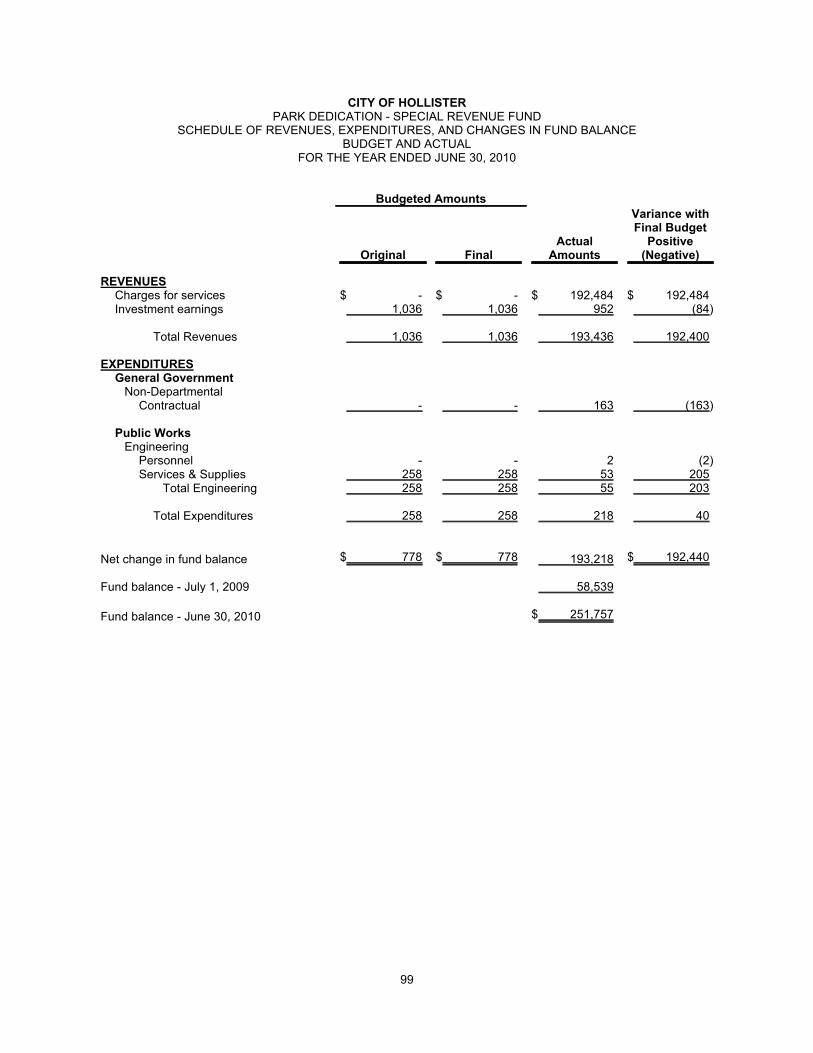
CITY OF HOLLISTERPARK DEDICATION - SPECIAL REVENUE FUND
SCHEDULE OF REVENUES, EXPENDITURES, AND CHANGES IN FUND BALANCEBUDGET AND ACTUAL
FOR THE YEAR ENDED JUNE 30, 2010
Budgeted Amounts
Original FinalActual
Amounts
Variance withFinal Budget
Positive(Negative)
REVENUESCharges for services $ - $ - $ 192,484 $ 192,484Investment earnings 1,036 1,036 952 (84)
Total Revenues 1,036 1,036 193,436 192,400
EXPENDITURESGeneral Government
Non-DepartmentalContractual - - 163 (163)
Public WorksEngineering
Personnel - - 2 (2)Services & Supplies 258 258 53 205
Total Engineering 258 258 55 203
Total Expenditures 258 258 218 40
Net change in fund balance $ 778 $ 778 193,218 $ 192,440
Fund balance - July 1, 2009 58,539
Fund balance - June 30, 2010 $ 251,757
99

CITY OF HOLLISTERLOCAL TRANSPORTATION - SPECIAL REVENUE FUND
SCHEDULE OF REVENUES, EXPENDITURES, AND CHANGES IN FUND BALANCEBUDGET AND ACTUAL
FOR THE YEAR ENDED JUNE 30, 2010
Budgeted Amounts
Original FinalActual
Amounts
Variance withFinal Budget
Positive(Negative)
REVENUESInvestment earnings $ 186 $ 186 $ 122 $ (64)
Total Revenues 186 186 122 (64)
EXPENDITURESGeneral Government
Non-DepartmentalContractual - - 35 (35)
Total Expenditures - - 35 (35)
Excess (deficiency) of revenues overexpenditures 186 186 87 (99)
OTHER FINANCING SOURCES (USES)Transfers out - - (37,802) (37,802)
Total other financing sources (uses) - - (37,802) (37,802)
Net change in fund balance $ 186 $ 186 (37,715) $ (37,901)
Fund balance - July 1, 2009 37,715
Fund balance - June 30, 2010 $ -
100
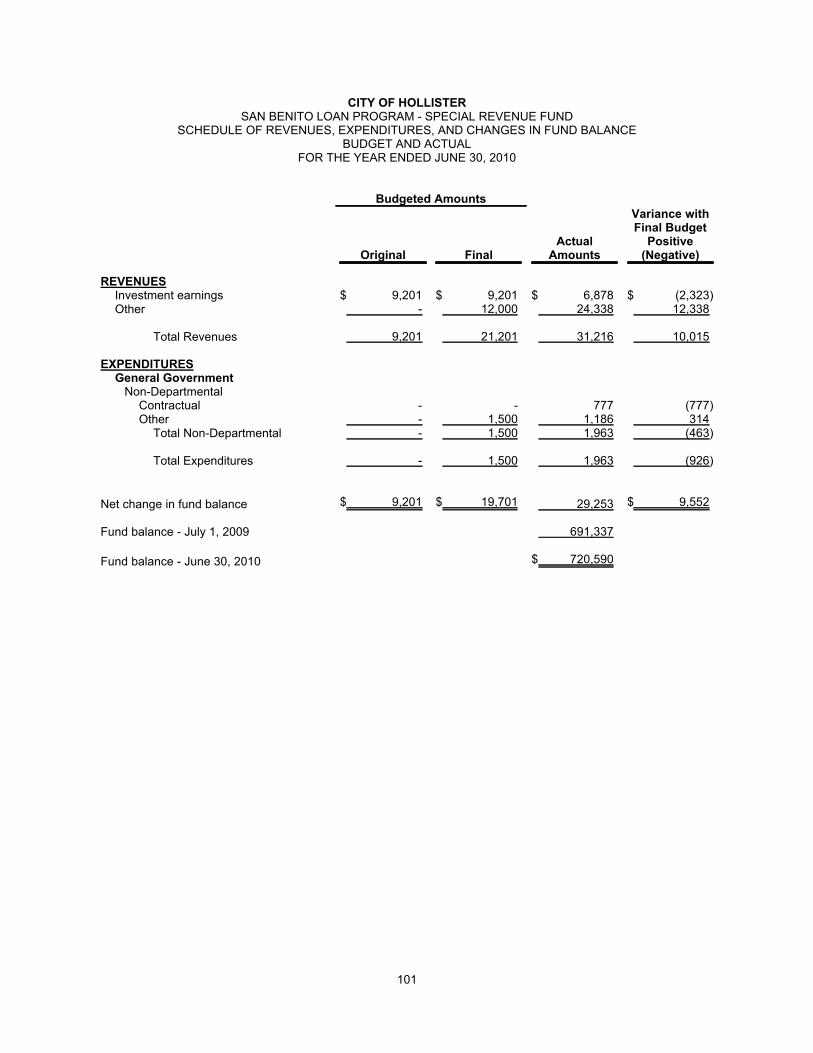
CITY OF HOLLISTERSAN BENITO LOAN PROGRAM - SPECIAL REVENUE FUND
SCHEDULE OF REVENUES, EXPENDITURES, AND CHANGES IN FUND BALANCEBUDGET AND ACTUAL
FOR THE YEAR ENDED JUNE 30, 2010
Budgeted Amounts
Original FinalActual
Amounts
Variance withFinal Budget
Positive(Negative)
REVENUESInvestment earnings $ 9,201 $ 9,201 $ 6,878 $ (2,323)Other - 12,000 24,338 12,338
Total Revenues 9,201 21,201 31,216 10,015
EXPENDITURESGeneral Government
Non-DepartmentalContractual - - 777 (777)Other - 1,500 1,186 314
Total Non-Departmental - 1,500 1,963 (463)
Total Expenditures - 1,500 1,963 (926)
Net change in fund balance $ 9,201 $ 19,701 29,253 $ 9,552
Fund balance - July 1, 2009 691,337
Fund balance - June 30, 2010 $ 720,590
101

CITY OF HOLLISTERLAW ENFORCEMENT PROGRAM - SPECIAL REVENUE FUND
SCHEDULE OF REVENUES, EXPENDITURES, AND CHANGES IN FUND BALANCEBUDGET AND ACTUAL
FOR THE YEAR ENDED JUNE 30, 2010
Budgeted Amounts
Original FinalActual
Amounts
Variance withFinal Budget
Positive(Negative)
REVENUESInvestment earnings $ 1,157 $ 1,157 $ 801 $ (356)Other 414 414 695 281
Total Revenues 1,571 1,571 1,496 (75)
EXPENDITURESGeneral Government
Non-DepartmentalContractual - - 227 (227)
Total Non-Departmental - - 227 (227)
Public SafetyPolice
Capital - 19,197 7,497 11,700
Total Expenditures - 19,197 7,724 11,473
Excess (deficiency) of revenues overexpenditures 1,571 (17,626) (6,228) 11,398
OTHER FINANCING SOURCES (USES)Transfers out - - (247,975) (247,975)
Total other financing sources (uses) - - (247,975) (247,975)
Net change in fund balance $ 1,571 $ (17,626) (254,203) $ (236,577)
Fund balance - July 1, 2009 254,203
Fund balance - June 30, 2010 $ -
102
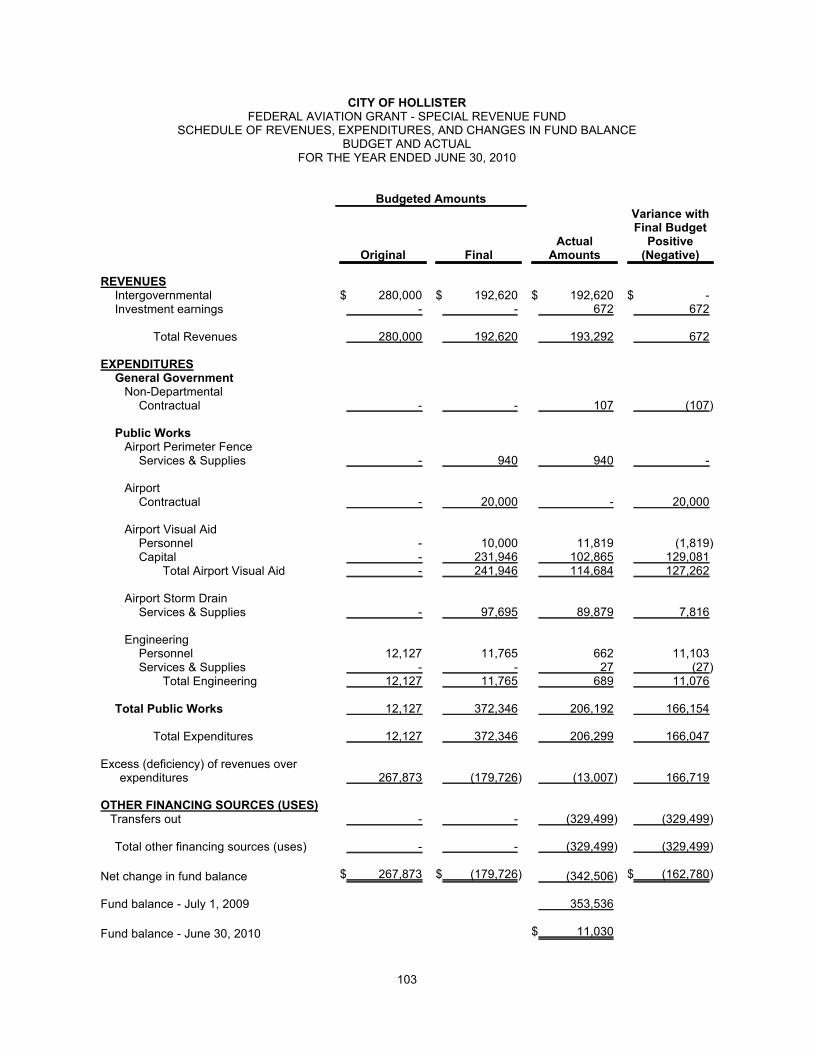
CITY OF HOLLISTERFEDERAL AVIATION GRANT - SPECIAL REVENUE FUND
SCHEDULE OF REVENUES, EXPENDITURES, AND CHANGES IN FUND BALANCEBUDGET AND ACTUAL
FOR THE YEAR ENDED JUNE 30, 2010
Budgeted Amounts
Original FinalActual
Amounts
Variance withFinal Budget
Positive(Negative)
REVENUESIntergovernmental $ 280,000 $ 192,620 $ 192,620 $ -Investment earnings - - 672 672
Total Revenues 280,000 192,620 193,292 672
EXPENDITURESGeneral Government
Non-DepartmentalContractual - - 107 (107)
Public WorksAirport Perimeter Fence
Services & Supplies - 940 940 -
AirportContractual - 20,000 - 20,000
Airport Visual AidPersonnel - 10,000 11,819 (1,819)Capital - 231,946 102,865 129,081
Total Airport Visual Aid - 241,946 114,684 127,262
Airport Storm DrainServices & Supplies - 97,695 89,879 7,816
EngineeringPersonnel 12,127 11,765 662 11,103Services & Supplies - - 27 (27)
Total Engineering 12,127 11,765 689 11,076
Total Public Works 12,127 372,346 206,192 166,154
Total Expenditures 12,127 372,346 206,299 166,047
Excess (deficiency) of revenues overexpenditures 267,873 (179,726) (13,007) 166,719
OTHER FINANCING SOURCES (USES)Transfers out - - (329,499) (329,499)
Total other financing sources (uses) - - (329,499) (329,499)
Net change in fund balance $ 267,873 $ (179,726) (342,506) $ (162,780)
Fund balance - July 1, 2009 353,536
Fund balance - June 30, 2010 $ 11,030
103

CITY OF HOLLISTERHOLLISTER AIR SHOW - SPECIAL REVENUE FUND
SCHEDULE OF REVENUES, EXPENDITURES, AND CHANGES IN FUND BALANCEBUDGET AND ACTUAL
FOR THE YEAR ENDED JUNE 30, 2010
Budgeted Amounts
Original FinalActual
Amounts
Variance withFinal Budget
Positive(Negative)
REVENUESCharges for services - - 18,774 18,774Investment earnings - - 46 46Other - - 1,123 1,123
Total Revenues - - 19,943 19,943
EXPENDITURESGeneral Government
Non-DepartmentalContractual - - 15 (15)
Public WorksAirport
Personnel - - 1,500 (1,500)Supplies & Services - 15,000 13,042 1,958
Total Airport - 15,000 14,542 458
Total Expenditures - 15,000 14,557 443
Excess (deficiency) of revenues overexpenditures - (15,000) 5,386 20,386
OTHER FINANCING SOURCES (USES)Transfers in - 15,000 15,000 -
Total other financing sources (uses) - 15,000 15,000 -
Net change in fund balance $ - $ - 20,386 $ 20,386
Fund balance - July 1, 2009 -
Fund balance - June 30, 2010 $ 20,386
104

CITY OF HOLLISTERCHRPO - SPECIAL REVENUE FUND
SCHEDULE OF REVENUES, EXPENDITURES, AND CHANGES IN FUND BALANCEBUDGET AND ACTUAL
FOR THE YEAR ENDED JUNE 30, 2010
Budgeted Amounts
Original FinalActual
Amounts
Variance withFinal Budget
Positive(Negative)
REVENUESInvestment earnings $ 405 $ 405 $ 472 $ 67
Total Revenues 405 405 472 67
EXPENDITURESGeneral Government
Non-DepartmentalContractual - - 90 (90)
Total Expenditures - - 90 -
Net change in fund balance $ 405 $ 405 382 $ (23)
Fund balance - July 1, 2009 82,165
Fund balance - June 30, 2010 $ 82,547
105

CITY OF HOLLISTEREDA - SPECIAL REVENUE FUND
SCHEDULE OF REVENUES, EXPENDITURES, AND CHANGES IN FUND BALANCEBUDGET AND ACTUAL
FOR THE YEAR ENDED JUNE 30, 2010
Budgeted Amounts
Original FinalActual
Amounts
Variance withFinal Budget
Positive(Negative)
REVENUESInvestment earnings $ 2 $ 2 $ 1 $ (1)
Total Revenues 2 2 1 (1)
EXPENDITURES
Total Expenditures - - - -
Excess (deficiency) of revenues overexpenditures 2 2 1 (1)
OTHER FINANCING SOURCES (USES)Transfers out - - (442) (442)
Total other financing sources (uses) - - (442) (442)
Net change in fund balance $ 2 $ 2 (441) $ (443)
Fund balance - July 1, 2009 441
Fund balance - June 30, 2010 $ -
106

CITY OF HOLLISTERTRANSPORTATION DEVELOPMENT ACT - SPECIAL REVENUE FUND
SCHEDULE OF REVENUES, EXPENDITURES, AND CHANGES IN FUND BALANCEBUDGET AND ACTUAL
FOR THE YEAR ENDED JUNE 30, 2010
Budgeted Amounts
Original FinalActual
Amounts
Variance withFinal Budget
Positive(Negative)
REVENUESInvestment earnings $ 6,580 $ 6,580 $ 7,450 $ 870
Total Revenues 6,580 6,580 7,450 870
EXPENDITURESGeneral Government
Non-DepartmentalContractual - - 1,415 (1,415)
Public WorksRoad Rehab
Personnel - 5,000 1,166 3,834Services & Supplies - 11,000 427 10,573Capital - 110,000 18,504 91,496
Total Road Rehab - 126,000 20,097 105,903
EngineeringPersonnel 28,365 27,724 4,928 22,796Services & Supplies - - 214 (214)
Total Engineering - 27,724 5,142 22,582
Total Public Works - 153,724 25,239 128,485
Total Expenditures - 153,724 26,654 127,070
Net change in fund balance $ 6,580 $ (147,144) (19,204) $ 127,940
Fund balance - July 1, 2009 1,297,486
Fund balance - June 30, 2010 $ 1,278,282
107
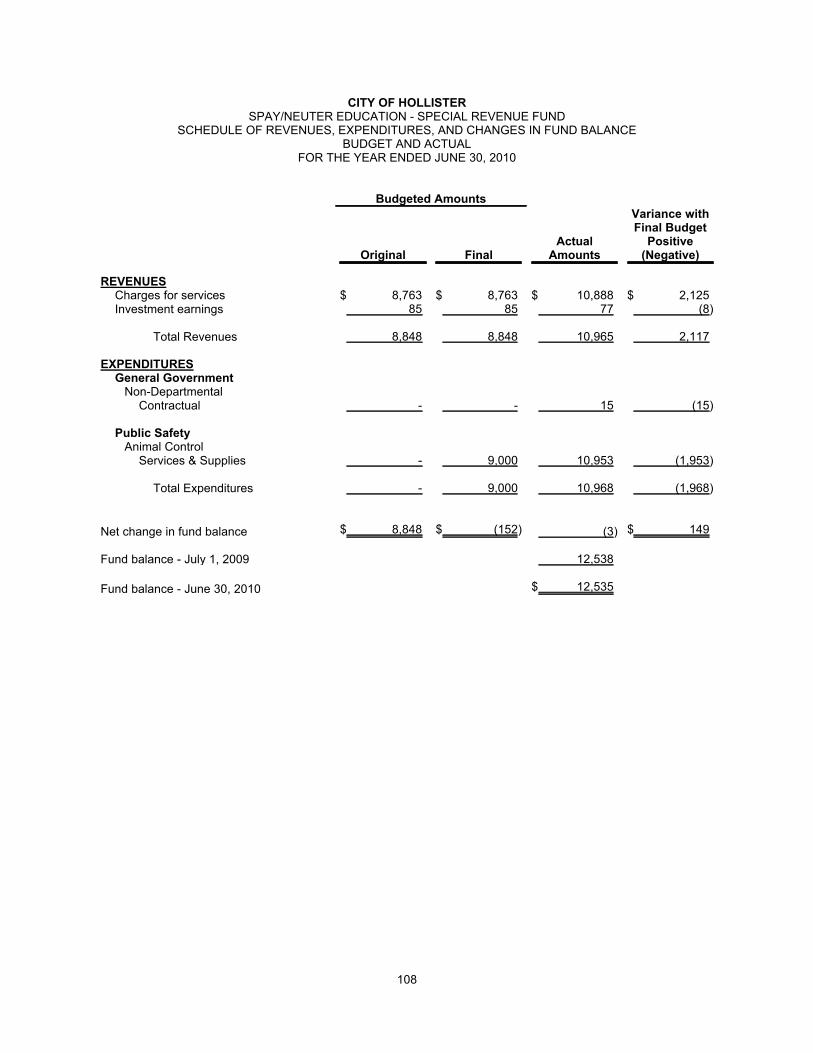
CITY OF HOLLISTERSPAY/NEUTER EDUCATION - SPECIAL REVENUE FUND
SCHEDULE OF REVENUES, EXPENDITURES, AND CHANGES IN FUND BALANCEBUDGET AND ACTUAL
FOR THE YEAR ENDED JUNE 30, 2010
Budgeted Amounts
Original FinalActual
Amounts
Variance withFinal Budget
Positive(Negative)
REVENUESCharges for services $ 8,763 $ 8,763 $ 10,888 $ 2,125Investment earnings 85 85 77 (8)
Total Revenues 8,848 8,848 10,965 2,117
EXPENDITURESGeneral Government
Non-DepartmentalContractual - - 15 (15)
Public SafetyAnimal Control
Services & Supplies - 9,000 10,953 (1,953)
Total Expenditures - 9,000 10,968 (1,968)
Net change in fund balance $ 8,848 $ (152) (3) $ 149
Fund balance - July 1, 2009 12,538
Fund balance - June 30, 2010 $ 12,535
108

CITY OF HOLLISTERMELLO ROOS CFD-1 - SPECIAL REVENUE FUND
SCHEDULE OF REVENUES, EXPENDITURES, AND CHANGES IN FUND BALANCEBUDGET AND ACTUAL
FOR THE YEAR ENDED JUNE 30, 2010
Budgeted Amounts
Original FinalActual
Amounts
Variance withFinal Budget
Positive(Negative)
REVENUESTaxes $ 887,179 $ 887,179 $ 800,210 $ (86,969)Investment earnings 112 112 486 374
Total Revenues 887,291 887,291 800,696 (86,595)
EXPENDITURESGeneral Government
Non-DepartmentalContractual - - 41,051 (41,051)
Public SafetyFire
Personnel 458,754 447,721 371,215 76,506Services & Supplies - - 3,007 (3,007)
Total Street Maintenance 458,754 447,721 374,222 73,499
PolicePersonnel 485,623 473,399 387,196 86,203Services & Supplies - - 3,000 (3,000)
Total Police 485,623 473,399 390,196 83,203
Total Public Safety 944,377 921,120 764,418 156,702
Total Expenditures 944,377 921,120 805,469 115,651
Net change in fund balance $ (57,086) $ (33,829) (4,773) $ 29,056
Fund balance - July 1, 2009 -
Fund balance (deficit) - June 30, 2010 $ (4,773)
109

CITY OF HOLLISTERYOUTH CENTER - SPECIAL REVENUE FUND
SCHEDULE OF REVENUES, EXPENDITURES, AND CHANGES IN FUND BALANCEBUDGET AND ACTUAL
FOR THE YEAR ENDED JUNE 30, 2010
Budgeted Amounts
Original FinalActual
Amounts
Variance withFinal Budget
Positive(Negative)
REVENUESInvestment earnings $ 108 $ 108 $ 126 $ 18
Total Revenues 108 108 126 18
EXPENDITURESGeneral Government
Non-DepartmentalContractual - - 24 (24)
Total Expenditures - - 24 (24)
Net change in fund balance $ 108 $ 108 102 $ (6)
Fund balance - July 1, 2009 21,850
Fund balance - June 30, 2010 $ 21,952
110

CITY OF HOLLISTEROIL RECYCLING - SPECIAL REVENUE FUND
SCHEDULE OF REVENUES, EXPENDITURES, AND CHANGES IN FUND BALANCEBUDGET AND ACTUAL
FOR THE YEAR ENDED JUNE 30, 2010
Budgeted Amounts
Original FinalActual
Amounts
Variance withFinal Budget
Positive(Negative)
REVENUESInvestment earnings $ 130 $ 130 $ 152 $ 22
Total Revenues 130 130 152 22
EXPENDITURESGeneral Government
Non-DepartmentalContractual - - 29 (29)
Total Expenditures - - 29 (29)
Net change in fund balance $ 130 $ 130 123 $ (7)
Fund balance - July 1, 2009 26,313
Fund balance - June 30, 2010 $ 26,436
111
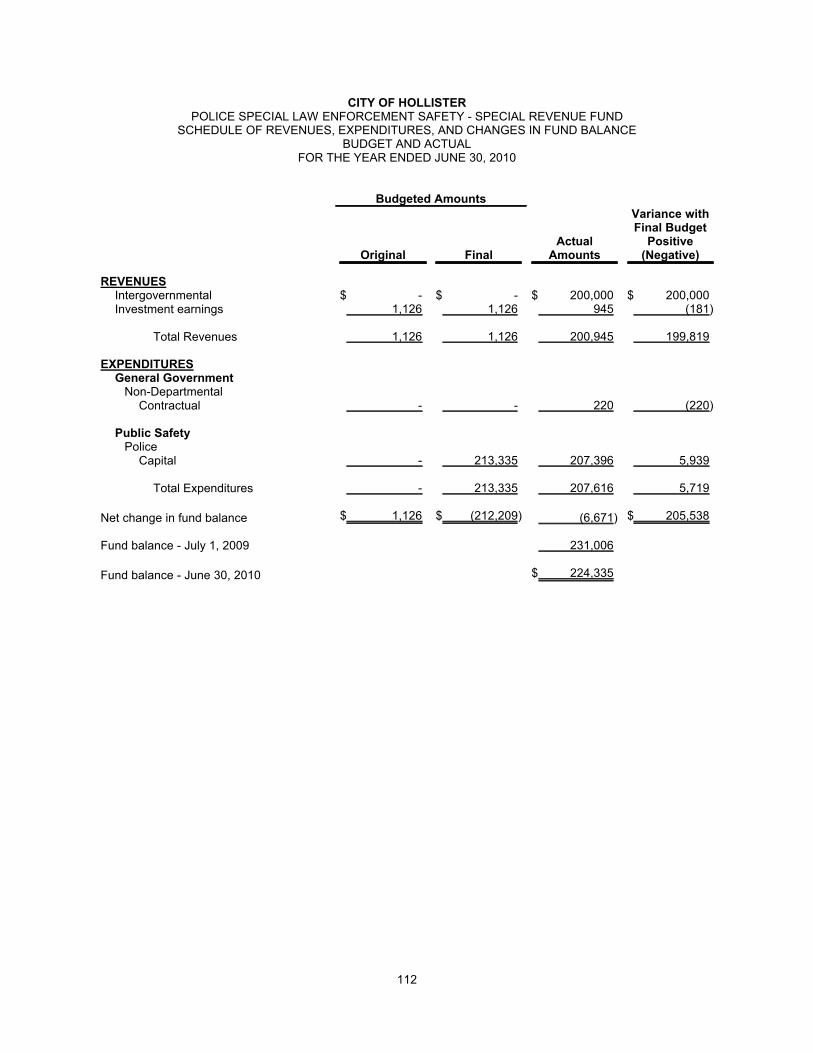
CITY OF HOLLISTERPOLICE SPECIAL LAW ENFORCEMENT SAFETY - SPECIAL REVENUE FUND
SCHEDULE OF REVENUES, EXPENDITURES, AND CHANGES IN FUND BALANCEBUDGET AND ACTUAL
FOR THE YEAR ENDED JUNE 30, 2010
Budgeted Amounts
Original FinalActual
Amounts
Variance withFinal Budget
Positive(Negative)
REVENUESIntergovernmental $ - $ - $ 200,000 $ 200,000Investment earnings 1,126 1,126 945 (181)
Total Revenues 1,126 1,126 200,945 199,819
EXPENDITURESGeneral Government
Non-DepartmentalContractual - - 220 (220)
Public SafetyPolice
Capital - 213,335 207,396 5,939
Total Expenditures - 213,335 207,616 5,719
Net change in fund balance $ 1,126 $ (212,209) (6,671) $ 205,538
Fund balance - July 1, 2009 231,006
Fund balance - June 30, 2010 $ 224,335
112

CITY OF HOLLISTEROFFICE OF TRAFFIC SAFETY - SPECIAL REVENUE FUND
SCHEDULE OF REVENUES, EXPENDITURES, AND CHANGES IN FUND BALANCEBUDGET AND ACTUAL
FOR THE YEAR ENDED JUNE 30, 2010
Budgeted Amounts
Original FinalActual
Amounts
Variance withFinal Budget
Positive(Negative)
REVENUESIntergovernmental $ - $ 7,800 $ 10,825 $ 3,025Investment earnings 64 64 97 33
Total Revenues 64 7,864 10,922 3,058
EXPENDITURESGeneral Government
Non-DepartmentalContractual - - 21 (21)
Public SafetyPolice
Services & Supplies - 7,800 4,691 3,109
Total Expenditures - 7,800 4,712 3,130
Net change in fund balance $ 64 $ 64 6,210 $ 6,146
Fund balance - July 1, 2009 12,993
Fund balance - June 30, 2010 $ 19,203
113

CITY OF HOLLISTERLOCAL LAW ENFORCEMENT - SPECIAL REVENUE FUND
SCHEDULE OF REVENUES, EXPENDITURES, AND CHANGES IN FUND BALANCEBUDGET AND ACTUAL
FOR THE YEAR ENDED JUNE 30, 2010
Budgeted Amounts
Original* Final*Actual
Amounts
Variance withFinal Budget
Positive(Negative)
REVENUES
Total Revenues $ - $ - $ - $ -
EXPENDITURES
Total Expenditures - - - -
OTHER FINANCING SOURCES (USES)Transfers in - - 40,400 40,400
Total other financing sources (uses) - - 40,400 40,400
Net change in fund balance $ - $ - 40,400 $ 40,400
Fund balance (deficit) - July 1, 2009 (40,400)
Fund balance - June 30, 2010 $ -
*The City did not adopt a budget for the Local Law Enforcement fund for the year ended June 30, 2010.
114
CITY OF HOLLISTERCOPS MORE PROGRAM - SPECIAL REVENUE FUND
SCHEDULE OF REVENUES, EXPENDITURES, AND CHANGES IN FUND BALANCEBUDGET AND ACTUAL
FOR THE YEAR ENDED JUNE 30, 2010
Budgeted Amounts
Original* Final*Actual
Amounts
Variance withFinal Budget
Positive(Negative)
REVENUES
Total Revenues $ - $ - $ - $ -
EXPENDITURES
Total Expenditures - - - -
OTHER FINANCING SOURCES (USES)Transfers out - - (38) (38)
Total other financing sources (uses) - - (38) (38)
Net change in fund balance $ - $ - (38) $ (38)
Fund balance - July 1, 2009 38
Fund balance - June 30, 2010 $ -
*The City did not adopt a budget for the COPS More Program fund for the year ended June 30, 2010.
115

CITY OF HOLLISTERANIMAL WELFARE - SPECIAL REVENUE FUND
SCHEDULE OF REVENUES, EXPENDITURES, AND CHANGES IN FUND BALANCEBUDGET AND ACTUAL
FOR THE YEAR ENDED JUNE 30, 2010
Budgeted Amounts
Original FinalActual
Amounts
Variance withFinal Budget
Positive(Negative)
REVENUESInvestment earnings $ 158 $ 158 $ 185 $ 27Other 4,024 4,024 1,853 (2,171)
Total Revenues 4,182 4,182 2,038 (2,144)
EXPENDITURESGeneral Government
Non-DepartmentalContractual - - 33 (33)
Public SafetyAnimal Control
Services & Supplies - 4,200 4,833 (633)
Total Expenditures - 4,200 4,866 (666)
Net change in fund balance $ 4,182 $ (18) (2,828) $ (2,810)
Fund balance - July 1, 2009 33,295
Fund balance - June 30, 2010 $ 30,467
116
CITY OF HOLLISTERCOPS IN SCHOOL PROGRAM - SPECIAL REVENUE FUND
SCHEDULE OF REVENUES, EXPENDITURES, AND CHANGES IN FUND BALANCEBUDGET AND ACTUAL
FOR THE YEAR ENDED JUNE 30, 2010
Budgeted Amounts
Original* Final*Actual
Amounts
Variance withFinal Budget
Positive(Negative)
REVENUES
Total Revenues - - - -
EXPENDITURES
Total Expenditures - - - -
OTHER FINANCING SOURCES (USES)Transfers out - - (51) (51)
Total other financing sources (uses) - - (51) (51)
Net change in fund balance $ - $ - (51) $ (51)
Fund balance - July 1, 2009 51
Fund balance - June 30, 2010 $ -
*The City did not adopt a budget for the COPS in School Program fund for the year ended June 30, 2010.
117
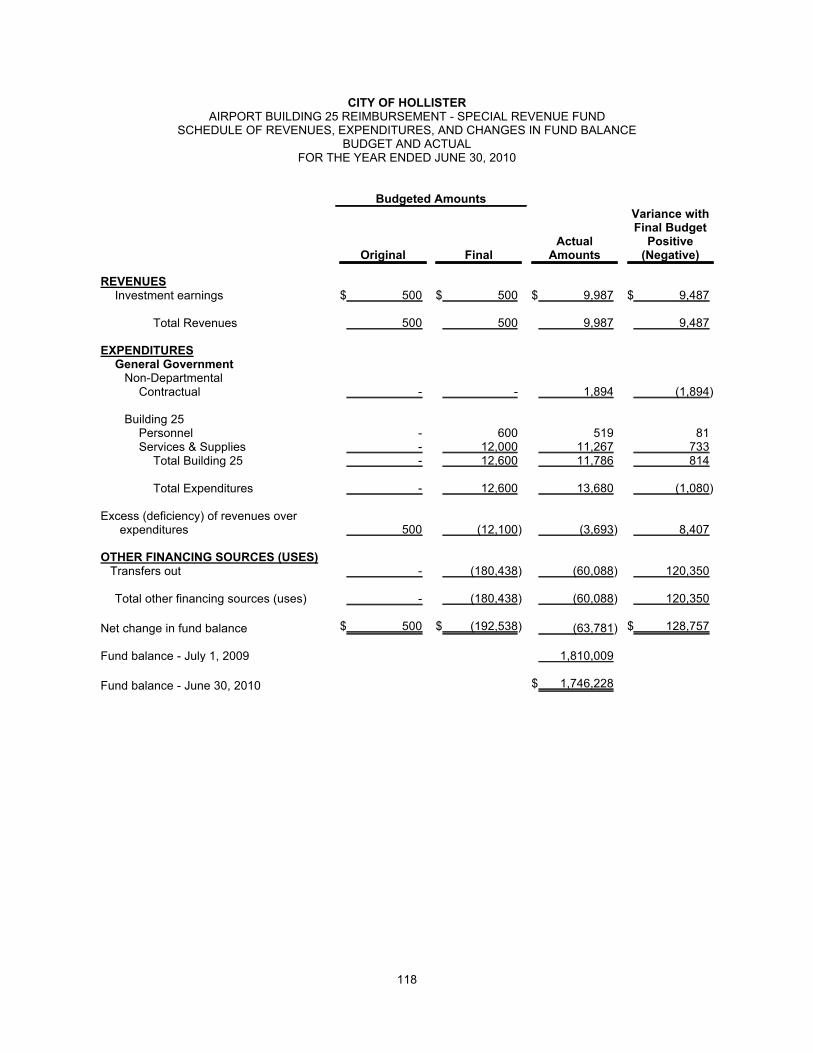
CITY OF HOLLISTERAIRPORT BUILDING 25 REIMBURSEMENT - SPECIAL REVENUE FUND
SCHEDULE OF REVENUES, EXPENDITURES, AND CHANGES IN FUND BALANCEBUDGET AND ACTUAL
FOR THE YEAR ENDED JUNE 30, 2010
Budgeted Amounts
Original FinalActual
Amounts
Variance withFinal Budget
Positive(Negative)
REVENUESInvestment earnings $ 500 $ 500 $ 9,987 $ 9,487
Total Revenues 500 500 9,987 9,487
EXPENDITURESGeneral Government
Non-DepartmentalContractual - - 1,894 (1,894)
Building 25Personnel - 600 519 81Services & Supplies - 12,000 11,267 733
Total Building 25 - 12,600 11,786 814
Total Expenditures - 12,600 13,680 (1,080)
Excess (deficiency) of revenues overexpenditures 500 (12,100) (3,693) 8,407
OTHER FINANCING SOURCES (USES)Transfers out - (180,438) (60,088) 120,350
Total other financing sources (uses) - (180,438) (60,088) 120,350
Net change in fund balance $ 500 $ (192,538) (63,781) $ 128,757
Fund balance - July 1, 2009 1,810,009
Fund balance - June 30, 2010 $ 1,746,228
118

CITY OF HOLLISTER4th OF JULY RALLY - SPECIAL REVENUE FUND
SCHEDULE OF REVENUES, EXPENDITURES, AND CHANGES IN FUND BALANCEBUDGET AND ACTUAL
FOR THE YEAR ENDED JUNE 30, 2010
Budgeted Amounts
Original FinalActual
Amounts
Variance withFinal Budget
Positive(Negative)
REVENUESInvestment earnings $ - $ 145 $ 849 $ 704Other - 535 843 308
Total Revenues - 680 1,692 1,012
EXPENDITURESGeneral Government
RallyPersonnel 40,580 - - -Services & Supplies 1,000 1,595 1,595 -Contractual - - 214 (214)
Total Rally 41,580 1,595 1,809 (214)
Public SafetyPolice
Personnel 2,778 2,778 2,778 -
Total Expenditures 44,358 4,373 4,587 (214)
Excess (deficiency) of revenues overexpenditures (44,358) (3,693) (2,895) 798
OTHER FINANCING SOURCES (USES)Transfers in - - 187,748 187,748
Total other financing sources (uses) - - 187,748 187,748
Net change in fund balance $ (44,358) $ (3,693) 184,853 $ 188,546
Fund balance (deficit) - July 1, 2009 (184,853)
Fund balance - June 30, 2010 $ -
119
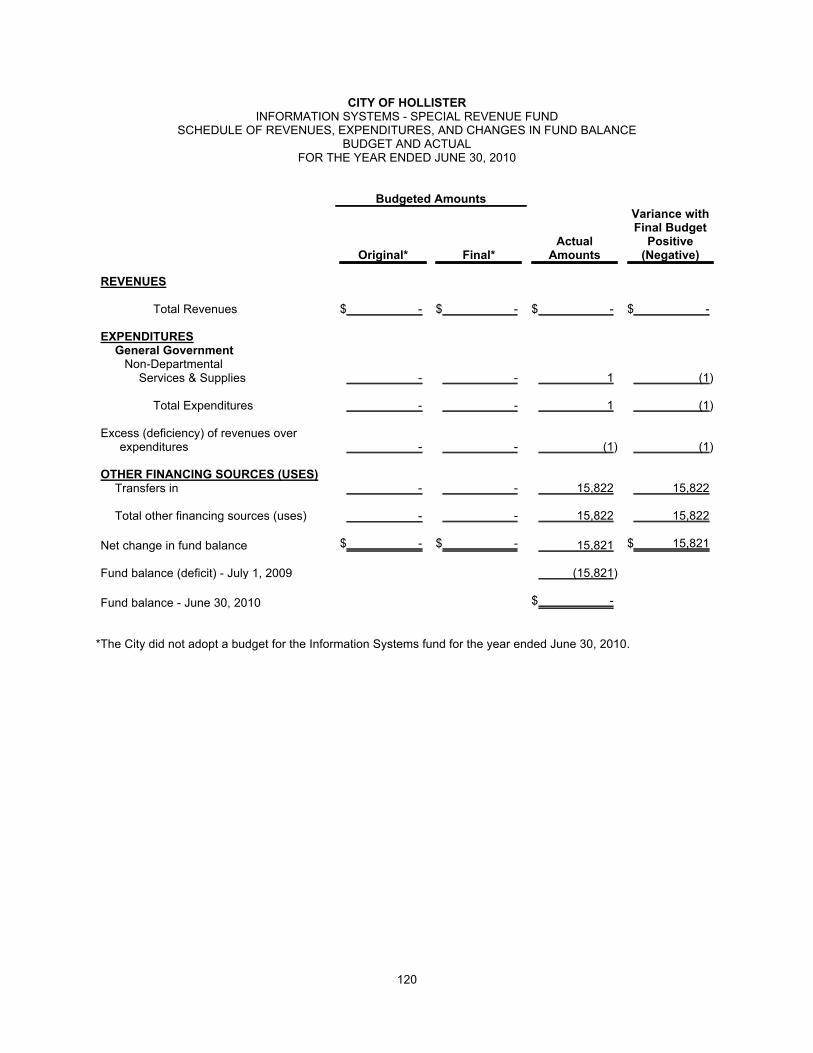
CITY OF HOLLISTERINFORMATION SYSTEMS - SPECIAL REVENUE FUND
SCHEDULE OF REVENUES, EXPENDITURES, AND CHANGES IN FUND BALANCEBUDGET AND ACTUAL
FOR THE YEAR ENDED JUNE 30, 2010
Budgeted Amounts
Original* Final*Actual
Amounts
Variance withFinal Budget
Positive(Negative)
REVENUES
Total Revenues $ - $ - $ - $ -
EXPENDITURESGeneral Government
Non-DepartmentalServices & Supplies - - 1 (1)
Total Expenditures - - 1 (1)
Excess (deficiency) of revenues overexpenditures - - (1) (1)
OTHER FINANCING SOURCES (USES)Transfers in - - 15,822 15,822
Total other financing sources (uses) - - 15,822 15,822
Net change in fund balance $ - $ - 15,821 $ 15,821
Fund balance (deficit) - July 1, 2009 (15,821)
Fund balance - June 30, 2010 $ -
*The City did not adopt a budget for the Information Systems fund for the year ended June 30, 2010.
120

CITY OF HOLLISTERJAG GRANT EQUIPMENT - SPECIAL REVENUE FUND
SCHEDULE OF REVENUES, EXPENDITURES, AND CHANGES IN FUND BALANCEBUDGET AND ACTUAL
FOR THE YEAR ENDED JUNE 30, 2010
Budgeted Amounts
Original* Final*Actual
Amounts
Variance withFinal Budget
Positive(Negative)
REVENUESIntergovernmental $ - $ - $ 18,314 $ 18,314Investment earnings - - 46 46
Total Revenues - - 18,360 18,360
EXPENDITURESGeneral Government
Non-DepartmentalContractual - - 2 (2)
Total Expenditures - - 2 (2)
Net change in fund balance $ - $ - 18,358 $ 18,358
Fund balance - July 1, 2009 -
Fund balance - June 30, 2010 $ 18,358
*The City did not adopt a budget for the JAG Grant Equipment fund for the year ended June 30, 2010.
121

CITY OF HOLLISTERJAG GRANT RECOVERY ACT - SPECIAL REVENUE FUND
SCHEDULE OF REVENUES, EXPENDITURES, AND CHANGES IN FUND BALANCEBUDGET AND ACTUAL
FOR THE YEAR ENDED JUNE 30, 2010
Budgeted Amounts
Original* Final*Actual
Amounts
Variance withFinal Budget
Positive(Negative)
REVENUESIntergovernmental $ - $ - $ 96,834 $ 96,834Investment earnings - - 242 242
Total Revenues - - 97,076 97,076
EXPENDITURESGeneral Government
Non-DepartmentalContractual - - 8 (8)
Public SafetyPolice
Capital - - 3,995 (3,995)
Total Expenditures - - 4,003 (4,003)
Net change in fund balance $ - $ - 93,073 $ 93,073
Fund balance - July 1, 2009 -
Fund balance - June 30, 2010 $ 93,073
*The City did not adopt a budget for the JAG Grant Recovery Act fund for the year ended June 30, 2010.
122
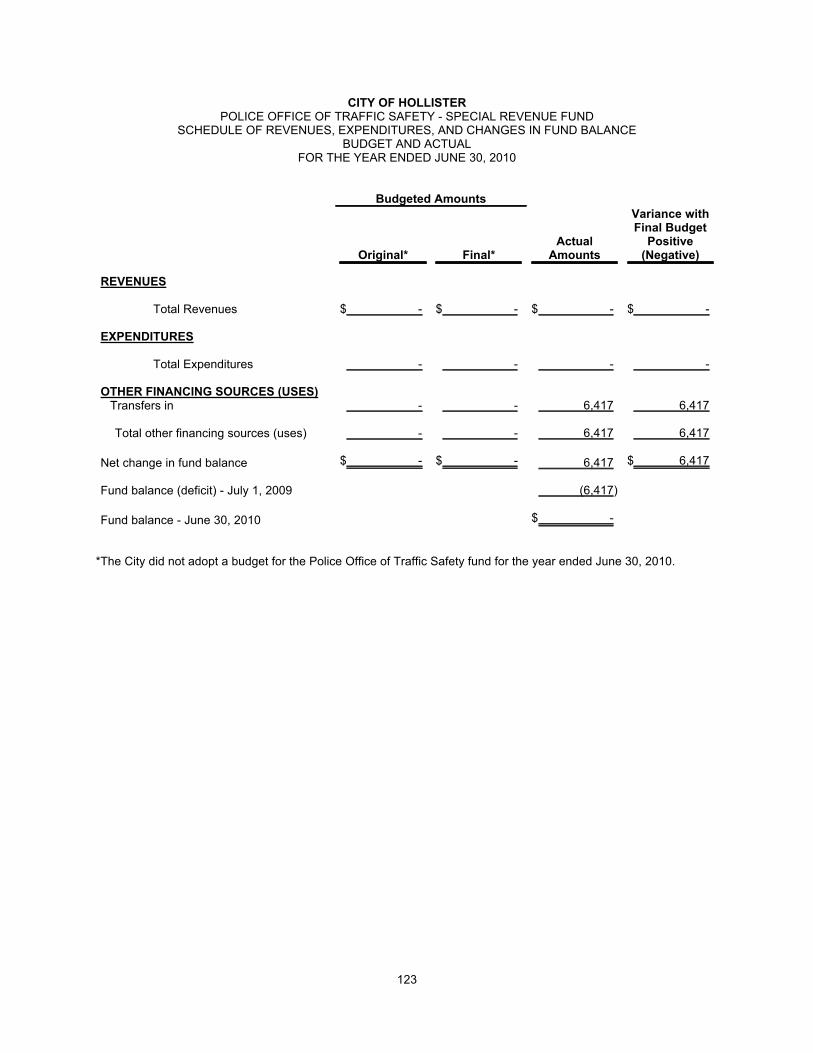
CITY OF HOLLISTERPOLICE OFFICE OF TRAFFIC SAFETY - SPECIAL REVENUE FUND
SCHEDULE OF REVENUES, EXPENDITURES, AND CHANGES IN FUND BALANCEBUDGET AND ACTUAL
FOR THE YEAR ENDED JUNE 30, 2010
Budgeted Amounts
Original* Final*Actual
Amounts
Variance withFinal Budget
Positive(Negative)
REVENUES
Total Revenues $ - $ - $ - $ -
EXPENDITURES
Total Expenditures - - - -
OTHER FINANCING SOURCES (USES)Transfers in - - 6,417 6,417
Total other financing sources (uses) - - 6,417 6,417
Net change in fund balance $ - $ - 6,417 $ 6,417
Fund balance (deficit) - July 1, 2009 (6,417)
Fund balance - June 30, 2010 $ -
*The City did not adopt a budget for the Police Office of Traffic Safety fund for the year ended June 30, 2010.
123

CITY OF HOLLISTERTRAFFIC CONGESTION RELIEF - SPECIAL REVENUE FUND
SCHEDULE OF REVENUES, EXPENDITURES, AND CHANGES IN FUND BALANCEBUDGET AND ACTUAL
FOR THE YEAR ENDED JUNE 30, 2010
Budgeted Amounts
Original FinalActual
Amounts
Variance withFinal Budget
Positive(Negative)
REVENUESIntergovernmental $ 79,235 $ 79,235 $ 335,701 $ 256,466Investment earnings 84 84 2,083 1,999
Total Revenues 79,319 79,319 337,784 258,465
EXPENDITURESGeneral Government
Non-DepartmentalContractual - - 428 (428)
Public WorksRoad Rehab
Personnel - 2,500 20,126 (17,626)Services & Supplies - 10,500 29,622 (19,122)Capital - 303,439 349,713 (46,274)
Total Non-Departmental - 316,439 399,461 (83,022)
Total Expenditures - 316,439 399,889 (83,450)
Net change in fund balance $ 79,319 $ (237,120) (62,105) $ 175,015
Fund balance - July 1, 2009 318,739
Fund balance - June 30, 2010 $ 256,634
124
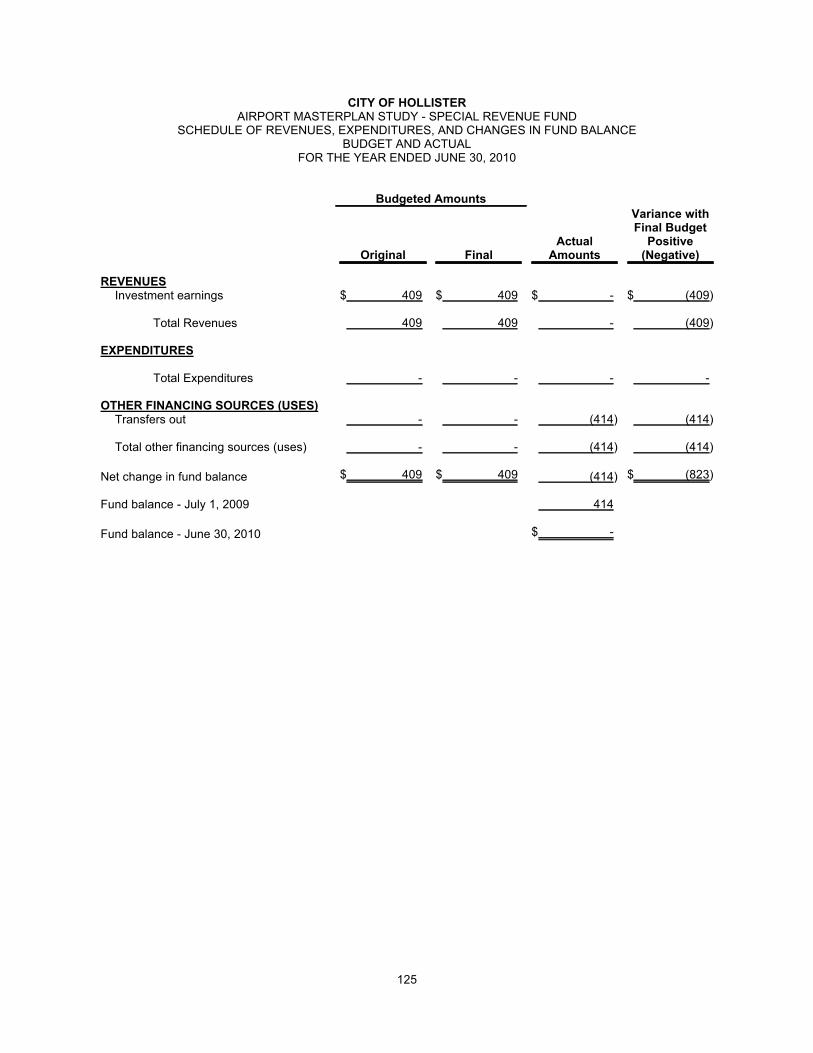
CITY OF HOLLISTERAIRPORT MASTERPLAN STUDY - SPECIAL REVENUE FUND
SCHEDULE OF REVENUES, EXPENDITURES, AND CHANGES IN FUND BALANCEBUDGET AND ACTUAL
FOR THE YEAR ENDED JUNE 30, 2010
Budgeted Amounts
Original FinalActual
Amounts
Variance withFinal Budget
Positive(Negative)
REVENUESInvestment earnings $ 409 $ 409 $ - $ (409)
Total Revenues 409 409 - (409)
EXPENDITURES
Total Expenditures - - - -
OTHER FINANCING SOURCES (USES)Transfers out - - (414) (414)
Total other financing sources (uses) - - (414) (414)
Net change in fund balance $ 409 $ 409 (414) $ (823)
Fund balance - July 1, 2009 414
Fund balance - June 30, 2010 $ -
125
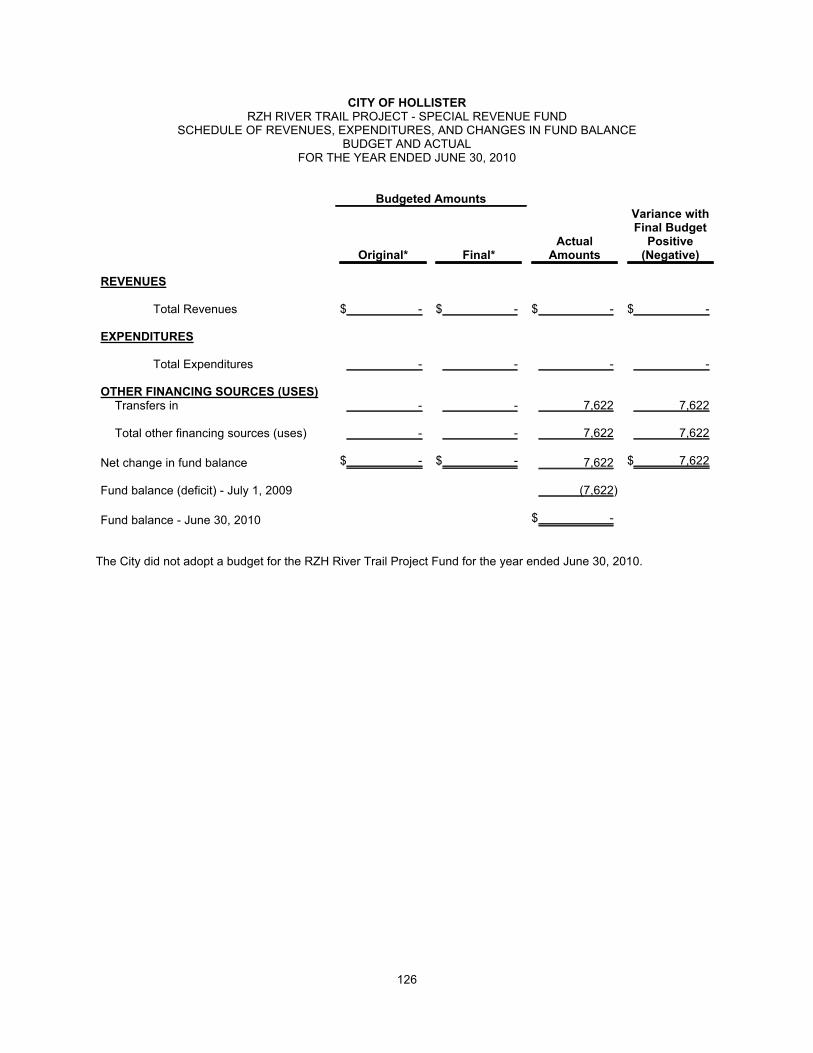
CITY OF HOLLISTERRZH RIVER TRAIL PROJECT - SPECIAL REVENUE FUND
SCHEDULE OF REVENUES, EXPENDITURES, AND CHANGES IN FUND BALANCEBUDGET AND ACTUAL
FOR THE YEAR ENDED JUNE 30, 2010
Budgeted Amounts
Original* Final*Actual
Amounts
Variance withFinal Budget
Positive(Negative)
REVENUES
Total Revenues $ - $ - $ - $ -
EXPENDITURES
Total Expenditures - - - -
OTHER FINANCING SOURCES (USES)Transfers in - - 7,622 7,622
Total other financing sources (uses) - - 7,622 7,622
Net change in fund balance $ - $ - 7,622 $ 7,622
Fund balance (deficit) - July 1, 2009 (7,622)
Fund balance - June 30, 2010 $ -
The City did not adopt a budget for the RZH River Trail Project Fund for the year ended June 30, 2010.
126
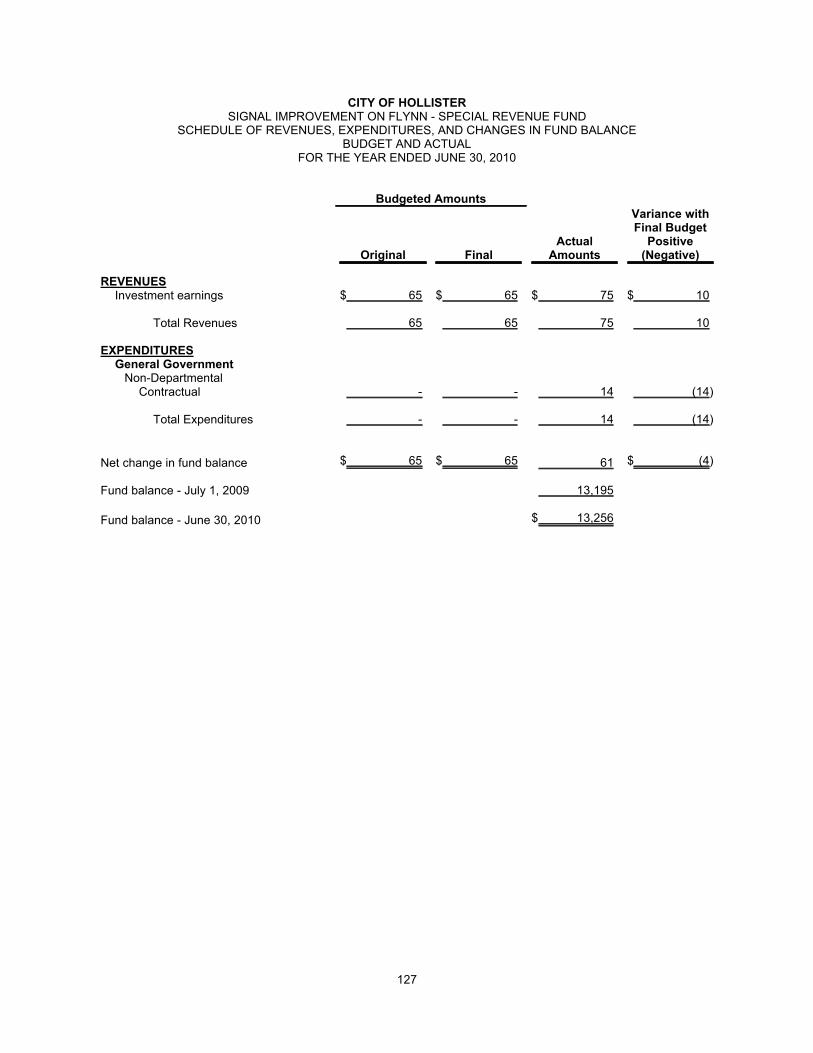
CITY OF HOLLISTERSIGNAL IMPROVEMENT ON FLYNN - SPECIAL REVENUE FUND
SCHEDULE OF REVENUES, EXPENDITURES, AND CHANGES IN FUND BALANCEBUDGET AND ACTUAL
FOR THE YEAR ENDED JUNE 30, 2010
Budgeted Amounts
Original FinalActual
Amounts
Variance withFinal Budget
Positive(Negative)
REVENUESInvestment earnings $ 65 $ 65 $ 75 $ 10
Total Revenues 65 65 75 10
EXPENDITURESGeneral Government
Non-DepartmentalContractual - - 14 (14)
Total Expenditures - - 14 (14)
Net change in fund balance $ 65 $ 65 61 $ (4)
Fund balance - July 1, 2009 13,195
Fund balance - June 30, 2010 $ 13,256
127
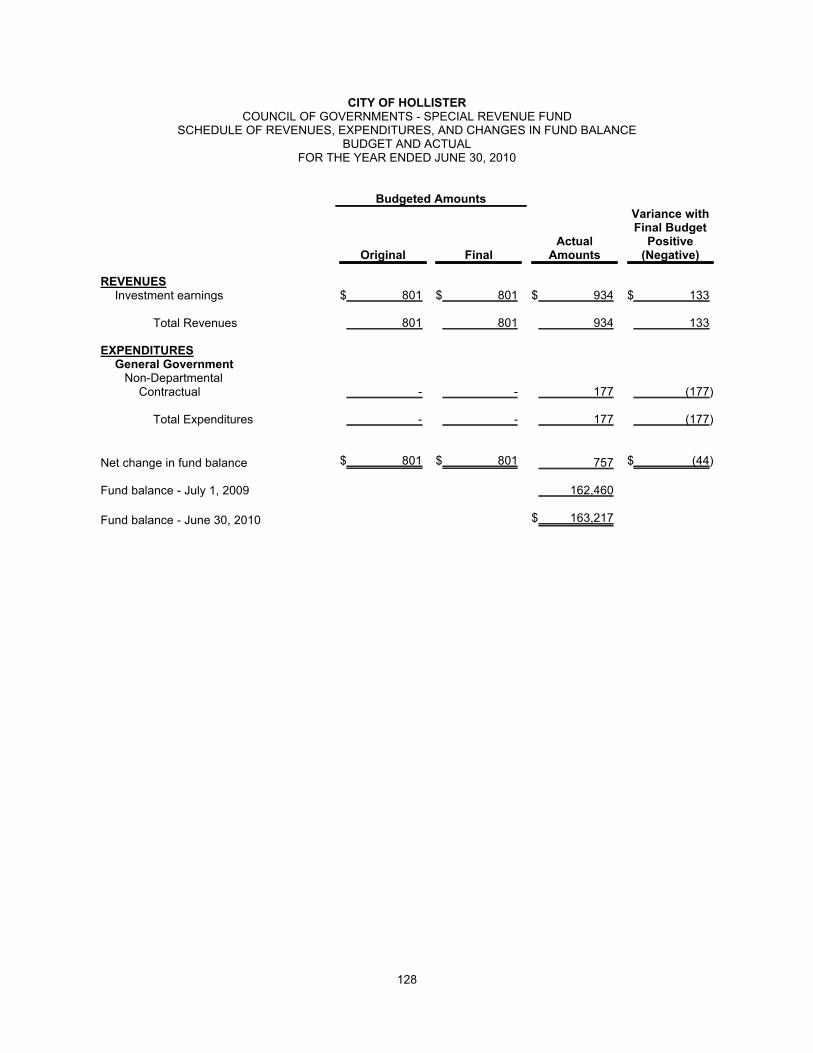
CITY OF HOLLISTERCOUNCIL OF GOVERNMENTS - SPECIAL REVENUE FUND
SCHEDULE OF REVENUES, EXPENDITURES, AND CHANGES IN FUND BALANCEBUDGET AND ACTUAL
FOR THE YEAR ENDED JUNE 30, 2010
Budgeted Amounts
Original FinalActual
Amounts
Variance withFinal Budget
Positive(Negative)
REVENUESInvestment earnings $ 801 $ 801 $ 934 $ 133
Total Revenues 801 801 934 133
EXPENDITURESGeneral Government
Non-DepartmentalContractual - - 177 (177)
Total Expenditures - - 177 (177)
Net change in fund balance $ 801 $ 801 757 $ (44)
Fund balance - July 1, 2009 162,460
Fund balance - June 30, 2010 $ 163,217
128

CITY OF HOLLISTERSAN FELIPE BIKEWAY - SPECIAL REVENUE FUND
SCHEDULE OF REVENUES, EXPENDITURES, AND CHANGES IN FUND BALANCEBUDGET AND ACTUAL
FOR THE YEAR ENDED JUNE 30, 2010
Budgeted Amounts
Original* Final*Actual
Amounts
Variance withFinal Budget
Positive(Negative)
REVENUES
Total Revenues $ - $ - $ - $ -
EXPENDITURES
Total Expenditures - - - -
OTHER FINANCING SOURCES (USES)Transfers in - - 21,931 21,931
Total other financing sources (uses) - - 21,931 21,931
Net change in fund balance $ - $ - 21,931 $ 21,931
Fund balance (deficit) - July 1, 2009 (21,931)
Fund balance - June 30, 2010 $ -
*The City did not adopt a budget for the San Felipe Bikeway fund for the year ended June 30, 2010.
129

CITY OF HOLLISTERHOME PROGRAM REVOLVING LOANS - SPECIAL REVENUE FUND
SCHEDULE OF REVENUES, EXPENDITURES, AND CHANGES IN FUND BALANCEBUDGET AND ACTUAL
FOR THE YEAR ENDED JUNE 30, 2010
Budgeted Amounts
Original FinalActual
Amounts
Variance withFinal Budget
Positive(Negative)
REVENUESInvestment earnings $ 1 $ 1 $ 8,036 $ 8,035Other - - 6,148 6,148
Total Revenues 1 1 14,184 14,183
EXPENDITURES
Total Expenditures - - - -
Net change in fund balance $ 1 $ 1 14,184 $ 14,183
Fund balance - July 1, 2009 622,095
Fund balance - June 30, 2010 $ 636,279
130
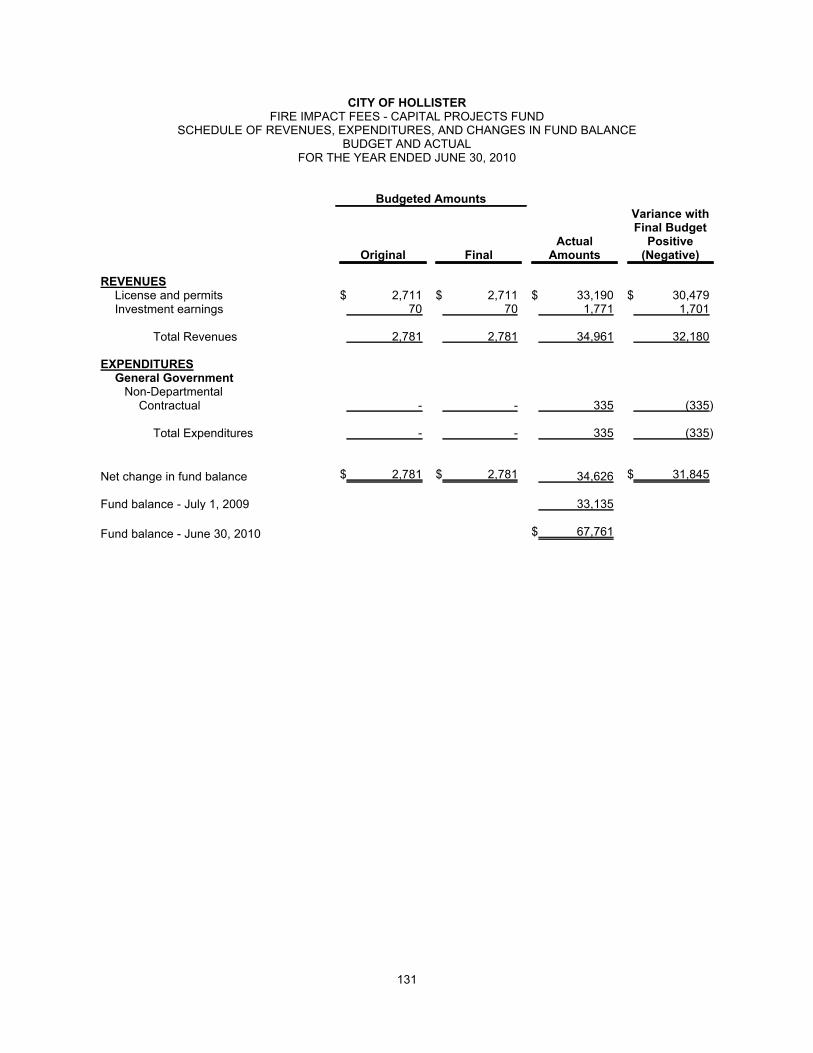
CITY OF HOLLISTERFIRE IMPACT FEES - CAPITAL PROJECTS FUND
SCHEDULE OF REVENUES, EXPENDITURES, AND CHANGES IN FUND BALANCEBUDGET AND ACTUAL
FOR THE YEAR ENDED JUNE 30, 2010
Budgeted Amounts
Original FinalActual
Amounts
Variance withFinal Budget
Positive(Negative)
REVENUESLicense and permits $ 2,711 $ 2,711 $ 33,190 $ 30,479Investment earnings 70 70 1,771 1,701
Total Revenues 2,781 2,781 34,961 32,180
EXPENDITURESGeneral Government
Non-DepartmentalContractual - - 335 (335)
Total Expenditures - - 335 (335)
Net change in fund balance $ 2,781 $ 2,781 34,626 $ 31,845
Fund balance - July 1, 2009 33,135
Fund balance - June 30, 2010 $ 67,761
131

CITY OF HOLLISTERPOLICE IMPACT FEES - CAPITAL PROJECTS FUND
SCHEDULE OF REVENUES, EXPENDITURES, AND CHANGES IN FUND BALANCEBUDGET AND ACTUAL
FOR THE YEAR ENDED JUNE 30, 2010
Budgeted Amounts
Original FinalActual
Amounts
Variance withFinal Budget
Positive(Negative)
REVENUESCharges for services $ 2,921 $ 2,921 $ 24,420 $ 21,499Investment earnings 161 161 274 113
Total Revenues 3,082 3,082 24,694 21,612
EXPENDITURESGeneral Government
Non-DepartmentalContractual - - 51 (51)
Total Expenditures - - 51 (51)
Net change in fund balance $ 3,082 $ 3,082 24,643 $ 21,561
Fund balance - July 1, 2009 36,386
Fund balance - June 30, 2010 $ 61,029
132

CITY OF HOLLISTERSTORM DRAIN FEES - CAPITAL PROJECTS FUND
SCHEDULE OF REVENUES, EXPENDITURES, AND CHANGES IN FUND BALANCEBUDGET AND ACTUAL
FOR THE YEAR ENDED JUNE 30, 2010
Budgeted Amounts
Original FinalActual
Amounts
Variance withFinal Budget
Positive(Negative)
REVENUESCharges for services $ 36,680 $ 36,680 $ 21,920 $ (14,760)Investment earnings 152 152 522 370
Total Revenues 36,832 36,832 22,442 (14,390)
EXPENDITURESGeneral Government
Non-DepartmentalContractual - - 100 (100)
Total Expenditures - - 100 (100)
Net change in fund balance $ 36,832 $ 36,832 22,342 $ (14,490)
Fund balance - July 1, 2009 70,321
Fund balance - June 30, 2010 $ 92,663
133

CITY OF HOLLISTERSTORM DRAIN IMPACT FEES - CAPITAL PROJECTS FUND
SCHEDULE OF REVENUES, EXPENDITURES, AND CHANGES IN FUND BALANCEBUDGET AND ACTUAL
FOR THE YEAR ENDED JUNE 30, 2010
Budgeted Amounts
Original FinalActual
Amounts
Variance withFinal Budget
Positive(Negative)
REVENUESCharges for services $ - $ - $ 125,290 $ 125,290Investment earnings 22,022 22,022 24,324 2,302
Total Revenues 22,022 22,022 149,614 127,592
EXPENDITURESGeneral Government
Non-DepartmentalContractual - - 4,569 (4,569)
Public WorksStorm Drain
Personnel - 18,000 19,570 (1,570)Services & Supplies - 236,500 206,275 30,225Capital - 120,000 106,100 13,900
Total Storm Drain - - 331,945 42,555
EngineeringPersonnel 74,294 54,237 47,481 6,756Supplies & Services 28,675 28,675 19,727 8,948Contractual 2,031 2,031 11,813 (9,782)Capital - - 1,387 (1,387)
Total Engineering 105,000 84,943 80,408 4,535
Street MaintenanceContractual 1,200 1,200 1,068 132
Total Public Works 106,200 86,143 413,421 47,222
Total Expenditures 106,200 86,143 417,990 42,653
Net change in fund balance $ (84,178) $ (64,121) (268,376) $ (204,255)
Fund balance - July 1, 2009 4,349,503
Fund balance - June 30, 2010 $ 4,081,127
134
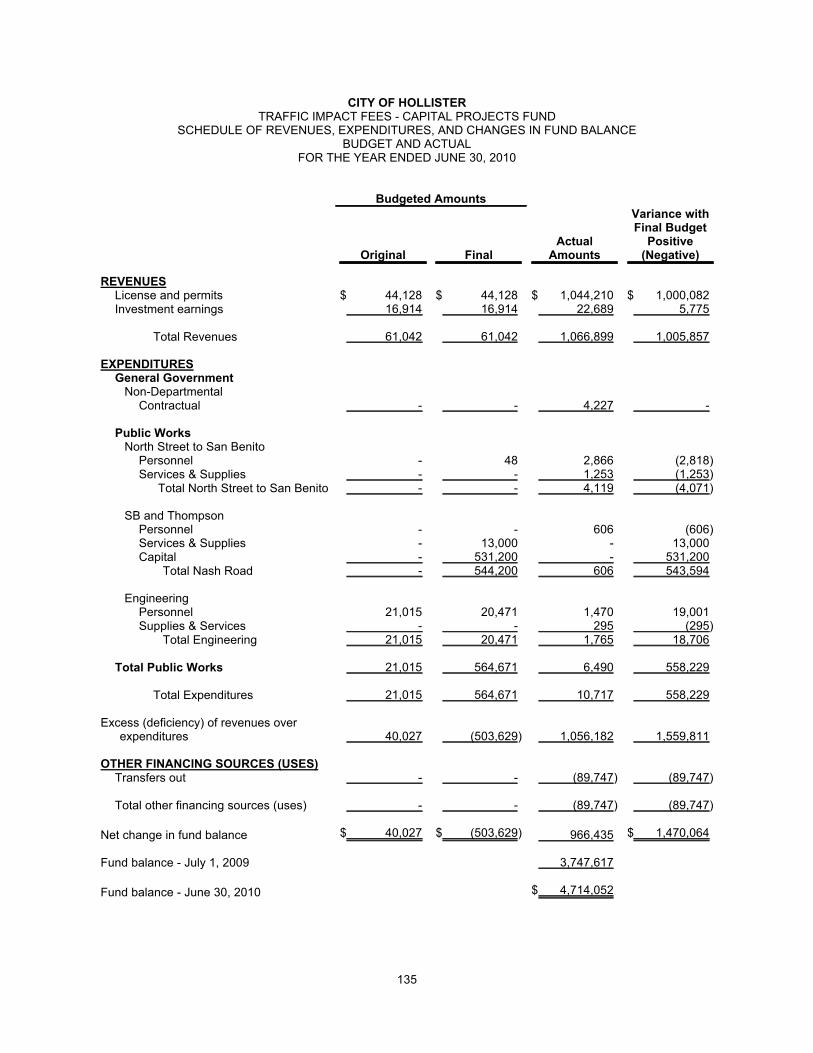
CITY OF HOLLISTERTRAFFIC IMPACT FEES - CAPITAL PROJECTS FUND
SCHEDULE OF REVENUES, EXPENDITURES, AND CHANGES IN FUND BALANCEBUDGET AND ACTUAL
FOR THE YEAR ENDED JUNE 30, 2010
Budgeted Amounts
Original FinalActual
Amounts
Variance withFinal Budget
Positive(Negative)
REVENUESLicense and permits $ 44,128 $ 44,128 $ 1,044,210 $ 1,000,082Investment earnings 16,914 16,914 22,689 5,775
Total Revenues 61,042 61,042 1,066,899 1,005,857
EXPENDITURESGeneral Government
Non-DepartmentalContractual - - 4,227 -
Public WorksNorth Street to San Benito
Personnel - 48 2,866 (2,818)Services & Supplies - - 1,253 (1,253)
Total North Street to San Benito - - 4,119 (4,071)
SB and ThompsonPersonnel - - 606 (606)Services & Supplies - 13,000 - 13,000Capital - 531,200 - 531,200
Total Nash Road - 544,200 606 543,594
EngineeringPersonnel 21,015 20,471 1,470 19,001Supplies & Services - - 295 (295)
Total Engineering 21,015 20,471 1,765 18,706
Total Public Works 21,015 564,671 6,490 558,229
Total Expenditures 21,015 564,671 10,717 558,229
Excess (deficiency) of revenues overexpenditures 40,027 (503,629) 1,056,182 1,559,811
OTHER FINANCING SOURCES (USES)Transfers out - - (89,747) (89,747)
Total other financing sources (uses) - - (89,747) (89,747)
Net change in fund balance $ 40,027 $ (503,629) 966,435 $ 1,470,064
Fund balance - July 1, 2009 3,747,617
Fund balance - June 30, 2010 $ 4,714,052
135

CITY OF HOLLISTERAB 1600 SANTA ANNA STORM DRAIN - CAPITAL PROJECTS FUND
SCHEDULE OF REVENUES, EXPENDITURES, AND CHANGES IN FUND BALANCEBUDGET AND ACTUAL
FOR THE YEAR ENDED JUNE 30, 2010
Budgeted Amounts
Original FinalActual
Amounts
Variance withFinal Budget
Positive(Negative)
REVENUESInvestment earnings $ 8,283 $ 8,283 $ 9,648 $ 1,365
Total Revenues 8,283 8,283 9,648 1,365
EXPENDITURESGeneral Government
Non-DepartmentalContractual - - 1,830 (1,830)
Total Expenditures - - 1,830 (1,830)
Net change in fund balance $ 8,283 $ 8,283 7,818 $ (465)
Fund balance - July 1, 2009 1,938,850
Fund balance - June 30, 2010 $ 1,946,668
136

CITY OF HOLLISTERJAIL JUVENILE HALL - CAPITAL PROJECTS FUND
SCHEDULE OF REVENUES, EXPENDITURES, AND CHANGES IN FUND BALANCEBUDGET AND ACTUAL
FOR THE YEAR ENDED JUNE 30, 2010
Budgeted Amounts
Original FinalActual
Amounts
Variance withFinal Budget
Positive(Negative)
REVENUESLicense and permits $ - $ - $ 24,956 $ 24,956Investment earnings 734 734 - (734)
Total Revenues 734 734 24,956 24,222
EXPENDITURES
Total Expenditures - - - -
Net change in fund balance $ 734 $ 734 24,956 $ 24,222
Fund balance (deficit) - July 1, 2009 (68,532)
Fund balance (deficit) - June 30, 2010 $ (43,576)
137
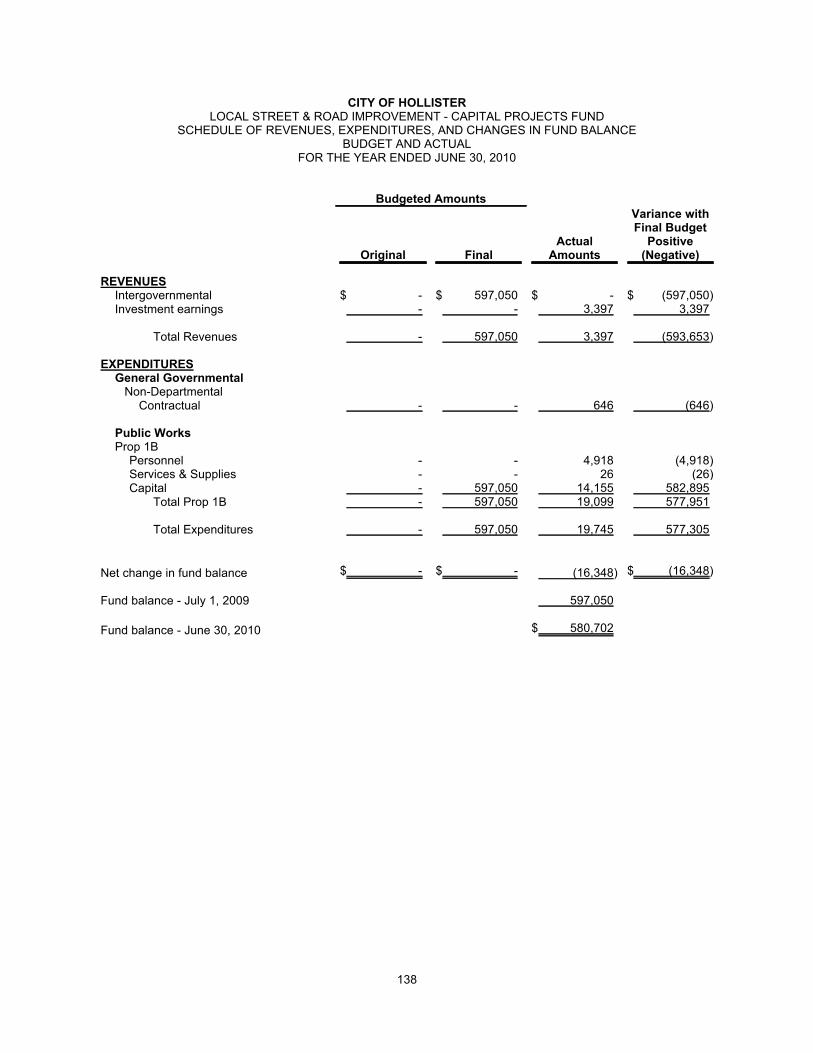
CITY OF HOLLISTERLOCAL STREET & ROAD IMPROVEMENT - CAPITAL PROJECTS FUND
SCHEDULE OF REVENUES, EXPENDITURES, AND CHANGES IN FUND BALANCEBUDGET AND ACTUAL
FOR THE YEAR ENDED JUNE 30, 2010
Budgeted Amounts
Original FinalActual
Amounts
Variance withFinal Budget
Positive(Negative)
REVENUESIntergovernmental $ - $ 597,050 $ - $ (597,050)Investment earnings - - 3,397 3,397
Total Revenues - 597,050 3,397 (593,653)
EXPENDITURESGeneral Governmental
Non-DepartmentalContractual - - 646 (646)
Public WorksProp 1B
Personnel - - 4,918 (4,918)Services & Supplies - - 26 (26)Capital - 597,050 14,155 582,895
Total Prop 1B - 597,050 19,099 577,951
Total Expenditures - 597,050 19,745 577,305
Net change in fund balance $ - $ - (16,348) $ (16,348)
Fund balance - July 1, 2009 597,050
Fund balance - June 30, 2010 $ 580,702
138

CITY OF HOLLISTERARRA - SPECIAL REVENUE FUND
SCHEDULE OF REVENUES, EXPENDITURES, AND CHANGES IN FUND BALANCEBUDGET AND ACTUAL
FOR THE YEAR ENDED JUNE 30, 2010
Budgeted Amounts
Original FinalActual
Amounts
Variance withFinal Budget
Positive(Negative)
REVENUESIntergovernmental $ - $ 1,218,531 $ - $ (1,218,531)Investment earnings - - 42 42
Total Revenues - 1,218,531 42 (1,218,489)
EXPENDITURESGeneral Government
Non-DepartmentalContractual - - 9 (9)
Public WorksRoad Rehab
Personnel - - 18,420 (18,420)Services & Supplies - 1,218,531 20,802 1,197,729
Total Road Rehab - 1,218,531 39,222 1,179,309
EngineeringServices & Supplies - - 201 (201)
Total Public Works - 1,218,531 39,423 1,179,108
Total Expenditures - 1,218,531 39,432 1,179,099
Net change in fund balance $ - $ - (39,390) $ (39,390)
Fund balance - July 1, 2009 -
Fund balance (deficit) - June 30, 2010 $ (39,390)
139

AGENCY FUNDS
Fiduciary Funds account for assets held by the City in a trustee capacity, or as an agent for private organizations,other governmental units, or other funds. The following are the City’s Fiduciary Funds:
Red Cross Relief - This fund accounts for assets held for the Red Cross Relief Fund in a fiduciary capacity.
Tricentennial - This fund accounts for assets held for the Tri-Centennial in a fiduciary capacity.
Veteran's Building Pavers - This fund accounts for assets held for the Veteran’s Building Pavers in a fiduciarycapacity.
Meridian Street - This fund accounts for assets held for the Meridian Street Assessment District in a fiduciarycapacity.
San Benito Estates - This fund accounts for assets held for the San Benito Estates Assessment District in a fiduciarycapacity.
Hollister Business Park - This fund accounts for assets held for the Hollister Business Park Assessment District in afiduciary capacity.
Landscaping and Lighting - This fund accounts for assets held for the Landscaping and Lighting Assessment Districtin a fiduciary capacity.
Sunnyslope Village - This fund accounts for assets held for the Landscaping and Lighting Assessment District in afiduciary capacity.
Gateway Auto Mall - This fund accounts for assets held for the Gateway Auto Mall Assessment District in a fiduciarycapacity.
140

CITY OF HOLLISTERCOMBINING SCHEDULE OF FIDUCIARY NET ASSETS
TRUST AND AGENCY FUNDSJUNE 30, 2010
RedCrossRelief
Tri-centennial
Veteran'sBuildingPavers
MeridianStreet
San BenitoEstates
HollisterBusiness
ParkLandscapingand Lighting
SunnyslopeVillage
GatewayAuto Mall Total
ASSETS
Cash and investments $ 193 $ 14 $ 338 $ 544,622 $ 252,571 $ 156,005 $ - $ 901 $ 315,138 $ 1,269,782Accounts receivable - - - 8,337 4,072 - 37,065 - 16,739 66,213Interest receivable - - - 253 268 203 - 1 268 993
Total Assets $ 193 $ 14 $ 338 $ 553,212 $ 256,911 $ 156,208 $ 37,065 $ 902 $ 332,145 $ 1,336,988
LIABILITIES
Accounts payable $ - $ - $ - $ - $ - $ - $ 35,332 $ - $ - $ 35,332Accrued liabilities 161 - - - - - 1,733 - - 1,894Deposits in trust 32 14 338 553,212 256,911 156,208 - 902 332,145 1,299,762
Total Liabilities $ 193 $ 14 $ 338 $ 553,212 $ 256,911 $ 156,208 $ 37,065 $ 902 $ 332,145 $ 1,336,988
141
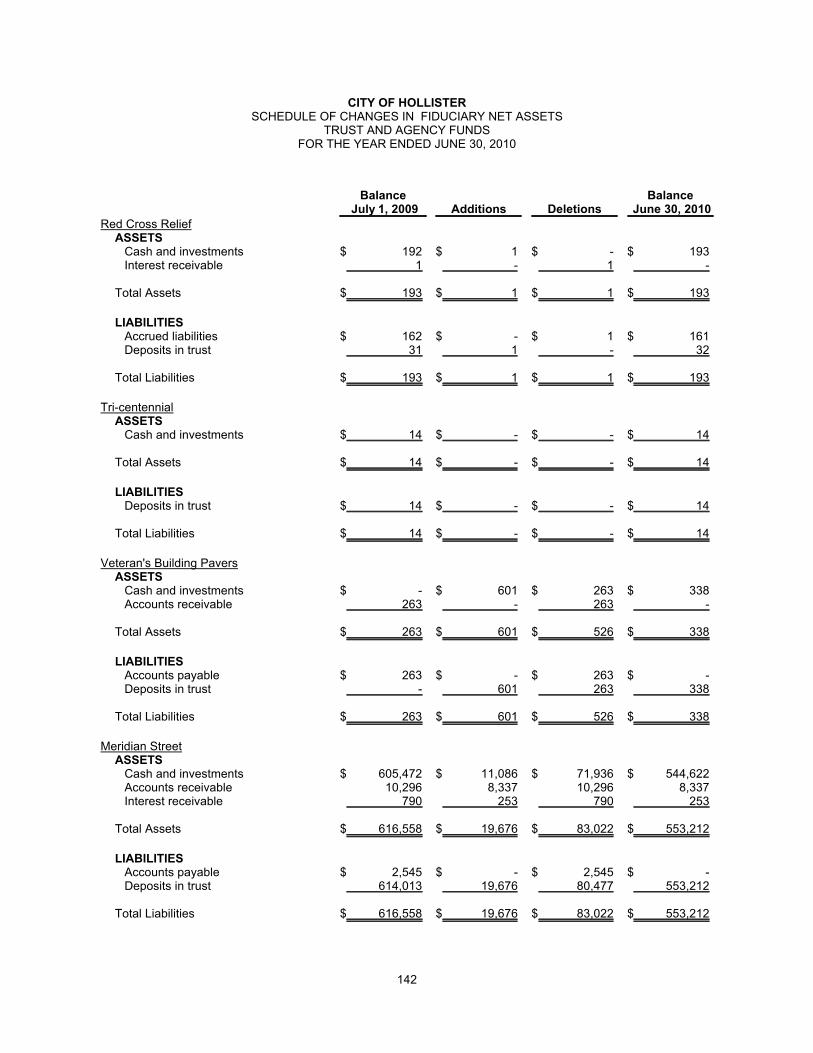
CITY OF HOLLISTERSCHEDULE OF CHANGES IN FIDUCIARY NET ASSETS
TRUST AND AGENCY FUNDSFOR THE YEAR ENDED JUNE 30, 2010
BalanceJuly 1, 2009 Additions Deletions
BalanceJune 30, 2010
Red Cross ReliefASSETS
Cash and investments $ 192 $ 1 $ - $ 193Interest receivable 1 - 1 -
Total Assets $ 193 $ 1 $ 1 $ 193
LIABILITIESAccrued liabilities $ 162 $ - $ 1 $ 161Deposits in trust 31 1 - 32
Total Liabilities $ 193 $ 1 $ 1 $ 193
Tri-centennialASSETS
Cash and investments $ 14 $ - $ - $ 14
Total Assets $ 14 $ - $ - $ 14
LIABILITIESDeposits in trust $ 14 $ - $ - $ 14
Total Liabilities $ 14 $ - $ - $ 14
Veteran's Building PaversASSETS
Cash and investments $ - $ 601 $ 263 $ 338Accounts receivable 263 - 263 -
Total Assets $ 263 $ 601 $ 526 $ 338
LIABILITIESAccounts payable $ 263 $ - $ 263 $ -Deposits in trust - 601 263 338
Total Liabilities $ 263 $ 601 $ 526 $ 338
Meridian StreetASSETS
Cash and investments $ 605,472 $ 11,086 $ 71,936 $ 544,622Accounts receivable 10,296 8,337 10,296 8,337Interest receivable 790 253 790 253
Total Assets $ 616,558 $ 19,676 $ 83,022 $ 553,212
LIABILITIESAccounts payable $ 2,545 $ - $ 2,545 $ -Deposits in trust 614,013 19,676 80,477 553,212
Total Liabilities $ 616,558 $ 19,676 $ 83,022 $ 553,212
142
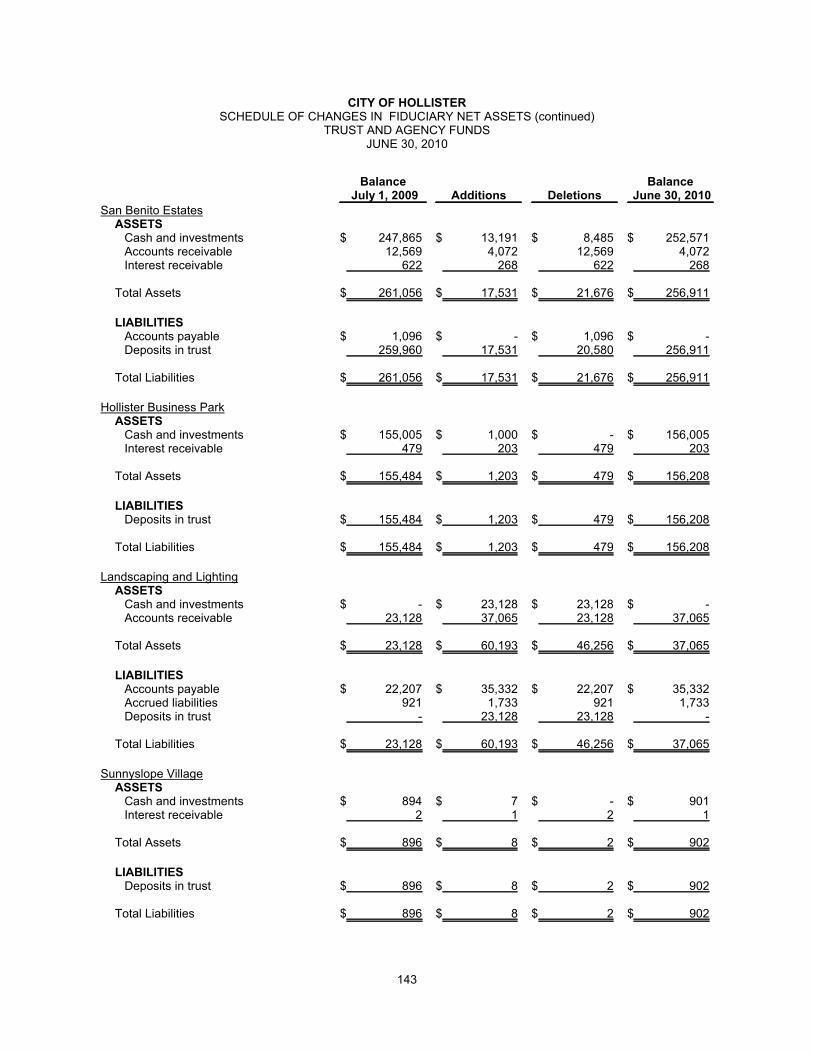
CITY OF HOLLISTERSCHEDULE OF CHANGES IN FIDUCIARY NET ASSETS (continued)
TRUST AND AGENCY FUNDSJUNE 30, 2010
BalanceJuly 1, 2009 Additions Deletions
BalanceJune 30, 2010
San Benito EstatesASSETS
Cash and investments $ 247,865 $ 13,191 $ 8,485 $ 252,571Accounts receivable 12,569 4,072 12,569 4,072Interest receivable 622 268 622 268
Total Assets $ 261,056 $ 17,531 $ 21,676 $ 256,911
LIABILITIESAccounts payable $ 1,096 $ - $ 1,096 $ -Deposits in trust 259,960 17,531 20,580 256,911
Total Liabilities $ 261,056 $ 17,531 $ 21,676 $ 256,911
Hollister Business ParkASSETS
Cash and investments $ 155,005 $ 1,000 $ - $ 156,005Interest receivable 479 203 479 203
Total Assets $ 155,484 $ 1,203 $ 479 $ 156,208
LIABILITIESDeposits in trust $ 155,484 $ 1,203 $ 479 $ 156,208
Total Liabilities $ 155,484 $ 1,203 $ 479 $ 156,208
Landscaping and LightingASSETS
Cash and investments $ - $ 23,128 $ 23,128 $ -Accounts receivable 23,128 37,065 23,128 37,065
Total Assets $ 23,128 $ 60,193 $ 46,256 $ 37,065
LIABILITIESAccounts payable $ 22,207 $ 35,332 $ 22,207 $ 35,332Accrued liabilities 921 1,733 921 1,733Deposits in trust - 23,128 23,128 -
Total Liabilities $ 23,128 $ 60,193 $ 46,256 $ 37,065
Sunnyslope VillageASSETS
Cash and investments $ 894 $ 7 $ - $ 901Interest receivable 2 1 2 1
Total Assets $ 896 $ 8 $ 2 $ 902
LIABILITIESDeposits in trust $ 896 $ 8 $ 2 $ 902
Total Liabilities $ 896 $ 8 $ 2 $ 902
143
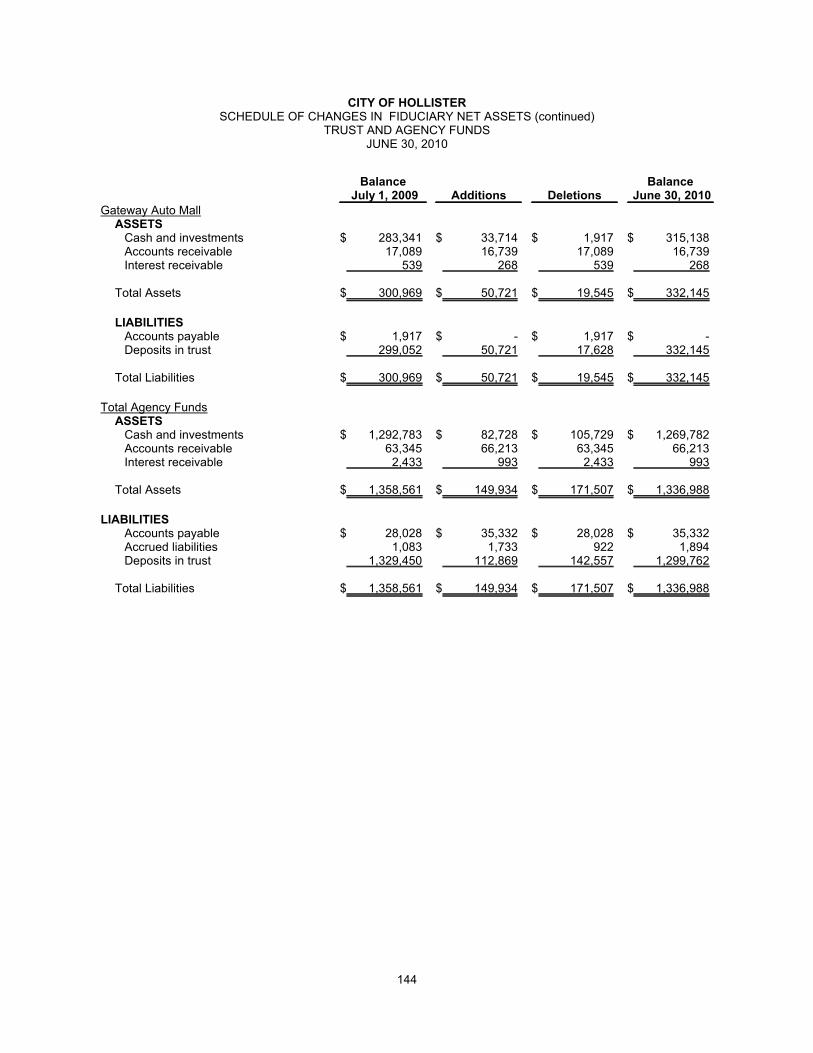
CITY OF HOLLISTERSCHEDULE OF CHANGES IN FIDUCIARY NET ASSETS (continued)
TRUST AND AGENCY FUNDSJUNE 30, 2010
BalanceJuly 1, 2009 Additions Deletions
BalanceJune 30, 2010
Gateway Auto MallASSETS
Cash and investments $ 283,341 $ 33,714 $ 1,917 $ 315,138Accounts receivable 17,089 16,739 17,089 16,739Interest receivable 539 268 539 268
Total Assets $ 300,969 $ 50,721 $ 19,545 $ 332,145
LIABILITIESAccounts payable $ 1,917 $ - $ 1,917 $ -Deposits in trust 299,052 50,721 17,628 332,145
Total Liabilities $ 300,969 $ 50,721 $ 19,545 $ 332,145
Total Agency FundsASSETS
Cash and investments $ 1,292,783 $ 82,728 $ 105,729 $ 1,269,782Accounts receivable 63,345 66,213 63,345 66,213Interest receivable 2,433 993 2,433 993
Total Assets $ 1,358,561 $ 149,934 $ 171,507 $ 1,336,988
LIABILITIESAccounts payable $ 28,028 $ 35,332 $ 28,028 $ 35,332Accrued liabilities 1,083 1,733 922 1,894Deposits in trust 1,329,450 112,869 142,557 1,299,762
Total Liabilities $ 1,358,561 $ 149,934 $ 171,507 $ 1,336,988
144

STATISTICAL SECTION
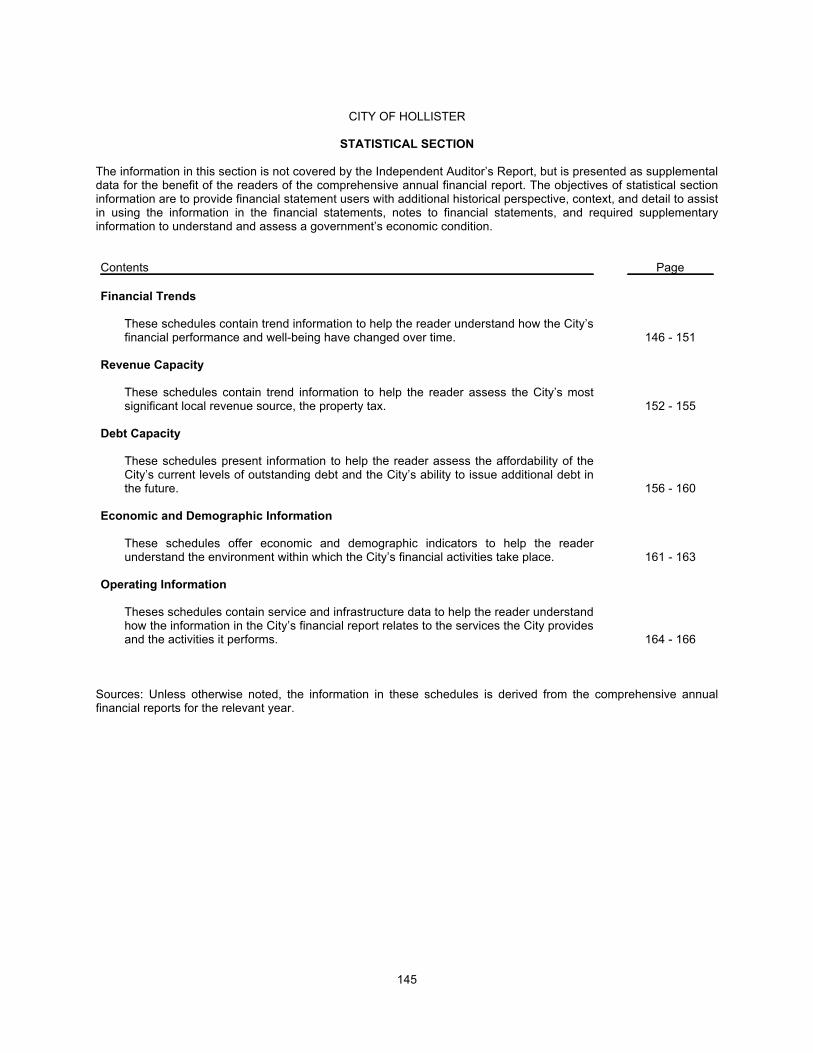
CITY OF HOLLISTER
STATISTICAL SECTION
The information in this section is not covered by the Independent Auditor’s Report, but is presented as supplementaldata for the benefit of the readers of the comprehensive annual financial report. The objectives of statistical sectioninformation are to provide financial statement users with additional historical perspective, context, and detail to assistin using the information in the financial statements, notes to financial statements, and required supplementaryinformation to understand and assess a government’s economic condition.
Contents Page
Financial Trends
These schedules contain trend information to help the reader understand how the City’sfinancial performance and well-being have changed over time. 146 - 151
Revenue Capacity
These schedules contain trend information to help the reader assess the City’s mostsignificant local revenue source, the property tax. 152 - 155
Debt Capacity
These schedules present information to help the reader assess the affordability of theCity’s current levels of outstanding debt and the City’s ability to issue additional debt inthe future. 156 - 160
Economic and Demographic Information
These schedules offer economic and demographic indicators to help the readerunderstand the environment within which the City’s financial activities take place. 161 - 163
Operating Information
Theses schedules contain service and infrastructure data to help the reader understandhow the information in the City’s financial report relates to the services the City providesand the activities it performs. 164 - 166
Sources: Unless otherwise noted, the information in these schedules is derived from the comprehensive annualfinancial reports for the relevant year.
145

2003 2004 2005 2006 2007 (2) 2008 2009 2010
Governmental activities:
92,636,995$ 97,106,893$ 113,969,767$ 116,709,036$ (906,002)$ (1,076,423)$ (1,238,024)$ (403,587)$ Restricted 29,678,279 50,383,527 41,330,000 40,040,000 23,189,297 18,447,194 15,252,460 15,087,344 Unrestricted 34,064,490 4,786,459 (6,798,832) (20,174,810) 18,487,468 32,972,977 40,887,336 35,397,359
156,379,764$ 152,276,879$ 148,500,935$ 136,574,226$ 40,770,763$ 50,343,748$ 54,901,772$ 50,081,116$
Business-type activities:
98,433,891$ 94,392,491$ 98,409,998$ 95,950,871$ 25,021,339$ 36,637,224$ 33,421,263$ 34,874,146$ Restricted 15,621,435 15,210,954 13,810,000 13,886,003 Unrestricted (18,363,847) (20,345,698) (20,970,559) (20,495,761) 3,820,889 3,203,871 10,765,382 13,757,524
95,691,479$ 89,257,747$ 91,249,439$ 89,341,113$ 28,842,228$ 39,841,095$ 44,186,645$ 48,631,670$
Primary government:
191,070,886$ 191,499,384$ 212,379,765$ 212,659,907$ 24,115,337$ 35,560,801$ 32,183,239$ 34,470,559$ Restricted 45,299,714 65,594,481 55,140,000 53,926,003 23,189,297 18,447,194 15,252,460 15,087,344 Unrestricted 15,700,643 (15,559,239) (27,769,391) (40,670,571) 22,308,357 36,176,848 51,652,718 49,154,883
252,071,243$ 241,534,626$ 239,750,374$ 225,915,339$ 69,612,991$ 90,184,843$ 99,088,417$ 98,712,786$
Note 1: The government-wide reporting requirements related to the implementation of GASB 34 were initiated during fiscal year 2002-03. We therefore only have eight years of data available to report.
Note 2: The City changed auditors for the 2006/07 audit. The 2006/07 audit had major readjustments to the City's financial statements.
Source: Finance Department, City of Hollister
CITY OF HOLLISTER, CALIFORNIANET ASSETS by COMPONENTLAST EIGHT FISCAL YEARS
(accrual basis of accounting)
Invested in capital assets, net of related debt
Invested in capital assets, net of related debt
Invested in capital assets, net of related debt
Total governmental activities net assets
Total primary government net assets
Total business-type activities net assets
146

2003 2004 2005 2006 2007 2008 2009 2010
Governmental activities:
Expenses
General government 6,911,718$ 9,135,598$ 10,242,260$ 21,594,223$ 7,393,697$ 7,633,251$ 7,565,001$ 11,496,478$
Public safety 8,447,474 9,265,653 9,606,645 9,958,700 14,770,458 10,569,228 12,510,912 11,725,625
Public works 8,952,829 6,359,419 5,111,662 3,864,120 16,164,892 5,792,244 3,802,923 3,368,100
Recreation 925,768 799,594 458,325 1,366,530 3,595,118 1,512,531 1,772,027 1,576,338
Interest on long-term debt 361,346 3,631,302 1,624,693 2,085,455 2,051,691 2,020,677 1,985,412 2,296,969
25,599,135 29,191,566 27,043,585 38,869,028 43,975,856 27,527,931 27,636,275 30,463,510
Program RevenuesCharges for services:
General government 882,029 1,185,305 967,484 127,642 86,580 1,530,103 1,121,856 Public safety 88,849 13,121 9,188 230,957 646,800 424,451 380,158 513,535 Public works 323,416 102,007 21,060 422,834 172,195 128,191 479,797 1,621,172 Recreation 396,848 318,253 195,206 726,712 285,996 290,548 270,260 498,451
2,919,263 3,270,473 4,465,604 5,144,663 6,205,229 6,059,794 1,362,085 1,116,473
1,040,934 192,620
5,651,339 4,889,159 5,658,542 6,525,166 7,437,862 6,989,564 4,022,403 5,064,107
Net Expense1 (19,947,796) (24,302,407) (21,385,043) (32,343,862) (36,537,994) (20,538,367) (23,613,872) (25,399,403)
General Revenues and TransfersTaxes:
14,577,752 14,387,478 14,361,047 15,470,622 16,248,080 17,115,012 21,280,446 18,544,527 Motor vehicle in lieu (2) 247,267 159,130 136,191 109,581 Licenses, permits, and fees (2) 744,855 470,836
2,468,001 1,897,854 1,605,036 1,997,621 2,722,010 1,732,758 764,469 348,449 Miscellaneous 1,559,425 3,914,190 1,643,016 2,948,910 2,077,720 2,668,418 4,930,074 1,605,007 Transfers (81,622) 38,759 (353,631)
18,605,178 20,199,522 17,609,099 20,417,153 22,039,932 22,064,532 27,149,939 20,253,933
Change in net assets- governmental activities (1,342,618)$ (4,102,885)$ (3,775,944)$ (11,926,709)$ (14,498,062)$ 1,526,165$ 3,536,067$ (5,145,470)$
1 Net expense is the difference between the expenses and program revenues of a function or program. It indicates the degree to which a function or program supports itself with its own fees and grants versus its reliance upon funding from taxes and other general revenues. Numbers in parentheses are net expenses, indicating that expenses were greater than program revenues and general revenues were needed to finance that function or program.
Note 2: The City changed auditors for the 2006/07 audit. The 2006/07 audit had major readjustments to the City's financial statements.
Source: Finance Department, City of Hollister
CITY OF HOLLISTER, CALIFORNIACHANGES IN NET ASSETS
LAST EIGHT FISCAL YEARS(accrual basis of accounting)
Total governmental activities expense
Operating grants and contributionsCapital grants and contributions
Total governmental activities program revenues
Property taxes and other taxes (2)
Unrestricted investment earnings
Total general revenues and transfers
147

2003 2004 2005 2006 2007 2008 2009 2010
Business-Type activities:
ExpensesAirport 579,988$ 775,997$ 676,283$ 754,289$ 746,959$ 807,734$ 873,910$ 852,930$ Water 2,124,645 2,785,903 2,445,174 2,528,405 2,487,804 2,964,693 3,919,817 3,776,513 Wastewater 6,610,919 10,933,663 5,653,507 5,875,070 3,460,118 4,142,410 7,195,980 8,716,397 Street sweeping 260,297 281,139 239,450 498,747 348,990 411,282 363,054 409,517 Briggs Building 84,419 206,683 219,093 223,840 228,233
9,575,849 14,776,702 9,014,414 9,740,930 7,250,554 8,545,212 12,576,601 13,983,590
Program RevenuesCharges for services:
Airport 515,662 492,278 536,114 524,951 590,000 560,947 625,513 697,675 Water 1,910,710 1,926,355 1,896,280 2,478,239 4,291,736 4,124,258 4,170,336 4,117,577 Wastewater 3,713,123 5,353,596 4,557,248 4,080,381 6,593,813 9,282,635 11,147,589 12,730,842 Street sweeping 286,262 287,456 286,882 286,882 316,001 309,352 320,609 318,057 Briggs Building 132,600 122,400 147,050 121,550 122,400
10,000 36,321 Total business-type activities program revenues 6,435,757 8,096,006 7,276,524 7,503,053 11,913,950 14,424,242 16,385,597 17,986,551
Net Expense1 (3,140,092) (6,680,696) (1,737,890) (2,237,877) 4,663,396 5,879,030 3,808,996 4,002,961
General revenues
181,398 246,964 252,759 329,551 3,101,803 3,779,982 575,313 88,433 Miscellaneous 3,476,823
Capital contributions 9,877,090 Transfers 81,622 (38,759) 353,631 Total general revenues 181,398 246,964 3,729,582 329,551 12,978,893 3,861,604 536,554 442,064
Change in net assets -business-type activities (2,958,694)$ (6,433,732)$ 1,991,692$ (1,908,326)$ 17,642,289$ 9,740,634$ 4,345,550$ 4,445,025$
1 Net expense is the difference between the expenses and program revenues of a function or program. It indicates the degree to which a function or program supports itself with its own fees and grants versus its reliance upon funding from taxes and other general revenues. Numbers in parentheses are net expenses, indicating that expenses were greater than program revenues and general revenues were needed to finance that function or program.
Note 2: The City changed auditors for the 2006/07 audit. The 2006/07 audit had major readjustments to the City's financial statements.
Source: Finance Department, City of Hollister
CITY OF HOLLISTER, CALIFORNIACHANGES IN NET ASSETS (continued)
LAST EIGHT FISCAL YEARS(accrual basis of accounting)
Total business-type activities
Capital grants and contributions
Unrestricted investment earnings
148

2003 2004 2005 2006 2007 2008 2009 2010
Primary Government
ExpensesGovernmental activities 25,599,135$ 29,191,566$ 27,043,585$ 38,869,028$ 43,975,856$ 27,527,931$ 27,636,275$ 30,463,510$ Business-type activities 9,575,849 14,776,702 9,014,414 9,740,930 7,250,554 8,545,212 12,576,601 13,983,590
Total primary government 35,174,984 43,968,268 36,057,999 48,609,958 51,226,410 36,073,143 40,212,876 44,447,100
Program RevenuesGovernmental activities 5,651,339 4,889,159 5,658,542 6,525,166 7,437,862 6,989,564 4,022,403 5,064,107 Business-type activities 6,435,757 8,096,006 7,276,524 7,503,053 11,913,950 14,424,242 16,385,597 17,986,551
Total primary government program revenues 12,087,096 12,985,165 12,935,066 14,028,219 19,351,812 21,413,806 20,408,000 23,050,658
Net Expense1
Governmental activities (19,947,796) (24,302,407) (21,385,043) (32,343,862) (36,537,994) (20,538,367) (23,613,872) (25,399,403) Business-type activities (3,140,092) (6,680,696) (1,737,890) (2,237,877) 4,663,396 5,879,030 3,808,996 4,002,961
Total primary government (23,087,888) (30,983,103) (23,122,933) (34,581,739) (31,874,598) (14,659,337) (19,804,876) (21,396,442)
General revenuesGovernmental activities 18,605,178 20,199,522 17,609,099 20,417,153 22,039,932 22,064,532 27,149,939 20,253,933 Business-type activities 181,398 246,964 3,729,582 329,551 12,978,893 3,861,604 536,554 442,064
Total primary government 18,786,576 20,446,486 21,338,681 20,746,704 35,018,825 25,926,136 27,686,493 20,695,997
Change in net assetsGovernmental activities (1,342,618) (4,102,885) (3,775,944) (11,926,709) (14,498,062) 1,526,165 3,536,067 (5,145,470) Business-type activities (2,958,694) (6,433,732) 1,991,692 (1,908,326) 17,642,289 9,740,634 4,345,550 4,445,025
Total primary government change in net assets (4,301,312)$ (10,536,617)$ (1,784,252)$ (13,835,035)$ 3,144,227$ 11,266,799$ 7,881,617$ (700,445)$
1 Net expense is the difference between the expenses and program revenues of a function or program. It indicates the degree to which a function or program supports itself with its own fees and grants versus its reliance upon funding from taxes and other general revenues. Numbers in parentheses are net expenses, indicating that expenses were greater than program revenues and general revenues were needed to finance that function or program.
Note 2: The City changed auditors for the 2006/07 audit. The 2006/07 audit had major readjustments to the City's financial statements.
Note: The government-wide reporting requirements related to the implementation of GASB 34 were initiated during fiscal year 2002-03. We therefore only have eight years of data available to report.
Source: Finance Department, City of Hollister
CITY OF HOLLISTER, CALIFORNIACHANGES IN NET ASSETS (continued)
LAST EIGHT FISCAL YEARS(accrual basis of accounting)
149
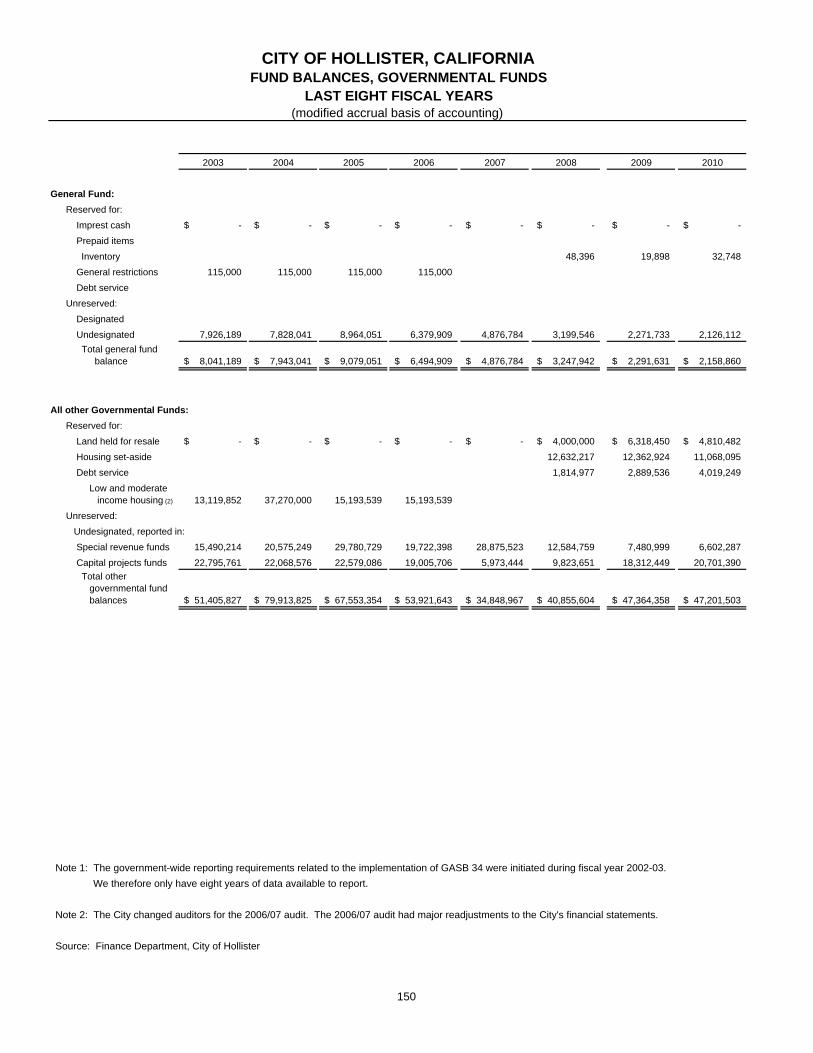
2003 2004 2005 2006 2007 2008 2009 2010
General Fund:Reserved for:
Imprest cash -$ -$ -$ -$ -$ -$ -$ -$ Prepaid itemsInventory 48,396 19,898 32,748
General restrictions 115,000 115,000 115,000 115,000 Debt service
Unreserved:DesignatedUndesignated 7,926,189 7,828,041 8,964,051 6,379,909 4,876,784 3,199,546 2,271,733 2,126,112
8,041,189$ 7,943,041$ 9,079,051$ 6,494,909$ 4,876,784$ 3,247,942$ 2,291,631$ 2,158,860$
All other Governmental Funds:Reserved for:
Land held for resale -$ -$ -$ -$ -$ 4,000,000$ 6,318,450$ 4,810,482$ Housing set-aside 12,632,217 12,362,924 11,068,095 Debt service 1,814,977 2,889,536 4,019,249
13,119,852 37,270,000 15,193,539 15,193,539 Unreserved: Undesignated, reported in:
Special revenue funds 15,490,214 20,575,249 29,780,729 19,722,398 28,875,523 12,584,759 7,480,999 6,602,287 Capital projects funds 22,795,761 22,068,576 22,579,086 19,005,706 5,973,444 9,823,651 18,312,449 20,701,390
51,405,827$ 79,913,825$ 67,553,354$ 53,921,643$ 34,848,967$ 40,855,604$ 47,364,358$ 47,201,503$
Note 1: The government-wide reporting requirements related to the implementation of GASB 34 were initiated during fiscal year 2002-03. We therefore only have eight years of data available to report.
Note 2: The City changed auditors for the 2006/07 audit. The 2006/07 audit had major readjustments to the City's financial statements.
Source: Finance Department, City of Hollister
(modified accrual basis of accounting)
CITY OF HOLLISTER, CALIFORNIAFUND BALANCES, GOVERNMENTAL FUNDS
LAST EIGHT FISCAL YEARS
Total general fund balance
Low and moderate income housing (2)
Total other governmental fund balances
150

2003 2004 2005 2006 2007 2008 2009 2010
REVENUESTaxes 14,482,615$ 14,078,793$ 13,986,568$ 15,470,622$ 16,248,080$ 17,115,012$ 21,416,637$ 18,654,108$ Licenses and permits 418,902 443,940 374,479 422,834 744,855 470,836 1,071,578 2,135,977 Intergovernmental 3,960,198 3,270,473 4,465,604 5,144,663 4,094,614 8,576,806 1,362,085 1,309,093 Charges for services 1,691,142 1,618,686 1,191,888 726,712 979,577 797,352 945,538 1,433,712 Fines and forfeitures 89,598 611,574 152,067 230,957 253,056 132,419 643,202 185,325 Investment earnings 2,468,001 1,897,854 1,605,036 1,997,622 2,722,010 1,732,758 764,469 348,449 Other 1,559,425 3,914,190 6,878,829 2,948,910 2,773,264 2,668,418 4,979,793 1,668,529 Total revenues 24,669,881 25,835,510 28,654,471 26,942,320 27,815,456 31,493,601 31,183,302 25,735,193
EXPENDITURESCurrent:
General government 4,720,607 8,396,502 6,473,962 19,381,237 5,403,623 6,505,756 8,558,338 13,423,444 Public safety 8,310,077 9,134,575 9,424,862 9,811,365 9,584,508 9,928,001 11,283,420 11,258,547 Public works 7,311,765 5,656,227 4,193,602 2,908,309 2,677,150 2,652,311 2,654,005 2,564,064 Recreation 925,768 799,594 458,325 1,366,530 1,224,766 1,247,593 1,517,656 1,322,829
Capital outlay 6,542,366 2,245,001 10,669,368 6,240,401 27,373,522 4,666,628 1,338,440 1,681,738 Debt Service:
Principal 1,295,000 4,575,271 1,230,000 1,289,887 735,000 765,000 795,000 835,000 Interest 571,538 2,167,175 1,926,715 2,045,444 2,067,713 2,036,699 2,001,434 2,686,796 Total expenditures 29,677,121 32,974,345 34,376,834 43,043,173 49,066,282 27,801,988 28,148,293 33,772,418
(5,007,240) (7,138,835) (5,722,363) (16,100,853) (21,250,826) 3,691,613 3,035,009 (8,037,225)
OTHER FINANCING SOURCES (USES)Sales of capital assetTransfers in 436,190 1,285,978 1,183,428 1,075,650 366,242 3,316,231 5,104,018 Transfer out (482,967) (809,261) (6,685,258) (1,075,650) (447,864) (3,277,472) (5,457,649)
35,000,000 8,000,000
(46,777) 35,476,717 (5,501,830) - - (81,622) 38,759 7,646,369
Net change in fund balances (5,054,017)$ 28,337,882$ (11,224,193)$ (16,100,853)$ (21,250,826)$ 3,609,991$ 3,073,768$ (390,856)$
Debt service as a percentage of noncapital expenditures 8.8% 28.1% 15.4% 10.0% 14.8% 13.8% 11.6% 12.2%
Note: The government-wide reporting requirements related to the implementation of GASB 34 were initiated during fiscal year 2002-03. We therefore only have eight years of data available to report.
Source: Finance Department, City of Hollister
LAST EIGHT FISCAL YEARS(modified accrual basis of accounting)
CITY OF HOLLISTER, CALIFORNIACHANGE IN FUND BALANCES, GOVERNMENTAL FUNDS
Excess (deficiency) of revenues over expenditures
Proceeds from issuance of debt Total other financing sources (uses)
151
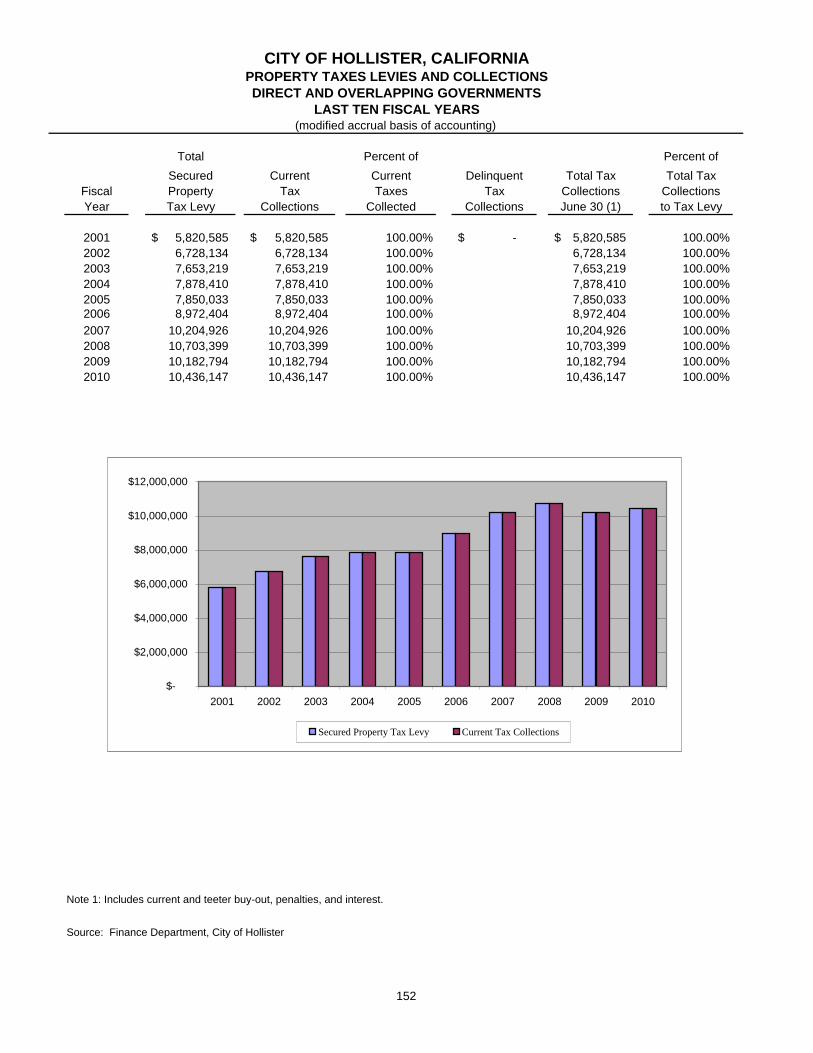
Total Percent of Percent ofSecured Current Current Delinquent Total Tax Total Tax
Fiscal Property Tax Taxes Tax Collections CollectionsYear Tax Levy Collections Collected Collections June 30 (1) to Tax Levy
2001 5,820,585$ 5,820,585$ 100.00% -$ 5,820,585$ 100.00%2002 6,728,134 6,728,134 100.00% 6,728,134 100.00%2003 7,653,219 7,653,219 100.00% 7,653,219 100.00%2004 7,878,410 7,878,410 100.00% 7,878,410 100.00%2005 7,850,033 7,850,033 100.00% 7,850,033 100.00%2006 8,972,404 8,972,404 100.00% 8,972,404 100.00%2007 10,204,926 10,204,926 100.00% 10,204,926 100.00%2008 10,703,399 10,703,399 100.00% 10,703,399 100.00%2009 10,182,794 10,182,794 100.00% 10,182,794 100.00%2010 10,436,147 10,436,147 100.00% 10,436,147 100.00%
Note 1: Includes current and teeter buy-out, penalties, and interest.
Source: Finance Department, City of Hollister
(modified accrual basis of accounting)
CITY OF HOLLISTER, CALIFORNIAPROPERTY TAXES LEVIES AND COLLECTIONSDIRECT AND OVERLAPPING GOVERNMENTS
LAST TEN FISCAL YEARS
$-
$2,000,000
$4,000,000
$6,000,000
$8,000,000
$10,000,000
$12,000,000
2001 2002 2003 2004 2005 2006 2007 2008 2009 2010
Secured Property Tax Levy Current Tax Collections
152
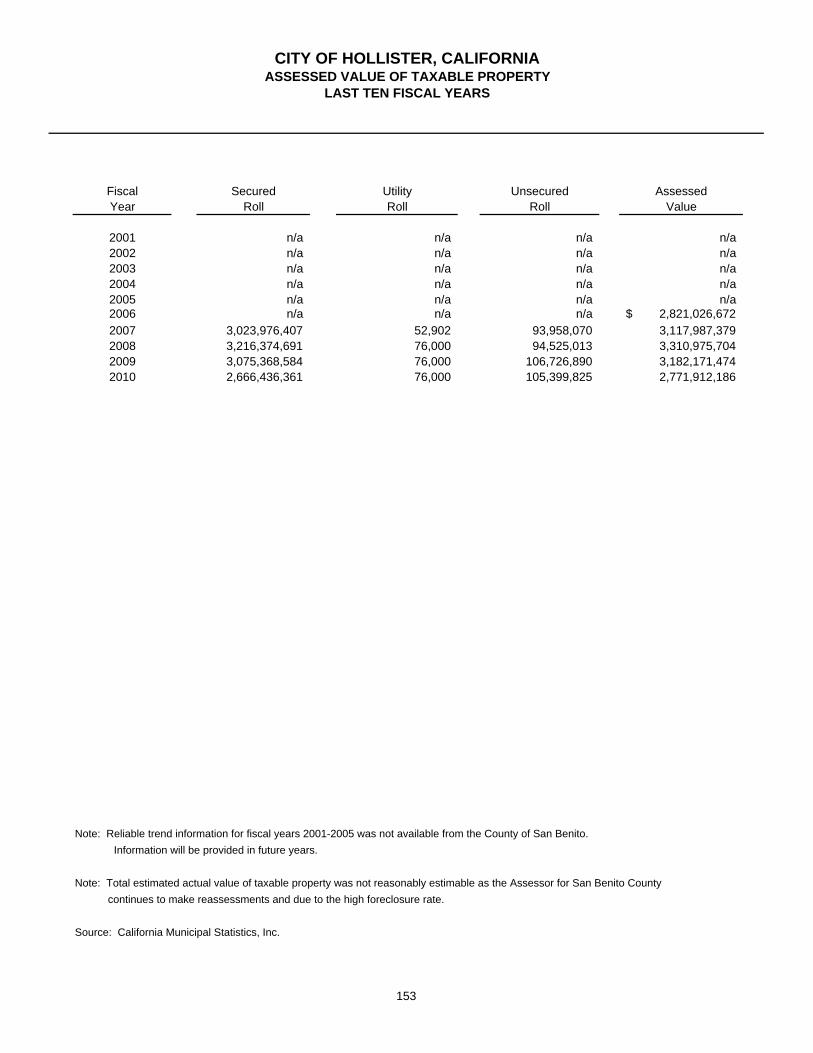
Fiscal Secured Utility Unsecured AssessedYear Roll Roll Roll Value
2001 n/a n/a n/a n/a2002 n/a n/a n/a n/a2003 n/a n/a n/a n/a2004 n/a n/a n/a n/a2005 n/a n/a n/a n/a2006 n/a n/a n/a 2,821,026,672$ 2007 3,023,976,407 52,902 93,958,070 3,117,987,379 2008 3,216,374,691 76,000 94,525,013 3,310,975,704 2009 3,075,368,584 76,000 106,726,890 3,182,171,474 2010 2,666,436,361 76,000 105,399,825 2,771,912,186
Note: Reliable trend information for fiscal years 2001-2005 was not available from the County of San Benito. Information will be provided in future years.
Note: Total estimated actual value of taxable property was not reasonably estimable as the Assessor for San Benito County continues to make reassessments and due to the high foreclosure rate.
Source: California Municipal Statistics, Inc.
CITY OF HOLLISTER, CALIFORNIAASSESSED VALUE OF TAXABLE PROPERTY
LAST TEN FISCAL YEARS
153

BasicFiscal Countywide SpecialYear Levy Schools Districts Total
2001 1.000% 0.0194% 0.2541% 1.2735%2002 1.000% 0.0168% 0.2536% 1.2704%2003 1.000% 0.0560% 0.2533% 1.3093%2004 1.000% 0.0497% 0.2500% 1.2997%2005 1.000% 0.0610% 0.2500% 1.3110%2006 1.000% 0.0231% 0.2750% 1.2981%2007 1.000% 0.0256% 0.2736% 1.2992%2008 1.000% 0.0274% 0.2730% 1.3004%2009 1.000% 0.0273% 0.2734% 1.3007%2010 1.000% 0.0286% 0.2762% 1.3048%
Note: California voters, on June 6, 1978, approved a constitutional amendment to Article XIIIA of the California Constitution,
commonly known as Proposition 13, which limits the taxing power of the California public agencies. Legislation enacted by the California Legislature to implement Article XIIIA (Statutes of 1978 Chapter 292, as amended) provides that not withstanding any other law, local agencies may not levy property tax except to pay debt service on indebtedness approved by voters prior to July 1, 1978, and that each County will levy the maximum tax permitted by
Article XIIIA of $1 per $100 of full cash value. Assessed value is equal to full cash value, pursuant to Senate Bill 1656, Statutes of 1978. The rates shown above are percentages of assessed valuation.
Source: California Municipal Statistics, Inc.
CITY OF HOLLISTER, CALIFORNIAPROPERTY TAX RATES - DIRECT AND OVERLAPPING GOVERNMENTS
LAST TEN FISCAL YEARS
0.0000%
0.2000%
0.4000%
0.6000%
0.8000%
1.0000%
2001 2003 2005 2007 2009
Schools Special Districts Basic Countywide Levy
154

Percentage PercentageAssessed of Total Assessed of Total
Taxpayer Rank Valuation Assessed Rank Valuation Assessed
Lifesparc Inc. 1 56,924,108$ 2.135% n/aK & S Market, Inc. 2 37,014,051 1.388% n/aJanet P. Roberts Family Trust 3 23,392,999 0.877% n/aAward Homes Inc. 4 19,076,523 0.715% n/aMilgard Manufacturing Incorporated 5 16,500,665 0.619% n/a2401 Bert LLC 6 12,775,499 0.479% n/aEdgewood Sunrise North 7 12,530,800 0.470% n/aMarich Confectionery Associates 8 10,954,927 0.411% n/aGeneral Chemical West Liability Co. 9 10,954,741 0.411% n/aDeutsche Bank National Trust Co. 10 10,793,985 0.405% n/a
Largest Secured Property Valuation 210,918,298 7.910% 0.000%
Other Secured Taxpayers 2,455,518,063
Total Secured Property Valuation - net of exemptions 2,666,436,361$ -$
Note 1: In accordance with GASB Statement No. 44, the following table presents information for the City's principal taxpayers as of June 30, 2010 and should also be presented for June 30, 2001. However, June 30, 2001 information isnot available from the County of San Benito. Information will not be presented until there is a nine year separation.
Source: California Municipal Statistics, Inc.
2010 2001 (1)
CITY OF HOLLISTER, CALIFORNIAPRINCIPAL PROPERTY TAX PAYERSCURRENT YEAR AND PRIOR YEAR
155
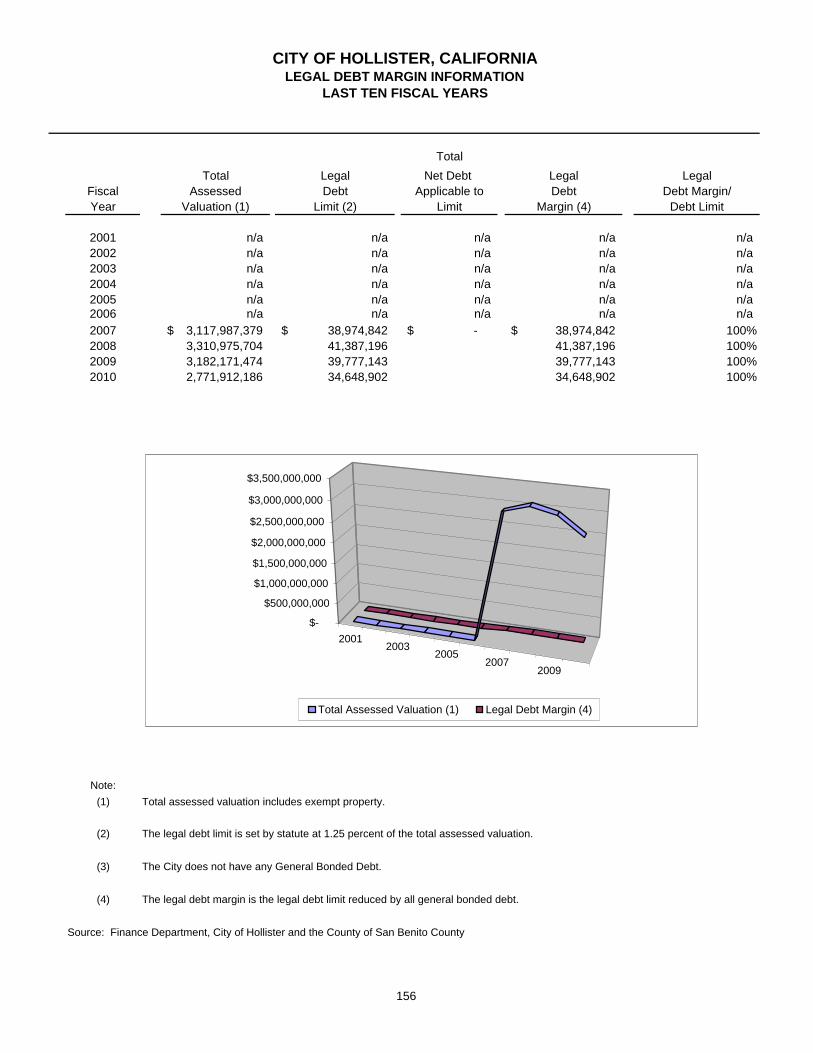
TotalTotal Legal Net Debt Legal Legal
Fiscal Assessed Debt Applicable to Debt Debt Margin/Year Valuation (1) Limit (2) Limit Margin (4) Debt Limit
2001 n/a n/a n/a n/a n/a2002 n/a n/a n/a n/a n/a2003 n/a n/a n/a n/a n/a2004 n/a n/a n/a n/a n/a2005 n/a n/a n/a n/a n/a2006 n/a n/a n/a n/a n/a2007 3,117,987,379$ 38,974,842$ -$ 38,974,842$ 100%2008 3,310,975,704 41,387,196 41,387,196 100%2009 3,182,171,474 39,777,143 39,777,143 100%2010 2,771,912,186 34,648,902 34,648,902 100%
Note:(1) Total assessed valuation includes exempt property.
(2) The legal debt limit is set by statute at 1.25 percent of the total assessed valuation.
(3) The City does not have any General Bonded Debt.
(4) The legal debt margin is the legal debt limit reduced by all general bonded debt.
Source: Finance Department, City of Hollister and the County of San Benito County
CITY OF HOLLISTER, CALIFORNIALEGAL DEBT MARGIN INFORMATION
LAST TEN FISCAL YEARS
20012003
20052007
2009
$-
$500,000,000
$1,000,000,000
$1,500,000,000
$2,000,000,000
$2,500,000,000
$3,000,000,000
$3,500,000,000
Total Assessed Valuation (1) Legal Debt Margin (4)
156

Debt Ratio of Percentage NetGross Payable from Net Bonded of Bonded
Fiscal City Assessed Bonded Enterprise Net Debt to Personal Debt perYear Population (1) Value Debt Revenue (2) Debt Assessed Value Income (1) Capita
2001 35,142$ n/a -$ 15,170,000$ 15,170,000$ n/a n/a 432$ 2002 36,150 n/a 15,928,494 15,928,494 n/a n/a 441 2003 36,618 n/a 15,618,014 15,618,014 n/a n/a 427 2004 36,750 n/a 15,210,954 15,210,954 n/a n/a 414 2005 36,758 n/a 14,775,066 14,775,066 n/a 479 402 2006 36,687 3,112,647,841 14,311,953 14,311,953 0.459% n/a 390 2007 36,707 3,305,136,503 128,248,196 128,248,196 3.873% n/a 3,494 2008 36,878 3,173,866,869 127,660,505 127,660,505 4.012% n/a 3,462 2009 37,054 2,762,160,352 118,953,880 118,953,880 4.291% n/a 3,210 2010 37,301 2,771,912,186 116,983,321 116,983,321 4.220% n/a 3,136
Source:
(1) State of California, Department of Finance(www.dof.ca.gov/research/demographic/reports/estimates/)
(2) Finance Department, City of Hollister
LAST TEN FISCAL YEARS
CITY OF HOLLISTER, CALIFORNIARATIO OF NET GENERAL OBLIGATION BONDED DEBT TO TAXABLE ASSESSED
VALUE AND NET GENERAL OBLIGATION BONDED DEBT PER CAPITA
157
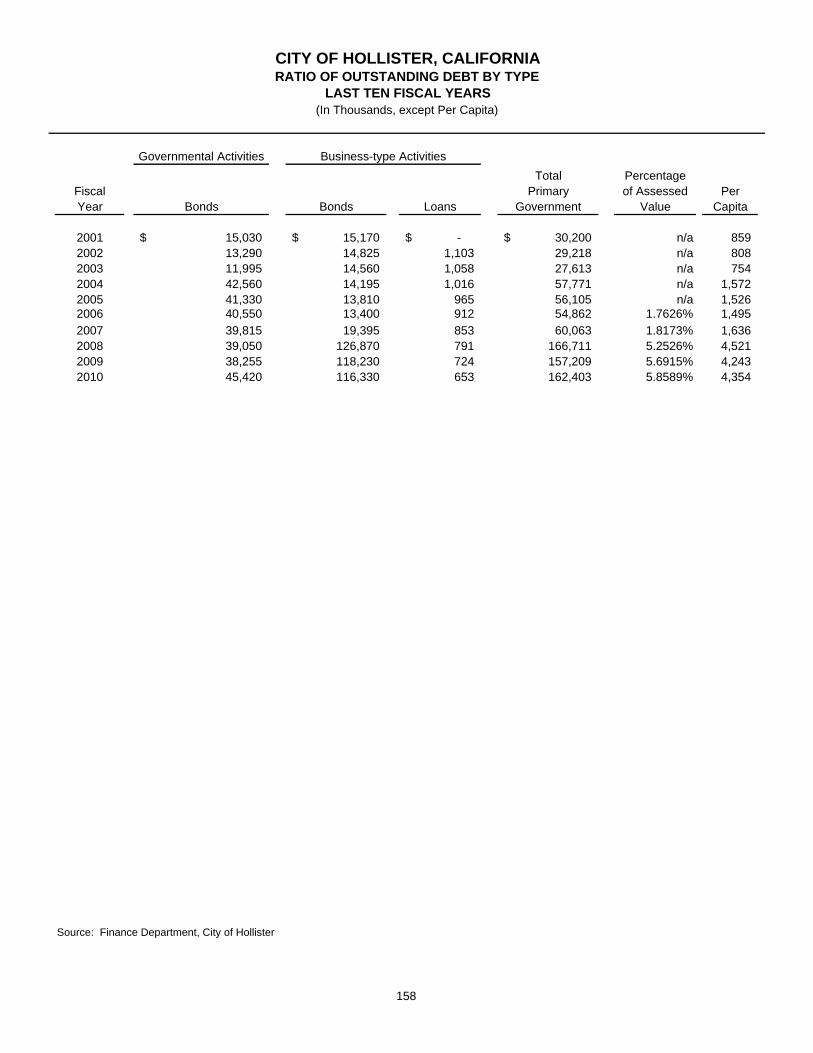
Governmental ActivitiesTotal Percentage
Fiscal Primary of Assessed PerYear Bonds Bonds Loans Government Value Capita
2001 15,030$ 15,170$ -$ 30,200$ n/a 859 2002 13,290 14,825 1,103 29,218 n/a 808 2003 11,995 14,560 1,058 27,613 n/a 754 2004 42,560 14,195 1,016 57,771 n/a 1,572 2005 41,330 13,810 965 56,105 n/a 1,526 2006 40,550 13,400 912 54,862 1.7626% 1,495 2007 39,815 19,395 853 60,063 1.8173% 1,636 2008 39,050 126,870 791 166,711 5.2526% 4,521 2009 38,255 118,230 724 157,209 5.6915% 4,243 2010 45,420 116,330 653 162,403 5.8589% 4,354
Source: Finance Department, City of Hollister
(In Thousands, except Per Capita)
Business-type Activities
CITY OF HOLLISTER, CALIFORNIARATIO OF OUTSTANDING DEBT BY TYPE
LAST TEN FISCAL YEARS
158

2009-10 Assessed Valuation: 2,771,912,186$ Redevelopment Incremental Valuation: 1,069,602,732 Adjusted Assessed Valuation: 1,702,309,454$
Total Debt as of City's Share of Debt Direct and Overlapping Tax and Assessment Debt: June 30, 2010 % Applicable (1) June 30, 2010
Gavilan Joint Community College District 74,535,000$ 7.856% 5,930,005$ Hollister School District 4,115,000 62.053% 2,553,481 North County Joint Union School District 3,314,906 13.494% 447,313 San Benito Healthcare District 30,775,000 35.524% 10,932,511 City of Hollister (1) - 100.000% - City of Hollister 1915 Act Bonds 2,730,000 100.000% 2,730,000
Total Direct and Overlapping Tax and Assessment Debt 22,593,310$
Overlapping General Fund Debt:
San Benito County Certificates of Participation 455,000$ 33.915% 154,313$ Monterey Bay Unified Air Pollution Control Authority 2,440,000 2.181% 53,216
Total Overlapping General Fund Debt 207,529$
Combined Total Debt (2) 22,800,839$
(1) Percentage of overlapping agency's assessed valuation located within boundaries of the City.
(2) Excludes tax and revenue anticipation notes, mortgage revenue and tax allocation bonds and non-bonded capital lease obligations.
Ratios to 2009-10 Assessed Valuation:Direct Debt 0.00%Total Direct and Overlapping Tax and Assessment Debt 0.82%
Ratios to Adjusted Assessed Valuation:Combined Total Debt 1.34%
State School Building Aid Repayable as of 6/30/10: -$
AB: ($425)
Source: California Municipal Statistics, Inc.
CITY OF HOLLISTER, CALIFORNIAOVERLAPPING BONDED DEBT
JUNE 30, 2010
159
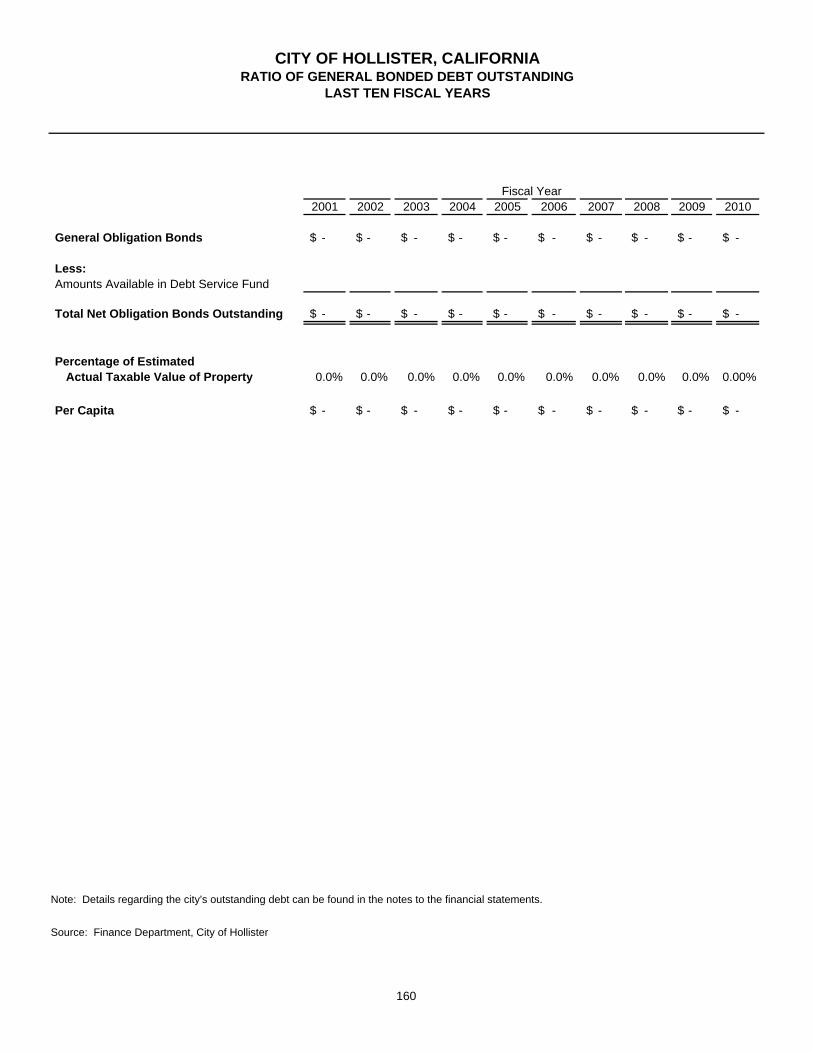
2001 2002 2003 2004 2005 2006 2007 2008 2009 2010
General Obligation Bonds -$ -$ -$ -$ -$ -$ -$ -$ -$ -$
Less:Amounts Available in Debt Service Fund
Total Net Obligation Bonds Outstanding -$ -$ -$ -$ -$ -$ -$ -$ -$ -$
Percentage of EstimatedActual Taxable Value of Property 0.0% 0.0% 0.0% 0.0% 0.0% 0.0% 0.0% 0.0% 0.0% 0.00%
Per Capita -$ -$ -$ -$ -$ -$ -$ -$ -$ -$
Note: Details regarding the city's outstanding debt can be found in the notes to the financial statements.
Source: Finance Department, City of Hollister
Fiscal Year
CITY OF HOLLISTER, CALIFORNIARATIO OF GENERAL BONDED DEBT OUTSTANDING
LAST TEN FISCAL YEARS
160

County of San BenitoCity of County of San Benito Per Capita
Fiscal Hollister Personal Personal School UnemploymentYear Population (1) Income (2) Income (2) Enrollment (3) Rate (4)
2001 35,142 1,579,602,000$ 28,856$ 10,566 5.9%2002 36,150 1,575,049,000 28,531 10,677 9.3%2003 36,618 1,623,818,000 29,327 10,837 10.7%2004 36,750 1,681,863,000 30,534 10,937 9.4%2005 36,758 1,704,973,000 31,041 10,199 8.0%2006 36,687 1,809,212,000 33,228 10,813 7.5%2007 36,707 1,971,598,000 34,874 10,754 7.1%2008 36,878 1,985,792,000 36,239 10,586 10.1%2009 37,054 n/a n/a 10,510 16.0%2010 37,301 n/a n/a 9,907 15.6%
Sources:
(1) State of California, Department of Finance(www.dof.ca.gov/research/demographic/reports/estimates/e-4_2001-07/)
(2) Bureau of Economic Analysis (www.bea.gov/bea/regional/reis/)
(3) Ed-data (www.ed-data.k12.ca.us)
(4) U.S. Bureau of Labor Statistics (www.bls.gov)
CITY OF HOLLISTER, CALIFORNIADEMOGRAPHICS AND ECONOMIC STATISTICS
LAST TEN FISCAL YEARS
161

Percentage Percentageof Total County of Total County
Company Employees Rank Employment Employees Rank Employment
Natural Select Foods 700 1 5.04% n/a n/a n/aHazel Hawkins Memorial Hospital 575 2 4.14% n/a n/a n/aSan Benito Foods 500 3 3.60% n/a n/a n/aPride of San Juan 425 4 3.06% n/a n/a n/aMilgard 330 5 2.37% n/a n/a n/aSan Benito High School District 245 6 1.76% n/a n/a n/aQuantic Holex 240 7 1.73% n/a n/a n/aMcCormick Selph 220 8 1.58% n/a n/a n/aSemifab 200 9 1.44% n/a n/a n/aTarget 167 10 1.20% n/a n/a n/a
Safeway 153 11 1.10% n/a n/a n/aGuerra Nut Shelling Co. Inc. 130 12 0.94% n/a n/a n/aCity of Hollister 117 13 0.84% n/a n/a n/aGranite Rock 112 14 0.81% n/a n/a n/aCable Car Sunglasses 110 15 0.79% n/a n/a n/a
Corbin, Inc. 105 16 0.76% n/a n/a n/aLifesparc Inc. 100 17 0.72% n/a n/a n/aSafety Storage 100 18 0.72% n/a n/a n/aCalifornia PC Products 100 19 0.72% n/a n/a n/aWest Marine 85 20 0.61% n/a n/a n/a
Total 4,714 33.91%
Source: Finance Department, City of Hollister and San Benito County Chamber of Commerce
2010 2001
Major County Employers
CITY OF HOLLISTER, CALIFORNIAPRINCIPAL EMPLOYERS
JUNE 30, 2010 and Nine Years Ago
162

Geographical Location: The City is located at the north end of San Benito County, which is surrounded by Santa Cruz,Santa Clara, Merced, Fresno, and Monterey Counties. The City is located approximately 95miles south of San Francisco, 40 miles south of San Jose, 30 miles northeast of Salinas, and40 miles east of Monterey.
Area of City: 6.6 square miles
County Seat: Hollister, California
Date of Incorporation: August 29, 1872
Form of Government: General Law City, governed by a five-member City Council
Fiscal Year Begins: July 1
City Employees: as of June 30, 2010: 123
Source: Finance Department, City of Hollister
CITY OF HOLLISTER, CALIFORNIAMISCELLANEOUS STATISTICAL INFORMATION
JUNE 30, 2010
163

2007 2008 2009 2010Function/Program
PoliceCriminal Citations Issued 1,976 1,352 2,113 1,184 Parking Citations 401 399 722 950
FireNumber of Calls Received 2,072 1,973 1,921 1,856
Public WorksStreets Resurfacing (Miles) 7 - - - Tons of debris collected
by Street Sweepers 681 708 691 463
Community ServicesFacility Rentals n/a 621 745 745
Community DevelopmentBuilding Inspections Completed 727 604 607 1,960 Total Permits Issued 882 645 647 506
WaterMillion Gallons Water Treated 934 903 1,014 800 Percent of Drinking Water Regulations Met 99% 99% 99% 99%
WastewaterMillion Gallons waster Water Treated 931 807 730 1,000 Miles of Wastewater Collection
System Pipes Cleaned 8.6 23.8 38.2 22.5 Percent of Discharge Requirement Met 99% 99% 99% 95%
AirportHangar/ Buildings Customers 92 92 90 87
Note: Information was not available for ten years' reporting, but will be accumulated over time as it becomes available.Source: Various City Departments, City of Hollister
CITY OF HOLLISTER, CALIFORNIAOPERATING INDICATORS BY FUNCTION
LAST FOUR FISCAL YEARS
For the Fiscal Year Ended June 30,
164

2007 2008 2009 2010Function/Program
PoliceStations 1 1 1 1
FireStations 1 2 2 2
Public WorksStreets (Miles) 95 95 95 95
Community ServicesParks Acreage 58.75 58.75 108.75 108.75 Parks 12 12 13 13 Tennis Courts 3 3 3 3 Community Buildings 3 3 3 3
WaterNumber of Pump Stations/ Booster Stations 1 1 1 1Number of Treatment Plants 1 1 1 1Number of Wells 6 6 6 6
WastewaterNumber of Treatment Plants 2 2 2 2Number of Lift Stations 4 4 4 4
AirportRunways, Taxiways, Ramps, and Hanger
Areas (Paved Surface in sq. ft)(in thousand) 2,455 2,455 2,455 2,455
ParkingNumber of Parking Structures and Lots 10 10 10 10Number of Parking Spaces 425 425 425 425
Note: Information was not available for ten years' reporting, but will be accumulated over time as it becomes available.
Source: Various City Departments, City of Hollister
CITY OF HOLLISTER, CALIFORNIACAPITAL ASSET STATISTICS BY FUNCTION
LAST THREE FISCAL YEARS
For the Fiscal Year Ended June 30,
165
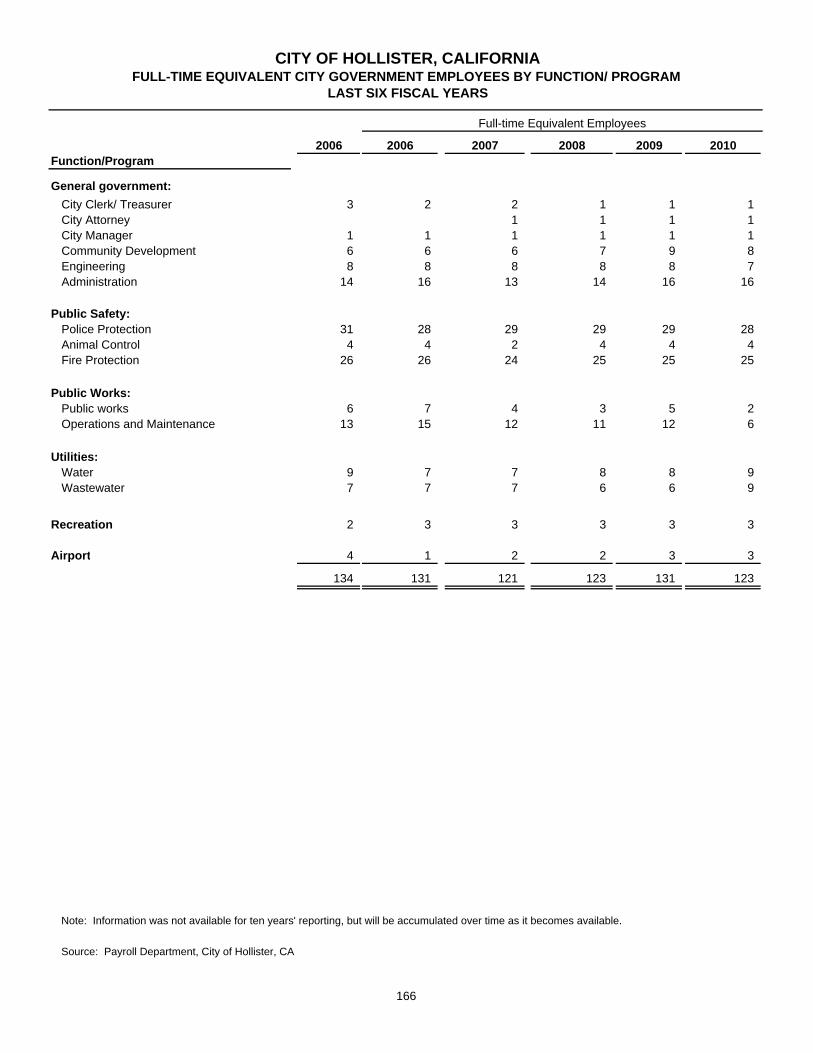
2006 2006 2007 2008 2009 2010Function/Program
General government:City Clerk/ Treasurer 3 2 2 1 1 1 City Attorney 1 1 1 1 City Manager 1 1 1 1 1 1 Community Development 6 6 6 7 9 8 Engineering 8 8 8 8 8 7 Administration 14 16 13 14 16 16
Public Safety:Police Protection 31 28 29 29 29 28 Animal Control 4 4 2 4 4 4 Fire Protection 26 26 24 25 25 25
Public Works:Public works 6 7 4 3 5 2 Operations and Maintenance 13 15 12 11 12 6
Utilities:Water 9 7 7 8 8 9 Wastewater 7 7 7 6 6 9
Recreation 2 3 3 3 3 3
Airport 4 1 2 2 3 3
134 131 121 123 131 123
Note: Information was not available for ten years' reporting, but will be accumulated over time as it becomes available.
Source: Payroll Department, City of Hollister, CA
Full-time Equivalent Employees
CITY OF HOLLISTER, CALIFORNIAFULL-TIME EQUIVALENT CITY GOVERNMENT EMPLOYEES BY FUNCTION/ PROGRAM
LAST SIX FISCAL YEARS
166

GLOSSARY

CITY OF HOLLISTER
GLOSSARY FOR THE COMPREHENSIVE ANNUAL FINANCIAL REPORT
ACCOUNTS PAYABLE. A short-term liability account reflecting amounts owed to private persons or organizationsfor goods and services received by a government.
ACCOUNTS RECEIVABLE. An asset account reflecting amounts due from private persons or organizations forgoods and services furnished by a government (but not including amounts due from other funds or othergovernments).
ACCRUAL BASIS. The recording of the financial effects on a government of transactions and other events andcircumstances that have cash consequences for the government in the periods in which those transactions, eventsand circumstances occur, rather than only in the periods in which cash is received or paid by the government.
ACCUMULATED DEPRECIATION. A contra-asset account used to report the accumulation of periodic credits toreflect the expiration of the estimated service life of capital assets.
ADVANCE FROM OTHER FUNDS. A liability account used to record noncurrent portions of a long-term debt owedby one fund to another fund within the same reporting entity. See DUE TO OTHER FUNDS and INTERFUNDRECEIVABLE/PAYABLE.
ADVANCE TO OTHER FUNDS. An asset account used to record noncurrent portions of a long-term loan from onefund to another fund within the same reporting entity. See DUE FROM OTHER FUNDS.
AGENCY FUND. A fund normally used to account for assets held by a government as an agent for individuals,private organizations or other governments and/or other funds.
AMORTIZATION. (1) The portion of the cost of a limited-life or intangible asset charged as an expense during aparticular period. (2) The reduction of debt by regular payments of principal and interest sufficient to retire the debtby maturity.
APPROPRIATION. A legal authorization granted by a legislative body to make expenditures and to incur obligationsfor specific purposes. An appropriation usually is limited in amount and time it may be expended.
ASSESSED VALUATION. A valuation set upon real estate or other property by a government as a basis for levyingtaxes.
AUDITOR’S REPORT. In the context of a financial audit, a statement by the auditor describing the scope of the auditand the auditing standards applied in the examination, and setting forth the auditor's opinion on the fairness ofpresentation of the financial information in conformity with GAAP or some other comprehensive basis of accounting.
BALANCE SHEET. The financial statement disclosing the assets, liabilities and equity of an entity at a specifieddate in conformity with GAAP.
BASIC FINANCIAL STATEMENTS (BFS). The minimum combination of financial statements and note disclosuresrequired for fair presentation in conformity with GAAP. Basic financial statements have three components:government-wide financial statements, fund financial statements and notes to the financial statements.
BASIS OF ACCOUNTING. A term used to refer to when revenues, expenditures, expenses, and transfers - and therelated assets and liabilities are recognized in the accounts and reported in the financial statements. Specifically, itrelates to the timing of the measurements made, regardless of the nature of the measurement, on either the cash orthe accrual method.
BUDGET. A plan of financial operation embodying an estimate of proposed expenditures for a given period and theproposed means of financing them. Used without any modifier, the term usually indicates a financial plan for a singlefiscal year. The term "budget" is used in two senses in practice. Sometimes it designates the financial planpresented to the appropriating governing body for adoption, and sometimes, the plan finally approved by that body.
BUDGETARY CONTROL. The control or management of a government or enterprise in accordance with anapproved budget to keep expenditures within the limitations of available appropriations and available revenues.
167

CITY OF HOLLISTER
GLOSSARY FOR THE COMPREHENSIVE ANNUAL FINANCIAL REPORT (continued)
CAPITAL ASSETS. Long-lived tangible assets obtained or controlled as a result of past transactions, events orcircumstances. Capital assets include buildings, equipment, and improvements other than buildings, land andinfrastructure. In the private sector, these assets are referred to most often as property, plant and equipment.
CAPITAL EXPENDITURES. Expenditures resulting in the acquisition of or addition to the government's generalcapital assets.
CAPITALIZATION POLICY. The criteria used by a government to determine which outlays should be reported ascapital assets.
CAPITAL LEASE. An agreement that conveys the right to use property, plant or equipment, usually for a statedperiod of time. See LEASE-PURCHASE AGREEMENTS.
CAPITAL PROJECTS FUND. A fund created to account for financial resources to be used for the acquisition orconstruction of major capital facilities (other than those financed by proprietary funds and trust funds).
CASH BASIS. A basis of accounting under which transactions are recognized only when cash is received ordisbursed.
CASH WITH FISCAL AGENT. An asset account reflecting deposits with fiscal agents, such as commercial banks,for the payment of bond principal and interest.
CERTIFICATE OF ACHIEVEMENT FOR EXCELLENCE IN FINANCIAL REPORTING PROGRAM. A voluntaryprogram administered by the GFOA to encourage governments to publish efficiently organized and easily readableCAFR’s and to provide technical assistance and peer recognition to the finance officers preparing them.
CHANGE IN THE FAIR VALUE OF INVESTMENTS. The difference between the fair value of investments at thebeginning of the year and at the end of the year, taking into consideration investment purchases, sales, andredemptions.
COMPENSATED ABSENCES. Absences, such as vacation, illness and holidays, for which it is expected employeeswill be paid. The term does not encompass severance or termination pay, postretirement benefits, deferredcompensation or other long-term fringe benefits, such as group insurance and long-term disability pay.
COMPREHENSIVE ANNUAL FINANCIAL REPORT (CAFR). A financial report that encompasses all funds andcomponent units of the government. The CAFR should contain (a) the basic financial statements and requiredsupplementary information, (b) combining statements to support columns in the basic financial statements thataggregate information from more than one fund or component unit, and (c) individual fund statements as needed.The CAFR is the governmental unit’s official annual report and also should contain introductory information,schedules necessary to demonstrate compliance with finance-related legal and contractual provisions, and statisticaldata.
CONCENTRATION OF CREDIT RISK. The risk of loss attributed to the magnitude of a government’s investment ina single issuer.
CONTINGENT LIABILITY. Items that may become liabilities as a result of conditions undetermined at a given date,such as guarantees, pending lawsuits, judgments under appeal, unsettled disputed claims, unfilled purchase ordersand uncompleted contracts. Contingent liabilities should be disclosed within the financial statements (including thenotes) when there is a reasonable possibility a loss may have been incurred. Guarantees, however, should bedisclosed even though the possibility of loss may be remote.
CREDIT RISK. The risk that an issuer or a counter-party to an investment will not fulfill its obligations.
CURRENT FINANCIAL RESOURCES MEASUREMENT FOCUS. Measurement focus according to which the aim ofa set of financial statements is to report the near-term (current) inflows, outflows, and balances of expendable(spendable) financial resources. The current financial resources measurement focus is unique to accounting andfinancial reporting for state and local governments and is used solely for reporting the financial position and resultsof operations of governmental funds.
168

CITY OF HOLLISTER
GLOSSARY FOR THE COMPREHENSIVE ANNUAL FINANCIAL REPORT (continued)
DEBT. An obligation resulting from the borrowing of money or from the purchase of goods and services. Debts ofgovernments include bonds, time warrants and notes.
DEBT SERVICE FUND. A fund established to account for the accumulation of resources for, and the payment of,general long-term debt principal and interest.
DEFERRED CHARGES. Expenditures that are not chargeable to the fiscal period in which they were made but thatare carried as an asset on the balance sheet, pending amortization or other disposition (e.g. bond issuance costs).Deferred charges differ from prepaid items in that they usually extend over a long period of time (more than fiveyears) and are not regularly recurring costs of operation.
DEFERRED REVENUE. Resource inflows that do not yet meet the criteria for revenue recognition. Unearnedamounts are always reported as deferred revenue. In governmental funds, earned amounts also are reported asdeferred revenue until they are available to liquidate liabilities of the current period.
DEFICIT. (1) The excess of the liabilities of a fund over its assets. (2) The excess of expenditures over revenuesduring an accounting period or, in the case of proprietary funds, the excess of expenses over revenues during anaccounting period.
DEFINED BENEFIT PENSION PLAN. A pension plan having terms that specify the amount of pension benefits to beprovided at a future date or after a certain period of time; the amount specified usually is a function of one or morefactors such as age, years of service, and compensation.
DEPRECIATION. (1) Expiration in the service life of capital assets, other than wasting assets, attributable to wearand tear, deterioration, action of the physical elements, inadequacy and obsolescence. (2) The portion of the cost ofa capital asset, other than a wasting asset, charged as an expense during a particular period. In accounting fordepreciation, the cost of a capital asset, less any salvage value, is prorated over the estimated service life of such anasset, and each period is charged with a portion of such cost. Through this process, the entire cost of the asset isultimately charged off as an expense.
DESIGNATED FUND BALANCE. A portion of an unreserved fund balance that has been "earmarked" by the chiefexecutive officer or the legislative body for specified purposes.
DUE FROM OTHER FUNDS. An asset account used to indicate amounts owed to a particular fund by another fundfor goods sold or services rendered. This account includes only short-term obligations on open account, notinterfund loans.
DUE TO OTHER FUNDS. A liability account reflecting amounts owed by a particular fund to another fund for goodssold or services rendered. These amounts include only short-term obligations on open account, not interfund loans.
ECONOMIC RESOURCES MEASUREMENT FOCUS. Measurement focus under which the aim of a set of financialstatements is to report all inflows, outflows, and balances affecting or reflecting an entity’s net assets. The economicresources measurement focus is used for proprietary and fiduciary funds, as well as for government-wide financialreporting. It is also used by business enterprises in the private sector.
ENCUMBRANCES. Commitments related to unperformed (executory) contracts for goods or services. Used inbudgeting, encumbrances are not GAAP expenditures or liabilities, but represent the estimated amount ofexpenditures ultimately to result if unperformed contracts in process are completed.
ENTERPRISE FUND. Proprietary fund type used to report an activity for which a fee is charged to external users forgoods and services.
EXPENDITURE-DRIVEN GRANTS. Government-mandated or voluntary nonexchange transactions in whichexpenditure is the prime factor for determining eligibility. Also referred to as reimbursement grants.
169
CITY OF HOLLISTER
GLOSSARY FOR THE COMPREHENSIVE ANNUAL FINANCIAL REPORT (continued)
EXCHANGE-LIKE TRANSACTION. Transaction in which there is an identifiable exchange between the reportinggovernment and another party, but the values exchanged may not be quite equal or the direct benefits of theexchange may not be exclusively for the parties to the exchange.
EXPENDITURES. Decreases in net financial resources. Expenditures include current operating expenses requiringthe present or future use of net current assets, debt service and capital outlays, and intergovernmental grants,entitlement and shared revenues.
EXPENSES. Outflows or other using up of assets or incurrences of liabilities (or a combination of both) fromdelivering or producing goods, rendering services or carrying out other activities that constitute the entity's ongoingmajor or central operations.
EXTERNAL AUDITORS. Independent auditors typically engaged to conduct an audit of a government’s financialstatements.
EXTERNAL INVESTMENT POOL. An arrangement that commingles (pools) the moneys of more than one legallyseparate entity and invests, on the participants’ behalf, in an investment portfolio; one or more of the participants isnot part of the sponsors reporting entity. An external investment pool can be sponsored by an individual government,jointly by more than one government, or by a nongovernmental entity. An investment pool that is sponsored by anindividual state or local government is an external investment pool if it includes participation by a legally separateentity that is not part of the same reporting entity as the sponsoring government. If a government-sponsored poolincludes only the primary government and its component units, it is an internal investment pool and not an externalinvestment pool.
FAIR VALUE. The amount at which a financial instrument could be exchanged in a current transaction betweenwilling parties, other than in a forced or liquidation sale.
FEDERAL DEPOSIT INSURANCE CORPORATION. A corporation created by the federal government that insuresdeposits in banks and savings associations.
FIDUCIARY FUNDS. The trust and agency funds used to account for assets held by a government unit in a trusteecapacity or as an agent for individuals, private organizations, other government units and/or other funds.
FINANCIAL RESOURCES. Resources that are or will become available for spending. Financial resources includecash and resources ordinarily expected to be converted to cash (e.g. receivables, investments). Financial resourcesmay also include inventories and pre-paids (because they obviate the need to expend current available resources).
FISCAL AGENT. A fiduciary agent, usually a bank or county treasurer, who performs the function of paying debtprincipal and interest when due.
FOREIGN EXCHANGE RISK. The risk that changes in exchange rate will adversely affect the fair value of aninvestment or a deposit.
FUND. A fiscal and accounting entity with a self-balancing set of accounts in which cash and other financialresources, all related liabilities and residual equities, or balances, and changes therein, are recorded andsegregated to carry on specific activities or attain certain objectives in accordance with special regulations,restrictions or limitations.
FUND BALANCE. The difference between fund assets and fund liabilities of governmental and similar trust funds.
FUND FINANCIAL STATEMENTS. Basic financial statements presented on the basis of funds. Term used incontrast with government-wide financial statements.
FUND TYPE. Any one of seven categories into which all funds are classified in governmental accounting. The sevenfund types are: general, special revenue, debt service, capital projects, enterprise, internal service, and trust andagency.
170

CITY OF HOLLISTER
GLOSSARY FOR THE COMPREHENSIVE ANNUAL FINANCIAL REPORT (continued)
GENERAL REVENUES. All revenues that are not required to be reported as program revenues. All taxes, eventhose that are levied for a specific purpose, are general revenues and should be reported by type of tax – forexample, property tax, sales tax, and transient occupancy tax. All other nontax revenues (including interest, grantsand contributions) that do not meet the criteria to be reported as program revenues should also be reported asgeneral revenues.
GENERAL FUND. The general fund is one of five governmental fund types and typically serves as the chiefoperating fund of the government. The general fund is used to account for all financial resources except thoserequired to be accounted for in another fund.
GENERALLY ACCEPTED ACCOUNTING PRINCIPLES (GAAP). The conventions, rules, and procedures that serveas the norm for the fair presentation of financial statements. The various sources of GAAP for state and localgovernments are set forth by SAS No. 69, The Meaning of “Present Fairly in Conformity with Generally AcceptedAccounting Principles” in the Independent Auditor’s Report.
GOVERNMENTAL ACCOUNTING. The composite activity of analyzing, recording, summarizing, reporting andinterpreting the financial transactions of governments.
GOVERNMENTAL ACCOUNTING STANDARDS BOARD (GASB). The ultimate authoritative accounting andfinancial reporting standard-setting body for state and local governments. The GASB was established in June 1984to replace the National Council on Governmental Accounting (NCGA).
GOVERNMENTAL FUNDS. Funds generally used to account for tax-supported activities. There are five differenttypes of governmental funds: the general fund, special revenue funds, debt service funds, capital projects funds andpermanent funds.
GOVERNMENT-WIDE FINANCIAL STATEMENTS. Financial statements that incorporate all of a government’sgovernmental and business-type activities, as well as its nonfiduciary component units. There are two basicgovernment-wide financial statements: the statement of net assets and the statement of net activities. Both basicgovernmental financial statements are presented using the economic resources measurement focus and the accrualbasis of accounting.
INFRASTRUCTURE. Long-lived capital assets that normally are stationary in nature and normally can be preservedfor a significantly greater number of years than most capital assets. Examples of infrastructure assets include roads,bridges, tunnels, drainage systems, water and sewer systems, dams and lighting systems.
INTEREST RATE RISK. The risk that changes in interest rates will adversely affect the fair value of an investment ora deposit.
INTERFUND RECEIVABLE/PAYABLE. Short-term loans made by one fund to another, or the current portion of anadvance to or from another fund.
INTERFUND TRANSFERS. Flow of assets (such as cash or goods) between funds and blended component units ofthe primary government without equivalent flows of assets in return and without a requirement for payment.
INTERNAL SERVICE FUND. A fund used to account for the financing of goods or services provided by onedepartment or agency to other departments or agencies of a government, or to other governments, on a cost-reimbursement basis.
JOINT VENTURE. A legal entity or other contractual arrangement in which a government participates as a separateand specific activity for the benefit of the public or service recipients and in which the government retains an ongoingfinancial interest.
LAPSE. As applied to appropriations, the automatic termination of an appropriation. Except for indeterminateappropriations and continuing appropriations, an appropriation is made for a certain period of time. At the end of thisperiod, any unexpended or unencumbered balance thereof lapses, unless otherwise provided by law.
171

CITY OF HOLLISTER
GLOSSARY FOR THE COMPREHENSIVE ANNUAL FINANCIAL REPORT (continued)
LEASE-PURCHASE AGREEMENTS. Contractual agreements that are termed leases, but that in substance arepurchase contracts.
LEGAL LEVEL OF BUDGETARY CONTROL. The level at which spending in excess of budgeted amounts would bea violation of law.
LEVEL OF BUDGETARY CONTROL. The level at which a government’s management may not reallocate resourceswithout special approval from the legislative body.
LIABILITIES. Probable future sacrifices of economic benefits, arising from present obligations of a particular entity totransfer assets or provide services to other entities in the future as a result of past transactions or events.
LOANS RECEIVABLE. An asset account reflecting amounts loaned to individuals or organizations external to agovernment, including notes taken as security for such loans. Loans to other funds and governments should berecorded and reported separately.
MAJOR FUND. A governmental fund or enterprise fund reported as a separate column in the basic fund financialstatements. The general fund is always a major fund. Otherwise, major funds are funds whoserevenues/expenditures, assets or liabilities are at least 10 percent of corresponding totals for all government orenterprise funds and at least 5 percent of the aggregate amount for all governmental and enterprise funds for thesame item. Any other government or enterprise fund may be reported as a major fund if the government’s officialsbelieve that fund is particularly important to financial statement users.
MANAGEMENT’S DISCUSSION AND ANALYSIS. A component of required supplementary information used tointroduce the basic financial statements and to provide an analytical overview of the government’s financial activities.
MEASUREMENT FOCUS. A way of presenting an entity’s financial performance and position by considering whichresources are measured (financial or economic) and when the effects of transactions or events involving thoseresources are recognized (the basis of accounting). The measurement focus of government-wide financialstatements, proprietary fund financial statements and fiduciary fund financial statements is economic resources. Themeasurement focus of governmental fund financial statements is current financial resources.
MODIFIED ACCRUAL BASIS. The accrual basis of accounting adapted to the governmental fund-typemeasurement focus. Under it, revenues and other financial resource increments (e.g. bond issue proceeds) arerecognized when they become susceptible to accrual, that is when they become both "measurable" and "available tofinance expenditures of the current period." "Available" means collectible in the current period or soon enoughthereafter to be used to pay liabilities of the current period. Generally, expenditures are recognized when the fundliability is incurred. All governmental funds, expendable trust funds and agency funds are accounted for using themodified accrual basis of accounting.
OTHER FINANCING SOURCES. An increase in current financial resources that is reported separately fromrevenues to avoid distorting revenue trends. The use of the other financing sources category is limited to items soclassified by GAAP.
OPERATING LEASE. A lease dose not transfer ownership rights, risks and rewards from the lessor to the lessee,the lease is called an operation lease and is similar to a rental.
OTHER FINANCING USES. A decrease in current financial resources that is reported separately from expendituresto avoid distorting expenditure trends. The use of other financing uses category is limited to items so classified byGAAP.
OVERLAPPING DEBT. The proportionate share property within each government must bear of the debts of all localgovernments located wholly or in part within the geographic boundaries of the reporting government. Except forspecial assessment debt, the amount of debt of each unit applicable to the reporting unit is arrived at by (1)determining what percentage of the total assessed value of the overlapping jurisdiction lies within the limits of thereporting unit, and (2) applying this percentage to the total debt of the overlapping jurisdiction. Special assessmentdebt is allocated on the basis of the ratio of assessment receivable in each jurisdiction, which will be used wholly orin part to pay off the debt, to total assessments receivable, which will be used wholly or in part for this purpose.
172
CITY OF HOLLISTER
GLOSSARY FOR THE COMPREHENSIVE ANNUAL FINANCIAL REPORT (continued)
PROGRAM REVENUES. Term used in connection with the government-wide statement of activities. Revenues thatderive directly from the program itself or from parties outside the reporting government’s taxpayers or citizenry, as awhole; they reduce the net cost of the function to be financed from the government’s general revenues.
PROPRIETARY FUNDS. Funds that focus on the determination of operating income, changes in net assets (or costrecovery), financial position, and cash flows. There are two different types of proprietary funds: enterprise funds andinternal service funds.
REBATABLE ARBITRAGE. A term used in connection with the reinvestment of the proceeds of tax-exempt debt. Arequirement to remit to the federal government interest revenue in excess of interest costs when the proceeds fromthe sale of tax-exempt securities are reinvested in a taxable money market instrument with a materially higher yield.
REPORTING ENTITY. The oversight unit and all of its component units, if any, that are combined in the CAFR/BFS.
REQUIRED SUPPLEMENTARY INFORMATION. Consists of statements, schedules, statistical data or otherinformation which, according to the GASB, is necessary to supplement, although not required to be a part of thebasic financial statements.
RESERVED FUND BALANCE. The portion of a governmental fund’s net assets that is not available forappropriation.
RESTRICTED ASSETS. Assets whose use is subject to constraints that are either (a) externally imposed bycreditors (such as through debt covenants), grantors, contributors, or laws or regulations of other governments or (b)imposed by law through constitutional provisions or enabling legislation.
RESTRICTED NET ASSETS. A component of net assets calculated by reducing the carrying value of restrictedassets by the amount of any related debt outstanding.
RETAINED EARNINGS. An equity account reflecting the accumulated earnings of an enterprise or internal servicefund.
REVENUE BONDS. Bonds whose principal and interest are payable exclusively from earnings of an enterprise fund.In addition to a pledge of revenues, such bonds sometimes contain a mortgage on the enterprise fund's property.
RISK MANAGEMENT. All the ways and means used to avoid accidental loss or to reduce its consequences if itdoes occur.
SELF-INSURANCE. A term often used to describe the retention by an entity of a risk of loss arising out of theownership of property or from some other cause, instead of transferring that risk to an independent third partythrough the purchase of an insurance policy. It is sometimes accompanied by the setting aside of assets to fund anyrelated losses. Because no insurance is involved, the term self insurance is a misnomer.
SINGLE AUDIT. An audit performed in accordance with the Single Audit Act of 1997 and Office of Management andBudget’s (OMB) Circular A-133, Audits of State and Local Governments and Non- Profit Organizations. The SingleAudit Act allows or requires governments (depending on the amount of federal assistance received) to have oneaudit performed to meet the needs of all federal agencies.
SPECIAL DISTRICT. An independent unit of local government organized to perform a single government function ora restricted number of related functions. Special districts usually have the power to incur debt and levy taxes;however, certain types of special districts are entirely dependent upon enterprise earnings and cannot impose taxes.Examples of special districts are water districts, drainage districts, flood control districts, hospital districts, fireprotection districts, transit authorities, port authorities and electric power authorities.
SPECIAL REVENUE FUND. A fund used to account for the proceeds of specific revenue sources (other thanexpendable trusts or major capital projects) that are legally restricted to expenditure for specified purposes.
173

CITY OF HOLLISTER
GLOSSARY FOR THE COMPREHENSIVE ANNUAL FINANCIAL REPORT (continued)
TAX AND REVENUE ANTICIPATION NOTES (TRANS). Notes issued in anticipation of the collection of taxes andrevenues, usually retirable only from tax collections, and frequently only from the proceeds of the tax and revenueslevy whose collection they anticipate.
TRUST FUNDS. Funds used to account for assets held by a government in a trustee capacity for individuals, privateorganizations, other governments and/or other funds.
UNDESIGNATED UNRESERVED FUND BALANCE. That portion of a fund balance that is available for spending orappropriation and has not been "earmarked" for specified purposes by the chief executive officer or the legislativebody.
UNQUALIFIED OPINION. An opinion rendered without reservation by the independent auditor that financialstatements are fairly presented.
UNRESERVED FUND BALANCE. That portion of a fund balance available for spending or appropriation in thefuture.
UNRESTRICTED NET ASSETS. That portion of net assets that is neither restricted not invested in capital assets(net of related debt).
VARIABLE-RATE INVESTMENT. An investment with terms that provide for the adjustment of its interest rate (suchas the last day of the month or a calendar quarter) and that, upon each adjustment until the final maturity of theinstrument or the period remaining until the principal amount can be recovered through demand, can reasonably beexpected to have a fair value that will be unaffected by interest rate changes.
174

OTHER REPORTS
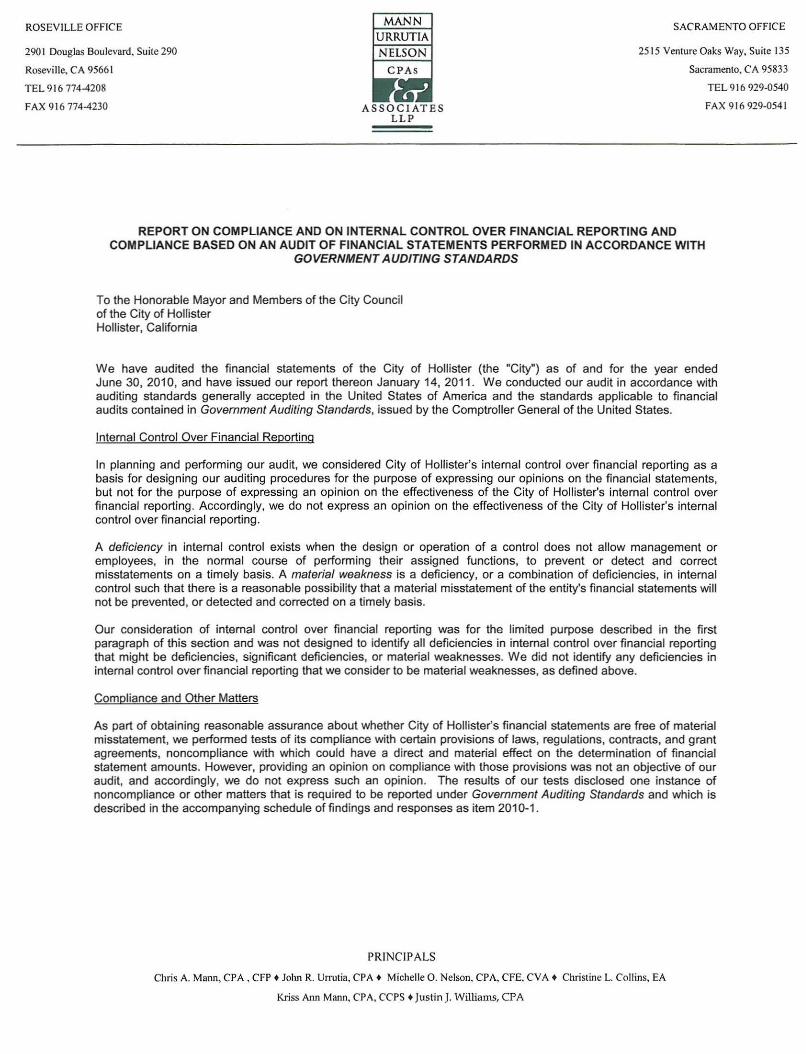
ROSEV ILLE OFFICE
2901 Douglas Boulevard. Suite 290
Roseville. CA 95661
TEL 9 16774-4208
FAX 916 774-4230
MANNURRUTI A
NELSON
CPAs
ASSOCIATESLLP
SACRAMENTO OFFICE
2515 Venture Oaks Way. Suite 135
Sacra mento. CA 95833
TEL9 I6 929-0540
FAX 916929-0541
REPORT ON COMPLIANCE AND ON INTERNAL CONTROL OVER FINANCIAL REPORTING ANDCOMPLIANCE BASED ON AN AUDIT OF FINANCIAL STATEMENTS PERFORMED IN ACCORDANCE WITH
GOVERNMENT AUDITING STANDARDS
To the Honorable Mayor and Members of the City Counci lof the City of HollisterHollister, California
We have audi ted the financial statements of the City of Hollister (the "City") as of and for the year endedJune 30, 2010, and have issued our report thereon January 14, 2011. We conducted our aud it in accordance withauditing standards generally accepted in the United States of America and the standards applicable to fina ncialaudits contained in Government Auditing Standards, issued by the Comptroller General of the United States .
Internal Control Over Financial Reporting
In planning and performing our audit, we considered City of Hollister's internal contro l over financial reporting as abasis for designing our auditing procedures for the purpose of expressing our opinions on the financial statements,but not for the purpose of expressing an opinion on the effectiveness of the City of Hollister's internal contro l overfinancial reporting. Accordingl y, we do not express an opinion on the effectiveness of the City of Hollister's internalcontro l over financial reporting .
A deficiency in internal control exists when the design or operation of a control does not allow management oremployees, in the normal course of performi ng thei r assig ned functions, to prevent or detect and correctmisstatements on a timely basis. A material weakness is a deficiency, or a combination of defic iencies, in internalcontrol such that there is a reasonable possibi lity that a material misstatement of the entity 's financial statements willnot be prevented , or detected and corrected on a timely basis .
Our consideration of internal control over financial reporting was for the limited purpose described in the firstparagraph of this sect ion and was not designed to identify all deficiencies in internal control over financial reportingthat might be deficiencies, significant deficiencies, or material weaknesses. We did not identify any deficiencies ininternal control over financial reporting that we consider to be materia l weaknesses, as defined above .
Compliance and Other Mallers
As part of obtaining reasonable assurance abou t whether City of Hollister's financial statements are free of materialmisstatem ent. we performed tests of its compliance with certai n provisions of laws, regulations , contracts, and grantagreements, noncompliance with which could have a direct and material effect on the determination of financialstatement amounts. However, providing an opinion on compliance with those provisions was not an objective of ouraudit , and acco rdingly, we do not express such an opinion. The results of our tests disclosed one instance ofnoncompliance or other matters that is required to be reported under Government Auditing Standards and which isdescribed in the accom panying sched ule of findings and responses as item 2010- 1.
PRINC IPALS
Chris A. Mann. CPA, CFP . John R. Urrutia. CPA . Michelle O. Nelson, CPA. CFE. eVA . Christine L. Collins, EA
Kriss Ann Mann. CPA, eeps . Ju stin J. Williams, CPA

We noted certain matters that we reported to management of the City of Hollister in a separate letter dated January14,2011.
The City of Hollister's response to the finding identified in our audit is described in the accompanying schedule offindings and responses. We did not audit the City of Hollister's response, and accordingly, we express no opinion onit.
This report is intended solely for the information and use of management, City Council, others within the entity, theBoard of Trustees, and federal awarding agencies and pass-through entities and is not intended to be used byanyone other than these specified parties.
Wwu--- UrYtd;a ~UY'{j?~'Sacrl.mento, California UJanuary 14, 2011
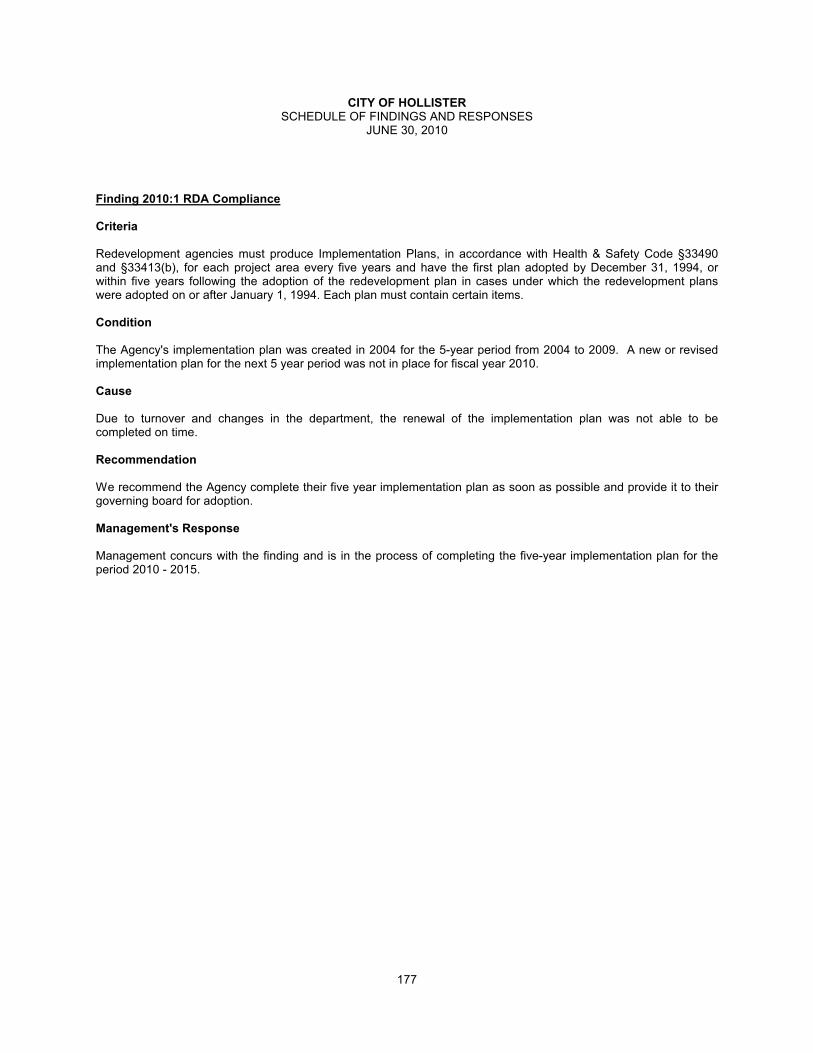
CITY OF HOLLISTERSCHEDULE OF FINDINGS AND RESPONSES
JUNE 30, 2010
Finding 2010:1 RDA Compliance
Criteria
Redevelopment agencies must produce Implementation Plans, in accordance with Health & Safety Code §33490and §33413(b), for each project area every five years and have the first plan adopted by December 31, 1994, orwithin five years following the adoption of the redevelopment plan in cases under which the redevelopment planswere adopted on or after January 1, 1994. Each plan must contain certain items.
Condition
The Agency's implementation plan was created in 2004 for the 5-year period from 2004 to 2009. A new or revisedimplementation plan for the next 5 year period was not in place for fiscal year 2010.
Cause
Due to turnover and changes in the department, the renewal of the implementation plan was not able to becompleted on time.
Recommendation
We recommend the Agency complete their five year implementation plan as soon as possible and provide it to theirgoverning board for adoption.
Management's Response
Management concurs with the finding and is in the process of completing the five-year implementation plan for theperiod 2010 - 2015.
177
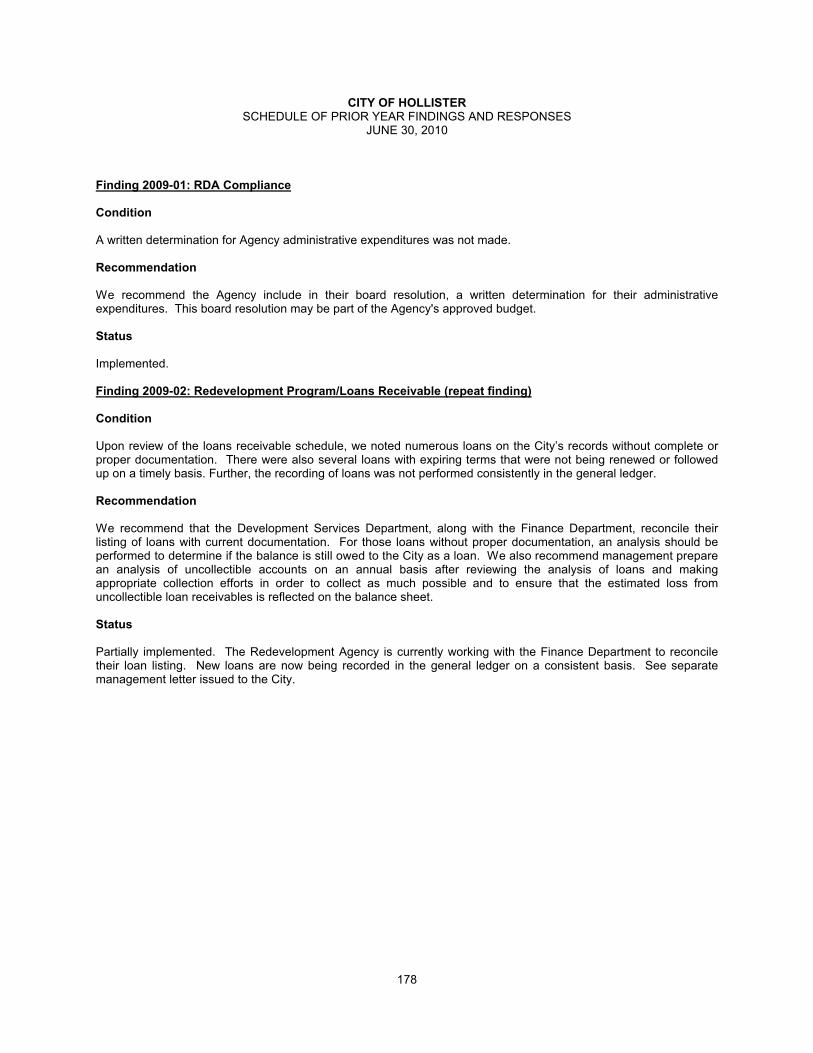
CITY OF HOLLISTERSCHEDULE OF PRIOR YEAR FINDINGS AND RESPONSES
JUNE 30, 2010
Finding 2009-01: RDA Compliance
Condition
A written determination for Agency administrative expenditures was not made.
Recommendation
We recommend the Agency include in their board resolution, a written determination for their administrativeexpenditures. This board resolution may be part of the Agency's approved budget.
Status
Implemented.
Finding 2009-02: Redevelopment Program/Loans Receivable (repeat finding)
Condition
Upon review of the loans receivable schedule, we noted numerous loans on the City’s records without complete orproper documentation. There were also several loans with expiring terms that were not being renewed or followedup on a timely basis. Further, the recording of loans was not performed consistently in the general ledger.
Recommendation
We recommend that the Development Services Department, along with the Finance Department, reconcile theirlisting of loans with current documentation. For those loans without proper documentation, an analysis should beperformed to determine if the balance is still owed to the City as a loan. We also recommend management preparean analysis of uncollectible accounts on an annual basis after reviewing the analysis of loans and makingappropriate collection efforts in order to collect as much possible and to ensure that the estimated loss fromuncollectible loan receivables is reflected on the balance sheet.
Status
Partially implemented. The Redevelopment Agency is currently working with the Finance Department to reconciletheir loan listing. New loans are now being recorded in the general ledger on a consistent basis. See separatemanagement letter issued to the City.
178