
City of Foley
157
City of Foley Fiscal Year 2020 Budget October 1, 2019 - September 30, 2020
Transcript of City of Foley

City of Foley
Fiscal Year 2020
Budget
October 1, 2019 -
September 30, 2020

This Page Intentionally Left Blank
2

City of Foley, Alabama
Fiscal Year 2020 Budget
Table of Contents
Page
Cover Page 1
Table of Contents 3
Budget Resolution 5
Map of City Location 8
Elected and Appointed Officials 9
City Organizational Chart 10
General Fund Cash Flow Summary 11
Management's Budget Message 13
Budget Process 17
Fund Structure 23
Financial Summaries - Adopted Budgets 27
City Wide Consolidated 28
General Fund 31
Fire AdValorem Fund 35
Library Fund 36
Recreational Activities Fund 37
Gas Tax Fund 38
Court Corrections Fund 39
Jail Corrections Fund 40
Foley Sports Tourism - Event Center Operations 41
Foley Sports Tourism - Multi-Use Fields Operations 42
Public Facilities Cooperative District 43
Public Athletic & Sports Facilities Cooperative District 44
Public Cultural & Entertainment Facilities Cooperative District 45
2006A Series General Obligation Warrant Fund 46
2009 Series General Obligation Warrant Fund 47
Qualified Energy Conservation Bonds of 2013 48
Economic Incentives Fund 49
2014 Series General Obligation Warrant Fund 50
2015 Series General Obligation Warrant Fund 51
2019 Series General Obligation Warrant Fund 52
Coastal Alabama Farmers' and Fishermen's Market, Inc. 53
Departmental Descriptions with Financial Summaries and Personnel Information 54
General Government
General Government 55
Municipal Complex 59
Municipal Court 61
Information Technology 63
Maintenance Shop 65
Public Works 66
Airport 67
Public Safety
Police 68
Fire 71
Community Development 73
Environmental 75
3

City of Foley, Alabama
Fiscal Year 2020 Budget
Table of Contents
Page
Highway and Streets
Street 77
Engineering 79
Sanitation 80
Recreation
Parks 81
Library 82
Recreation 86
Sports Tourism 88
Horticulture 90
Marketing 92
Senior Center 94
Beautification 95
Nature Parks 96
Fund Balance Analysis 99
Major Revenues 99
Major Expenses 105
Capital Expenditures and Long Range Plans 112
Debt 139
Statistics 145
Glossary 150
4

5

6

7
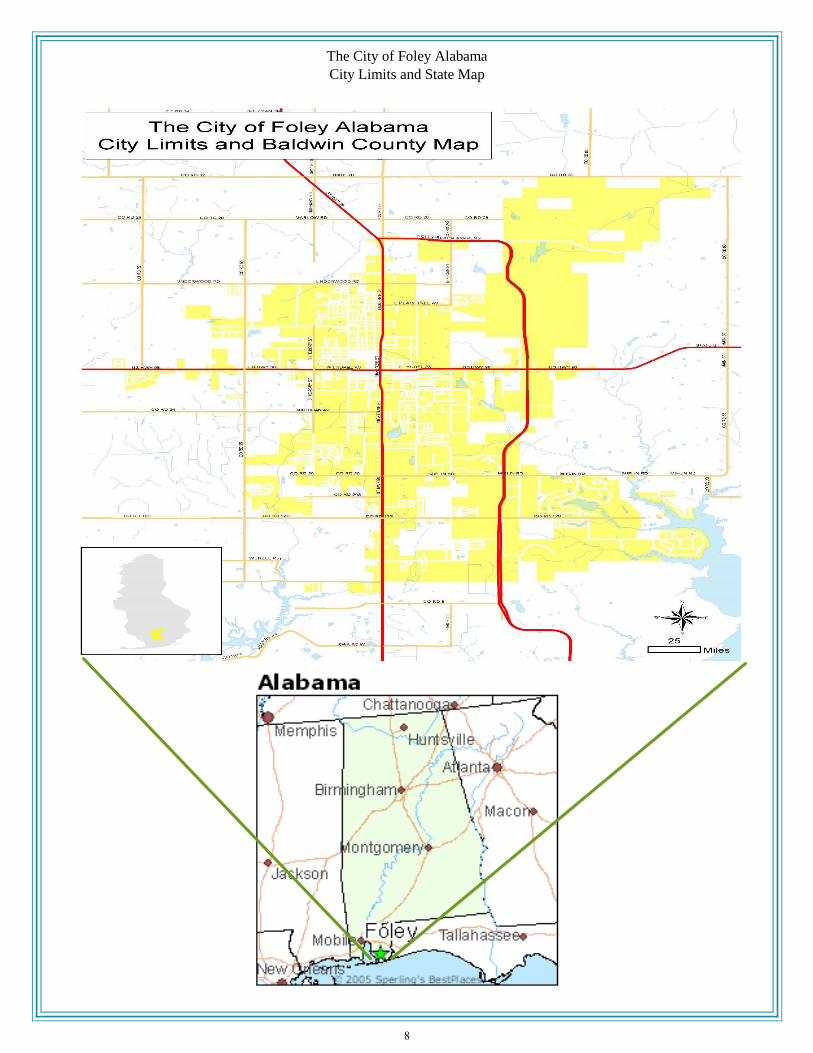
The City of Foley Alabama
City Limits and State Map
8

The City of Foley, Alabama
Elected and Appointed Officials
Year Ended September 30, 2020
ELECTED OFFICIALS
Mayor John E. Koniar
Council Member – District 1/Council President J. Wayne Trawick
Council Member – District 2 Vera Quaites
Council Member – District 3/Council President Pro Tempore Ralph G. Hellmich
Council Member – District 4 Cecil R. (Rick) Blackwell
Council Member – District 5 Charles J. Ebert, III
APPOINTED OFFICIALS
Administrator Michael Thompson
Clerk Kathryn Taylor
Human Resources Director Sandra Pate
Finance Director/Treasurer Sue Steigerwald
Fire Chief Joseph Darby
Police Chief David Wilson
Planner Miriam Boutwell
Engineer Chad Christian
Municipal Judge Mary Murchison
Assistant Municipal Judge Judy Newcomb
City Prosecutor Mike Dasinger
9
City PlannerMiriam Boutwell
Planning & ZoningInspectionsPermitting
Code EnforcementHistoric District
Community Development
City EngineerChad Christian
Land Disturbance PermitsDetention Requirements
Engineering
Fire ChiefJoey Darby
PreventionTraining
Education
Fire
Library DirectorJohn Jackson
Adult & Children ProgramsComputer Lab
Reference
Library
Municipal Complex DirectorPam Harris
Building MaintenanceCivic Center
Custodial Care
Municipal Complex
Clerk/AdministratorBrandy Springsteen
Criminal Domestic
Traffic
Municipal Court
Parks SuperintendentGary Deisner
Parks MaintenanceSpecial Event Support
Parks
HorticulturistJohn Graham
Flower BedsHanging Baskets
GreenhouseTree Care
Horticulture
Police ChiefDavid Wilson
Animal ControlDispatch
InvestigationPatrol
School Resource Officer
Police
Public Works SuperintendentDarrell Russell
Maintenance ShopPublic Works
StreetSanitation
Public Works
Sports DirectorDavid Thompson
AthleticsCity League Sports
EventsPark Rentals
Pools
Recreation
Senior Center DirectorPam Harris
Senior AwarenessVarious Activities
Senior Center
Marketing DirectorLaDonna Hinesley
MarketingPromotionTourism
Welcome CenterCity Museums
Marketing
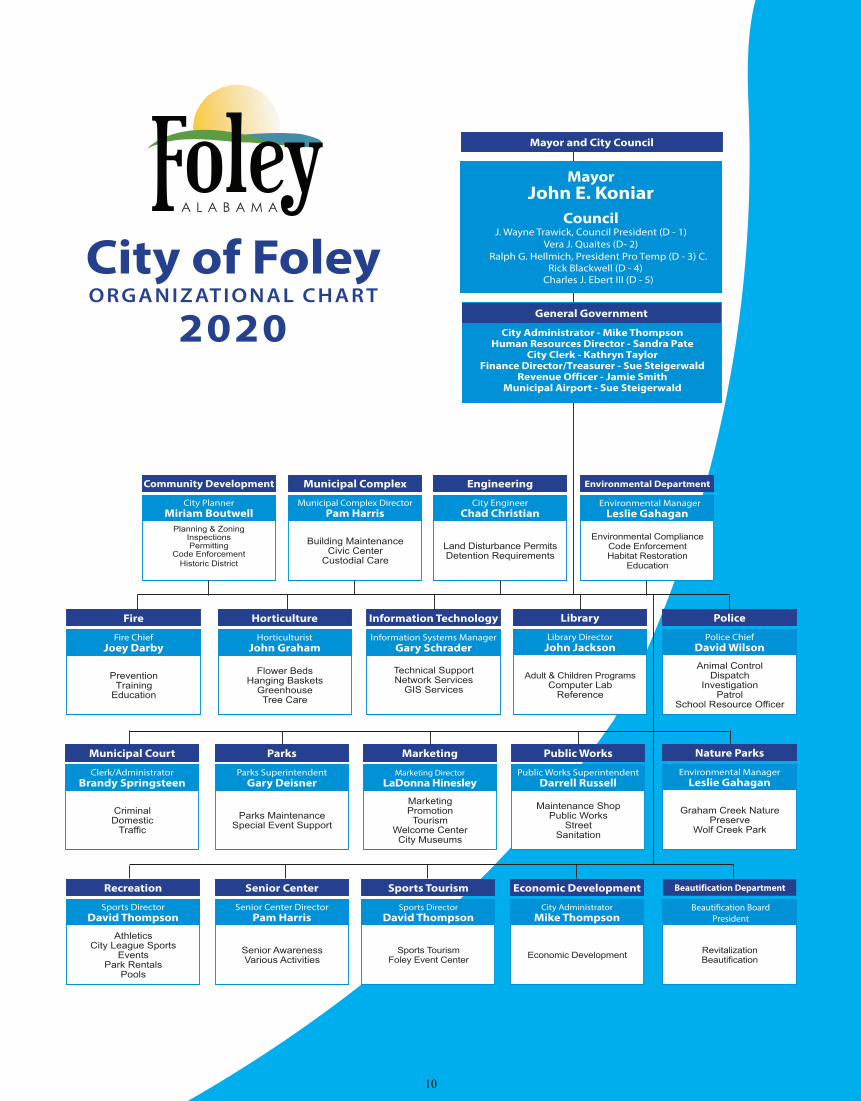
MayorJohn E. Koniar
CouncilJ. Wayne Trawick, Council President (D - 1)
Vera J. Quaites (D- 2)Ralph G. Hellmich, President Pro Temp (D - 3) C.
Rick Blackwell (D - 4) Charles J. Ebert III (D - 5)
Mayor and City Council
City of FoleyORGANIZ ATIONAL CHAR T
2020
Foley A L A B A M A
City AdministratorMike Thompson
Economic Development
Economic Development
Sports DirectorDavid Thompson
Sports TourismFoley Event Center
Sports Tourism
Information Systems ManagerGary Schrader
Technical SupportNetwork Services
GIS Services
Information Technology
Environmental ManagerLeslie Gahagan
Environmental ComplianceCode EnforcementHabitat Restoration
Education
Environmental Department
General GovernmentCity Administrator - Mike Thompson
Human Resources Director - Sandra Pate City Clerk - Kathryn Taylor
Finance Director/Treasurer - Sue Steigerwald Revenue Officer - Jamie Smith
Municipal Airport - Sue Steigerwald
General Government
Revitalization Beautification
Environmental ManagerLeslie Gahagan
Graham Creek Nature Preserve
Wolf Creek Park
Nature Parks
Beautification Department
Beautification Board President
10

FY19 Original FY19 Current FY 19 Variances FY20 Variances
Budget Budget Projections Pos. (Neg) Budget Draft vs Proj
General Fund Cash Flow Analysis
Unassigned Fund Balance (Cash & receivables net of Liabilities, 10/1/18) 11,690,576 11,690,576 11,690,576 - 11,364,277 (326,299)
Revenues 43,723,678 43,939,916 45,636,414 1,696,498 47,955,736 2,319,322
Revenues-One time - 132,750 132,750 - - (132,750)
Expenses (33,114,619) (33,492,395) (32,760,922) 731,473 (36,025,156) (3,264,234)
Expenses-One time (750,000) - - - - -
Revenue over/(under) expenses 9,859,059 10,580,271 13,008,242 2,427,971 11,930,580 (1,077,662)
Transfers in and other financing sources:
Sale of Assets 80,000 85,000 55,000 (30,000) 80,000 25,000
Trans from recreation activities fund 100,000 100,000 90,000 (10,000) 70,000 (20,000)
Trans from gas tax-eligible projects 80,000 80,000 80,000 - 140,000 60,000
Trans from Co-op districts (project user fees) 2,203,000 2,346,902 2,350,902 4,000 2,802,400 451,498
Trans from other funds - 10,000 10,000 - - (10,000)
Total transfers in and other financing sources 2,463,000 2,621,902 2,585,902 (36,000) 3,092,400 506,498
Transfers to debt service funds
Trans to 2006 A warrant fund (1,053,104) (1,053,104) (1,053,104) - (1,048,152) 4,952
Trans to 2009 Warrant fund (157,675) (157,675) (147,865) 9,810 - 147,865
Trans to 2013 QECB fund (124,578) (124,578) (125,159) (581) (127,050) (1,891)
Trans to 2014 Warrant fund (1,496,662) (1,496,662) (1,496,662) - (1,496,929) (267)
Trans to 2015 Warrant fund (449,667) (449,667) (449,667) - (451,167) (1,500)
Trans to 2019 Warrant fund - - - - (283,042) (283,042)
Trans to Economic Incentive fund-McVill-Centennial Bank LOC (223,002) (223,002) (223,002) - (223,002) -
Trans to Economic Incentive fund-UTC-M&M Bank LOC (515,774) (515,774) (515,774) - (515,775) (1)
Trans to PFCD Debt Service (1,604,465) (1,604,465) (1,499,072) 105,393 (338,928) 1,160,144
Trans to PASFCD Debt Service (496,853) (496,853) (496,853) - (496,853) -
Trans to PCEFCD Debt Service (919,940) (919,940) (919,940) - (920,365) (425)
Total Transfers to debt service funds (7,041,720) (7,041,720) (6,927,098) 114,622 (5,901,263) 1,025,835
Revenues & Transfers in over (under) expenses & debt service 5,280,339 6,160,453 8,667,046 2,506,593 9,121,717 454,671
Transfer to other funds
Trans to fire advalorem fund (120,000) (120,000) (120,000) - - 120,000
Trans to FST-event center operations (264,200) (264,200) (319,262) (55,062) (286,550) 32,712
Trans to PASFCD-operations (50,000) (2,116,834) (2,116,934) (100) (1,600) 2,115,334
Trans to FST-multi-use fields operations (304,935) (339,935) (347,480) (7,545) (346,600) 880
Trans to PCEFCD-operations (50,000) (1,155,332) (1,155,332) - (1,600) 1,153,732
Trans to capital projects fund (4,566,979) (4,540,079) (5,140,813) (600,734) (4,806,395) 334,418
Total Transfes to other funds (5,356,114) (8,536,380) (9,199,821) (663,441) (5,442,745) 3,757,076
11

FY19 Original FY19 Current FY 19 Variances FY20 Variances
Budget Budget Projections Pos. (Neg) Budget Draft vs Proj
Total Transfers out (12,397,834) (15,578,100) (16,126,919) (548,819) (11,344,008) 4,782,911
General Fund operations net of transfers (75,775) (2,375,927) (532,775) 1,843,152 3,678,972 4,211,747
General Fund expenses covered by restricted cash (MCJAF) 151,100 223,571 206,476 (17,095) 6,500 (199,976)
General Fund operations net of transfer & restricted cash 75,325 (2,152,356) (326,299) 1,826,057 3,685,472 4,011,771
Total Projected ending Unrestricted Cash Balance 11,765,901$ 9,538,220$ 11,364,277$ 1,826,057$ 15,049,749$ 3,685,472$
Undesignated Fund Balance Goal FY 19 OB FY 20 OB
Budgeted Operational Expenses 33,114,619$ 36,025,156$
Debt Service Expense 7,041,720 5,901,263
Less PUF Grants, offset by transfers in (1,621,250) (2,178,875)
Total expenditures used in calculation 38,535,089 39,747,544
25% of total expenditures equals min. fund balance goal 9,633,772$ 9,936,886$
12

Budget Message
13
MAYOR John E. Koniar CITY ADMINISTRATOR Michael L. Thompson
COUNCIL MEMBERS J. Wayne Trawick Vera J. Quaites Ralph G. Hellmich Cecil R. Blackwell Charles J. Ebert III
407 East Laurel Avenue (251) 943-1545 P.O. Box 1750 Fax (251) 952-4014 Foley, Alabama 36536 www.cityoffoley.org
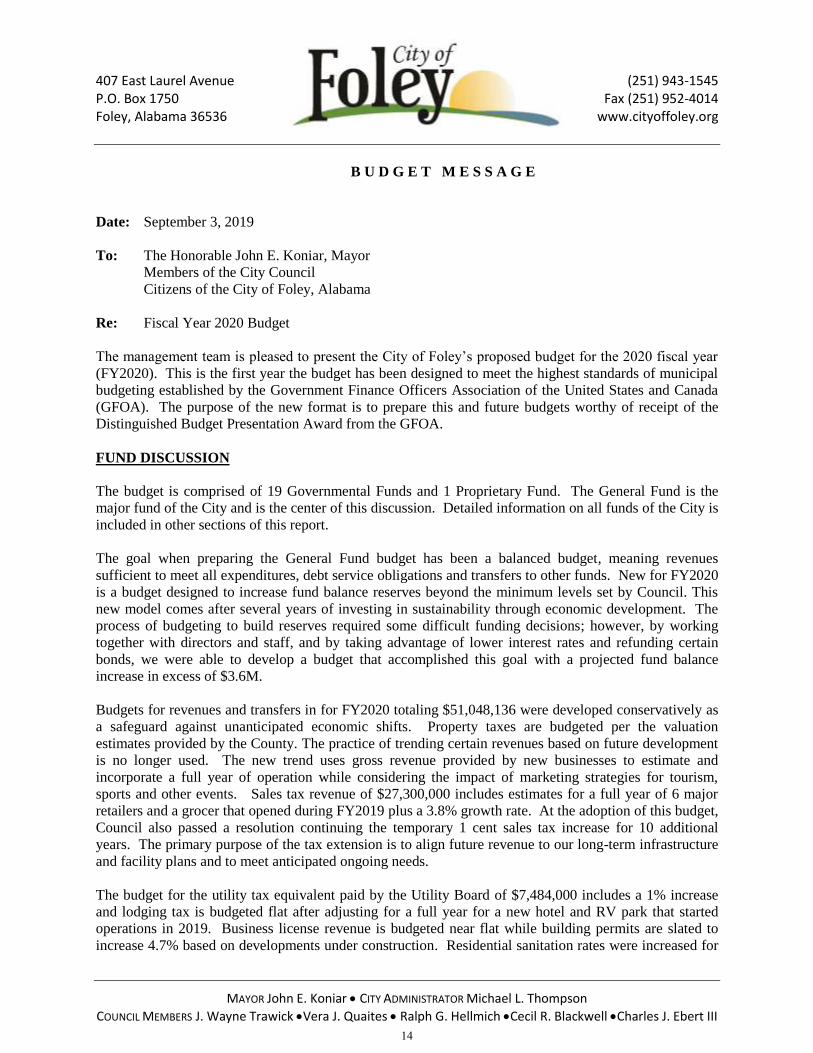
B U D G E T M E S S A G E
Date: September 3, 2019
To: The Honorable John E. Koniar, Mayor
Members of the City Council
Citizens of the City of Foley, Alabama
Re: Fiscal Year 2020 Budget
The management team is pleased to present the City of Foley’s proposed budget for the 2020 fiscal year
(FY2020). This is the first year the budget has been designed to meet the highest standards of municipal
budgeting established by the Government Finance Officers Association of the United States and Canada
(GFOA). The purpose of the new format is to prepare this and future budgets worthy of receipt of the
Distinguished Budget Presentation Award from the GFOA.
FUND DISCUSSION
The budget is comprised of 19 Governmental Funds and 1 Proprietary Fund. The General Fund is the
major fund of the City and is the center of this discussion. Detailed information on all funds of the City is
included in other sections of this report.
The goal when preparing the General Fund budget has been a balanced budget, meaning revenues
sufficient to meet all expenditures, debt service obligations and transfers to other funds. New for FY2020
is a budget designed to increase fund balance reserves beyond the minimum levels set by Council. This
new model comes after several years of investing in sustainability through economic development. The
process of budgeting to build reserves required some difficult funding decisions; however, by working
together with directors and staff, and by taking advantage of lower interest rates and refunding certain
bonds, we were able to develop a budget that accomplished this goal with a projected fund balance
increase in excess of $3.6M.
Budgets for revenues and transfers in for FY2020 totaling $51,048,136 were developed conservatively as
a safeguard against unanticipated economic shifts. Property taxes are budgeted per the valuation
estimates provided by the County. The practice of trending certain revenues based on future development
is no longer used. The new trend uses gross revenue provided by new businesses to estimate and
incorporate a full year of operation while considering the impact of marketing strategies for tourism,
sports and other events. Sales tax revenue of $27,300,000 includes estimates for a full year of 6 major
retailers and a grocer that opened during FY2019 plus a 3.8% growth rate. At the adoption of this budget,
Council also passed a resolution continuing the temporary 1 cent sales tax increase for 10 additional
years. The primary purpose of the tax extension is to align future revenue to our long-term infrastructure
and facility plans and to meet anticipated ongoing needs.
The budget for the utility tax equivalent paid by the Utility Board of $7,484,000 includes a 1% increase
and lodging tax is budgeted flat after adjusting for a full year for a new hotel and RV park that started
operations in 2019. Business license revenue is budgeted near flat while building permits are slated to
increase 4.7% based on developments under construction. Residential sanitation rates were increased for
14

MAYOR John E. Koniar CITY ADMINISTRATOR Michael L. Thompson
COUNCIL MEMBERS J. Wayne Trawick Vera J. Quaites Ralph G. Hellmich Cecil R. Blackwell Charles J. Ebert III
the first time in 11 years by $45 annually per single can household resulting in total projected revenues of
$1,800,000. This increase was necessary to keep up with the escalating cost of collecting residential
waste.
The trend for budgeting expenditures is based on a review of requested personnel and capital equipment
and incorporating into the budget what is approved. Operational expenditures are detailed by specific
need for the year or trended historically with a small margin of growth, normally around 3 percent. The
largest portion of total general fund expense of $47,369,164 by far is personnel costs totaling
$23,358,477. Included in personnel is $3,923,500 of health related benefit costs, which represents 16.8%
of the personnel cost. Also included is the addition of 6 FTE and 3 PTE net positions, and reserve for pay
increases of $366,045. The performance appraisal rating scale and associated raises remain the same as
FY2019.
Operational costs are budgeted 3.9% above the FY2019 projected close and debt service is decreased
substantially due to the bond refinance previously mentioned, with the intent to continue to pay down
debt over the next several years. A schedule of debt service obligations can be found in the Debt section
of this report.
INVESTING IN CAPITAL OUTLAY
Capital equipment is budgeted at $2,397,802, an increase of $1,320,217 from the FY2019 projected close,
and includes $1,015,995 in fleet additions. There is $470,000 budgeted for road construction equipment
estimated to save approximately $1.5M in future road construction costs, and $250,000 for an automated
garbage truck to service increasing residential sanitation needs.
Capital project and resurfacing cost for FY2020 total $8,749,582 and are offset by funding in the form of
grants and mutual aid agreements estimated at $3,943,187 resulting in a transfer requirement to the
Capital Projects fund of $4,806,395. Highlights of major projects in the plan are as follows:
Resurfacing & Street Repairs $ 1,000,000
Fern Avenue Extension (ATRIP Grant) 1,097,717
W. Pride Drive Safety Improvements (HISP Grant) 500,000
S. Juniper Street Extension 1,219,775
Foley Beach Express Intersection Improvements 600,000
9th Avenue Extension Sidewalks (TAP Grant) 500,000
Bon Secour Water Quality - land purchase (NFWF Grant) 1,410,200
Airport Ramp Taxiway Rehab (FAA/State Appropriations) 597,927
49.3%
16.9%4.6%
5.1%
10.1%
1.3%12.6%
FY2020 General Fund Budgeted Expenditures by Type
Personnel
Operational
Econ Developmnt Agrmnts
Capital Equipment
Trans-Capital Projects Fund
Trans-Other Funds
Debt & Trans-Debt Serv Funds
15
MAYOR John E. Koniar CITY ADMINISTRATOR Michael L. Thompson
COUNCIL MEMBERS J. Wayne Trawick Vera J. Quaites Ralph G. Hellmich Cecil R. Blackwell Charles J. Ebert III
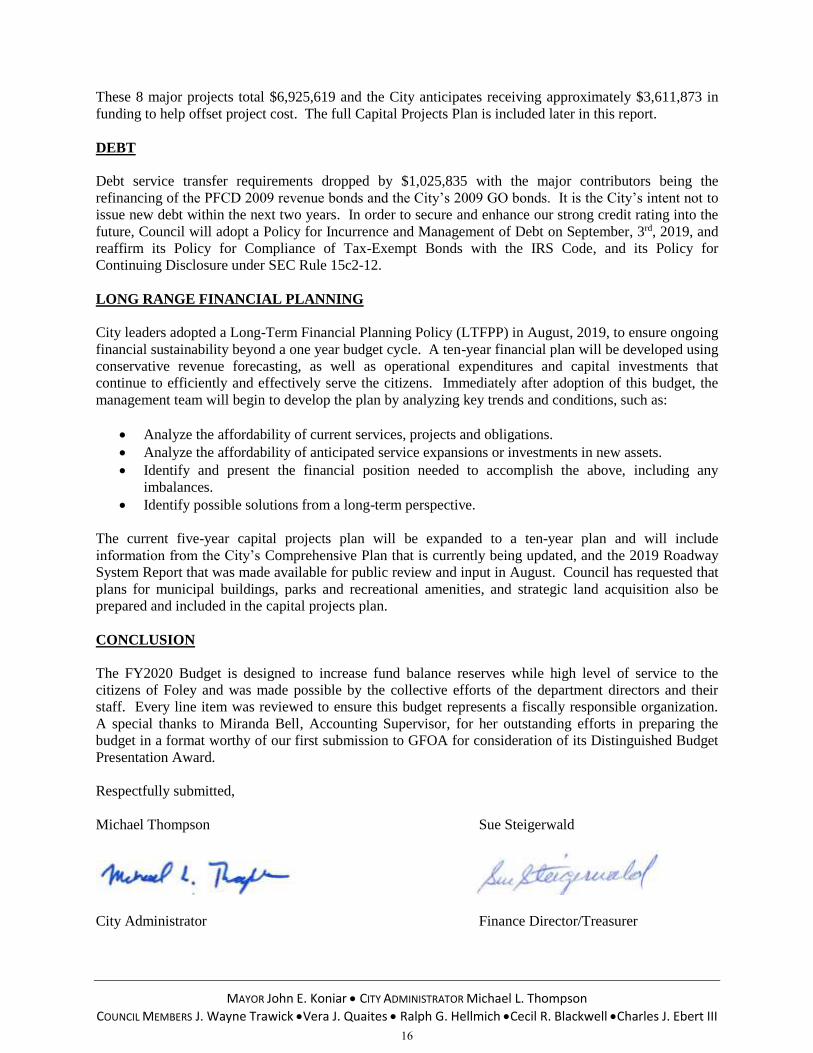
These 8 major projects total $6,925,619 and the City anticipates receiving approximately $3,611,873 in
funding to help offset project cost. The full Capital Projects Plan is included later in this report.
DEBT
Debt service transfer requirements dropped by $1,025,835 with the major contributors being the
refinancing of the PFCD 2009 revenue bonds and the City’s 2009 GO bonds. It is the City’s intent not to
issue new debt within the next two years. In order to secure and enhance our strong credit rating into the
future, Council will adopt a Policy for Incurrence and Management of Debt on September, 3rd, 2019, and
reaffirm its Policy for Compliance of Tax-Exempt Bonds with the IRS Code, and its Policy for
Continuing Disclosure under SEC Rule 15c2-12.
LONG RANGE FINANCIAL PLANNING
City leaders adopted a Long-Term Financial Planning Policy (LTFPP) in August, 2019, to ensure ongoing
financial sustainability beyond a one year budget cycle. A ten-year financial plan will be developed using
conservative revenue forecasting, as well as operational expenditures and capital investments that
continue to efficiently and effectively serve the citizens. Immediately after adoption of this budget, the
management team will begin to develop the plan by analyzing key trends and conditions, such as:
Analyze the affordability of current services, projects and obligations.
Analyze the affordability of anticipated service expansions or investments in new assets.
Identify and present the financial position needed to accomplish the above, including any
imbalances.
Identify possible solutions from a long-term perspective.
The current five-year capital projects plan will be expanded to a ten-year plan and will include
information from the City’s Comprehensive Plan that is currently being updated, and the 2019 Roadway
System Report that was made available for public review and input in August. Council has requested that
plans for municipal buildings, parks and recreational amenities, and strategic land acquisition also be
prepared and included in the capital projects plan.
CONCLUSION
The FY2020 Budget is designed to increase fund balance reserves while high level of service to the
citizens of Foley and was made possible by the collective efforts of the department directors and their
staff. Every line item was reviewed to ensure this budget represents a fiscally responsible organization.
A special thanks to Miranda Bell, Accounting Supervisor, for her outstanding efforts in preparing the
budget in a format worthy of our first submission to GFOA for consideration of its Distinguished Budget
Presentation Award.
Respectfully submitted,
Michael Thompson Sue Steigerwald
City Administrator Finance Director/Treasurer
16

Budget Process
17

Budget Calendar
May 10th – Finance distributed excel budget
worksheets for operational accounts, capital
purchase and capital projects. Finance also disbursed
instructions on how to enter information into Incode.
May 16th – Finance demonstrated how to enter
budget and projected close account information into
Incode at the monthly directors meeting.
June 13th – Capital purchase & capital project
requests were submitted to finance and personnel
requests (new positions, overtime, uniforms, etc.)
were submitted to human resources.
June 14th – June 28th - Capital projects worksheet
reviewed by the Mayor, Council and City
Administrator to ensure that each elected official’s
requested projects were included.
June 28th – All directors finalized entering operation
projected close and budget request.
July 8th – Finance delivered first draft of the budget
to the City Administrator
July 9th –26th – City Administrator met with
Directors; Finance/HR entered changes.
August 2nd – Finance provided adjusted draft to City
Administrator and Mayor and Council.
August 5th -13th – City Administrator met with
Mayor and Council individually or in pairs.
August 19th-22nd – Finance/HR made adjustments
requested by Mayor and Council.
August 23rd – Finance generated and distributed final
budget document to Mayor, Council and City
Administrator.
August 26th – Finance submitted Agenda Item for
adoption of the budget.
September 3rd – The FY20 budget was adopted by
Council.
September 16th – Was selected as alternate date for
adoption had delays occurred.
Sun Mon Tues Wed Thur Fri Sat
1 2 3 4
5 6 7 8 9 10 11
12 13 14 15 16 17 18
19 20 21 22 23 24 25
26 27 28 29 30 31
Sun Mon Tues Wed Thur Fri Sat
1
2 3 4 5 6 7 8
9 10 11 12 13 14 15
16 17 18 19 20 21 22
23 24 25 26 27 28 29
30
Sun Mon Tues Wed Thur Fri Sat
1 2 3 4 5 6
7 8 9 10 11 12 13
14 15 16 17 18 19 20
21 22 23 24 25 26 27
28 29 30 31
Sun Mon Tues Wed Thur Fri Sat
1 2 3
4 5 6 7 8 9 10
11 12 13 14 15 16 17
18 19 20 21 22 23 24
25 26 27 28 29 30 31
Sun Mon Tues Wed Thur Fri Sat
1 2 3 4 5 6 7
8 9 10 11 12 13 14
15 16 17 18 19 20 21
22 23 24 25 26 27 28
29 30
May 2019
June 2019
July 2019
August 2019
September 2019
18
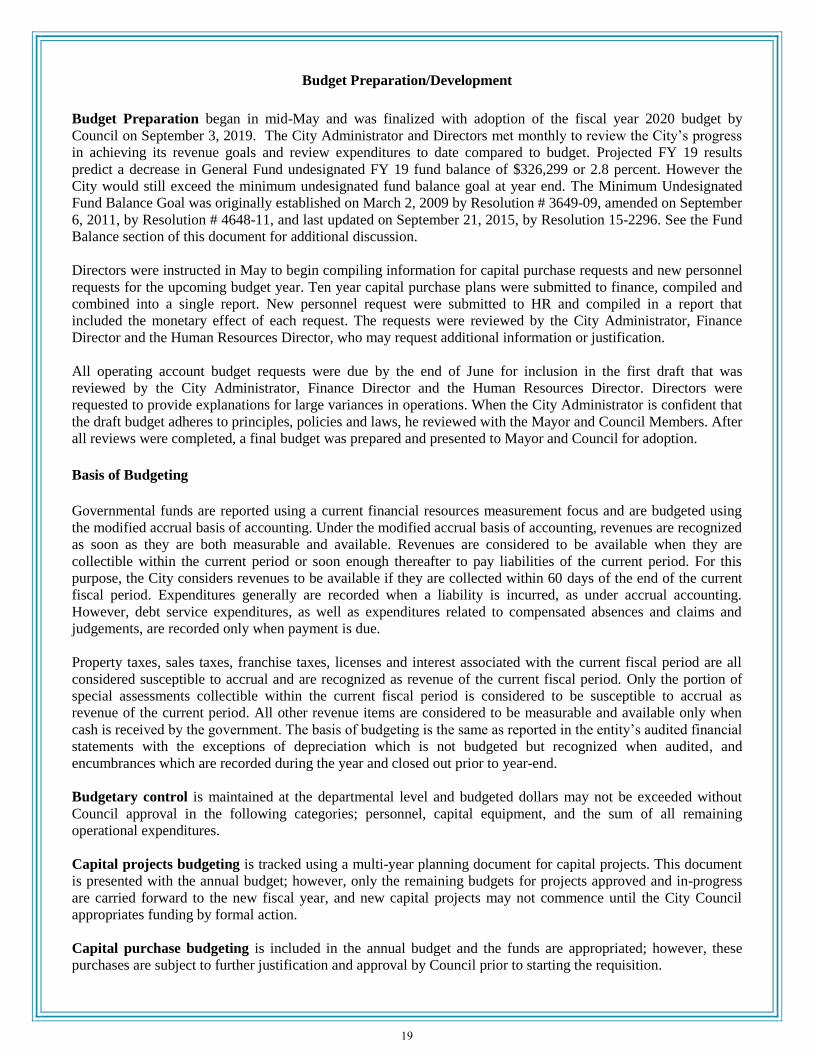
Budget Preparation/Development
Budget Preparation began in mid-May and was finalized with adoption of the fiscal year 2020 budget by
Council on September 3, 2019. The City Administrator and Directors met monthly to review the City’s progress
in achieving its revenue goals and review expenditures to date compared to budget. Projected FY 19 results
predict a decrease in General Fund undesignated FY 19 fund balance of $326,299 or 2.8 percent. However the
City would still exceed the minimum undesignated fund balance goal at year end. The Minimum Undesignated
Fund Balance Goal was originally established on March 2, 2009 by Resolution # 3649-09, amended on September
6, 2011, by Resolution # 4648-11, and last updated on September 21, 2015, by Resolution 15-2296. See the Fund
Balance section of this document for additional discussion.
Directors were instructed in May to begin compiling information for capital purchase requests and new personnel
requests for the upcoming budget year. Ten year capital purchase plans were submitted to finance, compiled and
combined into a single report. New personnel request were submitted to HR and compiled in a report that
included the monetary effect of each request. The requests were reviewed by the City Administrator, Finance
Director and the Human Resources Director, who may request additional information or justification.
All operating account budget requests were due by the end of June for inclusion in the first draft that was
reviewed by the City Administrator, Finance Director and the Human Resources Director. Directors were
requested to provide explanations for large variances in operations. When the City Administrator is confident that
the draft budget adheres to principles, policies and laws, he reviewed with the Mayor and Council Members. After
all reviews were completed, a final budget was prepared and presented to Mayor and Council for adoption.
Basis of Budgeting
Governmental funds are reported using a current financial resources measurement focus and are budgeted using
the modified accrual basis of accounting. Under the modified accrual basis of accounting, revenues are recognized
as soon as they are both measurable and available. Revenues are considered to be available when they are
collectible within the current period or soon enough thereafter to pay liabilities of the current period. For this
purpose, the City considers revenues to be available if they are collected within 60 days of the end of the current
fiscal period. Expenditures generally are recorded when a liability is incurred, as under accrual accounting.
However, debt service expenditures, as well as expenditures related to compensated absences and claims and
judgements, are recorded only when payment is due.
Property taxes, sales taxes, franchise taxes, licenses and interest associated with the current fiscal period are all
considered susceptible to accrual and are recognized as revenue of the current fiscal period. Only the portion of
special assessments collectible within the current fiscal period is considered to be susceptible to accrual as
revenue of the current period. All other revenue items are considered to be measurable and available only when
cash is received by the government. The basis of budgeting is the same as reported in the entity’s audited financial
statements with the exceptions of depreciation which is not budgeted but recognized when audited, and
encumbrances which are recorded during the year and closed out prior to year-end.
Budgetary control is maintained at the departmental level and budgeted dollars may not be exceeded without
Council approval in the following categories; personnel, capital equipment, and the sum of all remaining
operational expenditures.
Capital projects budgeting is tracked using a multi-year planning document for capital projects. This document
is presented with the annual budget; however, only the remaining budgets for projects approved and in-progress
are carried forward to the new fiscal year, and new capital projects may not commence until the City Council
appropriates funding by formal action.
Capital purchase budgeting is included in the annual budget and the funds are appropriated; however, these
purchases are subject to further justification and approval by Council prior to starting the requisition.
19

Budget Development Guidelines
The City’s fiscal year runs from October 1 through September 30. This document is prepared for the year October
1, 2019, through September 30, 2020, thereby being the Fiscal Year 2020 Budget. The City’s annual budget
process provides a financial plan for the upcoming year. Throughout this process, future year projections are
reviewed to proactively adjust spending trends which creates the ability to actively manage future year
appropriations.
Budget Objective
The following budget objectives are established for the different types of funds the City uses:
General Fund – The annual budget for the General Fund shall provide for general governmental
operations of the City and maintain working capital necessary for the City’s financial heath and stability.
Special Revenue Funds - The City adopts annual budgets for each special revenue fund that
demonstrates any legally restricted revenue sources are used consistently with the applicable laws or
regulations.
Capital Projects Funds – The City only adopts budgets for operational cost in these funds. Infrastructure
maintenance and capital construction projects in these funds are approved on a per project basis and do
not expire until the project is complete. These projects are maintained using a planning document that is
included in the budget report.
Debt Service Funds – The City adopts annual budgets for its debt service funds to ensure funding is
available to meet all annual debt service requirements.
Balanced Budget
The City defines a balanced budget in the general fund when the total revenues and transfers received are greater
than the total expense and the transfers to other funds to support operations, capital projects and fund debt service,
net of eligible restricted/assigned cash uses.
Budget Adjustments
The budget is a dynamic rather than static plan that requires adjustments by formal budget amendments as
circumstances change. The City Council must approve all increases in total departmental appropriations, increases
in the personnel services budgets, and increases in the number of authorized positions (full and part-time).
Directors are expected to operate with the funding appropriated for their department(s). However, should a
funding increase be required, a written request is to be submitted to the City Administrator and approved by
formal action of the Council prior to expenditure of funds. Departmental budget dollars may be transferred
between accounts within a category upon a Directors written request to the Finance Director/City Treasurer.
Departmental capital purchases included in, and approved by this budget, are subject to further justification and
formal approval by Council prior to starting the requisition process (i.e. request for purchase order or letting of
bids).
Financial Policies
Cash Flow
For analysis and internal management purposes, the City prepares an annual cash flow analysis in conjunction
with the Operating Budget. The purpose of this document is to ensure that cash will be available to pay budgeted
costs on a timely basis. This cash flow is closely monitored by the finance department throughout the year.
Capital Project Plan
The City maintains a five-year capital project plan which is updated annually. This plan assists in the planning,
acquisition and financing of capital projects. A capital project is generally defined as an expenditure that has an
20

expected useful life of more than 5 years with an estimated total cost of $5,000 or more, or an
improvement/addition to an existing capital asset. Examples include building/infrastructure construction, park
improvements, streetscapes, street construction and improvements.
Capital projects are budgeted through appropriations when funding request are submitted to council.
Capital Project Budget Preparation Each Director, the Mayor and City Council Members submit projects to be added to the plan, indicating
which year of the plan the project is desired to occur. Should the cash flow analysis not support all
projects requested in the current budget year, the City Administrator will work with Directors and
Officials to distribute projects in the remaining years of the capital projects plan. This plan will provide a
method of tracking and planning for future needs of the City.
Capital Project Budget Appropriations/Amendments Project owners must submit to Mayor and Council a request to begin a project prior to expending funds or
awarding contracts. If the project is approved to move forward, an appropriation of funds is made by
Resolution of the Council. The finance division staff reviews Resolutions and records all budget
adjustments in the accounting software. All capital projects that have been approved and funded are
recorded on a worksheet that is updated after every council meeting.
Capital Project Appropriations at year-end The budget balance in capital projects shall carry forward to the subsequent budget period and the project
may continue without being taken back to Council. If it is determined by the project owner that the
project may go over budget, they must submit another request to Mayor and Council to appropriate the
additional funding needed.
Fund Balance Reserve
It is the City’s goal to maintain a minimum unrestricted fund balance in the general fund equal to 25 percent of
the originally budgeted operational expenditures and debt service obligations, less one time expenditures greater
than $500,000 and expenditures that are offset by transfer in or other financing sources, as a safeguard against
financial demands such as major natural disasters or other unforeseen events. The FY 2019 amount subject to the
calculation was $38,535,089 resulting in a 25 percent fund balance goal of $9,633,772. The projected ending
unrestricted fund balance is $11,364,277 representing 29.5 percent and exceeds the goal by $1,730,505.
Debt Disclosure
To ensure compliance with the Securities and Exchange Commission's (SEC) Rule 15c2-12: Continuing
Disclosure, the City entered into a Disclosure Dissemination Agent Agreement with Digital Assurance
Certification, LLC (DAC). As the City's Disclosure Dissemination Agent, DAC will assist the City with meeting
continuing disclosure requirements set forth in bond and other debt indentures.
Debt Management Policy
On September 3rd, 2019 the City adopted a Debt Management Policy that set parameters for issuing debt and
providing guidance to decision makers. Adherence to a debt management policy helps to ensure that the City
maintains a sound debt position and that credit quality is protected.
Capital Assets
The City adopted a comprehensive Capital Asset Management Policies and Procedures manual in accordance
with Generally Accepted Accounting Principles (GAAP) as they pertain to local governments that also included
procedures for tracking Small and Attractive Items (easily lost or theft sensitive). This policy is designed to assist
in collecting and maintaining complete and accurate asset information for the preparation of the financial
statements. This policy became effective October 1, 2014, increased the capital asset threshold from $1,000 to
$5,000, and established a $100,000 threshold for easements. Capital assets, which include land, buildings,
improvements, machinery and equipment, and infrastructure assets, are reported in the government-wide financial
21

statements. Capital assets are defined by the City as those assets with an initial individual cost of $5,000 or more and an estimated useful life more than five years. Long Term Financial Planning Policy On August 19th, 2019 the City adopted a Long Term Financial Planning Policy to establish principals to ensure the City’s ongoing financial sustainability beyond a single fiscal year budget cycle. Accounting, Auditing and Financial Reporting Policies An independent audit of the City’s financial records and internal control procedures is performed on an annual basis. The City, while adhering to General Accepted Accounting Principles (GAAP), produces a Comprehensive Annual Financial Report (CAFR) in accordance with the Governmental Accounting Standards Board (GASB). Federal Grant Management Policy On December 17th, 2018, The City adopted a Federal Grant Management Policies and Procedures Manual to ensure federal grant dollars are maximized for the greatest public benefit while maintaining appropriate safeguards to ensure taxpayer funds are not misused.
22

Fund Structure
23

Fund Structure
In the fund financial statements, financial transactions and accounts of the City are organized on the basis of funds.
The operation of each fund is considered to be an independent fiscal and separate accounting entity, with a self-
balancing set of accounts recording cash and/or other financial resources together with all related liabilities and
residual equities or balances, and changes therein, which are segregated for the purpose of carrying on specific
activities or attaining certain objectives in accordance with special regulations, restrictions, or limitations. The fund
statements are budgeted and presented on a current financial resource and modified accrual basis of accounting.
Governmental Funds
General Fund is the City’s primary operating fund. It accounts for all financial resources of the City except those
required to be accounted for in another fund. The General Fund expenses provide services to the City’s population
and include general government, public safety, highways and streets, sanitation, culture, recreation activities and
economic development. Major sources of revenue for the General Fund include property taxes, sales and use taxes,
lodging tax, utility tax equivalents and charges for service.
Special Revenue Funds are established to account for the proceeds of specific revenue sources other than special
assessments, expendable trusts, or major capital projects, that are legally restricted to expenditures for specified
purposes. The City’s Special Revenue Funds consist of the following:
Fire AdValorem Fund
Library Fund
Recreational Activities Fund
Gas Tax Fund
Court Corrections Fund
Jail Corrections Fund
Foley Sports Tourism (FST) Event Center Operations
Foley Sports Tourism (FST) Multi-Use Fields Operations
Public Facilities Cooperative District (blended component unit)
Public Athletic & Sports Facilities Cooperative District (blended component unit)
Public Cultural & Entertainment Facilities Cooperative District (blended component unit)
Debt Service Funds are established for the purpose of accumulating resources for the payment of interest and
principal on long-term general obligation debt. The City’s Debt Service Funds consist of the following:
2006-A General Obligation Warrant
2009 General Obligation – this was refinanced in September 2019, so there is not budget for 2019.
Qualified Energy Conservation Bond of 2013
Economic Incentives Fund
2014 General Obligation Warrant
2015 General Obligation Warrant
2019 General Obligation Warrant
Capital Projects Funds are used to account for financial resources for the acquisition or construction of major
capital items. The City’s Capital Projects Funds consist of the following:
Capital Projects Fund (used to account for the majority of the city’s capital projects)
CDBG grant – this grant was completed in FY 2019, so it is not included in the FY 2020 Budget.
24

Proprietary Funds
Proprietary Funds are used to account for a government’s ongoing activities that are similar to those found in the
private sector. There are two types of Proprietary Funds; Enterprise and Internal Service Funds.
Enterprise Funds are used to account for operations (a) that are financed and operated in a manner similar to private
business enterprises - where the intent of the governing body is that the costs of providing goods or services to the
general public on a continuing basis be financed or recovered primarily through user charges; or (b) where the
governing body has decided that periodic determination of revenues earned, expenses incurred and/or net income
is appropriate for capital maintenance, public policy, management control, accountability, or other purposes. The
City has one Enterprise Fund:
Coastal Alabama Farmers’ and Fishermen’s Market Inc. Fund. This entity has a separate board that is
responsible for adopting a budget. Their resolution and budget are included in this report.
Internal Service Funds are used to identify and allocate costs of goods and services to other departments. The City
currently has no Internal Service Funds.
Fund Types Budgeted by the City Appropriated Major Fund Minor Fund
General Fund
General Fund X X
Special Revenue Funds
Fire AdValorem Tax Fund X X
Library Fund X X
Recreational Activities Fund X X
Gas Tax Fund X X
Court Corrections Fund X X
Jail Corrections Fund X X
FST Event Center Operations Fund X X
FST Multi-Use Fields Operations Fund X X
Public Facilities Cooperative District X X
Public Athletic & Sports Facilities Cooperative District X X
Public Cultural & Entertainment Facilities Cooperative District X X
Debt Service Funds
2006A General Obligation Warrant Fund X X
Energy Conservation Bonds Series 2013 X X
Economic Incentive Fund X X
2014 General Obligation Warrant Fund X X
2015 General Obligation Warrant Fund X X
2019 General Obligation Warrant Fund X X
Capital Projects Fund
Capital Projects Fund X
Proprietary Funds
Coastal Alabama Farmers’ & Fishermen’s Market, Inc. X
25
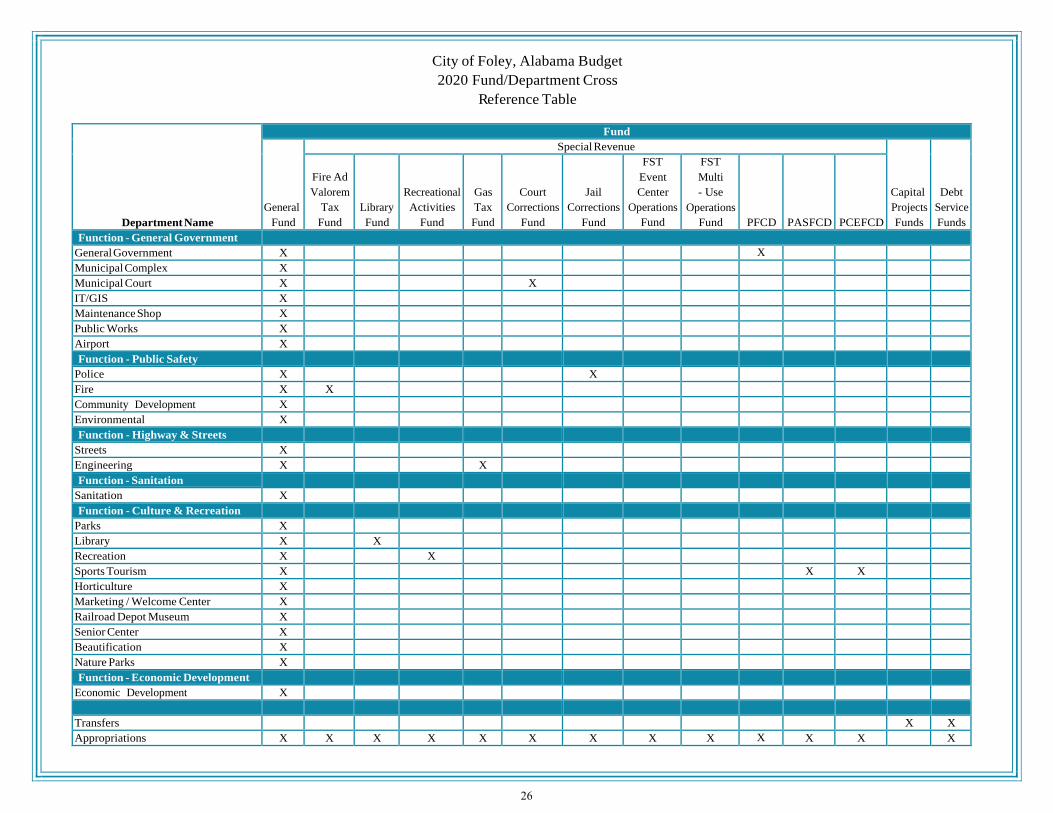
City of Foley, Alabama Budget
2020 Fund/Department Cross
Reference Table
Department Name
Fund
General
Fund
Special Revenue
Capital
Projects
Funds
Debt
Service
Funds
Fire Ad
Valorem
Tax
Fund
Library
Fund
Recreational
Activities
Fund
Gas
Tax
Fund
Court
Corrections
Fund
Jail
Corrections
Fund
FST
Event
Center
Operations
Fund
FST
Multi
- Use
Operations
Fund
PFCD
PASFCD
PCEFCD
Function - General Government General Government X X Municipal Complex X Municipal Court X X IT/GIS X Maintenance Shop X Public Works X Airport X Function - Public Safety
Police X X Fire X X Community Development X Environmental X Function - Highway & Streets
Streets X Engineering X X Function - Sanitation
Sanitation X Function - Culture & Recreation
Parks X Library X X Recreation X X Sports Tourism X X X Horticulture X Marketing / Welcome Center X Railroad Depot Museum X Senior Center X Beautification X Nature Parks X Function - Economic Development
Economic Development X Transfers X X
Appropriations X X X X X X X X X X X X X
26

Financial Summaries
27

City of Foley
City Wide Consolidated Financial Statements
% Change
(audited) (audited) (amended) Change From
FY 2017 FY 2018 FY 2019 FY 2019 FY 2020 From FY 19 FY 19 to
Actual Actual Budgeted Projections Budgeted to FY 20 FY 20
Revenues
Property and advalorem taxes 1,625,209$ 1,711,873$ 1,728,100$ 1,756,010$ 1,887,382$ 131,372$ 7%
Sales and other local taxes 22,405,114 26,646,096 27,555,720 28,942,276 30,821,950 1,879,675 6%
Licenses and permits 3,720,477 3,828,883 3,523,300 3,579,250 3,625,500 46,250 1%
Intergovernmental 3,132,314 2,313,245 473,734 444,605 334,238 (110,367) -25%
Charges for services 2,570,615 2,645,941 2,928,230 2,986,771 3,352,840 366,069 12%
Fines and forfeitures 646,292 584,494 583,638 574,775 585,900 11,125 2%
Utility tax equivalents 6,796,594 7,206,906 7,398,500 7,558,506 7,632,000 73,494 1%
Interest & rental income 393,347 438,707 440,179 1,189,267 471,943 (717,324) -60%
Contributions and donations 230,806 789,317 213,952 120,200 151,400 31,200 26%
Other 1,444,874 2,603,155 2,812,845 2,796,255 3,146,980 350,725 13%
Total Revenues 42,965,642 48,768,617 47,658,198 49,947,915 52,010,133 2,062,218 4%
Expenditures
General government 5,636,357 6,037,041 6,245,186 6,006,987 6,575,940 568,953 9%
Public safety 11,404,151 11,995,342 13,109,711 12,993,449 13,330,904 337,455 3%
Highways and streets 3,097,595 2,926,279 2,532,468 2,474,829 2,683,346 208,517 8%
Sanitation 2,208,683 2,053,143 2,225,332 2,214,965 2,238,510 23,545 1%
Culture and recreation 6,094,701 7,255,457 7,796,036 8,011,685 7,704,195 (307,490) -4%
Economic development 2,101,714 2,048,752 1,656,250 1,725,600 2,213,875 488,275 28%
Capital outlay 18,028,847 6,768,709 4,091,513 2,904,958 3,063,283 158,325 5%
Principal 4,122,542 4,704,499 4,901,864 4,901,668 3,670,159 (1,231,509) -25%
Interest 2,755,695 2,679,534 2,535,261 2,535,381 2,380,797 (154,584) -6%
Bond issuance cost 31,995 25,641 18,803 18,803 12,054 (6,749) -36%
Total Expenditures 55,482,280 46,494,397 45,112,423 43,788,325 43,873,063 84,738 0%
Excess (deficiency) of revenues
over expenditures (12,516,638) 2,274,220 2,545,775 6,159,590 8,137,070 1,977,480 32%
Other financing sources (uses)
Transfers in 12,564,628 14,414,569 18,496,058 18,413,594 15,397,452 (3,016,142) -16%
Transfers out (12,609,256) (14,459,197) (18,540,786) (19,106,481) (14,415,912) 4,690,569 -25%
Issuance of bonded debt 1,000,000 500,000 - - - - 0%
Issuance of other debt 300,000 - - - - - 0%
Capital leases 32,031 - - - - - 0%
Sale of capital assets 1,785,258 - - - - - 0%
Total other financing 3,072,661 455,372 (44,728) (692,887) 981,540 1,674,427 -242%
sources (uses)
Net change in fund balances (9,443,977) 2,729,592 2,501,047 5,466,703 9,118,610 3,651,907 67%
Beginning Fund Balance 29,922,670 20,478,693 23,451,897 23,451,897 28,918,600 5,466,703 23%
Prior period adjustment - 243,612 - - - - 0%
Ending Fund Balance 20,478,693 23,451,897 25,952,944 28,918,600 38,037,210 9,118,610 32%
28

City of Foley
Graphs - City Wide Budgets
Property and
advalorem taxes
3.63%
Sales and other
local taxes
59.26%Licenses and
permits
6.97%
Intergovernmental
0.64%
Charges for
services
6.45%
Fines and
forfeitures
1.13%
Utility tax
equivalents
14.67%
Interest & rental
income
0.91%
Contributions and
donations
0.29%Other
6.05%
2020 BUDGETED REVENUES - ALL FUNDS
29

General
government
14.99%
Public safety
30.39%
Highways and
streets
6.12%
Sanitation
5.10%
Culture and
recreation
17.56%
Economic
development
5.05%
Capital outlay
6.98%
Principal
8.37%
Interest
5.43%
Bond issuance cost
0.03%
2020 BUDGETED EXPENSES - ALL FUNDS
30

City of Foley
General Fund Financial Statements
% Change
(audited) (audited) (amended) Change From
FY 2017 FY 2018 FY 2019 FY 2019 FY 2020 From FY 19 FY 19 to
Actual Actual Budgeted Projections Budgeted to FY 20 FY 20
Revenues
Property and advalorem taxes 1,452,785$ 1,529,150$ 1,553,100$ 1,571,010$ 1,697,382$ 126,372$ 8%
Sales and other local taxes 22,310,123 26,550,965 27,460,450 28,846,776 30,658,550 1,811,775 6%
Licenses and permits 3,720,477 3,828,883 3,523,300 3,579,250 3,625,500 46,250 1%
Intergovernmental 755,328 330,764 458,576 417,712 315,950 (101,762) -24%
Charges for services 2,219,553 2,296,347 2,526,770 2,644,373 3,009,340 364,967 14%
Fines and forfeitures 544,843 490,154 488,138 484,275 495,400 11,125 2%
Utility tax equivalents 6,796,594 7,206,906 7,398,500 7,558,506 7,632,000 73,494 1%
Interest & rental income 257,377 314,368 307,500 307,182 335,134 27,952 9%
Contributions and donations 108,434 66,967 46,952 41,450 28,400 (13,050) -31%
Other 221,838 413,487 394,380 373,630 238,080 (135,550) -36%
Total Revenues 38,387,352 43,027,991 44,157,666 45,824,164 48,035,736 2,211,572 5%
Expenditures
General government 5,587,374 5,931,427 6,166,786 5,955,429 6,510,490 555,061 9%
Public safety 11,351,029 11,991,848 13,057,211 12,983,590 13,278,404 294,814 2%
Highways and streets 2,341,445 2,249,262 2,507,468 2,454,829 2,658,346 203,517 8%
Sanitation 2,208,683 2,053,143 2,225,332 2,214,965 2,238,510 23,545 1%
Culture and recreation 5,551,347 5,434,475 5,966,710 6,240,202 6,638,210 398,008 6%
Economic development 1,002,397 1,548,752 1,656,250 1,725,600 2,213,875 488,275 28%
Capital outlay 711,183 1,237,428 1,803,917 1,077,585 2,397,802 1,320,217 123%
Principal 30,107 83,452 86,308 86,308 71,924 (14,384) -17%
Interest 7,859 29,784 22,414 22,414 17,595 (4,819) -21%
Total Expenditures 28,791,424 30,559,571 33,492,395 32,760,922 36,025,156 3,264,234 10%
Excess (deficiency) of revenues
over expenditures 9,595,928 12,468,420 10,665,271 13,063,242 12,010,580 (1,052,662) -8%
Other financing sources (uses)
Transfers in 3,284,226 2,324,566 2,536,902 2,530,902 3,012,400 481,498 19%
Transfers out (9,280,402) (11,974,733) (15,578,100) (16,126,919) (11,344,008) 4,782,911 -30%
Issuance of other debt 300,000 - - - - - 0%
Capital leases 32,031 - - - - - 0%
Sale of capital assets 1,785,258 - - - - - 0%
Total other financing (3,878,887) (9,650,167) (13,041,198) (13,596,017) (8,331,608) 5,264,409 -39%
sources (uses)
Net change in fund balances 5,717,041 2,818,253 (2,375,927) (532,775) 3,678,972 4,211,747 -791%
Beginning Fund Balance 9,785,607 15,502,648 18,564,513 18,564,513 18,031,738 (532,775) -3%
Prior period adjustment - 243,612 - - - - 0
Ending Fund Balance 15,502,648$ 18,564,513$ 16,188,586$ 18,031,738$ 21,710,710$ 3,678,972$ 20%
Notes:
The City is budgeting a $3.6M increase in reserves in FY 20.
31

City of Foley
Graphs – General Fund Budgets
Property and
advalorem taxes
3.53%
Sales and other local
taxes
63.82%
Licenses and permits
7.55%
Intergovernmental
0.66%
Charges for services
6.26%
Fines and forfeitures
1.03%
Utility tax equivalents
15.89%
Interest & rental
income
0.70%
Contributions and
donations
0.06%
Other
0.50%
2020 BUDGETED GENERAL FUND REVENUES
32
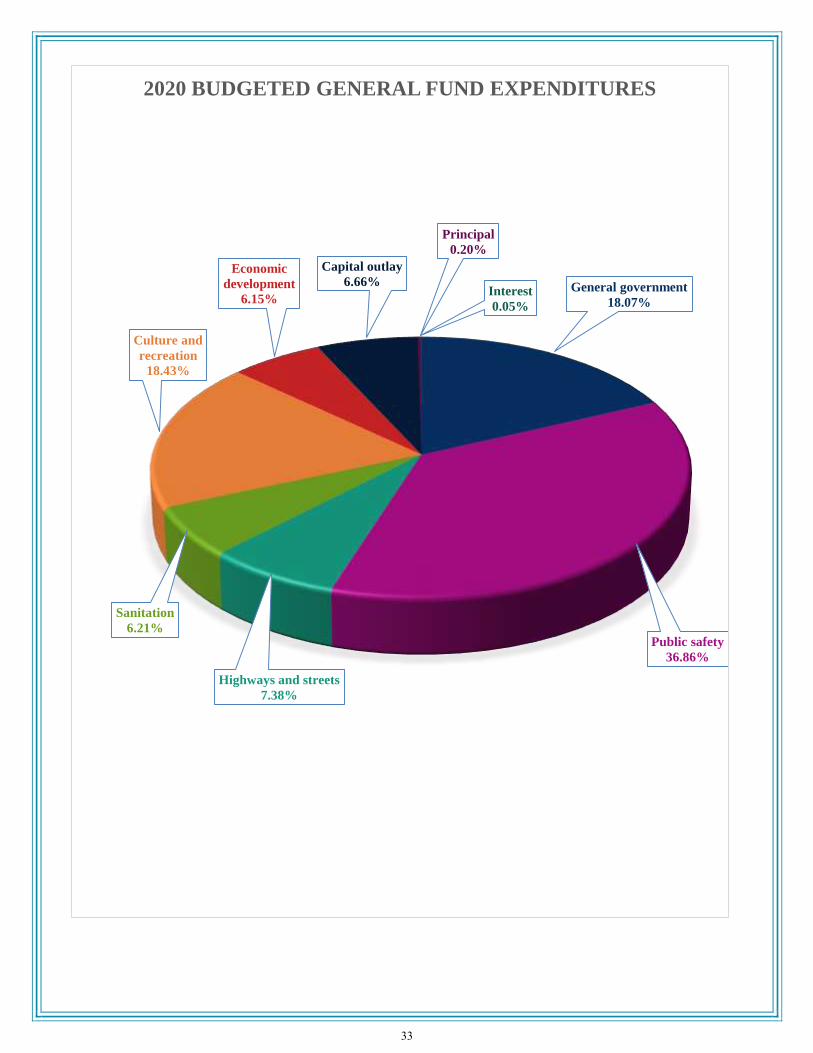
General government
18.07%
Public safety
36.86%
Highways and streets
7.38%
Sanitation
6.21%
Culture and
recreation
18.43%
Economic
development
6.15%
Capital outlay
6.66%
Principal
0.20%
Interest
0.05%
2020 BUDGETED GENERAL FUND EXPENDITURES
33

City of Foley
Non-Major Funds
Financial Statement Summaries
34

City of Foley
Special Revenue Funds
Fire AdValorem Fund
% Change
(audited) (audited) (amended) Change From
FY 2017 FY 2018 FY 2019 FY 2019 FY 2020 From FY 19 FY 19 to
Actual Actual Budgeted Projection Budgeted to FY 20 FY 20
Revenues
Property and advalorem taxes 172,424$ 182,723$ 175,000$ 185,000$ 190,000$ 5,000$ 3%
Interest and rental income 752 1,034 750 850 900 50 6%
Total Revenues 173,176 183,757 175,750 185,850 190,900 5,050 3%
Expenditures
Culture and recreation 18,421 - 52,500 5,500 52,500 47,000 855%
Capital outlay 465,120 50,329 505,000 16,000 530,481 514,481 3216%
Total Expenditures 483,541 50,329 557,500 21,500 582,981 561,481 2612%
Excess (deficiency) of revenues
over expenditures (310,365) 133,428 (381,750) 164,350 (392,081) (556,431) -339%
Other financing sources (uses)
Transfers in 5,000 - 120,000 120,000 - (120,000) -100%
Total other financing 5,000 - 120,000 120,000 - (120,000) -100%
sources (uses)
Net change in fund balances (305,365) 133,428 (261,750) 284,350 (392,081) (676,431) -238%
Beginning Fund Balance 665,950 360,585 494,013 494,013 778,363 284,350 58%
Ending Fund Balance 360,585$ 494,013$ 232,263$ 778,363$ 386,282$ (392,081)$ -50%
Note:
During FY 2019, the City budgeted the purchase of a new custom fire pumper in the Fire AdValorem Fund. Once
the purchase was approved by Council and bid, it was determined that it would not be received during the fiscal
year. However, the vendor required full payment for the truck in exchange for a discounted price. The City has a
prepaid asset on the Fire AdValorem balance sheet in the amount of $484,999 which is budgeted as a capital outlay
expenditure in FY 2020.
35

City of Foley
Special Revenue Funds
Library Fund
% Change
(audited) (audited) (amended) Change From
FY 2017 FY 2018 FY 2019 FY 2019 FY 2020 From FY 19 FY 19 to
Actual Actual Budgeted Projection Budgeted to FY 20 FY 20
Revenues
Intergovernmental 35,158$ 30,940$ 25,158$ 26,893$ 18,288$ (8,605)$ -32%
Charges for services 9,640 11,117 9,935 9,700 9,700 - 0%
Fines and forfeitures 12,724 12,151 10,500 10,500 10,500 - 0%
Interest and rental income 195 175 - 5 5 - 0%
Contributions and donations 25,472 18,662 27,000 27,000 22,000 (5,000) -19%
Total Revenues 83,189 73,045 72,593 74,098 60,493 (13,605) -18%
Expenditures
Culture and recreation 76,478 77,641 81,100 81,110 76,110 (5,000) -6%
Total Expenditures 76,478 77,641 81,100 81,110 76,110 (5,000) -6%
Excess (deficiency) of revenues
over expenditures 6,711 (4,596) (8,507) (7,012) (15,617) (8,605) 123%
Other financing sources (uses)
Transfers out - - (10,000) (10,000) - 10,000 -100%
Total other financing - - (10,000) (10,000) - 10,000 -100%
sources (uses)
Net change in fund balances 6,711 (4,596) (18,507) (17,012) (15,617) 1,395 -8%
Beginning Fund Balance 70,633 77,344 72,748 72,748 55,736 (17,012) -23%
Ending Fund Balance 77,344$ 72,748$ 54,241$ 55,736$ 40,119$ (15,617)$ -28%
Note:
During FY 2019, the Library transferred $10,000 from the Library Fund to assist the General Fund in covering the
cost of painting the interior of the library. This was a one-time transfer.
36
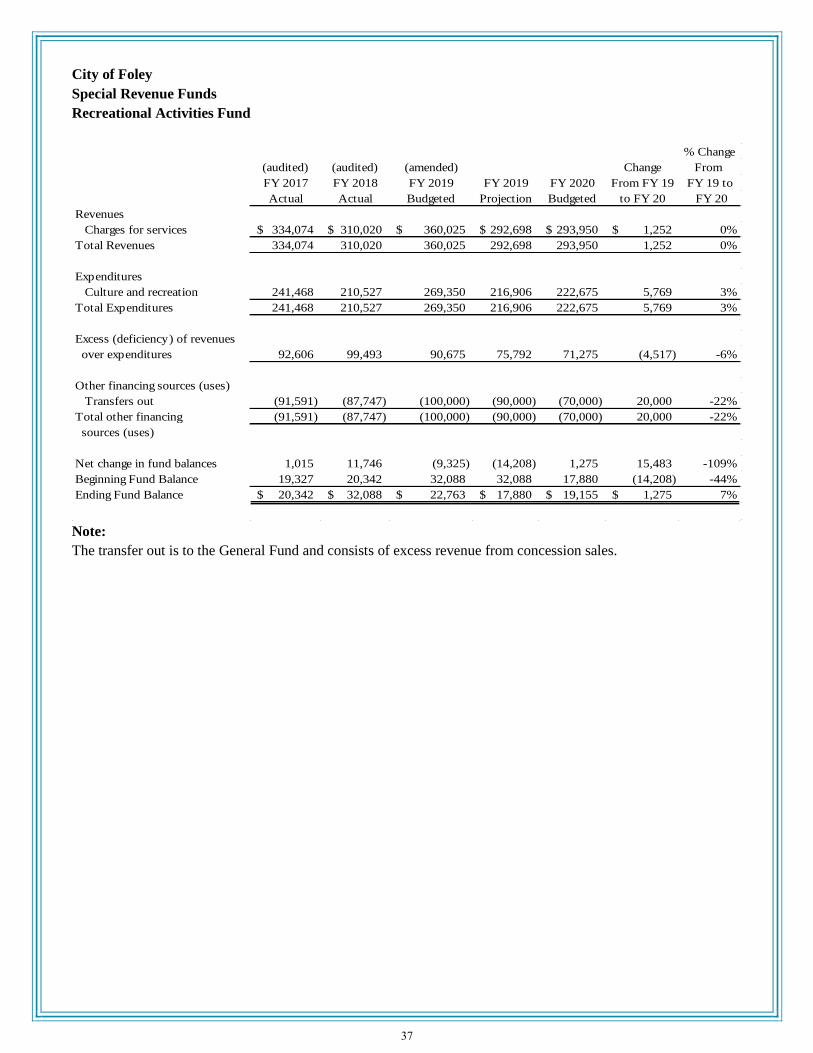
City of Foley
Special Revenue Funds
Recreational Activities Fund
% Change
(audited) (audited) (amended) Change From
FY 2017 FY 2018 FY 2019 FY 2019 FY 2020 From FY 19 FY 19 to
Actual Actual Budgeted Projection Budgeted to FY 20 FY 20
Revenues
Charges for services 334,074$ 310,020$ 360,025$ 292,698$ 293,950$ 1,252$ 0%
Total Revenues 334,074 310,020 360,025 292,698 293,950 1,252 0%
Expenditures
Culture and recreation 241,468 210,527 269,350 216,906 222,675 5,769 3%
Total Expenditures 241,468 210,527 269,350 216,906 222,675 5,769 3%
Excess (deficiency) of revenues
over expenditures 92,606 99,493 90,675 75,792 71,275 (4,517) -6%
Other financing sources (uses)
Transfers out (91,591) (87,747) (100,000) (90,000) (70,000) 20,000 -22%
Total other financing (91,591) (87,747) (100,000) (90,000) (70,000) 20,000 -22%
sources (uses)
Net change in fund balances 1,015 11,746 (9,325) (14,208) 1,275 15,483 -109%
Beginning Fund Balance 19,327 20,342 32,088 32,088 17,880 (14,208) -44%
Ending Fund Balance 20,342$ 32,088$ 22,763$ 17,880$ 19,155$ 1,275$ 7%
Note:
The transfer out is to the General Fund and consists of excess revenue from concession sales.
37

City of Foley
Special Revenue Funds
Gas Tax Fund
% Change
(audited) (audited) (amended) Change From
FY 2017 FY 2018 FY 2019 FY 2019 FY 2020 From FY 19 FY 19 to
Actual Actual Budgeted Projection Budgeted to FY 20 FY 20
Revenues
Intergovernmental 94,991$ 95,131$ 95,270$ 95,500$ 163,400$ 67,900$ 71%
Interest and rental income 1,553 243 200 200 200 - 0%
Total Revenues 96,544 95,374 95,470 95,700 163,600 67,900 71%
Expenditures
Public safety 32,656 29,141 25,000 20,000 25,000 5,000 25%
Total Expenditures 32,656 29,141 25,000 20,000 25,000 5,000 25%
Excess (deficiency) of revenues
over expenditures 63,888 66,233 70,470 75,700 138,600 62,900 83%
Other financing sources (uses)
Transfers out (700,000) (80,000) (80,000) (80,000) (140,000) (60,000) 75%
Total other financing (700,000) (80,000) (80,000) (80,000) (140,000) (60,000) 75%
sources (uses)
Net change in fund balances (636,112) (13,767) (9,530) (4,300) (1,400) 2,900 -67%
Beginning Fund Balance 720,093 83,981 70,214 70,214 65,914 (4,300) -6%
Ending Fund Balance 83,981$ 70,214$ 60,684$ 65,914$ 64,514$ (1,400)$ -2%
Note:
Increase in budgeted revenue is due to new gas taxes that were passed at the State level, the majority of which will
be transferred to the General Fund to reimburse the cost of resurfacing.
38

City of Foley
Special Revenue Funds
Court Corrections Fund
% Change
(audited) (audited) (amended) Change From
FY 2017 FY 2018 FY 2019 FY 2019 FY 2020 From FY 19 FY 19 to
Actual Actual Budgeted Projection Budgeted to FY 20 FY 20
Revenues
Fines and forfeitures 53,235$ 49,313$ 51,000$ 48,000$ 48,000$ -$ 0%
Interest and rental income 95 123 125 150 150 - 0%
Total Revenues 53,330 49,436 51,125 48,150 48,150 - 0%
Expenditures
General government 41,327 38,255 51,400 44,816 48,650 3,834 9%
Total Expenditures 41,327 38,255 51,400 44,816 48,650 3,834 9%
Excess (deficiency) of revenues
over expenditures 12,003 11,181 (275) 3,334 (500) (3,834) -115%
Other financing sources (uses)
Transfers out - - - - - - 0%
Total other financing - - - - - - 0%
sources (uses)
Net change in fund balances 12,003 11,181 (275) 3,334 (500) (3,834) -115%
Beginning Fund Balance 37,026 49,029 60,210 60,210 63,544 3,334 6%
Ending Fund Balance 49,029$ 60,210$ 59,935$ 63,544$ 63,044$ (500)$ -1%
39

City of Foley
Special Revenue Funds
Jail Corrections Fund
% Change
(audited) (audited) (amended) Change From
FY 2017 FY 2018 FY 2019 FY 2019 FY 2020 From FY 19 FY 19 to
Actual Actual Budgeted Projection Budgeted to FY 20 FY 20
Revenues
Charges for services 7,348$ 10,050$ 7,000$ 10,000$ 10,000$ -$ 0%
Fines and forfeitures 35,490 32,876 34,000 32,000 32,000 - 0%
Interest and rental income 222 315 300 390 350 (40) -10%
Total Revenues 43,060 43,241 41,300 42,390 42,350 (40) 0%
Expenditures
Public safety 2,045 3,494 3,580 4,359 - (4,359) -100%
Capital outlay - - 28,777 28,777 135,000 106,223 369%
Total Expenditures 2,045 3,494 32,357 33,136 135,000 101,864 307%
Excess (deficiency) of revenues
over expenditures 41,015 39,747 8,943 9,254 (92,650) (101,904) -1101%
Other financing sources (uses)
Transfers out - - - - - - 0%
Total other financing - - - - - - 0%
sources (uses)
Net change in fund balances 41,015 39,747 8,943 9,254 (92,650) (101,904) -1101%
Beginning Fund Balance 78,610 119,625 159,372 159,372 168,626 9,254 6%
Ending Fund Balance 119,625$ 159,372$ 168,315$ 168,626$ 75,976$ (92,650)$ -55%
Note:
The Police Department is budgeting to spend some of the restricted Jail Corrections Funds in FY 20. These are non-
reoccurring capital purchases.
40

City of Foley
Special Revenue Funds
Foley Sports Tourism – Event Center
% Change
(audited) (audited) (amended) Change From
FY 2017 FY 2018 FY 2019 FY 2019 FY 2020 From FY 19 FY 19 to
Actual Actual Budgeted Projection Budgeted to FY 20 FY 20
Revenues
Charges for services -$ 8,050$ 12,000$ 18,500$ 18,750$ 250$ 1%
Interest and rental income - - 500 - - 0%
Contributions and donations - - 70,000 - 41,000 41,000 100%
Total Revenues - 8,050 82,500 18,500 59,750 41,250 223%
Expenditures
Culture and recreation - 355,338 341,560 337,762 346,300 8,538 3%
Total Expenditures - 355,338 341,560 337,762 346,300 8,538 3%
Excess (deficiency) of revenues
over expenditures - (347,288) (259,060) (319,262) (286,550) 32,712 -10%
Other financing sources (uses)
Transfers in - 347,388 264,200 319,262 286,550 (32,712) 0%
Total other financing - 347,388 264,200 319,262 286,550 (32,712) 0%
sources (uses)
Net change in fund balances - 100 5,140 - - - 0%
Beginning Fund Balance - - 100 100 100 - 0%
Ending Fund Balance -$ 100$ 5,240$ 100$ 100$ -$ 0%
41

City of Foley
Special Revenue Funds
Foley Sports Tourism – Multi-Use Fields
% Change
(audited) (audited) (amended) Change From
FY 2017 FY 2018 FY 2019 FY 2019 FY 2020 From FY 19 FY 19 to
Actual Actual Budgeted Projection Budgeted to FY 20 FY 20
Revenues
Charges for services -$ 10,357$ 12,500$ 11,500$ 11,100$ (400)$ -3%
Interest and rental income - - 500 - - 0%
Contributions and donations - - 75,000 51,750 60,000 8,250 16%
Total Revenues - 10,357 88,000 63,250 71,100 7,850 12%
Expenditures
Culture and recreation - 300,758 428,910 410,730 417,700 6,970 2%
Total Expenditures - 300,758 428,910 410,730 417,700 6,970 2%
Excess (deficiency) of revenues
over expenditures - (290,401) (340,910) (347,480) (346,600) 880 0%
Other financing sources (uses)
Transfers in - 290,501 339,935 347,480 346,600 (880) 0%
Total other financing - 290,501 339,935 347,480 346,600 (880) 0%
sources (uses)
Net change in fund balances - 100 (975) - - - 0%
Beginning Fund Balance - - 100 100 100 - 0%
Ending Fund Balance -$ 100$ (875)$ 100$ 100$ -$ 0%
42

Public Facilities Cooperative District of the City of Foley
Blended Component Unit
Special Revenue Fund
% Change
(audited) (audited) (amended) Change From
FY 2017 FY 2018 FY 2019 FY 2019 FY 2020 From FY 19 FY 19 to
Actual Actual Budgeted Projection Budgeted to FY 20 FY 20
Revenues
Interest and rental income 101,514$ 92,147$ 106,504$ 106,504$ 106,504$ -$ 0%
Other 1,086,524 1,772,943 1,959,000 1,963,000 2,399,900 436,900 22%
Total Revenues 1,188,038 1,865,090 2,065,504 2,069,504 2,506,404 436,900 21%
Expenditures
General government 6,811 65,183 26,900 6,742 16,800 10,058 149%
Principal 1,015,000 1,040,000 1,075,000 1,075,000 65,000 (1,010,000) -94%
Interest 588,715 559,465 529,465 529,465 273,928 (255,537) -48%
Total Expenditures 1,610,526 1,664,648 1,631,365 1,611,207 355,728 (1,255,479) -78%
Excess (deficiency) of revenues
over expenditures (422,488) 200,442 434,139 458,297 2,150,676 1,692,379 369%
Other financing sources (uses)
Transfers in 1,602,880 1,610,057 1,604,465 1,604,465 338,928 (1,265,537) -79%
Transfers out (1,187,282) (1,897,548) (2,009,290) (2,028,166) (2,459,404) (431,238) 21%
Total other financing 415,598 (287,491) (404,825) (423,701) (2,120,476) (1,696,775) 400%
sources (uses)
Net change in fund balances (6,890) (87,049) 29,314 34,596 30,200 (4,396) -13%
Beginning Fund Balance 2,421,856 2,414,966 2,327,917 2,327,917 2,362,513 34,596 1%
Ending Fund Balance 2,414,966$ 2,327,917$ 2,357,231$ 2,362,513$ 2,392,713$ 30,200$ 1%
Notes:
The PFCD Board met on August 5th, 2019, and passed Resolution # 19-0001-PFCD adopting the FY 2020 budget.
In September 2019, the City refinanced the balance of the PFCD’s remaining 2009 special revenue bonds. The
activity related to the refinancing is not included in the FY 19 projections, as the refinance was approved the same
day the budget was presented to Mayor and Council. The budgeted debt service in FY 2020 for the PFCD is the
2016 Special Revenue bonds that are held in the PFCD. The new debt service is budgeted in the City of Foley’s
2019 Series General Obligation Warrant Fund.
43

Public Athletic & Sports Facilities Cooperative District of the City of Foley
Blended Component Unit
Special Revenue Fund
% Change
(audited) (audited) (amended) Change From
FY 2017 FY 2018 FY 2019 FY 2019 FY 2020 From FY 19 FY 19 to
Actual Actual Budgeted Projection Budgeted to FY 20 FY 20
Revenues
Interest and rental income 3,901$ 10,869$ 6,500$ 6,500$ 5,000$ (1,500)$ -23%
Other 9,613 36,467 36,000 36,000 36,000 - 0%
Total Revenues 13,514 47,336 42,500 42,500 41,000 (1,500) -4%
Expenditures
Culture and recreation 151,884 624,609 401,700 401,564 1,600 (399,964) -100%
Capital outlay 480,335 235,613 977,286 977,286 - (977,286) -100%
Interest 496,853 496,853 496,853 496,853 496,853 - 0%
Total Expenditures 1,129,072 1,357,075 1,875,839 1,875,703 498,453 (1,377,250) -73%
Excess (deficiency) of revenues
over expenditures (1,115,558) (1,309,739) (1,833,339) (1,833,203) (457,453) 1,375,750 -75%
Other financing sources (uses)
Transfers in 645,355 1,028,823 2,613,687 2,613,787 498,453 (2,115,334) -81%
Transfers out (9,610) (115,270) (423,396) (421,396) - 421,396 -100%
Total other financing 635,745 913,553 2,190,291 2,192,391 498,453 (1,693,938) -77%
sources (uses)
Net change in fund balances (479,813) (396,186) 356,952 359,188 41,000 (318,188) -89%
Beginning Fund Balance 690,574 210,761 (185,425) (185,425) 173,763 359,188 -194%
Ending Fund Balance 210,761$ (185,425)$ 171,527$ 173,763$ 214,763$ 41,000$ 24%
Notes:
The PASFCD Board met on August 5th, 2019, and passed Resolution # 19-0003-PASFCD adopting the FY 2020
budget.
Due to the unfavorable arbitration settlement of the PCEFCD project, management chose to negotiate settlement of
the multi-use field construction project which resulted in an increase of $1,327,286 from the original budget for
project cost and legal fees.
44
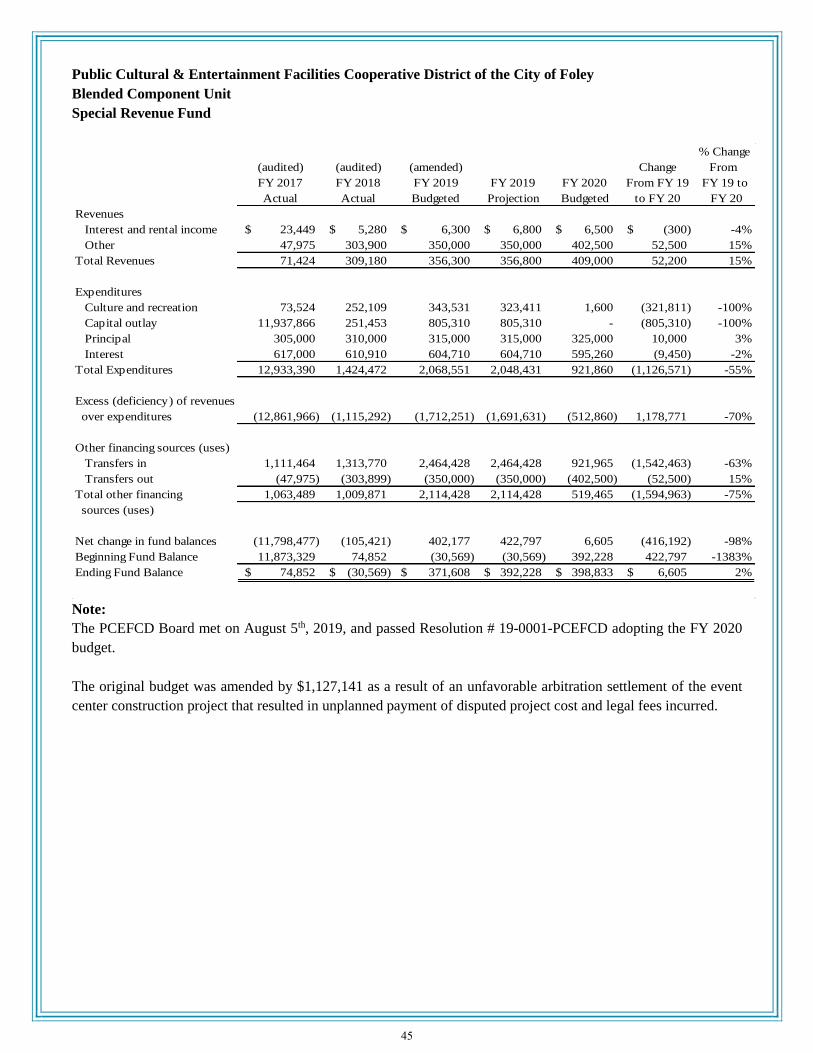
Public Cultural & Entertainment Facilities Cooperative District of the City of Foley
Blended Component Unit
Special Revenue Fund
% Change
(audited) (audited) (amended) Change From
FY 2017 FY 2018 FY 2019 FY 2019 FY 2020 From FY 19 FY 19 to
Actual Actual Budgeted Projection Budgeted to FY 20 FY 20
Revenues
Interest and rental income 23,449$ 5,280$ 6,300$ 6,800$ 6,500$ (300)$ -4%
Other 47,975 303,900 350,000 350,000 402,500 52,500 15%
Total Revenues 71,424 309,180 356,300 356,800 409,000 52,200 15%
Expenditures
Culture and recreation 73,524 252,109 343,531 323,411 1,600 (321,811) -100%
Capital outlay 11,937,866 251,453 805,310 805,310 - (805,310) -100%
Principal 305,000 310,000 315,000 315,000 325,000 10,000 3%
Interest 617,000 610,910 604,710 604,710 595,260 (9,450) -2%
Total Expenditures 12,933,390 1,424,472 2,068,551 2,048,431 921,860 (1,126,571) -55%
Excess (deficiency) of revenues
over expenditures (12,861,966) (1,115,292) (1,712,251) (1,691,631) (512,860) 1,178,771 -70%
Other financing sources (uses)
Transfers in 1,111,464 1,313,770 2,464,428 2,464,428 921,965 (1,542,463) -63%
Transfers out (47,975) (303,899) (350,000) (350,000) (402,500) (52,500) 15%
Total other financing 1,063,489 1,009,871 2,114,428 2,114,428 519,465 (1,594,963) -75%
sources (uses)
Net change in fund balances (11,798,477) (105,421) 402,177 422,797 6,605 (416,192) -98%
Beginning Fund Balance 11,873,329 74,852 (30,569) (30,569) 392,228 422,797 -1383%
Ending Fund Balance 74,852$ (30,569)$ 371,608$ 392,228$ 398,833$ 6,605$ 2%
Note:
The PCEFCD Board met on August 5th, 2019, and passed Resolution # 19-0001-PCEFCD adopting the FY 2020
budget.
The original budget was amended by $1,127,141 as a result of an unfavorable arbitration settlement of the event
center construction project that resulted in unplanned payment of disputed project cost and legal fees incurred.
45
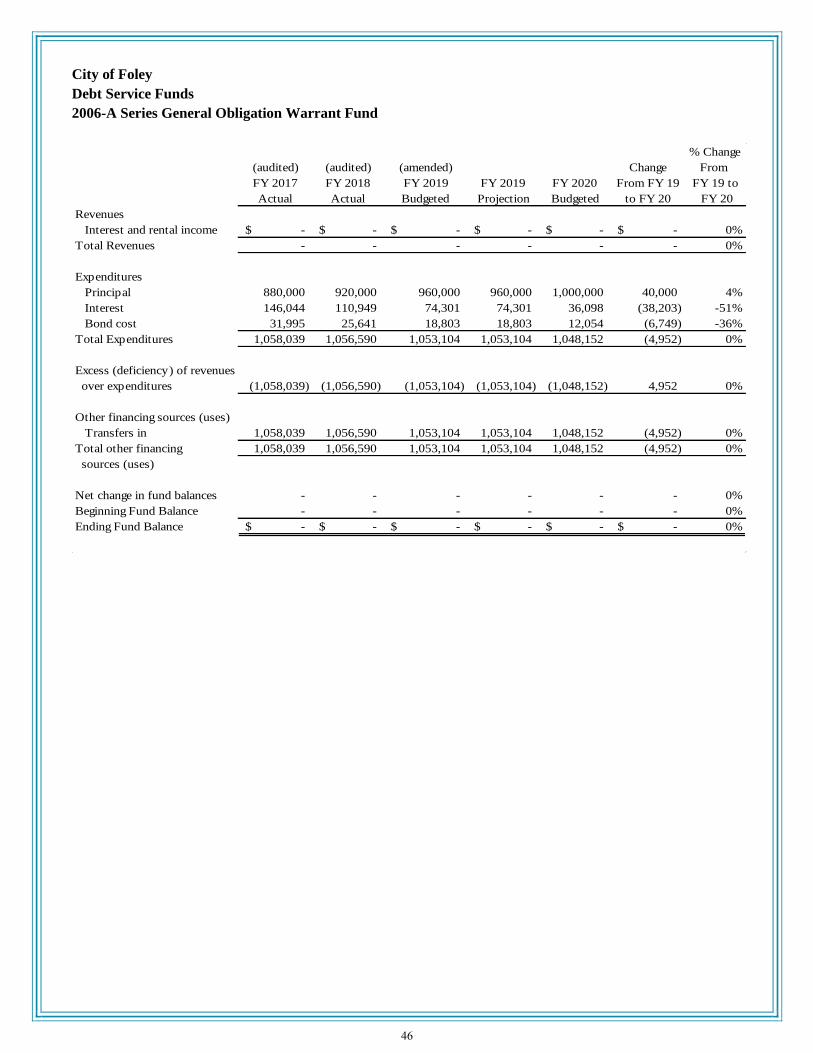
City of Foley
Debt Service Funds
2006-A Series General Obligation Warrant Fund
% Change
(audited) (audited) (amended) Change From
FY 2017 FY 2018 FY 2019 FY 2019 FY 2020 From FY 19 FY 19 to
Actual Actual Budgeted Projection Budgeted to FY 20 FY 20
Revenues
Interest and rental income -$ -$ -$ -$ -$ -$ 0%
Total Revenues - - - - - - 0%
Expenditures
Principal 880,000 920,000 960,000 960,000 1,000,000 40,000 4%
Interest 146,044 110,949 74,301 74,301 36,098 (38,203) -51%
Bond cost 31,995 25,641 18,803 18,803 12,054 (6,749) -36%
Total Expenditures 1,058,039 1,056,590 1,053,104 1,053,104 1,048,152 (4,952) 0%
Excess (deficiency) of revenues
over expenditures (1,058,039) (1,056,590) (1,053,104) (1,053,104) (1,048,152) 4,952 0%
Other financing sources (uses)
Transfers in 1,058,039 1,056,590 1,053,104 1,053,104 1,048,152 (4,952) 0%
Total other financing 1,058,039 1,056,590 1,053,104 1,053,104 1,048,152 (4,952) 0%
sources (uses)
Net change in fund balances - - - - - - 0%
Beginning Fund Balance - - - - - - 0%
Ending Fund Balance -$ -$ -$ -$ -$ -$ 0%
46
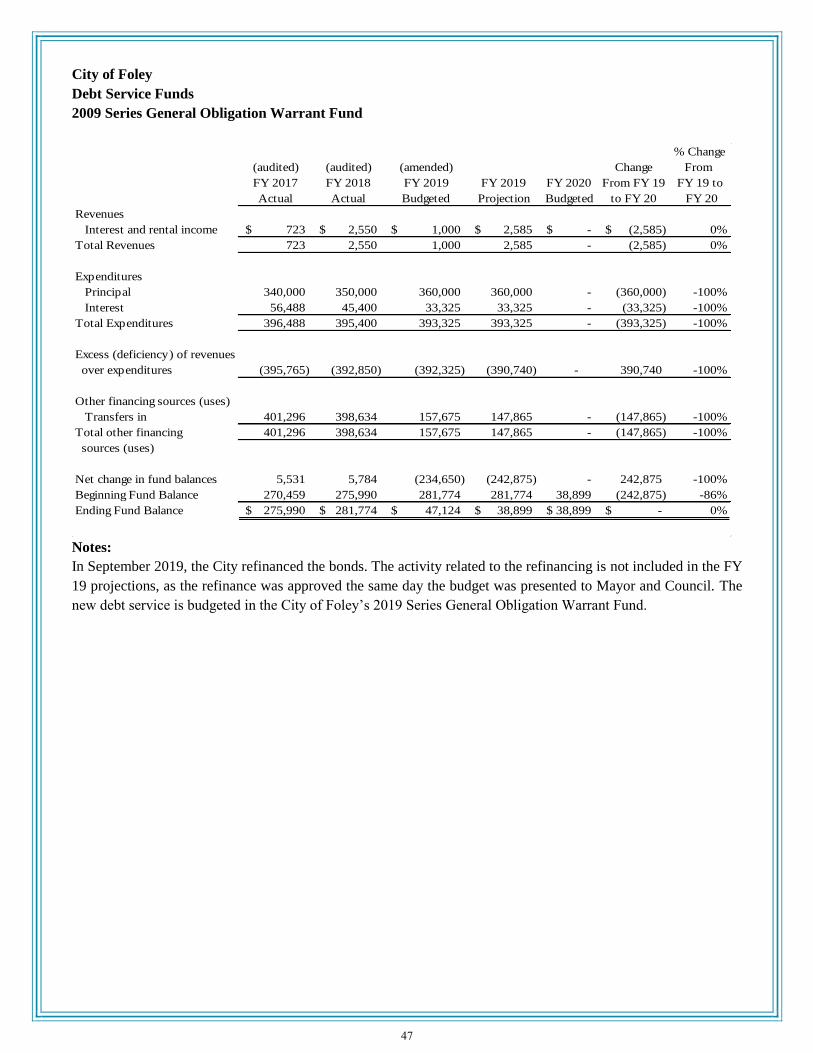
City of Foley
Debt Service Funds
2009 Series General Obligation Warrant Fund
% Change
(audited) (audited) (amended) Change From
FY 2017 FY 2018 FY 2019 FY 2019 FY 2020 From FY 19 FY 19 to
Actual Actual Budgeted Projection Budgeted to FY 20 FY 20
Revenues
Interest and rental income 723$ 2,550$ 1,000$ 2,585$ -$ (2,585)$ 0%
Total Revenues 723 2,550 1,000 2,585 - (2,585) 0%
Expenditures
Principal 340,000 350,000 360,000 360,000 - (360,000) -100%
Interest 56,488 45,400 33,325 33,325 - (33,325) -100%
Total Expenditures 396,488 395,400 393,325 393,325 - (393,325) -100%
Excess (deficiency) of revenues
over expenditures (395,765) (392,850) (392,325) (390,740) - 390,740 -100%
Other financing sources (uses)
Transfers in 401,296 398,634 157,675 147,865 - (147,865) -100%
Total other financing 401,296 398,634 157,675 147,865 - (147,865) -100%
sources (uses)
Net change in fund balances 5,531 5,784 (234,650) (242,875) - 242,875 -100%
Beginning Fund Balance 270,459 275,990 281,774 281,774 38,899 (242,875) -86%
Ending Fund Balance 275,990$ 281,774$ 47,124$ 38,899$ 38,899$ -$ 0%
Notes:
In September 2019, the City refinanced the bonds. The activity related to the refinancing is not included in the FY
19 projections, as the refinance was approved the same day the budget was presented to Mayor and Council. The
new debt service is budgeted in the City of Foley’s 2019 Series General Obligation Warrant Fund.
47

City of Foley
Debt Service Funds
Qualified Energy Conservation Bond of 2013
% Change
(audited) (audited) (amended) Change From
FY 2017 FY 2018 FY 2019 FY 2019 FY 2020 From FY 19 FY 19 to
Actual Actual Budgeted Projection Budgeted to FY 20 FY 20
Revenues
Interest and rental income 240$ 753$ 500$ 1,000$ 1,000$ -$ 0%
Other 78,924 76,358 73,465 73,625 70,500 (3,125) -4%
Total Revenues 79,164 77,111 73,965 74,625 71,500 (3,125) 0%
Expenditures
Principal 95,000 95,000 100,000 100,000 105,000 5,000 5%
Interest 99,880 98,455 96,368 96,368 93,550 (2,818) -3%
Total Expenditures 194,880 193,455 196,368 196,368 198,550 2,182 1%
Excess (deficiency) of revenues
over expenditures (115,716) (116,344) (122,403) (121,743) (127,050) (5,307) 4%
Other financing sources (uses)
Transfers in 115,898 120,430 124,578 125,159 127,050 1,891 2%
Total other financing 115,898 120,430 124,578 125,159 127,050 1,891 2%
sources (uses)
Net change in fund balances 182 4,086 2,175 3,416 - (3,416) -100%
Beginning Fund Balance 71,270 71,452 75,538 75,538 78,954 3,416 5%
Ending Fund Balance 71,452$ 75,538$ 77,713$ 78,954$ 78,954$ -$ 0%
48
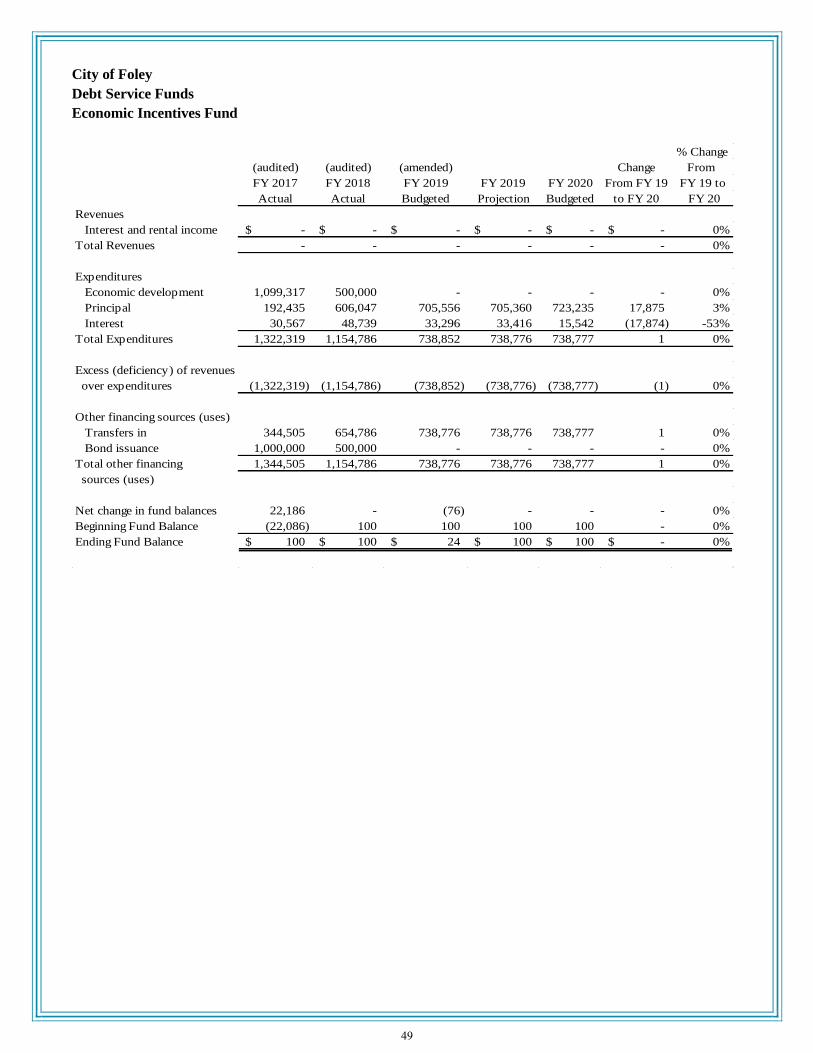
City of Foley
Debt Service Funds
Economic Incentives Fund
% Change
(audited) (audited) (amended) Change From
FY 2017 FY 2018 FY 2019 FY 2019 FY 2020 From FY 19 FY 19 to
Actual Actual Budgeted Projection Budgeted to FY 20 FY 20
Revenues
Interest and rental income -$ -$ -$ -$ -$ -$ 0%
Total Revenues - - - - - - 0%
Expenditures
Economic development 1,099,317 500,000 - - - - 0%
Principal 192,435 606,047 705,556 705,360 723,235 17,875 3%
Interest 30,567 48,739 33,296 33,416 15,542 (17,874) -53%
Total Expenditures 1,322,319 1,154,786 738,852 738,776 738,777 1 0%
Excess (deficiency) of revenues
over expenditures (1,322,319) (1,154,786) (738,852) (738,776) (738,777) (1) 0%
Other financing sources (uses)
Transfers in 344,505 654,786 738,776 738,776 738,777 1 0%
Bond issuance 1,000,000 500,000 - - - - 0%
Total other financing 1,344,505 1,154,786 738,776 738,776 738,777 1 0%
sources (uses)
Net change in fund balances 22,186 - (76) - - - 0%
Beginning Fund Balance (22,086) 100 100 100 100 - 0%
Ending Fund Balance 100$ 100$ 24$ 100$ 100$ -$ 0%
49

City of Foley
Debt Service Funds
2014 Series General Obligation Warrant Fund
% Change
(audited) (audited) (amended) Change From
FY 2017 FY 2018 FY 2019 FY 2019 FY 2020 From FY 19 FY 19 to
Actual Actual Budgeted Projection Budgeted to FY 20 FY 20
Revenues
Interest and rental income 2,574$ 8,360$ 7,000$ 14,000$ 11,000$ (3,000)$ 0%
Total Revenues 2,574 8,360 7,000 14,000 11,000 (3,000) 0%
Expenditures
Principal 940,000 960,000 980,000 980,000 1,000,000 20,000 2%
Interest 554,529 535,729 516,529 516,529 496,929 (19,600) -4%
Total Expenditures 1,494,529 1,495,729 1,496,529 1,496,529 1,496,929 400 0%
Excess (deficiency) of revenues
over expenditures (1,491,955) (1,487,369) (1,489,529) (1,482,529) (1,485,929) (3,400) 0%
Other financing sources (uses)
Transfers in 1,492,984 1,489,234 1,496,662 1,496,662 1,496,929 267 0%
Total other financing 1,492,984 1,489,234 1,496,662 1,496,662 1,496,929 267 0%
sources (uses)
Net change in fund balances 1,029 1,865 7,133 14,133 11,000 (3,133) -22%
Beginning Fund Balance 498,572 499,601 501,466 501,466 515,599 14,133 3%
Ending Fund Balance 499,601$ 501,466$ 508,599$ 515,599$ 526,599$ 11,000$ 2%
50

City of Foley
Debt Service Funds
2015 Series General Obligation Warrant Fund
% Change
(audited) (audited) (amended) Change From
FY 2017 FY 2018 FY 2019 FY 2019 FY 2020 From FY 19 FY 19 to
Actual Actual Budgeted Projection Budgeted to FY 20 FY 20
Revenues
Interest and rental income 752$ 2,490$ 2,500$ 4,325$ 4,200$ (125)$ 0%
Total Revenues 752 2,490 2,500 4,325 4,200 (125) 0%
Expenditures
Principal 290,000 305,000 320,000 320,000 340,000 20,000 6%
Interest 157,750 143,251 128,000 128,000 112,000 (16,000) -13%
Total Expenditures 447,750 448,251 448,000 448,000 452,000 4,000 1%
Excess (deficiency) of revenues
over expenditures (446,998) (445,761) (445,500) (443,675) (447,800) (4,125) 1%
Other financing sources (uses)
Transfers in 446,776 446,237 449,667 449,667 451,167 1,500 0%
Total other financing 446,776 446,237 449,667 449,667 451,167 1,500 0%
sources (uses)
Net change in fund balances (222) 476 4,167 5,992 3,367 (2,625) -44%
Beginning Fund Balance 187,361 187,139 187,615 187,615 193,607 5,992 3%
Ending Fund Balance 187,139$ 187,615$ 191,782$ 193,607$ 196,974$ 3,367$ 2%
51
City of Foley
Debt Service Funds
2019 Series General Obligation Warrant Fund
% Change
(audited) (audited) (amended) Change From
FY 2017 FY 2018 FY 2019 FY 2019 FY 2020 From FY 19 FY 19 to
Actual Actual Budgeted Projection Budgeted to FY 20 FY 20
Revenues
Interest and rental income -$ -$ -$ -$ 1,000$ 1,000$ 0%
Total Revenues - - - - 1,000 1,000 0%
Expenditures
Principal - - - - 40,000 40,000 100%
Interest - - - - 243,042 243,042 0%
Total Expenditures - - - - 283,042 283,042 100%
Excess (deficiency) of revenues
over expenditures - - - - (282,042) (282,042) 100%
Other financing sources (uses)
Transfers in - - - - 283,042 283,042 100%
Total other financing - - - - 283,042 283,042 100%
sources (uses)
Net change in fund balances - - - - 1,000 1,000 100%
Beginning Fund Balance - - - - - - 0%
Ending Fund Balance -$ -$ -$ -$ 1,000$ 1,000$ 100%
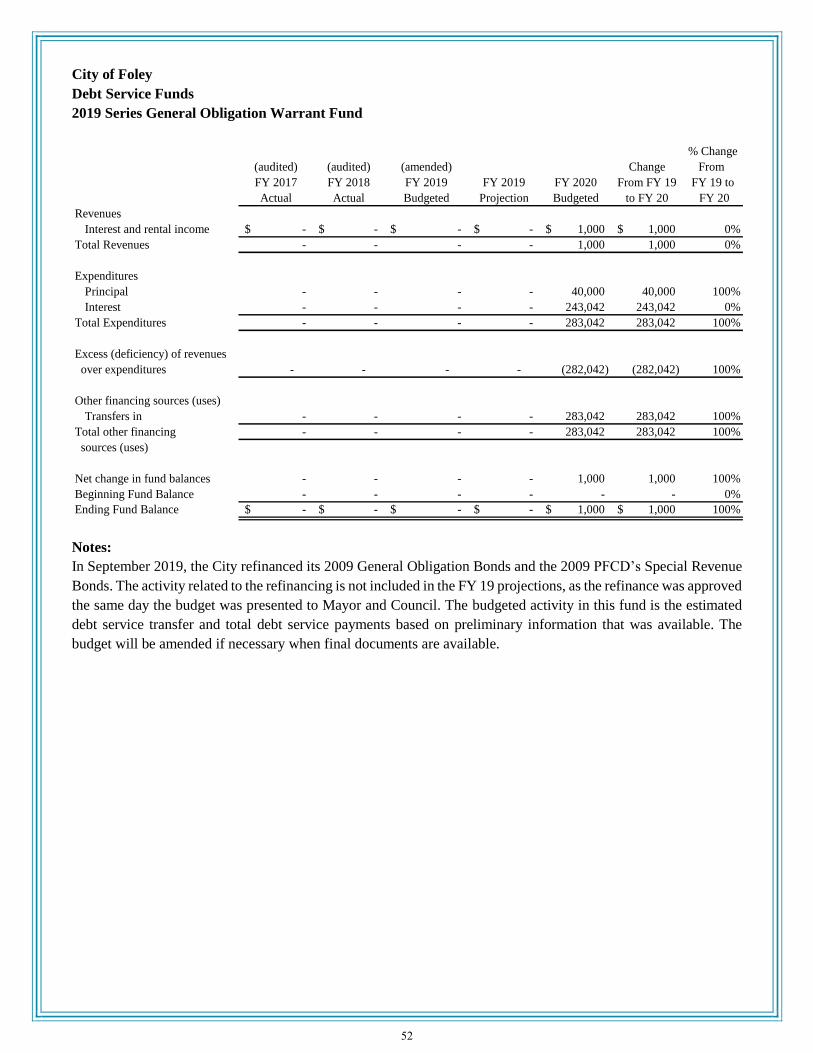
Notes:
In September 2019, the City refinanced its 2009 General Obligation Bonds and the 2009 PFCD’s Special Revenue
Bonds. The activity related to the refinancing is not included in the FY 19 projections, as the refinance was approved
the same day the budget was presented to Mayor and Council. The budgeted activity in this fund is the estimated
debt service transfer and total debt service payments based on preliminary information that was available. The
budget will be amended if necessary when final documents are available.
52

Coastal Alabama Farmers’ and Fishermen’s Market, Inc.
Blended Component Unit
Business Type Activity
% Change
(audited) (audited) (amended) Change From
FY 2017 FY 2018 FY 2019 FY 2019 FY 2020 From FY 19 FY 19 to
Actual Actual Budgeted Projection Budgeted to FY 20 FY 20
Operating revenues
Charges for service 371,151$ 406,462$ 414,840$ 430,599$ 494,834$ 64,235$ 15%
Intergovernmental 22,200 - - - 50,318 50,318 100%
Other 2,671 664 500 200 200 - 0%
Total operating revenues 396,022 407,126 415,340 430,799 545,352 114,553 27%
Operating expenses
Legal and professional 19,367 17,612 15,000 30,000 15,000 (15,000) -50%
Insurance 58,623 63,192 68,870 68,804 69,120 316 0%
Utilities 27,671 22,074 22,750 22,065 22,280 215 1%
Maintenance 21,647 14,357 262,624 260,000 30,000 (230,000) -88%
Advertising 36,510 6,069 20,000 11,000 11,000 - 0%
Contracted services 40,519 43,240 53,000 45,000 45,000 - 0%
Miscellaneous 3,879 9,091 11,750 9,200 38,100 28,900 314%
Depreciation 262,853 283,617 236,828 236,828 236,828 - 0%
Total Operating expenses 471,069 459,252 690,822 682,897 467,328 (215,569) -32%
Operating income (loss) (75,047) (52,126) (275,482) (252,098) 78,024 330,122 -131%
Non-operating revenues
Interest expense (122,167) (128,612) (128,600) (133,870) (88,630) 45,240 -34%
Interest income 2,216 311 300 300 300 - 0%
Total non-operating revenues, net (119,951) (128,301) (128,300) (133,570) (88,330) 45,240 -34%
Transfers in 44,628 44,628 44,628 59,504 59,504 - 0%
Changes in net position (150,370) (135,799) (359,154) (326,164) 49,198 375,362 -115%
Net position, beginning of year (215,668) (366,038) (501,837) (501,837) (828,001) (326,164) 65%
Net position, end of year (366,038)$ (501,837)$ (860,991)$ (828,001)$ (778,803)$ 49,198$ -6%
Note:
The CAFFM Board met on August 26th, 2019, and passed Resolution No. 94 adopting the FY 2020 budget.
53

Departmental Descriptions
with Financial Summary
and Personnel Information
54

General Government Department
The General Government Department is made up of 4 divisions; Administration, Finance, Human Resources and Revenue. Each division serves both the employees and the citizens of the City of Foley.
Administration Division
Mission Statement: To serve the City of Foley by providing exceptional customer service, in a timely manner, to the general public, elected officials, city staff, other governmental agencies and community partners, and to preserve the accuracy, integrity, and public accessibility to the City’s official records.
Function: The City Clerk is the custodian of public records for the City of Foley, which includes all minutes, resolutions, ordinances, contracts and codes. The City Clerk is required to attend all City Council Meetings. The City Clerk’s office is responsible for preparing the City Council Meeting Agendas and Minutes of the City Council Meetings as well as the City Council Work Session Minutes. The City Clerk is the City’s Chief Election Official and is responsible for the administration of Municipal Elections.
Performance Goals
Design and maintain responsive systems and processes that inform the public of the City Council’s legislative actions.
Take all steps necessary to ensure transparency in the official roles of the office. Preserve and manage the City’s official records for efficient access and retrieval. Conduct elections and council and commission appointments with integrity and with broad community
outreach. Provide support services to the City Council and staff to assist them in providing excellent service to the
community.
Selected Objectives
To become known for the exceptional service we bring to the citizens, the City Council our colleges and to our profession.
Finance Division
Mission Statement: The Finance Division safeguards and protects city assets, provides effective support to city departments, and records and reports accurate and timely financial information to the administrator, elected officials and citizens of the City.
Function: The division continuously reviews internal controls in order to improve operations and compliance with laws, guidelines, and best practices pertaining to financial operations. Major functions of the division include: accounting, auditing, asset management, investments, debt management and issuance, grant accounting, risk and emergency management, budget administration, accounts payable, purchasing and bids, contract management, and project management.
Performance Goals
Produce financial and budgetary information and administer management practices that earn the City recognition and maintain or improve credit quality.
Continuously review and update departmental policies and procedures in order to maintain compliance with laws and regulations as well as current and best practices.
Develop and maintain a comprehensive set of city-wide internal controls. Provide superior support to the City’s management team and their staff through the timely submission of
information and effective process training.
55
Selected Objectives
To prepare an annual financial report in accordance with the Certificate of Achievement of Excellence in Financial Reporting Program (CAFR Program) administered by the Government Finance Officer Association.
Review various policies and procedures to ensure they align with the upgraded Version X Incode software and with current best practices, and to determine where new policies may be warranted.
To assess various City operations to determine areas susceptible to losses. To accurately process large volumes of information within established timelines.
Performance Measures
Received 5th consecutive CAFR Program award from GFOA. Prepared the City’s first submission for GFOA’s Distinguished Budget Award. Updated the Purchasing Policy, Travel and Training Policy, and the Policy for Continuing Disclosure
under SEC Rule 15c2-12 (Continuing Disclosure Policy). Implemented a Policy for Incurrence and Management of Debt, a Policy for Compliance with Tax-
Exempt Bonds with the Internal Revenue Code, and a Long-Term Financial Planning Policy. Reviewed and implemented better processes related to the Capital and Small and Attractive Asset Policy
and Procedures. Prepare to begin tracking information for future assessment of performance measures, such as assets
added, number of new vendors, invoices processed, etc.
Human Resources Division
Mission Statement: The Human Resources Division is dedicated to providing services that support and advance the success of the City of Foley through our most valuable resource: our PEOPLE. We are focused on delivering quality customer service in all personnel operations with integrity, responsiveness and sensitivity to all employees.
Function: The major tasks and responsibilities performed by the Human Resources Division of the General Government Department include the following core functions: employee compensation, benefits administration, recruitment and retention, safety and risk management, employee wellness, performance management, job analysis and classification, employee satisfaction and motivation, training and development, personnel policy formulation, interpretation and compliance of local, state, and federal employment law, as well as performing a number of other human resources related functions. The Human Resources Division works with all City departments and management in the development and implementation of a quality personnel system of policies and procedures in order to maintain a fair, equitable and positive work environment for our employees.
Performance Goals
Value, encourage, and support a diverse workforce. Continually improve HR’s involvement in individual and organizational effectiveness. Anticipate and meet the changing needs of the workforce /family. Champion career and professional growth. Enhance services through technology. Continually improve health and wellness opportunities for employees.
Selected Objectives
Recruit and retain diverse workforce. Continue to develop new and improved health and wellness programs and increase employee
participation. Continue to automate and move to paperless processes in payroll and benefit services. Update Personnel System Policy (PSP) and other personnel related policies and procedures.
56

Train all employees in substance abuse and harassment. Implement Employee Self Service (ESS) portal available through InCode V.10. Provide accurate, timely, and effective payroll and benefits administration to all city employees.
Performance Measures
Recruitment/retention percentages. Measure effectiveness of wellness initiatives/healthcare cost. Identify processes moved to paperless/automated. Personnel policy/other policies updated. ESS implemented/measure employee usage. Number of payroll & benefits processed.
Revenue Division
Mission Statement: The Revenue Division serves the business community and taxpayers of the City by providing excellent customer service with professionalism. We strive to be consistent, fair and equitable while administering local revenue related Ordinances. Our priority is to grow in efficiency as the City grows economically.
Function: The Revenue Division is responsible for providing accurate, efficient and responsive services to the business community, taxpayers and municipal officials. A large portion of duties involve payment processing, recording inter-departmental transactions, business licensing, liaison for commercial sanitation, collection of special fees, local tax and franchise agreements. It is imperative for this division to administer the City’s Ordinances in a fair and equitable manner, being both consistent and efficient while, maximizing revenues through the use of internal audits. While overseeing and administering fees and local tax, we also conduct revenue analysis to ensure revenues will meet and/or exceed budget for given periods and provide information to the general public without compromising business owner privacy and confidentiality laws.
Performance Goals
Capture unreported and/or underreported revenue through the use of internal auditing. Update revenue related Ordinances.
Selected Objectives
Educate citizens about the dangers of hiring an unlicensed business to preform services or contracting. Work with other municipal departments to ensure code compliance.
Achievements & Training
Revenue Officer and Revenue Clerk are certified as Alabama Municipal Revenue Officers Revenue Officer has taken all necessary classes to become an Alabama Certified Revenue Examiner.
Financial Summary
% Change2017 2018 2019 2019 2020 2019 to
Expenditures Actual Actual Budget Projected Budget 2020Personnel 1,438,919$ 1,412,542$ 1,424,377$ 1,404,947$ 1,422,107$ 1.22%Capital 32,031 - - - - 0.00%Operational 1,617,115 1,626,622 1,703,130 1,679,863 1,800,075 7.16%Debt Service 7,030 7,669 7,670 7,670 7,670 0.00%Total 3,095,096$ 3,046,834$ 3,135,177$ 3,092,480$ 3,229,852$ 4.44%
57

General Government Organizational Chart
Pay Classification Plan Information
Grade Min Mid Max FLSA Job Code Classification Title # of Slots
40 $27,204 $34,005 $40,806 N 1010101 Part-Time Mail Courier/Receptionist 1 60 $29,933 $37,491 $44,989 N TBD Part-Time Administrative Assistant I 1 70 $31,492 $39,365 $47,238 N 1010102 Administrative Assistant II (HR) 1 70 $31,492 $39,365 $47,238 N 1010103 Administrative Assistant II (Admin) 1 80 $33,067 $41,334 $49,600 N 1010104 Payroll Clerk 1 90 $34,720 $43,400 $52,080 N 1010105 Accounting Clerk 1 90 $34,720 $43,400 $52,080 N 1010106 Accounts Payable Clerk 2 90 $34,720 $43,400 $52,080 N 1010107 Revenue Clerk 1
100 $36,456 $45,570 $64,684 N 1010108 Assistant City Clerk 1
130 $42,203 $52,753 $63,304 E 1010109 Benefits Specialist/Safety Coordinator
1
130 $42,203 $52,753 $63,304 E 1010110 Personnel Specialist 1
150 $46,528 $58,160 $69,793 E 1010111 Grants and Special Agreements Administrator
1
190 $56,556 $70,694 $84,833 E 1010113 Accounting Supervisor 1 190 $56,556 $70,694 $84,833 E 1010114 Revenue Officer 1 200 $59,383 $74,229 $89,075 E 1010115 City Clerk 1
240 $72,181 $90,226 $108,271 E 1010116 Project & Risk Manager/EMA Director
1
270 $83,558 $104,448 $125,337 E 1010117 Finance Director/City Treasurer 1 270 $83,558 $104,448 $125,337 E 1010118 Human Resources Director 1 330 $111,976 $139,970 $167,964 E 1010119 City Administrator 1
City Administrator
Administration
City Clerk
Assistant City ClerkAdministrative Assistant
IIPart-Time Mail
Courier/Receptionist
Human Resources
Human Resources Director
Benefits Specialist/Safety Coordinator
Personnel SpecialistPayroll Clerk
Administrative Assistant IIPart-Time Administrative
Assistant I
Revenue
Revenue Officer
Revenue Clerk
Finance
Finance Director/City Treasurer
Accounting Supervisor
Grants & Special Agreements
Administrator Accounting Clerk
Project & Risk Manager/EMA Director Accounts Payable Clerk
58
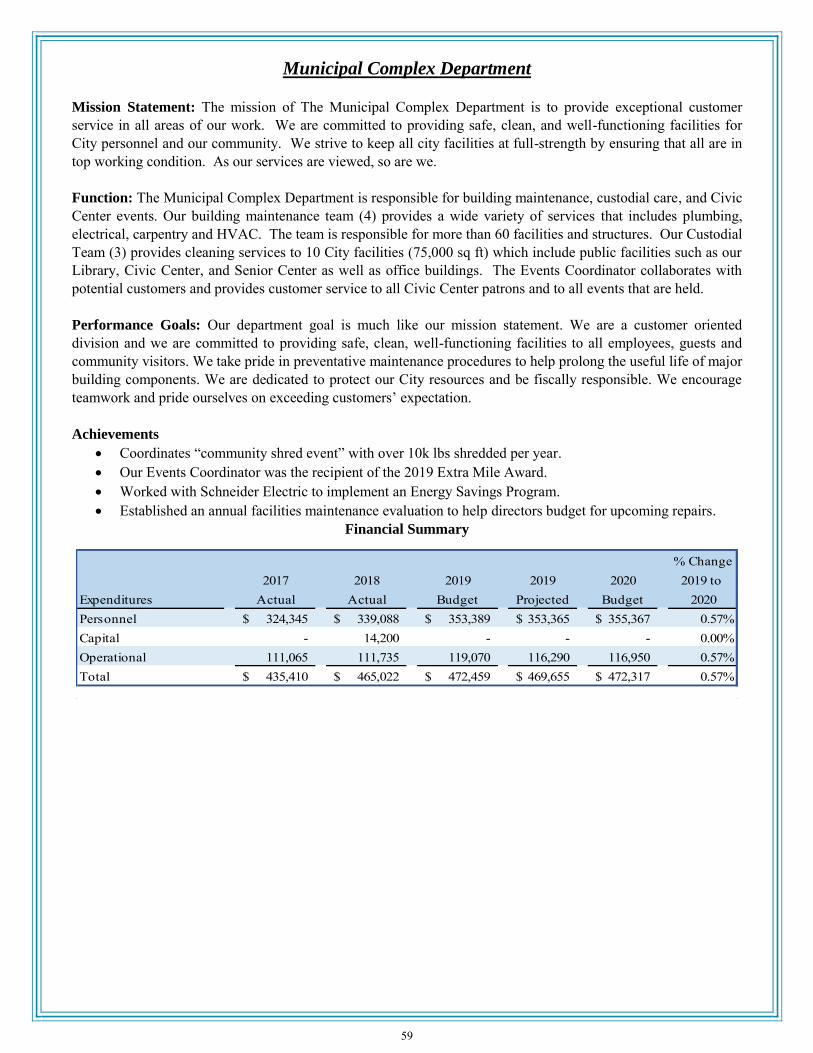
Municipal Complex Department
Mission Statement: The mission of The Municipal Complex Department is to provide exceptional customer service in all areas of our work. We are committed to providing safe, clean, and well-functioning facilities for City personnel and our community. We strive to keep all city facilities at full-strength by ensuring that all are in top working condition. As our services are viewed, so are we. Function: The Municipal Complex Department is responsible for building maintenance, custodial care, and Civic Center events. Our building maintenance team (4) provides a wide variety of services that includes plumbing, electrical, carpentry and HVAC. The team is responsible for more than 60 facilities and structures. Our Custodial Team (3) provides cleaning services to 10 City facilities (75,000 sq ft) which include public facilities such as our Library, Civic Center, and Senior Center as well as office buildings. The Events Coordinator collaborates with potential customers and provides customer service to all Civic Center patrons and to all events that are held. Performance Goals: Our department goal is much like our mission statement. We are a customer oriented division and we are committed to providing safe, clean, well-functioning facilities to all employees, guests and community visitors. We take pride in preventative maintenance procedures to help prolong the useful life of major building components. We are dedicated to protect our City resources and be fiscally responsible. We encourage teamwork and pride ourselves on exceeding customers’ expectation. Achievements
Coordinates “community shred event” with over 10k lbs shredded per year. Our Events Coordinator was the recipient of the 2019 Extra Mile Award. Worked with Schneider Electric to implement an Energy Savings Program. Established an annual facilities maintenance evaluation to help directors budget for upcoming repairs.
Financial Summary
% Change2017 2018 2019 2019 2020 2019 to
Expenditures Actual Actual Budget Projected Budget 2020Personnel 324,345$ 339,088$ 353,389$ 353,365$ 355,367$ 0.57%Capital - 14,200 - - - 0.00%Operational 111,065 111,735 119,070 116,290 116,950 0.57%Total 435,410$ 465,022$ 472,459$ 469,655$ 472,317$ 0.57%
59

Municipal Complex Organizational Chart
Pay Classification Plan Information
Grade Min Mid Max FLSA Job Code Classification Title # of Slots
20 $24,675 $30,844 $37,013 N 1020101 Building Custodian 3 70 $31,492 $39,365 $47,238 N 1020102 Building Maintenance Technician I 1 70 $31,492 $39,365 $47,238 N 1020103 Events Coordinator 1 90 $34,720 $43,400 $52,080 N 1020104 Building Maintenance Technician II 2
120 $40,193 $50,241 $60,289 N 1020105 Building Maintenance Technician III 1 220 $65,470 $81,838 $98,205 E 5070103 Director of Senior Services &
Municipal Complex *
*This payroll cost is budgeted under the Senior Center Department.
Director of Senior Services & Municipal Complex
Building Maintenance Technician IIIBuilding Maintenance Technician IIBuilding Maintenance Technician I
Events Coordinator Building Custodian
60

Municipal Court Mission Statement: The mission of the Foley Municipal Court is to ensure compliance with all state laws and city ordinances while providing quality services, thereby earning and maintaining the public’s respect and confidence. Municipal Court Functions:
Municipal Court Judge: The Municipal Court Judge presides over the Municipal Court Clerk and Magistrates, and hears any cases brought before the Foley Municipal Court. The position of Municipal Court Judge is created by the Code of Alabama and directed by the Supreme Court and the Administrative Office of Courts. The Judge must be an attorney and is appointed and approved by the Mayor and City Council. Municipal Court Clerk: The Municipal Court Clerk is responsible for the administration of the Municipal Court and its records, finances and employees, and ensures compliance with all city ordinances and state and municipal laws. Also, as a magistrate, accepts fine payments, issues warrants, has probable cause hearings, and does initial Appearance/Bond hearings with incarcerated defendants. Municipal Court Magistrate: The Municipal Court Magistrate accepts payments of fines, guilty pleas, holds probable cause hearings, and issues warrants. The Magistrate holds initial appearance/bond hearings with incarcerated defendants, as well as manages the clerical duties of the case files of the Court.
Goals:
Goals are established by the Municipal Judge, command staff, and all employees within the Foley Municipal Court. The following are general goals established throughout the court. 1. Fairly and impartially adjudicate traffic and misdemeanor cases. 2. Effectively maintain information and records. 3. Assist citizens in the resolution of cases. 4. Improve caseload management. 5. Reduce inmate population. 6. Reduce outstanding warrants. 7. Reduce size of docket. Key Measures:
Projected
Cases Filed 2016 2017 2018 2019
DUI 189 151 152 112Other Traffic 4,470 4,368 4,258 3,670Non-Traffic 1,963 2,046 2,066 1,713Total 6,622 6,565 6,476 5,495
Projected
Cases Disposed 2016 2017 2018 2019
DUI 174 169 179 207Other Traffic 4,064 4,493 4,105 4,146Non-Traffic 1,871 1,981 1,997 1,908Total 6,109 6,643 6,281 6,261
61

Projected
2016 2017 2018 2019
Revenues 643,141$ 640,538$ 585,936$ 618,889$ Disbursements 577,740 565,292 531,408 488,806 Total 1,220,881$ 1,205,831$ 1,117,344$ 1,107,695$
Major Accomplishments: Reduced the outstanding warrants by sending notification to defendants and purging warrants 10 years old and older. Decreased the size of dockets by using credit card payments and online payments. Started the Pre-Trial Intervention program. Allowed defendants to plead to contempt of court and pay a contempt fee in lieu of being arrested, minimizing court dockets.
Financial Summary
% Change2017 2018 2019 2019 2020 2019 to
Expenditures Actual Actual Budget Projected Budget 2020Personnel 342,310$ 354,370$ 389,301$ 376,054$ 396,826$ 5.52%Capital - - - - - 0.00%Operational 4,043 2,589 42,905 33,903 2,710 -92.01%Total 346,353$ 356,959$ 432,206$ 409,957$ 399,536$ -2.54%
Municipal Court Organizational Chart
Pay Classification Plan Information
Grade Min Mid Max FLSA Job Code Classification Title # of Slots
90 $34,720 $43,400 $52,080 N 1030101 Magistrate I 1 110 $38,279 $47,849 $57,419 N 1030102 Magistrate II 3 110 $38,279 $47,849 $57,419 E 1030105 Part-Time Municipal Judge 1 130 $42,203 $52,753 $63,604 E 1030103 Magistrate III 1 190 $56,556 $70,694 $84,833 E 1030104 Municipal Court
Clerk/Administrator 1
Part-Time Municipal JudgeMunicipal Court Clerk / Administrator
Magistrate IIIMagistrate IIMagistrate I
62

Office of Information Technology & Geographic Information Systems Mission Statement: To provide outstanding technology support services while practicing excellent stewardship of our information resources, ensuring that our government is properly equipped to serve our citizens and community. Function: The IT/GIS Department provides technical support for all City operations and is responsible for the technical analysis, design, procurement, implementation, operation, planning, and support of computing infrastructure, applications, data, and services. Our intent is to align our goals and objectives with the priorities of the City and provide strategic IT vision and enterprising solutions for all departments so they may be able to meet their goals, deliver results, and enhance services to the citizens of Foley. Performance Goals
To have established and documented policies for access and use of City technology resources. To reduce or minimize spending and maximize return on investment wherever feasible and reasonable. To ensure regulatory compliance of our infrastructure, applications, and data.
Selected Objectives
Create/update policies and procedures. Identify and act upon opportunities to either reduce spending or find methods to enhance performance
without an expenditure increase. Assess our cybersecurity vulnerabilities and audit our compliance with established regulations,
remediating where necessary. Performance Measures
Systems average uptime/availably. Network average uptime/availability. Help desk tickets closed. Number of security breaches affection production. Number of major incidents affecting production. Number of evaluations/updates of publicly accessible GIS Data.
Financial Summary
% Change2017 2018 2019 2019 2020 2019 to
Expenditures Actual Actual Budget Projected Budget 2020Personnel 255,008$ 279,718$ 332,716$ 333,463$ 342,683$ 2.76%Capital - - 10,000 - - 0Operational 344,085 384,080 454,020 448,137 477,360 6.52%Debt Service 30,935 31,311 26,793 26,793 7,590 -71.67%Total 630,029$ 695,109$ 823,529$ 808,393$ 827,633$ 2.38%
63

IT/GIS Organizational Chart
Pay Classification Plan Information
Grade Min Mid Max FLSA Job Code Classification Title # of Slots
90 $34,720 $43,400 $52,080 N 1040101 IT Technician I 1 120 $40,193 $50,241 $60,289 N 1040102 IT Technician II 1 150 $46,528 $58,160 $69,793 E 1040103 GIS Specialist 1 150 $46,528 $58,160 $69,793 N 1040104 IT Technician III 1 170 $51,298 $64,122 $76,946 E 1040105 Infrastructure Administrator 1 210 $62,352 $77,941 $93,529 E 1040106 Information Systems Manager 1
Information Systems Manager
Infrastructure Administrator
IT Technician III
IT Technician II IT Technician I GIS Specialist
64

Maintenance Shop
Mission Statement:
It is the mission of the Foley Public Works Maintenance Department to support and enhance the growth of our city while maintaining the small town character and service levels to which our residents, businesses and visitors are accustomed. The responsible implementation of efficient and cost effective public services in a safe and courteous manner is our top priority. Function: The Maintenance Department services the city’s vehicles as required for the timely provision of city services to the residents. General maintenance and repairs are provided in-house as required for all standard sized cars and trucks used by city departments, as well as the larger specialty garbage, police, and fire vehicles and equipment whenever possible. When the outsourcing of vehicle repairs is required, the services are directed and managed by the Shop Foreman.
Department Goals:
To continue the implementation of compliant digital record keeping for work order creation and completion, and to create written procedural instructions for the new processes.
Financial Summary
% Change2017 2018 2019 2019 2020 2019 to
Expenditures Actual Actual Budget Projected Budget 2020Personnel 232,754$ 255,545$ 283,356$ 283,223$ 286,541$ 1.17%Capital - 23,753 10,000 9,254 52,000 461.92%Operational 28,157 34,981 35,415 36,412 38,800 6.56%Total 260,911$ 314,280$ 328,771$ 328,889$ 377,341$ 14.73%
Maintenance Shop Organizational Chart
Pay Classification Plan Information
Grade Min Mid Max FLSA Job Code Classification Title # of Slots
20 $24,675 $30,844 $37,013 N 1050101 Mechanic Aide 1 120 $40,193 $50,241 $60,289 N 1050102 Mechanic 3 190 $56,556 $70,694 $84,833 E 1050103 Shop Foreman 1
Public Works Superintendent
Shop Foreman
Mechanic Mechanic Aide
65

Public Works
Mission Statement:
It is the mission of the Foley Public Works Department to support and enhance the growth of our City while maintaining the small town character and service levels to which our residents, businesses and visitors are accustomed. The responsible implementation of efficient and cost effective public services in a safe and courteous manner is our top priority. Function: The Public Works administrative assistants provide a friendly interface for customers to ask questions and express concerns over city provided services, while also providing intra-departmental support in the form of work orders, reports, and other miscellaneous administrative support for three supervisors and all crew leaders.
Department Goals:
To continue the implementation of compliant digital record keeping for work order creation and completion, and to create written procedural instructions for the new processes.
Financial Summary
% Change2017 2018 2019 2019 2020 2019 to
Expenditures Actual Actual Budget Projected Budget 2020Personnel 88,339$ 74,425$ 81,608$ 81,070$ 93,246$ 15.02%Capital - - - - - 0.00%Operational 41,600 39,084 48,850 48,550 56,425 16.22%Total 129,939$ 113,508$ 130,458$ 129,620$ 149,671$ 15.47%
Public Works Organizational Chart
Pay Classification Plan Information
Grade Min Mid Max FLSA Job Code Classification Title # of Slots
60 $29,993 $37,491 $44,989 N 1060101 Administrative Assistant I 1 80 $33,067 $41,334 $49,600 N 1060102 Administrative Assistant III 1
Public Works Superintendent
Administrative Assistant III
Administrative Assistant I
66

Airport
Mission Statement: The Foley Municipal Airport is a general aviation airport operated, maintained, and preserved for the benefit of the community and airport users. It is our mission to provide a safe, efficient and customer focused airport to serve our community. Function: The Foley Municipal Airport is a public airport located on approximately 125 acres in the northwest quadrant of the City. The airport has a north/south runway approximately 3,700 feet in length. Thirty-two enclosed T-Hangar units are available for lease. There are accommodations for the Fixed Base Operator (FBO) which consist of a lobby, office space, classrooms and training areas as well as a maintenance hangar.
The day-to-day operations at the airport are managed by an FBO contracted by the City. The FBO’s services include fuel sales, long-term vehicle parking, aircraft maintenance, and flight training school. The City’s Airport Manager is responsible for lease of T-Hangars, airport maintenance, repair, and projects to ensure the airport meets FAA and ALDOT operational standards. Performance Goals:
Maintain standards required by ALDOT Aeronautics Bureau for issuance of an operating license as determined by annual airport inspection.
Maintain, improve and develop airport facilities and infrastructure. Maintain revenue streams generated by lease of FBO facilities and T-Hangar units.
Selected Objectives:
Ensure that runway/taxiway lights and pavement are maintained and other operational measures required by ALDOT are in place. Maintain open communication with FBO and City maintenance crews to identify and correct any issues that arise.
Maintain a 5-year capital plan for large projects. Seek and apply for FAA and ALDOT funding for capital projects.
Maintain waiting list for T-Hangar units and fill units as vacancies arise.
Financial Summary
% Change2017 2018 2019 2019 2020 2019 to
Expenditures Actual Actual Budget Projections Budget 2020Personnel -$ -$ -$ -$ 0.00%Capital - - - - 0.00%Operational 56,922 40,331 79,330 68,704 76,800 11.78%Total 56,922$ 40,331$ 79,330$ 68,704$ 76,800$ 11.78%
There are no City employees in the airport department. The Airport Manager is located in the Finance Division of the General Government Department.
67

Police Department
Mission Statement: We will strategically and effectively police in a modern manner that ensures a safe and
secure city. We strive every day to be the best trained, best equipped, best performing police department that
serves with excellence. To achieve our mission, the Foley Police Department collaborates extensively with local,
state and federal partners from multiple communities and other public sectors.
Function: The Foley Police Departments’ strategy and vision is to interact with and become an integral part of
the lives of our citizens. We will build trust and develop partnerships and work together to lower crime and
maintain and improve the quality of life for all citizens in all neighborhoods. Our department is comprised of five
components: the Command Staff, the Patrol Division, the Criminal Investigation Division, the Administrative
Division, and the Community Safety Division.
Organizational Values:
We desire to maintain our City’s quality of life and ensure that our citizens feel safe to work, play, rest,
and raise their children in this city.
We desire that our residents and businesses enjoy a high degree of protection and police services.
We desire to police in a manner that allows our community to get to know us as approachable employees
which results in close relationships, partnerships, and professionalism.
We desire to assist in community development which in turn affects economic development for our city,
our citizens, and future generations.
We focus on crime fighting, quick police response, community relations, delivery of advanced level of
police services and professionalism.
Performance Goals: Goals are established by the Chief of Police, Command Staff and all employees within the
Foley Police Department. The following are our methods to obtaining our general goals.
We will give our absolute best and impact our community through quality police services we are proud
of.
As a department, we will always seek to reach higher levels of performance through professional and
ethical law enforcement operations and modern, proficient training.
We will always work as a professional team. Each section of the police department is an invaluable,
critical, mission-essential component of this police team.
We will practice maximum effort in pursuing offenders and protecting the innocent.
As a department, we will strive to become one large family as we serve our community.
Department Achievements: This year we saw a highly publicized narrative from the National Council for Home
Safety and Security that placed Foley in the top 10 safest cities in Alabama based on 2017 statistics.
In 2018, we experienced an uptick in some of our crime categories but overall we had a drop in total crime of
nearly 2%. As an agency, we of course would like to see some type of drop each year and never want to see it
increase. We have implemented some initiatives to target narcotics. The use and sell of narcotics brings in more
crime.
Our calls for service continue to increase in our growing city. Foley is a great place to live and our secret is out.
The governor’s office declared Foley an “Opportunity Zone”. Our Neighborhood Watch program continues to
grow as our city does. With our citizens partnership we will continue to enjoy the quality of life the City of Foley
has to offer.
68

Financial Summary
% Change
2017 2018 2019 2019 2020 2019 to
Expenditures Actual Actual Budget Projected Budget 2020
Personnel 5,598,941$ 5,861,136$ 6,207,080$ 6,216,674$ 6,376,200$ 2.57%
Capital 188,273 298,010 434,286 402,991 437,302 8.51%
Operational 909,493 935,403 1,075,606 1,057,250 1,182,900 11.88%
Total 6,696,707$ 7,094,550$ 7,716,972$ 7,676,915$ 7,996,402$ 4.16%
Police Department Organizational Chart
Part-Time City Prosecutor
Police Chief
Deputy Chief of Police
Sergeant/Professional Development
Assistant Training Officer
Commander/Administration
Div
Building Custodian
Chief Corrections
Officer
Corrections/Shift Leader
Corrections Officer
Commander/Investigations Div
Administrative Assistant II
Sgt/Intelligence
Crime Analyst / Records
Clerk
Sgt/DetectiveSgt/Narcotics
Corporal/Sex Offender
Compliance
Detective
Commander/Community Safety Div
Sergeant/Community
Oriented Policing
School Resource Corporal
School Resource Officer
Community Services Officer
Communications Supervisor
Communications /Shift Leader
Communications Officer
Office Coord.
Admin. Asst. IV
Commander/ Patrol Div
Administrative Assistant II
Sergeant/Patrol
Sergeant/Patrol - K9
Corporal/Accident Investigations
Corporal/Patrol
Accident Investigations
Officer
Code Enforcement
Officer
Patrol Officer
Patrol Officer -K9
69

Pay Classification Plan Information
Grade Min Mid Max FLSA Job Code Classification Title # of Slots
20 $24,675 $30,844 $37,013 N 2010101 Building Custodian 1
60 $29,993 $37,491 $44,989 N 2010102 Communications Officer 5
70 $31,492 $39,365 $47,238 N 2010103 Administrative Assistant II
(Patrol)
1
70 $31,492 $39,365 $47,238 N 2010104 Administrative Assistant II
(CID)
1
70 $31,492 $39,365 $47,238 N 2010105 Corrections Officer 9
70 $31,492 $39,365 $47,238 N 2010106 Crime Analyst/Records Clerk 2
90 $34,720 $43,400 $52,080 N 2010107 Communications/Shift Leader 4
90 $34,720 $43,400 $52,080 N 2010108 Corrections/Shift Leader 4
90 $34,720 $43,400 $52,080 E 2010138 Part-Time City Prosecutor 1
100 $36,456 $45,570 $54,684 N 2010109 Administrative Assistant IV 1
110 $38,279 $47,849 $57,419 E 2010110 Chief Corrections Officer 1
110 $38,279 $47,849 $57,419 E 2010111 Communications Supervisor 1
110 $38,279 $47,849 $57,419 N 2010112 Office Coordinator 1
150 $46,528 $58,160 $69,793 N 2010113 Accident Investigations Officer 1
150 $46,528 $58,160 $69,793 N 2010114 Assistant Training Coordinator 1
150 $46,528 $58,160 $69,793 N 2010115 Code Enforcement Officer 2
150 $46,528 $58,160 $69,793 N 2010117 Detective 7
150 $46,528 $58,160 $69,793 N 2010118 Patrol Officer 24
150 $46,528 $58,160 $69,793 N 2010119 Patrol Officer K-9 3
150 $46,528 $58,160 $69,793 N 2010120 School Resource Officer 3
150 $46,528 $58,160 $69,793 N 2010141 Community Services Officer 1
180 $53,862 $67,328 $80,794 N 2010121 Corporal/Accident
Investigations
1
180 $53,862 $67,328 $80,794 N 2010123 Corporal/Patrol 5
180 $53,862 $67,328 $80,794 N 2010125 Corporal/Sex Offender
Compliance
1
180 $53,862 $67,328 $80,794 N 2010126 School Resource Corporal 1
200 $59,383 $74,229 $89,075 N 2010127 Sergeant/Community Oriented
Policing
1
200 $59,383 $74,229 $89,075 N 2010128 Sergeant/Detective 2
200 $59,383 $74,229 $89,075 N 2010129 Sergeant/Intelligence 1
200 $59,383 $74,229 $89,075 N 2010130 Sergeant/Patrol 3
200 $59,383 $74,229 $89,075 N 2010131 Sergeant/Professional
Development
1
200 $59,383 $74,229 $89,075 N 2010139 Sergeant/Narcotics 1
200 $59,383 $74,229 $89,075 N 2010140 Sergeant/Patrol – K9 1
220 $65,470 $81,838 $98,205 E 2010132 Commander/Administration
Division
1
220 $65,470 $81,838 $98,205 E 2010133 Commander/Community Safety
Division
1
220 $65,470 $81,838 $98,205 E 2010134 Commander/Criminal
Investigations Division
1
220 $65,470 $81,838 $98,205 E 2010135 Commander/Patrol Division 1
250 $75,790 $94,737 $113,685 E 2010136 Deputy Chief of Police 1
300 $96,729 $120,911 $145,094 E 2010137 Police Chief 1
70

Fire Department
Mission Statement: The Foley Fire & Rescue Department professionals are committed to providing rapid and
reliable services to the citizens of our community. We are committed to saving lives and property and improving
the quality of life through education and training. We will provide fire prevention, fire suppression and rescue
services of the highest quality for the community. We will accomplish our mission by working with the
community, efficiently utilizing our resources, and fostering an atmosphere that encourages teamwork, innovation
and progress.
Function: The Fire Department is trained for all-hazards emergency response. Essentially, the core functions of
the Department are fire suppression, emergency medical response, hazardous materials response, fire prevention
and education.
Performance Goals: With the growth of our city, we are working to continue to provide adequate emergency
response while also aggressively working on fire prevention through our inspection program and public
education. While our total annual emergency responses continue to increase, our cumulative property losses from
fires throughout the city have remained low and show a decreasing trend. We have been actively involved in the
Alabama Turn Your Attention to Fire Prevention campaign in an effort to reduce the loss of life from fire in our
community and throughout the state.
Department Achievements: We were surveyed by the Insurance Services Office (ISO) last year in order to
establish our current Public Protection Class (PPC) and we gained points in risk reduction and maintained a solid
PPC Class 3/3Y. This puts us in the top 12% of all fire departments surveyed in the U.S.
Financial Summary
% Change
2017 2018 2019 2019 2020 2019 to
Expenditures Actual Actual Budget Projected Budget 2020
Personnel 2,255,984$ 2,419,865$ 2,442,725$ 2,419,911$ 2,470,634$ 2.10%
Capital - 18,890 - - 30,000 100.00%
Operational 410,725 336,747 495,207 486,674 416,650 -14.39%
Total 2,666,709$ 2,775,502$ 2,937,932$ 2,906,585$ 2,917,284$ 0.37%
71

Fire Department Organizational Chart
Pay Classification Plan Information
Grade Min Mid Max FLSA Job Code Classification Title # of Slots
60 $29,993 $37,491 $44,989 N 2020101 Administrative Assistant I 1
100 $36,456 $45,570 $54,684 N 2020102 Administrative Assistant IV 1
140 $44,313 $55,391 $66,469 N 2020103 Firefighter 18
150 $46,528 $58,160 $69,793 N 2020104 Fire Inspector 1
160 $48,855 $61,069 $73,282 N 2020105 Senior Firefighter 6
180 $53,862 $67,328 $80,794 N 2020106 Fire Service Lieutenant 3
180 $53,862 $67,328 $80,794 N 2020109 Senior Fire Inspector 1
240 $72,181 $90,226 $108,271 E 2020107 Deputy Fire Chief 1
280 $87,736 $109,670 $131,604 E 2020108 Fire Chief 1
Fire Chief
Deputy Fire Chief
Senior Fire inspectorFire Inspector
Fire Service Lieutenant
Senior FirefighterFirefighter
Administrative Assistant IV
Administrative Assistant I
72

Community Development Department
Mission Statement: To provide for orderly and controlled growth for its citizenry and to provide superior
customer service in matters relating to development. We constantly strive to ensure that all codes, ordinances and
other regulations are met for the health, safety and well-being of Foley citizens.
Function: The Community Development Department (CDD) provides the following services to the citizens of
Foley; planning, zoning, building permitting and inspections, and code enforcement.
Performance Goals
Specific departmental goals are set on an annual basis through our budget. We work closely with developers to
determine the growth rate for the next fiscal year and budget accordingly. We strive to provide accurate revenue
estimates and budget expenses based on those projections.
Department Achievements
Maintain high standards by adopting current national regulatory codes.
Amend the Zoning Ordinance on an annual basis to assure compliance with federal and state standards.
Encourage building to the highest standard and are currently 4th in the Nation for Fortified Homes.
Currently has an ISO rating of 4 for residential and commercial.
Created and hosts a monthly meeting called PLAN (Plan Lower Alabama Now). Attendees include
planners, engineers, developers, home builders, GIS, Realtors Board, elected officials, environmentalist
and other interested parties. We have a speaker, round-table challenges & work on specific areas of
concern.
Was accepted into the FEMA CRS (Community Rating System). This required a flood audit prior to
acceptance and requires specific topics related to flooding being maintained in order to provide a reduced
flood rate to our citizens.
Adopted a Coastal Supplement to the building code that requires a higher minimum standard due to our
location in a hurricane/high wind area.
Staff hold various certifications in their field and continue to attend trainings and obtain new
certifications.
Staff serve in various capacities with local, state, regional and federal boards/committees.
Financial Summary
% Change
2017 2018 2019 2019 2020 2019 to
Expenditures Actual Actual Budget Projected Budget 2020
Personnel 480,013$ 539,214$ 598,952$ 582,246$ 616,914$ 3.00%
Capital - 31,450 28,000 28,000 - -100.00%
Operational 70,948 126,015 244,930 218,820 123,183 -43.71%
Total 550,962$ 696,678$ 871,882$ 829,066$ 740,097$ -10.73%
73

Community Development Organizational Chart
Pay Classification Plan Information
Grade Min Mid Max FLSA Job Code Classification Title # of Slots
60 $29,993 $37,491 $44,989 N 2030101 Administrative Assistant I 2
80 $33,067 $41,334 $49,600 N 2030102 Permit Clerk 1
80 $33,067 $41,334 $49,600 N 2030103 Planning & Zoning Assistant 1
120 $40,193 $50,241 $60,289 E 2030104 Planning & Zoning Coordinator 1
150 $46,528 $58,160 $69,793 E 2030105 Building Inspector 3
180 $53,862 $67,328 $80,794 E 2030106 Chief Building Inspector 1
280 $87,738 $109,670 $131,604 E 2030107 City Planner/Building Official 1
City Planner / Building Official
Chief Building Inspector
Building Inspector
Planning / Zoning Coordinator
Planning & Zoning Assistant
Permit ClerkAdministrative
Assistant I
74
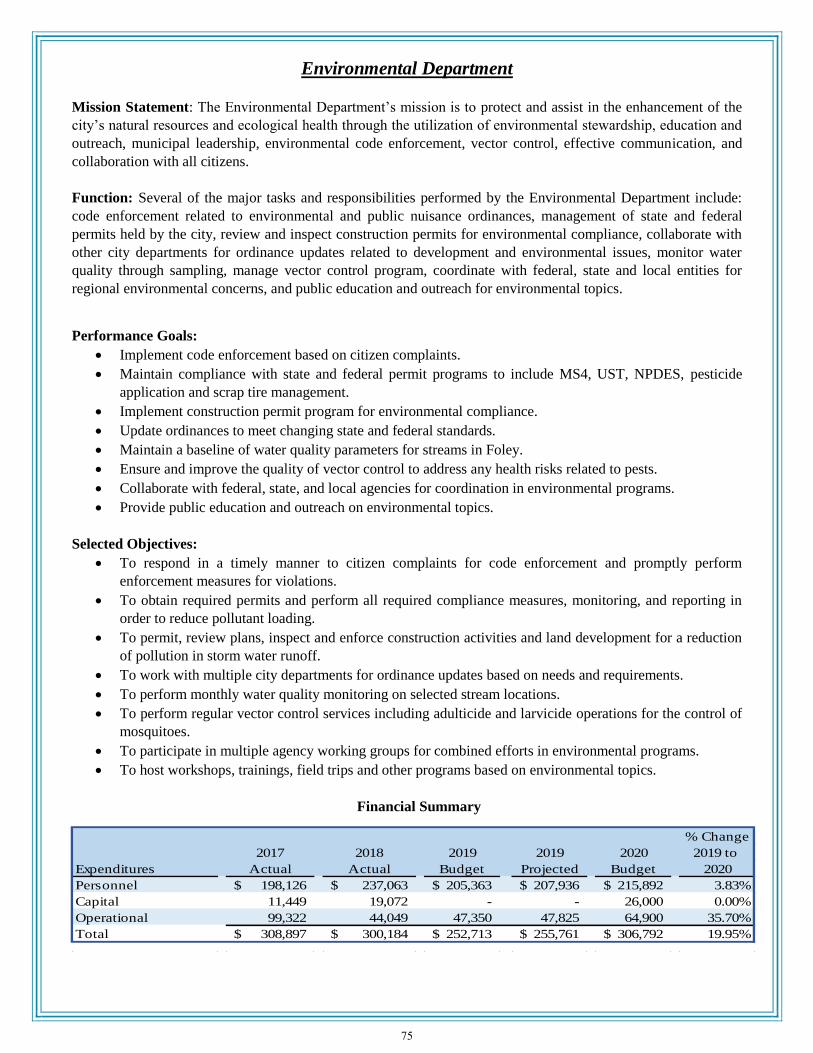
Environmental Department
Mission Statement: The Environmental Department’s mission is to protect and assist in the enhancement of the
city’s natural resources and ecological health through the utilization of environmental stewardship, education and
outreach, municipal leadership, environmental code enforcement, vector control, effective communication, and
collaboration with all citizens.
Function: Several of the major tasks and responsibilities performed by the Environmental Department include:
code enforcement related to environmental and public nuisance ordinances, management of state and federal
permits held by the city, review and inspect construction permits for environmental compliance, collaborate with
other city departments for ordinance updates related to development and environmental issues, monitor water
quality through sampling, manage vector control program, coordinate with federal, state and local entities for
regional environmental concerns, and public education and outreach for environmental topics.
Performance Goals:
Implement code enforcement based on citizen complaints.
Maintain compliance with state and federal permit programs to include MS4, UST, NPDES, pesticide
application and scrap tire management.
Implement construction permit program for environmental compliance.
Update ordinances to meet changing state and federal standards.
Maintain a baseline of water quality parameters for streams in Foley.
Ensure and improve the quality of vector control to address any health risks related to pests.
Collaborate with federal, state, and local agencies for coordination in environmental programs.
Provide public education and outreach on environmental topics.
Selected Objectives:
To respond in a timely manner to citizen complaints for code enforcement and promptly perform
enforcement measures for violations.
To obtain required permits and perform all required compliance measures, monitoring, and reporting in
order to reduce pollutant loading.
To permit, review plans, inspect and enforce construction activities and land development for a reduction
of pollution in storm water runoff.
To work with multiple city departments for ordinance updates based on needs and requirements.
To perform monthly water quality monitoring on selected stream locations.
To perform regular vector control services including adulticide and larvicide operations for the control of
mosquitoes.
To participate in multiple agency working groups for combined efforts in environmental programs.
To host workshops, trainings, field trips and other programs based on environmental topics.
Financial Summary
% Change
2017 2018 2019 2019 2020 2019 to
Expenditures Actual Actual Budget Projected Budget 2020
Personnel 198,126$ 237,063$ 205,363$ 207,936$ 215,892$ 3.83%
Capital 11,449 19,072 - - 26,000 0.00%
Operational 99,322 44,049 47,350 47,825 64,900 35.70%
Total 308,897$ 300,184$ 252,713$ 255,761$ 306,792$ 19.95%
75

Environmental Department Organizational Chart
Pay Classification Plan Information
Grade Min Mid Max FLSA Job Code Classification Title # of Slots
90 $34,720 $43,400 $52,080 N 2040103 Vector Control Specialist 1
110 $38,279 $47,849 $57,419 N 2040101 Environmental Inspector & Initiatives
Coordinator
1
240 $72,181 $90,226 $108,271 E 2040102 Environmental Manager 1
Environmental Manager
Environmental Inspector & Initiatives Coordiantor
Vector Control Specialist
76

Street Department
Mission Statement: It is the mission of the Foley Public Works Street Department to support and enhance the
growth of our city while maintaining the small town character and service levels to which our residents,
businesses, and visitors are accustomed. The responsible implementation of efficient and cost effective public
services in a safe and courteous manner is our top priority.
Function: The Street department works proactively to maintain the city’s roadways, rights of ways, drainage, and
sidewalks. Prioritize and respond to issues identified by the Street Supervisor, Engineering Department, elected
city officials, and concerned citizens. Duties include street/pothole repairs, addressing drainage issues, mowing,
tree trimming, street sweeping, culvert installation, and providing signage that is compliant with the Manual on
Uniform Traffic Control Devices (MUTCD).
Performance Goals: With the implementation of new crew leader positions within the Street Department, our
main goal is to train these new leaders in areas of efficiency, productivity, and communicative ideology between
employees and citizens in order to build a conducive working relationship.
Financial Summary
% Change
2017 2018 2019 2019 2020 2019 to
Expenditures Actual Actual Budget Projected Budget 2020
Personnel 1,147,977$ 1,273,632$ 1,371,458$ 1,340,425$ 1,432,325$ 6.86%
Capital 133,317 197,503 337,000 334,077 1,016,500 204.27%
Operational 295,256 302,703 326,155 347,310 363,550 4.68%
Total 1,576,550$ 1,773,838$ 2,034,613$ 2,021,812$ 2,812,375$ 39.10%
Street Department Organizational Chart
Public Works Superintendent
Street Supervisor
Construction CrewLeader/Equip Op III
Equipment Operator II
Equipment Operator I
Maintenance CrewLeader/Equip Op III
Equipment Operator I
PT Equip Operator I
PT Street Laborer
Sidewalks CrewLeader/Equip Op III
Sweeper Truck Driver Operator
Equipment Operator I
Traffic Control Technician
Equipment Operator
77

Pay Classification Plan Information
Grade Min Mid Max FLSA Job Code Classification Title # of Slots
20 $24,675 $30,844 $37,013 N 3010101 Part-Time Street Laborer 2
50 $28,564 $35,705 $42,847 N 3010102 Part-Time Equipment Operator I 1
60 $29,993 $37,491 $44,989 N 3010103 Equipment Operator I 17
70 $31,492 $365 $47,238 N TBD Sweeper Truck Driver Operator 1
80 $33,067 $41,334 $49,600 N 3010104 Equipment Operator II 7
120 $40,193 $50,241 $60,289 N 3010105 Crew Leader / Equipment Operator III
(Sidewalks) 1
120 $40,193 $50,241 $60,289 N 3010106 Crew Leader / Equipment Operator III
(Construction) 1
120 $40,193 $50,241 $60,289 N 3010107 Crew Leader / Equipment Operator III
(Maintenance) 1
120 $40,193 $50,241 $60,289 N 3010108 Traffic Control Technician 1
170 $51,298 $64,122 $76,946 E 3010109 Street Supervisor 1
270 $83,558 $104,448 $125,337 E 3010110 Public Works Superintendent .5
78
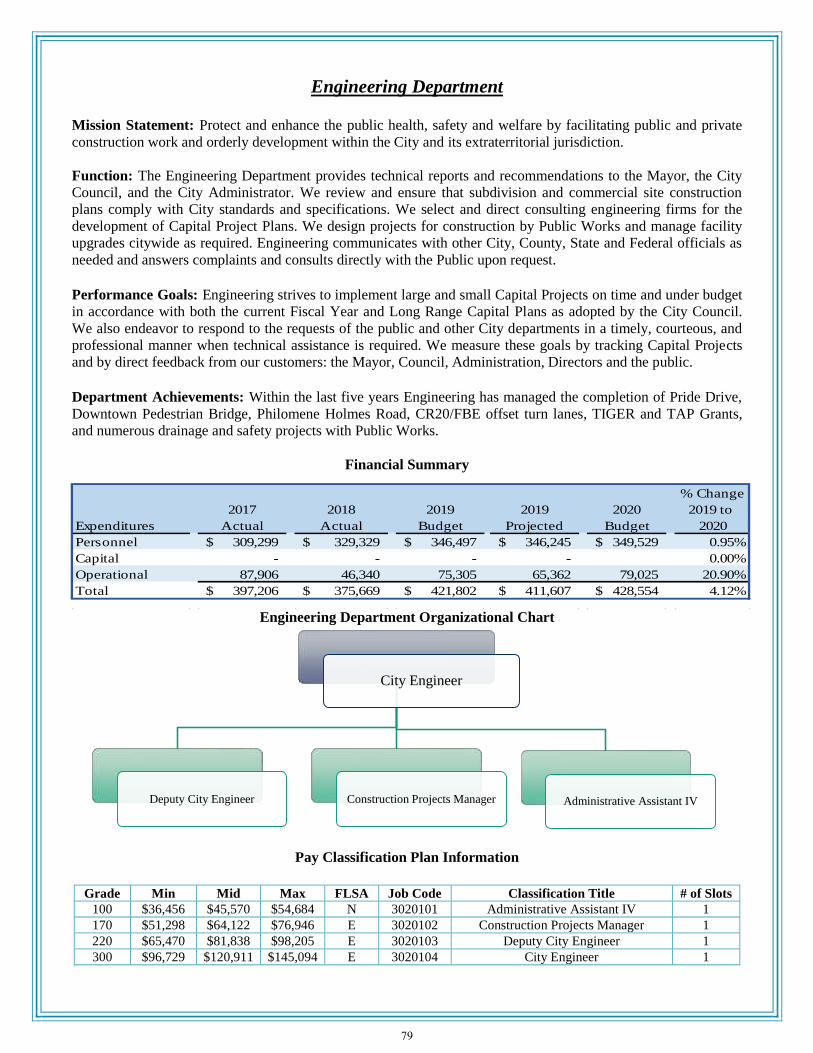
Engineering Department
Mission Statement: Protect and enhance the public health, safety and welfare by facilitating public and private
construction work and orderly development within the City and its extraterritorial jurisdiction.
Function: The Engineering Department provides technical reports and recommendations to the Mayor, the City
Council, and the City Administrator. We review and ensure that subdivision and commercial site construction
plans comply with City standards and specifications. We select and direct consulting engineering firms for the
development of Capital Project Plans. We design projects for construction by Public Works and manage facility
upgrades citywide as required. Engineering communicates with other City, County, State and Federal officials as
needed and answers complaints and consults directly with the Public upon request.
Performance Goals: Engineering strives to implement large and small Capital Projects on time and under budget
in accordance with both the current Fiscal Year and Long Range Capital Plans as adopted by the City Council.
We also endeavor to respond to the requests of the public and other City departments in a timely, courteous, and
professional manner when technical assistance is required. We measure these goals by tracking Capital Projects
and by direct feedback from our customers: the Mayor, Council, Administration, Directors and the public.
Department Achievements: Within the last five years Engineering has managed the completion of Pride Drive,
Downtown Pedestrian Bridge, Philomene Holmes Road, CR20/FBE offset turn lanes, TIGER and TAP Grants,
and numerous drainage and safety projects with Public Works.
Financial Summary
% Change
2017 2018 2019 2019 2020 2019 to
Expenditures Actual Actual Budget Projected Budget 2020
Personnel 309,299$ 329,329$ 346,497$ 346,245$ 349,529$ 0.95%
Capital - - - - 0.00%
Operational 87,906 46,340 75,305 65,362 79,025 20.90%
Total 397,206$ 375,669$ 421,802$ 411,607$ 428,554$ 4.12%
Engineering Department Organizational Chart
Pay Classification Plan Information
Grade Min Mid Max FLSA Job Code Classification Title # of Slots
100 $36,456 $45,570 $54,684 N 3020101 Administrative Assistant IV 1
170 $51,298 $64,122 $76,946 E 3020102 Construction Projects Manager 1
220 $65,470 $81,838 $98,205 E 3020103 Deputy City Engineer 1
300 $96,729 $120,911 $145,094 E 3020104 City Engineer 1
City Engineer
Deputy City Engineer Construction Projects Manager Administrative Assistant IV
79

Sanitation Department
Mission Statement: It is the mission of the Foley Public Works Sanitation Department to support and enhance
the growth of our city while maintaining the small town character and service levels to which our residents,
businesses, and visitors are accustomed. The responsible implementation of efficient and cost effective public
services in a safe and courteous manner is our top priority.
Function: The Sanitation department provides garbage, recycle, yard debris, bulk pickup, and hot shot service for
residents and businesses. Delivery of cans to new residents, walkup service for handicapped residents, cardboard
recycling, commercial bulk pickup, and trash services for special events are a few of the additional services
administered by the sanitation department.
Financial Summary
% Change
2017 2018 2019 2019 2020 2019 to
Expenditures Actual Actual Budget Projected Budget 2020
Personnel 712,450$ 705,087$ 763,090$ 727,530$ 748,610$ 2.90%
Capital - 388,343 160,000 - 618,500 100%
Operational 1,187,033 1,132,424 1,258,976 1,275,401 1,282,375 0.55%
Total 1,899,483$ 2,225,855$ 2,182,066$ 2,002,931$ 2,649,485$ 32.28%
Sanitation Department Organizational Chart
Pay Classification Plan Information
Grade Min Mid Max FLSA Job Code Classification Title # of Slots
10 $23,500 $29,375 $35,250 N 4010101 Sanitation Worker I 1
30 $25,909 $32,386 $38,863 N 4010102 Sanitation Worker II 5
70 $31,492 $39,365 $47,238 N 4010103 Sanitation Worker III / Driver Op II 8
70 $31,492 $39,365 $47,238 N 4010106 Part-Time Sanitation Worker III /
Driver Operator 2
100 $36,456 $45,570 $54,684 N 4010104 Sanitation Crew Leader 1
140 $44,313 $55,391 $66,469 E 4010105 Sanitation Supervisor 1
270 $83,558 $104,448 $125,337 E 3010110 Public Works Superintendent .5
Public Works Superintendent
Sanitation Supervisor
Sanitation Crew Leader
Sanitation Worker III/Driver Op II
Sanitation Worker II
Sanitation Worker IPT Sanitation
Worker III/Driver Op II
80

Parks Department
Mission Statement: It is the chief objective of the Parks Department to provide a safe and pleasant experience for
all City park visitors by ensuring well maintained facilities that focus on safety and cleanliness. A particular
emphasis is placed on the seamless organization, facilitation, and completion of special events held within the
City’s park system.
Function: The Parks Department is responsible for the maintenance, safety, and cleanliness of the City parks and
related amenities. Additionally, the Parks Department staff is utilized in the facilitation of special events held
within the parks and is responsible for the deployment and removal of holiday decorations throughout the City.
Performance Goals
The Parks Department goal is to respond to resident concerns and complaints within one business day, and
address or repair the findings as necessary within a reasonable timeframe for each occurrence.
Financial Summary
% Change
2017 2018 2019 2019 2020 2019 to
Expenditures Actual Actual Budget Projected Budget 2020
Personnel 591,645$ 588,526$ 610,676$ 572,661$ 615,488$ 7.48%
Capital - 23,753 35,000 34,787 - -100.00%
Operational 154,264 142,013 170,980 172,170 175,560 1.97%
Total 745,909$ 754,292$ 816,656$ 779,618$ 791,048$ 1.47%
Parks Department Organizational Chart
Pay Classification Plan Information
Grade Min Mid Max FLSA Job Code Classification Title # of Slots
20 $24,675 $30,844 $37,013 N 5010106 Parks Maintenance Worker I 2
50 $28,564 $35,705 $42,847 N 5010107 Parks Maintenance Worker II 5
70 $31,492 $39,365 $47,238 N 5010108 Parks Maintenance Worker III 3
130 $42,203 $52,753 $63,304 N 5010104 Parks Crew Leader 1
230 $68,744 $85,930 $103,115 E 5010105 Parks Superintendent 1
Parks Superintendent
Parks Crew Leader
Parks Maintenance Worker III
Parks Maintenance
Worker II
Parks Maintenance
Worker I
81

Library
Mission Statement: The Foley Public Library's mission is to provide members of the Foley community with the
resources necessary to fulfill their evolving informational, educational, recreational and cultural needs in an
environment that encourages lifelong habits of reading, community engagement, and self-expression.
Our primary purpose is to obtain and organize books and other printed and digital material and establish programs
in a manner that allows everyone easy and free access to information regardless of age, sex, race, creed, social,
economic, or educational level.
To achieve our purpose, we shall maintain programs and services to:
Provide reliable print and digital materials and activities for the pursuit of personal and community
interests.
Engage children entering the world of learning and reading, and provide supplementary resources and
activities that encourage the love of reading.
Serve as a reference center by securing or locating authoritative sources for information needs.
Provide access to the internet and help patrons gain the skills necessary to use computer hardware and
software.
Provide recreational materials to all ages that aid in the pursuit of quality leisure time.
Stimulate the enjoyment of and appreciation for the fine arts, humanities and the sciences.
Function: The Foley Public Library provides residents of Foley and the surrounding communities access to
information in a variety of formats as well as continuing educational opportunities that broaden horizons and
improve their quality of life. The 84,000 + titles held in the 21,000 square foot facility provide wide ranging
information on a myriad of topics. Those title are supplemented by close to 50,000 electronic titles that can be
accessed on numerous personal devices. The Library serves as a cultural center complete with a meeting room for
large groups, a board room and study/testing rooms that can accommodate smaller groups or individuals as they
study, read, conduct research, prepare for and take exams, or conduct meetings or presentations. We also provide
varied programming that assists in enlightening our community on current local and world events as well as
crafts, ideology, and history. We consider ourselves, and are seen by the Foley area, as a center of the
community.
Performance Goals: The Library’s goals are divided into seven different initiatives each with their own set of
goals and objectives. These seven initiatives are: community, collections, patrons, communications, staff
development, technology, and capital expansion.
Community Initiative:
The library is committed to enriching the quality of life for Foley residents through our services, community
outreach programs, and partnerships which contribute to life-long learning by expanding our in-house programs
and events to become more integrated into the community and become a true community center. The intent is to
maintain those programs, enhance them where necessary, and introduce new programs of interest to the residents
of Foley. The Foley Public Library will continue to expand its reach into the community to enhance the quality of
life for Foley residents through strategic partnerships and collaborative programs. The library will continue to be
an information center, with facilities that are convenient, comfortable and inviting places for quiet study, effective
meetings and civic engagement.
82

Collections Initiative:
The Library’s collections, in all relevant formats, are among their most important assets. Collections must be
thoughtfully managed with an eye toward providing what is current, popular, and useful, along with the best of
the cultural and historical record, and with a special emphasis on preserving the rich history of the City of Foley
and Baldwin County. The collections will reflect the interests of Foley readers in their content, format and
language. Collections will be available in both a timely manner and sufficient quantities to anticipate demand.
The newly created Stacks Maintenance Coordinator places an emphasis on a properly maintained collection
through the generation of statistical reports that provide information on patron use. The Library's
Genealogy/Alabama History Room will continue to collect and maintain the premier compilation of historical
materials on Foley and Baldwin County history held in any Baldwin County facility.
Patrons Initiative:
The Library provides outstanding services and facilities that are convenient for our patrons by continuing to
support the early literacy needs of children and young adults and contributing to their readiness for schools and
careers. Adults will have access to lifelong learning opportunities through library programs that are educational,
entertaining, and that help connect them to their community and the world. All patrons will have convenient
access to public computers, self-service technology, electronic resources, and a vibrant web site designed to
connect people of all ages to our collections, programs, and services.
Communications Initiative:
Providing accurate, timely information creates a stronger, more visible organization. The Library is committed to
improving the flow of information, resolving internal challenges, and creating open dialogues with the Foley
community. By utilizing Facebook, Twitter, and Pinterest, the majority of Foley residents can become aware of
the breadth of services and programs offered by the library through a variety of regular customized updates. Foley
residents, as well as members of the Baldwin County Library Cooperative, will be encouraged to provide
suggestions for service enhancements, programs, and collections in a variety of ways.
Staff Development Initiative:
To continuously provide opportunities for individual training for staff as well as yearly training that involves all
staff members. The Library will continue to value the talent, experience, and contributions of all staff, and
effectively support staff training, a cross-functional team approach, and open communications to improve internal
operations and service to the community. The Library Advisory Board will continue to be composed of
knowledgeable citizen stewards who support the Library's mission, exemplify its values, and serve as library
ambassadors and advocates throughout the community.
Technology Initiative:
A continuation of maintaining up-to-date technology for our patrons use in our computer lab. In addition,
providing any technology for in-house and external circulation that our community deems necessary or needed.
The Library will work closely with the City of Foley IT Department to maintain our Computer Lab at peak
efficiency. The Library will continue to aid patrons in setting up the parameters of their personal electronic
devices as well as aiding them in understanding the operation of their personal devices.
Capital Expansion Initiative:
A continuation of making the most efficient use of the space that we have in order to maintain a large, diverse
collection while, providing an inviting space for patrons to use. In addition, the Library will begin to seek input
from the City Council on possible expansion plans as the Library will use all of our available space prior to the
end of the current five year plan. The Library will continue to make best use of the limited space that remains in
our Library by adding shelving in innovative ways, if possible, to continue the growth of our collection.
83

Achievement of Goals: The Library documents numerous statistics concerning services that we record daily. We
can observe these stats each month and track trends. We can use these numbers to determine the success of a
project and if that project deserves to continue, to be altered or to be discontinued. We also participate in the
Alabama Library Associations Snapshot Day each year which polls patrons in addition to isolating activities to
determine their effectiveness. We utilize our website and Facebook to track trends and to follow up on the
success rate of projects.
Department Achievements:
2015 - 2018 Alabama Library Association Gold Standard Award Winner.
2016 Library Journal Five Star rated number one library in the United States in our category.
2017 Library Journal Five Star rated number five library in the United States in our category.
2018 Library Journal Five Star rated number six library in the United States in our category.
2019 Alabama Library Association Gold Standard Award Winner.
Financial Summary
% Change
2017 2018 2019 2019 2020 2019 to
Expenditures Actual Actual Budget Projected Budget 2020
Personnel 628,258$ 639,424$ 698,531$ 698,853$ 706,918$ 1.15%
Capital - - - - - 0.00%
Operational 145,540 148,857 185,500 185,500 161,150 -13.13%
Total 773,799$ 788,282$ 884,031$ 884,353$ 868,068$ -1.84%
Library Organizational Chart
Library Director
Head of Circulation Services
Library AidePart-Time Library
Aide
Children's Librarian
Assistant Children's Librarian
Library Computer Lab Manager
Library Aide II
History & Genealogy Technician
Stacks Maintenance Coordinator
Library Cataloger
84

Pay Classification Plan Information
Grade Min Mid Max FLSA Job Code Classification Title # of Slots
30 $25,909 $32,386 $38,863 N 5020101 Library Aide I 3
30 $25,909 $32,386 $38,863 N 5020102 Part-Time Library Aide 4
60 $29,993 $37,491 $44,989 N 5020103 Library Aide II 1
90 $34,720 $43,400 $52,080 N 5020104 Library Cataloger 1
100 $36,456 $45,570 $54,684 N 5020105 Assistant Children’s Librarian 1
100 $36,456 $45,570 $54,684 N 5020106 Stacks Maintenance
Coordinator
1
110 $38,279 $47,849 $57,419 E 5020107 Head of Circulation Services 1
130 $42,203 $52,753 $63,304 N 5020108 History & Genealogy
Technician
1
150 $46,528 $58,160 $69,793 E 5020109 Library Computer Lab Manager 1
170 $51,298 $64,122 $76,946 E 5020110 Children’s Librarian 1
220 $65,470 $81,838 $98,205 E 5020111 Library Director 1
85

Recreation Department
Mission Statement: The City of Foley Recreation Department’s mission is to offer the widest range of recreation
opportunities at an affordable cost to our diverse population. In addition, the Recreation Department wants to
improve the quality of life for our residents while providing a safe environment and facilities.
Function: Foley Recreation manages 4 outdoor swimming pools, the Foley Sports Complex with 10
baseball/softball fields & 5 soccer fields, Mel Roberts Park, and 3 concessions stands. The department offers
soccer, basketball, baseball/softball, swim team and lessons, senior water aerobics, archery and tennis to the
residents of the Foley area. During the summer, it becomes home to several national World Series events that
provide sports tourism through baseball and softball. We also host several adult leagues for soccer, 7v7 soccer,
and kickball.
The department works with local schools, neighboring cities, the general public and administration to provide
recreational opportunities.
Performance Goals
Clearly document/define as many policies and procedures as possible.
Accurately track R.O.I – sports, tournaments and sponsorships.
Increase annual room nights for our events by 100 total.
Host one new event (USSSA/ASA/NSA softball/baseball).
Reduce number of local tournaments for bigger ones.
Delegation of projects and assigning/dividing more responsibility for accountability.
Increase our planning horizons – one year out for all sports if possible, maintenance calendars,
capital/project requests.
Pursue relevant grants to help offset some of our funding needs.
Align marketing and advertising with Foley Sports Tourism.
Financial Summary
% Change
2017 2018 2019 2019 2020 2019 to
Expenditures Actual Actual Budget Projected Budget 2020
Personnel 751,119$ 776,029$ 838,734$ 817,960$ 846,818$ 3.53%
Capital 9,500 67,805 85,000 83,770 64,500 -23.00%
Operational 449,418 447,880 500,185 481,370 445,060 -7.54%
Total 1,210,037$ 1,291,713$ 1,423,919$ 1,383,100$ 1,356,378$ -1.93%
86

Recreation Department Organizational Chart
Pay Classification Plan Information
Grade Min Mid Max FLSA Job Code Classification Title # of Slots
50 $28,564 $35,705 $42,847 N 5030101 Field Maintenance Worker I 2
70 $31,492 $39,365 $47,238 N 5030102 Field Maintenance Worker II 2
70 $31,492 $39,365 $47,238 N 5030103 Sportsplex Technician 1
90 $34,720 $43,400 $52,080 N 5030110 Recreation Concessions Manager 1
90 $34,720 $43,400 $52,080 N 5030105 Recreation Office Manager 1
120 $40,193 $50,241 $60,289 E 5030106 Athletic Coordinator 2
130 $42,203 $52,753 $63,304 E 5030107 Recreation Field Superintendent 1
130 $42,203 $52,753 $63,304 E 5030108 Sports & Events Sales Manager 1
270 $83,558 $104,448 $125,337 E 5030109 Director of Recreation & Sports Tourism .5
Director of Recreation & Sports Tourism
Recreation Field Superintendent
Sportsplex Technician
Field Maintenance Worker II
Field Maintenance Worker I
Sports & Events Sales Manager
Athletic Coordinator
Recreation Concessions Manager
Recreation Office Manager
87

Sports Tourism Department
Mission Statement: The mission of Foley Sports Tourism is to attract, create and host high-quality events for all
ages to increase economic vitality, improve the quality of life, and provide a unique memorable experience that
brands Foley, Alabama, as a nationally recognized sports destination.
Function: Foley Sports Tourism manages and maintains 16 multipurpose outdoor fields in addition to a 90,000+
square foot indoor facility. The department works to attract meetings, conventions, and sporting events to help
drive the economy of the City. This includes managing the events and marketing Foley as a preferred destination
for tourists.
The department works with local sponsors, meeting organizers, tournament directors, vendors, and governing
sports bodies. We also work with other venues and local businesses to promote events.
The following Guiding Principles are considered to be foundational to any tourism initiatives moving forward in
Foley:
Measurable economic benefits to City of Foley.
City of Foley tourism brand enhancement.
Targeted events make effective use of Foley’s new and existing sport facilities.
Targeted events to strengthen local sport development and tourism.
Performance Goals
Market to increase visitation, lengthen stays, encourage additional spending in all local businesses, and
grow occupancy levels in local hotels. – Develop measurable campaigns.
Improve year-round occupancy rates by 3%.
Increase visitor spending – increase impact on retail and lodging tax.
Increase attendance to events – Grow event participants by 2% annually.
Retain 90% of events.
Grow outdoor events by 2 and indoor events by 10.
Create value for sponsors. Capture metrics to provide fulfillment report.
Create a positive image for Foley – Ratings at 4.8 or higher.
Develop baseline for economic impact reporting for events.
Identify and implement hotel booking engine.
Department Achievements
2019 Sport Events Magazine Readers’ Choice Award.
Financial Summary
% Change
2017 2018 2019 2019 2020 2019 to
Expenditures Actual Actual Budget Projected Budget 2020
Personnel 503,375$ 622,906$ 753,252$ 757,585$ 823,612$ 8.72%
Capital 311,000 35,851 93,000 54,749 106,000 93.61%
Operational 644,704 187,723 322,730 278,902 366,760 31.50%
Debt Services - 74,256 74,259 74,259 74,259 0.00%
Total 1,459,079$ 920,736$ 1,243,241$ 1,165,495$ 1,370,631$ 17.60%
88
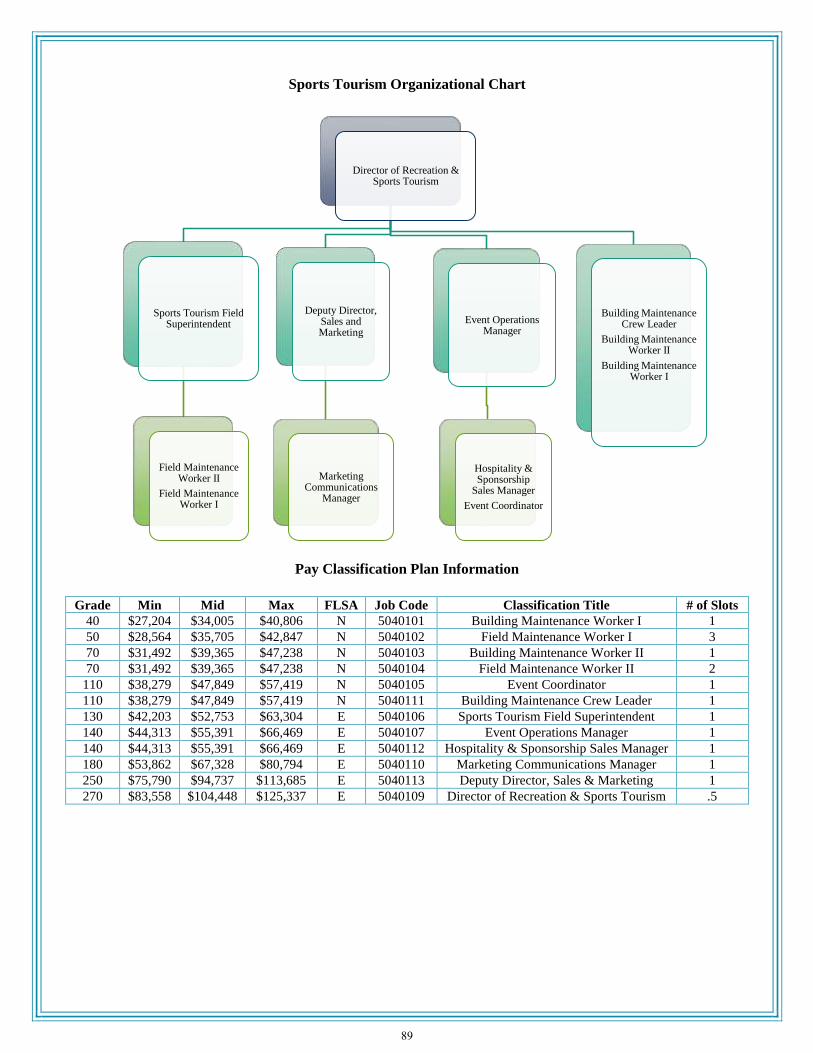
Sports Tourism Organizational Chart
Pay Classification Plan Information
Grade Min Mid Max FLSA Job Code Classification Title # of Slots
40 $27,204 $34,005 $40,806 N 5040101 Building Maintenance Worker I 1
50 $28,564 $35,705 $42,847 N 5040102 Field Maintenance Worker I 3
70 $31,492 $39,365 $47,238 N 5040103 Building Maintenance Worker II 1
70 $31,492 $39,365 $47,238 N 5040104 Field Maintenance Worker II 2
110 $38,279 $47,849 $57,419 N 5040105 Event Coordinator 1
110 $38,279 $47,849 $57,419 N 5040111 Building Maintenance Crew Leader 1
130 $42,203 $52,753 $63,304 E 5040106 Sports Tourism Field Superintendent 1
140 $44,313 $55,391 $66,469 E 5040107 Event Operations Manager 1
140 $44,313 $55,391 $66,469 E 5040112 Hospitality & Sponsorship Sales Manager 1
180 $53,862 $67,328 $80,794 E 5040110 Marketing Communications Manager 1
250 $75,790 $94,737 $113,685 E 5040113 Deputy Director, Sales & Marketing 1
270 $83,558 $104,448 $125,337 E 5040109 Director of Recreation & Sports Tourism .5
Director of Recreation & Sports Tourism
Sports Tourism Field Superintendent
Field Maintenance Worker II
Field Maintenance Worker I
Deputy Director, Sales and Marketing
Marketing Communications
Manager
Event Operations Manager
Hospitality & Sponsorship
Sales Manager
Event Coordinator
Building Maintenance Crew Leader
Building Maintenance Worker II
Building Maintenance Worker I
89
Horticulture Department
Mission Statement: The City of Foley Horticulture Department strives to provide living beautification of all
areas of the City by incorporating traditional sound horticultural practices with “forward” thinking methods of
execution to achieve superior aesthetics and efficiency.
Function: Management of the City’s horticulture and arboriculture programs cultivating a wide variety of
ornamental plants in the City’s flower beds, hanging baskets, and container gardens. Installation and maintenance
of irrigation systems, and decorative fountains.
Management, installation, and maintenance of the Antique Rose Trail, all other rose plantings, new trees and
landscaped areas throughout the city. Provide guidance, oversight, and preservation practices of all city trees as
needed for safety and preservation.
Performance Goals
o 1-3 years
Expand greenhouse complex.
Build new office facility.
Rose Trail middle and north section improvements.
Irrigation system improvements downtown.
o 3-5 years
Categorical tree inventory.
Dedicated in-house two-man tree crew w/bucket truck.
Department Achievements
o Developed a proactive public and street tree safety, maintenance and preservation program.
o Provide hanging baskets or gardening assistance and guidance to local schools to encourage and
enhance student participation and knowledge.
o Provide presentations and offer guidance to local garden clubs and civic groups.
o Participate in local school Career Day programs.
o Multiple employees have achieved Landscape Management Certification, and have become
Certified Urban Foresters.
o We have State representation on the Board for the Alabama Urban Forestry Association within
the department.
o Annually grow, plant, and maintain the following:
Over 30,000 bedding plants in our city greenhouses.
380 hanging baskets.
Over 90 container planters.
Over 300 crape myrtles.
Rose Trail.
Over 80 irrigation zones throughout the city.
90

Financial Summary
% Change
2017 2018 2019 2019 2020 2019 to
Expenditures Actual Actual Budget Projected Budget 2020
Personnel 249,537$ 255,973$ 283,230$ 278,411$ 317,237$ 13.95%
Capital 25,613 27,832 54,525 54,525 - -100.00%
Operational 153,259 179,051 197,120 188,543 206,550 9.55%
Total 428,409$ 462,856$ 534,875$ 521,479$ 523,787$ 0.44%
Horticulture Department Organizational Chart
Pay Classification Plan Information
Grade Min Mid Max FLSA Job Code Classification Title # of Slots
30 $25,909 $32,386 $38,863 N 5050101 Gardener I 1
70 $31,492 $39,365 $47,238 N 5050102 Gardener II 2
80 $33,067 $41,334 $49,600 N 5050103 Gardener III 1
100 $36,456 $45,570 $54,684 N 5050104 Gardener IV 1
160 $48,855 $61,069 $73,282 E 5050105 Horticulturist 1
Horticulturist
Gardener IV Gardener III Gardener II Gardener I
91

Marketing Department
Mission Statement: The Marketing Department promotes the City by providing information to residents and
visitors, by providing marketing services to other city departments, by undertaking special projects, and by
operating the Welcome Center, Foley Railroad Museum and Model Train Exhibit.
Function: Foley’s Marketing Department promotes the city by providing city information on the city website,
social media, brochures and printed materials, press releases and public relations; and promotes tourism by
operating a Welcome Center, a tourism website, social media and printed materials to provide information about
restaurants, accommodations, attractions, events and shopping; and other advertising, public relations and special
projects as needed. The Marketing Department also manages a city museum and model train exhibit.
Performance Goals:
Actively promote Main Street Program.
Manage Welcome Center operations where local experts greet visitors and provide up-to-date area
information.
Manage Foley Railroad Museum and employees of Holmes Hospital Museum.
Plan and execute wayfinding signage for public parking in downtown area.
Provide marketing services to other city departments.
Create parking signs for historic downtown area.
Designs the mayor’s quarterly newsletter.
Oversee the city governmental website and the Visit Foley website.
Maintain inventory of promotional brochures.
Plan, organize, and oversee city events that including Uptown Halloween, Christmas in the Park & Let it
Snow, Annual Snowbird Coffee, Music and a Movie, and Heritage Park Marketplace.
Financial Summary
% Change
2017 2018 2019 2019 2020 2019 to
Expenditures Actual Actual Budget Projected Budget 2020
Personnel 191,520$ 232,011$ 258,330$ 244,454$ 275,133$ 12.55%
Capital - 53,197 - - - 0.00%
Operational 123,420 238,471 221,510 205,505 238,225 15.92%
Total 314,940$ 523,679$ 479,840$ 449,959$ 513,358$ 14.09%
92

Marketing Department Organizational Chart
Pay Classification Plan Information
Grade Min Mid Max FLSA Job Code Classification Title # of Slots
20 $24,675 $30,844 $37,013 N 5060101 Part-Time Welcome Center Aide 2
20 $24,675 $30,844 $37,013 N 5060108 Part-Time Museum Attendant 2
70 $31,492 $39,365 $47,238 N 5060107 Part-Time Event Coordinator/Welcome
Center Aide
1
70 $31,492 $39,365 $47,238 N TBD Part-Time Administrative Assistant II 1
120 $40,193 $50,241 $60,289 E 5060103 Graphic Designer 1
200 $59,383 $74,229 $89,075 E 5060105 Marketing Director 1
Marketing Director
Graphic DesignerPart-Time Event
Coordinator / Welcome Center Assistant
Part-Time Administrative
Assistant II
Part-Time Welcome Center Aide
Part-Time Museum Attendant
93

Senior Center
Mission Statement: The staff’s mission for those who are 50 and over is to provide the opportunity for our
“Young at Heart” to meet and enjoy a wide variety of social, educational, health, and recreational activities while
promoting the positive aspects of senior status to them, their families and the community at large.
Function: The Foley Senior Center is located at 304 E. Rose Avenue; our hours of operation are from 8am – 4pm
Monday – Friday. Our 6,000 sq. ft. facility includes a media room, computer lab, kitchen area, stage area and a
dance/exercise room. We offer 49 various activities throughout the year to our 754 members and during the past
year we had 21,436 visits to our facility to enjoy these activities.
Performance Goals: Our department goal is much like our mission statement. As our City is progressively
growing and expanding, we are also committed to growing and expanding the activities for our senior residents
and visitors. We are dedicated to our senior population and committed to offering these citizens a wide variety of
social, educational, health and recreational activities that help them stay active and engaged in our community.
We utilize the wise council of our seven (7) member advisory board to help guide us in what is important to our
seniors, as well as our suggestion box, but most importantly we spend time with our seniors and listen to what
their needs and concerns are.
Department Achievements
Recognized by The Baldwin County Commission for our outstanding contribution to Older Americans
Six participants in the Seniors Masters Games in Mobile coming away with four 1st place ribbons
Financial Summary
% Change
2017 2018 2019 2019 2020 2019 to
Expenditures Actual Actual Budget Projected Budget 2020
Personnel 214,433$ 227,624$ 243,456$ 234,535$ 248,385$ 5.91%
Capital - - 28,000 27,265 - -100.00%
Operational 52,679 55,252 57,840 51,810 55,885 7.87%
Total 267,112$ 282,876$ 329,296$ 313,610$ 304,270$ -2.98%
Senior Center Organizational Chart
Pay Classification Plan Information
Grade Min Mid Max FLSA Job Code Classification Title # of Slots
100 $36,456 $45,570 $54,684 N 5070101 Administrative Assistant IV 1
140 $44,313 $55,391 $66,469 E 5070102 Senior Center & Municipal Complex
Support Specialist
1
220 $65,470 $81,838 $98,205 E 5070103 Director of Senior Services &
Municipal Complex
1
Director of Senior Services & Municipal Complex
Senior Center & Municipal Complex Suport Specialist
Administrative Assistant IV
94

Beautification Department
Mission Statement: The mission of the Revitalization & Beautification Advisory Board is to enhance the quality
of life in our community with specific beautification projects. The Committee promotes community pride and
involvement through our revitalization and beautification programs by forming partnerships with individual
volunteers, schools, civic organizations, businesses, and theCity Mayor and Council.
Function: The Revitalization & Beautification Advisory Board acts in an advisory capacity in matters relating
and pertaining to landscaping for community enhancement and specific beautification projects on properties
owned, managed, leased, and operated by the City.
Performance Goals:
Organize the Annual Arbor Day Event and ensure the City maintains its Tree City USA membership.
Select winners of the annual Revitalization and Beautification Awards.
Work with the horticulture department on seasonal plantings.
Maintain suitable markers to identify trees, donors and honorees.
Continue development of Foley Heritage Park.
Maintain Foley Century Tree Program to protect and preserve old trees.
Department Achievements
In 2019, the City of Foley was recognized a Tree City USA by the National Arbor Day Foundation for the
38th year. This is the 2nd longest running designation in the State of Alabama.
Financial Summary
% Change
2017 2018 2019 2019 2020 2019 to
Expenditures Actual Actual Budget Projected Budget 2020
Personnel -$ -$ -$ -$ -$ 0.00%
Capital - 37,769 - - - 0.00%
Operational 91,531 50,756 112,585 89,046 103,090 15.77%
Total 91,531$ 88,525$ 112,585$ 89,046$ 103,090$ 15.77%
There are no City employees in the Beautification Division. The City Clerk’s office of the General Government
Department provides support services to the Board.
95

Nature Parks Department
Mission Statement: The Nature Parks Department provides a cohesive relationship between native wildlife
species and passive recreation opportunities for park visitors in a seamless fashion that utilizes the nature parks’
assets while creating minimal disturbance to the parks’ flora and fauna.
Function: The Nature Parks Department manages the Graham Creek Nature Preserve and Wolf Creek Park with
major tasks and responsibilities including: habitat management operations, recreational amenities additions and
maintenance, landscaping, coordination with groups and citizens for facility use and rentals, management of the
Interpretive Center, visitor assistance, planning and delivering successful events for public benefit, education and
outreach through social media, website and newsletters, seeking grants for additional amenities and conducting
tours.
Performance Goals:
Conduct habitat management operations
Offer wide range of passive recreational opportunities
Landscape and maintain nature park grounds
Provide facilities and venues for groups and citizens
Offer an Interpretive Center for nature park information
Provide quality customer service
Host events that fit within nature park mission
Obtain grants for additional amenities
Attract new visitors through advertising and public education
Objectives:
To increase natural habitats through invasive control, prescribed fire operations annually, and planting of
native vegetation areas for wildlife.
To increase and maintain existing recreational amenities such as trails, disc golf courses, archery ranges,
and kayak launches.
To perform regular maintenance and landscaping activities for aesthetically pleasing park grounds.
To increase rental venues for public and private events.
To increase visitors of the nature parks through information offering at the Interpretive Center.
To welcome visitors and provide assistance with use of nature parks.
To increase successful events that benefit the public and have limited impact on the natural resources.
To obtain grant funding for new appropriate amenities in the nature parks.
To increase new visitors through increase of social media interaction, updated website and newsletters
and public outreach and education.
Financial Summary
% Change
2017 2018 2019 2019 2020 2019 to
Expenditures Actual Actual Budget Projected Budget 2020
Personnel -$ 172$ 110,589$ 106,968$ 128,467$ 20.10%
Capital - - 49,266 49,266 47,000 -4.60%
Operational - 45,311 117,515 112,150 131,500 17.25%
Total -$ 45,483$ 277,370$ 268,384$ 306,967$ 14.38%
96

Nature Parks Organizational Chart
Pay Classification Plan Information
Grade Min Mid Max FLSA Job Code Classification Title # of Slots
60 $29,993 $37,491 $44,989 N TBD Part-Time Administrative Assistant I 1
80 $33,067 $41,334 $49,600 N 5090101 Events Specialist/Office Manager 1
90 $34,720 $43,400 $52,080 N 5090102 Parks Ranger 1
240 $72,181 $90,226 $108,271 E 2040102 Environmental Manager *
*This payroll cost is budgeted under the Environmental Departmental.
Environmental Manager
Parks RangerEvents
Specialist/Office Manager
Part-Time Administrative
Assistant I
97
Fund Balance
Major Revenues &
Major Expenses
98

Fund Balance
The City Council adopted a Minimum Fund Balance Policy for the General Fund as a safeguard against financial
demands caused by natural disasters and other unforeseen events. The policy establishes a minimum fund balance
goal equal to 25% of the Originally Budgeted operational expenditures and debt service obligations, less one time
expenditures greater than $500,000 and expenditures that are offset by transfers in or other financing sources.
Shown below is the fund balance goal and fund balance actuals for fiscal years 2017 and 2018; and the fund balance
goal and projected fund balance for 2019 and 2020 for the General Fund.
Fiscal Year Expenditures*
Fund Balance
Goal
Fund Balance
Actual/Projected
Amount
Exceeded
Fund Balance as %
of Expenditures
2017 35,102,056 8,775,514 9,268,737 493,223 26.41%
2018 37,501,722 9,375,443 12,304,712 2,929,269 32.81%
2019 38,535,089 9,633,772 11,364,277 1,730,505 29.49%
2020 39,747,544 9,936,886 15,049,749 5,112,863 37.86%
* Originally budgeted expenditures and debt service less one time expenditures greater than $500,000
and expenditures offset by transfers in or other financing sources.
Major Revenue Sources
The following table gives an analysis of General Fund top five revenue sources for two prior audited years, the
current year projections and next year’s budget.
2017 % of 2018 % of 2019 % of 2019 % of 2020 % of
Re ve nue Type Ac tua l Ac tua l Ac tua l Ac tua l Budge t Ac tua l P roje c te d Ac tua l Budge t Ac tua l
S a le s & use ta x 19,280,693$ 50% 23,546,995$ 55% 24,400,000$ 55% 25,600,000$ 56% 27,300,000$ 57%
Utility ta x e quiva le nts 6,796,594 18% 7,053,060 16% 7,250,000 16% 7,410,006 16% 7,484,000 16%
Busine ss lic e nse 2,504,014 7% 2,477,791 6% 2,500,000 6% 2,490,500 5% 2,500,000 5%
S a nita tion c ha rge s 1,313,530 3% 1,360,762 3% 1,380,000 3% 1,492,000 3% 1,800,000 4%
Lodging ta x 1,073,626 3% 1,234,281 3% 1,250,000 3% 1,440,000 3% 1,527,000 3%
S ubtota l 30,968,457$ 81% 35,672,889$ 83% 36,780,000$ 83% 38,432,506$ 84% 40,611,000$ 85%
99

Sales & Use Tax
The sales taxes rate within the City is 10%, with a distribution of 3% City, 3% County and 4% State and with the
highest collections occurring in the spring and summer months. Effective March 1, 2017, the City’s Sales Tax rate
temporarily increased from 2% to 3%. This increase is currently effective until August 31, 2020; however, the
Council intends to extend it until August 21, 2030, to fund the cost of major infrastructure additions.
$-
$5,000,000
$10,000,000
$15,000,000
$20,000,000
$25,000,000
$30,000,000
Sales Tax Collections
2011 2012 2013 2014 2015 2016 2017 2018 2019 2020
100

Utility Tax Equivalents
The City receives monthly tax equivalent payments from the Utilities Board of the City of Foley which are based
on the retained earnings of the Board. The annual tax equivalent rate for the years presented below is 4.25%. The
Utilities Board operates on a June 30 year end and provides the City the estimate in August or September for the
upcoming year after completion of their annual audit. The average increase is 2-3% and can be attributed to new
housing units.
$-
$1,000,000
$2,000,000
$3,000,000
$4,000,000
$5,000,000
$6,000,000
$7,000,000
$8,000,000
Utility Tax Equivalents
2011 2012 2013 2014 2015 2016 2017 2018 2019 2020
101

Business License
Business Licenses are renewable in January and vary depending on the business type and gross receipts. Business
License revenue collections for 2019 remained consistent with 2018 collections. Business license amounts for fiscal
year 2017 had significant growth due to the construction and opening of OWA.
$-
$500,000
$1,000,000
$1,500,000
$2,000,000
$2,500,000
$3,000,000
Business License
2011 2012 2013 2014 2015 2016 2017 2018 2019 2020
102
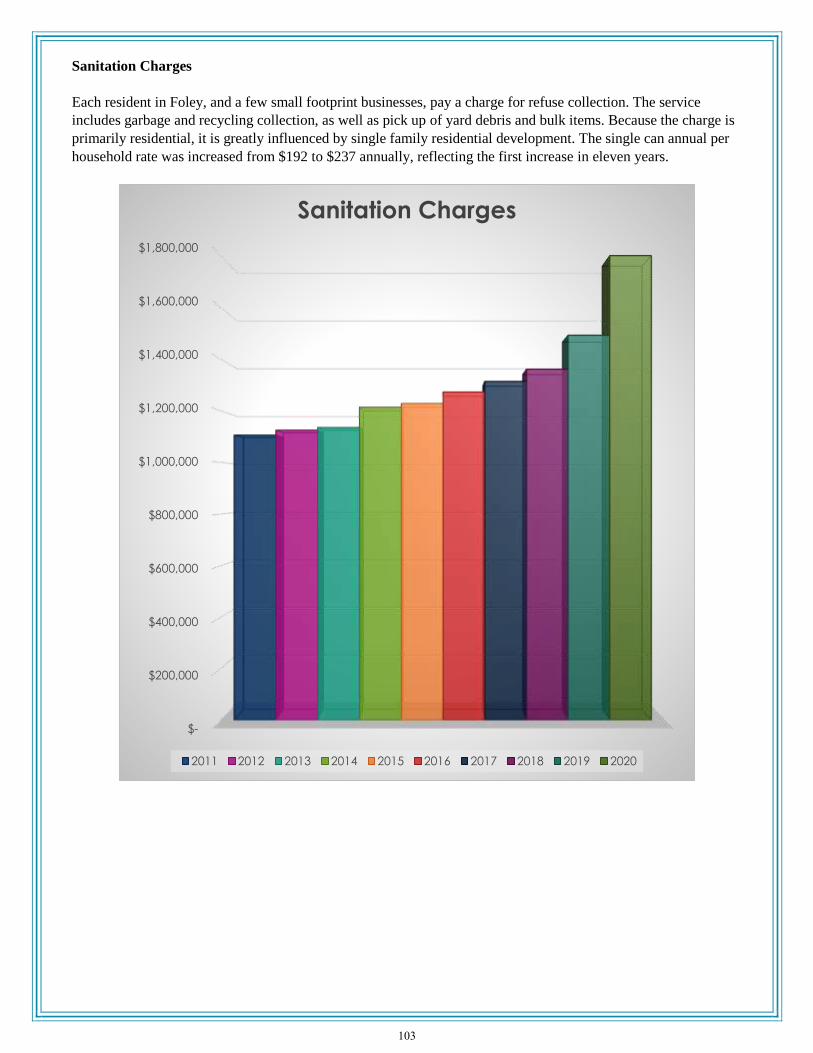
Sanitation Charges
Each resident in Foley, and a few small footprint businesses, pay a charge for refuse collection. The service
includes garbage and recycling collection, as well as pick up of yard debris and bulk items. Because the charge is
primarily residential, it is greatly influenced by single family residential development. The single can annual per
household rate was increased from $192 to $237 annually, reflecting the first increase in eleven years.
$-
$200,000
$400,000
$600,000
$800,000
$1,000,000
$1,200,000
$1,400,000
$1,600,000
$1,800,000
Sanitation Charges
2011 2012 2013 2014 2015 2016 2017 2018 2019 2020
103

Lodging Tax
Lodging Tax has become a major revenue source for the City due to an increase in the rate from 4% to 7% effective
November 2013, the construction of additional hotels within the City, and an overall increase in tourism.
$-
$200,000
$400,000
$600,000
$800,000
$1,000,000
$1,200,000
$1,400,000
$1,600,000
Lodging Tax Collected
2011 2012 2013 2014 2015 2016 2017 2018 2019 2020
104
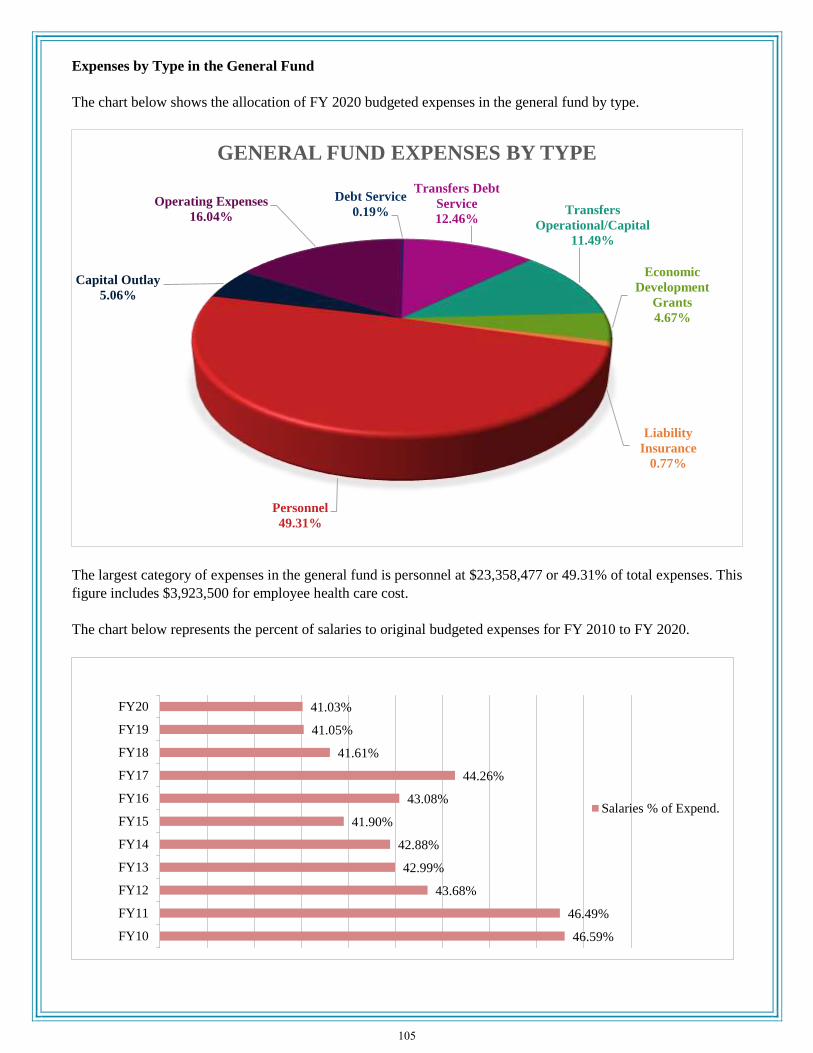
Expenses by Type in the General Fund
The chart below shows the allocation of FY 2020 budgeted expenses in the general fund by type.
The largest category of expenses in the general fund is personnel at $23,358,477 or 49.31% of total expenses. This
figure includes $3,923,500 for employee health care cost.
The chart below represents the percent of salaries to original budgeted expenses for FY 2010 to FY 2020.
Debt Service
0.19%
Transfers Debt
Service
12.46%Transfers
Operational/Capital
11.49%
Economic
Development
Grants
4.67%
Liability
Insurance
0.77%
Personnel
49.31%
Capital Outlay
5.06%
Operating Expenses
16.04%
GENERAL FUND EXPENSES BY TYPE
46.59%
46.49%
43.68%
42.99%
42.88%
41.90%
43.08%
44.26%
41.61%
41.05%
41.03%
FY10
FY11
FY12
FY13
FY14
FY15
FY16
FY17
FY18
FY19
FY20
Salaries % of Expend.
105
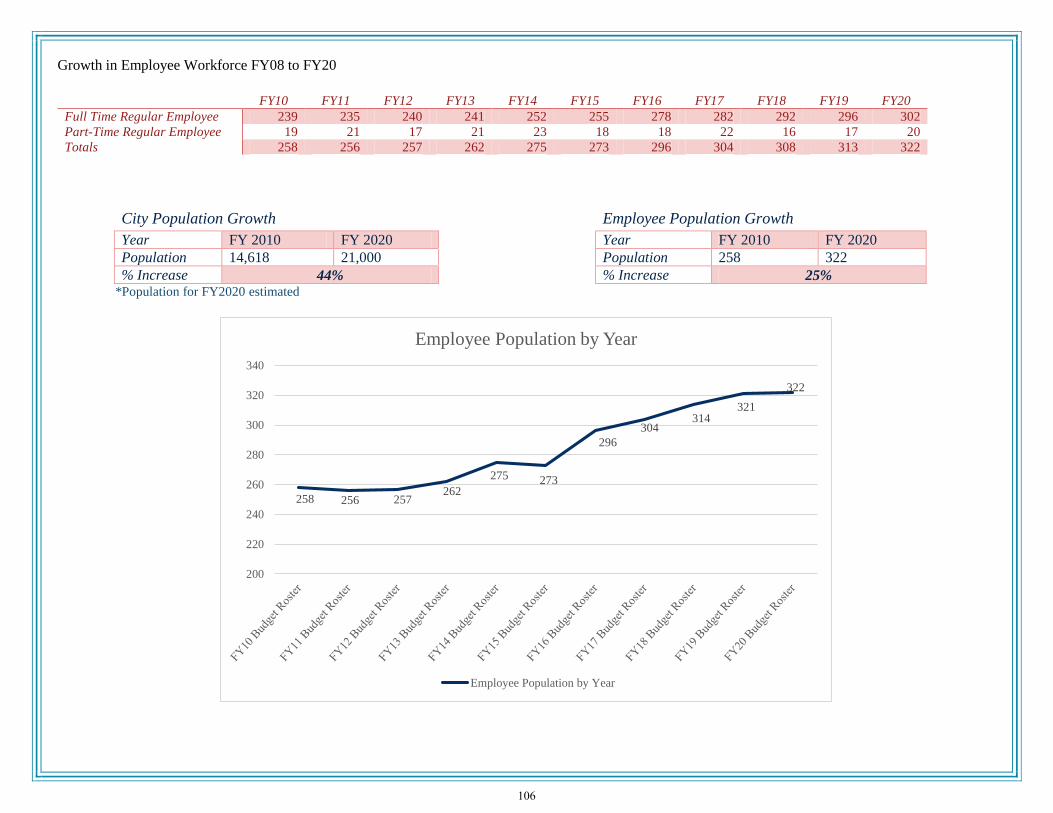
Growth in Employee Workforce FY08 to FY20
FY10 FY11 FY12 FY13 FY14 FY15 FY16 FY17 FY18 FY19 FY20
Full Time Regular Employee 239 235 240 241 252 255 278 282 292 296 302
Part-Time Regular Employee 19 21 17 21 23 18 18 22 16 17 20
Totals 258 256 257 262 275 273 296 304 308 313 322
City Population Growth Employee Population Growth
Year FY 2010 FY 2020 Year FY 2010 FY 2020
Population 14,618 21,000 Population 258 322
% Increase 44% % Increase 25% *Population for FY2020 estimated
258 256 257262
275 273
296
304314
321
322
200
220
240
260
280
300
320
340
Employee Population by Year
Employee Population by Year
106

Staffing summary – General Fund by Department
Department 2018 Full
Time
2018 Part
Time
2019 Full
Time
2019 Part
Time
2020 Full
Time
2020 Part
Time
General Government
General Government 19 1 19 1 18 2
Public Works 2 0 2 0 2 0
Municipal Complex 8 0 8 0 8 0
Municipal Court 6 1 6 1 6 1
Vehicle Maintenance Shop 5 0 5 0 5 0
Information & Technology 6 0 6 0 6 0
Public Safety
Police 95 0 95 1 97 1
Fire 33 0 33 0 33 0
Community Development 9 0 9 0 10 0
Environmental 4 0 3 0 3 0
Highways & Streets
Streets 28 3 28 3 31 3
Engineering 4 0 4 0 4 0
Sanitation 15 0 16 1 16 2
Culture & Recreation
Parks 12 0 12 0 12 0
Library 12 4 12 4 12 4
Senior Center 3 0 3 0 3 0
Recreation 12 0 12 0 12 0
Sports Tourism 12 0 13 0 14 0
Horticulture 5 0 6 0 6 0
Marketing 2 7 2 6 2 6
Nature Parks 0 0 2 0 2 1
Total 292 16 296 17 302 20
107

FY 2020 Budget – New Head Count Request
Request Grade Hourly Salary
Est. Annual
Benefit Total Cost
Public Works-Temp-PT Admin Assistant – 3rd Qtr 1,248 hrs Est. 50 $13.73 $17,135.04 $2,570.26 $9,852.65
Street-Perm-FT Equipment Operator II-Construction Crew – 2nd Qtr * 80 $17.02 $2,620.80 $393.12 $3,013.92 **
Street-Perm-FT Equipment Operator II-Road Crew – 2nd Qtr * 80 $15.90 $33,072.00 $16,536.00 $36,252.00
Street-Perm-FT Sweeper Truck Driver – 4th Qtr * Est 70 $15.58 $2,412.80 $361.92 $640.32 **
Street-(2) Temp-FT Equipment Operator-Sidewalk Crew 60 $14.42 $9,228.80 $1,384.32 $21,226.24
Sanitation-Perm-PT Sanitation Worker I/Driver Operator – 3rd Qtr * 70 $15.14 $18,894.72 $2,834.21 $10,864.46
Police-(2) Patrol Officers – 3rd Qtr * 150 $21.31 $46,541.04 $23,270.52 $69,811.56
Community Development-Perm-FT-Admin Assistant – 2nd Qtr * 60 $14.42 $29,993.60 $14,996.80 $16,986.60
Municipal Complex-Temp-PT-Building Custodian – 2nd Qtr * $14.00 $17,472.00 $2,620.80 ($9,618.00) **
Gen Gov/HR-Perm-PT-Admin Assistant – 1st Qtr 1,508 hrs * 60 $14.42 $21,745.36 $3,261.80 $10,007.16 **
Marketing-Temp-PT-Caboose Club Operator – 1st Qtr 780 hrs * Est 60 $14.42 $11,247.60 $1,687.14 $12,934.74
Sports Tourism-Perm-FT-Field Maintenance Worker I – 3rd Qtr * 50 $13.74 $28,579.20 $14,289.60 $23,083.20
Nature Parks-Perm-PT Admin Assistant – 3rd Qtr 1,508 hrs * Est 60 $14.42 $21,745.36 $3,261.80 $12,503.58
New Headcount Personnel Request Subtotal $217,558.44
Miscellaneous Labor Cost
Street – Increase overtime by $5,000 $5,000.00 $750.00 $5,750.00
Street – Increase uniform for new employees $1,600.00 $1,600.00
Police – Increase salaries to over 84-86 hour gap $20,000.00 $3,000.000 $23,000.00
Police – Increase overtime $40,000.00 $6,000.00 $46,000.00
Police – Increase uniforms for new officers $2,000.00 $2,000.00
Fire – Increase overtime $8,825.00 $1,323.75 $10,148.75
Senior Center – Increase overtime $500.00 $75.00 $575.00
Senior Center – Decrease uniforms ($150.00) ($150.00)
Recreation – Increase overtime $10,000.00 $1,500.00 $11,500.00
Recreation – Increase PT salaries $1,000.00 $150.00 $1,150.00
Sports Tourism – Increase PT salaries $19,000.00 $2,850.00 $21,850.00
IT – Decrease to uniforms ($250.00) ($250.00)
Environmental – Increase overtime $250.00 $37.50 $287.50
Environmental – Increase uniforms $400.00 $400.00
Nature Parks – Decrease overtime ($500.00) ($500.00)
Nature Parks – Increase PT salaries $4,500.00 $675.00 $5,175.00
Other Miscellaneous Labor Cost Subtotal $128,461.25
Grand Total New Head Count Request FY 2020 $346,019.69 ‘* Amends the Pay Plan ** These positions are offset either partial or in full by personnel cost that is currently budgeted.
108

Policy for Employee Raises & Job Analysis for FY20 Budget Year
The FY20 Budget authorizes and allocates funding for employee pay-for-performance raises for FY20 for Full-
Time and Part-Time Regular Employees as defined by the Personnel System Policy. The Reserve for Salary
Increases Account (#100-9200-5999) contains a budget figure of $322,405 for pay out of employee raises during
FY20. This is an increase of $8,887 over last year’s figure of $313,518.
Under the City’s automated Performance Appraisal System, raises are awarded each year on the employee’s
anniversary date (date of hire). The employee’s final review is due by the employee’s anniversary date and the
employee will receive their merit raise on the pay check following the first full pay period following receipt of the
Final Appraisal.
The performance appraisal rating scale and the associated raises are as follows:
Consistently Exceeds Standards (score of 45.5 – 50.0) = 5% raise
Exceeds Standards (score of 35.5 – 45.4) = 4% raise
Meets Standards (score of 25.5 – 35.4) = 3% raise
Partially Meets Standards (score of 15.5 – 25.4) = 0% raise
Does Not Meet Standards (score of 0 - 15.4) = 0% raise
Standard Operating Procedures for Raises:
It will be the responsibility of the Directors/Department Heads to get the Final Appraisal in on time so the employee
can receive their raise on time. If the Final Appraisal is not turned in on time, the raise will be awarded on the pay
check following the first full pay period following the date of receipt of the Final Appraisal. Human Resources will
not back pay raises.
Note: For Directors, Department Heads and executive level full-time, regular employees who do not receive
employee performance appraisals through Halogen, the City Administrator will recommend the percentage amount
of the raise to the Mayor on the same time line as described above. The Mayor will then solicit input from the
Council members and based on that input will make the final decision on the percentage or dollar amount of the
raise for each of these employees. The City Administrator will then deliver the decision on the raise in an email to
the HR Director, who will then process it through payroll on the same time line as described above.
HR will provide Finance a quarterly report for preparation of a budget adjustment to report the necessary figures to
departmentalize the cost of raises. This will move the funds out of the Reserve for Salary Increases account to the
actual departmental personnel accounts.
There is also a $43,640 pool of funds budgeted in this account for anticipated job analysis requests from Directors
on current employee pay grades that we anticipate to occur during the FY20 Budget year. Based upon the results of
the job analysis, position pay grades and departmental salary accounts will be adjusted using these funds if the
job(s) qualify for an upgrade.
109

Standard Operating Procedures for Requesting Job Analysis:
Directors will discuss the position with HR and the change in job duties. If it is determined that the change in job
duties are substantially affecting the essential duties in any or all of the five job factors of 1) Leadership; 2) Working
Conditions; 3) Complexity; 4) Decision Making; and 5) Relations, then the employee will be requested to complete
a JAT Survey (Job Assessment Tool) for review by HR. HR will review the JAT with the Supervisor/Director and
any adjustments that need to be made will be made. HR will then conduct the job analysis on the 5 factors and will
obtain market data to conduct both an internal and external analysis. If the analysis indicates that the job needs a
pay grade adjustment, FLSA status change, modified job title, etc. then HR will prepare a Council Resolution to
bring before the Council for consideration of the adjustment to the City’s Pay Classification Plan for the position.
$322,405 (pay raises)
+ $43,640 (job analysis)
$366,045 Total Budget Amount for Reserve for Salary Increase Account
City of Foley Policy - “GAP” Day & Holiday Pay
“GAP” days are days that fall between a City approved holiday and a weekend. For example, if a holiday falls on a
Tuesday, the Council may elect, via the budget adoption each fiscal year, to allow City employees to also have the
Monday off prior to the Tuesday holiday as a “GAP” day. (“GAP” days, if approved, are recorded as “Personal
Days” in the City’s payroll system). “GAP” Days must be used prior to any accrued annual or compensatory leave
being used. Accrued personal leave hours will not be paid out if/when the employee retires or terminates
employment.
GAP days fall differently on the calendar from year to year. Some years there may be several “GAP” days and other
years there may be no GAP days if all City approved holidays happen to fall on a Friday and/or a Monday. In FY20,
there is one (1) GAP day occurring on Monday, December 23rd as reflected on the calendar at the end of this section.
City Approved Holidays Per PSP 3.3.7(7) *
New Year’s Day
Martin Luther King Day
Memorial Day
Independence Day
Labor Day
Veterans Day
Thanksgiving Day
Day after Thanksgiving
Christmas Eve
Christmas Day
Full-Time Regular Employees who are normally scheduled to work on a holiday, and do not work due to the
approved holiday, will receive a standard eight (8) hours of “Holiday Pay”. If the employee works the holiday, they
will receive 8 hours of “Holiday Pay” on top of the pay for the hours worked.
Part-Time Regular Employees who are normally scheduled to work on a holiday, and do not work due to the
approved holiday, will receive a standard (4) hours of “Holiday Pay”. If the employee works the holiday, they will
receive 4 hours of “Holiday Pay” on top of the pay for the hours worked.
* Temporary employees are not eligible for holiday and/or personal day leave.
* Excludes Declared State of Emergencies (Hurricane, etc.)
110
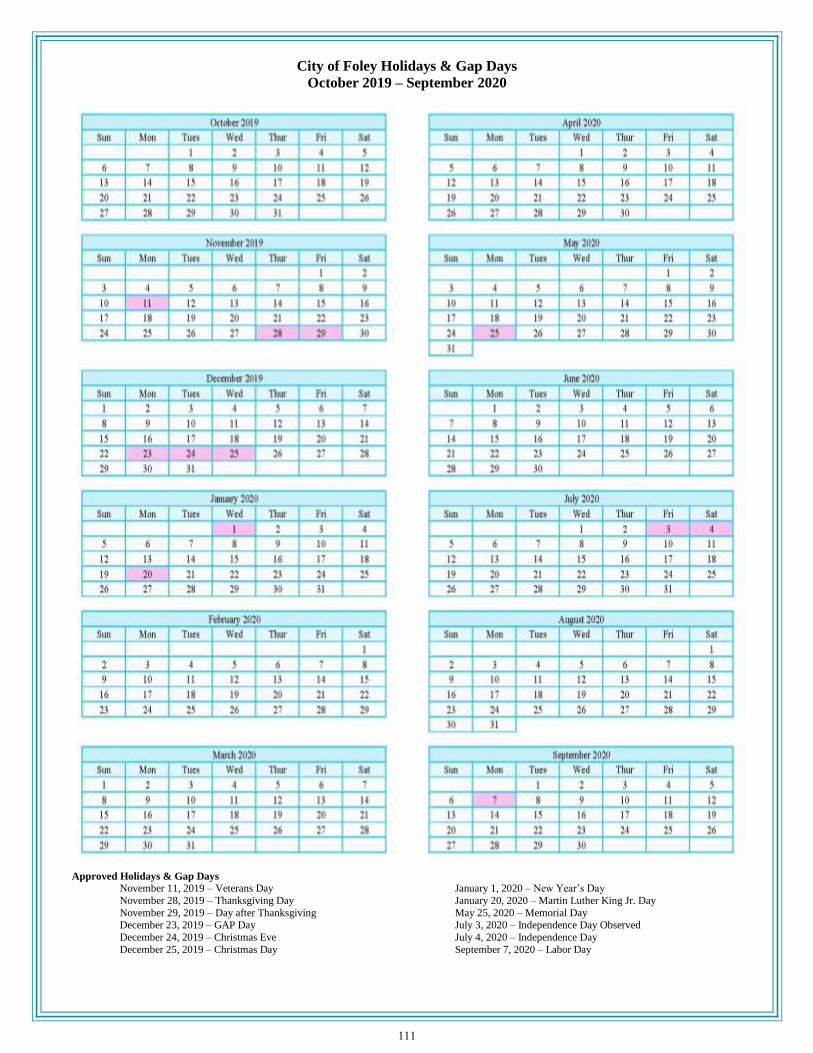
City of Foley Holidays & Gap Days
October 2019 – September 2020
Approved Holidays & Gap Days
November 11, 2019 – Veterans Day January 1, 2020 – New Year’s Day
November 28, 2019 – Thanksgiving Day January 20, 2020 – Martin Luther King Jr. Day
November 29, 2019 – Day after Thanksgiving May 25, 2020 – Memorial Day December 23, 2019 – GAP Day July 3, 2020 – Independence Day Observed
December 24, 2019 – Christmas Eve July 4, 2020 – Independence Day
December 25, 2019 – Christmas Day September 7, 2020 – Labor Day
111

Capital Expenditures &
Long Term Plans
112

Capital Purchases and Capital Projects
The City maintains a ten year capital purchase plan in the General Fund and a five-year capital improvement plan
in the Capital Projects Fund. The ten year capital purchase plan was developed by management to assist the
directors in scheduling a replacement cycle for their vehicles and equipment. The five year capital improvement
plan is used to schedule a variety of capital projects which may be funded by grants or by other sources.
During budget preparation, directors submit their updated ten year capital purchase plan and five year capital
project plan. The Finance Division compiles reports for all departmental requests and reviews with the City
Administrator. Because capital purchases and capital projects have a major effect on the operational fund
balance, the City has safeguards in place to ensure that the Council maintains additional controls over these
expenditures as further described in the following paragraph.
Capital purchases and their budget are approved when the council adopts the budget but directors must obtain
permission from Council in the form of a Resolution before proceeding. This allows the Council to have control
over the timing of the purchase and ensures each purchase is at or under the approved budgeted amount. All
appropriations for capital purchases lapse at the end of the fiscal year. In contrast, the capital project plan is
included in the adopted budget but each project requires appropriation of funds by Council via Resolution prior to
beginning. The budgets for projects do not expire until the project is completed and may span multiple years.
The tables below provide a summary of capital expenditure projections for 2019, and capital expenditures
budgeted for 2020, by fund and type of expenditure.
Fund Revenues Infras tructure
P ro perty
Impv Buildings
Building
Impv
Vehic les &
Equipment
No n-capita l
Expens es
To ta l
Expenditures
% o f
To ta l
General Fund 14,153 - - - - 1,077,585 - 1,077,585 9.68%
Capita l P ro jec ts Fund 3,124,163 5,534,501 667,751 615,000 416,252 2,500 993,967 8,229,971 73.91%
Fire AdValo rem Fund - - - - - 16,000 - 16,000 0.14%
J ail Co rrec tio ns - - 28,777 - - - - 28,777 0.26%
P ASFCD - - 977,286 - - - - 977,286 8.78%
P CEFCD - - 805,310 - - - - 805,310 7.23%
To tal 3,138,316 5,534,501 2,479,124 615,000 416,252 1,096,085 993,967 11,134,929 100%
2019 P ro jec ted Expenditures
Fund Revenues Infras tructure
P ro perty
Impv Buildings
Building
Impv
Vehic les &
Equipment
No n-capita l
Expens es
To ta l
Expenditures
% o f
To ta l
General Fund 6,000 - - - - 2,397,802 - 2,397,802 20.36%
Capita l P ro jec ts Fund 3,943,187 5,323,259 1,766,700 210,000 242,000 170,619 1,002,000 8,714,578 73.99%
Fire AdValo rem Fund - - - - - 530,481 - 530,481 4.50%
J ail Co rrec tio ns - - - - - 135,000 - 135,000 1.15%
To tal 3,949,187 5,323,259 1,766,700 210,000 242,000 3,233,902 1,002,000 11,777,861 100%
2020 Budgeted Expenditures
Fiscal year 2019 included $1,782,596 in capital expenditures in the PASFCD & PCEFCD for the settlement of the
event center and the multi-use fields construction arbitrations. These expenditures are onetime cost.
113
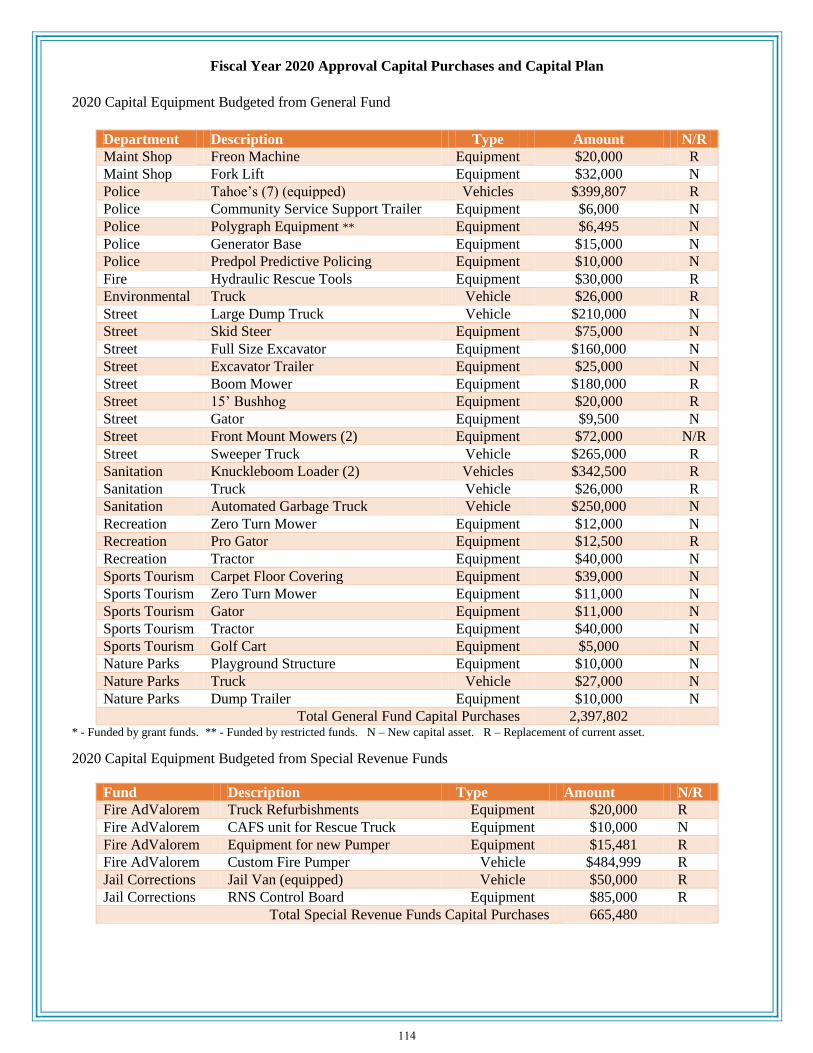
Fiscal Year 2020 Approval Capital Purchases and Capital Plan
2020 Capital Equipment Budgeted from General Fund
Department Description Type Amount N/R
Maint Shop Freon Machine Equipment $20,000 R
Maint Shop Fork Lift Equipment $32,000 N
Police Tahoe’s (7) (equipped) Vehicles $399,807 R
Police Community Service Support Trailer Equipment $6,000 N
Police Polygraph Equipment ** Equipment $6,495 N
Police Generator Base Equipment $15,000 N
Police Predpol Predictive Policing Equipment $10,000 N
Fire Hydraulic Rescue Tools Equipment $30,000 R
Environmental Truck Vehicle $26,000 R
Street Large Dump Truck Vehicle $210,000 N
Street Skid Steer Equipment $75,000 N
Street Full Size Excavator Equipment $160,000 N
Street Excavator Trailer Equipment $25,000 N
Street Boom Mower Equipment $180,000 R
Street 15’ Bushhog Equipment $20,000 R
Street Gator Equipment $9,500 N
Street Front Mount Mowers (2) Equipment $72,000 N/R
Street Sweeper Truck Vehicle $265,000 R
Sanitation Knuckleboom Loader (2) Vehicles $342,500 R
Sanitation Truck Vehicle $26,000 R
Sanitation Automated Garbage Truck Vehicle $250,000 N
Recreation Zero Turn Mower Equipment $12,000 N
Recreation Pro Gator Equipment $12,500 R
Recreation Tractor Equipment $40,000 N
Sports Tourism Carpet Floor Covering Equipment $39,000 N
Sports Tourism Zero Turn Mower Equipment $11,000 N
Sports Tourism Gator Equipment $11,000 N
Sports Tourism Tractor Equipment $40,000 N
Sports Tourism Golf Cart Equipment $5,000 N
Nature Parks Playground Structure Equipment $10,000 N
Nature Parks Truck Vehicle $27,000 N
Nature Parks Dump Trailer Equipment $10,000 N
Total General Fund Capital Purchases 2,397,802 * - Funded by grant funds. ** - Funded by restricted funds. N – New capital asset. R – Replacement of current asset.
2020 Capital Equipment Budgeted from Special Revenue Funds
Fund Description Type Amount N/R
Fire AdValorem Truck Refurbishments Equipment $20,000 R
Fire AdValorem CAFS unit for Rescue Truck Equipment $10,000 N
Fire AdValorem Equipment for new Pumper Equipment $15,481 R
Fire AdValorem Custom Fire Pumper Vehicle $484,999 R
Jail Corrections Jail Van (equipped) Vehicle $50,000 R
Jail Corrections RNS Control Board Equipment $85,000 R
Total Special Revenue Funds Capital Purchases 665,480
114

2020 Capital Projects Fund Plan
Department Description Type Amount N/R
IT LPR Camera Expansion Equipment $50,000 N
IT Fiber Expansion Infrastructure $50,000 N
Maint Shop Fuel Pump Building Impv Building Impv $15,000 R
Airport Ramp Taxiway Mill & Repave * Infrastructure $597,927 R
Police Radio Channels (3 sites) Equipment $53,519 N
Police Radio Equipment Upgrades Equipment $18,100 N
Fire Traffic Preemption Signal Equipment $10,000 N
Fire Nexedge Radio System Site Equipment $30,000 N
Fire Traffic Warning Signal (Station 3) Equipment $9,000 N
Environmental Bon Secour Water Quality * Property Impv $1,410,200 N
Street Road Construction (in house) Infrastructure $117,840 N
Street Sidewalk Improvements (various) Infrastructure $50,000 R
Engineering Street Improvements (various) Infrastructure $25,000 R
Engineering Fern Ave Extension (ongoing project) * Infrastructure $1,097,717 N
Engineering Traffic Safety-CR 12 & FBE * Infrastructure $500,000 R
Engineering Traffic Safety (various) * Infrastructure $400,000 R
Engineering Hamburg Building Preservation Building Impv $25,000 R
Engineering Juniper St Extension Infrastructure $1,219,775 N
Engineering Juniper/Us 98 Intersection Impv Infrastructure $15,000 N
Engineering FBE Intersection Imvp Infrastructure $600,000 R
Engineering TAP Grant – 9th Ave sidewalks * Infrastructure $500,000 R
Engineering Rose Trail near Post Office Infrastructure $150,000 R
Engineering Pine St Property Impv (BOE) Property Impv $50,000 R
Engineering Centennial Fountain Impv Property Impv $150,000 R
Parks Mel Roberts Bathroom Bldg Building $100,000 R
Sports Tourism Acoustical Dampening Building Impv $145,000 N
Sports Tourism Press Box Building Impv $20,000 N
Sports Tourism Bathrooms Property Impv $25,000 N
Sports Tourism Pole Barn Property Impv $10,000 N
Horticulture Office Building Building $85,000 N
Horticulture Security Fencing Property Impv $15,000 N
Senior Center Senior Center Roof Building Impv $37,000 R
GCNP Outdoor Class Pavilion Building $25,000 N
GCNP Fencing & Storage Area Property Impv $24,000 N
GCNP West Entrance Impv Property Impv $7,500 R
GCNP Boardwalk * Property Impv $75,000 N
Total Capital Projects Fund Planned Projects 7,712,578 * - Funded by grant funds. – Total grant funding for FY20 is $3,943,187.
The City typically has $1.2-$1.5 million in capital equipment purchases in the general fund each year. The
equipment purchased each year changes (with the exception of police cars), but the amount usually falls within
those ranges. This year is higher than average due to the City outfitting a road construction crew.
The City typically has $4-5 million (net of grants) planned in the capital projects fund each year. This includes the
annual resurfacing which is not capitalized and not listed above.
115

2 ATV’s for the Foley Police
Department received through
Firehouse Public Safety Grant. Tua is
the newest K9 purchased. Also, 7 new
Tahoes were purchased this year.
116
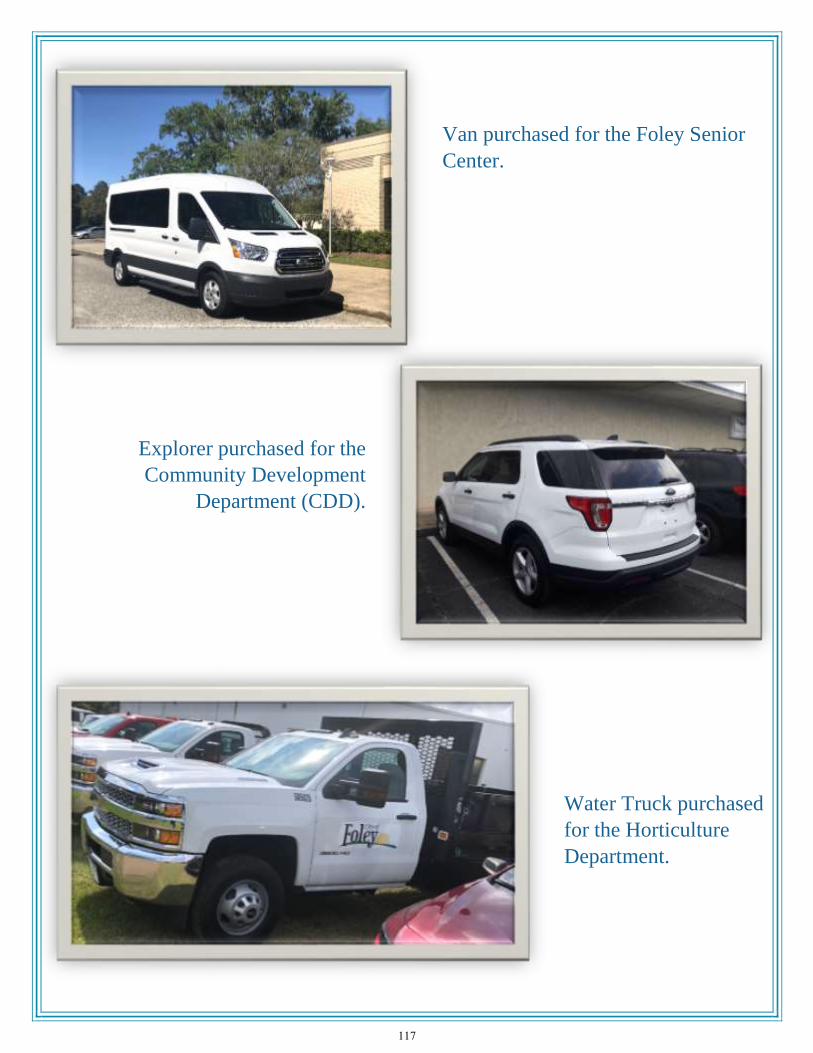
Van purchased for the Foley Senior
Center.
Explorer purchased for the
Community Development
Department (CDD).
Water Truck purchased
for the Horticulture
Department.
117

Equipment & Vehicles purchased for Street Department.
118

New Location purchased for Community Development Department
12” outer walls
2 safe rooms w/ concrete ceilings
Secure windows
Backup generator
Heavy gauge metal roof
2 hour UL fire rated with self-closing steel
fire doors
119

Ten Year Capital Equipment Plan
Department FY 20 FY 21 FY 22 FY 23 FY 24 FY 25 FY 26 FY 27 FY 28 FY 29
General Government
Vehicle - - - - 38,000 - - - - -
Total - - - - 38,000 - - - - -
Municipal Complex
None - - - - - - - - - -
Total - - - - - - - - - -
Municipal Court
None - - - - - - - - - -
Total - - - - - - - - - -
Information Technology
Data center virtualization servers - - 75,000 - - - - - - -
New server room UPS - - - - - - 40,000 - - -
New IT vehicle - 32,000 - - - - - - - -
Total - 32,000 75,000 - - - 40,000 - - -
Maintenance Shop
Freon machine 20,000 - - - - - - - - -
Fork lift 32,000 - - - - - - - - -
Full size pick up - - - 26,000 - - - - 28,000 -
Tire machine - 10,000 - - - - - - - -
Service truck - - 80,000 - - - - - - -
Total 52,000 10,000 80,000 26,000 - - - - 28,000 -
Public Works
Fuel Pumps - 25,000 - - - - - - - -
Total - 25,000 - - - - - - - -
Airport
None - - - - - - - - - -
Total - - - - - - - - - -
120

Department FY 20 FY 21 FY 22 FY 23 FY 24 FY 25 FY 26 FY 27 FY 28 FY 29
Police
Tahoes 224,857 230,479 236,241 242,147 248,201 254,406 254,406 254,406 254,406 254,406
Equipment 159,950 159,950 159,950 159,950 159,950 159,950 159,950 159,950 159,950 159,950
Axon ICVS 15,000 15,000 15,000 15,000 15,000 15,000 15,000 15,000 15,000 15,000
K-9 - 10,000 10,000 10,000 10,000 10,000 - 10,000 - -
Community Service Support Trailer 6,000 - - - - - - - - -
Polygraph Equipment 6,495 - - - - - - - - -
Generator Base 15,000 - - - - - - - - -
Pedpol Predictive Policing 10,000 - - - - - - - - -
Speed Trailer - 10,000 - - - - - - - -
ATV's - - 15,000 - - - - - - -
Mobile Dispatch In Car System - 37,434 - - - - - - - -
TRTV - - - 17,000 - - - - - -
Total Station - - - 85,000 - - - - - -
Replace/Upgrade Mobile Command - - 72,000 - - - - - - -
Total 437,302 462,863 508,191 529,097 433,151 439,356 429,356 439,356 429,356 429,356
Fire
Hydraulic rescue tools 30,000 - 35,000 - - - - - - -
Refurbish rescue truck - 100,000 - - - - - - - -
Total 30,000 100,000 35,000 - - - - - - -
Community Development
Van - - 28,000 - - 28,000 - - - -
Total - - 28,000 - - 28,000 - - - -
Environmental
Full size pick up 26,000 - - - - - - - - -
Mosquito sprayer - 15,000 - - - 15,000 - - - -
Granular Spreader - - 10,000 - - - - - - -
SUV - - 25,000 - - - 30,000 - - -
Total 26,000 15,000 35,000 - - 15,000 30,000 - - -
121

Department FY 20 FY 21 FY 22 FY 23 FY 24 FY 25 FY 26 FY 27 FY 28 FY 29
Streets
Construction Equipment
Large dump truck tri-axle 210,000 - - - - - - 210,000 - -
Skid Steer 75,000 - - - - 90,000 - - - -
Full size excavator 160,000 - - - - - - - - 150,000
Excavator trailer 25,000 - - - - - - - - -
Full size pick up - - - - - 26,000 - - - 26,000
Heavy duty flatbed/dump - 55,000 - - - - 110,000 - - -
Small dump truck - - - - 80,000 - - - - -
Large dump truck tandem - - - 160,000 - - - - - -
Asphalt patcher - - - - - 75,000 - - - -
Mini excavator - - 50,000 - - - 50,000 - - 50,000
Backhoe - - - 110,000 - - - - - -
Front end loader - - - - 120,000 - - - - -
Bulldozier/trailer - - 140,500 - - - - - - -
Vaccuum/jetter pull behind - 40,000 - - - - - - - -
Maintenance Equipment
Boom mower 180,000 - - - 180,000 - - - - -
15' Bushhog 20,000 - - - - - 20,000 - - 20,000
Gator 9,500 - - 9,500 - - 9,200 - - -
Front mount mower 72,000 72,000 37,500 37,500 38,000 38,000 40,000 40,000 40,000 40,000
Full size pick up - - 26,000 - - - - - 26,000 26,000
Bucket truck - 110,000 - - - - - 110,000 - -
Big tractor - 60,000 - 60,000 - - - - - 60,000
Sidewalk Equipment
Sweeper truck 265,000 - - - - - - - - -
Full size pick up - 26,000 - - - - - - - -
Heavy duty flatbed/dump - - - - 55,000 - - - - -
Gator X2 - - 11,000 - - - 11,000 - - -
Z3 Ride on Blower - - 10,000 - - - - 10,000 - -
Enclosed trailer - 5,000 - - - - - - - -
Total 1,016,500 368,000 275,000 377,000 473,000 229,000 240,200 370,000 66,000 372,000
Engineering
Truck - - - 35,000 - - 35,000 - - -
Total - - - 35,000 - - 35,000 - - -
122
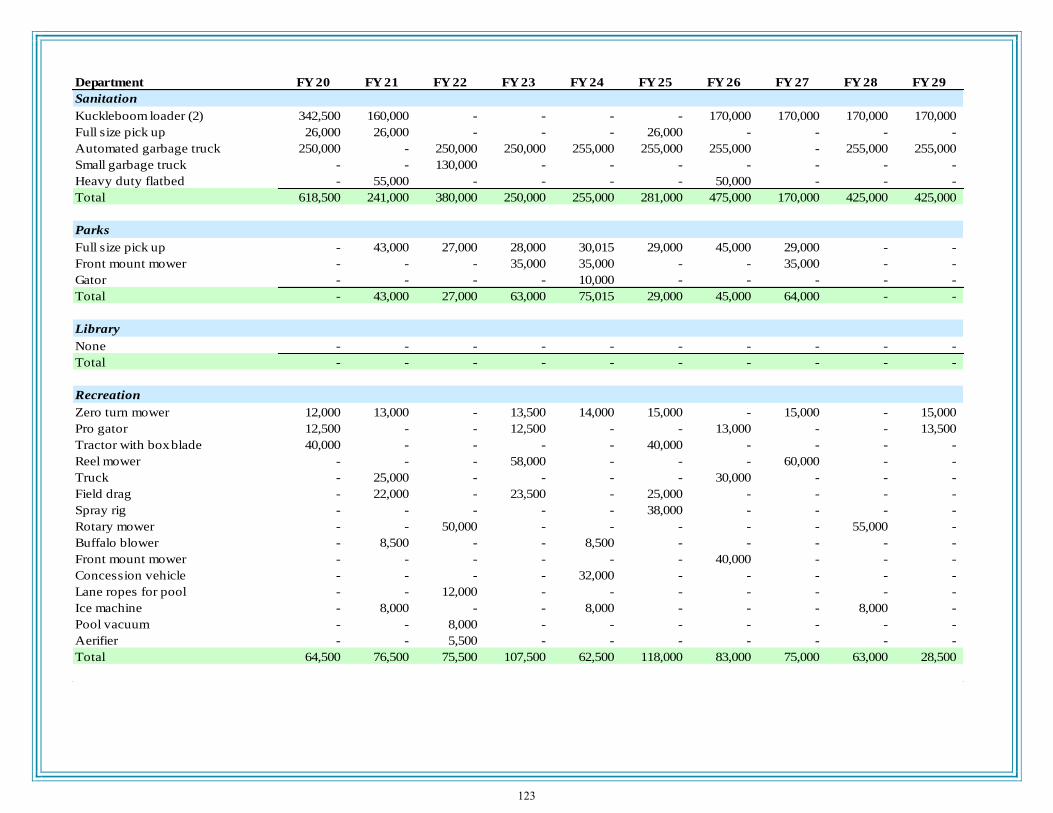
Department FY 20 FY 21 FY 22 FY 23 FY 24 FY 25 FY 26 FY 27 FY 28 FY 29
Sanitation
Kuckleboom loader (2) 342,500 160,000 - - - - 170,000 170,000 170,000 170,000
Full size pick up 26,000 26,000 - - - 26,000 - - - -
Automated garbage truck 250,000 - 250,000 250,000 255,000 255,000 255,000 - 255,000 255,000
Small garbage truck - - 130,000 - - - - - - -
Heavy duty flatbed - 55,000 - - - - 50,000 - - -
Total 618,500 241,000 380,000 250,000 255,000 281,000 475,000 170,000 425,000 425,000
Parks
Full size pick up - 43,000 27,000 28,000 30,015 29,000 45,000 29,000 - -
Front mount mower - - - 35,000 35,000 - - 35,000 - -
Gator - - - - 10,000 - - - - -
Total - 43,000 27,000 63,000 75,015 29,000 45,000 64,000 - -
Library
None - - - - - - - - - -
Total - - - - - - - - - -
Recreation
Zero turn mower 12,000 13,000 - 13,500 14,000 15,000 - 15,000 - 15,000
Pro gator 12,500 - - 12,500 - - 13,000 - - 13,500
Tractor with box blade 40,000 - - - - 40,000 - - - -
Reel mower - - - 58,000 - - - 60,000 - -
Truck - 25,000 - - - - 30,000 - - -
Field drag - 22,000 - 23,500 - 25,000 - - - -
Spray rig - - - - - 38,000 - - - -
Rotary mower - - 50,000 - - - - - 55,000 -
Buffalo blower - 8,500 - - 8,500 - - - - -
Front mount mower - - - - - - 40,000 - - -
Concession vehicle - - - - 32,000 - - - - -
Lane ropes for pool - - 12,000 - - - - - - -
Ice machine - 8,000 - - 8,000 - - - 8,000 -
Pool vacuum - - 8,000 - - - - - - -
Aerifier - - 5,500 - - - - - - -
Total 64,500 76,500 75,500 107,500 62,500 118,000 83,000 75,000 63,000 28,500
123

Department FY 20 FY 21 FY 22 FY 23 FY 24 FY 25 FY 26 FY 27 FY 28 FY 29
Sports Tourism
Event Center
Carpet floor covering 39,000 - - - - - - - - -
Gator or UTV - - - - - - 13,000 - - -
Ride on floor sweeper - - 16,000 - - 18,000 - - - -
Projector - 8,000 - - - 10,000 - - - -
Ice machine - - - - - - - 10,000 - -
Multi-Use Fields
Zero turn mower 11,000 - - 11,500 - 12,000 - - 12,500 -
Gator or UTV 11,000 11,000 - 11,500 - - 12,000 - - -
Tractor with loader 40,000 - - - - - - 45,000 - -
Golf cart 5,000 - - 5,200 - - 5,400 - - -
Front mount mower - 15,000 - - - - - - - -
Laser line painter - - - 14,000 - - - - - -
Chemical storage building - 8,000 - - - - - - - -
Spreader - 5,000 - - - - - - - -
Full size truck - - 30,000 - - 40,000 - - - -
Total 106,000 47,000 46,000 42,200 - 80,000 30,400 55,000 12,500 -
Horticulture
Truck - - - - - 35,000 - - - -
Total - - - - - 35,000 - - - -
Marketing
Vehicle - - - 18,000 - - - - - -
Total - - - 18,000 - - - - - -
Senior Center
None - - - - - - - - - -
Total - - - - - - - - - -
Beautification
None - - - - - - - - - -
Total - - - - - - - - - -
124

Department FY 20 FY 21 FY 22 FY 23 FY 24 FY 25 FY 26 FY 27 FY 28 FY 29
Nature Parks
Playground structure 10,000 - - - 15,000 - - - - -
4x4 Truck 27,000 - - - 30,000 - - - - -
Dump trailer 10,000 - - - - - - - - -
Wagon for hay rides - - - 16,000 - 16,000 - - - -
Small trailer/excavator - - - 28,000 - - - - - -
15' Bushhog - - 20,000 - - - - - - -
ATV - - - 12,000 - 11,000 - - - -
Tractor - - - 65,000 - - - - - -
Zero turn mower - - 15,000 - 15,000 - - - - -
Front mount mower - - - - - - 38,000 - - -
Utility trailer - 10,000 - - - - - - - -
Total 47,000 10,000 35,000 121,000 60,000 27,000 38,000 - - -
Total General Fund 2,397,802 1,430,363 1,599,691 1,568,797 1,396,666 1,281,356 1,446,256 1,173,356 1,023,856 1,254,856
125

Department FY 20 FY 21 FY 22 FY 23 FY 24 FY 25 FY 26 FY 27 FY 28 FY 29
Fire Ad Valorem Fund
Light refurbish rescue truck 20,000 - - - - - - - - -
CAFS unit for rescue truck 10,000 - - - - - - - - -
Equipment for new pumper 15,481 - - - - - - - - -
Custom fire pumper 484,999 - 570,000 - - 600,000 - - 620,000 -
Thermal imager - - 10,000 - - - - - - -
Refurbish/Rechasis brush truck - 60,000 - - - - - - - -
4x4 pick up - 40,000 - 45,000 - - 50,000 - - 52,000
SUV command vehicle - - - - 50,000 - - - - -
Total 530,480 100,000 580,000 45,000 50,000 600,000 50,000 - 620,000 52,000
Library Fund
None - - - - - - - - - -
Total - - - - - - - - - -
Recreation Activities Fund
None - - - - - - - - - -
Total - - - - - - - - - -
Gas Tax Fund
None - - - - - - - - - -
Total - - - - - - - - - -
Court Corrections Fund
None - - - - - - - - - -
Total - - - - - - - - - -
Jail Corrections Fund
Jail van & equipment 50,000 - - - - - - - - -
RNS control board 85,000 - - - - - - - - -
Total 135,000 - - - - - - - - -
FST Event Center Operations
None - - - - - - - - - -
Total - - - - - - - - - -
FST Multi-Use Fields Operations
None - - - - - - - - - -
Total - - - - - - - - - -
126

Five year Capital Projects Plan
Prior Projected close Planned Planned Planned Planned Planned
Department Project year cost FY 2019 FY 2020 FY 2021 FY 2022 FY 2023 FY 2024
Engineering Resurfacing - 893,168 1,000,000 1,000,000 1,000,000 1,000,000 1,000,000
Engineering Repave/Widen FBE - - - - 3,500,000 - -
Engineering Grant - repave FBE - - - - (2,800,000) - -
Engineering Drainage repairs-Waterford & Willow Oaks - 47,823 - - - - -
Engineering Paving assessment - 51,500 - - - - -
Engineering Heritage Park sidewalk improvements 1,442 17,148 - - - - -
Engineering Street capital improvements - - 25,000 25,000 25,000 25,000 25,000
Engineering Woodbridge drainage improvements 4,800 5,861 - - - - -
Engineering Chestnut St pipe improvements - 12,500 - - - - -
Engineering Azalea Ave drainage improvements - 7,500 - - - - -
Engineering Fern Ave Extension (ATRIP Project) 1,672,904 2,000,000 1,097,717 - - - -
Engineering Grant - ATRIP - Fern Ave (885,107) (1,600,000) (878,174) - - - -
Engineering Tanger outlet pond expansion 3,700 46,875 - - - - -
Engineering East Pride Blvd access projects 90,233 - - 75,000 - - -
Engineering Foley Beach Express-US 98 Turnlanes 4,032 81,794 - - - - -
Engineering 9th Ave Extension - Cedar to Hickory 89,750 885,068 - - - - -
Engineering Contributions - BOE - 9th Ave - (36,082) - - - - -
Engineering South Pine St Drainage Improvements 214,580 343,591 - - - - -
Engineering Contributions - Developer - S. Pine St (102,423) (176,094) - - - - -
Engineering Hamburg building preservation 22,019 3,609 25,000 - - - -
Engineering HSIP-Traffic safety-Pride Drive 6,000 2,000 500,000 - - - -
Engineering Grant-HSIP-Traffic safety-Pride Drive - - (450,000) - - - -
Engineering Woerner access road 193,449 455,769 - - - - -
Engineering Post Office roof replacement 1,182 67,680 - - - - -
Engineering Tanger Ave extension - 450,000 - - - - -
Engineering Contribution-Tanger Ave extension-State - (250,000) - - - - -
Engineering Contribution-Tanger Ave extension-Developer - (200,000) - - - - -
Engineering HSIP-Traffic safety-CR12 & FBE - 47,306 400,000 - - - -
Engineering Grant-HSIP-Traffic safety-CR12 & FBE - (10,530) (293,814) - - - -
Engineering Juniper St South extension - 155,225 1,219,775 500,000 - - -
Engineering Pine St/US 98 Corner improvements - 35,300 - - - - -
Engineering Miflin Road Projects - 37,902 - - - - -
Engineering Hwy 59-Traffic Signal System Improvement - 260,000 - - - - -
Engineering Grant-Hwy 59-Traffic Signal System Improvement - (260,000) - - - - -
Engineering Heritage Park gazebo step redesign - 30,000 - - - - -
Engineering Tiger grant overrun - 72,363 - - - - -
Engineering Juniper/US 98 Intersection improvement - - 15,000 - - - -
Engineering Foley Beach Express intersection improvements - - 600,000 300,000 - - -
127
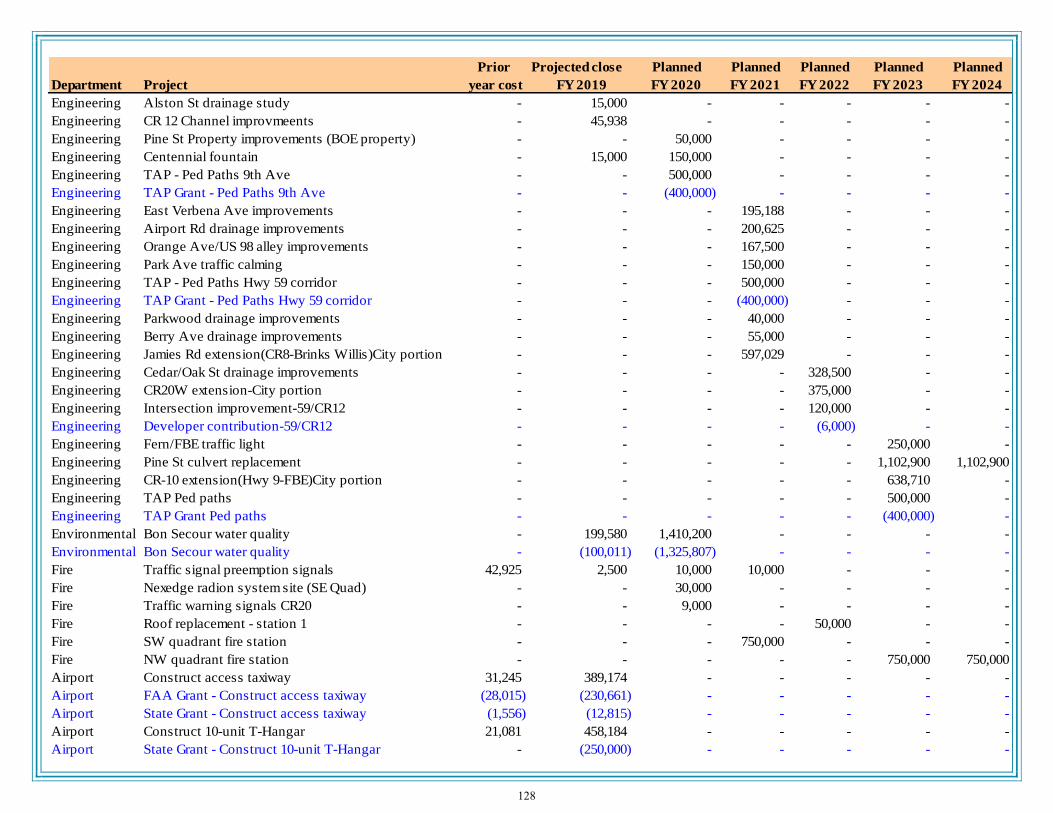
Prior Projected close Planned Planned Planned Planned Planned
Department Project year cost FY 2019 FY 2020 FY 2021 FY 2022 FY 2023 FY 2024
Engineering Alston St drainage study - 15,000 - - - - -
Engineering CR 12 Channel improvmeents - 45,938 - - - - -
Engineering Pine St Property improvements (BOE property) - - 50,000 - - - -
Engineering Centennial fountain - 15,000 150,000 - - - -
Engineering TAP - Ped Paths 9th Ave - - 500,000 - - - -
Engineering TAP Grant - Ped Paths 9th Ave - - (400,000) - - - -
Engineering East Verbena Ave improvements - - - 195,188 - - -
Engineering Airport Rd drainage improvements - - - 200,625 - - -
Engineering Orange Ave/US 98 alley improvements - - - 167,500 - - -
Engineering Park Ave traffic calming - - - 150,000 - - -
Engineering TAP - Ped Paths Hwy 59 corridor - - - 500,000 - - -
Engineering TAP Grant - Ped Paths Hwy 59 corridor - - - (400,000) - - -
Engineering Parkwood drainage improvements - - - 40,000 - - -
Engineering Berry Ave drainage improvements - - - 55,000 - - -
Engineering Jamies Rd extension(CR8-Brinks Willis)City portion - - - 597,029 - - -
Engineering Cedar/Oak St drainage improvements - - - - 328,500 - -
Engineering CR20W extension-City portion - - - - 375,000 - -
Engineering Intersection improvement-59/CR12 - - - - 120,000 - -
Engineering Developer contribution-59/CR12 - - - - (6,000) - -
Engineering Fern/FBE traffic light - - - - - 250,000 -
Engineering Pine St culvert replacement - - - - - 1,102,900 1,102,900
Engineering CR-10 extension(Hwy 9-FBE)City portion - - - - - 638,710 -
Engineering TAP Ped paths - - - - - 500,000 -
Engineering TAP Grant Ped paths - - - - - (400,000) -
Environmental Bon Secour water quality - 199,580 1,410,200 - - - -
Environmental Bon Secour water quality - (100,011) (1,325,807) - - - -
Fire Traffic signal preemption signals 42,925 2,500 10,000 10,000 - - -
Fire Nexedge radion system site (SE Quad) - - 30,000 - - - -
Fire Traffic warning signals CR20 - - 9,000 - - - -
Fire Roof replacement - station 1 - - - - 50,000 - -
Fire SW quadrant fire station - - - 750,000 - - -
Fire NW quadrant fire station - - - - - 750,000 750,000
Airport Construct access taxiway 31,245 389,174 - - - - -
Airport FAA Grant - Construct access taxiway (28,015) (230,661) - - - - -
Airport State Grant - Construct access taxiway (1,556) (12,815) - - - - -
Airport Construct 10-unit T-Hangar 21,081 458,184 - - - - -
Airport State Grant - Construct 10-unit T-Hangar - (250,000) - - - - -
128
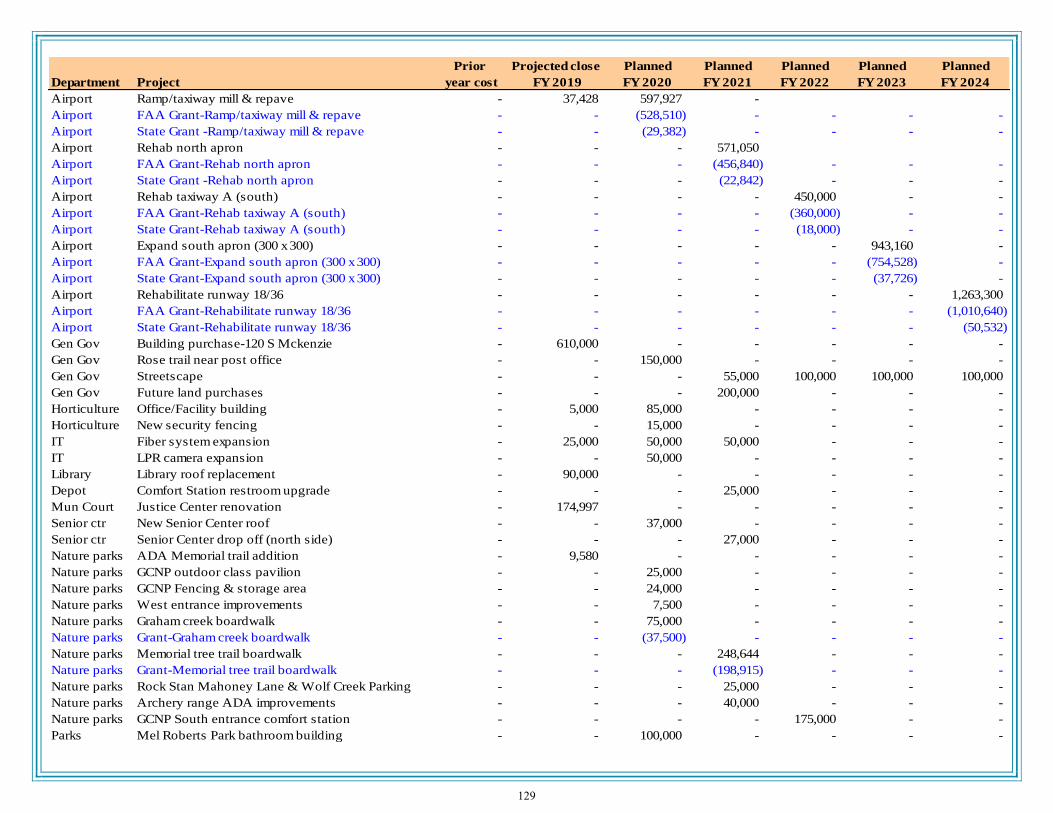
Prior Projected close Planned Planned Planned Planned Planned
Department Project year cost FY 2019 FY 2020 FY 2021 FY 2022 FY 2023 FY 2024
Airport Ramp/taxiway mill & repave - 37,428 597,927 -
Airport FAA Grant-Ramp/taxiway mill & repave - - (528,510) - - - -
Airport State Grant -Ramp/taxiway mill & repave - - (29,382) - - - -
Airport Rehab north apron - - - 571,050
Airport FAA Grant-Rehab north apron - - - (456,840) - - -
Airport State Grant -Rehab north apron - - - (22,842) - - -
Airport Rehab taxiway A (south) - - - - 450,000 - -
Airport FAA Grant-Rehab taxiway A (south) - - - - (360,000) - -
Airport State Grant-Rehab taxiway A (south) - - - - (18,000) - -
Airport Expand south apron (300 x 300) - - - - - 943,160 -
Airport FAA Grant-Expand south apron (300 x 300) - - - - - (754,528) -
Airport State Grant-Expand south apron (300 x 300) - - - - - (37,726) -
Airport Rehabilitate runway 18/36 - - - - - - 1,263,300
Airport FAA Grant-Rehabilitate runway 18/36 - - - - - - (1,010,640)
Airport State Grant-Rehabilitate runway 18/36 - - - - - - (50,532)
Gen Gov Building purchase-120 S Mckenzie - 610,000 - - - - -
Gen Gov Rose trail near post office - - 150,000 - - - -
Gen Gov Streetscape - - - 55,000 100,000 100,000 100,000
Gen Gov Future land purchases - - - 200,000 - - -
Horticulture Office/Facility building - 5,000 85,000 - - - -
Horticulture New security fencing - - 15,000 - - - -
IT Fiber system expansion - 25,000 50,000 50,000 - - -
IT LPR camera expansion - - 50,000 - - - -
Library Library roof replacement - 90,000 - - - - -
Depot Comfort Station restroom upgrade - - - 25,000 - - -
Mun Court Justice Center renovation - 174,997 - - - - -
Senior ctr New Senior Center roof - - 37,000 - - - -
Senior ctr Senior Center drop off (north side) - - - 27,000 - - -
Nature parks ADA Memorial trail addition - 9,580 - - - - -
Nature parks GCNP outdoor class pavilion - - 25,000 - - - -
Nature parks GCNP Fencing & storage area - - 24,000 - - - -
Nature parks West entrance improvements - - 7,500 - - - -
Nature parks Graham creek boardwalk - - 75,000 - - - -
Nature parks Grant-Graham creek boardwalk - - (37,500) - - - -
Nature parks Memorial tree trail boardwalk - - - 248,644 - - -
Nature parks Grant-Memorial tree trail boardwalk - - - (198,915) - - -
Nature parks Rock Stan Mahoney Lane & Wolf Creek Parking - - - 25,000 - - -
Nature parks Archery range ADA improvements - - - 40,000 - - -
Nature parks GCNP South entrance comfort station - - - - 175,000 - -
Parks Mel Roberts Park bathroom building - - 100,000 - - - -
129
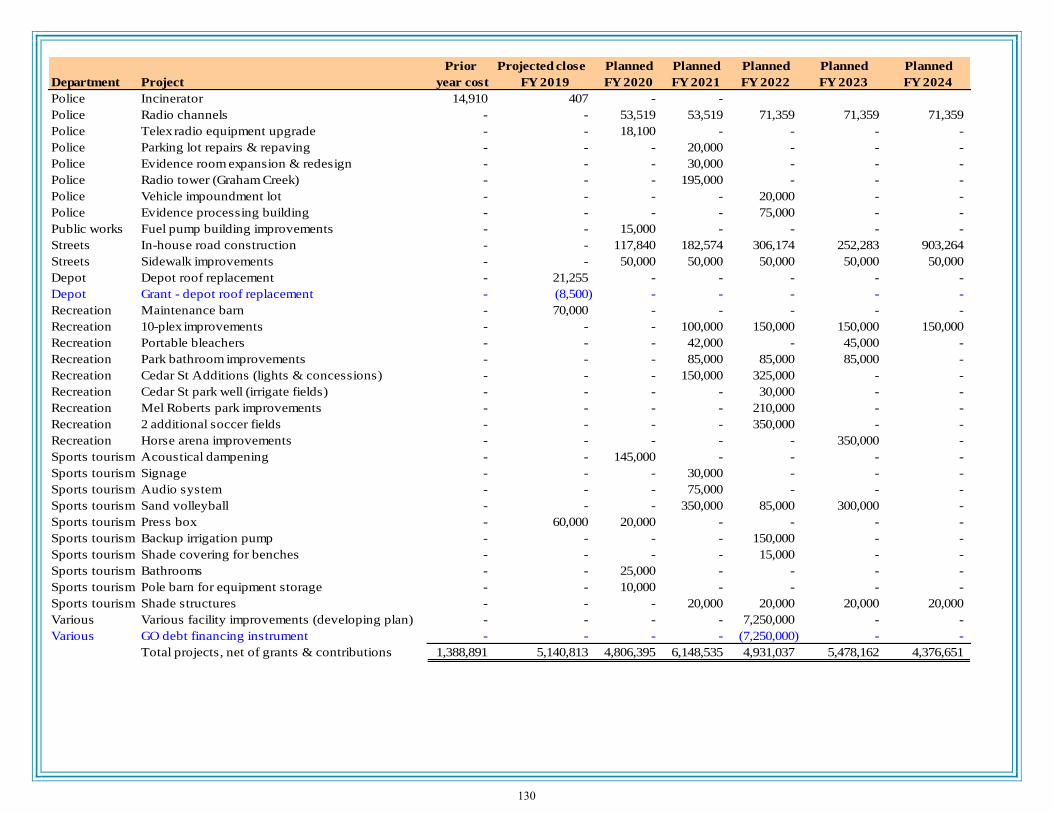
Prior Projected close Planned Planned Planned Planned Planned
Department Project year cost FY 2019 FY 2020 FY 2021 FY 2022 FY 2023 FY 2024
Police Incinerator 14,910 407 - -
Police Radio channels - - 53,519 53,519 71,359 71,359 71,359
Police Telex radio equipment upgrade - - 18,100 - - - -
Police Parking lot repairs & repaving - - - 20,000 - - -
Police Evidence room expansion & redesign - - - 30,000 - - -
Police Radio tower (Graham Creek) - - - 195,000 - - -
Police Vehicle impoundment lot - - - - 20,000 - -
Police Evidence processing building - - - - 75,000 - -
Public works Fuel pump building improvements - - 15,000 - - - -
Streets In-house road construction - - 117,840 182,574 306,174 252,283 903,264
Streets Sidewalk improvements - - 50,000 50,000 50,000 50,000 50,000
Depot Depot roof replacement - 21,255 - - - - -
Depot Grant - depot roof replacement - (8,500) - - - - -
Recreation Maintenance barn - 70,000 - - - - -
Recreation 10-plex improvements - - - 100,000 150,000 150,000 150,000
Recreation Portable bleachers - - - 42,000 - 45,000 -
Recreation Park bathroom improvements - - - 85,000 85,000 85,000 -
Recreation Cedar St Additions (lights & concessions) - - - 150,000 325,000 - -
Recreation Cedar St park well (irrigate fields) - - - - 30,000 - -
Recreation Mel Roberts park improvements - - - - 210,000 - -
Recreation 2 additional soccer fields - - - - 350,000 - -
Recreation Horse arena improvements - - - - - 350,000 -
Sports tourism Acoustical dampening - - 145,000 - - - -
Sports tourism Signage - - - 30,000 - - -
Sports tourism Audio system - - - 75,000 - - -
Sports tourism Sand volleyball - - - 350,000 85,000 300,000 -
Sports tourism Press box - 60,000 20,000 - - - -
Sports tourism Backup irrigation pump - - - - 150,000 - -
Sports tourism Shade covering for benches - - - - 15,000 - -
Sports tourism Bathrooms - - 25,000 - - - -
Sports tourism Pole barn for equipment storage - - 10,000 - - - -
Sports tourism Shade structures - - - 20,000 20,000 20,000 20,000
Various Various facility improvements (developing plan) - - - - 7,250,000 - -
Various GO debt financing instrument - - - - (7,250,000) - -
Total projects, net of grants & contributions 1,388,891 5,140,813 4,806,395 6,148,535 4,931,037 5,478,162 4,376,651
130
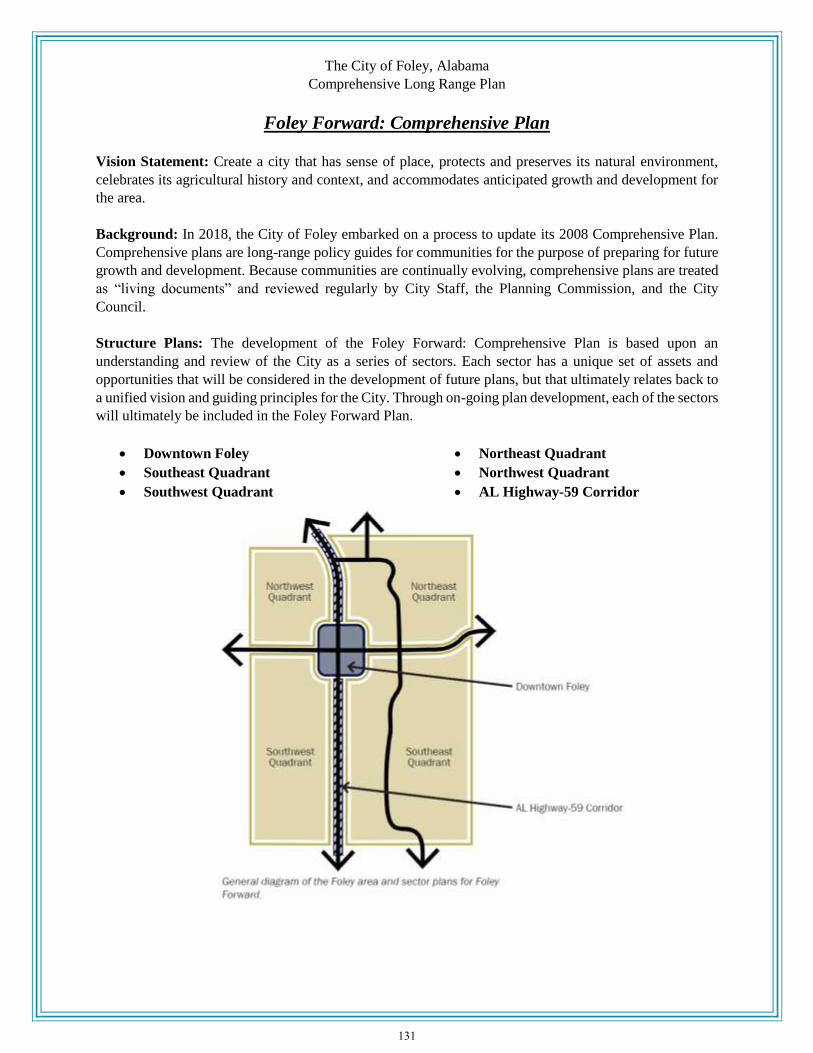
The City of Foley, Alabama
Comprehensive Long Range Plan
Foley Forward: Comprehensive Plan
Vision Statement: Create a city that has sense of place, protects and preserves its natural environment,
celebrates its agricultural history and context, and accommodates anticipated growth and development for
the area.
Background: In 2018, the City of Foley embarked on a process to update its 2008 Comprehensive Plan.
Comprehensive plans are long-range policy guides for communities for the purpose of preparing for future
growth and development. Because communities are continually evolving, comprehensive plans are treated
as “living documents” and reviewed regularly by City Staff, the Planning Commission, and the City
Council.
Structure Plans: The development of the Foley Forward: Comprehensive Plan is based upon an
understanding and review of the City as a series of sectors. Each sector has a unique set of assets and
opportunities that will be considered in the development of future plans, but that ultimately relates back to
a unified vision and guiding principles for the City. Through on-going plan development, each of the sectors
will ultimately be included in the Foley Forward Plan.
Downtown Foley
Southeast Quadrant
Southwest Quadrant
Northeast Quadrant
Northwest Quadrant
AL Highway-59 Corridor
131

Vision and Guiding Principles: Foley Forward strives to advance the vision that was set forth by the citizens of
the community through careful reflection of the Guiding Principles and consideration of the goals, policies, and
projects.
Enhance Sense of Place – The plan in every way protects, promotes, and ensures the unique sense of place
that defines and reflects Foley including its landscape, its built environment, its history, and its culture.
Raise Development Standards – The plan “raises the bar” with regard to development standards to guide
future developments and redevelopments including residential and mixed use.
Preserve Environmental Features – The plan protects the environment and capitalizes on the City’s
natural features, including development of greenways, parks and open space, tree canopy, and landscape
standards for all future development and redevelopment within the City of Foley.
Promote Responsible Regionalism – The plan defines and recommends actions to facilitate the City’s
desire to serve as principal partner in support of regional growth and development. Context sensitive
development, historical preservation, nature-based tourism, community public health, industrial
recruitment, and support for the school system are key issues with regional impacts that should be supported
throughout the plan.
Enhance Local Infrastructure – The plan encourages the development of community and public
infrastructure that addresses current issues and forecasted future needs. Through local and regional
partnerships, infrastructure providers should be aware of the growth and development of the region so
facilities can accommodate future growth.
Downtown Foley Plan
Summary: In the past few years, Downtown Foley has seen a resurgence of activity with the opening of new
businesses, restaurants and community activities. To support and foster continued activity, a downtown plan was
developed through public outreach and discussions with the Downtown Plan Advisory Committee. A series of goals
were developed based on input from the community and the advisory committee. These goals strive to reinforce the
vision and guiding principles of Foley in a manner that supports and fosters the vibrancy of downtown.
Goals:
D.1: Promote Downtown Through its Unique Sense of Place
D.2: Increase Different Types of Residential Living Opportunities Downtown
D.3: Create Opportunities Downtown for Mixed-Use Infill Development
D.4: Create a More User – Friendly Way of Navigating Downtown
D.5: Enhance Pedestrian and Bicycle Activity Downtown
D.6: Enhance and Expand Important Community Facilities
D.7: Use Creative Green Infrastructure Downtown to Improve Storm Water Conditions
Downtown Action Plan: Policies and projects included within the Action Plan are integrated into the on-going
budgeting and capital planning of the City to ensure a commitment to implementation. Each year, the Action Plan
is reviewed and updated to remain consistent with the needs of Downtown. A copy of the Action Plan can be found
on page 136.
132
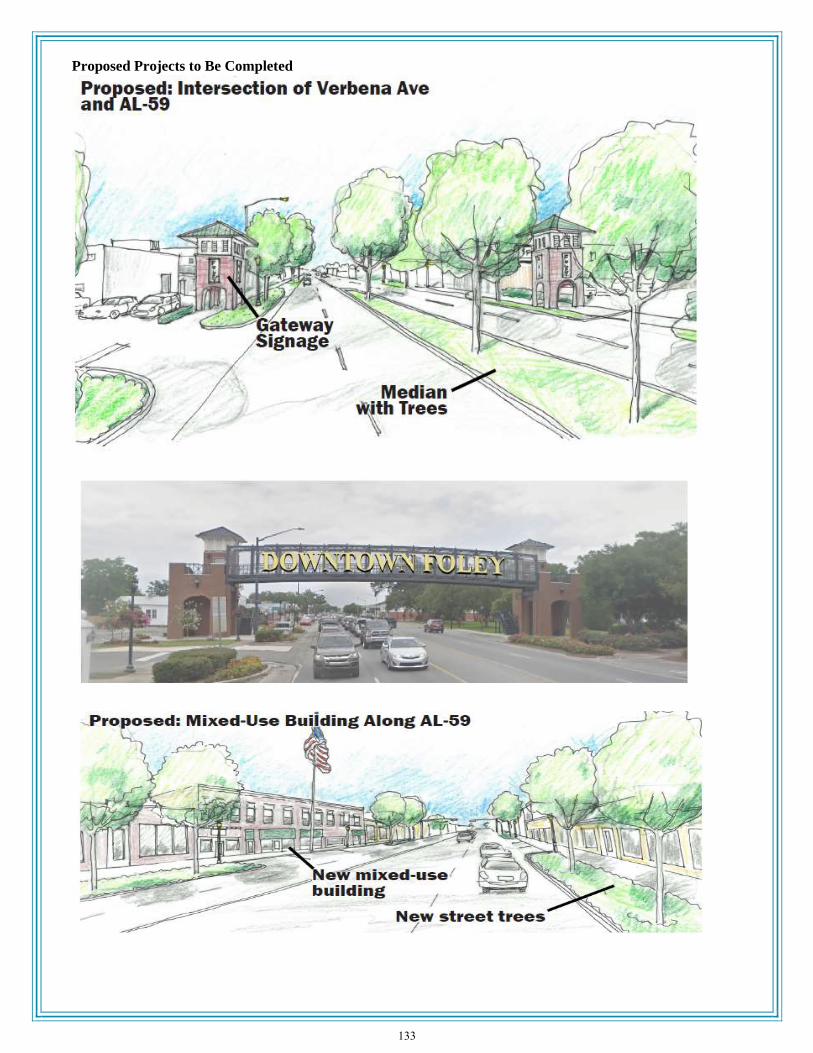
Proposed Projects to Be Completed
133

Southeast Quadrant Plan
Summary: The Southeast Quadrant of Foley is one of the most dynamic areas of the City considering the amount
of growth and activity which has taken place over the past ten years. This growth has been manifested through the
development of several large neighborhoods, creation of Graham Creek Nature Preserve, and the development of
OWA. Transportation and connectivity across the Southeast Quadrant has been the most significant issue.
134

Transportation was the highest identified priority and strategic improvements to east and west connectivity in
transportation system will greatly improve conditions.
Future Land Use Goals: Defining future land use has the largest impact on the built environment. Land use consists
of the human made spaces in which citizens live, work, and play on a day-to-day basis.
SE.LU.1 – Buildings and sites designed to enhance and contribute to surroundings and neighborhoods.
SE.LU.2 – Well-designed infill development in strategic locations.
SE.LU.3 – A built environment that focuses more on people to create more activity in given area.
SE.LU.4 – More mixed use with less separation of uses – create more activity in given areas.
SE.LU.5 – Better suburban development – minimize additional sprawl to maximize growth in existing areas
through infill.
SE.LU.6 – More connections among developed areas and neighborhoods.
Transportation Goals: Improvements to the transportation system focus on increasing and diversifying
connections across the quadrant as well as increasing the capacity when warranted. Land use and transportation are
intrinsically linked which results in transportation influencing future land use decisions.
SE.T.1 – Improve the safety and efficiency of all modes of transportation.
SE.T.2 – Develop transportation alternatives to motorized vehicles.
SE.T.3 – Increase connectivity across the quadrant with strategic improvements to the street network.
Community Facilities and Services: There are significant community-wide assets which are provided to all the
citizens of Foley and are accessible to the greater region. Improvements and investments in these assets should
consider the local and regional impacts.
SE.CFS.1 – Provide diverse recreational opportunities for residents in the quadrant.
SE.CFS.2 – Provide upgrades to existing recreational facilities to continue to maintain high standards.
SE.CFS.3 – Promote and enhance medical facilities within the community.
SE.CFS.4 – Facilitate regular coordination with public and private utility providers to ensure facilities are
prepared for future growth.
SE.CFS.5 – Improve stormwater management in the quadrant to mitigate local flooding and protect
surrounding water and wetlands.
Southeast Quadrant Action Plan: Projects included within the Action Plan are integrated into the on-going
budgeting and capital planning of the City to ensure a commitment to implementation. Each year, the Action Plan
is reviewed and updated to remain consistent with the needs of the Southeast Quadrant. A copy of the Action Plan
can be found on page 137.
Remaining Sectors
The remaining sectors will be updated when allowable.
Conclusion
The information in this document is a summation of the full plan that was adopted by Council. As with any long
range plan, continuous review of Foley Forward is essential to responsible implementation of the plan over time.
Each geographic sector within Foley Forward contains an action plan for on-going plan implementation. As each
sector is updated, these action plans will reflect the implementation of goals, policies, and projects developed during
the process. The projects included in the action plans are integrated into the on-going budgeting and capital planning
of the City to ensure a commitment to implementation.
135
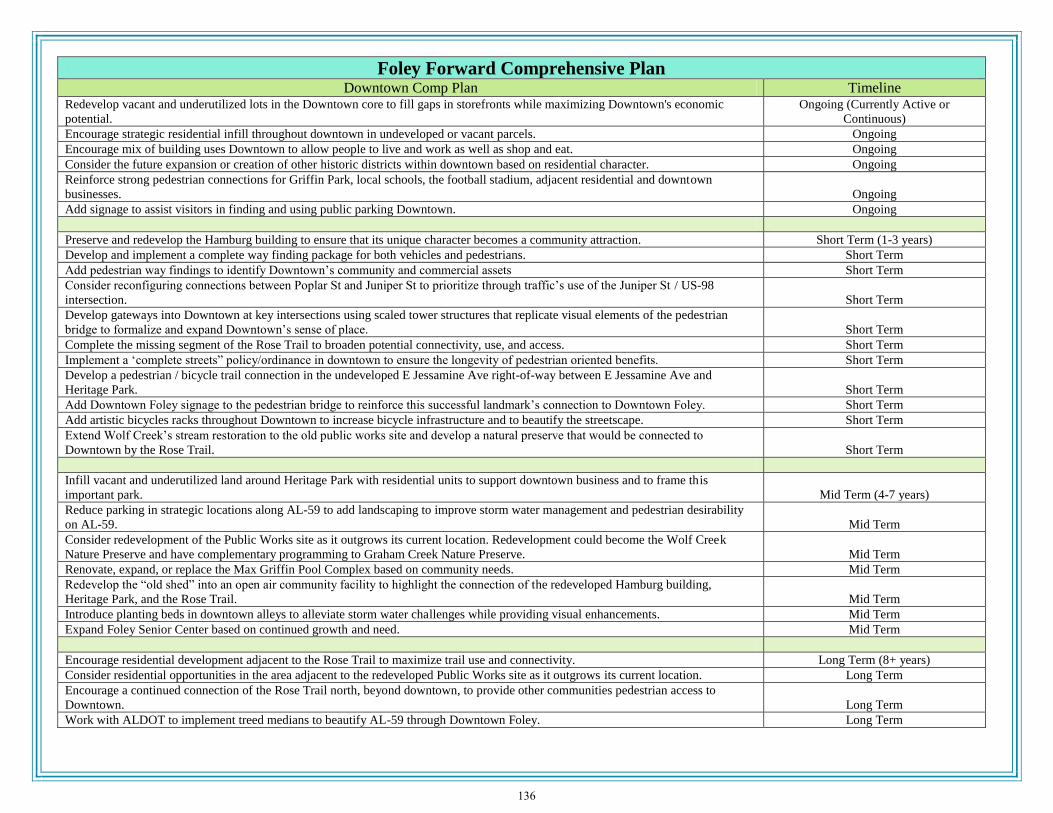
Foley Forward Comprehensive Plan Downtown Comp Plan Timeline
Redevelop vacant and underutilized lots in the Downtown core to fill gaps in storefronts while maximizing Downtown's economic
potential.
Ongoing (Currently Active or
Continuous)
Encourage strategic residential infill throughout downtown in undeveloped or vacant parcels. Ongoing
Encourage mix of building uses Downtown to allow people to live and work as well as shop and eat. Ongoing
Consider the future expansion or creation of other historic districts within downtown based on residential character. Ongoing
Reinforce strong pedestrian connections for Griffin Park, local schools, the football stadium, adjacent residential and downtown
businesses. Ongoing
Add signage to assist visitors in finding and using public parking Downtown. Ongoing
Preserve and redevelop the Hamburg building to ensure that its unique character becomes a community attraction. Short Term (1-3 years)
Develop and implement a complete way finding package for both vehicles and pedestrians. Short Term
Add pedestrian way findings to identify Downtown’s community and commercial assets Short Term
Consider reconfiguring connections between Poplar St and Juniper St to prioritize through traffic’s use of the Juniper St / US-98
intersection. Short Term
Develop gateways into Downtown at key intersections using scaled tower structures that replicate visual elements of the pedestrian
bridge to formalize and expand Downtown’s sense of place. Short Term
Complete the missing segment of the Rose Trail to broaden potential connectivity, use, and access. Short Term
Implement a ‘complete streets” policy/ordinance in downtown to ensure the longevity of pedestrian oriented benefits. Short Term
Develop a pedestrian / bicycle trail connection in the undeveloped E Jessamine Ave right-of-way between E Jessamine Ave and
Heritage Park. Short Term
Add Downtown Foley signage to the pedestrian bridge to reinforce this successful landmark’s connection to Downtown Foley. Short Term
Add artistic bicycles racks throughout Downtown to increase bicycle infrastructure and to beautify the streetscape. Short Term
Extend Wolf Creek’s stream restoration to the old public works site and develop a natural preserve that would be connected to
Downtown by the Rose Trail. Short Term
Infill vacant and underutilized land around Heritage Park with residential units to support downtown business and to frame this
important park. Mid Term (4-7 years)
Reduce parking in strategic locations along AL-59 to add landscaping to improve storm water management and pedestrian desirability
on AL-59. Mid Term
Consider redevelopment of the Public Works site as it outgrows its current location. Redevelopment could become the Wolf Creek
Nature Preserve and have complementary programming to Graham Creek Nature Preserve. Mid Term
Renovate, expand, or replace the Max Griffin Pool Complex based on community needs. Mid Term
Redevelop the “old shed” into an open air community facility to highlight the connection of the redeveloped Hamburg building,
Heritage Park, and the Rose Trail. Mid Term
Introduce planting beds in downtown alleys to alleviate storm water challenges while providing visual enhancements. Mid Term
Expand Foley Senior Center based on continued growth and need. Mid Term
Encourage residential development adjacent to the Rose Trail to maximize trail use and connectivity. Long Term (8+ years)
Consider residential opportunities in the area adjacent to the redeveloped Public Works site as it outgrows its current location. Long Term
Encourage a continued connection of the Rose Trail north, beyond downtown, to provide other communities pedestrian access to
Downtown. Long Term
Work with ALDOT to implement treed medians to beautify AL-59 through Downtown Foley. Long Term
136
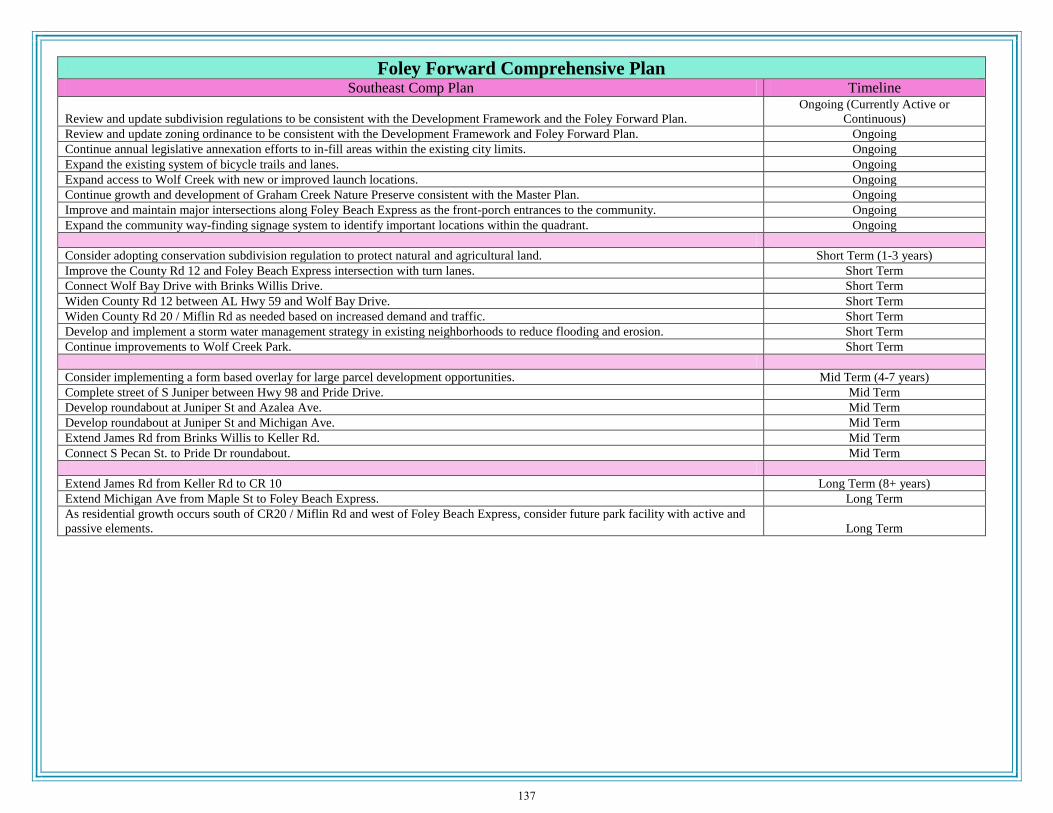
Foley Forward Comprehensive Plan Southeast Comp Plan Timeline
Review and update subdivision regulations to be consistent with the Development Framework and the Foley Forward Plan.
Ongoing (Currently Active or
Continuous)
Review and update zoning ordinance to be consistent with the Development Framework and Foley Forward Plan. Ongoing
Continue annual legislative annexation efforts to in-fill areas within the existing city limits. Ongoing
Expand the existing system of bicycle trails and lanes. Ongoing
Expand access to Wolf Creek with new or improved launch locations. Ongoing
Continue growth and development of Graham Creek Nature Preserve consistent with the Master Plan. Ongoing
Improve and maintain major intersections along Foley Beach Express as the front-porch entrances to the community. Ongoing
Expand the community way-finding signage system to identify important locations within the quadrant. Ongoing
Consider adopting conservation subdivision regulation to protect natural and agricultural land. Short Term (1-3 years)
Improve the County Rd 12 and Foley Beach Express intersection with turn lanes. Short Term
Connect Wolf Bay Drive with Brinks Willis Drive. Short Term
Widen County Rd 12 between AL Hwy 59 and Wolf Bay Drive. Short Term
Widen County Rd 20 / Miflin Rd as needed based on increased demand and traffic. Short Term
Develop and implement a storm water management strategy in existing neighborhoods to reduce flooding and erosion. Short Term
Continue improvements to Wolf Creek Park. Short Term
Consider implementing a form based overlay for large parcel development opportunities. Mid Term (4-7 years)
Complete street of S Juniper between Hwy 98 and Pride Drive. Mid Term
Develop roundabout at Juniper St and Azalea Ave. Mid Term
Develop roundabout at Juniper St and Michigan Ave. Mid Term
Extend James Rd from Brinks Willis to Keller Rd. Mid Term
Connect S Pecan St. to Pride Dr roundabout. Mid Term
Extend James Rd from Keller Rd to CR 10 Long Term (8+ years)
Extend Michigan Ave from Maple St to Foley Beach Express. Long Term
As residential growth occurs south of CR20 / Miflin Rd and west of Foley Beach Express, consider future park facility with active and
passive elements. Long Term
137
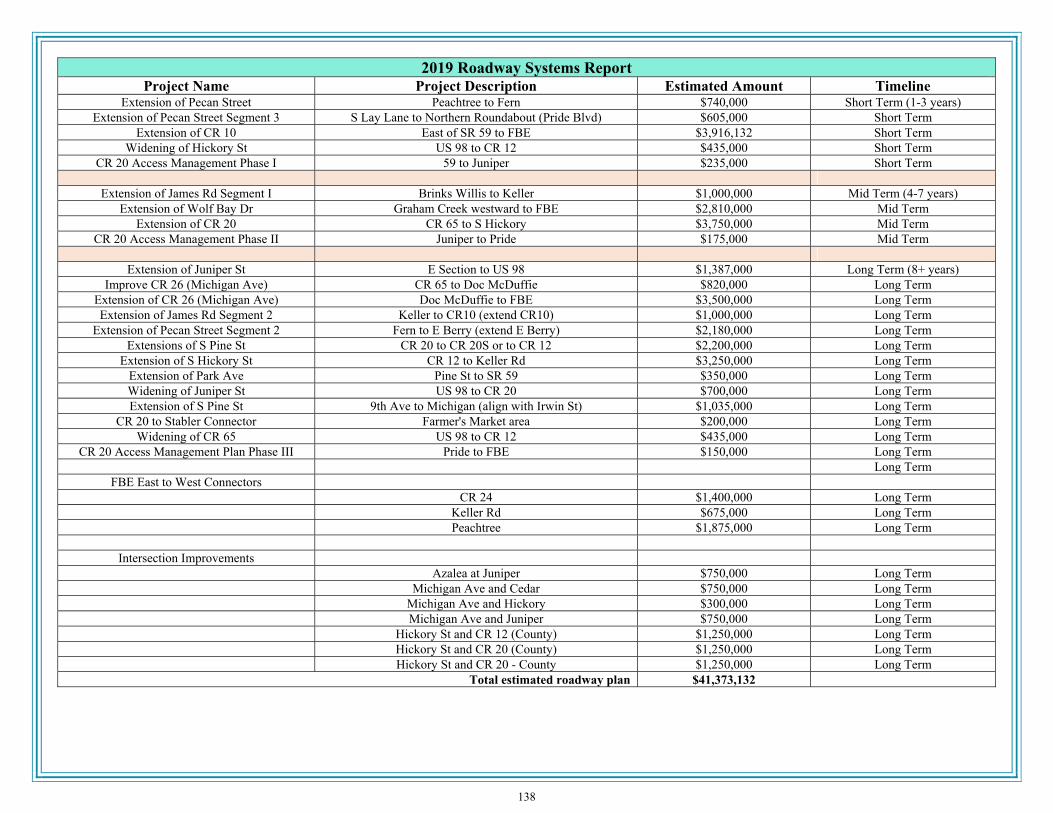
2019 Roadway Systems Report Project Name Project Description Estimated Amount Timeline
Extension of Pecan Street Peachtree to Fern $740,000 Short Term (1-3 years) Extension of Pecan Street Segment 3 S Lay Lane to Northern Roundabout (Pride Blvd) $605,000 Short Term
Extension of CR 10 East of SR 59 to FBE $3,916,132 Short Term Widening of Hickory St US 98 to CR 12 $435,000 Short Term
CR 20 Access Management Phase I 59 to Juniper $235,000 Short Term
Extension of James Rd Segment I Brinks Willis to Keller $1,000,000 Mid Term (4-7 years) Extension of Wolf Bay Dr Graham Creek westward to FBE $2,810,000 Mid Term
Extension of CR 20 CR 65 to S Hickory $3,750,000 Mid Term CR 20 Access Management Phase II Juniper to Pride $175,000 Mid Term
Extension of Juniper St E Section to US 98 $1,387,000 Long Term (8+ years)
Improve CR 26 (Michigan Ave) CR 65 to Doc McDuffie $820,000 Long Term Extension of CR 26 (Michigan Ave) Doc McDuffie to FBE $3,500,000 Long Term Extension of James Rd Segment 2 Keller to CR10 (extend CR10) $1,000,000 Long Term
Extension of Pecan Street Segment 2 Fern to E Berry (extend E Berry) $2,180,000 Long Term Extensions of S Pine St CR 20 to CR 20S or to CR 12 $2,200,000 Long Term
Extension of S Hickory St CR 12 to Keller Rd $3,250,000 Long Term Extension of Park Ave Pine St to SR 59 $350,000 Long Term Widening of Juniper St US 98 to CR 20 $700,000 Long Term Extension of S Pine St 9th Ave to Michigan (align with Irwin St) $1,035,000 Long Term
CR 20 to Stabler Connector Farmer's Market area $200,000 Long Term Widening of CR 65 US 98 to CR 12 $435,000 Long Term
CR 20 Access Management Plan Phase III Pride to FBE $150,000 Long Term Long Term
FBE East to West Connectors CR 24 $1,400,000 Long Term Keller Rd $675,000 Long Term Peachtree $1,875,000 Long Term
Intersection Improvements Azalea at Juniper $750,000 Long Term Michigan Ave and Cedar $750,000 Long Term Michigan Ave and Hickory $300,000 Long Term Michigan Ave and Juniper $750,000 Long Term Hickory St and CR 12 (County) $1,250,000 Long Term Hickory St and CR 20 (County) $1,250,000 Long Term Hickory St and CR 20 - County $1,250,000 Long Term
Total estimated roadway plan $41,373,132
138

Debt
139
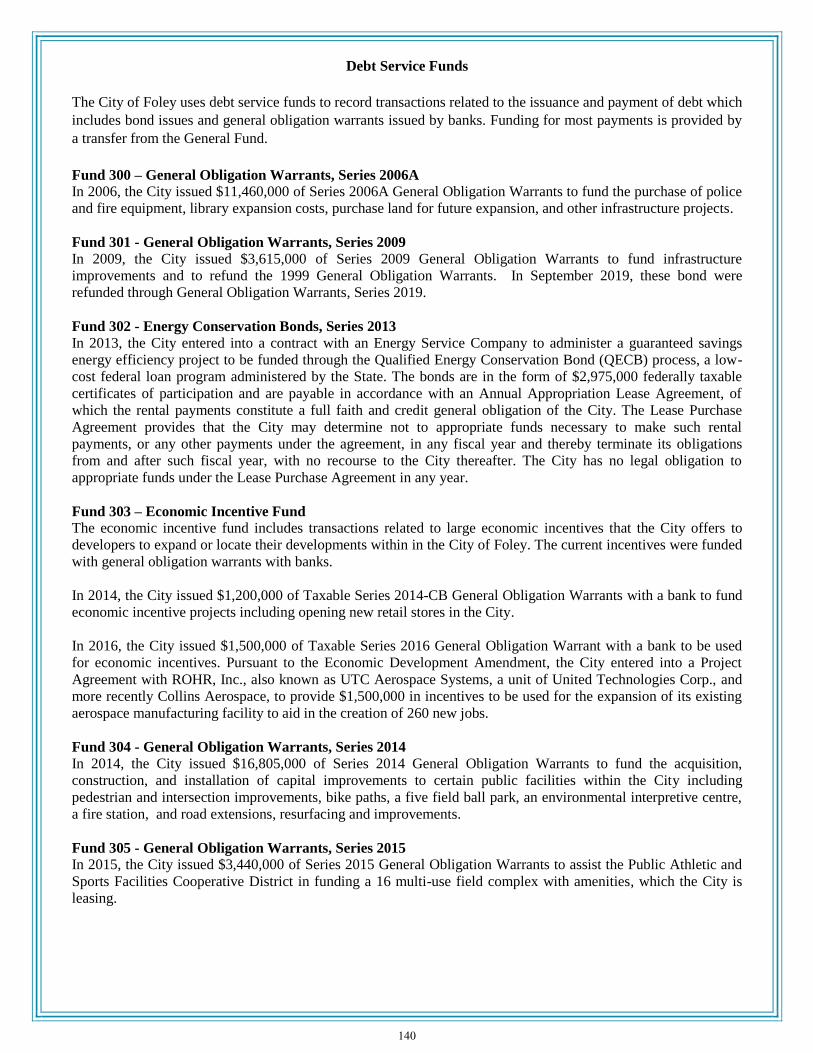
Debt Service Funds
The City of Foley uses debt service funds to record transactions related to the issuance and payment of debt which
includes bond issues and general obligation warrants issued by banks. Funding for most payments is provided by
a transfer from the General Fund.
Fund 300 – General Obligation Warrants, Series 2006A
In 2006, the City issued $11,460,000 of Series 2006A General Obligation Warrants to fund the purchase of police
and fire equipment, library expansion costs, purchase land for future expansion, and other infrastructure projects.
Fund 301 - General Obligation Warrants, Series 2009 In 2009, the City issued $3,615,000 of Series 2009 General Obligation Warrants to fund infrastructure
improvements and to refund the 1999 General Obligation Warrants. In September 2019, these bond were
refunded through General Obligation Warrants, Series 2019.
Fund 302 - Energy Conservation Bonds, Series 2013
In 2013, the City entered into a contract with an Energy Service Company to administer a guaranteed savings
energy efficiency project to be funded through the Qualified Energy Conservation Bond (QECB) process, a low-
cost federal loan program administered by the State. The bonds are in the form of $2,975,000 federally taxable
certificates of participation and are payable in accordance with an Annual Appropriation Lease Agreement, of
which the rental payments constitute a full faith and credit general obligation of the City. The Lease Purchase
Agreement provides that the City may determine not to appropriate funds necessary to make such rental
payments, or any other payments under the agreement, in any fiscal year and thereby terminate its obligations
from and after such fiscal year, with no recourse to the City thereafter. The City has no legal obligation to
appropriate funds under the Lease Purchase Agreement in any year.
Fund 303 – Economic Incentive Fund
The economic incentive fund includes transactions related to large economic incentives that the City offers to
developers to expand or locate their developments within in the City of Foley. The current incentives were funded
with general obligation warrants with banks.
In 2014, the City issued $1,200,000 of Taxable Series 2014-CB General Obligation Warrants with a bank to fund
economic incentive projects including opening new retail stores in the City.
In 2016, the City issued $1,500,000 of Taxable Series 2016 General Obligation Warrant with a bank to be used
for economic incentives. Pursuant to the Economic Development Amendment, the City entered into a Project
Agreement with ROHR, Inc., also known as UTC Aerospace Systems, a unit of United Technologies Corp., and
more recently Collins Aerospace, to provide $1,500,000 in incentives to be used for the expansion of its existing
aerospace manufacturing facility to aid in the creation of 260 new jobs.
Fund 304 - General Obligation Warrants, Series 2014 In 2014, the City issued $16,805,000 of Series 2014 General Obligation Warrants to fund the acquisition,
construction, and installation of capital improvements to certain public facilities within the City including
pedestrian and intersection improvements, bike paths, a five field ball park, an environmental interpretive centre,
a fire station, and road extensions, resurfacing and improvements.
Fund 305 - General Obligation Warrants, Series 2015 In 2015, the City issued $3,440,000 of Series 2015 General Obligation Warrants to assist the Public Athletic and
Sports Facilities Cooperative District in funding a 16 multi-use field complex with amenities, which the City is
leasing.
140

Fund 306 - General Obligation Warrants, Series 2019 In September 2019, the City issued approximately $6,000,000 of Series 2019 General Obligation Warrants to
refund the Series 2009 General Obligation Warrants and the remaining 2009 Revenue Bonds that were issued by
the Public Facilities Cooperative District of the City of Foley. Funding estimates are included in this budget based
on preliminary schedules that were provided by bond council.
Other Debt Obligations
The City also has the following debt obligations that are maintained in other funds that are not considered debt
service funds.
Energy Loan. In 2014, the City received an interest free loan of $350,000 through the low-cost energy loan
program from the Energy Division of the Alabama Department of Economic and Community Affairs (ADECA)
to fund energy efficiency improvement projects within the City. The loan is secured by the City’s irrevocable
letter of credit with an annual interest rate of 1.25 percent. In July 2019, the letter of credit matured and was
replaced with a letter of credit of $157,500 with a maturity date in June 2020. The principal payments for this debt
are recorded in the capital projects fund.
Note Payable. In 2017, the City entered into a note payable with Riviera Utilities for construction in-aid in the
amount of $300,000 to fund the cost of parking lot lights at the newly constructed events center. The principal and
interest payments for this debt are recorded in the General Fund, under the sports tourism department. The City
currently leases the facility from the District.
Capital Leases for Equipment. The City has multiple capital leases for office equipment. All transactions for
these leases are recorded in various departments of the General Fund.
Public Facilities Cooperative District Revenue Bonds, Series 2009. In 2009, the PFCD issued $23,335,000 in
Revenue Bonds. The Bonds are special obligations of the PFCD payable solely from revenues derived by the
PFCD from facilities financed by the proceeds of the Bonds (the "Project"), including without limitation payments
to be made under a Lease Agreement by the District to the City with respect to the Project. The Lease Agreement
provides that (i) for each year in which the Lease Agreement is in effect, the City shall pay rentals for the account
of the District at such times and in such amounts as shall be sufficient to pay the principal of and interest on the
Bonds when due and any amounts required to be paid into the reserve fund for the Bonds, (ii) the obligations of
the City under the Lease Agreement shall be general obligations of the City, and (iii) the City may terminate the
Lease Agreement as of September 30 of any year without penalty, and without acceleration or advancement of
maturity or due date of any principal of or interest on the Bonds or amount payable under the Lease Agreement,
and without recourse against the City for the payment of any amount which would otherwise become due under
the Lease Agreement in any year subsequent to such termination of the Lease Agreement. The Bonds and the
obligations of the City under the Lease Agreement are not chargeable against the constitutional debt limit of the
City. In September 2019, these bond are being refunded through the Series 2019 General Obligation Warrants.
Public Facilities Cooperative District Revenue Bonds, Series 2016. On April 28, 2016, the PFCD issued
$9,165,000 of Series 2016 Revenue Bonds with interest rates ranging from 1 percent to 4 percent in order to
advance refund $8,830,000 of outstanding Series 2009 Revenue Bonds with rates ranging from 4 percent to 5
percent.
Public Athletic and Sports Facilities Cooperative District, Revenue Bonds, Series 2015. In 2015, the PASFCD
issued $13,000,000 in Revenue Bonds. The Bonds are limited obligations of the PASFCD payable solely from
and secured by a pledge of (i) the moneys payable by the City of Foley, Alabama (the "City") pursuant to the
Funding Agreement, dated as of May 1, 2015, by the City, the District and the Trustee; (ii) certain revenues
derived by the District for such purpose from the Project; and (iii) moneys on deposit in the funds created under
the Indenture. The Funding Agreement is a full faith and credit general obligation of the City and will provide for
payments by the City on dates and in amounts sufficient to provide for the payment of the debt service on the
bonds when due for payment.
141

Public Cultural and Entertainment Facilities Cooperative District, Revenue Bonds Series 2015. In December
2015, the PCEFCD issued $15,285,000 in Revenue Bonds. The Bonds are limited obligations of the PCEFCD
payable solely from and secured by a pledge of (i) the moneys payable by the City of Foley, Alabama (the "City")
pursuant to the Funding Agreement, dated as of December 1, 2015, by the City, the District and the Trustee; (ii)
certain revenues derived by the PCEFCD for such purpose from the Project; and (iii) moneys on deposit in the
funds created under the Indenture. The Funding Agreement is a full faith and credit general obligation of the City
and will provide for payments by the City on dates and in amounts sufficient to provide for the payment of the
debt service on the bonds when due for payment.
Coastal Alabama Farmers’ and Fishermen’s Market, Inc., Qualified Low Income Business Loan. In 2014, the
City and its blended component units the PFCD and the newly formed CAFFM engaged in various transactions to
ultimately secure proceeds from four 1.045% interest rate loans totaling $8,000,000 for CAFFM, which qualifies
as a qualified active low-income community business (QALICB) under provisions of the Federal New Markets
Tax Credit Program. The 1.045% loans are payable by CAFFM to Pacesetter CDE X, LLC (Pacesetter) and
collateralized by the assets of the fund.
The PFCD participated in the transaction by serving as the leverage lender by making a $5,950,400 loan at a rate
of 1.0 percent to the Chase NMTC CAFFM Investment Fund, LLC (Investment Fund). The Investment Fund also
received an equity contribution of $2,589,600 from Chase Community Equity, LLC (CCE-LLC) an outside “tax
credit investor” owning 100% of the Investment Fund. After paying a sub-allocation fee of $540,000, the
Investment Fund, which owns 99.99% of Pacesetter, made Qualifying Equity Investments totaling $8,000,000 to
Pacesetter, to fund Pacesetter’s four loans to CAFFM.
CAFFM will make quarterly “interest only” payments for seven years (through June 1, 2021) after which time
quarterly principal and interest payments will be due until final maturity in 2043. The payments by CAFFM to
Pacesetter will be distributed to the Investment Fund to pay debt service on the leverage loan to the PFCD.
In connection with the PFCD leverage loan, the PFCD entered into an “Investment Fund Put/Call Agreement”
with CCE-LLC which allows CCE-LLC to “put” its 100% ownership interest in the Investment Fund to PFCD at
the end of the seven-year tax compliance period in 2021 for a purchase price of $1,000, plus any transfer or
closing costs. In the event the put is not exercised, PFCD can exercise a “call” option to purchase the interest, as
valued by an independent appraiser.
The General Fund also has notes receivable totaling $5,570,579 from the PFCD in connection with the transaction
related to properties transferred to the PFCD.
Notes Receivable and Payable at September 30, 2018 were as follows:
Notes Receivable Balance Maturity Date Interest Rate
General Fund $5,570,579 2043 1.3443%
PFCD $5,950,400 2043 1.0000%
Notes Payable Balance Maturity Date Interest Rate
PFCD $5,570,579 2043 1.3444%
CAFFM–Four loans $8,000,000 2043 1.0450%
Coastal Alabama Farmers' and Fishermen's Market, Inc., Closed Line of Credit Agreement and Promissory
Note. In 2016, CAFFM entered into a $1,400,000 Closed Line of Credit Agreement and Promissory Note with
United Bank with such funds being available for draw through January 2017, at an interest rate of 2.94 percent per
annum. Beginning February 1, 2017, and continuing for 180 months through January 31, 2032, the outstanding
principal balance is subject to a fixed rate of interest of 3.60 percent. Principal and interest payments began
February 2017, however, CAFFM may prepay the principal at any time without penalty. The transaction is
backed by the City of Foley's execution and delivery of a Funding Agreement or Pledge Agreement with respect
to the unconditional obligation of the City to repay the debt in the event of nonpayment by CAFFM.
142

Debt Limit
Under Section 225 of the Constitution of Alabama of 1901, as amended, the present general constitutional debt
limit of the City is an amount equal to 20 percent of the assessed value of the taxable property. However, the
following, among other types of indebtedness, are not chargeable against general constitutional debt limit under
existing law: 1) obligations issued for the purpose of acquiring, providing or constructing schools, water works, or
sewers; 2) obligations incurred for street or sidewalk improvements where all or a portion of the costs are to be
assessed against property abutting such improvements; 3) under certain conditions, tax anticipation notes; 4)
certain lease obligations subject to termination at the end of each fiscal year, without recourse; 5) certain
obligations to make contributions towards the debt service of other public entities; 6) and revenue securities
issued for the purpose of extending, enlarging or improving water, electric, gas or sewer systems and payable
solely from the revenues of one or more of such systems. Amendment No. 772 authorizes the City to use public
funds for certain purposes intended to further economic development and exempts such debt from the twenty
percent debt limit. Below is a five year chart of the general constitutional debt margin and net debt as a percentage
of the debt limit:
2015 2016 2017 2018 2019
Assessed Value, including vehicles, net of
exemptions 272,892,340$ 334,750,604$ 298,516,052$ 312,818,636$ 316,402,320$
Debt limit (20% of assessed value) 54,578,468 66,950,121 59,703,210 62,563,727 63,280,464
Debt applicable to limit:
Outstanding debt of the primary government 70,900,451 85,529,047 82,782,512 78,353,184 72,231,670
Less: Exempt special lease obligations (21,112,047) (21,069,879) (19,903,231) (18,711,584) (12,061,584)
Less: Exempt debt pursuant to Section 772 (20,716,884) (28,931,090) (28,604,075) (28,272,060) (27,957,060)
Less: Amount set aside for repayment of debt (1,007,405) (956,344) (962,730) (970,857) (690,875)
Total net debt applicable to limit 28,064,115 34,571,734 33,312,476 30,398,683 31,522,151
Legal Debt Margin 26,514,353$ 32,378,387$ 26,390,734$ 32,165,044$ 31,758,313$
Net debt as a percentage of debt limit 51.42% 51.64% 55.80% 48.59% 49.81%
General Constitutional Debt Margin
Although no new debt was issued in 2019, refunding of the remaining PFCD 2009 Revenue Bonds by the City’s 2019
General Obligation Warrants moved approximately $5.4M from Special Constitutional Debt to General Constitutional Debt.
Amendment No. 772 of the Constitution of Alabama authorizes the counties and municipalities within the State to
use public funds for certain purposes intended to further economic development. Bonds, warrants, notes and
other indebtedness issued pursuant to Amendment No. 772 are (a) not subject to and exempt from the 20 percent
general constitutional debt limit for government purposes, and (b) are subject to and chargeable against 50 percent
of the assessed value of taxable property. Below is a five year chart of the special constitutional debt margin and
net debt as a percentage of the debt limit:
2015 2016 2017 2018 2019
Assessed Value, including vehicles, net of
exemptions 272,892,340$ 334,750,604$ 298,516,052$ 312,818,636$ 316,402,320$
Debt limit (50% of assessed value) 136,446,170 167,375,302 149,258,026 156,409,318 158,201,160
Debt applicable to limit:
Plus: PASFCD 12,716,884 12,726,427 12,735,971 12,745,515 12,745,515
Plus: PCEFCD - 16,204,663 15,868,104 15,526,545 15,211,545
Plus: CAFFM 8,000,000 8,000,000 9,260,601 9,193,323 9,049,352
Less: Amount set aside for repayment of debt (1,987,698) (591,201) (591,767) (592,883) (592,586)
Total net debt applicable to limit 18,729,186 36,339,889 37,272,909 36,872,500 36,413,826
Legal Debt Margin for Fiscal Year 117,716,984$ 131,035,413$ 111,985,117$ 119,536,818$ 121,787,334$
Net debt as a percentage of debt limit 13.73% 21.71% 24.97% 23.57% 23.02%
Special Constitutional Debt Margin
143

Fiscal year 2020 debt service expenditures constitute 8.45% of total Governmental expenditures, which includes
capital leases in the General Fund and transfers to debt service funds. At this time the City is focused on paying
down current debt obligations and has no plans to issue new debt in the near future. The table below shows debt
service payments for upcoming years:
Principal Interest Total
9/30/2020 3,692,862 2,389,333 6,082,195
9/30/2021 3,822,064 2,250,232 6,072,296
9/30/2022 2,650,880 2,090,145 4,741,025
9/30/2023 2,700,000 1,967,613 4,667,613
9/30/2024 2,828,750 1,593,128 4,421,878
2025 to 2029 15,740,000 7,580,469 23,320,469
2030 to 2034 11,520,000 4,561,684 16,081,684
2035 to 2039 8,130,000 3,071,450 11,201,450
2040 to 2044 7,860,000 1,177,826 9,037,826
2045 to 2049 1,785,000 80,146 1,865,146
60,729,556$ 26,762,026$ 87,491,582$
Principal Interest Total
9/30/2020 73,279 122,614 195,893
9/30/2021 154,925 119,932 274,857
9/30/2022 396,396 115,079 511,475
9/30/2023 402,881 108,864 511,745
9/30/2024 409,239 102,496 511,735
2025 to 2029 2,146,781 411,953 2,558,734
2030 to 2034 2,021,517 243,676 2,265,193
2035 to 2039 1,859,203 138,069 1,997,272
2040 to 2044 1,658,410 39,267 1,697,677
2045 to 2049 - - -
9,122,631$ 1,401,950$ 10,524,581$
Total 69,852,187$ 28,163,976$ 98,016,163$
Governmental Activities
Business - Type Activities
Debt Service Payments by Year
144

Statistics
145
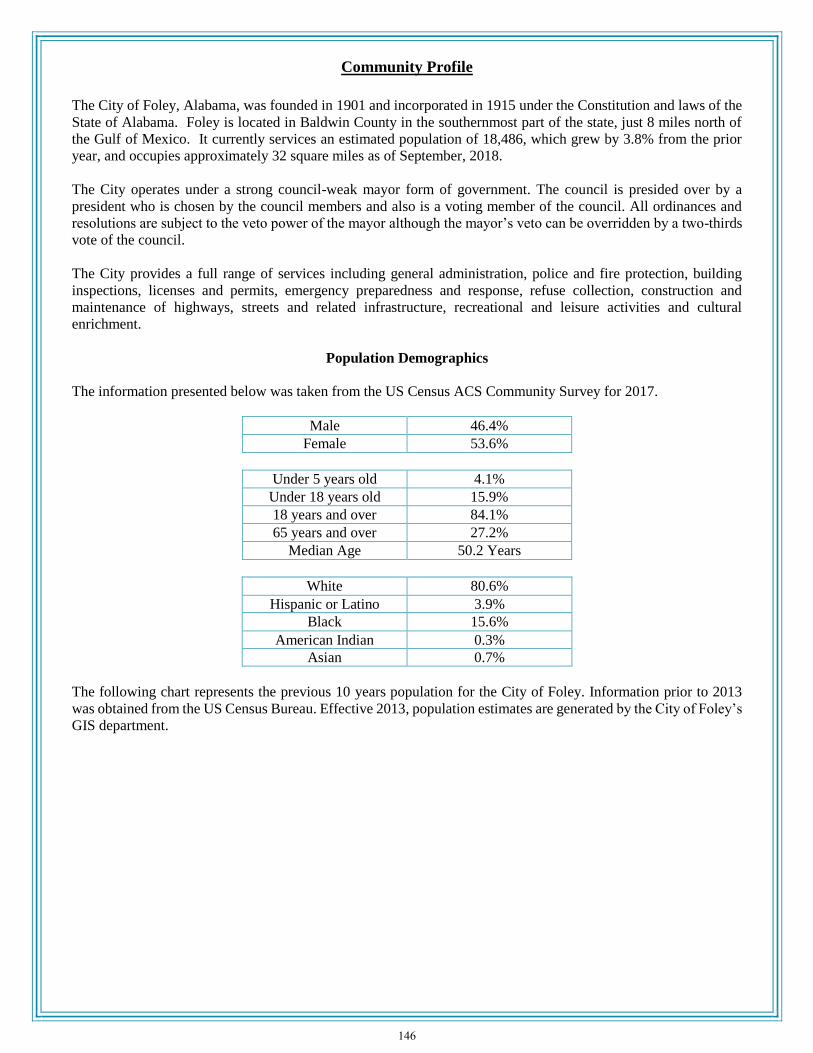
Community Profile
The City of Foley, Alabama, was founded in 1901 and incorporated in 1915 under the Constitution and laws of the
State of Alabama. Foley is located in Baldwin County in the southernmost part of the state, just 8 miles north of
the Gulf of Mexico. It currently services an estimated population of 18,486, which grew by 3.8% from the prior
year, and occupies approximately 32 square miles as of September, 2018.
The City operates under a strong council-weak mayor form of government. The council is presided over by a
president who is chosen by the council members and also is a voting member of the council. All ordinances and
resolutions are subject to the veto power of the mayor although the mayor’s veto can be overridden by a two-thirds
vote of the council.
The City provides a full range of services including general administration, police and fire protection, building
inspections, licenses and permits, emergency preparedness and response, refuse collection, construction and
maintenance of highways, streets and related infrastructure, recreational and leisure activities and cultural
enrichment.
Population Demographics
The information presented below was taken from the US Census ACS Community Survey for 2017.
Male 46.4%
Female 53.6%
Under 5 years old 4.1%
Under 18 years old 15.9%
18 years and over 84.1%
65 years and over 27.2%
Median Age 50.2 Years
White 80.6%
Hispanic or Latino 3.9%
Black 15.6%
American Indian 0.3%
Asian 0.7%
The following chart represents the previous 10 years population for the City of Foley. Information prior to 2013
was obtained from the US Census Bureau. Effective 2013, population estimates are generated by the City of Foley’s
GIS department.
146
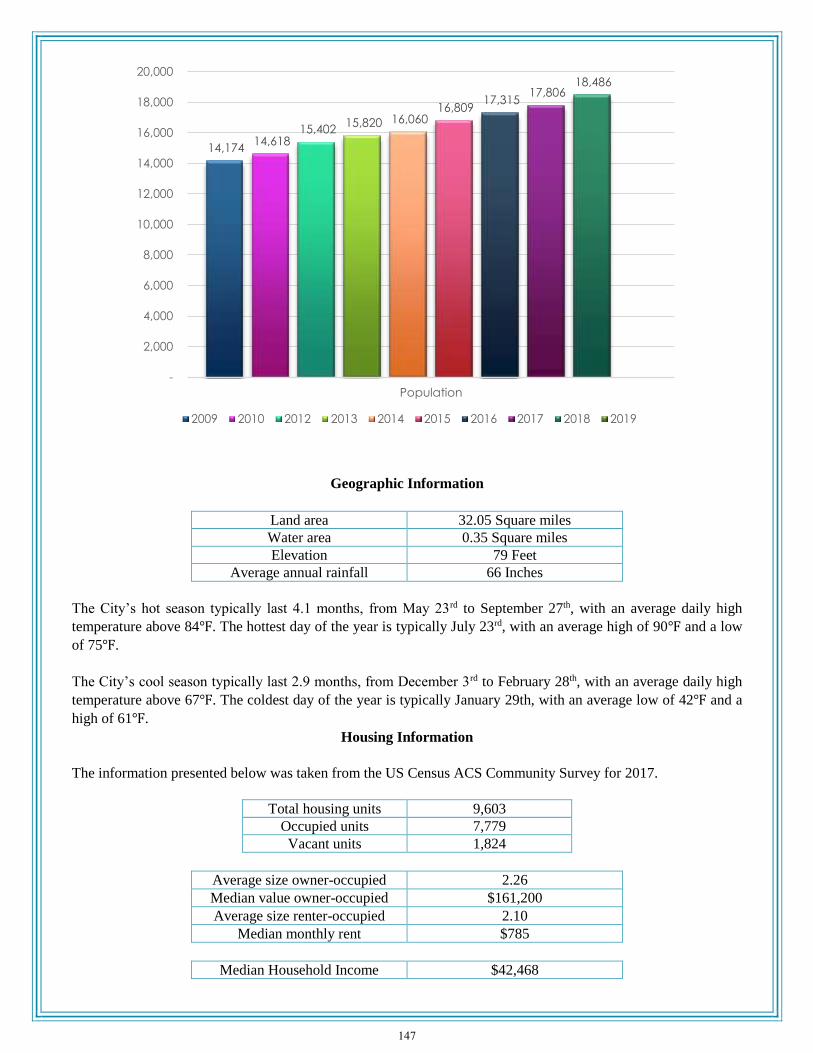
Geographic Information
Land area 32.05 Square miles
Water area 0.35 Square miles
Elevation 79 Feet
Average annual rainfall 66 Inches
The City’s hot season typically last 4.1 months, from May 23rd to September 27th, with an average daily high
temperature above 84℉. The hottest day of the year is typically July 23rd, with an average high of 90℉ and a low
of 75℉.
The City’s cool season typically last 2.9 months, from December 3rd to February 28th, with an average daily high
temperature above 67℉. The coldest day of the year is typically January 29th, with an average low of 42℉ and a
high of 61℉.
Housing Information
The information presented below was taken from the US Census ACS Community Survey for 2017.
Total housing units 9,603
Occupied units 7,779
Vacant units 1,824
Average size owner-occupied 2.26
Median value owner-occupied $161,200
Average size renter-occupied 2.10
Median monthly rent $785
Median Household Income $42,468
14,174 14,618
15,402 15,820 16,060
16,809 17,315
17,806 18,486
-
2,000
4,000
6,000
8,000
10,000
12,000
14,000
16,000
18,000
20,000
Population
2009 2010 2012 2013 2014 2015 2016 2017 2018 2019
147

Economic Indicators
Unemployment
Foley Baldwin County Alabama U.S. Nation Average
2.5% 2.5% 3.1% 4.0% Figures above come from Alabama Department of Labor for July 2019.
Foley Top 10 Ad Valorem Tax Payers
Payer City Tax Assessed Value
Coroc/Riviera LLC 80,578.60 16,115,720
Aerostructures – Rohr 29,399.50 5,879,900
Gulf Telephone Company 17,801.40 3,560,580
The Reserve of Foley LLC 14,020.50 2,804,100
Foley Square LLC 12,888.50 2,577,700
CHS Properties Inc. 12,795.00 2,560,660
Wal-Mart Real Estate Business Trust 11,818.70 2,363,740
Park Place (Foley) Owners LLC 11,157.40 2,231,480
Baldwin Co Electric Membership 10,774.10 2,154,820
Sovran Acquisition Ltd Partnership 10,704.60 2,140,920
Totals 211,938.30 42,389,620
Figures above come from 2019 abstract provided by the Baldwin County Revenue Commissioner.
The top 10 Ad Valorem Tax Payers represent 14.27% of the total Ad Valorem Revenue Budgeted in FY 20.
The City of Foley issued 3,390 business license in fiscal year 2018.
Assets by Department
The charts below show information about City assets for various departments. These assets are necessary to provide
City services.
City Buildings # Parks #
Airport 1 Aaronville Ball Park 1
City hall 1 Beulah Heights Park 1
Civic center 1 Evans Park (undeveloped) 1
Community development office 1 Florence B Mathis Park 1
Fire station 3 Foley Dog Park 1
Engineering office 1 Foley Kids Park 1
Greenhouse 1 Foley Skate Park 1
IT/recreation office 1 Foley Sports Tourism Complex 1
Jail 1 Graham Creek Nature Preserve 1
Library 1 Heritage Park 1
Maintenance shop 1 John B Foley Park 1
Municipal court 1 Max Griffin Park 1
Museum 1 Melvin Roberts Park 1
Parks office 1 Ralph Shumacher Soccer Park 1
Police station 1 Raymond C. Christensen Sportsplex 1
Public works office 1 Savannah Park (undeveloped) 1
Senior activity center 1 Wilbourne Antique Rose Trail 1
Welcome center 1 Wolf Creek Park 1
148

City owned leased/unoccupied buildings #
Barnes Building 1
Cactus Café 1
Hamburg Building 1
Peteet Building 1
Post Office 1
Snook Youth Club 1
Symbol Health 1
Information about highways and streets.
Miles of Street 154 # of Street Lights 2,884 Miles of Sidewalks 37
‘* - These estimates are as of September 2018.
149

Glossary
150

Glossary A
Ad Valorem Tax: Real estate and personal property taxes calculated “according to the value” of property. The taxes are based on the assessed valuation of real property, and in certain cases, the value of tangible personal property. ADECA: Alabama Department of Economic and Community Affairs. A state agency committed to building better Alabama communities. ADEM: Alabama Department of Environmental Management. A state agency that enforces environmental issues. Adopted Budget: Original budget approved by the governing body at the beginning of the fiscal year. ADLOT: Alabama Department of Transportation. A state agency that monitors and improves all forms of transportation. Amended Budget: The original budget plus any budget adjustments that have been approved by the appropriate parties. Annual Debt Service: The total amount required to be paid in the fiscal year for principal and interest on all outstanding debt. Appraised Value: The estimated value of real and personal property as determined by Baldwin County Revenue Commissioner and/or Baldwin County Probate Office. Appropriation: The legislative action authorizing the expenditure of a designated amount of public funds for a purpose specified by the governing body. ASA: Alabama Soccer Association, is a non-profit and educational organization whose mission is to foster the physical, mental, and emotional growth of players of all ages, by creating and increasing opportunities for wholesome participation. ASA has a current membership of over 27,000 registered players statewide, youth and adult, and approximately 2,000 active coaches, referees, and administrators Assessed Value: The dollar value placed on real and personal property to measure taxes. Assigned Fund Balance: Fund balance amounts that are constrained by the City’s expressed intent to use resources for specific purposes but do not meet the criteria to be classified as restricted or committed. The City Council has the authority to assign amounts intended to be used for specific purposes. B
Balanced Budget: A budget in which the general fund revenue and transfers in are greater than or equal to the total expenses plus transfers out, net of eligible restricted/assigned cash available for use. Bond: A written promise, generally under seal, to pay a specified amount of money, called the face value, at a fixed time in the future called the date of maturity, and carrying interest at a fixed or variable rate, usually payable periodically. Bond Rating: A rating (made by an established bond rating company) from a schedule of grades, indicating the probability of timely repayment of principal and interest on bonds issued.
151
Glossary
Budget: A financial plan for a defined period of time.
Budget Adjustment: The increase, decrease or transfer of appropriated funds, requiring approval from the appropriate parties. Budget Calendar: The schedule of key dates and milestones the City follows in the preparation and adoption of the budget. Budget Message: The written discussion included in the budget document that explains current budget issues. C
CAFFM: The Coastal Alabama Farmers’ & Fishermen’s Market Inc. is a proprietary fund of the City. It is a local farmers’ and fishermen’s market that was created as part of a new markets tax credit transaction. CAFR: Comprehensive Annual Financial Report. An annual report compiled which provides audited detailed information on the City’s financial status. Capital Assets: Tangible and intangible assets which are held and used for a period of five years and more. Classifications of capital assets are buildings, land, improvements, infrastructure, machinery & equipment, automobiles & equipment, office equipment and construction work in progress. Capital Expenditures: All charges incurred to acquire equipment, land, buildings, improvements of land or buildings, fixtures and other permanent improvements. Capital Improvement Plan: A plan for all capital projects to be incurred each year over a period of 5 years. Capital Projects Fund: A fund used to account for financial resources designated to construction or acquire capital assets and major capital improvements. Capital Purchase Plan: A financial plan maintained to schedule replacement cycle and addition of departments vehicles or equipment. Capital Purchase: Expenditure for the acquisition of a capital asset that does not require construction, such as a vehicle or equipment. CCE-LLC: Chase Community Equity, LLC, an outside tax credit investor involved in the new markets tax credit. CDBG: Community Development Block Grant is a flexible program that provides communities with resources to address unique community development needs. Committed Fund Balance: Fund balance amounts that can only be used for specific purposes determined by an Ordinance, the City’s highest level of decision-making authority (the City Council).
CWIP: Construction Work In Progress, is a class of capital asset which represents the cost of buildings, building improvements, infrastructure and equipment under construction. When completed the total cost is reported under the appropriate capital asset class.
152

Glossary D
Debt Limit: The maximum amount of debt that is legally permitted by a jurisdiction’s charter, constitution, or statues. Debt Service: The amount necessary to pay principal and interest requirements on outstanding debt for a given year or series of years.
Debt Service Funds: A Fund used to finance and account for the accumulation of resources for, and the payment of, general long-term debt principal and interest. E
Expenditures: A payment or disbursement, which results in a decrease in net financial resources. Examples includes operating expenses, asset purchases, capital project payments or debt service payments. Expenses: Outflows or obligations of assets from delivering or producing goods, delivering services or carrying out other activities that embody the entity’s ongoing operations. F
FEMA: The Federal Emergency Management Agency, is an agency of the United States Department of Homeland Security. The agency’s primary purpose is to coordinate the response to a disaster that has occurred in the United States and that overwhelms the resources of local and state authorities.
Fiscal Year: The twelve month period used for accounting and budgeting purposes. The City’s fiscal year runs from October 1 through September 30. FLSA: Fair Labor Standards Act is a federal law which establishes minimum wage, overtime pay eligibility, record keeping, and child labor standards affecting full-time and part-time workers in private sector and in federal, state, and local governments. Fund: An independent fiscal and accounting entity with a self-balanced set of accounts recording all financial resources and liabilities which are segregated for a specific purpose, activity or objective. Fund Balance: The difference between the City’s total assets and total liability. The City has 5 classifications of fund balance: Non-spendable, Restricted, Committed, Assigned, and Unassigned. G
GAAP: Generally Accepted Accounting Principles – authoritative standards and commonly accepted ways of recording and reporting accounting information. GASB: Governmental Accounting Standards Board – independent organization that establishes accounting and financial reporting standards for U.S. state and local governments that follow GAAP, General Fund: A fund used to account for financial resources and liabilities except those which are required to be accounted for in another fund.
153

Glossary
General Obligation Warrant: Bonds for which the full faith and credit of the issuing government are pledged for payment. GIS: Geographic Information System is a framework for gathering, managing and analyzing data. Rooted in the science of geography, GIS integrates many types of data and it analyzes spatial location and organizes layers of information into visualizations using maps and 3D scenes. Goal: A measurable statement of desired conditions to be maintained or achieved.
Governmental Fund: A fund category used to account for government’s governmental-type activities. This category includes four fund types: general fund, special revenue funds, debt service funds and capital project funds. Grant: A contribution of assets by one organization to another to support a particular function or purpose. H
I
Incode: Financial accounting software used by the City
Infrastructure: A long-lived asset that is normally stationary in nature. This classification typically has a longer useful life than most other classifications. Examples include roads, bridges, curbs, gutters, streets, sidewalks, and drainage systems. Interest Income: Revenue generated from investments. Interfund transfers: Flow of assets between funds of the primary government without the equivalent flow of assets in return and without a requirement for repayment. ISO: The Insurance Services Office, a subsidiary of Verisk Analytics, formed in 1971 as an advisory and rating organization for the property/casualty insurance industry to provide statistical and actuarial services, to develop insurance programs, and to assist insurance companies in meeting state regulatory requirements.
J
JAT: Job Assessment Tool used by the HR department during job analysis.
K
L
License & Permits: Fees collected for the issuance of license and permits such as business license and building permits.
M
Major Fund: Funds with revenues or expenditures (excluding other financing sources and uses) that are at least 10% of the total of all governmental funds.
154

Glossary Mills: Millage Rate - The ad valorem tax rate expressed in the amount levied per thousand dollars of the taxable assed value of property.
Modified Accrual Basis: A basis of accounting in which revenues are recorded when collected within the current period and soon enough thereafter to be used to pay liabilities of the current period and expenditures are recognized when the related liability is incurred. MS4: A municipal separate storm sewer system is a conveyance or system of conveyances that is owned by a state, city, town, village, or other public entity that discharges to waters of the U.S., designed or used to collect or convey storm water (e.g. storm drains, pipes, ditches), not a combined sewer, and not part of sewage treatment plant or publicly owned treatment works. MS4s are regulated through the NPDES permit program administered in Alabama by the Alabama Department of Environmental Management.
MUTCD: The Manual on Uniform Traffic Control Devices is a document issued by the Federal Highway Administration of the United States Department of Transportation to specify the standards by which traffic signs, road surface markings, and signals are designed, installed and used. These specifications includes shapes, colors and fonts used in road markings and signs.
N
NMTC: New Markets Tax Credit – A program established by congress in 2000 to provide investments in low-income communities. Non-Major Funds: Funds with revenues or expenditures (excluding other financing sources and uses) that are less than 10% of the total of all governmental funds. Non-Spendable Fund Balance: Amounts that cannot be spent either because they are not in a spendable form or because they are legally or contractually required to be maintained intact. NPDES: The National Pollutant Discharge Elimination System permit program, created in 1972 by the Clean Water Act, helps address water pollution by regulating point sources that discharge pollutants to waters of the U.S. The permit provides two levels of control: technology-based limits and water quality-based limits. It is administered in Alabama through the Alabama Department of Environmental Management. NSA: The National Softball Association is a sporting governing body that gives softball teams the opportunity to play in qualifying tournaments for State, National, Regional and World Series tournament play.
O
Operational Expenses: The cost associated with the non-capitalized materials and services required for daily operations of services, such as supplies, maintenance of equipment, professional fees, rental of equipment, and travel and training.
P
PASCD: Public Athletic & Sports Facilities Cooperative District of the City of Foley, a blended component unit of the City that is considered a special revenue fund within the City’s financial statements.
155

Glossary
PCEFCD: Public Cultural & Entertainment Facilities Cooperative District of the City of Foley, a blended component unit of the City that is considered a special revenue fund within the City’s financial statements.
Personnel Expense: The cost associated with salaries, wages and fringe benefits of the employees of the City.
PFCD: Public Facilities Cooperative District of the City of Foley, a blended component unit of the City that is considered a special revenue fund within the City’s financial statements.
Q
QALICB: Qualified low-income community business, is the property owner/developer involved in a New Markets Tax Credit. QECB: Qualified Energy Conservation Bonds are federally subsidized bonds available to states, local and tribal issuers. This financing is eligible for energy efficiency, renewable energy and mass commuting projects.
R
Restricted Fund Balance: Fund balance amounts that can only be spent for specific purposes because of the City’s charter, City code, state or federal laws, or externally imposed conditions by grantors or creditors.
Revenue: Income received which represents an increase to the City’s net financial resources.
Revenue Bond: A bond which is payable from a specific source of revenue and to which the full faith and credit of the issuer is not pledged. They are payable from identified sources of revenue, and do not permit the bondholders to compel the City to pay debt service from any other source. ROI: Return on Investment is a performance measure used to evaluate the efficiency of an investment.
S
Special Revenue Funds: A fund used to account for the proceeds of the specific revenue sources that are legally restricted to expenditures or specified purposes.
T
U
Unassigned Fund Balance: Fund balance that does not fall into any other category is considered unassigned. This fund balance may be used for any purpose. USSSA: The United State Specialty Sports Association is a volunteer, sports governing body and 501 (c)(3) nonprofit organization. USSSA governs 13 sports across the US, Puerto Rico, various US Military bases and Canada, and has a membership of over 3.7 million. UST: Underground Storage Tanks which store flammable hazardous materials such as diesel or gasoline. USTs are regulated through the NPDES program to require monitoring systems to prevent contamination of groundwater and soils.
156

Glossary V
W
Warrant: A certificate of debt issued by a government to finance a capital expenditure or other liability, in which payment of the original investment plus interest is guaranteed by a specified future date.
X
Y
Z
157