City of Elizabeth Water Department O&M by Liberty …nj.gov/dep/swap/reports/swar_2004001.pdf ·...
52
Source Water Assessment Report For City of Elizabeth Water Department O&M by Liberty Water Company James E. McGreevey, Governor State of New Jersey Bradley M. Campbell, Commissioner Department of Environmental Protection Ernest Hahn, Assistant Commissioner Land Use Management Michele Mateo Putnam, Administrator Water Supply Administration Barker Hamill, Bureau Chief Bureau of Safe Drinking Water 401 E. State Street PO Box 426 Trenton, New Jersey 08625-0426 (609) 292-5550 October 2004
Transcript of City of Elizabeth Water Department O&M by Liberty …nj.gov/dep/swap/reports/swar_2004001.pdf ·...
Source Water Assessment ReportFor
City of Elizabeth Water Department O&M byLiberty Water Company
James E. McGreevey, GovernorState of New Jersey
Bradley M. Campbell, CommissionerDepartment of Environmental Protection
Ernest Hahn, Assistant CommissionerLand Use Management
Michele Mateo Putnam, AdministratorWater Supply Administration
Barker Hamill, Bureau ChiefBureau of Safe Drinking Water
401 E. State StreetPO Box 426
Trenton, New Jersey 08625-0426(609) 292-5550
October 2004
I
HOW TO USE THIS SOURCE WATER ASSESSMENT REPORT
The following outlines the source water assessment report and directs you to general and/orwater system specific information.
Source Water Assessment Executive SummaryA summary of the Source Water Assessment Program and the susceptibility resultsstatewide. This summary also provides the susceptibility ratings for the water system’ssource(s).
The first three sections of the report contain general information; the remaining four sectionsare exclusive to the water system and its susceptibility results.
Section I: Background Information on Drinking Water Systems page 1General information on types of public drinking water systems (community andnoncommunity), entry point to the distribution system (EPTDS), and sources of drinkingwater. The number of public water systems, wells, and surface water intakes in New Jerseyis provided.
Section II: Source Water Assessment Program Overview page 7An introduction to the Source Water Assessment Program and its goals.
Section III: Source Water Assessment Program Steps page 10A description of the steps the Department of Environmental Protection (DEP) conducted toassess drinking water source(s) susceptibility to potential contamination. The contaminantcategories of concern and the potential contaminant sources found to be significant indetermining susceptibility (reffered to as explanatory variables) for the Source WaterAssessment Program are included in this section. Table 5 provides the percentage of publiccommunity water system sources in New Jersey that rated high, medium, and low for each ofthe contaminant categories.
Section IV: General Description of Water System page 25General information for the specific water system described in this report such as thesystem’s address, number of entry points to the distribution system, number of wells, numberof surface water intakes, and the municipalities and population the system serves. This isthe first section of the report that is specific to the water system.
Section V: Inventory of Treatment Plants and Drinking Water Sources page 27An inventory of the specific water system’s sources (wells and surface water intakes) andentry points to the distribution system. Additional source information such as source capacityand status is also provided. The water system data used for the development of theoriginal drinking water source inventory was compiled in the summer of 2003.
Section VI: Susceptibility Ratings for Drinking Water Source(s) page 30The susceptibility ratings (high, medium, or low) for each of the specific water system’ssources for each contaminant category.

II
Section VII: Susceptibility Ratings for the Entry Point(s) to the Distribution page 33 System (EPTDS)
The susceptibility ratings (high, medium, or low) for each of the water system’s EPTDS foreach contaminant category. The susceptibility ratings were calculated using the susceptibilityratings for the sources. This section explains the process DEP followed to determine theEPTDS’s susceptibility ratings.
Appendix A contains additional specific information for the system, immediately follows thereport. Appendix A consists of tables and information relating to the susceptibility ratingdetermination for the system’s sources. These items include:
Individual Explanatory Variable InventoryA series of tables show each water source’s inventory for each of the explanatory variablesfor the contaminant categories. For example, agricultural land use in 1995 was found to beone of the significant variables in determining susceptibility to nutrients for a well. Thepercentage of agricultural land use in 1995 is provided as well as the source’s rating fornutrients. The data populating these tables was used to determine susceptibility to thecontaminant categories for the drinking water sources.
Specific Potential Contaminant Source InventoryA table providing a list of potential contaminant sources located within the source waterassessment area for each unconfined well and/or intake. This table provides more specificinformation concerning the source’s potential contaminant source inventory. All of thepotential contaminant sources are listed individually. The site’s name, address, identificationnumber, and county, when available, is provided.
Contaminant Category Scoring SystemA series of tables illustrating how the rating score is determined for a source. This documentis divided into surface water and ground water sections and provides a table(s) for each ofthe contaminant categories. Using these rating score tables and the Individual ExplanatoryVariable Inventory, the numerical susceptibility rating score can be determined. This ratingscore was then converted into a high, medium, or low susceptibility rating. (The susceptibilityrating score conversions are also provided.)
Entry Point to the Distribution System (EPTDS) Rating CalculationsA table illustrating DEP’s calculations of the susceptibility ratings for the system’s EPTDS.This rating was determined using the susceptibility ratings for the sources and the sources’contributions. The monitoring and treatment takes place at the EPTDS level. Therefore, toassist in developing monitoring strategies, a susceptibility score and rating was developed.
Public Water TreatmentAlmost all community water systems in New Jersey treat source water prior to distributing it totheir customers. This portion of the appendices contains a list of the treatment processes thewater system was using at the time the source water assessment was conducted. Thisinformation is important consider when reviewing the susceptibility ratings; treatment mayalready be operating to remove contaminants associated with systems with high susceptibilityratings.
III
Source Water Assessment MapsA collection of maps illustrating the source water assessment areas for the water system’ssources (wells and surface water intakes). A separate map has been created for eachground water and surface water susceptibility model. In the case of ground water, there areseven source water assessment maps, one for each of the contaminant categories ofconcern. These categories include pathogens, nutrients, pesticides, volatile organiccompounds, inorganics, radionuclides/radon, and disinfection byproduct precursors. Forsurface water intakes, five source water assessment area maps were generated: nutrients,pesticides, volatile organic compounds, inorganics, and disinfection byproduct precursors. Inaddition to illustrating the source water assessment areas, these maps show the potentialcontaminant sources used in determining susceptibility ratings for the source(s).
Appendix B contains documents that further explain the procedures taken to determinesusceptibility of public drinking water sources. These documents contain informationaddressing the three steps of a source water assessment: develop a source waterassessment area, inventory the potential contaminant sources, and determine susceptibilityto potential contaminant sources.
Appendix C contains materials to assist in understanding the source water assessment reportand contact information for further questions.
1
SOURCE WATER ASSESSMENT
Executive Summary
City of Elizabeth Water Department O&M by Liberty Water Company
As a requirement of the 1996 Amendments to the Safe Drinking Water Act, New JerseyDepartment of Environmental Protection (DEP) performed a source water assessment ofeach source of public drinking water and determined each source’s susceptibility tocontamination. Susceptibility is a measure of the potential exposure of a drinking watersource to contamination.
Approximately 85 to 90 percent of New Jersey’s population receive their drinking water frompublic water systems. These public water systems are highly regulated and perform routinemonitoring for the presence of contaminants. The remaining population obtains their drinkingwater from private wells. In 2003, 606 public community water systems consisting of 2237wells and 64 surface water sources served approximately 7.5 million New Jersey residents.
DEP, in conjunction with the United States Geological Survey (USGS), performed thefollowing steps to determine the drinking water sources’ susceptibility.
• Identified the area that supplies water to a public drinking water system well or surfacewater intake (known as the source water assessment area). For ground water sources,this area is also known as the well head protection area. Approximately 10 percent ofNew Jersey is contained within a community water system well’s source waterassessment area. For surface water, approximately 53 percent of the state falls within asource water assessment area.
• Inventoried the significant potential sources of contamination within the source waterassessment area.
• Determined how susceptible each drinking water source is to contamination.
Susceptibility to the following categories of contamination was determined:
• Pathogens• Nutrients (nitrates)• Pesticides• Volatile Organic Compounds (VOCs)• Inorganics• Radionuclides• Radon• Disinfection Byproduct Precursors (DBPs)
To determine susceptibility to these contaminants, the USGS, with DEP assistance,developed statistical models based on extensive analysis of existing well sample data andsurface water intake data. The statistical models determined the relationship betweenenvironmental factors and the probability for contamination to occur. These models identifiedfactors, such as land use or geology, found to be significantly “linked” to a public watersystem source’s potential to become contaminated by one or more categories of

2
contaminants. DEP and USGS looked at factors that might affect the quality of drinking watersources and separated them into two categories.
The first category consists of sensitivity factors, which includes items related to theconstruction of a well (such as whether the well is in a confined or unconfined aquifer) andnaturally occurring factors (such as the geology of the unit in which a well is drawing waterfrom or over which water flows to the surface water intake).
Significant Sensitivity Factors• Confinement status: For ground water, the confinement status of the well was by far the
most frequently occurring sensitivity factor in predicting susceptibility to contamination andin fact was a factor in all the models. Confined wells are protected from activities at theland surface by relatively thick, laterally extensive units of low permeability (clay layers)and are a sufficient distance from the outcrop area of the geologic unit so that the sourcewater is less likely to be affected by contamination at the land surface. Confined wellswere determined to be of low susceptibility to contamination occurring at the land surface.Some confined wells, however, are susceptible to contaminants of natural subsurfaceorigin.
• Depth to the top of the open interval: For unconfined wells, depth to the top of the openinterval of the well was the most common sensitivity factor to affect the potential forcontamination of a well. Depth to top of open interval was found to be a factor in thefollowing five models: pathogens, nutrients, pesticides, inorganics, and radon. Theshorter the distance to the land surface, the more likely for the well to be affected bycontamination originating at the surface from point sources and certain land uses.
• Percent soil organic matter: For surface water and ground water, percent soil organicmatter was found to be a frequently occurring sensitivity factor. Percent soil organicmatter was a factor in the VOC, inorganic, and disinfectant byproduct precursor modelsfor both the surface water and ground water susceptibility models.
The second category of factors affecting a source’s potential to become contaminatedconsists of intensity of use factors. This category addresses the susceptibility tocontamination resulting from human activities at the land surface. Intensity of use factorsinclude those coming from a specific point source, such as a landfill or leaking undergroundstorage tank, and nonpoint sources of contamination grouped by land-use characteristics,such as agriculture or urban land use.
Significant Intensity of Use Factors
Nonpoint SourcesOverall, the results of the modeling performed by USGS show that of the nonpoint sources,factors related to urban land use and agricultural land use, were most often linked tosusceptibility of drinking water sources to contamination.• Surface water: factors related to urban land use from the 1995 coverage (including
percentage of commercial/industrial land use, percentage of developed land, percentageof residential land) were important in predicting a source’s susceptibility for fourcontaminant groups, specifically nutrients, pesticides, VOCs, and inorganics. Agriculturalland use was found to be a significant factor in three of the surface water models -nutrients, pesticides, and inorganics.

3
• Ground water: factors related to urban land use from both 1970 and 1995 were importantin predicting the susceptibility of source water for five of the models - nutrients, pesticides,VOCs, inorganics and radionuclides. Agricultural land use in 1970 and 1995 coverageswere factors in six of the ground water models: pathogens, nutrients, pesticides,radionuclides, radon, and inorganics.
Point Sources• Surface water: factors related to New Jersey Pollutant Discharge Elimination System
/Discharge to Surface Water (NJPDES/DSW) permits and sewage treatment plant densitywere found most often to be important factors, specifically for the nutrients, VOCs, andinorganics susceptibility models. NJPDES stormwater permitted locations, compostfacilities, sites on DEP’s Known Contaminated Site List (KCSL) and solid waste landfillswere found to be factors in two of the models: VOCs and inorganics.
• Ground water: point sources were found to be significant only in the models for VOC,inorganics, and disinfection byproduct precursors. No point sources were found to beimportant in the models for pathogens, nutrients, pesticides, radionuclides, and radon.
The specific sensitivity and intensity of use factors for each drinking water source areprovided in the Source Water Assessment Report in Tables 2, 3, and 4.
Using the susceptibility factors, the statistical models provided numerical ratings for eachsource of drinking water for each contaminant category, which were then converted into high(H), medium (M), or low (L) susceptibility ratings.
The Safe Drinking Water Standards or Maximum Contaminant Levels (MCLs) were used todefine the three susceptibility ratings (H, M, and L). These standards are developed basedhealth effects, analytical and treatment factors on either acute or long-term impacts related todrinking water exposure. A low susceptibility rating means a potential contaminant level waspredicted to be less than 10 percent of the MCL for that contaminant category. A mediumrating was given to drinking water sources where the potential contaminant level waspredicted to be equal to or greater than 10 percent and less than 50 percent of the MCL. Ahigh rating was assigned to those sources that were predicted to have potential contaminantlevels equal to or greater than 50 percent of the MCL. Sources with high susceptibility ratingsare still likely to have contaminant concentrations below the MCL. For the list of New Jerseyprimary and secondary drinking water standards, containing the MCLs, please refer tohttp://www.state.nj.us/dep/watersupply/standard.htm.
In some cases, insufficient data for particular supplies were available for all variables used insusceptibility models. In such cases, a default value for missing data was assumed. Use ofdefault values could result in a different susceptibility rating than that which would result if thesource-specific data were available.
Statewide SummaryTable E1 illustrates the percentage of community water system sources in New Jersey thatrated high, medium, and low for each of the contaminant categories. The table is separatedby source type: ground water (confined and unconfined) and surface water.

4
Table E1: Summary of Statewide Susceptibility Ratings for Community Water SystemSources (Percent %)
Path
ogen
s
Nut
rient
s
Pest
icid
es
VOC
s
Inor
gani
cs
Rad
ionu
clid
es
Rad
on
DB
Ps
GroundWater-
Confined1
High 0 0 0 0 0 0 0 27Medium 0 0 0 0 47 39 19 70
Low 100 100 100 100 53 61 81 3GroundWater-
Unconfined2
High 6 67 0 61 39 50 50 26Medium 56 30 34 1 33 47 46 74
Low 38 3 66 38 28 3 4 0SurfaceWater3
High 1004 47 13 5 81 0 0 98Medium 0 42 34 81 19 0 0 2
Low 0 11 53 14 0 1004 1004 01 Community water systems confined wells in New Jersey in 2003 = 6402 Community water systems unconfined wells in New Jersey in 2003 = 15973 Community water system surface water sources in New Jersey in 2003 = 644 All surface water intakes received high susceptibility ratings for pathogens and low susceptibility rating forradionuclides and radon
For the purpose of the source water assessments, the drinking water derived from all surfacewater intakes was assumed to be highly susceptible to contamination by pathogens.Therefore, all surface water intakes received a high rating for pathogens (100 percent).Surface water sources are subject to various sources of microbial contamination runoffcontaining fecal matter. Secondly, radionuclide and radon models for surface water were notdeveloped. Radionuclides are primarily a concern of ground water, therefore, all surfacewater intakes received a low susceptibility rating for radionuclides and radon (0 percent).
Statewide, 77 percent of the sources rated high for at least one of the contaminantcategories. Disinfection byproduct precursors were the contaminant category for whichsurface water sources most commonly received a high susceptibility rating (excludingpathogens). The factors deemed important for the surface water disinfectant byproductprecursor susceptibility model were average percent soil organic matter and distance towetlands. To address this important category of contaminants, the United StatesEnvironmental Protection Agency (USEPA) and DEP adopted the new Stage 1 Disinfectantsand Disinfection Byproduct Rule, that requires all community water systems that add adisinfectant to the drinking water during any part of the treatment process to perform routinemonitoring for trihalomethanes and haloacetic acids and meet new MCLs of 80 parts perbillion and 60 parts per billion, respectively. For more information on the Stage 1Disinfectants and Disinfection Byproduct Rule please refer to USEPA's web site athttp://www.epa.gov/OGWDW/mdbp/dbp1.html.

5
In addition, disinfection byproduct precursors were the contaminant category for whichconfined wells (ground water source) most commonly received a high susceptibility rating.The source water assessments resulted in an unexpected number of medium and highsusceptibility ratings for the disinfectant precursor model for ground water. The medium andhigh ratings were unexpected because the reported levels of disinfection byproductprecursors by ground water systems for compliance in New Jersey are generally low. Thismodel is being reviewed with data collected by DEP and may be further refined in the future.
An important distinction exists between the ground water disinfectant precursor model andthe other models. The disinfectant byproduct precursors, for which the model wasdeveloped, in combination with the disinfection process, form the actual disinfectantbyproducts. The disinfectant byproducts are regulated, not the precursors. The precursorsthemselves are not considered to have adverse health effects, but instead the chemicals thatare formed during the disinfection process have the potential health impacts. The othersusceptibility models were developed using the regulated contaminant rather than aconstituent that reacts to form the regulated contaminant.
For unconfined wells (ground water sources), nutrients and VOCs, were the contaminantcategories in which the most sources received a high susceptibility rating. On the other hand,all confined wells obtained a low susceptibility rating for nutrients and VOCs. Both of thesecontaminant categories are caused by human activity at the land surface, and confined wellsare relatively protected from the activity-related contamination by a layer of less permeablematerial. (The contaminant categories most related to by human activities are nutrients,pesticides, VOCs, and inorganic compounds.)
Drinking Water System: Summary of Sources for City of Elizabeth Water Department O&Mby Liberty Water CompanyCity of Elizabeth Water Department O&M by Liberty Water Company consists of 0 wells, 0wells under the influence of surface water, 0 surface water intake(s), 1 purchased groundwater source(s), and 3 purchased surface water source(s) of drinking water. (The watersystem data used for the development of the original drinking water source inventorywas compiled in the summer of 2003.)
Table E2 provides a summary of the susceptibility ratings for the City of Elizabeth WaterDepartment O&M by Liberty Water Company drinking water source(s). The “sources” columnof the table provides the number of ground water and surface water sources and the numberof wells under the direct influence of surface water in the system. Ground water under thedirect influence of surface water (GUDI) is a well found to be influenced by surroundingsurface water bodies, and is classified according to site specific water quality measurements,according to the Surface Water Treatment Rule. The other columns provide the number ofeach of the source(s) that rated high (H), medium (M), and low (L) for each of thecontaminant categories.

6
Table E2: Summary of Susceptibility Ratings for Drinking Water Source(s) for City ofElizabeth Water Department O&M by Liberty Water Company
Path
ogen
s
Nut
rient
s
Pest
icid
es
VOC
s
Inor
gani
cs
Rad
ionu
clid
es
Rad
on
DB
Ps
Sources H M L H M L H M L H M L H M L H M L H M L H M L
Wells - 0
GUDI - 0
Surface waterintakes - 0
If a drinking water source’s susceptibility is high, it does not necessarily mean the drinkingwater is contaminated. The rating reflects the potential for contamination of source water, notthe existence of contamination.
Under the State’s Safe Drinking Water Regulations, all public water systems must routinelymonitor for contamination. If MCLs (drinking water standards) are exceeded, the watersystem must perform additional monitoring and treat the water before it is served to theconsumer. The water system is also required to notify its customers when MCL violationsoccur. The process for notification depends on the severity of the violation, which can includepublic service announcements and publication in a local newspaper. Information aboutviolations must also be included in the Consumer Confidence Reports that community watersystems must mail to all their customers annually.
Drinking Water System: Entry Point to the Distribution SystemEach entry point to the distribution system (EPTDS) also received a susceptibility rating bycombining the weighted average of all the sources contributing to the EPTDS, after the waterhas been treated (if the drinking water is treated). The susceptibility rating for each EPTDS isavailable in the Source Water Assessment Report, Section VII, Table 11.
Since the EPTDS is the point at which monitoring and treatment occurs, the DEP determinedthe EPTDS susceptibility ratings because the assessment will help determine if the existingmonitoring requirements for each public water system need to be revised. The assessmentwill help determine if the routine monitoring frequencies required of a community watersystem should be increased or decreased (support monitoring waivers). Secondly, theresults of the Source Water Assessments will help DEP protect public health by targetingwells and surface water sources that are highly susceptible to contamination for additionalwater quality monitoring.
The Source Water Assessment Program was designed to encourage protection of drinkingwater sources by providing information to state and local regulatory agencies and the publicto assist in watershed assessment and planning and to enhance the public’s role as “waterstewards.” The results provide information to allow state and local agencies to determine ifincreased regulatory controls, including local land use ordinances, are warranted. In addition,the basic data gathered through the Source Water Assessment Program, including thelocations of the public water system wells and surface water sources, will be available for

7
DEP program use in efforts to improve environment regulatory actions, such as cleanupdecisions in the hazardous and solid waste programs. For more information on DEP’sSource Water Protection Strategy please see the Statewide Summary Document available atwww.state.nj/us/dep/swap.
For further information please refer to the detailed information in the Source WaterAssessment Report or go to www.state.nj/us/dep/swap.

Acknowledgements
The New Jersey Department of Environmental Protection would like to take this opportunity toacknowledge and thank the individuals who contributed to the Source Water Assessment Program.
The Department of Environmental Protection’s Water Supply Administration, New Jersey GeologicalSurvey, and Division of Science, Research and Technology prepared the source water assessmentsin cooperation with the United States Geological Survey.
Water Supply AdministrationEdward ApalinskiPatricia BonoKaren FellBarker Hamill
Sandra KrietzmanMyongsun KongMike MatthewsDiane Pupa
Michele PutnamLinda WalshKristin Zams
New Jersey Geological SurveySteve JohnsonBill Mennel
Ted PallisSteve Spayd
Division of Science, Research and TechnologyGail CarterBranden JohnsonJudy Louis
Watershed ManagementRobert KecskesTom McKeeElizabeth Semple
United States Geological SurveyDebra BuxtonJessica HoppleRobert Nicholson
Steven NieswandDonald StorckEric Vowinkel
Source Water Assessment Advisory CommitteeTom Atherholt, NJDEP, DSRTJim Blando, NJ Department of Health and SeniorServicesPaul Britt, NJ Water AssociationDave Brogle, Middlesex Water CompanyPerry Cohn, NJ Department of Health and SeniorServicesRay Cywinski, United WaterJoe Deckelmick, NJ Environmental FederationKevin Dixon, NJ American Water CompanyRon Farr, North Jersey District Water SupplyCommissionAmy Goldsmith, NJ Environmental FederationRobert Hordon, Rutgers UniversityRick Howlett, NJ Water AssociationWilliam Hutchinson, Southeast Morris County MUAMark Impomeni, Bergen County HealthLendel Jones, NJ American Water CompanyRobert Karl, Brick Township MUA
Haig Kasabach, Hamilton TownshipGeoff Knapp, Morris CountyAnne Kruger, Passaic River CoalitionLeo Kruger, Passaic River CoalitionLouisa Lubiak, Passaic River CoalitionFrank Marascia, Elizabethtown Water CompanyPeder Nesse, NJ Water AssociationJohn Paschal, Morris County Board of AgricultureDave Pringle, NJ Environmental FederationDavid Sayers, Delaware River Basin CommissionPaul Scelsi, NJ Department of TransportationCarol Storms, NJ American Water CompanyLouise Usechak, League of Women Voters of NJDan Van Abs, NJ Water Supply AuthorityPeter Weppler, North Jersey District Water SupplyCommissionRick Westergard, Gloucester County PlanningDepartmentRonald Williams, Middlesex Water Company
i
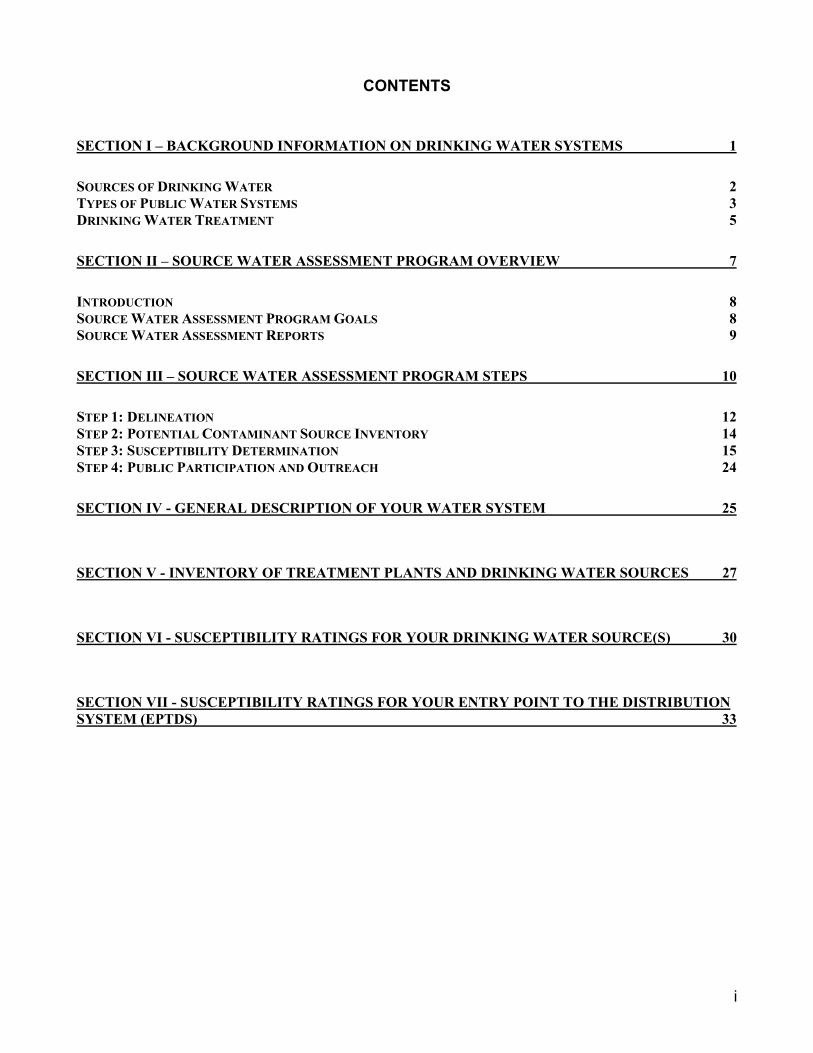
CONTENTS
SECTION I – BACKGROUND INFORMATION ON DRINKING WATER SYSTEMS 1
SOURCES OF DRINKING WATER 2TYPES OF PUBLIC WATER SYSTEMS 3DRINKING WATER TREATMENT 5
SECTION II – SOURCE WATER ASSESSMENT PROGRAM OVERVIEW 7
INTRODUCTION 8SOURCE WATER ASSESSMENT PROGRAM GOALS 8SOURCE WATER ASSESSMENT REPORTS 9
SECTION III – SOURCE WATER ASSESSMENT PROGRAM STEPS 10
STEP 1: DELINEATION 12STEP 2: POTENTIAL CONTAMINANT SOURCE INVENTORY 14STEP 3: SUSCEPTIBILITY DETERMINATION 15STEP 4: PUBLIC PARTICIPATION AND OUTREACH 24
SECTION IV - GENERAL DESCRIPTION OF YOUR WATER SYSTEM 25
SECTION V - INVENTORY OF TREATMENT PLANTS AND DRINKING WATER SOURCES 27
SECTION VI - SUSCEPTIBILITY RATINGS FOR YOUR DRINKING WATER SOURCE(S) 30
SECTION VII - SUSCEPTIBILITY RATINGS FOR YOUR ENTRY POINT TO THE DISTRIBUTIONSYSTEM (EPTDS) 33

ii
APPENDICES
APPENDIX A – SOURCE WATER ASSESSMENT SUSCEPTIBILITY RATING INFORMATION FORYOUR WATER SYSTEM
Attachment 1: Individual Explanatory Variable InventoryAttachment 2: Specific Potential Contaminant Sources InventoryAttachment 3: Contaminant Category Scoring SystemAttachment 4: Entry Point to the Distribution System Rating CalculationsAttachment 5: Public Water TreatmentAttachment 6: Source Water Assessment Maps
APPENDIX B – RESOURCE MATERIALS FOR COMPLETEING SOURCE WATER ASSESSMENTSFOR PUBLIC DRINKING WATER SOURCES
Attachment 1: Guidelines for Delineation of Well Head Protection Areas in New JerseyAttachment 2: Surface Water Delineation MethodologyAttachment 3: New Jersey Source Water Assessment Program Potential Contaminant
Source Inventory MethodologyAttachment 4: Methods to Determine the Susceptibility of Source Water to Community and
Noncommunity Water Supplies in New Jersey to ContaminationAttachment 5: Contaminant Group Reports for Ground WaterAttachment 6: Contaminant Group Reports for Surface Water
APPENDIX C – SOURCE WATER ASSESSMENT REPORT MATERIALS
Attachment 1: Source Water Assessment Contact ListAttachment 2: List of AcronymsAttachment 3: Glossary

iii
FIGURES
FIGURE 1: HYDROLOGIC CYCLE AND SOURCES OF DRINKING WATER 3
FIGURE 2: TYPES OF PUBLIC WATER SYSTEMS 4
FIGURE 3: EXAMPLE OF DRINKING WATER TREATMENT 6
FIGURE 4: FLOWCHART OF SOURCE WATER ASSESSMENT PROGRAM PROCESS 11

iv
TABLES
TABLE 1: PUBLIC WATER SYSTEMS IN NEW JERSEY IN 2003 5
TABLE 2: SURFACE WATER EXPLANATORY VARIABLES 19
TABLE 3: GROUND WATER UNCONFINED EXPLANATORY VARIABLES 20
TABLE 4: GROUND WATER CONFINED EXPLANATORY VARIABLES 22
TABLE 5: SUMMARY OF STATEWIDE SUSCEPTIBILITY RATINGS FOR COMMUNITY WATER
SYSTEM SOURCES (PERCENT %) 23
TABLE 6: MUNICIPALITIES AND POPULATION SERVED 26
TABLE 7: DRINKING WATER SOURCE AND EPTDS INVENTORY 28
TABLE 8: SUMMARY OF SUSCEPTIBILITY RATINGS FOR DRINKING WATER SOURCE(S) 31
TABLE 9: SUSCEPTIBILITY RATING FOR DRINKING WATER SOURCE(S) 32
TABLE 10: EXAMPLE OF AN EPTDS SUSCEPTIBILITY RATING CALCULATION 35
TABLE 11: SUSCEPTIBILITY RATING FOR EPTDS 36

1
SECTION I – BACKGROUND INFORMATION ON DRINKING WATER SYSTEMS

2
SECTION I – BACKGROUND INFORMATION ON DRINKING WATER SYSTEMS
This background information is provided to describe how public drinking water systems areregulated and the relationship of these water systems with the Source Water AssessmentProgram. The following section describes sources of drinking water (groundwater and surfacewater), types of drinking water systems according to the Department of EnvironmentalProtection (DEP) and Environmental Protection Agency (EPA) definitions, and drinking watertreatment.
Sources of Drinking Water
1. Ground WaterGround water infiltrates the ground and is stored in aquifers, soil and rock below the surface.Aquifers typically consist of gravel, sandstone, sand, or fractured rock. An aquifer can beconfined or unconfined. A confined aquifer is ground water bounded between impermeablelayers, such as clay. An unconfined aquifer is not bounded by impermeable layers and ismore directly linked to surface activities and resources.
Ground water is obtained from a spring or by pumping water from an aquifer through a well.A well is a hole or excavation that is drilled, bored, core driven, jetted, dug, driven orotherwise constructed for the purpose of removal of water from the subsurface for potablewater supply. Public wells in New Jersey range from 15 to 1,984 feet deep (in 2002).
2. Surface WaterSurface water, is the water at or above the land’s surface, which is neither ground water norcontained within the unsaturated zone, including, but not limited to, the ocean and itstributaries, all springs, streams, rivers, lakes, ponds, wetlands, and artificial waterbodies.
An important link exists between ground water and surface water. Surface water can infiltratethe ground and recharge aquifers. Conversely, ground water slowly moves to the surfaceand discharges into lakes, rivers, or streams and is known as baseflow. New Jersey’s naturalstream flow, especially during periods of low precipitation, is largely baseflow from groundwater.

3
Figure 1 illustrates the water cycle, ground water and surface water, and potential sources ofcontamination to drinking water sources.
Figure 1: Hydrologic Cycle and Sources of Drinking Water
Illustration courtesy of USGS
Types of Public Water SystemsA public water system is defined as a system for the provision to the public of water forhuman consumption through pipes or other constructed conveyances, if such system has atleast 15 service connections or regularly serves at least 25 individuals. Ground water and/orsurface water sources can be used for public water systems.
1. Community Water System: has at least 15 service connections used by year roundresidents, or regularly serves at least 25 year round residents. Examples of a communitywater system are mobile home communities, municipally owned water systems andprivately owned water systems that have their own well(s) or surface water intake(s).
2. Noncommunity Water System: used by individuals other than year round residents forat least 60 days of the year. A noncommunity water system can be either transient ornontransient. A nontransient noncommunity water system serves at least 25 of the samepersons over six months per year, such as schools, factories, and office buildings whichhave their own well(s) or surface water intake(s). Transient noncommunity water systemsare systems that do not fall within the definition of a nontransient water system. Transientnoncommunity water systems include rest stop areas, restaurants, and motels that havetheir own well(s).
A flow chart describing these definitions appears in Figure 2.

4
Figure 2: Types of Public Water Systems

5
Approximately 85 to 90 percent of New Jersey’s population is served by public watersystems. Table 1 summarizes the number of public water systems, wells, and surface watersources in the State of New Jersey in 2003.
Table 1: Public Water Systems in New Jersey in 2003Type of Public Water System # of Public Water Systems* # of Ground
Water Sources# of Surface
Water Sources
Community 606 2237 64
Nontransient Noncommunity 876 1083 3
Transient Noncommunity 2654 2779 0
Total 4136 6099 67* DEP, Bureau of Safe Drinking Water, NJ Public Water System Database.
The remaining New Jersey population is served by private wells (i.e. wells serving individualhomes, small businesses, etc.) Private wells are not included in the SWAP. For moreinformation on private wells please visit the Water Supply Administration web site atwww.state.nj.us/dep/watersupply or refer to the EPA web site atwww.epa.gov/safewater/pwells1.html.
Drinking Water TreatmentA public water system consists of interconnected pipes that lead from the source of drinkingwater to the consumer. Almost all community water system sources and somenoncommunity water system sources are treated to remove microorganisms or dissolvedchemicals or minerals. An entry point to the distribution system (EPTDS) is a location in thepublic water system where treated water from a treatment plant enters into the waterdistribution system. A public water system may contain one or more EPTDS. If the water isnot treated, as some ground water systems are not, then the place where the untreated watersource enters the network of pipes is the EPTDS.
Figure 3 illustrates general treatment schemes for both a surface water system and a groundwater system. The means of acquiring water (well or surface water intake), the treatmentprocess, and storage are shown. An individual water system may contain only part or evennone (do not treat) of these pieces. Individual water treatment may vary according to sourcewater quality.

6
Figure 3: Example of Drinking Water Treatment
Illustration from “Safeguarding the Quality of Your Drinking Water”, prepared by the Public Information Committee of the NewJersey Section of the American Water Works Association.

7
SECTION II – SOURCE WATER ASSESSMENT PROGRAM OVERVIEW

8
SECTION II – SOURCE WATER ASSESSMENT PROGRAM OVERVIEW
IntroductionThe 1996 Amendments to the Federal Safe Drinking Water Act place a strong emphasis onpublic awareness and the information provided to the public concerning the quality of drinkingwater. As part of the 1996 Amendments, all states were required to establish a Source WaterAssessment Program (SWAP).
Through the SWAP, the DEP evaluated the susceptibility of public water systems to severalcategories of contamination. If a system rates highly susceptible for a contaminantcategory, it does not mean a customer is or will be consuming contaminated drinkingwater. The rating reflects the potential for contamination of source water, not the existenceof contamination. Susceptibility to contamination is a function of several factors, includingcontaminant use near the water source and the characteristics of the water source.
New Jersey’s SWAP Plan, which provides the framework for how DEP performed theassessments, can be found at www.state.nj.us/dep/watersupply/swap1.pdf.
The New Jersey SWAP incorporates four steps:
1. Delineate the source water assessment area of each public drinking water source.2. Inventory the potential contaminant sources within the source water assessment
area.3. Determine the water system’s susceptibility to contaminants.4. Incorporate public participation and education.
Source Water Assessment Program GoalsThe information obtained from the completed source water assessments may be used toachieve the goals listed below.
1. Protect sources of drinking water.The source water assessments provide a susceptibility rating for each source of drinkingwater, which supplies information on how vulnerable the source is to contamination.
Source water protection focuses on preserving and protecting the public drinking watersource. The information obtained from the SWAP will provide communities and decision-makers with the information to protect their drinking water source(s). The source waterassessment results can also be used by DEP, purveyors, and local planning officals to lay thegroundwork for advancing the State’s drinking water protection efforts. Based on thepotential of a drinking water source to become contaminated, DEP can initiate a variety ofactivities to protect the drinking water source through existing DEP programs. For moreinformation regarding DEP’s Source Water Protection Strategy please refer to the SourceWater Assessment Program Statewide Summary available on the Division of Water Supply’sweb site at http://www.state.nj.us/dep/watersupply//.
2. Public education of SWAP information.DEP incorporated public education throughout the development and implementation of theSource Water Assessment Program. During the source water assessment process, DEP

9
spoke to interested parties, beginning with the development of the SWAP Plan, publishedarticles, wrote two newsletters, and developed a SWAP web site. Upon completion of thesource water assessments, DEP generated a source water assessment report and/orsummary for each public water system to report the susceptibility ratings.
The goal of the public education efforts is to make the public more aware of the source oftheir drinking water and the potential contaminants that could impair the water's quality. Tocontinue fulfilling the education requirement, DEP will conduct training sessions following therelease of the Source Water Assessment Reports.
3. Establish a customized monitoring schedule for each public water system.The source water assessments will assist DEP in improving current monitoring requirementsfor individual public water systems. Currently, the EPA and the DEP have mandatorymonitoring schedules that depend on a variety of factors that can include the source of thewater (ground water or surface water) and the surrounding land use. These schedules canbe customized based on the susceptibility of the sources of drinking water. The SWAP willprovide better information for making these determinations.
Source Water Assessment ReportsDEP will issue the following reports to public water systems.
1. Community Water System Source Water Assessment Report: primarily intended forthe public water system’s reference and use, although the report is also available to thepublic. Individuals, environmental organizations, and municipalities interested in sourcewater protection may also utilize the Community Water System Source WaterAssessment Report for protection activities.
2. Community Water System Source Water Assessment Summary: a short (4-6 page)informative document created for distribution by the water system to the general public. Inaddition, DEP will post the summary document on the SWAP web site athttp://www.state.nj.us/dep/swap/. The Community Water System Source WaterAssessment Summary is a synopsis of the Source Water Assessment Report andprovides the source susceptibility ratings for the community water system’s sources.
3. Noncommunity Water System Source Water Assessment Report: developed for therespective noncommunity water system. The report provides the susceptibility ratings ofthe system’s sources. The general public may request the report from the noncommunitywater system or the DEP.

10
SECTION III – SOURCE WATER ASSESSMENT PROGRAM STEPS
11
SECTION III – SOURCE WATER ASSESSMENT PROGRAM STEPS
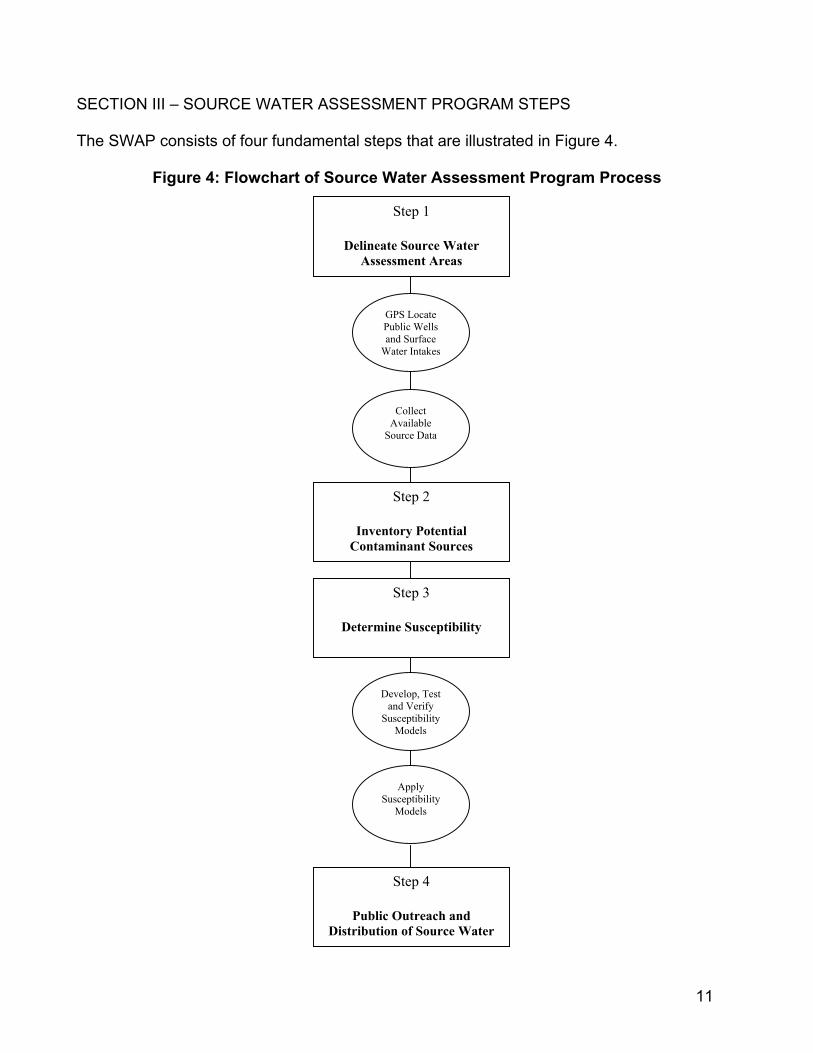
The SWAP consists of four fundamental steps that are illustrated in Figure 4.
Figure 4: Flowchart of Source Water Assessment Program Process
Step 1
Delineate Source WaterAssessment Areas
GPS LocatePublic Wellsand Surface
Water Intakes
CollectAvailable
Source Data
Step 2
Inventory PotentialContaminant Sources
Step 3
Determine Susceptibility
Develop, Testand Verify
SusceptibilityModels
ApplySusceptibility
Models
Step 4
Public Outreach andDistribution of Source Water

12
Step 1: DelineationThe first step of the SWAP process is to delineate the source water assessment area foreach public water system well and surface water intake. For ground water sources, a sourcewater assessment area in New Jersey is the area from which water is reasonably likely toflow to a well within a 12 year period. This area is also known as a wellhead protection area,or WHPA. For surface water sources, the source water assessment area is the areaupstream of a surface water intake, including land that drains to the upstream areas.
Before the source water assessment area was delineated for a public well, attribute data wasgathered. Since 1947, a property owner or well driller has been required to obtain a wellpermit from New Jersey’s well permitting program to drill a well in New Jersey. After alicensed well driller drills the well, a well record must be submitted to the Water SupplyAdministration, DEP. The well record is an “as-built” description of the well construction, andusually contains important attribute data such as well depth, screened interval or length ofopen hole, and pumping rate/capacity. This information is needed to delineate the sourcewater assessment area around the well. DEP used the well record to determine attributedata. In situations where DEP was unable to obtain attribute data, such as for a well drilledprior to 1947 or when a well record was not available, default values were generated usingNew Jersey Geological Survey’s (NJGS) “Guidelines for Delineation of Well Head ProtectionAreas in New Jersey,” Appendix B- Attachment 1. The guidance document is available onthe internet at www.state.nj.us/dep/njgs/whpaguide.pdf, by contacting the DEP, New JerseyGeological Survey at (609) 292-1185, or from the DEP Maps and Publications Sales Office at(609) 777-1038.
For surface water intakes, source water assessment areas were developed based on thelocation of the intake and the entire drainage area upstream of the intake includingheadwaters and tributaries. These factors influence the shape and size of the delineations.
Next, the well or intake was located using Global Positioning System (GPS). All wells andintakes were GPS-located according to the "DEP GPS Data Collection Standards for GISData Development” available at www.state.nj.us/dep/gis/gpstrim.html. The DEP GPS-locatedthe community water system wells and surface water intakes. The noncommunity watersystem wells were GPS-located by DEP, County Environmental Health Act (CEHA)Agencies, and the New Jersey Water Association.
After collecting the attribute data and GPS location, the source water assessment areas forwells and intakes were delineated. DEP performed the ground water source waterassessment area delineations using the Combined Model/Calculated Fixed Radius Methodfor all public community water system wells and the Calculated Fixed Radius method for thenoncommunity water system wells. For a detailed description of the delineation methodsplease refer to New Jersey’s “Guidelines for Delineation of Well Head Protection Areas inNew Jersey,” Appendix B- Attachment 1.
For each ground water source, three tiers were calculated and labeled as Tier 1 (two yeartime of travel), Tier 2 (five year time of travel), and Tier 3 (12 year time of travel). Time oftravel was established for determining the risk of contamination to a well. The two year timeof travel was developed based on the potential for microbiological contamination. Studiesshow on average, bacteria can survive in ground water for approximately 170 days and
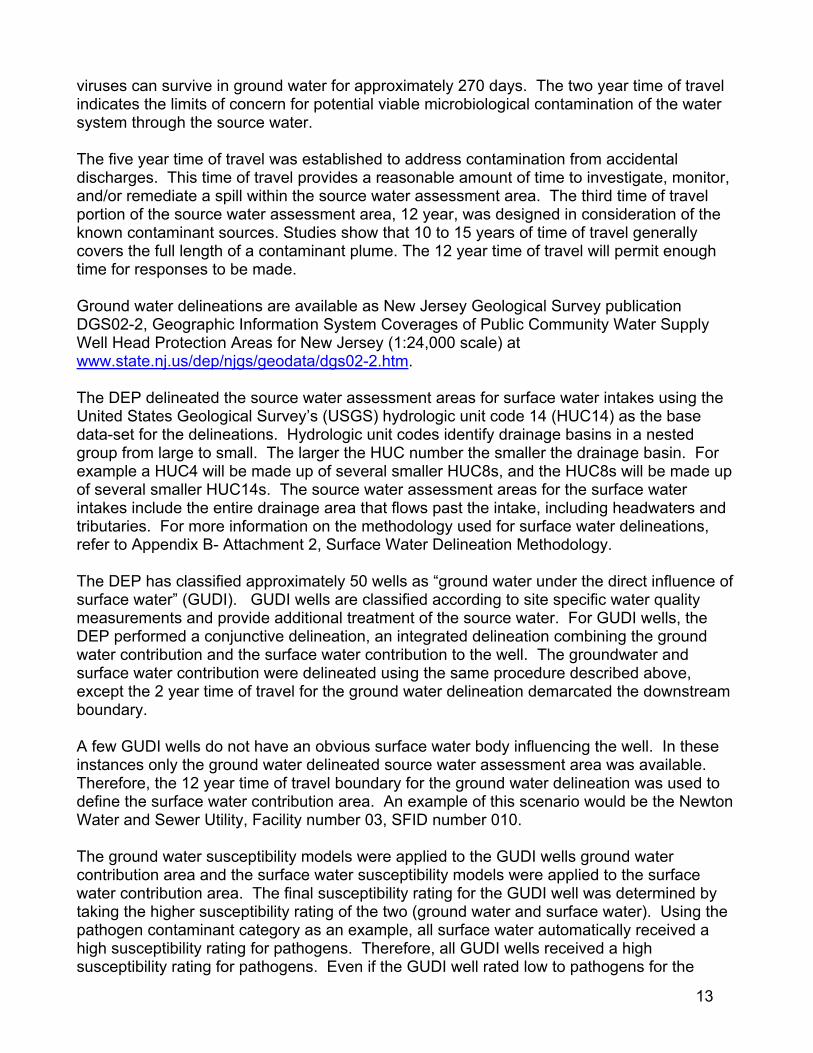
13
viruses can survive in ground water for approximately 270 days. The two year time of travelindicates the limits of concern for potential viable microbiological contamination of the watersystem through the source water.
The five year time of travel was established to address contamination from accidentaldischarges. This time of travel provides a reasonable amount of time to investigate, monitor,and/or remediate a spill within the source water assessment area. The third time of travelportion of the source water assessment area, 12 year, was designed in consideration of theknown contaminant sources. Studies show that 10 to 15 years of time of travel generallycovers the full length of a contaminant plume. The 12 year time of travel will permit enoughtime for responses to be made.
Ground water delineations are available as New Jersey Geological Survey publicationDGS02-2, Geographic Information System Coverages of Public Community Water SupplyWell Head Protection Areas for New Jersey (1:24,000 scale) atwww.state.nj.us/dep/njgs/geodata/dgs02-2.htm.
The DEP delineated the source water assessment areas for surface water intakes using theUnited States Geological Survey’s (USGS) hydrologic unit code 14 (HUC14) as the basedata-set for the delineations. Hydrologic unit codes identify drainage basins in a nestedgroup from large to small. The larger the HUC number the smaller the drainage basin. Forexample a HUC4 will be made up of several smaller HUC8s, and the HUC8s will be made upof several smaller HUC14s. The source water assessment areas for the surface waterintakes include the entire drainage area that flows past the intake, including headwaters andtributaries. For more information on the methodology used for surface water delineations,refer to Appendix B- Attachment 2, Surface Water Delineation Methodology.
The DEP has classified approximately 50 wells as “ground water under the direct influence ofsurface water” (GUDI). GUDI wells are classified according to site specific water qualitymeasurements and provide additional treatment of the source water. For GUDI wells, theDEP performed a conjunctive delineation, an integrated delineation combining the groundwater contribution and the surface water contribution to the well. The groundwater andsurface water contribution were delineated using the same procedure described above,except the 2 year time of travel for the ground water delineation demarcated the downstreamboundary.
A few GUDI wells do not have an obvious surface water body influencing the well. In theseinstances only the ground water delineated source water assessment area was available.Therefore, the 12 year time of travel boundary for the ground water delineation was used todefine the surface water contribution area. An example of this scenario would be the NewtonWater and Sewer Utility, Facility number 03, SFID number 010.
The ground water susceptibility models were applied to the GUDI wells ground watercontribution area and the surface water susceptibility models were applied to the surfacewater contribution area. The final susceptibility rating for the GUDI well was determined bytaking the higher susceptibility rating of the two (ground water and surface water). Using thepathogen contaminant category as an example, all surface water automatically received ahigh susceptibility rating for pathogens. Therefore, all GUDI wells received a highsusceptibility rating for pathogens. Even if the GUDI well rated low to pathogens for the

14
ground water contribution area, the high rating for the surface water contribution area wasused as the final susceptibility rating (the highest rating of the two).
Step 2: Potential Contaminant Source InventoryThe second step of the SWAP is to identify the potential contaminant sources within thesource water assessment area. These potential sources of contamination include point andnonpoint sources. Point source contaminants may be traced to a single source, such asknown contaminated sites, industrial and commercial surface and ground water discharges,and sewage treatment discharges. Nonpoint source contaminants may not be traced to onesingle source because they come from several individual sources within a large area. Landuse activities such as salting and runoff from roads and the application of pesticides andherbicides are examples of nonpoint sources. Nonpoint and point sources can have asignificant impact on both surface water and ground water quality.
Potential contaminant source inventory information was primarily collected from existing DEPGIS databases. For nonpoint sources, digital GIS land use and land cover data for the years1970, 1986, and 1995 were used. Several datasets of land coverage were used to accountfor the changes in land use over the years. The New Jersey Source Water AssessmentProgram Potential Contaminant Source Inventory (PCSI) Methodology, Appendix B-Attachment 3, describes how the potential contaminant source inventory was developed, thedatasets used, the sites and activities included in the inventory, and the preliminary list ofexplanatory variables used in the susceptibility models.
For the purpose of the SWAP, the DEP, in conjunction with a Source Water AssessmentAdvisory Committee that met regularly during the development of the SWAP Plan, developedeight conceptual contaminant categories that represent microbiological and chemicalcontaminants of concern. These categories include pathogens, nutrients, volatile organiccompounds, synthetic organic compounds, pesticides, inorganics, radionuclides anddisinfection byproduct precursors. This list was further refined during the susceptibility modeldevelopment process. Tables 2, 3, and 4 contain the final list of contaminant categories andexplanatory variables. Each drinking water source was evaluated for susceptibility to each ofthe following contaminant categories.
Conceptual Contaminant Categories
PathogensDisease-causing organisms such as bacteria, protozoa, and viruses. Sources of pathogensinclude both point and nonpoint activities. An example of a point source of pathogens is asewer system overflow. An example of a nonpoint source is runoff from areas wherelivestock are kept.
NutrientsCommon types of nutrients include nitrogen and phosphorous. Nutrients can harmenvironmental quality, human health, and the efficiency of the drinking water treatment plantby encouraging growth of photosynthetic microorganisms in surface water sources, whichalter water characteristics (eutrophic conditions). Sources of nutrients are point and nonpointsources. Effluents from a sewage treatment plant are a point source of nutrients. Nonpointsources of nutrients include discharge from septic fields, areas where animal waste is stored,and runoff from agricultural and residential land where fertilizers were used.
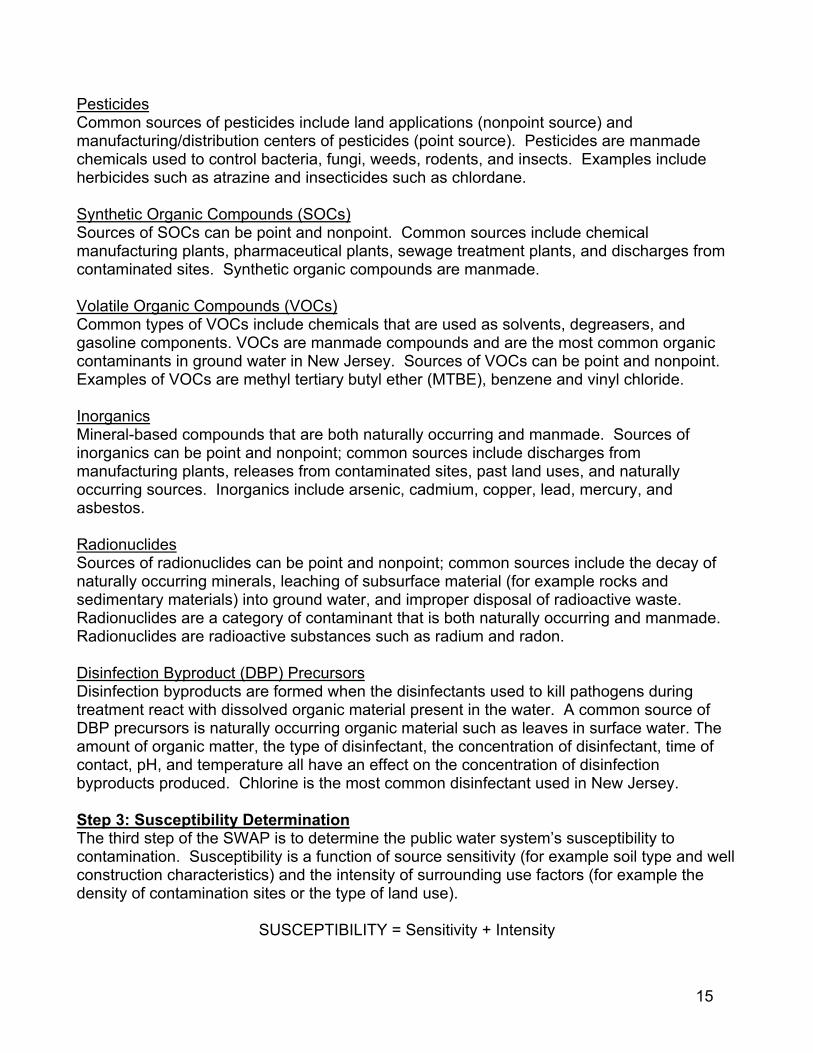
15
PesticidesCommon sources of pesticides include land applications (nonpoint source) andmanufacturing/distribution centers of pesticides (point source). Pesticides are manmadechemicals used to control bacteria, fungi, weeds, rodents, and insects. Examples includeherbicides such as atrazine and insecticides such as chlordane.
Synthetic Organic Compounds (SOCs)Sources of SOCs can be point and nonpoint. Common sources include chemicalmanufacturing plants, pharmaceutical plants, sewage treatment plants, and discharges fromcontaminated sites. Synthetic organic compounds are manmade.
Volatile Organic Compounds (VOCs)Common types of VOCs include chemicals that are used as solvents, degreasers, andgasoline components. VOCs are manmade compounds and are the most common organiccontaminants in ground water in New Jersey. Sources of VOCs can be point and nonpoint.Examples of VOCs are methyl tertiary butyl ether (MTBE), benzene and vinyl chloride.
InorganicsMineral-based compounds that are both naturally occurring and manmade. Sources ofinorganics can be point and nonpoint; common sources include discharges frommanufacturing plants, releases from contaminated sites, past land uses, and naturallyoccurring sources. Inorganics include arsenic, cadmium, copper, lead, mercury, andasbestos.
RadionuclidesSources of radionuclides can be point and nonpoint; common sources include the decay ofnaturally occurring minerals, leaching of subsurface material (for example rocks andsedimentary materials) into ground water, and improper disposal of radioactive waste.Radionuclides are a category of contaminant that is both naturally occurring and manmade.Radionuclides are radioactive substances such as radium and radon.
Disinfection Byproduct (DBP) PrecursorsDisinfection byproducts are formed when the disinfectants used to kill pathogens duringtreatment react with dissolved organic material present in the water. A common source ofDBP precursors is naturally occurring organic material such as leaves in surface water. Theamount of organic matter, the type of disinfectant, the concentration of disinfectant, time ofcontact, pH, and temperature all have an effect on the concentration of disinfectionbyproducts produced. Chlorine is the most common disinfectant used in New Jersey.
Step 3: Susceptibility DeterminationThe third step of the SWAP is to determine the public water system’s susceptibility tocontamination. Susceptibility is a function of source sensitivity (for example soil type and wellconstruction characteristics) and the intensity of surrounding use factors (for example thedensity of contamination sites or the type of land use).
SUSCEPTIBILITY = Sensitivity + Intensity

16
DEP contracted with the USGS to develop susceptibility assessment models, with DEPguidance, to determine susceptibility ratings for public supply wells and surface water intakesfor the contaminant categories of concern described in Step 2. Some states have determinedsusceptibility using relatively simple approaches that account for factors such as distance tocontaminant sources, but the more thorough modeling approach employed for New Jerseyprovides a more accurate estimate of susceptibility. The models were based on results froman extensive analysis of ground water and surface water quality data from the DEP-USGSstatewide cooperative monitoring networks for a select set of sites in New Jersey. Pleaserefer to the documentation Methods to Determine the Susceptibility of Source Water toCommunity and Noncommunity Water Supplies in New Jersey to Contamination, AppendixB- Attachment 4 for more information.
USGS developed susceptibility models for seven contaminant categories and radon for bothground water and surface water. DEP had originally intended to develop a susceptibilitymodel for “synthetic organic compounds” (SOCs), but did not do so for two reasons. First,SOCs under the Federal and State Safe Drinking Water Acts consist primarily of pesticidesand as part of SWAP, USGS developed a pesticide susceptibility model. Secondly, as USGSinvestigated whether it could construct a SOCs model, USGS and DEP jointly determinedthat there was insufficient SOC data that was neither pesticide nor volatile organic compound(VOC) related. (USGS also developed a separate VOC model.) However, it is DEP’sexperience that the presence of non-pesticide, non-volatile SOCs will typically co-occur withVOCs. Specifically, recent work by DEP and others at community water systems usingground water as a source and known to be contaminated by volatile organic contaminationfrom hazardous waste sites determined that “tentatively identified compounds” (TICs) werepresent. In this study, although DEP and others were primarily looking for non-volatileorganic compounds, TICs were found at some frequency at these sites. As part of the study,a “control” water system with no hazardous waste site nearby and with no volatilecontamination was tested and contained no TICs. Qualitative evaluation of the data showsystems with the higher levels of volatile organic chemicals and with more than one VOCpresent contained the highest number of TICs. For these reasons, DEP has determined theSOC rating for a water system would be the same as the public water system’s VOC rating,and that a separate SOC susceptibility model was unnecessary.
Separate susceptibility models were developed for radon and other radionuclides for tworeasons. First, radon, a gas, is chemically and physically different from other radionuclideconstituents. Second, radon most often occurs in areas where other radionuclides are notpresent. The remedy for radon is different from the remedy for other radionuclides. DEP wasconcerned that if both radon and other radionuclides were combined, the susceptibility ratingwould not show the difference in susceptibility of water systems’ sources to the differentradionuclides.
For the purpose of the source water assessments, all surface water was assumed to behighly susceptible to pathogens, therefore a pathogen model was not developed for surfacewater. Surface water sources are subject to various sources of microbial contaminationrunoff containing fecal matter. All surface water intakes received a high rating for pathogens.Secondly, a radionuclide model was not developed for surface water. Radionuclides areprimarily a concern of ground water, therefore, all surface water intakes received a lowsusceptibility rating for radionuclides.

17
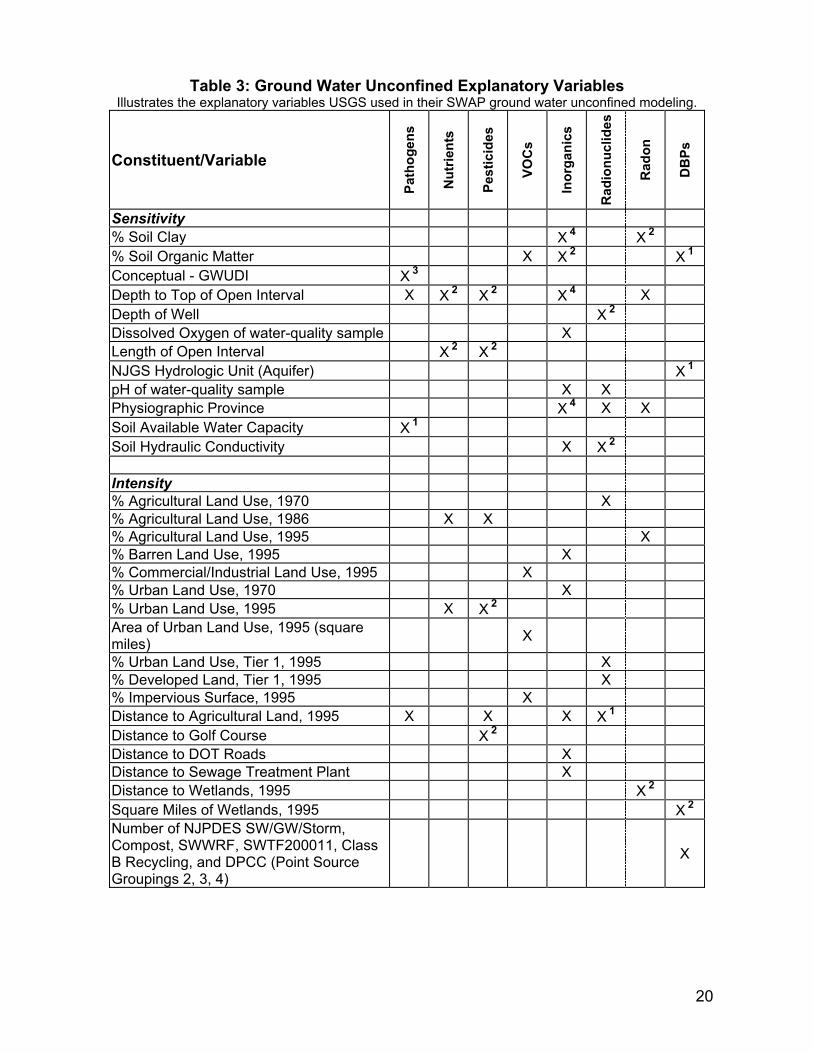
The susceptibility models determined source water susceptibility based on the well or intake’slocation and explanatory variables. An explanatory variable is a variable that can be used topredict the presence of a contaminant or the potential presence of a contaminant in groundwater or surface water. Tables 2, 3, and 4 illustrate the final explanatory variables used indetermining sensitivity and intensity ratings for surface water intakes, unconfined wells, andconfined wells. These tables also contain the conceptual variables used in the susceptibilityrating determinations. A conceptual variable is one that has been shown in a previousscientific investigation to be related to, or is expected to have an effect on, the concentrationsof a constituent. Conceptual variables that did not produce significant univariate statisticalrelations may however, produce a significant relation when used with other variables inmultivariate statistical tests.
A list of all contaminant variables reviewed can be found in the documentation Methods toDetermine the Susceptibility of Source Water to Community and Noncommunity WaterSupplies in New Jersey to Contamination, Appendix B- Attachment 4. For furtherinformation, Appendix B- Attachment 5 and 6, Contaminant Group Reports, provide detaileddescriptions of the models used for SWAP.
In addition to evaluating the contaminant variables separately, groupings of several pointsource variables together as a single explanatory variable were investigated to determine if acertain subset of point sources produced meaningful results. USGS determined thatalthough several types of point sources are not statistically significant individually, groupingthem as a unit could produce meaningful results. These combinations are known as “PointSource Groupings.”
Point Source Grouping 1: consists of sites on the Known Contaminated Site List and on theSolid Waste Landfill Site list. In general, these point sources are existing contaminationsources.
Point Source Grouping 2: consists of New Jersey Pollutant Discharge Elimination System forpermitted discharges to surface water, New Jersey Pollutant Discharge Elimination Systemstorm water discharges, and Compost Facilities. These point sources are potential surfacewater contamination problems.
Point Source Grouping 3: consists of New Jersey Pollutant Discharge Elimination Systemdischarges for ground water (NJPDES/DGW), Solid Waste Resource Recovery Facilities(RRF), Solid Waste Transfer Facilities (SWTF), and Class B Recycling Facilities. These pointsources are potential ground water contamination problems. The last three activities (RRF,SWTF, and Class B) are designed not to discharge contamination and degrade ground water.They do handle pollutants, and there is a potential to cause contamination. Thus, they areincluded in the inventory. Facilities that discharge via a NJPDES/DGW permit are given strictpermit limits. The discharge standards are typically at or below the ground water qualitystandards. While these activities are grouped for modeling purposes, the RRF, SWTF, andClass B Recycling Facilities do not appreciably affect the model, based on analysis by USGS.
Point Source Grouping 4: consists of sites regulated by the DEP Discharge Prevention andCountermeasures Plan regulations and Discharge Cleanup and Removal Plan regulations.These facilities store, transfer, process, or use hazardous substances and must specify and

18
submit information regarding prevention, containment and countermeasure plans anddischarge cleanup and removal plans.
Point Source Grouping 5: consists of regulated Underground Storage Tanks (USTs). USTswere treated as a separate point source grouping due to the large number of USTs in NewJersey, relative to the number of other types of potential point sources. There areapproximately 19,454 underground storage tank registrations in New Jersey, consisting ofactive and inactive tanks. USTs were treated separately so that the number of USTs wouldnot obscure possible statistical relations between susceptibility and other potentialcontaminant sources.
Point Source Grouping 6: consists of the entire Potential Contaminant Source Inventory ofpoint sources.
Several point source groupings were combined to determine whether or not these pointsource groupings had an effect on a source’s susceptibility. If a point source groupingcombination was found to be significant it was used as an explanatory variable in thesusceptibility models. The explanatory variables can be found in Tables 2, 3, and 4dependent on the type of drinking water source.

19
Table 2: Surface Water Explanatory VariablesIllustrates the explanatory variables USGS used in their SWAP surface water modeling.
Constituent/Variable
Path
ogen
s 1
Nut
rient
s
Pest
icid
es
VOC
s
Inor
gani
cs
Rad
ionu
clid
es 1
Rad
on 1
DB
Ps -
conc
eptu
al 2
Sensitivity% Soil Clay X% Soil Organic Matter X 2 X 2 X 2
PH of water-quality sample XPhysiographic Province X 2
Water Region X
Intensity% Agricultural Land Use, 1995 X% Commercial/Industrial Land Use,1995 X 2
% Developed Land, 1995 X 2
% Residential Land Use, 1995 X% Urban Land Use, 1995 X X XDistance to Agricultural Land, 1995 X X 2
Distance to Wetlands, 1995 X 2
Density of NJPDES SW/Storm,Compost Facilities (Point SourceGrouping 2)
X
Density of KCSL, SWL, NJPDESSW/Storm, Compost Facilities (PointSource Groupings 1,2)
X
Density of KCSL, SWL, NJPDESGW, SWRRF, SWTF200011, ClassB Recycling, DPCC, UST (PointSource Groupings 1, 3, 4, 5)
X
Sewage Treatment Plant Density XTotal Pesticide Application X
1 For the purpose of developing susceptibility models, a pathogen model was not developedbecause all surface water sources are considered highly susceptible to pathogens; aradionuclide model was not developed because radionuclides are not a concern in surfacewater.2 This conceptual variable shows a graphical relation to water-quality, improves the model,and is supported by scientific investigations.
20
Table 3: Ground Water Unconfined Explanatory VariablesIllustrates the explanatory variables USGS used in their SWAP ground water unconfined modeling.
Constituent/Variable
Path
ogen
s
Nut
rient
s
Pest
icid
es
VOC
s
Inor
gani
cs
Rad
ionu
clid
es
Rad
on
DB
Ps
Sensitivity% Soil Clay X 4 X 2
% Soil Organic Matter X X 2 X 1
Conceptual - GWUDI X 3
Depth to Top of Open Interval X X 2 X 2 X 4 XDepth of Well X 2
Dissolved Oxygen of water-quality sample XLength of Open Interval X 2 X 2
NJGS Hydrologic Unit (Aquifer) X 1
pH of water-quality sample X XPhysiographic Province X 4 X XSoil Available Water Capacity X 1
Soil Hydraulic Conductivity X X 2
Intensity% Agricultural Land Use, 1970 X% Agricultural Land Use, 1986 X X% Agricultural Land Use, 1995 X% Barren Land Use, 1995 X% Commercial/Industrial Land Use, 1995 X% Urban Land Use, 1970 X% Urban Land Use, 1995 X X 2
Area of Urban Land Use, 1995 (squaremiles) X
% Urban Land Use, Tier 1, 1995 X% Developed Land, Tier 1, 1995 X% Impervious Surface, 1995 XDistance to Agricultural Land, 1995 X X X X 1
Distance to Golf Course X 2
Distance to DOT Roads XDistance to Sewage Treatment Plant XDistance to Wetlands, 1995 X 2
Square Miles of Wetlands, 1995 X 2
Number of NJPDES SW/GW/Storm,Compost, SWWRF, SWTF200011, ClassB Recycling, and DPCC (Point SourceGroupings 2, 3, 4)
X

21
Table 3 continued
Constituent/Variable
Path
ogen
s
Nut
rient
s
Pest
icid
es -
conc
eptu
al 3
SOC
s 1
VOC
s
Inor
gani
cs
Rad
ionu
clid
es
Rad
on
DB
Ps
Density of KCSL, SWL, NJPDESGW/SW/Storm, Compost Facility,SWRRF, SWTF200011, Class BRecycling, DPCC, UST (Point SourceGroupings 1, 2, 3, 4, 5)
X
Density of SWL, UST, KCSL (Point SourceGroupings 1, 5) X
Population Density XPopulation Density, Tier 1 XSeptic Tank Density X 1
Septic Tank Density in Piedmont XSewage Treatment Plant Density XConceptual - Presence of Streams, Tier 1 X 3
Length of Railroads X
1 This conceptual variable shows a graphical relation, improves the model, and is supportedby scientific investigations.2 This conceptual variable shows a graphical relation to water quality and improves themodel.3 Statistical tests could not be used because the variable was unavailable for the data setused to develop the model.4 This factor is a conceptual variable and an explanatory variable for the contaminantcategory. As a result of the contaminant category consisting of several inorganics (arsenic,barium, beryllium, fluoride, lead, and mercury), the factor is used as a conceptual andstatistically significant variable. Percent soil clay is a conceptual variable (X 2) for lead andmercury, but a statistically significant explanatory variable for beryllium. For depth to top ofopen interval, the factor is conceptual (X 2) for fluoride and lead, and a statistically significantexplanatory variable for beryllium. Thirdly, physiographic province is a conceptual variable (X3) for mercury and a statistically significant explanatory variable for the arsenic, barium,beryllium, and fluoride models.

22
Table 4: Ground Water Confined Explanatory VariablesIllustrates the explanatory variables USGS used in their SWAP ground water modeling.
Constituent/Variable
Path
ogen
s
Nut
rient
s
Pest
icid
es
VOC
s
Inor
gani
cs
Rad
ionu
clid
es
Rad
on
DB
Ps
Sensitivity% Soil Organic MatterNJGS Hydrologic Unit (Aquifer) XGeologic Unit X X XpH of water-quality sample X
Intensity 1
1 Confined wells are not susceptible to intensity variables.
Susceptibility is the measurement of potential for a public water system to becomecontaminated. The susceptibility models developed by the USGS were applied to allcommunity water system sources and resulted in a high, medium, or low susceptibility ratingfor each source of water.
If a drinking water source’s susceptibility is high, it does not mean the water iscontaminated. High susceptibility is a vulnerability rating, not a factor determining whetheror not the water is or is not safe to drink. The rating reflects the potential for contamination ofsource water, not the existence of contamination. Public water systems are required tomonitor for regulated contaminants and to install treatment if any contaminants are detectedat frequencies and concentrations above allowable levels. Customers can refer to the watercompany’s Consumer Confidence Report (CCR) to determine if the drinking water is meetingall of the Safe Drinking Water Act regulatory requirements. The water utility may becontacted for additional water quality information.

23
DEP calculated the percentage of community water system sources in New Jersey that ratedhigh, medium, and low for each of the contaminant categories. Table 5 summarizes thesusceptibility rating information.
Table 5: Summary of Statewide Susceptibility Ratings for Community Water SystemSources (Percent %)
Path
ogen
s
Nut
rient
s
Pest
icid
es
VOC
s
Inor
gani
cs
Rad
ionu
clid
es
Rad
on
DB
Ps
GroundWater1
High 4 48 0 44 27 35 36 22Medium 40 22 23 0 38 45 38 76
Low 56 31 77 56 35 20 26 2SurfaceWater2
High 100 47 13 5 81 0 0 98Medium 0 42 34 81 19 0 0 2
Low 0 11 53 14 0 100 100 0 1 Community water systems wells in New Jersey in 2003 = 2237 2 Community water system surface water sources in New Jersey in 2003 = 64
USGS developed a rating scoring system for each susceptibility model. When each modelwas applied to a well or intake, a rating score was generated. This score was then convertedinto a susceptibility rating of high, medium, or low. For further information on thesusceptibility rating score scheme please refer to Appendix A- Attachment 3. The SafeDrinking Water Maximum Contaminant Levels (MCLs) were used to guide the divisionbetween the three susceptibility ratings. A low susceptibility rating means a potentialcontaminant level was predicted to be less than 10 percent of the MCL for that contaminant.A medium susceptibility rating was assigned where the potential contaminant level waspredicted to be equal to or greater than 10 percent and less than 50 percent of the MCL. Ahigh susceptibility rating was assigned where the potential contaminant level was equal to orgreater than 50 percent of the MCL. For the list of New Jersey primary and secondarydrinking water standards, containing the MCLs, please refer tohttp://www.state.nj.us/dep/watersupply/standard.htm.
In many cases, a public water system may have more than one well or intake, or acombination of wells and intakes. In cases of ground water or surface water only systems,the well or intake ratings were grouped together to represent the EPTDS rating. EachEPTDS received a susceptibility rating for radon and each of the seven contaminantcategories. The EPTDS rating was determined by weighing each source’s rating scoreaccording to the rate of withdrawal. Each weighted score was added, the sum was dividedby the number of drinking water sources, and the EPTDS score was classified as low,medium or high susceptibility. Appendix A- Attachment 4 provides an explanation of theEPTDS calculation.

24
Step 4: Public Participation and OutreachThe fourth step, public participation and outreach, is an essential component of the SWAP.The 1996 Amendments to the Federal Safe Drinking Water Act place a strong emphasis onpublic participation. To ensure the source water assessments are used for source waterprotection efforts, the public was involved from the beginning of the program.
The DEP used a variety of techniques to include the public in the program.
1. Created a Source Water Assessment Advisory Committee to provide input on thedraft and final SWAP Plan. The Source Water Assessment Advisory Committeecontinued to meet with the DEP regularly to discuss the status of the assessments andprovide suggestions during the development of the program. In addition, the SourceWater Assessment Advisory Committee provided advice concerning the source waterassessment summaries and reports.
2. Developed a SWAP newsletter, the “New Jersey Source Water Assessment News.”Issues of the “New Jersey Source Water Assessment News” may be found atwww.state.nj.us/dep/swap. The newsletter was sent to committee members, public watersystems, county health agencies, environmental organizations, municipalities, drinkingwater laboratories, and other interested parties. The New Jersey Source WaterAssessment News informed readers of the status of the SWAP, contact information,source water protection issues, and other related topics.
3. Published SWAP articles in several organizations’ newsletters. For example, articleswere published in the New Jersey Section of American Water Works Associationnewsletter “Pipeline” and the DEP Division of Watershed Management newsletter“Focus.”
4. Provided speakers for numerous SWAP presentations throughout the State. Thepresentations were regularly presented to water purveyors at New Jersey WaterAssociation training courses and other interested organizations such as the watershedmanagement area committees.
The DEP will continue its public outreach following the release of the source waterassessments. Public outreach activities will include training sessions for water purveyors,published SWAP articles, and correspondence with interested parties such as purveyors,municipalities, planning boards, and environmental commissions.

25
SECTION IV - GENERAL DESCRIPTION OF YOUR WATER SYSTEM

26
SECTION IV – DESCRIPTION OF WATER SYSTEM
City of Elizabeth Water Department O&M by Liberty Water CompanyPWID # 2004001
PO Box 778Westfield, NJ 07090(908)654-1234
City of Elizabeth Water Department O&M by Liberty Water Company is a public communitywater system consisting of
0 Entry Points to the Distribution System (EPTDS)0 wells0 wells under the influence of surface water0 surface water intake(s)1 purchased ground water3 purchased surface water
Table 6 below contains the municipalities and the population within each of thesemunicipalities served by City of Elizabeth Water Department O&M by Liberty WaterCompany.
Table 6: Municipalities and Population ServedMunicipality County Population Served - 2003Elizabeth City Union 120000

27
SECTION V - INVENTORY OF TREATMENT PLANTS AND DRINKING WATER SOURCES

28
SECTION V - SYSTEM INVENTORY FOR: City of Elizabeth Water Department O&M byLiberty Water Company
Table 7 provides the City of Elizabeth Water Department O&M by Liberty Water Company’streatment plant(s); source(s); the sources’ location(s); whether the source(s) are groundwater, surface water, or a purchased supply; and the sources’ capacity(s). The first columncontains the EPTDS ID and sources contributing to the same EPTDS are identified by thesame number. An EPTDS is the entry point to the distribution system, and for mostcommunity water systems this location is after the water is treated at a treatment plant.
In the case of a ground water source, the well’s confinement status and well permit numberare provided.
Table 7: Drinking Water Source and EPTDS Inventory
EPTD
S ID
Sour
ce ID
Sour
ce N
ame
Wat
er S
yste
mC
ompo
nent
*
Sour
ce S
tatu
s *
Sour
ce *
Sour
ceC
apac
ity (M
GD
)
Wel
l Per
mit
#
Con
finem
ent
Stat
us *
01 006 NEWARK WATER DEPT P P
02 014 ELIZABETHTOWN WC P P
03 018 NEWARK WATER DEPT. P E
05 023 ELIZABETHTOWN WATERCOMPANY W E
*KEYWater System Component
G = Ground Water, P = Purchased Surface Water, S = Surface Water, T = Treatment Plant (EPTDS), U =Ground Water Under The Direct Influence of Surface Water, W = Purchased Ground Water. For a completedefinition of each source of drinking water, please refer to the Glossary at the end of this report.
Confinement StatusC = Confined, U = Unconfined. For a definition of a confined and an unconfined aquifer please refer to theGlossary at the end of this report. K = Unknown, S = Semi-confined. For the purposes of SWAP both K and Swere treated as unconfined wells.
Source StatusC = Recharge, E = Emergency, I= Interim, O = Other, P= Permanent, R= Reserve, S= Seasonal, U = Not inUse/Capped, V = Abandoned/Not Capped, W = Not in Use/Unspecified, X = Not in Use/Mechanical, Y = Not inUse/Contaminated. For a complete definition of each well status category, please refer to the Glossary at theend of this report.
SourceFor ground water sources, the name of the aquifer is provided. For surface water sources, the name of thesurface water body on which the intake is located is given.
The City of Elizabeth Water Department O&M by Liberty Water Company contains 0 EPTDSas illustrated in Table 7 (identified by a “T” in the water system component column). Oftenpublic water systems treat source water at the EPTDS to ensure the drinking water provided

29
to the public meets Federal and State Drinking Water Standards. Please refer to AppendixA- Attachment 5 for information on the public water system’s treatment process.

30
SECTION VI - SUSCEPTIBILITY RATINGS FOR YOUR DRINKING WATER SOURCE(S)

31
SECTION VI – SUSCEPTIBILITY RATINGS FOR DRINKING WATER SOURCE(S)
Table 8 provides a summary of the susceptibility ratings for the system’s source(s). Thesource column of the table provides the number of ground water and surface water sourcesand the number of ground water under the direct influence of surface water (GUDI) wells inthe system. The other columns provide the total number of source(s) that rated high (H),medium (M), and low (L) for each of the contaminant categories.
Table 8: Summary of Susceptibility Ratings for Drinking Water Source(s)
Path
ogen
s
Nut
rient
s
Pest
icid
es
VOC
s
Inor
gani
cs
Rad
ionu
clid
es
Rad
on
DB
Ps
Sources H M L H M L H M L H M L H M L H M L H M L H M L
Wells - 0
GUDI - 0
Surface waterintakes - 0
To review a summary of how the other public water systems in the State of New Jersey rated,please refer to Table 5, “Summary of Statewide Susceptibility Ratings for Community WaterSystem Sources (Percent %)” in Section III of the Source Water Assessment Report.
If a drinking water source’s susceptibility is high, it does not necessarily mean thewater is contaminated. High susceptibility is a vulnerability rating, not a factor determiningwhether or not the water is or is not meeting State and Federal Safe Drinking WaterStandards. The rating reflects the potential for contamination of source water, not theexistence of contamination. Public water systems are required to monitor for regulatedcontaminants and to install treatment if any contaminants are detected at frequencies andconcentrations above allowable levels. Please refer to the Consumer Confidence Report(CCR) to determine if the drinking water is meeting all of the Safe Drinking Water Actregulatory requirements.

32
Table 9 illustrates the susceptibility rating for each individual source for each of thecontaminant categories.
Table 9: Susceptibility Rating for Drinking Water Source(s)Contaminant Category
EPTD
S ID
Sour
ce ID
Sour
ce N
ame
Path
ogen
s
Nut
rient
s
Pest
icid
es
VOC
s
Inor
gani
cs
Rad
ionu
clid
esR
adon
DB
Ps
Rating Rating Rating Rating Rating Rating Rating
City of Elizabeth Water Department O&M by Liberty Water Company purchases all of itsdrinking water. As a result Table 9 can not be completed since this system does not operateany wells or intakes. Please refer to Table 7 in this report for details on which system(s) Cityof Elizabeth Water Department O&M by Liberty Water Company purchases its drinking waterfrom.
The potential contaminant source inventory and sensitivity variables were used to determinethe susceptibility ratings for the sources. For specific information on the water system’spotential contaminant source inventory and sensitivity variables, please refer to the IndividualExplanatory Variable Inventory and the Specific Potential Contaminant Sources Inventory,Appendix A- Attachment 1 and 2.

33
SECTION VII - SUSCEPTIBILITY RATINGS FOR YOUR ENTRY POINT TO THEDISTRIBUTION SYSTEM (EPTDS)
SECTION VII – SUSCEPTIBILITY RATINGS FOR ENTRY POINT TO THE DISTRIBUTIONSYSTEM (EPTDS)
The City of Elizabeth Water Department O&M by Liberty Water Company contains 0 EPTDS.The EPTDS and the susceptibility rating for radon and each of the seven-contaminantcategories are provided in Table 11. A susceptibility rating was developed for each EPTDSbecause this rating represents the water that is treated and delivered to the consumer. Amajority of the monitoring regulations are established for the point at which the water exits thewater treatment facility, therefore the EPTDS susceptibility rating is important in determiningthe monitoring requirements.
The EPTDS rating was calculated by the following method. The source contribution resultedfrom multiplying the pumping rate for each water source by each source’s susceptibility score(a point value based on the contaminant category scoring system found in Appendix A –Attachment 3). In cases where the pumping rate was not available, the pumping capacitywas used. Next, all source contributions were summed and divided by the total capacity(sum of all the pumping rates and/or capacities) for the EPTDS.
KeySource Capacity: the source capacity used for determining EPTDS ratings wrate used by New Jersey Geological Survey to create the source water asserate was not available, the pumping capacity or a default value was used. Thdescribed in the New Jersey Geological Survey’s “Guidance for Well Head PNew Jersey”, Appendix B- Attachment 1.
Source Contribution: the value calculated by multiplying the source’s pumpsusceptibility score rating. The susceptibility score rating is the point value bcategory scoring system, which can be found in Appendix A – Attachment 3.
Source Susceptibility Score Rating: to obtain a high, medium, or low susca susceptibility scoring system for each contaminant category (pathogens, Vradionuclides, disinfection byproduct precursors, and pesticides). Each contpoint system based on the susceptibility model. For example a susceptibilitycould be 0-5 = low susceptibility, 6-10 = medium susceptibility, and 11-20 = hAppendices A- Attachment 3 for the susceptibility scoring system USGS useratings.
Total Capacity: is the full amount of water the sources are contributing to thrates/capacities are summed to determine the total capacity for the EPTDS.
For groundwater sources, only permanent, seasonal, and interimEPTDS rating calculation. Other wells such as emergency, reserincluded in the source to EPTDS “roll-up”, but these wells were ra
∑ Source Contributions (Source Capacity x Source SusceptibilityScore Rating)
Total Capacity (∑ of all source capacities to the EPTDS)
= EPTDS Susceptibility Score
34
as the same as the pumpingssment areas. If the pumpinge pumping rate selection isrotection Area Delineations in
ing rate by the source’sased on the contaminant
eptibility rating, USGS developedOCs, inorganics, nutrients,aminant category has its own score range for a contaminantigh susceptibility. See
d to determine the susceptibility
e EPTDS. The pumping
wells were used in theve, and not-in-use, were notted on a source basis.

35
For public water systems that consist of a combination of well(s) and intake(s), the EPTDSreceived a ground water EPTDS rating and a surface water EPTDS rating. Even incircumstances where the surface water is blended with ground water, the EPTDS receivedtwo separate susceptibility ratings. A separate ETPDS rating is provided for the ground waterand the surface water because separate susceptibility models were developed for groundand surface water. Ground water and surface water susceptibility models differ insusceptibility rating score, therefore, the rating results are not on the same scale.
If a facility has only one well or intake contributing to the EPTDS, that EPTDS received thesame rating as the well or intake. DEP used the equation below to determine an EPTDSsusceptibility rating.
Table 10 provides an example of how the EPTDS ratings were calculated. To review how theEPTDS ratings were calculated for the City of Elizabeth Water Department O&M by LibertyWater Company, please refer to Appendix A- Attachment 4.
Table 10: Example of an EPTDS Susceptibility Rating CalculationEPTDS 01
Source Capacity (MGD)Source Susceptibility
Score Rating(0-20, low to high)
Total = SourceContribution
Well 1 1.09 20 (1.09*20) = 21.8Well 2 1.72 10 17.2Well 3 0.72 5 3.6Well 4 1.48 10 14.8Well 5 0.75 20 15.0
Total Capacity 5.76 72.4EPTDS Susceptibility Score is 72.4 / 5.76 = 12.6
For the above example, the sum of the source contributions for EPTDS 01 (72.4) is dividedby the total capacity from all sources (5.76) giving a susceptibility score for the EPTDS of12.6. The original range for rating sources was 0-5 low, 6-10 medium, 11-20 high. EPTDS01 susceptibility rating was 12.6; therefore the EPTDS would receive a high rating.

36
Table 11 lists the susceptibility ratings for each EPTDS for the City of Elizabeth WaterDepartment O&M by Liberty Water Company.
Table 11: Susceptibility Rating for EPTDSContaminant Category
EPTD
S ID
EPTD
S N
ame
Path
ogen
s
Nut
rient
s
Pest
icid
es
VOC
s
Inor
gani
cs
Rad
ionu
clid
es
Rad
on
DB
Ps
Rating Rating Rating Rating Rating Rating Rating
City of Elizabeth Water Department O&M by Liberty Water Company purchases all of itsdrinking water. As a result Table 11 can not be completed since this system does notoperate any EPTDS. Please refer to Table 7 in this report for details on which system(s) Cityof Elizabeth Water Department O&M by Liberty Water Company purchases its drinking waterfrom.