
City of El Centro Active Transportation & Safe Routes to ...


1 9 9 S O U T H L O S R O B L E S A V E N U E • S U I T E 5 3 0 • P A S A D E N A , C A L I F O R N I A 9 1 1 0 1 • ( 6 2 6 ) 5 3 5 - 0 1 8 0 • F A X ( 6 2 6 ) 5 3 5 - 0 1 8 5 H:\client\City_ElCentro_PAS\04 Reports\04.2 Final\04.2d Final to Client\TOC El Centro WMP.doc
City of El Centro WATER SYSTEM MASTER PLAN FINAL February 2008

FINAL - February 13, 2008 i H:\client\City_ElCentro_PAS\04 Reports\04.2 Final\04.2d Final to Client\TOC El Centro WMP.doc
CITY OF EL CENTRO
WATER SYSTEM MASTER PLAN
TABLE OF CONTENTS
Page No.
CHAPTER 1 - INTRODUCTION.......................................................................................1-1
1.1 Authorization.........................................................................................................1-1 1.2 Purpose and Objectives ........................................................................................1-1 1.3 Background...........................................................................................................1-1 1.4 Scope of Work ......................................................................................................1-1 1.5 Acknowledgements...............................................................................................1-3 1.6 Project Staff ..........................................................................................................1-3 1.7 Report Organization..............................................................................................1-3 1.8 Abbreviations ........................................................................................................1-5
CHAPTER 2 - STUDY AREA, LAND USE, POPULATION, AND DEMANDS .................2-1
2.1 Study Area............................................................................................................2-1 2.2 Climate .................................................................................................................2-1 2.3 Land Use ..............................................................................................................2-2
2.3.1 Land Use Definitions .................................................................................2-2 2.3.2 Land Use Area ..........................................................................................2-5 2.3.3 Phasing of Developments..........................................................................2-6
2.4 Population...........................................................................................................2-10 2.5 Existing Water Demand ......................................................................................2-13
2.5.1 Historical Water Demands....................................................................... 2-13 2.5.2 Historical Water Production ..................................................................... 2-14 2.5.3 Water Loss .............................................................................................. 2-15 2.5.4 Peaking Factors ...................................................................................... 2-15
2.6 Future Water Demand ........................................................................................2-16 2.6.1 Water Demand Factors ........................................................................... 2-16 2.6.2 Water Demand Projections...................................................................... 2-17 2.6.3 Phasing of Water Demand ...................................................................... 2-20
CHAPTER 3 - EXISTING WATER SYSTEM....................................................................3-1
3.1 Pressure Zones ....................................................................................................3-1 3.2 Distribution System...............................................................................................3-1
3.2.1 Pipeline Diameter Distribution ...................................................................3-3 3.2.2 Pipeline Age Distribution ...........................................................................3-3 3.2.3 Pipeline Material Distribution .....................................................................3-3
3.3 Storage Facilities ..................................................................................................3-6 3.4 bOOSTER StaTIONS ...........................................................................................3-7 3.5 sUPPLIES.............................................................................................................3-7
3.5.1 Water Rights .............................................................................................3-8 3.5.2 Water Treatment Plant ..............................................................................3-8
3.6 Inter-Agency Connections.....................................................................................3-8

FINAL - February 13, 2008 ii H:\client\City_ElCentro_PAS\04 Reports\04.2 Final\04.2d Final to Client\TOC El Centro WMP.doc
CHAPTER 4 - PLANNING AND EVALUATION CRITERIA .............................................4-1
4.1 Evaluation Criteria Summary ................................................................................4-1 4.2 System Pressure...................................................................................................4-3 4.3 Pipeline Velocity and Headloss .............................................................................4-3 4.4 Storage Requirements ..........................................................................................4-3
4.4.1 Operational Storage ..................................................................................4-4 4.4.2 Fire Flow Storage ......................................................................................4-4 4.4.3 Emergency Storage...................................................................................4-4
4.5 Fire Flow Requirements........................................................................................4-5 4.6 Supply Requirements............................................................................................4-5
4.6.1 Largest Source Out of Service...................................................................4-5 4.6.2 Power Outage ...........................................................................................4-5 4.6.3 Earthquake................................................................................................4-8 4.6.4 Pipeline Breaks .........................................................................................4-8
4.7 Booster Station Requirements ..............................................................................4-8 4.8 Distribution System...............................................................................................4-9
4.8.1 Pipeline Diameters ....................................................................................4-9 4.8.2 Roughness Coefficients........................................................................... 4-10 4.8.3 Age Replacements .................................................................................. 4-10
CHAPTER 5 - MODEL DEVELOPMENT .........................................................................5-1
5.1 Model Creation .....................................................................................................5-1 5.1.1 Software Selection ....................................................................................5-1 5.1.2 Data Collection and Validation...................................................................5-2 5.1.3 Skeletonizing GIS Data .............................................................................5-2 5.1.4 Network Configuration...............................................................................5-3 5.1.5 Facility Configuration.................................................................................5-6 5.1.6 Elevation Allocation ...................................................................................5-8 5.1.7 Demand Allocation ....................................................................................5-8 5.1.8 System Controls ........................................................................................5-9
5.2 Model Calibration ................................................................................................5-10 5.2.1 Fire Flow Testing..................................................................................... 5-10 5.2.2 Calibration Set-up.................................................................................... 5-11 5.2.3 Calibration Results .................................................................................. 5-13
CHAPTER 6 - EXISTING SYSTEM ANALYSIS ...............................................................6-1
6.1 System Pressures.................................................................................................6-1 6.1.1 Pressures with PHD ..................................................................................6-1 6.1.2 Pressures with MinDD...............................................................................6-2 6.1.3 Pressures with MDD Plus Fire Flow ..........................................................6-2
6.2 Velocity and Headloss ..........................................................................................6-5 6.3 Storage Capacity Evaluation.................................................................................6-9 6.4 Pump Station Capacity Evaluation ......................................................................6-10 6.5 Water Supply Evaluation.....................................................................................6-11
6.5.1 Largest Source Out of Service................................................................. 6-11 6.5.2 Power Outage ......................................................................................... 6-13 6.5.3 Earthquake.............................................................................................. 6-14
6.6 Transmission Main Breaks..................................................................................6-15

FINAL - February 13, 2008 iii H:\client\City_ElCentro_PAS\04 Reports\04.2 Final\04.2d Final to Client\TOC El Centro WMP.doc
6.7 Age Replacements..............................................................................................6-19 6.8 Summary of Recommendations ..........................................................................6-19
CHAPTER 7 - FUTURE SYSTEM ANALYSIS .................................................................7-1
7.1 System Pressures.................................................................................................7-3 7.1.1 Pressures with PHD ..................................................................................7-3 7.1.2 Pressures with MinDD...............................................................................7-6 7.1.3 Pressures with MDD Plus Fire Flow ..........................................................7-6
7.2 Velocity and Headloss ..........................................................................................7-8 7.3 Storage Capacity Evaluation.................................................................................7-8
7.3.1 2015 ..........................................................................................................7-9 7.3.2 Build-Out ...................................................................................................7-9
7.4 Pump Station Capacity Evaluation ......................................................................7-11 7.4.1 2015 ........................................................................................................ 7-11 7.4.2 Build-Out ................................................................................................. 7-11
7.5 Water Supply Evaluation.....................................................................................7-13 7.5.1 Largest Source Out of Service................................................................. 7-14 7.5.2 Power Outage ......................................................................................... 7-17 7.5.3 Earthquake.............................................................................................. 7-19
7.6 Summary of Recommendations ..........................................................................7-20
CHAPTER 8 - CAPITAL IMPROVEMENT PROGRAM....................................................8-1
8.1 Cost Estimating.....................................................................................................8-1 8.1.1 Level of Accuracy ......................................................................................8-1 8.1.2 Contingencies ...........................................................................................8-2 8.1.3 Unit Construction Cost...............................................................................8-2
8.2 Summary of Improvements ...................................................................................8-3 8.3 Phasing of Improvements .....................................................................................8-5 8.4 Cost Estimates......................................................................................................8-6 APPENDIX A References APPENDIX B Reference Tables APPENDIX C Calibration Tables
LIST OF TABLES Table 2.1 Climate......................................................................................................2-1 Table 2.2 Land Use Summary...................................................................................2-6 Table 2.3 Phasing of Land Developments............................................................... 2-10 Table 2.4 Population Density and Projection at Build-Out ....................................... 2-12 Table 2.5 Population Phasing ................................................................................. 2-12 Table 2.6 Existing Demand by Land Use ................................................................ 2-13 Table 2.7 Historical Water Production ..................................................................... 2-14 Table 2.8 Peaking Factor Summary ........................................................................ 2-16 Table 2.9 Water Demand Factors ........................................................................... 2-17 Table 2.10 Demand Projections – Infill Development ................................................ 2-17 Table 2.11 Demand Projections – SOI Growth.......................................................... 2-18

FINAL - February 13, 2008 iv H:\client\City_ElCentro_PAS\04 Reports\04.2 Final\04.2d Final to Client\TOC El Centro WMP.doc
Table 2.12 Demand Projections – Summary ............................................................. 2-19 Table 2.13 Current and Projected Water Demands................................................... 2-20 Table 3.1 Water Distribution System Summary .........................................................3-1 Table 3.2 Pipeline Diameter Distribution ...................................................................3-3 Table 3.3 Pipeline Diameter Distribution by Age .......................................................3-3 Table 3.4 Total Water Storage Capacity....................................................................3-6 Table 3.5 Booster Stations Summary........................................................................3-7 Table 4.1 Evaluation Criteria .....................................................................................4-1 Table 4.2 Standard Pipeline Sizes ............................................................................4-9 Table 5.1 Pipeline Diameter Distribution ...................................................................5-5 Table 5.2 C-Factor Allocation....................................................................................5-5 Table 5.3 Storage Reservoir Characteristics .............................................................5-7 Table 5.4 Booster Station Characteristics .................................................................5-7 Table 5.5 Demand Allocation ....................................................................................5-9 Table 5.6 System Controls ........................................................................................5-9 Table 5.7 Model Calibration Results - Static and Dynamic Pressures ..................... 5-15 Table 6.1 Fire Flow Improvements ............................................................................6-6 Table 6.2 Storage Capacity Evaluation .....................................................................6-9 Table 6.3 Pump Station Capacity Evaluation........................................................... 6-10 Table 6.4 Water Supply Evaluation ......................................................................... 6-12 Table 6.5 Pipeline Breaks ....................................................................................... 6-17 Table 6.6 Pipe Age Replacement............................................................................ 6-19 Table 7.1 Future System Demands...........................................................................7-1 Table 7.2 Storage Evaluation ....................................................................................7-8 Table 7.3 Pump Station Capacity Evaluation - 2015................................................ 7-11 Table 7.4 Pump Station Capacity Evaluation - Build-Out......................................... 7-12 Table 7.5 Water Supply Evaluation – 2015 Conditions............................................ 7-15 Table 7.6 Water Supply Evaluation – Build-Out Conditions..................................... 7-16 Table 8.1 Unit Construction Costs – Mark-ups ..........................................................8-2 Table 8.2 Unit Construction Costs – Water System Improvements ...........................8-3 Table 8.3 Summary of System Improvements...........................................................8-4 Table 8.4 Water System CIP Summary - by Facility ..................................................8-7 Table 8.5 Water System CIP Summary - by User Type.............................................8-9 Table 8.6 Detailed Capital Improvement Program................................................... 8-11
LIST OF FIGURES
Figure 1.1 Study Area ................................................................................................1-2 Figure 2.1 General Plan Land Use .............................................................................2-3 Figure 2.2 Existing Developments and Vacant Areas.................................................2-7 Figure 2.3 General Plan Tiers ....................................................................................2-8 Figure 2.4 Phasing of Developments........................................................................ 2-11 Figure 3.1 Existing Water Distribution System............................................................3-2 Figure 3.2 Pipeline Diameter Distribution ...................................................................3-4 Figure 3.3 Pipeline Distribution by Material ................................................................3-5 Figure 4.1 Distribution of Fire Flow Requirements......................................................4-7 Figure 5.1 Screen Capture of Hydraulic Model ...........................................................5-4 Figure 5.2 Locations of Fire Hydrant Test Sites....................................................... 5-12 Figure 6.1 Pressures under PHD Conditions..............................................................6-3 Figure 6.2 Pressures under MinDD Conditions...........................................................6-4

FINAL - February 13, 2008 v H:\client\City_ElCentro_PAS\04 Reports\04.2 Final\04.2d Final to Client\TOC El Centro WMP.doc
Figure 6.3 Pressures under MDD plus Fire Flow Conditions ......................................6-8 Figure 6.4 Potential Storage Sites and Pipe Break Analysis..................................... 6-16 Figure 7.1 Future Distribution System Network ..........................................................7-2 Figure 7.2 System Pressures under Build-Out PHD Conditions without New PS Facilities ..........................................................................7-4 Figure 7.3 System Pressures under Build-Out PHD Conditions with New PS Facilities ...............................................................................7-5 Figure 7.4 System Pressures under Build-Out MinDD Conditions with New PS Facilities ...............................................................................7-7 Figure 7.5 Recommended Future System Pipelines and Facilities ........................... 7-10 Figure 8.1 Phasing of Recommendations...................................................................8-8 Figure 8.2 Distribution of Capital Cost ...................................................................... 8-10

FINAL - February 13, 2008 1-1 H:\client\City_ElCentro_PAS\04 Reports\04.2 Final\04.2d Final to Client\Ch01.doc
Chapter 1
INTRODUCTION
This chapter presents the purpose, objectives, background, and scope of work for this Water Master Plan (WMP). A list of abbreviations is also provided to assist the reader in understanding the information presented. A list of references used in the preparation of this report is included in Appendix A.
1.1 AUTHORIZATION
This report is prepared in accordance with the consulting engineers agreement between the City of El Centro (City) and Carollo Engineers, P.C. (Carollo) dated October 18, 2006. The agreement covers three separate master plans: this WMP, a Sewer Master Plan, and a Strom Drainage Master Plan. This report presents the findings of the WMP. The Sewer Master Plan, and Storm Drain Master Plan are presented in separate reports.
1.2 PURPOSE AND OBJECTIVES
The purpose of this WMP is to aid the City in the planning, development, and financing of water system facilities to provide reliable and enhanced service for existing customers, and to serve anticipated growth. This WMP considers existing conditions as well as future build out conditions presented in the City’s General Plan [1]. Where available, specific development plans have been considered. Build out includes expansion of the City limits within the existing Sphere of Influence (SOI).
1.3 BACKGROUND
The City owns and operates the water treatment system within the existing City limits. The previous Water System Master Plan was completed in 2004. The 2004 Plan was based on planning assumptions and operational conditions that have since changed, requiring this update.
In February 2004, the City Council adopted an update to the General Plan. Land use assumptions used in this study are consistent with the General Plan update and describe existing and projected future development within the study area. The existing SOI and City limits are shown on Figure 1.1.
1.4 SCOPE OF WORK
The preparation of this water system master plan included the following tasks:
• Establish water system evaluation and planning criteria.
• Create and calibrate a hydraulic model of the City’s water system.

A³
A³
!"_$ !"_$
AÌ
AÌ
Aten Rd
Au
stin R
d
Cruickshank Rd
Evan Hewes Hwy
Ross Rd
Danenberg Rd
McCabe Rd
Treshill Rd
Villa Rd
Orange Ave
La B
ruch
erie Rd
Clark R
d
Do
gw
oo
d R
d
Co
oley R
d
Fo
urth
St
City ofImperial
FIGURE 1.1STUDY AREA
WATER MASTER PLANCITY OF EL CENTRO
0 3,500 7,000Feet
�
Legend
Sphere of Influence
City Limits

FINAL - February 13, 2008 1-3 H:\client\City_ElCentro_PAS\04 Reports\04.2 Final\04.2d Final to Client\Ch01.doc
• Analyze existing use patterns, and based on these, project future demands.
• Evaluate the capacity of the existing water distribution system using the hydraulic model.
• Summarize existing system deficiencies and propose improvements to address these deficiencies.
• Recommend improvements needed to service anticipated future growth for build out conditions.
• Develop a staged Capital Improvement Program (CIP) with a planning horizon of 2015.
The study includes several planning assumptions that are documented in this report. Should future planning conditions deviate from the assumptions stated in this master plan, such as accelerated growth or more intense developments, this master plan would need to be reviewed and possibly revised. This update should be done before changes in growth are approved.
1.5 ACKNOWLEDGEMENTS
Carollo Engineers wishes to acknowledge and thank all of the City’s staff for their support and assistance in completing this project. Special thanks go to Paul Steward (water plant supervisor), Randy Hines (wastewater treatment plant supervisor), and Carl Fowler (maintenance supervisor).
1.6 PROJECT STAFF
The following Carollo Engineers staff members were principally involved in this project:
Dennis Wood, P.E. Partner-In-Charge
Donn Wilcox, P.E. Project Manager
Inge Wiersema, P.E. Project Engineer
Beth Winton Staff Engineer
Debra Dunn GIS/Graphics
ID Modeling Hydraulic Model Creation and Calibration
1.7 REPORT ORGANIZATION
The Water System Master Plan report contains eight chapters, followed by appendices that provide supporting documentation fro the information presented in the report. The chapters are briefly described below:

FINAL - February 13, 2008 1-4 H:\client\City_ElCentro_PAS\04 Reports\04.2 Final\04.2d Final to Client\Ch01.doc
Chapter 1 – Introduction . This chapter presents the need for this Water System Master Plan and the objectives of the study. A list of abbreviations is also provided to assist the reader in understanding the information presented.
Chapter 2 – Study Area, Land Use, Population, and Demands . This chapter presents a discussion of this study’s planning area, land use classifications and designations, population trends, existing demand, and future demand. The City’s future water demands were projected using the land use designations.
Chapter 3 – Existing Water System . This chapter presents an overview of the City’s distribution system, water supply, and storage facilities.
Chapter 4 – Planning and Evaluation Criteria . This chapter presents the planning criteria and methodologies for analysis used to evaluate the existing distribution system and its facilities and to address the existing system deficiencies and future improvements. The developed criteria address the water supply capacity, storage capacity, acceptable service pressures, fire flow requirements, and distribution main performance.
Chapter 5 – Model Development . This chapter describes the development and calibration of the city’s water distribution hydraulic model. This model was used for identifying existing system deficiencies and for recommending improvements as discussed in Chapter 6.
Chapter 6 – Existing System Analysis . This chapter presents the results of the capacity evaluation of the water supply, distribution, and storage facilities. The chapter also presents improvements to mitigate existing system deficiencies and for servicing future growth. These improvements are recommended based on the system’s technical requirements, cost effectiveness, and operational reliability.
Chapter 7 – Future System Analysis This chapter presents the results of the capacity evaluation of the water supply, distribution, and storage facilities under 2015 and build out conditions. The chapter also presents recommendations to prepare for servicing future growth. These improvements are recommended based on the system’s technical requirements, cost effectiveness, and operational reliability.
Chapter 8 – Capital Improvement Plan. This chapter presents the recommended CIP for the City’s water distribution system. The program is based on the evaluation of the City’s water distribution system, and on the recommended projects described in the previous chapters. The CIP has been prepared to assist the City in planning and constructing the water system improvements through the year 2015 and to build out.

FINAL - February 13, 2008 1-5 H:\client\City_ElCentro_PAS\04 Reports\04.2 Final\04.2d Final to Client\Ch01.doc
1.8 ABBREVIATIONS Abbreviation Description oF Fahrenheit
Ac-ft/yr Acre-feet per year
AFY/ac Acre-feet per year per acre
ADD Average Day Demand
ADP Average Day Production
AWWA American Water Works Association
BO Build Out
Carollo Carollo Engineers
Ci Civic
CIP Capital Improvement Program
City City of El Centro
DC Downtown Commercial
du/ac Dwelling unit per gross acre
FAR Floor to area ratio
fps Feet per second
ft Feet
ft/kft Feet per thousand feet
GC General Commercial
GI General Industrial
GIS Geographical Information Systems
gpd/ac Gallons per acre per day
gpd/cap Gallons per capita per day
gpm Gallons per minute
HC Heavy Commercial
HDR High-Medium Density Residential
hp Horse power
IID Imperial Irrigation District
IND Industrial
LDR Low Density Residential
MDD Maximum Day Demand
MDP Maximum Day Production
MDR Medium Density Residential

FINAL - February 13, 2008 1-6 H:\client\City_ElCentro_PAS\04 Reports\04.2 Final\04.2d Final to Client\Ch01.doc
Abbreviation Description
MG Million gallons
mgd Million gallons per day
MinDD Minimum Day Demand
msl Mean sea level
NE Northeastern
NW Northwestern
PF Public Facility
PHD Peak Hour Demand
PI Planned Industrial
PRV Pressure reducing valve
PS Pump station
psi Pounds per square inch
PSV Pressure sustaining valve
RR Rural Residential
RTP Regional Transportation Plan
SCAG Southern California Association of Governments
SE Southeastern
SOI Sphere of Influence
TC Tourist Commercial
TDH Total discharge head
TDS Total dissolved solids
UWMP Urban Water Master Plan
VFD Variable Frequency Drive
WDF Water Demand Factor
WMP Water Master Plan
WTP Water Treatment Plant

FINAL - February 13, 2008 2-1 H:\client\City_ElCentro_PAS\04 Reports\04.2 Final\04.2d Final to Client\Ch02.doc
Chapter 2
STUDY AREA, LAND USE, POPULATION, AND DEMANDS
This chapter presents a discussion of this study’s planning area characteristics, the land use classifications, and the historical population trends. Subsequently, the historical, existing, and future water demands are discussed. This Water Master Plan Study (WMP) includes demand projections for year 2015 and build-out conditions.
2.1 STUDY AREA
The City of El Centro (City) is located in Imperial County, California. The City is situated 117 miles east of San Diego, 245 miles west of Phoenix, Arizona, and just 10 miles north of the Mexico border. El Centro is accessible via State Highways 86 and 111, and Interstate 8. The City’s service area is approximately 6,850 acres or 11 square miles.
The City’s boundary and Sphere of Influence (SOI) were shown previously on Figure 1.1. The SOI includes areas that are currently under the jurisdiction of Imperial County but are anticipated to be incorporated in the City some time in the future. The total area of the SOI outside the City boundary is approximately 16,000 acres or 25 square miles.
2.2 CLIMATE
The City’s climate consists of hot, dry summers and cool winters, with most of the annual precipitation occurring between August and February. The average annual temperature is 72.6 degrees Fahrenheit (°F), with an average maximum of 88.5 °F and an average minimum of 55.7 °F. It is not unusual for summer readings to reach 115 °F. With an average rainfall of less than 3 inches per year, El Centro is characterized by a dry and hot climate. The average rainfall and temperature per month is presented in Table 2.1.
Table 2.1 Climate Water System Master Plan City of El Centro
Month Average Rainfall (inches)
Average Temperature (°F)
January 0.53 55.0
February 0.37 59.0
March 0.26 63.7
April 0.08 69.7
May 0.03 77.1
June 0.01 85.4
July 0.07 91.5

FINAL - February 13, 2008 2-2 H:\client\City_ElCentro_PAS\04 Reports\04.2 Final\04.2d Final to Client\Ch02.doc
Table 2.1 Climate Water System Master Plan City of El Centro
Month Average Rainfall (inches)
Average Temperature (°F)
August 0.34 91.1
September 0.33 85.8
October 0.32 75.1
November 0.23 62.8
December 0.42 54.9
Annual Average 2.99 72.6
Notes: (1) Source: Western Regional Climate Center website [2].
2.3 LAND USE
The land use area for this study was derived from the Geographical Information System (GIS) parcel map provided by Nobel Systems [3]. The following sections define the land use categories and summarize the land use breakdown by area used in this study. A map of the general plan land use is shown on Figure 2.1.
It is important to note that the land use breakdown in the 2004 General Plan [1] is not used in this report, because the General Plan only provides total acreage by land use and does not provide a geospatial land use distribution map.
A table that summarizes the total acreage for each land use category as listed in the General Plan can be found in Appendix B as a reference. There are slight differences between the GIS and General Plan land use distributions, which could be attributed to digitization and rounding discrepancies.
2.3.1 Land Use Definitions
The General Plan identifies 15 different land use classifications for the City. These classifications are discussed in more detail below.
1. Rural Residential (RR): The RR land use category is defined as single-family detached dwelling units with small agricultural operations. The maximum allowable density for this land use type is 2.0 dwellings per gross acre (du/ac) and the average density is 1.0 du/ac.
2. Low Density Residential (LDR): The LDR land use category is mainly a single-family residential designation. The maximum allowable density for this land use type is 6.0 du/ac and the average density is 4.5 du/ac.

A³
A³
!"_$ !"_$
AÌ
AÌ
Aten Rd
Au
stin R
d
Cruickshank Rd
Evan Hewes Hwy
Ross Rd
Danenberg Rd
McCabe Rd
Treshill Rd
Villa Rd
Orange Ave
La B
ruch
erie Rd
Clark R
d
Do
gw
oo
d R
d
Co
oley R
d
Fo
urth
St
City ofImperial
GC (1)
GC (1)
LDR
LDR
LDR
PI
LDR
LDR
GI
PF
PI
PI
GI
PI
TCGC
PF
PF
LDR
PFGC
RR
GI
PF
RR
PF
GC
PF
RRGC
RR
PF
GIPF
PF
GI
MDR
GI
RR
TC
HMDR
GC
GC
LDR
GC
PF
HMDR
MDR
PF
GCPF
MDR
PF
RR
PFPI
PF
LDR
HMDR
MDR
PF
TC
TC
RR
LDR
CF
GC
LDR
LDR
LDR
HMDRHMDR
TC
LDR
LDR
MDR
FIGURE 2.1GENERAL PLAN LAND USE
WATER MASTER PLANCITY OF EL CENTRO
0 3,500 7,000Feet
�
Legend
Roads
Sphere of Influence
City Limits
Land Use
Residential
Rural (RR)
Low Density (LDR)
Medium Denstiy (MDR)
High-Medium Density (HMDR)
Commercial
General (GC)
Downtown (DC)
Tourist (TC)
Industrial
General (GI)
Planned (PI)
Facilities
Public (PF)
Civic (CF)
(1) Revsion per General Plan overlay 2001

FINAL - February 13, 2008 2-4 H:\client\City_ElCentro_PAS\04 Reports\04.2 Final\04.2d Final to Client\Ch02.doc
3. Medium Density Residential (MDR): The MDR land use category promotes a mixture of single-family or multiple-family houses, duplexes, and mobile home parks. This designation is designed to provide a transition from higher density, multi-family, and commercial development to LDR neighborhoods. Allowable densities range from 6.1 to 12.0 du/ac, with an average of 8.5 du/ac.
4. High-Medium Density Residential (HDR): The HDR land use category allows for residential uses such as apartments and multi-family buildings, with allowable densities ranging from 12.1 to 25.0 du/ac and an average of 16 du/ac.
5. Downtown Commercial (DC): The DC land use category allows for general commercial and service uses that serve the entire community. This designation allows for a range of community-serving commercial, entertainment, residential, and office uses. The maximum allowed intensity is a floor to area ratio (FAR) of 1.5.
6. Tourist Commercial (TC): The TC land use category allows for motels, resort hotels, related commercial and tourist oriented uses, limited retail, and freeway-oriented businesses. Multiple-family residential may also be permitted. The maximum allowed intensity for this designation is a FAR of 1.0.
7. General Commercial (GC): The GC land use category is divided into three subcategories: Neighborhood Commercial, Office Commercial, and Heavy Commercial. These three commercial categories are described below. For the purpose of this master plan, the three subcategories are not individually studied.
8. Office Commercial (OC): The OC land use category allows for professional and administrative offices, medical centers, and ancillary services. The maximum allowed intensity for this designation is a FAR of 0.4.
9. Neighborhood Commercial (NC): The NC land use category allows for local shopping areas where the retail or service businesses meet the daily needs of the residents in surrounding neighborhoods, such as hair salons, dry cleaners, coffee shops, and bakeries. The maximum allowed intensity for this designation is a FAR of 0.25.
10. Heavy Commercial (HC): The HC land use category allows for general commercial uses, business and consumer services, and light manufacturing. The maximum allowed intensity for this designation is a FAR of 0.5.
11. General Industrial (GI): The GI land use category is divided into two subcategories: Light Manufacturing and General Manufacturing. These two land use categories are defined below.
12. Planned Industrial (PI): The PI land use category allows for a range of industrial, manufacturing, select businesses, and related establishments of park-like settings. The maximum allowed intensity for this designation is a FAR of 0.45.

FINAL - February 13, 2008 2-5 H:\client\City_ElCentro_PAS\04 Reports\04.2 Final\04.2d Final to Client\Ch02.doc
13. Civic (Ci): The Ci land use category is used for local governmental offices, state and federal facilities, privately owned property including professional offices, financial institutions, and restaurants located within the City’s civic center area. The maximum allowed intensity for this designation is a FAR of 1.5.
14. Public Facility (PF): The PF land use category is used for all the land owned by the City, Imperial Irrigation District, school districts, or El Centro Regional Medical Center. This category contains police and fire departments, libraries, sewer facilities, flood control basins, parks and recreation facilities, cemeteries, museums, etc. The maximum allowed intensity for this designation is a FAR of 0.40.
15. Undesignated (Und): The Und category is for parcels with an unknown land use, as labeled in the GIS parcel map provided by Nobel Systems. Most of this land has been identified as roadways.
2.3.2 Land Use Area
The land within the City’s SOI was divided into two categories by superimposing an aerial map of the City [4] over the parcel map in GIS. These categories are:
1. Existing development areas.
2. Vacant land areas.
Existing development areas contain all parcels that are currently developed with the exception of developments that are not connected to the City’s water distribution system. Remote areas that receive water through truck delivery are categorized as vacant as these developments currently do not contribute to the City’s water demand. The aerial map indicating the areas identified as existing developments within the SOI is shown on Figure 2.2.
Based on the aerial map, it is estimated that the area within the City boundary is approximately 70 percent developed and the total area within the SOI is approximately 30 percent developed. Once all the vacant parcels were identified, these areas were further divided into areas within the City boundary (infill) and outside the City boundary (SOI growth). The land use distribution of these three categories (existing developments, City infill, and SOI growth) is summarized in Table 2.2.
As shown in Table 2.2, the vast majority of the City’s SOI is designated as LDR (64 percent).

FINAL - February 13, 2008 2-6 H:\client\City_ElCentro_PAS\04 Reports\04.2 Final\04.2d Final to Client\Ch02.doc
Table 2.2 Land Use Summary Water System Master Plan City of El Centro
Within City Boundary Outside City Boundary Total Area Land Use
Category Developed
(ac) Infill Growth
(ac) Developed
(ac) SOI Growth
(ac) (ac) (%)
RR 71 47 109 327 554 4%
LDR 1,286 737 59 7,298 9,380 64%
MDR 191 58 0 26 275 2%
HDR 334 37 0 33 405 3%
GC 555 414 0 45 1,014 7%
DC 1 0 0 0 1 0%
TC 223 37 0 0 260 2%
GI 606 301 75 0 982 7%
PI 115 106 0 589 809 6%
Ci 54 3 0 0 57 0%
PF 652 25 68 42 787 5%
Und 0 52 0 13 65 0%
Total 4,088 1,819 312 8,373 14,591 100%
2.3.3 Phasing of Developments
The General Plan divides the developments into four categories: City, Tier 1, Tier 2, and Tier 3. The City category includes all existing developments. Tier 1 includes land adjacent to and within the City limits. The Tier 2 developments include land adjacent to the City limits that has limited access to public infrastructure. The Tier 3 developments include unincorporated land, most of which will not be developed in the near future. Figure 2.3 shows the areas of these three tiers, while a breakdown of area by land use categories is listed in Appendix B. The General Plan does not specify any phasing of these improvements, and therefore this categorization was not used for the projection of water demands.
Instead, the most recent information on pending developments was used. The City provided an updated and detailed list of near-term developments, which are divided into three categories: approved, proposed, and probable developments. Based on discussions with City staff, it was determined that only 3 of the 70 near-term developments are likely to start developing before 2015, which is the planning horizon of this WMP. All remaining developments and other vacant areas will be considered fully developed under build-out conditions.

A³
A³
!"_$ !"_$
AÌ
AÌ
Aten Rd
Au
stin R
d
Cruickshank Rd
Evan Hewes Hwy
Ross Rd
Danenberg Rd
McCabe Rd
Treshill Rd
Villa Rd
Orange Ave
La B
ruch
erie Rd
Clark R
d
Do
gw
oo
d R
d
Co
oley R
d
Fo
urth
St
City ofImperial
FIGURE 2.2EXISTING DEVELOPMENTS
AND VACANT AREASWATER MASTER PLANCITY OF EL CENTRO
0 3,500 7,000Feet
�
Legend
Roads
Existing Development
Vacant
Sphere of Influence
City Limits

A³
A³
!"_$ !"_$
AÌ
AÌ
Aten Rd
Au
stin R
d
Cruickshank Rd
Evan Hewes Hwy
Ross Rd
Danenberg Rd
McCabe Rd
Treshill Rd
Villa Rd
Orange Ave
La B
ruch
erie Rd
Clark R
d
Do
gw
oo
d R
d
Co
oley R
d
Fo
urth
St
City ofImperial
Tier 2
Tier 1
Tier 2
Tier 1
Tier 3
Tier 2
Tier 3
Tier 2
Tier 3
Tier 2
Tier 1
FIGURE 2.3GENERAL PLAN TIERSWATER MASTER PLANCITY OF EL CENTRO
0 3,500 7,000Feet
�
Legend
Roads
Existing City
Sphere of Influence
City Limits
General Plan Tiers
Tier 1
Tier 2
Tier 3

FINAL - February 13, 2008 2-9 H:\client\City_ElCentro_PAS\04 Reports\04.2 Final\04.2d Final to Client\Ch02.doc
The three developments that are anticipated to start developing before 2015 are:
1. Waterford/Anderson (Waterford): This development consists of 5,400 residential units and covers an area of approximately 1,348 acres. It is assumed that 27 percent of the growth from 2008 to 2015 will be within this development. According to the City, Waterford has since withdrawn their application for development. However, the development was included in this plan to account for potential development.
2. Gillett Road (Gillett): This development consists of 150 units and covers an area of approximately 41 acres south of Gillett Road and West of Cooley Road. It is assumed that 13 percent of the growth from 2008 to 2015 will be within this development.
3. Lerno Verhaegan (Lerno): This development consists of 2,708 residential units and covers an area of approximately 676 acres. It is assumed that 60 percent of the growth from 2008 to 2015 will be within this development.
The Waterford, Gillett, and Lerno specific plans are used in this WMP for the projection of water demand. The developed area in the years 2010 and 2015 is based on the projected population growth as provided by the 2005 Urban Water Management Plan (UWMP). It is assumed that all population growth through the year 2015 is within the Lerno, Gillett, and Waterford areas, and that all new developments through the year 2015 are LDR. The average unit density of 4.5 du/ac and population density of 3.5 people per dwelling unit (ppl/du) for LDR (Table 2.4) was used to calculate the total area developed according to the total population growth.
The Lerno, Gillett, and Waterford developments are shown on Figure 2.4 along with the other near-term developments. As shown on this figure, the Lerno development is partially located within the City (140 acres), while the majority of the development is located in the SOI (536 acres). The Waterford and Gillett developments are entirely located in the SOI.
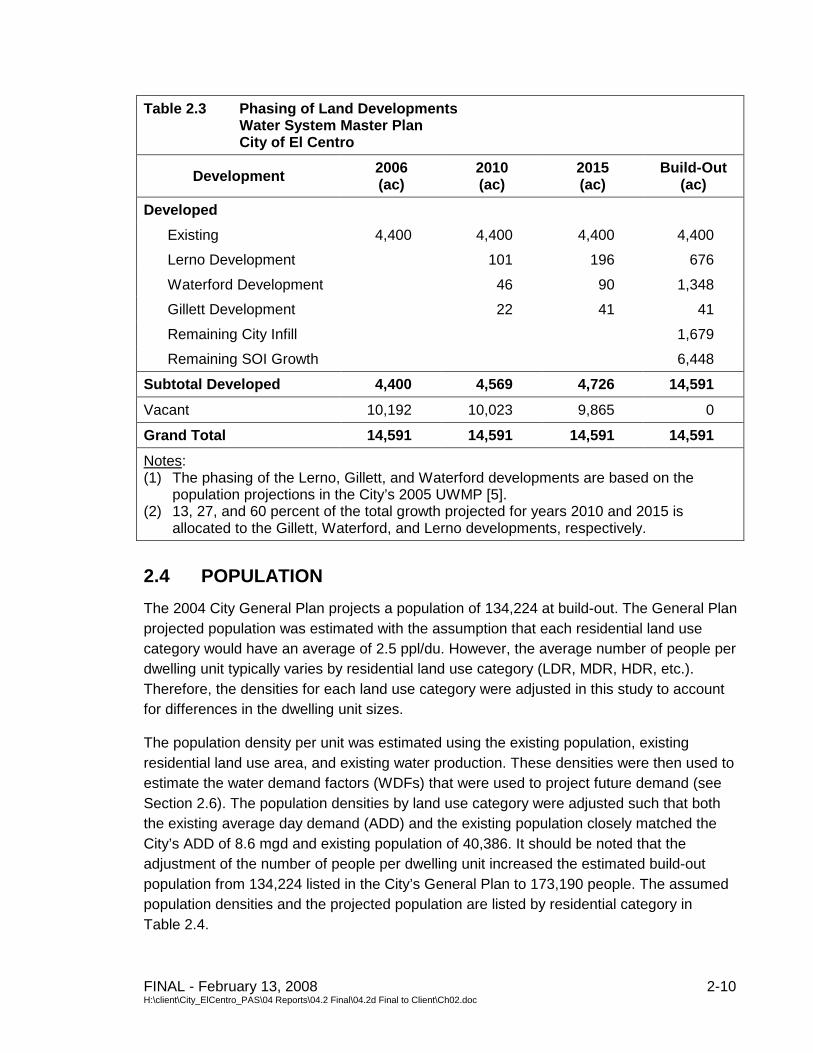
The anticipated areas of developed and vacant land for years 2006, 2010, 2015, and for build-out conditions are summarized in Table 2.3, while the land use distribution of all the near-term developments are listed in Appendix B.
FINAL - February 13, 2008 2-10 H:\client\City_ElCentro_PAS\04 Reports\04.2 Final\04.2d Final to Client\Ch02.doc
Table 2.3 Phasing of Land Developments Water System Master Plan City of El Centro
Development 2006 (ac)
2010 (ac)
2015 (ac)
Build-Out (ac)
Developed
Existing 4,400 4,400 4,400 4,400
Lerno Development 101 196 676
Waterford Development 46 90 1,348
Gillett Development 22 41 41
Remaining City Infill 1,679
Remaining SOI Growth 6,448
Subtotal Developed 4,400 4,569 4,726 14,591
Vacant 10,192 10,023 9,865 0
Grand Total 14,591 14,591 14,591 14,591
Notes: (1) The phasing of the Lerno, Gillett, and Waterford developments are based on the
population projections in the City’s 2005 UWMP [5]. (2) 13, 27, and 60 percent of the total growth projected for years 2010 and 2015 is
allocated to the Gillett, Waterford, and Lerno developments, respectively.
2.4 POPULATION
The 2004 City General Plan projects a population of 134,224 at build-out. The General Plan projected population was estimated with the assumption that each residential land use category would have an average of 2.5 ppl/du. However, the average number of people per dwelling unit typically varies by residential land use category (LDR, MDR, HDR, etc.). Therefore, the densities for each land use category were adjusted in this study to account for differences in the dwelling unit sizes.
The population density per unit was estimated using the existing population, existing residential land use area, and existing water production. These densities were then used to estimate the water demand factors (WDFs) that were used to project future demand (see Section 2.6). The population densities by land use category were adjusted such that both the existing average day demand (ADD) and the existing population closely matched the City’s ADD of 8.6 mgd and existing population of 40,386. It should be noted that the adjustment of the number of people per dwelling unit increased the estimated build-out population from 134,224 listed in the City’s General Plan to 173,190 people. The assumed population densities and the projected population are listed by residential category in Table 2.4.

A³
A³
!"_$ !"_$
AÌ
AÌ
Aten Rd
Au
stin R
d
Cruickshank Rd
Evan Hewes Hwy
Ross Rd
Danenberg Rd
McCabe Rd
Treshill Rd
Villa Rd
Orange Ave
La B
ruch
erie Rd
Clark R
d
Do
gw
oo
d R
d
Co
oley R
d
Fo
urth
St
City ofImperial
Waterford
Lerno
FIGURE 2.4PHASING OF DEVELOPMENTS
WATER MASTER PLANCITY OF EL CENTRO
0 3,500 7,000Feet
�
Legend
Roads
Sphere of Influence
City Limits
Lerno
2015 Lerno Developments
Waterford
2015 Waterford Developments
2015 Gillett Development
Phasing of Development
Approved
Proposed
Probable

FINAL - February 13, 2008 2-12 H:\client\City_ElCentro_PAS\04 Reports\04.2 Final\04.2d Final to Client\Ch02.doc
Table 2.4 Population Density and Projection at Build-Out Water System Master Plan City of El Centro
Residential Land Use Total Area (acres)
Average Density (du/ac)
Average Population
Density (ppl/du)
Projected Population
Rural Residential 554 1 4 2,216
Low Density Residential 9,380 4.5 3.5 147,740
Medium Density Residential 275 8.5 3 7,025
High-Medium Density Residential 405 16 2.5 16,209
Total 10,615 N/A N/A 173,190
Table 2.5 presents the population projections from the City’s UWMP, which were based on the 2004 Regional Transportation Plan (RTP) forecast from the Southern California Association of Governments (SCAG).
Table 2.5 Population Phasing Water System Master Plan City of El Centro
Development Area 2005 2006 2010 2015 Build-Out
Existing Development 40,165 40,165 40,165 40,165 40,165
Lerno Development 1,598(1) 3,088(1) 10,647
Waterford Development 719(1) 1,389(1) 14,331
Gillett Development 346(1) 669(1) 669
Other Developments 107,378
Total 40,165 40,165 42,829(2) 45,311(2) 173,190
Notes: (1) Lerno, Gillett, and Waterford based on 60 percent, 13 percent, and 27 percent of
growth, respectively. (2) Source: 2005 Urban Water Management Plan (based on SCAG projections in 2004).
As shown in Table 2.5, the projected population increase for 2010 and 2015 is 2,664 and 5,146, respectively. As discussed previously, this growth was entirely allocated to the Lerno, Gillett, and Waterford developments with a ratio of 60 percent, 13 percent, and 27 percent, respectively. Thus, for 2010 the growth allocated to Lerno is equal to a population of 1,598 (0.6 x 2,664), which equates to approximately 460 du (1,598 ppl/3.5 ppl/du) and 100 acres (180 du/4.5 du/ac). The remaining numbers in Tables 2.3 and 2.5 are calculated accordingly.

FINAL - February 13, 2008 2-13 H:\client\City_ElCentro_PAS\04 Reports\04.2 Final\04.2d Final to Client\Ch02.doc
2.5 EXISTING WATER DEMAND
This section describes the City’s historical water usage, water demand, water loss, and water demand coefficients. This information is used to estimate the City’s future water demands as described in Section 2.6.
2.5.1 Historical Water Demands
Historical water demands are typically obtained from customer billing records. However, this information was not available for this WMP and the demands for the City are therefore estimated with historical water production records. The estimated existing demand for each land use category using the WDFs described in Section 2.6.1 are summarized in Table 2.6.
Table 2.6 Existing Demand by Land Use Water System Master Plan City of El Centro
Land Use Density Total Area
(acres)
Developed Area
(acres)
WDF (gpd/acre)
Estimated ADD
(mgd)
Within the City Limits
Rural Residential 118 71 1,000 0.07
Low Density Residential 2,023 1,286 2,000 2.57
Medium Density Residential 250 191 3,000 0.57
High-Medium Density Residential 372 334 4,000 1.34
General Commercial 969 555 2,500 1.39
Downtown Commercial 1 1 2,500 0.00
Tourist Commercial 260 223 2,500 0.56
General Industrial 907 606 1,000 0.61
Planned Industrial 221 115 1,000 0.11
Civic 57 54 1,500 0.08
Public Facility 677 652 1,500 0.98
Undesignated 52 0 0 0.00
City Subtotal 5,907 4,088 n/a 8.3
Within the SOI (exc. City)
Rural Residential 436 109 1,000 0.11
Low Density Residential 7357 59 2,000 0.12
Medium Density Residential 26 0 3,000 0.00
High-Medium Density Residential 33 0 4,000 0.00
General Commercial 45 0 2,500 0.00
Downtown Commercial 0 0 2,500 0.00

FINAL - February 13, 2008 2-14 H:\client\City_ElCentro_PAS\04 Reports\04.2 Final\04.2d Final to Client\Ch02.doc
Table 2.6 Existing Demand by Land Use Water System Master Plan City of El Centro
Land Use Density Total Area
(acres)
Developed Area
(acres)
WDF (gpd/acre)
Estimated ADD
(mgd)
Tourist Commercial 0 0 2,500 0.00
General Industrial 75 75 1,000 0.07
Planned Industrial 589 0 1,000 0.00
Civic 0 0 1,500 0.00
Public Facility 110 68 1,500 0.10
Undesignated 13 0 0 0.00
SOI Subtotal 8,684 312 n/a 0.4
Grand Total 14,591 4400 n/a 8.7(1)
Notes: (1) Historical water production show that the existing demand is 8.6 mgd (see Table 2.7),
thus the estimated demand factors shown in the table provide a reasonable estimation for demand.
2.5.2 Historical Water Production
The annual average water production in 2005 was 9,150 acre-ft/yr or 8.2 mgd. Based on the City’s population in 2005 of 40,386 (2005 UWMP), the average daily per capita consumption is about 202 gallons per capita per day (gpd/cap). Table 2.7 lists the historical water production.
Table 2.7 Historical Water Production Water System Master Plan City of El Centro
Calendar Year
Annual Production (acre-ft/yr)
Average Day Production
(mgd)
Maximum Day Production
(mgd)
Maximum Day Peaking Factor
1960 4,805 4.3 7.7 1.8
1970 6,430 5.7 9.9 1.7
1980 6,508 5.8 9.7 1.7
1985 6,631 5.9 9.5 1.6
1990 8,096 7.2 10.9 1.5
1991 7,707 6.9 10.5 1.5
1992 8,200 7.3 11.2 1.5
1993 8,670 7.7 13.3 1.7
1994 8,662 7.7 12.9 1.7

FINAL - February 13, 2008 2-15 H:\client\City_ElCentro_PAS\04 Reports\04.2 Final\04.2d Final to Client\Ch02.doc
Table 2.7 Historical Water Production Water System Master Plan City of El Centro
Calendar Year
Annual Production (acre-ft/yr)
Average Day Production
(mgd)
Maximum Day Production
(mgd)
Maximum Day Peaking Factor
1995 8,660 7.7 11.9 1.5
1996 8,782 7.8 12.3 1.6
1997 8,779 7.8 12.7 1.6
1998 8,482 7.6 11.6 1.5
1999 8,592 7.7 11.1 1.5
2000 8,792 7.8 11.3 1.4
2001 8,760 7.8 11.1 1.4
2002 8,838 7.9 11.2 1.4
2003 8,773 7.8 12.3 1.6
2004 8,997 8.0 11.7 1.5
2005 9,150 8.2 12.5 1.5
2006 9,677 8.6 12.5 1.5
Notes: (1) Source: City Production Records.
As shown in Table 2.7, the City’s water production has increased from 4.3 mgd in 1960 to 8.6 mgd in 2006. This equates to an average increase of 1.5 percent per year over this period.
2.5.3 Water Loss
The difference between water production and consumption (billed to customers) is defined as the unaccounted-for-water, also referred to as water loss. Unaccounted-for-water may be attributed to leaking pipes, unmetered or unauthorized water use, inaccurate meters, or other events causing water to be withdrawn from the system without being measured. Unmetered flows (including park irrigation) are anticipated to decrease over time, as the City plans to install meters at all park locations. The General Plan states that water loss accounted for approximately 4 percent of the total flows in 2005 and that it is expected that this loss will be reduced to 1 percent over the next 20 years. Due to the absence of billing data, WDFs in this report are calibrated to include water loss at 4 percent.
2.5.4 Peaking Factors
The maximum and minimum day peaking factors for the City were determined using the historical production records and discussion with the City. The maximum day demand

FINAL - February 13, 2008 2-16 H:\client\City_ElCentro_PAS\04 Reports\04.2 Final\04.2d Final to Client\Ch02.doc
(MDD)/ADD peaking factor was decided at 1.6, because this is the highest factor since 1994. Higher peaking factors for MDD conditions, although experienced before 1994, are not anticipated in the future due to the City’s land use distribution and water conservation trends. There are no hourly production records, therefore the peak hour demand factor used is a factor common for the City’s climate and land use characteristics. The peaking factors used for this study are summarized in Table 2.8.
Table 2.8 Peaking Factor Summary Water System Master Plan City of El Centro
Demand Condition Daily Peaking Factor Maximum Hourly Peaking Factor
Average Day Demand (ADD) 1.0 times ADD 1.7 times ADD(2)
Maximum Day Demand (MDD) 1.6 times ADD(1) 2.7 times ADD(3)
Minimum Day Demand (MinDD) 0.7 times ADD(1) 1.1 times ADD(3)
Notes: (1) Source: Daily Production Records From 1960 to 2006 (El Centro). (2) Typical industry value. (3) Calculated values.
2.6 FUTURE WATER DEMAND
This section describes the City’s WDF, projected water demand, and the phasing of demand to the year 2030.
2.6.1 Water Demand Factors
WDFs are the estimated amount of water usage for a certain land use type. WDFs are typically expressed in gpd/ac. These factors are used to estimate the ADD for existing and potential development areas by multiplying the WDF with the total number of acres of each land use category.
WDFs are typically determined from a combination of geocoded billing records and land use information using spatial GIS routines. However, billing records are unavailable for this master plan. The WDFs were developed by matching existing water production and current population with the land use distribution and WDFs. The rounded WDFs are listed in Table 2.9.

FINAL - February 13, 2008 2-17 H:\client\City_ElCentro_PAS\04 Reports\04.2 Final\04.2d Final to Client\Ch02.doc
Table 2.9 Water Demand Factors Water System Master Plan City of El Centro
Land Use WDF (gpd/ac)
Rural Residential 1,000
Low Density Residential 2,000
Medium Density Residential 3,000
High-Medium Density Residential 4,000
General Commercial 2,500
Downtown Commercial 2,500
Tourist Commercial 2,500
General Industrial 1,000
Planned Industrial 1,000
Civic 1,500
Public 1,500
Undesignated 0
2.6.2 Water Demand Projections
The water demand projections are divided into two groups:
1. Infill Development: Growth within the City boundary (1,819 acres).
2. SOI Growth: Growth outside of the City boundary and inside the SOI (8,373 acres).
The remaining developable land within the City boundary is approximately 1,819 acres. At build-out, these City infill areas have an estimated ADD of 3.4 mgd and MDD of 5.5 mgd. Table 2.10 lists the infill demand for each land use category at build-out.
Table 2.10 Demand Projections – Infill Development Water System Master Plan City of El Centro
Land Use Total Area (acres)
ADD (mgd)
MDD (mgd)
Rural Residential 47 0.05 0.08
Low Density Residential 737 1.47 2.36
Medium Density Residential 58 0.18 0.28

FINAL - February 13, 2008 2-18 H:\client\City_ElCentro_PAS\04 Reports\04.2 Final\04.2d Final to Client\Ch02.doc
Table 2.10 Demand Projections – Infill Development Water System Master Plan City of El Centro
Land Use Total Area (acres)
ADD (mgd)
MDD (mgd)
High-Medium Density Residential 37 0.15 0.24
General Commercial 414 1.04 1.66
Downtown Commercial 0 0.00 0.00
Tourist Commercial 37 0.09 0.15
General Industrial 301 0.30 0.48
Planned Industrial 106 0.11 0.17
Civic 3 0.00 0.01
Public 25 0.04 0.06
Undesignated 52 0.00 0.00
Total 1,819 3.4 5.5
The future demand is projected by multiplying the land use area in acres with the appropriate WDF in gpd/ac (Table 2.8). The MDD is found by multiplying the ADD by the peaking factor of 1.6 (Table 2.7).
The developable land outside of the City limits and within the SOI covers an area of approximately 8,373 acres within the SOI. These areas have an estimated ADD of 15.9 mgd and MDD of 25.4 mgd at build-out. Table 2.11 lists the SOI growth demand for each land use category at build-out.
Table 2.11 Demand Projections – SOI Growth Water System Master Plan City of El Centro
Land Use Total Area (acres)
ADD (mgd)
MDD (mgd)
Rural Residential 327 0.33 0.52
Low Density Residential 7,298 14.60 23.35
Medium Density Residential 26 0.08 0.12
High-Medium Density Residential 33 0.13 0.21
General Commercial 45 0.11 0.18
Downtown Commercial 0 0.00 0.00
Tourist Commercial 0 0.00 0.00

FINAL - February 13, 2008 2-19 H:\client\City_ElCentro_PAS\04 Reports\04.2 Final\04.2d Final to Client\Ch02.doc
Table 2.11 Demand Projections – SOI Growth Water System Master Plan City of El Centro
Land Use Total Area (acres)
ADD (mgd)
MDD (mgd)
General Industrial 0 0.00 0.00
Planned Industrial 589 0.59 0.94
Civic 0 0.00 0.00
Public 42 0.06 0.10
Undesignated 13 0.00 0.00
Total 8,373 15.9 25.4
Assuming that the existing land use will continue to have an ADD of 8.7 mgd at build-out, the total demand within the City’s SOI will reach an ADD of 28.0 mgd and a MDD of 44.8 mgd at build-out. A summary of the total demand at build-out is listed in Table 2.12. As shown in Table 2.12, the majority of the demand is associated with LDR areas.
Table 2.12 Demand Projections – Summary Water System Master Plan City of El Centro
Land Use Total Area (acres)
ADD (mgd)
MDD (mgd)
Rural Residential 428 0.55 0.89
Low Density Residential 8,036 18.8 30.0
Medium Density Residential 639 0.83 1.32
High-Medium Density Residential 752 1.62 2.59
General Commercial 794 2.54 4.06
Downtown Commercial 0 0.00 0.00
Tourist Commercial 1,383 0.65 1.04
General Industrial 492 0.98 1.57
Planned Industrial 809 0.81 1.29
Civic 723 0.09 0.14
Public 247 1.18 1.89
Undesignated 288 0.00 0.00
Total 14,591 28.0 44.8

FINAL - February 13, 2008 2-20 H:\client\City_ElCentro_PAS\04 Reports\04.2 Final\04.2d Final to Client\Ch02.doc
2.6.3 Phasing of Water Demand
The following assumptions were made to phase the projected water demands for years 2010 and 2015:
1. The Lerno, Gillett, and Waterford consist of only LDR users.
2. The three developments will be the only growth areas through 2015.
3. Sixty (60) percent of the growth will take place in the Lerno development, 27 percent will take place in the Waterford development, and 13 percent will take place in the Gillett development.
4. The phasing of demands is based on the 2005 UWMP population projection for 2010 and 2015.
The projected demands are listed in Table 2.13. As shown in Table 2.13, the ADD is projected to increase to 9.4 mgd by 2015, which equates to an average annual growth of 0.9 percent. At this growth rate, build-out conditions will not materialize until after 2100.
Table 2.13 Current and Projected Water Demands Water System Master Plan City of El Centro
Developments 2006 (mgd)
2010 (mgd)
2015 (mgd)
Build-Out (mgd)
Average Day Demand (ADD)
Existing 8.6 8.6 8.6 8.6
Lerno - 0.2 0.4 1.4
Waterford - 0.09 0.2 2.7
Gillett - 0.04 0.1 0.1
Remaining Infill - - - 3.1
Remaining SOI Growth - - - 12.0
Total ADD 8.6 8.9 9.3 27.9
Maximum Day Demand (MDD)
Existing 13.8 13.8 13.8 13.8
Lerno - 0.3 0.6 2.2
Waterford - 0.1 0.3 4.3
Gillett - 0.1 0.1 0.1
Remaining Infill - - - 5.0
Remaining SOI Growth - - - 19.3
Total MDD 13.8 14.3 14.8 44.7

FINAL - February 13, 2008 3-1 H:\client\City_ElCentro_PAS\04 Reports\04.2 Final\04.2d Final to Client\Ch03.doc
Chapter 3
EXISTING WATER SYSTEM
This chapter presents an overview of the City of El Centro’s (City’s) water distribution system, water supply, and storage facilities. The City currently has four treated water storage reservoirs, two booster pumping stations and approximately 148 miles of pipeline. The City serves water to about 9,200 connections with an average day demand (ADD) of approximately 8.6 mgd.
The water system components are summarized in Table 3.1. A map of the distribution system pipes and facilities is shown on Figure 3.1.
Table 3.1 Water Distribution System Summary Water System Master Plan City of El Centro
Facility Type Quantity
Pressure Zone 1
Raw Water Storage Reservoirs 2
Treated Water Storage Facilities 4
Booster Pump Stations 2
Inter-Agency Connections 0
Pipeline (miles) 148
Water Treatment Plant 1
3.1 PRESSURE ZONES
The topography of the City is essentially flat, with ground elevations within the City’s Sphere of Influence (SOI) ranging from 20 feet to 51 feet below mean sea level (msl). Due to the minor variations in ground elevation throughout the SOI, the City’s water distribution system consists of only one pressure zone. This zone is supplied by two booster pump stations, which are located at the water treatment plant (WTP) and the remote ground storage tank site (La Brucherie).
3.2 DISTRIBUTION SYSTEM
The City’s distribution system consists of approximately 148 miles of pipeline, which range from 3/4 inch to 30 inches in diameter. The following sections describe the distribution system by pipeline diameter, age, and material.

%,
%,
kj
kj[�
A³
A³
!"_$ !"_$
AÌ
Au
stin R
d
Cruickshank Rd
Evan Hewes Hwy
Ross Rd
Danenberg Rd
McCabe Rd
Treshill Rd
Villa Rd
Orange Ave
La B
ruch
erie Rd
Clark R
d
Do
gw
oo
d R
d
Co
oley R
d
Fo
urth
St
AÌ
Water Treatment Plant (15 mgd)3 Reservoirs (10 MG)
Pump Station (800 hp)
La Brucherie1 Reservoir (5 MG) andPump Station (400 hp)
FIGURE 3.1EXISTING WATER
DISTRIBUTION SYSTEMWATER MASTER PLANCITY OF EL CENTRO
0 3,000 6,000Feet
�
Legend
Sphere of Influence
City Limits
Facilities
[� WTP
kj Reservoir
%, Pump Station
Pipelines by Diameter
4" and Smaller
5 - 6"
8"
10 - 12"
14 - 18"
20" and Larger
Private Pipelines

FINAL - February 13, 2008 3-3 H:\client\City_ElCentro_PAS\04 Reports\04.2 Final\04.2d Final to Client\Ch03.doc
3.2.1 Pipeline Diameter Distribution
The distribution of pipeline diameters is summarized in Table 3.2 and on Figure 3.2. As shown, the most common pipeline diameter is 8 inches, contributing to 58 miles or 39 percent of the City’s distribution system.
Table 3.2 Pipeline Diameter Distribution Water System Master Plan City of El Centro
Diameter (inches) Length (feet) Length (miles) Percent
<4 8,800 2 1%
4 12,500 2 2%
6 193,600 37 25%
8 303,200 58 39%
10-12 175,600 33 23%
14-18 62,300 12 8%
≥20 22,800 4 3%
Total 778,700 148 100%
3.2.2 Pipeline Age Distribution
The distribution of pipelines by age is summarized in Table 3.3. Of the 148 miles of pipeline, 62 miles, or 42 percent, were installed less than 25 years ago. However, 27 miles (or 19 percent) have an unknown age. The oldest recorded pipeline is 72 years and will soon be due for replacement.
Table 3.3 Pipeline Diameter Distribution by Age Water System Master Plan City of El Centro
Year of Installation Pipeline Age (years) Length (miles) Percent
Pre-1932 75 or more N/A N/A
1933-1957 50-74 13 8%
1958-1982 25-49 46 31%
1983-Present 25 or less 62 42%
Unknown Unknown 27 19%
Total 148 100%
3.2.3 Pipeline Material Distribution
The distribution of pipelines by material is summarized on Figure 3.3.
The material categories are asbestos cement (AC), polyvinyl chloride (PVC), ductile iron pipe (DIP), copper (COP), cast iron pipes (CIP), steel (STL), and cement mortar lined

- C - .2 61 0. dr20 El entro12 07F3 -7 9A0 c
PIPELINE DIAMETER DISTRIBUTION
FIGURE 3.2
WATER MASTER PLANCITY OF EL CENTRO
10 - 12 inch33 mi(23%)
8 inch58 mi(38%)
6 inch37 mi(25%)
4 inch2 mi(2%)
< 4 inch2 mi(1%)
> 20 inch
4 mi(3%)
14 - 18 inch12 mi(8%)

- C - .3 61 0. dr20 El entro12 07F3 -7 9A0 c
PIPELINE DISTRIBUTION BY MATERIAL
FIGURE 3.3
Copper (COP)0.05 mi
(0%)
Cast Iron Pipes (CIP)7 mi(5%)
Ductile Iron Pipe (DIP)0.1 mi
(0%)
Asbestos Cement (AC)86 mi(58%)
Steel (STL and CMLWS)2 mi(1%)
Polyvinyl Chloride (PVC)53 mi(36%)
WATER MASTER PLANCITY OF EL CENTRO

FINAL - February 13, 2008 3-6 H:\client\City_ElCentro_PAS\04 Reports\04.2 Final\04.2d Final to Client\Ch03.doc
welded steel (CMLWS). STL and CMLWS are combined into the Steel category in Figure 3.3. A majority of the pipelines (86 miles, or 58 percent) are made of asbestos cement (AC).
3.3 STORAGE FACILITIES
Due to the minor variation in ground elevations, the system does not have any gravity reservoirs and no elevated tanks in service. Thus, all system storage is ground storage, which must be used in combination with booster pumps. The location, type, capacity, and construction year of each reservoir are summarized in Table 3.4
The system has two primary locations with storage. The first location is at the WTP near the southern end of the City’s service area. The City has two raw water ponds and three treated water tanks at the WTP site. This site has about 52 million gallons (MG) of raw water storage that is used to buffer imported water supply and provide supply reliability in case of an interruption of imported water supply. In addition, this site accommodates 10 MG of treated storage at the WTP that provides suction supply to the four booster pumps, which provide the primary water supply for the City’s distribution system.
The system also has one remote ground storage location in the northwest portion of the City’s distribution system near the intersection of La Brucherie Road and Barbara Worth Drive. This facility can provide additional water supply to the system during peak demands by use of the La Brucherie booster pump station. This facility is used primarily during peak demand periods and has approximately 5 MG of storage.
Table 3.4 Total Water Storage Capacity Water System Master Plan City of El Centro
Storage Type Location Reservoir Type Capacity
(MG) Year
Constructed
Raw Water Storage
Pond 1 WTP Asphalt Lined Pond 26.25 1956
Pond 2 WTP Asphalt Lined Pond 26.25 1956
Subtotal 52.5
Treated Water Storage
Reservoir Tank No. 1 WTP Welded Steel Tank 2.5 1956
Reservoir Tank No. 2 WTP Welded Steel Tank 2.5 1956
Reservoir Tank No. 3 WTP Welded Steel Tank 5.0 1977
Remote Reservoir La Brucherie Rd. and Barbara Worth Dr.
Welded Steel Tank 5.0 1993
Subtotal 15.0
GRAND TOTAL 67.5

FINAL - February 13, 2008 3-7 H:\client\City_ElCentro_PAS\04 Reports\04.2 Final\04.2d Final to Client\Ch03.doc
3.4 BOOSTER STATIONS
Since there are no elevated tanks or gravity storage reservoirs, all water supplies must be pumped from the ground storage facilities at the WTP and the remote tank. The system has two booster pump stations, which characteristics are summarized in Table 3.5.
Table 3.5 Booster Stations Summary Water System Master Plan City of El Centro
Pump Station Pump Unit Design Head
(feet) Design Flow
(gpm) Pump Capacity
(hp)
1 156 4,000 200
2 145 4,000 200
3 145 4,000 200
WTP PS
4 145 4,000 200
1 128 4,000 200 La Brucherie PS
2 128 4,000 200
The primary pump station is located at the WTP and contains four 200 hp variable speed pumps with Total Dynamic Head (TDH) of 145 feet and a design flow of 4,000 gpm. These pumps operate by maintaining a set discharge pressure of approximately 56 psi by automatically adjusting the speed of all pumps. The pumps are controlled based on time, such that the tanks are filled at night and drained in the morning and late afternoon to supplement water supplies and maintain sufficient pressures during the high demand hours.
If the pressure at the WTP pump station discharge cannot be maintained during peak demand periods this will trigger the La Brucherie pump station to come on to help maintain the desired system pressure. This facility contains two 200 hp variable speed pumps with a TDH of 128 feet and a design flow of 4,000 gpm. These pumps also operate by maintaining a set discharge pressure of approximately 56 psi by automatically adjusting the speed of all pumps. This pump station has space for a third booster pump that could be installed in the future. These pumps are identical to the pumps at the WTP with a slightly reduced impeller diameter.
3.5 SUPPLIES
The City cannot use its local groundwater due to the high total dissolved solids (TDS) concentration. Therefore, all water is supplied from the Colorado River via the All American Canal and facilities of the Imperial Irrigation District (IID). Water is pumped from the canal into the City’s raw water storage ponds, with a combined capacity of 52.5 MG. This storage provides the City more than 6 days of storage under existing ADD conditions. This raw imported surface water is treated at the City’s WTP before it enters the distribution system.

FINAL - February 13, 2008 3-8 H:\client\City_ElCentro_PAS\04 Reports\04.2 Final\04.2d Final to Client\Ch03.doc
The City has sufficient water supplies through the deliveries of Imperial Irrigation District (IID), which supplies are governed in the Colorado River Water Delivery Agreement of October 2003. Future water supplies are not of concern to the City as the allocation of water for agricultural land is substantially higher (5.1 acre-feet per year per acre (AFY/ac)) than the average water use of developed land, which is estimated to range from 1.1 AFY/ac (rural residential) to 4.5 AFY/ac (high density residential) as listed in Table 2.7.
3.5.1 Water Rights
The Colorado River Water Delivery Agreement of October 2003 allows the IID to receive 3.1 million acre-feet of water per year. The City is currently receiving 35,755 acre-feet per year (ac-ft/year) from the IID’s All American Canal and Main Canal through the Date Canal and the Dahlia Lateral Number 1. These canals directly supply the water treatment facility. The water supplies are projected to stay constant through the year 2025.
3.5.2 Water Treatment Plant
The water supplied from the IID is directed to the City’s treatment plant. The plant is a conventional pretreatment-filtration plant. The pretreatment consists of ferrous sulfate and polymer addition to flocculating clarifiers. There are three gravity filters. Disinfection is accomplished with the addition of chlorine followed by contact time in the three on-site storage reservoirs. The treatment plant has a normal flow pattern for the raw water storage ponds. Water is pumped into the south pond and then flows by gravity through the north pond and to the clarifiers. This configuration utilizes the largest pipes and has adequate retention time for sedimentation of silt carried in the raw water [5]. The available capacity of the plant is 15 mgd (see Table 3.2). Water from the three on-site tanks (totaling 10 MG of storage) feeds the system via the WTP booster pumping station and represents the primary water supply for the El Centro system.
3.6 INTER-AGENCY CONNECTIONS
The City’s water system has no inter connections with neighboring cities or water utilities.

FINAL - February 13, 2008 4-1 H:\client\City_ElCentro_PAS\04 Reports\04.2 Final\04.2d Final to Client\Ch04.doc
Chapter 4
PLANNING AND EVALUATION CRITERIA
This chapter presents the planning criteria and methodologies for analysis used to evaluate the existing distribution system and its facilities and to address the existing system deficiencies and size future improvements. This section starts with a summary of the selected planning and evaluation criteria. A detailed discussion of each type of criterion is discussed in subsequent sections.
4.1 EVALUATION CRITERIA SUMMARY
The developed evaluation criteria address the water system pressure, pipeline velocities, storage capacity, supply requirements, and booster station requirements. The criteria are developed using the typical planning criteria used in the systems of similar water utilities, local codes, engineering judgment, commonly accepted industry standards and input from City of El Centro (City) staff. The “industry standards” are typically ranges of values that are acceptable for the criteria in question, and, therefore, are used more as a check to confirm that the values being developed are reasonable. A summary of the planning and evaluation criteria used in this master plan is listed in Table 4.1.
Table 4.1 Evaluation Criteria Water System Master Plan City of El Centro
Evaluation Condition Value Unit
System Pressure
Maximum MinDD 80 psi
Minimum, without fire flow PHD 40 psi
Minimum, with fire flow MDD 20 psi
Pipeline Velocity
Existing pipelines (excl. hydrant runs) MDD 5 ft/s
New pipelines (≤ 12-inch diameter pipes) MDD 5 ft/s
New pipelines (≥ 16-inch diameter pipes) MDD 4 ft/s
PS suction pipelines MDD 8 ft/s
Pipeline Headloss
Existing pipelines (excl. hydrant runs) MDD 10 ft/kft
New pipelines MDD 5 ft/kft

FINAL - February 13, 2008 4-2 H:\client\City_ElCentro_PAS\04 Reports\04.2 Final\04.2d Final to Client\Ch04.doc
Table 4.1 Evaluation Criteria Water System Master Plan City of El Centro
Evaluation Condition Value Unit
Storage Volume
Operational Storage 30% of MDD MG
Fire Fighting Storage Max FF demand * duration MG
Emergency Storage 100 % of MDD MG
Fire Flow Requirements
Rural Residential MDD 1,000 gpm gpm for 2 hrs
Low Density Residential MDD 1,000 gpm gpm for 2 hrs
Medium Density Residential MDD 2,000 gpm gpm for 2 hrs
High Density Residential MDD 3,000 gpm gpm for 3 hrs
Commercial MDD 3,000 gpm gpm for 3 hrs
Public MDD 3,000 gpm gpm for 3 hrs
Civic MDD 3,000 gpm gpm for 3 hrs
Industrial MDD 4,000 gpm gpm for 4 hrs
Supply Requirements
Supply with largest source out of service Meet MDD for 7 days MG
Supply with power outage Meet MDD for 6 hours MG
Supply with earthquake Meet MinDD for 14 days MG
Pipeline Breaks Meet MDD with single transmission main out of
service
≥ 40 psi
Pump Station Capacity
Under normal conditions Meet PHD with the largest unit out of service
gpm
Power outage Meet MDD with back-up power only
gpm
Earthquake conditions Meet ADD with the largest PS out of service
gpm
Distribution System
Pipeline life expectancy 75 years
Minimum pipeline size (new pipes) 8 inches

FINAL - February 13, 2008 4-3 H:\client\City_ElCentro_PAS\04 Reports\04.2 Final\04.2d Final to Client\Ch04.doc
4.2 SYSTEM PRESSURE
Minimum system pressures are evaluated under two different scenarios: Peak Hour Demand (PHD) and Maximum Day Demand (MDD) plus fire flow. The minimum pressure criterion for normal PHD conditions is 40 pounds per square inch (psi), while the minimum pressure criterion under MDD with fire flow conditions is 20 psi. The pressure analysis is limited to demand nodes, because only locations with service connections need to meet such pressure requirements. Lower pressures are only acceptable for junctions at water system facilities and on transmission mains. However, no pressure shall be less than 5 psi to avoid potential contamination of ground water intrusion.
Maximum system pressures are evaluated under the minimum day demand (MinDD) scenario. The maximum pressure criterion for normal MinDD conditions is 80 psi. Service connection locations that have system pressures exceeding 80 psi require pressure-reducing valves.
4.3 PIPELINE VELOCITY AND HEADLOSS
Maximum pipeline velocities are defined to decrease the potential for pipeline lining erosion and headloss in the system. The pipeline velocity in the existing distribution system pipelines and pump station suction lines shall not exceed 5 feet per second (fps).
New distribution system pipelines 12 inches in diameter or less shall be designed with a maximum pipeline velocity of 5 fps, while new distribution system pipelines 16 inches in diameter or more shall be designed with a maximum pipeline velocity of 4 fps under normal MDD conditions.
The maximum headloss should not exceed 10 feet per thousand feet (ft/kft) in existing pipelines under MDD conditions. New pipelines should be sized with a maximum headloss of 5 ft/kft.
4.4 STORAGE REQUIREMENTS
Storage criteria are used to determine existing storage deficiencies and to estimate the future storage needs. Storage criteria are typically divided in to the following three components:
• Operational Storage.
• Fire Flow Storage.
• Emergency Storage.
The sum of these three components equates to the total required storage. The typical criteria used to size operational, fire flow, and emergency storage are described below.

FINAL - February 13, 2008 4-4 H:\client\City_ElCentro_PAS\04 Reports\04.2 Final\04.2d Final to Client\Ch04.doc
4.4.1 Operational Storage
Operational storage is defined as the quantity of water that is required to balance daily fluctuations in demand and water production. It is necessary to coordinate the water source production rates and the available storage capacity in a water system to provide a continuous treated water supply to the system. Water systems are often designed to supply the average demand on the maximum day and use reservoir storage to supply water for peak hour flows that typically occur in the mornings and late afternoons. This operational storage is replenished during off-peak hours that typically occur during nighttime, when the demand is less.
The American Water Works Association (AWWA) recommends that an operational supply volume ranging from 25 percent to 33 percent of the demand experienced during one maximum day [6]. Due to the City’s residential character, and to provide a conservative basis for planning, it is assumed that the operational storage component be sized as 30 percent of MDD.
4.4.2 Fire Flow Storage
Fire flow storage is required for suppressing fires, and is defined as the highest required fire flow for a certain land use type multiplied by the minimum duration. As shown in Table 4.1, the highest fire flow criterion is for the protection of industrial developments and is 4,000 gpm for a duration of 4 hours, equaling a total of 1.0 MG of required fire flow storage.
4.4.3 Emergency Storage
Storage is also required to meet system demands during emergencies. Emergencies cover a wide range of rare but probable events, such as water contamination, failure at the water treatment plant (WTP), power outages, transmission pipeline ruptures, several simultaneous fires, and earthquakes. The volume of water that is needed during an emergency is usually based on the estimated amount of time expected to elapse before the disruptions caused by the emergency are corrected. The occurrence and magnitude of emergencies is difficult to predict and therefore, the emergency storage is typically set as a percentage of average day demand (ADD) or MDD. However, this percentage needs to be based on water system layout and the available supply facilities. Water systems that have only one source of supply, such as the City, are more vulnerable in emergencies than water systems with a large number of groundwater wells that are located throughout the distribution system.
Based on values used for similar water systems having only one source supply, the appropriate emergency storage criterion for the City is determined to be 100 percent of MDD, which would provide enough storage for nearly two days under ADD conditions. Thus, during a power outage at the WTP due to an earthquake, fire, or other emergency, the City should be able to supply two typical days of demand. During summertime, when

FINAL - February 13, 2008 4-5 H:\client\City_ElCentro_PAS\04 Reports\04.2 Final\04.2d Final to Client\Ch04.doc
the demand is higher, the City can issue water conservation notices to reduce the City’s water demand and extend the available water supply period.
4.5 FIRE FLOW REQUIREMENTS
As shown in Table 4.1, the fire flow requirements range from 1,000 gpm for 2 hours in rural residential and low-density residential areas, to 4,000 gpm for 4 hours in industrial areas. A map of the fire flow requirements by land use is shown on Figure 4.1.
4.6 SUPPLY REQUIREMENTS
In determining the adequacy of the water supply facilities, the available water supplies are evaluated for four types of conditions:
• Largest Source out of service.
• Power outage.
• Earthquake.
• Pipeline Breaks.
4.6.1 Largest Source Out of Service
The City’s water supply should have sufficient water capacity to meet the MDD with the largest source out of service for 7 days. The largest and only source of supply is the City’s WTP, which can provide a continuous supply of 15 mgd to the City. Thus, storage is the only source of treated water that can be used when the WTP is out of service.
However, the City can pump raw water from the Imperial Irrigation District (IID) canal into its distribution system during a lasting emergency to continue water supply service and fire flow protection. Raw water supply would require boil-water-notices to all customers and system flushing with treated water after the WTP is back in operation.
4.6.2 Power Outage
In case of a power outage, the City should have sufficient water and pressure to serve its customers at MDD for six hours while one power grid is temporarily interrupted. In addition, the system pressure should not be less than 40 psi at any location in the distribution system.
The City has full back-up power at the WTP pump station (PS), the La Brucherie PS, and the raw water PS that is used to pump water from the IID canal into the raw water storage ponds at the WTP site. The Water Treatment Plant has a 1,800-gallon diesel tank that can run the plant at full load for 24 hours. The La Brucherie facility has a 300-galloon tank that can run the facility for at least 8 hours depending on load. The City can also have diesel

FINAL - February 13, 2008 4-6 H:\client\City_ElCentro_PAS\04 Reports\04.2 Final\04.2d Final to Client\Ch04.doc
delivered in very short notice. Therefore, a power outage will have little to no affect on the City’s water supply.

A³
A³
!"_$ !"_$
AÌ
AÌ
Aten Rd
Au
stin R
d
Cruickshank Rd
Evan Hewes Hwy
Ross Rd
Danenberg Rd
McCabe Rd
Treshill Rd
Villa Rd
Orange Ave
La B
ruch
erie Rd
Clark R
d
Do
gw
oo
d R
d
Co
oley R
d
Fo
urth
St
City ofImperial
FIGURE 4.1DISTRIBUTION OF FIREFLOW REQUIREMENTSWATER MASTER PLANCITY OF EL CENTRO
0 3,500 7,000Feet
�
Legend
Roads
Sphere of Influence
City Limits
Fire Flow Requirement
1,000 gpm
2,000 gpm
3,000 gpm
4,000 gpm

FINAL - February 13, 2008 4-8 H:\client\City_ElCentro_PAS\04 Reports\04.2 Final\04.2d Final to Client\Ch04.doc
4.6.3 Earthquake
In case of an earthquake, the City should have sufficient water and pressure to maintain a minimum level of water service for 14 days. In addition, the system pressure should not be less than 40 psi at any location in the distribution system. It is assumed that an earthquake would damage not more than one storage tank or the WTP (not both simultaneously). It is also assumed that 14 days would provide sufficient time to make temporary repairs and resume operations of the damaged water supply and/or storage and PS facilities. However, it should be noted that the repair time of facilities will be much greater in the case of a severe emergency than under normal conditions, due to a high demand for contractors. It is assumed that public notices would be posted to request customers to conserve water and that these efforts would reduce water demands to MinDD, regardless of the time of year.
In addition, an earthquake can destroy the IDD canal that supplies water to the raw water ponds at the City’s WTP. It is assumed that the City can construct a temporary pipeline within a couple of days to convey raw water from one of the other canals to the WTP. As mentioned in Section 4.6.1, the use of raw water is acceptable in an emergency to continue water supply service and fire flow protection as long as boil-water-notices are issued.
In case all canals in the City’s surrounding are destroyed, water supply would be temporarily interrupted unless a minimal water supply could be maintained by delivering water with trucks to the City’s storage facilities.
4.6.4 Pipeline Breaks
In case of a break in a pipeline, the City should have sufficient water and pressure to meet MDD at a minimum of 40 psi. It is assumed that only one transmission main break would occur at a time and that this incident should not affect the water service in the City.
4.7 BOOSTER STATION REQUIREMENTS
Due to the flat topography within the City’s service area, there is only one pressure zone, which is supplied from two booster stations that pump directly into the distribution system. These booster stations are located at the WTP and at the La Brucherie Tank. The La Brucherie PS is typically only used to pump water into the system during peak water demands. The condition that requires the largest pumping capacity governs the pump station sizing. The evaluation criteria require that the pump stations meet PHD with the largest pump station out of service and also meet MDD with at least 40 psi of pressure. In the City of El Centro, the largest pump station is the one at the WTP, which provides a majority of the water during normal and peak hour conditions.

FINAL - February 13, 2008 4-9 H:\client\City_ElCentro_PAS\04 Reports\04.2 Final\04.2d Final to Client\Ch04.doc
The available booster station capacity needs to be sufficient to meet the following conditions:
• Meet PHD with the largest pump unit out of service.
• Meet MDD with back-up power only.
• Meet ADD with the largest PS out of service.
4.8 DISTRIBUTION SYSTEM
This section presents the standards that will be used in the Master Plan in evaluating the distribution system and consists of three subsections:
• Pipeline diameters.
• Roughness coefficients.
• Age replacements.
4.8.1 Pipeline Diameters
Any pipeline 12 inches in diameter and larger is typically considered to be a transmission pipeline, while pipelines that are 10-inches in diameter and smaller are considered to be distribution pipelines. The existing pipes in the distribution system range between 0.75 inches and 12 inches in diameter. Pipeline sizes used for pipeline upgrades or system expansions will be based on the standard diameters listed in Table 4.2. The non-standard 20-inch diameter pipeline is considered as an alternative to 24 inches with respect to potential cost savings. As shown in Table 4.2, the smallest pipeline considered is 8-inches in diameter.
Table 4.2 Standard Pipeline Sizes Water System Master Plan City of El Centro
Pipe Diameter Type Size
8 inches Standard Size
12 inches Standard Size
16 inches Standard Size
18 inches Non-standard Size
20 inches Non-standard Size
24 inches Standard Size
30 inches Standard Size
FINAL - February 13, 2008 4-10 H:\client\City_ElCentro_PAS\04 Reports\04.2 Final\04.2d Final to Client\Ch04.doc
4.8.2 Roughness Coefficients
The roughness coefficients (C-factors) of existing pipelines are determined based on the results from model calibration of hydrant tests. Roughness coefficients of 110 to 130 is used in the hydraulic model for new pipelines and replacement pipelines (see Table 5.2 for details).
4.8.3 Age Replacements
For the identification of pipeline replacements, a typical life expectancy of 75 years was used for pipelines. All pipelines older than 75 years (pre-1932) are recommended for replacement. The approximate time of each development is used as an indicator for pipeline age, as the year of installation for 27 miles (19 percent) of pipelines is unknown (Table 3.4).

FINAL - February 13, 2008 5-1 H:\client\City_ElCentro_PAS\04 Reports\04.2 Final\04.2d Final to Client\Ch05.doc
Chapter 5
MODEL DEVELOPMENT
This chapter presents an overview of the water system hydraulic model development. The purpose of this model is to provide the City of El Centro (City) with a tool that can be used to evaluate the hydraulics of the water distribution system under existing and future demand conditions. In addition, this model is used to size pipelines and facilities to address the identified system deficiencies.
5.1 MODEL CREATION
The City's hydraulic model combines information on the physical and operational characteristics of the water system and performs calculations to solve a series of mathematical equations to simulate the hydraulics in the City’s distribution system. Steps involved in the model creation process are:
• Software Selection.
• Data Gathering and Validation.
• Skeletonizing GIS Data.
• Network Configuration (Pipes and Nodes).
• Facility Configuration (Water Treatment Plant, Tanks, and Booster Stations).
• Elevation Allocation.
• Demand Allocation.
• System Controls.
This section discusses these eight steps of the model creation.
5.1.1 Software Selection
There is an abundance of network analysis software in the marketplace today with a variety of features and capabilities. The selection of a particular modeling suite generally depends on user preferences with operating platform, the operational requirements of the water system, and cost.
It was decided that the software that best meets the requirements of the City’s water system master plan is the H2OMAP Water Version 7.0 Update 15 developed by MWH Soft. H2OMAP Water provides a graphical approach to the hydraulic analysis of water distribution systems. The program allows seamless integration with the City’s Geographical Information System (GIS) data and is a stand-alone product that requires no other software applications.

FINAL - February 13, 2008 5-2 H:\client\City_ElCentro_PAS\04 Reports\04.2 Final\04.2d Final to Client\Ch05.doc
5.1.2 Data Collection and Validation
Data necessary for the development of the hydraulic model were collected from City’s engineering and operations staff. The data included the following:
• Water pipelines in GIS (shapefiles).
• Water node elements in GIS (shapefiles).
• Water system facility locations from GIS (shapefiles).
• Water atlas sheets.
• As-built drawings.
• System pump curve data.
• System controls through conversations with City operators.
The data validation process included a review by City engineering, operations, and field maintenance staff of the City's water system as-built maps. City staff comments were used to help revise the hydraulic model where necessary. The system operational data and controls were collected from City staff familiar with the day-to-day operation of the water system.
Standard quality control procedures were performed to verify the connectivity of the GIS information. This included routines such as Pipe Split Candidates, Parallel Pipes, Trace Network Disconnected, and Nodes in Close Proximity. Additional questions were developed during the review of the GIS data such as missing pipes and diameter discrepancies. These items were resolved using the as-built drawings, atlas sheets, and conversations with City staff.
5.1.3 Skeletonizing GIS Data
All pipelines included in the hydraulic model are obtained from the GIS information provided by Nobel Systems or the as-built drawing and Atlas Maps viewable from the Geoviewer. Key hydraulic parameters used in the model were gathered directly from the GIS information and included pipe diameter, year of installation, pressure zone, and pipeline material. The original GIS database consists of more than 20,000 pipes and includes the majority of the pipelines installed by April 2007. During the modeling process, additional pipelines were identified as missing in the original GIS datasets. These missing pipelines were added to the model manually using the as-built drawings and Atlas Maps available from Nobel Systems Geoviewer application.
To make the model more manageable and usable, the model pipelines had to be skeletonized. This process was necessary to run the model using the 4,000-link hydraulic model software license size agreed upon for this project.

FINAL - February 13, 2008 5-3 H:\client\City_ElCentro_PAS\04 Reports\04.2 Final\04.2d Final to Client\Ch05.doc
Skeletonizing is the process of reducing the number of links within a hydraulic model and is typically completed using automated software routines that are available in the MWH Soft H2OMAP Suite tools. By selecting the appropriate skeletonizing criteria, the number of links can be reduced significantly without loosing important hydraulic information.
Skeletonizing was completed by reducing the number of pipelines in the system considered as hydraulically non-significant. The purpose of skeletonizing a system is to minimize the number of pipelines in the model while still having a model that accurately simulates the hydraulics of the flow of water conveyed through the system. The pipeline reduction was accomplished by the following two major steps:
1. Removal of pipes by use of series pipe reduction based on common diameter and pipe material. This step resulted in the removal of pipe breaks at all system gate valves.
2. Removal (trimming) of dead-end pipes less than an acceptable dead-end tolerance. This step removed short dead-end mainlines and all lateral lines used for hydrants and larger service meters.
After skeletonization, the model was reduced to approximately 3,500 pipe and link elements. A graphical representation of the City’s hydraulic model is presented in Figure 5.1.
5.1.4 Network Configuration
Computer modeling requires gathering detailed numerical information on the physical characteristics of the water system pipelines, such as pipe diameters, lengths, roughness coefficients, and the connectivity of pipes and nodes. Initial data provided in the original GIS included all pipelines, including laterals. Data used to create the model had to be sub-selected from the original GIS provided to include only laterals and points where the main pipelines were split.
Pipe and node components represent the physical elements of the water network. A node represents a location in the network where a demand can be applied or water can be supplied to the system, as well as a location where pipes change characteristics or are connected. Node locations in the model were created directly from elements in the GIS.
The modeled network contains 3,544 pipelines and 3,100 nodes. The diameter distribution of the modeled pipelines is listed in Table 5.1.

FINAL - February 13, 2008 5-4 H:\client\City_ElCentro_PAS\04 Reports\04.2 Final\04.2d Final to Client\Ch05.doc
Fig
ure
5.1
S
cree
n C
aptu
re o
f H
ydra
ulic
Mo
del

FINAL - February 13, 2008 5-5 H:\client\City_ElCentro_PAS\04 Reports\04.2 Final\04.2d Final to Client\Ch05.doc
Table 5.1 Pipeline Diameter Distribution Water System Master Plan City of El Centro
Diameter (in)
Length (ft)
Length (mi)
Percent (%)
4" or smaller 13,200 2.5 2%
6 184,700 35.0 24%
8 292,600 55.0 39%
10 8,900 1.7 1%
12 173,000 32.8 23%
14 0 0.0 <1%
18 64,400 12.2 8%
20 11,900 2.3 2%
24 5,600 1.1 1%
30 3,800 0.7 <1%
Total 758,200 144.0 100%
Notes: (1) The total length and distribution of pipe diameters included in the hydraulic model
differs from the GIS summary presented in Table 3.2 due to modifications made during model construction, calibration, and verification with City staff.
The roughness coefficients (C-factors) in the model were initially assigned based on the pipeline material presented in Table 5.2. As shown in this table, the C-factors in the model range from 90 to 130. It should be noted that some of these factors were adjusted during model calibration as discussed in Section 5.2.
Table 5.2 C-Factor Allocation Water System Master Plan City of El Centro
Material Code in Model Material Description C-factor
PVC Polyvinyl Chloride Pipe (PVC) 130
STL Steel (Unlined) 110
DIP Ductile Iron Pipe 120
AC Asbestos Cement 130
CIP 30-yr Cast Iron Pipe Slight Attack 110
GALV Galvanized Pipe 110

FINAL - February 13, 2008 5-6 H:\client\City_ElCentro_PAS\04 Reports\04.2 Final\04.2d Final to Client\Ch05.doc
5.1.5 Facility Configuration
The model includes several water system facilities that are modeled such that the model configuration represents the basic configuration and operations of these facilities in the field. The City’s model includes the following facilities:
• Water Treatment Plant (WTP).
• Storage Reservoirs.
• Pump Stations (PS).
The system does not include any groundwater wells, pressure reducing stations or inter-agency connections.
5.1.5.1 Water Treatment Plant
The City’s WTP is modeled as an unlimited source of supply, which is represented by a fixed grade node. The hydraulic grade line (HGL) of this facility is set at -26 ft msl, which corresponds to approximately a water level of 18 to 20 feet in the treated water storage tanks. The raw water storage ponds and the treated water reservoirs are not included in the model.
In addition, to simplify the use of the model for future model runs without the need of changing the settings on the variable frequency drive (VFD) pumps, the WTP facility is also modeled as a fixed grade node (unlimited source of supply) and a pressure-reducing valve (PRV). This WTP configuration is used for all existing and future system analyses runs and replaces the configuration used during model calibration. This model set-up makes the model more user-friendly, however, the flow through the PRV needs to be verified to ensure that the WTP does not provide more water than actually available.
5.1.5.2 Storage Reservoirs
Tank and reservoir components are used to represent storage tanks, reservoirs, water treatment plant supplies, or the groundwater aquifer. The specified dimensions, storage type, and hydraulic grade (head) determine the performance of these components in the model. A cylindrical storage tank was used to model the remote storage facility, while a fixed head reservoir was used to represent the WTP supply. The modeling characteristics of the storage reservoirs included in the model are summarized in Table 5.3.

FINAL - February 13, 2008 5-7 H:\client\City_ElCentro_PAS\04 Reports\04.2 Final\04.2d Final to Client\Ch05.doc
Table 5.3 Storage Reservoir Characteristics Water System Master Plan City of El Centro
Model ID Tank Type Diameter
(ft)
Ground Elevation (ft msl)
Maximum Elevation
(ft)
Initial Water Level
(ft) Head (ft)
LBB_TANK Circular 150 -37.00 40 30 n/a
WTP_POT_WTR
Fixed Grade Node
n/a n/a n/a n/a -26
5.1.5.3 Pump Stations
Pump components are used to represent booster station pumps or well pumps. All system pumps were modeled with their system controls as explained by the City’s operation department.
All booster pumps in the City’s two booster stations are variable frequency drive (VFD) pumps and are modeled with multi-point pump curves that are based on a combination of the manufacturer’s pump curve and the most recent pump tests. Information input on each model pump includes pump speed (%), pump curve, and any specific control criteria identified. The WTP pumps operate by maintaining a set discharge pressure of approximately 56 psi by automatically adjusting the speed of all pumps simultaneously. If the pressure at the WTP pump station discharge cannot be maintained during peak demand periods this will trigger the La Brucherie pump station to come on to help maintain the desired system pressure.
The modeling characteristics of the storage reservoirs included in the model are summarized in Table 5.4.
Table 5.4 Booster Station Characteristics Water System Master Plan City of El Centro
Pump Station
Model ID
Pump Unit
Design Head (ft)
Design Flow (gpm)
Pump Capacity
(hp)
WTP PS WTP_BSTR_1 1 156 4,000 200
WTP_BSTR_2 2 145 4,000 200
WTP_BSTR_3 3 145 4,000 200
WTP_BSTR_4 4 145 4,000 200
LBB_BP_1 1 128 4,000 200 La Brucherie PS
LBB_BP_2 2 126 4,000 200

FINAL - February 13, 2008 5-8 H:\client\City_ElCentro_PAS\04 Reports\04.2 Final\04.2d Final to Client\Ch05.doc
5.1.6 Elevation Allocation
Elevation allocation is the process of assigning elevations to model nodes. The El Centro region is relatively flat and allows the existing system to operate with only one pressure zone. Elevation data from the United States Geological Survey (USGS) was used for this project. A digital elevation model (DEM) was obtained from the USGS website.
Model elevations were assigned to the model using the elevation extractor routine in the H2OMAP software, which assigns the elevations from the DEM raster file to the model nodes. Elevation data was also copied to the DEM_ELEV field to maintain a record of the elevation assigned automatically from the DEM.
5.1.7 Demand Allocation
Demand allocation is the process of assigning water demands to model nodes, such that the spatial distribution of demands represents the actual demand distribution in the City as close as possible. Demand distribution is important to create a model that simulates field hydraulics accurately.
Customer demands were estimated by parcel using the parcel area and the specified water demand factor (WDF) developed by land use type. These WDFs are discussed in Chapter 2 of this report. GIS routines were used to calculate the average day demand (ADD) per parcel and then assign these demands to the closest model node.
These demands were then assigned to the model using the automated H2OMAP Suite demand allocation extension using the closest “loadable model pipe” method. The loadable pipes were identified using the DMD_PIPE field in the model. Only pipes with a “YES” value in this field were used for the demand allocation. Transmission mains and pipelines at the water system facilities were excluded from the demand allocation process, as these pipelines do not have any service connections. Subsequently, the distance-weighted formula was then used to apportion the parcel demand to the two nodes connected to that model pipe. With this demand allocation method, the demand of each model node represents the aggregate demand of its surrounding parcels.
This routine allocated roughly 99.08 percent of the 5,977-gpm (or 8.6-mgd) demand identified in the EXIST_GPM field of the PARCEL_CENTROID shapefile.
The allocated demand is represented by the demand set EX_ADM_DMD in the model and is just slightly lower than the loading shapefile provided but not to a significant degree. To account for the remaining 0.92 percent of demand that was not allocated, all model demands were scaled up to allocate the remaining demand by using a global multiplier. The scaled model demand set is represented by the demand set EX_ADP_DMD.
This demand set was used as the basis to create the demand sets for maximum day demand (MDD) and peak hour demand (PHD) conditions as summarized in Table 5.5.

FINAL - February 13, 2008 5-9 H:\client\City_ElCentro_PAS\04 Reports\04.2 Final\04.2d Final to Client\Ch05.doc
Table 5.5 Demand Allocation Water System Master Plan City of El Centro
Year Demand Scenario
Demand (gpm)
Demand (mgd) Multiplier
2006 ADD 5,977 8.6 1.0 x ADD
MDD 9,559 13.8 1.6 x ADD
PHD 16,131 23.2 2.7 x ADD
2015 ADD 6,299 9.1 1.0 x ADD
MDD 10,078 14.5 1.6 x ADD
PHD 17,006 24.5 2.7 x ADD
Build-Out ADD 19,267 27.6 1.0 x ADD
MDD 30,827 44.3 1.6 x ADD
PHD 52,021 74.5 2.7 x ADD
5.1.8 System Controls
The booster pump stations at the WTP and the remote storage tank have VFD pumps and are controlled to maintain a fixed discharge pressure of approximately 56 psi by automatically adjusting the speed of their pumps. The speed setting in the model is adjusted for the various demand conditions to maintain the appropriate pressure as summarized in Table 5.6.
Table 5.6 System Controls Water System Master Plan City of El Centro
Year Demand Scenario
Speed Setting at WTP PS
Speed Setting at Remote Tank PS
2006 ADD n/a (off) n/a (off)
MDD 0.80 0.80
PHD 0.88 0.88
2015 ADD n/a (off) n/a (off)
MDD n/a (PRV used)(1) 0.80
PHD n/a (PRV used)(1) 0.85
Build-Out ADD n/a (off) n/a (off)
MDD n/a (PRV used)(1) 0.80
PHD n/a (PRV used)(1) 0.85
Notes:
1) The WTP PS was modeled with a PRV for future model runs (see Section 5.1.5.1).

FINAL - February 13, 2008 5-10 H:\client\City_ElCentro_PAS\04 Reports\04.2 Final\04.2d Final to Client\Ch05.doc
In addition, the booster pumps at the remote storage tanks only operate during the peak hour demand periods. The pumps are closed during the low demand hours when the tank is filled through an altitude valve, which is modeled as a pressure sustaining valve (PSV). The setting of this PSV is 17 psi, which corresponds to the maximum water level in the remote storage tank (40 ft).
Time controls for the pumps and PSV at the La Brucherie PS are not included in the model, because the model was created and calibrated for steady state conditions only. The booster pumps at both the WTP PS and the La Brucherie PS are assumed to be operating under all MDD and PHD scenarios. The pumps at the La Brucherie PS are turned off for all ADD and minimum day demand (MinDD) scenarios. The pump settings used for model calibration are based on actual the field conditions at the time of each hydrant test as discussed in detail in Section 5.2.
5.2 MODEL CALIBRATION
The City’s hydraulic model was calibrated to verify the reliability of the model results and make adjustment where necessary to increase the model accuracy. Calibration can be performed for either steady state (SS) or for extended period simulation (EPS) conditions. SS calibration is based on the comparison of field data and model results for one snapshot in time. SS calibration is typically used as the first step in model calibration and is primarily focused on system pressures, system connectivity, and roughness factors for pipelines. EPS calibration consists of the comparison of the difference in field conditions and model results over an extended period, such as 24-hours or one week in hourly increments or less. EPS calibration allows the comparison of trends in system pressures and water levels during the course of a day with low and high demand periods.
Due to the absence of available Supervisory Control and Data Acquisition (SCADA) data, EPS calibration was not feasible for the City’s hydraulic model. The model was therefore only calibrated for SS conditions using fire flow tests.
5.2.1 Fire Flow Testing
Ten fire flow testing sites were selected to gather field data for the SS calibration. These tests sites were selected such that they represent the entire distribution system and are using a variety of pipeline diameters and pipeline materials to get a good representation of various roughness coefficients (C-factors).
Fire flow tests are used to stress the water system and create as much friction in the pipeline as possible to obtain information on the effect on system pressures and to calibrate the C-factors in the model. During each fire flow test, one fire hydrant (flowing hydrant) was opened using both the 4-inch and 2.5-inch nozzles simultaneously and pressure measurements were taken before, during, and after each test. The system pressures with the hydrants closed is referred to as the static pressure, while the system pressure with the

FINAL - February 13, 2008 5-11 H:\client\City_ElCentro_PAS\04 Reports\04.2 Final\04.2d Final to Client\Ch05.doc
hydrant flowing is referred to as the residual pressure. Typically, hydrants in close vicinity to the flowing hydrant are used to collect the static and residual pressures (pressure hydrants). The following parameters were recorded during each fire flow test:
• Flow at hydrant(s).
• Static and residual pressure at the neighboring hydrants.
• Static and residual pressure at the discharge side of the La Brucherie PS and WTP PS.
• Status and speed settings of the pumps at the WTP PS.
• Tank levels at the WTP finished water storage tank.
• Speed settings for the La Brucherie PS and the tank levels for the La Brucherie Tank were not taken because the city disabled the La Brucherie facility during the testing period.
The fire flow testing was conducted on October 11, 2007 and consisted of ten different fire flow tests across the water distribution system. The locations of the test sites are shown on Figure 5.2, while detailed schematics of each test site are included in Appendix C.
5.2.2 Calibration Set-up
Steady state testing is very useful to validate system connectivity and the pipeline roughness values used in the model. This is best accomplished by comparing the pressure drop at each location that occurred between the static and dynamic tests. If the pressure drops observed in the field, and in the model are close (within 5 percent) this provides great confirmation that the system connectivity and pipeline roughness factors are representative of what is in the field.
The total system demand on October 11, 2007 was calculated to be approximately 7.8 mgd (1.14 times ADD), which is approximately 1.14 times the allocated existing system demands.

[�
%,
%,
kj
kj
A³
A³
!"_$ !"_$
AÌ
Au
stin R
d
Cruickshank Rd
Evan Hewes Hwy
Ross Rd
Danenberg Rd
McCabe Rd
Treshill Rd
Villa Rd
Orange Ave
La B
ruch
erie Rd
Clark R
d
Do
gw
oo
d R
d
Co
oley R
d
Fo
urth
St
Test #10
Test #5
Test #1
Test #3Test #4
Test #2
Test #8
Test #7
Test #11Test #13
Test #12
Test #9
Test #6
FIGURE 5.2LOCATIONS OF FIRE
HYDRANT TEST SITESWATER MASTER PLANCITY OF EL CENTRO
0 3,000 6,000Feet
�
Legend
City Limits
Facilities
[� WTP
kj Reservoir
%, Pump Station
Fire Hydrant Test Site
Test #1
Test #2
Test #3
Test #4
Test #5
Test #6
Test #7
Test #8
Test #9
Test #10
Test #11
Test #12
Test #13
Pipelines by Diameter
8" and Smaller
10" and Larger

FINAL - February 13, 2008 5-13 H:\client\City_ElCentro_PAS\04 Reports\04.2 Final\04.2d Final to Client\Ch05.doc
The system operations of the WTP PS varied over the course of the day to meet the system demand. However, the operations of the La Brucherie PS did not vary because this facility was disabled during the testing period. To model the boundary conditions of each test appropriately, a separate control set was created in the model that specifies the exact speed settings used at the VFD pumps at the time of each fire flow test. This control set is called FTXX. The “XX” represents the hydrant test number such as 01, 02, or 10.
5.2.3 Calibration Results
Model comparisons were made using the initial field pressure drop observed during the testing. The static pressures were calibrated first, while the residual pressures were calibrated after the static calibration results were satisfactory.
During calibration of the static pressures, the following adjustments were made to the model to get a reasonable match between the model results and the field data:
• System demands were adjusted to match the WTP flow during the fire flow test periods. Each fire flow test used the same base system demand adjusted to match the WTP PS flow.
• Information obtained from the City’s operations staff during field testing was used to make modifications to the model connectivity, facility layouts, and system controls.
• Although pipe diameter, lengths, and location are typically known, some gaps in the GIS data were found. Pipeline connectivity was adjusted in the model where needed to match the field measurements as closely as possible using information obtained from as-built drawings and Atlas Maps.
• Adjustment of the HGL of the treatment plant (WTP_POT_WTR) feeding the WTP booster pumps until the best fit for all static tests was obtained. The best fit was found to correspond to an HGL of 26 feet below msl, which corresponds to a water level of approximately 18 to 20 feet in the finished water storage tanks. Using this data the model was able to match the WTP discharge pressure to within approximately 5 psi of the value measured in the field for all tests.
• The speed setting for each WTP PS was adjusted in each fire test scenario to match the speed value observed in the field. The same speed setting was used for both the static and dynamic test runs.
During the calibration of the residual pressures, the following adjustments were made to the model to get a reasonable match between the model results and the field data:
• Changed C-factors from 110 to 90 on the cast iron pipes (CIP) along Hamilton Avenue between South Hope Avenue and South Dogwood Road (PIP_7220, PIP_7225, PIP_7248, PIP_7249, PIP_7262, PIP_7263).

FINAL - February 13, 2008 5-14 H:\client\City_ElCentro_PAS\04 Reports\04.2 Final\04.2d Final to Client\Ch05.doc
• Added missing pipe PIP_11001, which closes an 8-inch diameter loop on Wensley Street, between Lotus Avenue and 23rd Street.
• Identified two potentially closed valves on two of the following four roads; Manual Ortiz Avenue, Valleyview Avenue, Fieldview Avenue, and/or Palmview Avenue.
It should be noted that the WTP pump speed was not adjusted for runs with the hydrants flowing (dynamic runs). Model runs used the initial pressure drop observed in the field before the WTP pumps modified their speed in a manner similar to what the El Centro Fire Department does when they perform hydrant testing. This procedure was selected as this gave the highest model pressure drop and allowed calibration to focus on connectivity and pipeline headloss.
A check of the validity of this method was completed for two model runs. In these runs, the WTP speed settings were adjusted to match the speed adjustments in the field that occurred after system responded to the increased flow from the test hydrant. The adjustment of the VFD speed settings in the field resulted in rebound of initial residual pressures to pressures that were much closer to the static pressures. Due to the operation with VFDs, the overall pressure drop (after the system stabilized with the new VFD settings) ranges from 2 to 20 psi. Test runs using this method provided similar pressure drop comparisons between field and model results that were nearly identical to those from the previous method. In light of this no additional test comparisons were completed.
The model calibration results are summarized in Table 5.7, while a detailed summary of all results is included in Appendix C. As shown in Table 5.7, tests 2, 12, and 13 were not performed due to location. Proposed test site 2 was located on school grounds, test site 12 was located at a trailer park, and test site 13 was on private grounds.
As shown in Table 5.7, approximately 90 percent of the static pressure comparison points in the model match the field static pressure within 5 psi while the remaining 10 percent match within 7 psi. In addition, 90 percent of the residual pressure comparison points match the field residual pressure within 5 psi while the remaining 10 percent match within 7 psi. In addition, a comparison of the field pressure drop to the model pressure drop reveals that 85 percent of all test comparison points are within 3 psi while the remaining 15 percent match within 5 psi. The average difference between all model results and field values is 2.5 psi.
Based on these results it can be concluded that the model is well calibrated to steady state conditions and that the model connectivity and pipeline C-factors provide an accurate representation of the City’s distribution system and system operations primarily due to the close similarity between the model and field pressure drop. This model is further modified to present future system demand conditions and is used for the system analysis described in Section 6.

FINAL - February 13, 2008 5-15 H:\client\City_ElCentro_PAS\04 Reports\04.2 Final\04.2d Final to Client\Ch05.doc
Table 5.7 Model Calibration Results - Static and Dynamic Pressures Water System Master Plan City of El Centro
Static Residual Pressure Drop Fire Flow Test(1)
Hydrant Flow (gpm)
Field (psi)
Model (psi)
Diff (psi)
Diff (%)
Field (psi)
Model (psi)
Diff (psi)
Diff (%)
Field (psi)
Model (psi)
Diff (psi)
Diff (%)
1 1,978 64 64 0 1% 54 57 3 5% 7 10 -3 50%
3 1,830 64 67 3 5% 54 60 6 10% 8 10 -2 28%
4 2,060 62 63 1 1% 54 58 4 7% 5 8 -3 67%
5 1,470 63 65 2 3% 60 61 1 1% 4 3 1 28%
6 2,263 60 61 2 2% 54 58 4 7% 4 6 -2 53%
7 2,325 62 61 -1 1% 58 57 -1 2% 4 4 1 11%
8 2,316 66 66 -1 1% 60 59 -1 1% 6 6 0 6%
9 2,069 65 68 3 4% 46 46 0 1% 22 19 3 13%
10 2,197 64 68 4 6% 50 57 7 14% 11 14 -3 29%
11 2,158 60 58 -2 4% 46 47 2 2% 11 14 -3 27%
Notes: (1) Tests 2, 12, and 13 were not performed due to location constraints. (2) Numbers may not add up due to rounding to the nearest 1 psi.