Citigroup Plutonomy
35
Equity Strategy October 16, 2005 Ajay Kapur, CFA +1-212-816-4813 [email protected] Niall Macleod +44-20-7986-4449 [email protected] Narendra Singh +1-212-816-2807 [email protected] SUMMARY ➤ The World is dividing into two blocs - the Plutonomy and the rest. The U.S., UK, and Canada are the key Plutonomies - economies powered by the wealthy. Continental Europe (ex-Italy) and Japan are in the egalitarian bloc. ➤ Equity risk premium embedded in “global imbalances” are unwarranted. In plutonomies the rich absorb a disproportionate chunk of the economy and have a massive impact on reported aggregate numbers like savings rates, current account deficits, consumption levels, etc. This imbalance in inequality expresses itself in the standard scary “ global imbalances”. We worry less. ➤ There is no “average consumer” in a Plutonomy. Consensus analyses focusing on the “average” consumer are flawed from the start. The Plutonomy Stock Basket outperformed MSCI AC World by 6.8% per year since 1985. Does even better if equities beat housing. Select names: Julius Baer, Bulgari, Richemont, Kuoni, and Toll Brothers. WELCOME TO THE PLUTONOMY MACHINE In early September we wrote about the (ir)relevance of oil to equities and introduced the idea that the U.S.is a Plutonomy - a concept that generated great interest from our clients. As global strategists, this got us thinking about how to buy stocks based on this plutonomy thesis, and the subsequent thesis that it will gather strength and amass breadth. In researching this idea on a global level and looking for stock ideas we also chanced upon some interesting big picture implications. This process manifested itself with our own provocative thesis: that the so called “global imbalances” that worry so many of our equity clients who may subsequently put a lower multiple on equities due to these imbalances, is not as dangerous and hostile as one might think. Our economics team led by Lewis Alexander researches and writes about these issues regularly and they are the experts. But as we went about our business of finding stock ideas for our clients, we thought it important to highlight this provocative macro thesis that emerged, and if correct, could have major implications in terms of how equity investors assess the risk embedded in equity markets. Sometimes kicking the tires can tell you a lot about the car-business. Well, here goes. Little of this note should tally with conventional thinking. Indeed, traditional thinking is likely to have issues with most of it. We will posit that: 1) the world is dividing into two blocs - the plutonomies, where economic growth is powered by and largely consumed by the wealthy few, and the rest. Plutonomies have occurred before in sixteenth century Spain, in seventeenth century Holland, the Gilded Age and the Roaring Twenties in the U.S. What are the common drivers of Plutonomy? Disruptive technology-driven productivity gains, creative financial innovation, capitalist- See page 33 for Analyst Certification and Important Disclosures Industry Note Citigroup Research is a division of Citigroup Global Markets Inc. (the "Firm"), which does and seeks to do business with companies covered in its research reports. As a result, investors should be aware that the Firm may have a conflict of interest that could affect the objectivity of this report. Investors should consider this report as only a single factor in making their investment decision. Non-US research analysts who have prepared this report, and who may be associated persons of the member or member organization, are not registered/qualified as research analysts with the NYSE and/or NASD, but instead have satisfied the registration/qualification requirements or other research-related standards of a non-US jurisdiction. Global
description
Citigroup analysts talk inequality, the eclipsing of democracy, and how Citi investors can capitalise on these global trends.
Transcript of Citigroup Plutonomy

Equity Strategy1MVUPOPNZ���#VZJOH�-VYVSZ �&YQMBJOJOH�(MPCBM�*NCBMBODFT
October 16, 2005
Ajay Kapur, [email protected]
Niall [email protected]
Narendra [email protected]
SUMMARY
➤ The World is dividing into two blocs - the Plutonomy and the rest. The U.S.,UK, and Canada are the key Plutonomies - economies powered by the wealthy.Continental Europe (ex-Italy) and Japan are in the egalitarian bloc.
➤ Equity risk premium embedded in “global imbalances” are unwarranted. Inplutonomies the rich absorb a disproportionate chunk of the economy and havea massive impact on reported aggregate numbers like savings rates, currentaccount deficits, consumption levels, etc. This imbalance in inequalityexpresses itself in the standard scary “ global imbalances”. We worry less.
➤ There is no “average consumer” in a Plutonomy. Consensus analyses focusingon the “average” consumer are flawed from the start. The Plutonomy StockBasket outperformed MSCI AC World by 6.8% per year since 1985. Doeseven better if equities beat housing. Select names: Julius Baer, Bulgari,Richemont, Kuoni, and Toll Brothers.
WELCOME TO THE PLUTONOMY MACHINEIn early September we wrote about the (ir)relevance of oil to equities and introduced theidea that the U.S.is a Plutonomy - a concept that generated great interest from ourclients. As global strategists, this got us thinking about how to buy stocks based on thisplutonomy thesis, and the subsequent thesis that it will gather strength and amassbreadth. In researching this idea on a global level and looking for stock ideas we alsochanced upon some interesting big picture implications. This process manifested itselfwith our own provocative thesis: that the so called “global imbalances” that worry somany of our equity clients who may subsequently put a lower multiple on equities due tothese imbalances, is not as dangerous and hostile as one might think. Our economicsteam led by Lewis Alexander researches and writes about these issues regularly and theyare the experts. But as we went about our business of finding stock ideas for our clients,we thought it important to highlight this provocative macro thesis that emerged, and ifcorrect, could have major implications in terms of how equity investors assess the riskembedded in equity markets. Sometimes kicking the tires can tell you a lot about thecar-business.
Well, here goes. Little of this note should tally with conventional thinking. Indeed,traditional thinking is likely to have issues with most of it. We will posit that: 1) theworld is dividing into two blocs - the plutonomies, where economic growth is poweredby and largely consumed by the wealthy few, and the rest. Plutonomies have occurredbefore in sixteenth century Spain, in seventeenth century Holland, the Gilded Age andthe Roaring Twenties in the U.S. What are the common drivers of Plutonomy?Disruptive technology-driven productivity gains, creative financial innovation, capitalist-
See page 33 for Analyst Certification and Important Disclosures
Industry Note
Citigroup Research is a division of Citigroup Global Markets Inc. (the "Firm"), which does and seeks to do business with companies covered in its research reports. Asa result, investors should be aware that the Firm may have a conflict of interest that could affect the objectivity of this report. Investors should consider this report asonly a single factor in making their investment decision. Non-US research analysts who have prepared this report, and who may be associated persons of the memberor member organization, are not registered/qualified as research analysts with the NYSE and/or NASD, but instead have satisfied the registration/qualificationrequirements or other research-related standards of a non-US jurisdiction.
Glo
ba
l

friendly cooperative governments, an international dimension of immigrants andoverseas conquests invigorating wealth creation, the rule of law, and patentinginventions. Often these wealth waves involve great complexity, exploited best by therich and educated of the time.
2) We project that the plutonomies (the U.S., UK, and Canada) will likely see even moreincome inequality, disproportionately feeding off a further rise in the profit share in theireconomies, capitalist-friendly governments, more technology-driven productivity, andglobalization.
3) Most “Global Imbalances” (high current account deficits and low savings rates, highconsumer debt levels in the Anglo-Saxon world, etc) that continue to (unprofitably) pre-occupy the world’s intelligentsia look a lot less threatening when examined through theprism of plutonomy. The risk premium on equities that might derive from the dyspeptic“global imbalance” school is unwarranted - the earth is not going to be shaken off itsaxis, and sucked into the cosmos by these “imbalances”. The earth is being held up bythe muscular arms of its entrepreneur-plutocrats, like it, or not.
Fixing these “global imbalances” that many pundits fret about requires time travel tochange relative fertility rates in the U.S. versus Japan and Continental Europe. Why?There is compelling evidence that a key driver of current account imbalances isdemographic differences between regions. Clearly, this is tough. Or, it would requiremaking the income distribution in the Anglo-Saxon plutonomies (the U.S., UK, andCanada) less skewed to the rich, and relatively egalitarian Europe and Japan to suddenlyembrace income inequality. Both moves would involve revolutionary tectonic shifts inpolitics and society. Note that we have not taken recourse to the conventional curativesof global rebalance - the dollar needs to drop, either abruptly, or smoothly, the Chineseneed to revalue, the Europeans/Japanese need to pump domestic demand, etc. Thesehave merit, but, in our opinion, miss the key driver of imbalances - the select plutonomyof a few nations, the equality of others. Indeed, it is the “unequal inequality”, or theimbalances in inequality across nations that corresponds with the “global imbalances”that so worry some of the smartest people we know.
4) In a plutonomy there is no such animal as “the U.S. consumer” or “the UKconsumer”, or indeed the “Russian consumer”. There are rich consumers, few innumber, but disproportionate in the gigantic slice of income and consumption they take.There are the rest, the “non-rich”, the multitudinous many, but only accounting forsurprisingly small bites of the national pie. Consensus analyses that do not tease out theprofound impact of the plutonomy on spending power, debt loads, savings rates (andhence current account deficits), oil price impacts etc, i.e., focus on the “average”consumer are flawed from the start. It is easy to drown in a lake with an average depthof 4 feet, if one steps into its deeper extremes. Since consumption accounts for 65% ofthe world economy, and consumer staples and discretionary sectors for 19.8% of theMSCI AC World Index, understanding how the plutonomy impacts consumption is keyfor equity market participants.
5) Since we think the plutonomy is here, is going to get stronger, its membershipswelling from globalized enclaves in the emerging world, we think a “plutonomybasket” of stocks should continue do well. These toys for the wealthy have pricing
2

power, and staying power. They are Giffen goods, more desirable and demanded themore expensive they are.
RIDING THE GRAVY TRAIN - WHERE ARE THE PLUTONOMIES?The U.S., UK, and Canada are world leaders in plutonomy. (While data quality in thisfield can be dated in emerging markets, and less than ideal in developed markets, wehave done our best to source information from the most reliable and crediblegovernment and academic sources. There is an extensive bibliography at the end of thisnote). Countries and regions that are not plutonomies: Scandinavia, France, Germany,other continental Europe (except Italy), and Japan.
THE UNITED STATES PLUTONOMY - THE GILDED AGE, THE ROARING TWENTIES, AND THE NEWMANAGERIAL ARISTOCRACYLet’s dive into some of the details. As Figure 1 shows the top 1% of households in theU.S., (about 1 million households) accounted for about 20% of overall U.S. income in2000, slightly smaller than the share of income of the bottom 60% of households puttogether. That’s about 1 million households compared with 60 million households, bothwith similar slices of the income pie! Clearly, the analysis of the top 1% of U.S.households is paramount. The usual analysis of the “average” U.S. consumer is flawedfrom the start. To continue with the U.S., the top 1% of households also account for33% of net worth, greater than the bottom 90% of households put together. It gets better(or worse, depending on your political stripe) - the top 1% of households account for40% of financial net worth, more than the bottom 95% of households put together. Thisis data for 2000, from the Survey of Consumer Finances (and adjusted by academicEdward Wolff). Since 2000 was the peak year in equities, and the top 1% of householdshave a lot more equities in their net worth than the rest of the population who tend tohave more real estate, these data might exaggerate the U.S. plutonomy a wee bit.
Was the U.S. always a plutonomy - powered by the wealthy, who aggrandized largerchunks of the economy to themselves? Not really. For those interested in the details, werecommend “Wealth and Democracy: A Political History of the American Rich” byKevin Phillips, Broadway Books, 2002.
3
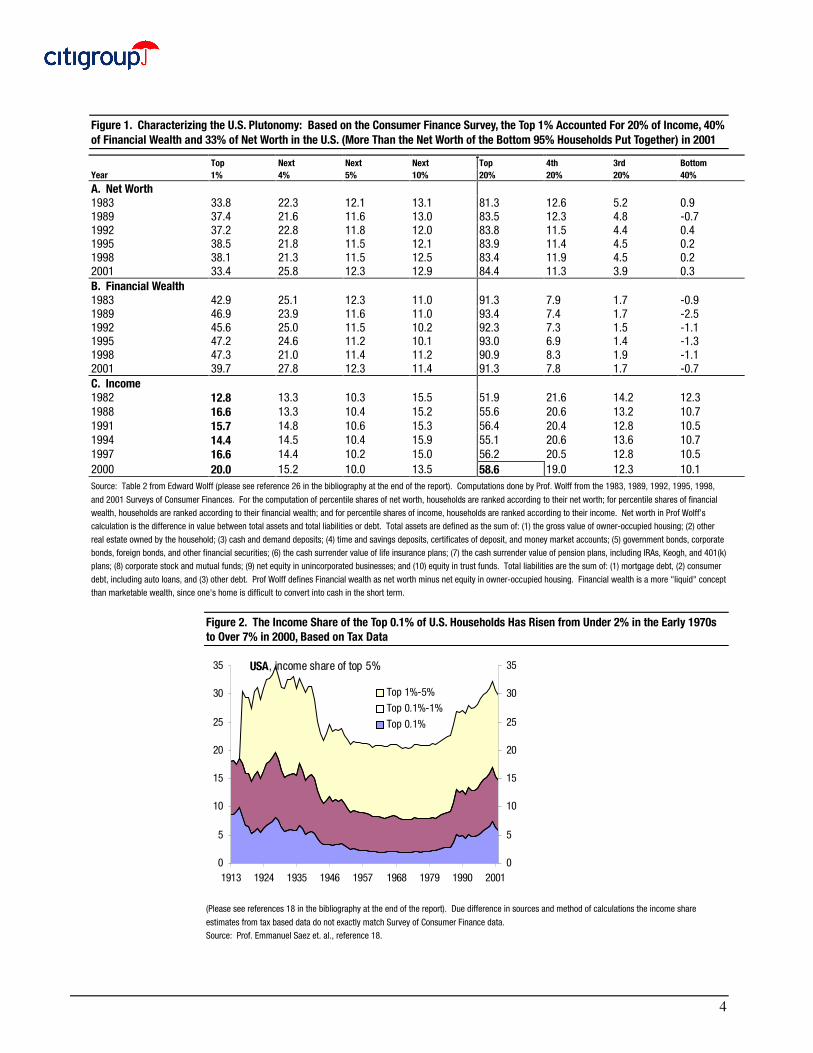
Figure 1. Characterizing the U.S. Plutonomy: Based on the Consumer Finance Survey, the Top 1% Accounted For 20% of Income, 40%of Financial Wealth and 33% of Net Worth in the U.S. (More Than the Net Worth of the Bottom 95% Households Put Together) in 2001
Top Next Next Next Top 4th 3rd BottomYear 1% 4% 5% 10% 20% 20% 20% 40%
A. Net Worth1983 33.8 22.3 12.1 13.1 81.3 12.6 5.2 0.91989 37.4 21.6 11.6 13.0 83.5 12.3 4.8 -0.71992 37.2 22.8 11.8 12.0 83.8 11.5 4.4 0.41995 38.5 21.8 11.5 12.1 83.9 11.4 4.5 0.21998 38.1 21.3 11.5 12.5 83.4 11.9 4.5 0.22001 33.4 25.8 12.3 12.9 84.4 11.3 3.9 0.3B. Financial Wealth1983 42.9 25.1 12.3 11.0 91.3 7.9 1.7 -0.91989 46.9 23.9 11.6 11.0 93.4 7.4 1.7 -2.51992 45.6 25.0 11.5 10.2 92.3 7.3 1.5 -1.11995 47.2 24.6 11.2 10.1 93.0 6.9 1.4 -1.31998 47.3 21.0 11.4 11.2 90.9 8.3 1.9 -1.12001 39.7 27.8 12.3 11.4 91.3 7.8 1.7 -0.7C. Income1982 12.8 13.3 10.3 15.5 51.9 21.6 14.2 12.31988 16.6 13.3 10.4 15.2 55.6 20.6 13.2 10.71991 15.7 14.8 10.6 15.3 56.4 20.4 12.8 10.51994 14.4 14.5 10.4 15.9 55.1 20.6 13.6 10.71997 16.6 14.4 10.2 15.0 56.2 20.5 12.8 10.52000 20.0 15.2 10.0 13.5 58.6 19.0 12.3 10.1Source: Table 2 from Edward Wolff (please see reference 26 in the bibliography at the end of the report). Computations done by Prof. Wolff from the 1983, 1989, 1992, 1995, 1998,
and 2001 Surveys of Consumer Finances. For the computation of percentile shares of net worth, households are ranked according to their net worth; for percentile shares of financial
wealth, households are ranked according to their financial wealth; and for percentile shares of income, households are ranked according to their income. Net worth in Prof Wolff’s
calculation is the difference in value between total assets and total liabilities or debt. Total assets are defined as the sum of: (1) the gross value of owner-occupied housing; (2) other
real estate owned by the household; (3) cash and demand deposits; (4) time and savings deposits, certificates of deposit, and money market accounts; (5) government bonds, corporate
bonds, foreign bonds, and other financial securities; (6) the cash surrender value of life insurance plans; (7) the cash surrender value of pension plans, including IRAs, Keogh, and 401(k)
plans; (8) corporate stock and mutual funds; (9) net equity in unincorporated businesses; and (10) equity in trust funds. Total liabilities are the sum of: (1) mortgage debt, (2) consumer
debt, including auto loans, and (3) other debt. Prof Wolff defines Financial wealth as net worth minus net equity in owner-occupied housing. Financial wealth is a more "liquid" concept
than marketable wealth, since one's home is difficult to convert into cash in the short term.
Figure 2. The Income Share of the Top 0.1% of U.S. Households Has Risen from Under 2% in the Early 1970sto Over 7% in 2000, Based on Tax Data
0
5
10
15
20
25
30
35
1913 1924 1935 1946 1957 1968 1979 1990 20010
5
10
15
20
25
30
35
Top 1%-5%
Top 0.1%-1%
Top 0.1%
USA, income share of top 5%
(Please see references 18 in the bibliography at the end of the report). Due difference in sources and method of calculations the income share
estimates from tax based data do not exactly match Survey of Consumer Finance data.
Source: Prof. Emmanuel Saez et. al., reference 18.
4

We will focus here on data from Prof. Emmanuel Saez of U.C. Berkeley who works withdata from tax sources. Figure 2 shows the share of income for the top 0.1%, 1% and 5%in the U.S. since the 1910s. Clearly the fortunes of the top 0.1% fluctuate the most.Indeed, the fortunes of the top 5% (or even top 10%), or the top 1%, are almost entirelydriven by the fortunes of the top 0.1% (roughly 100,000 households).
With the exception of the boom in the Roaring 1920s, this super-rich group kept losingout its share of incomes in WWI, the Great Depression and WWII, and till the earlyeighties. Why? The answers are unclear, but the massive loss of capital income(dividend, rents, interest income, but not capital gains) from progressive corporate andestate taxation is a possible candidate. The rise in their share since the mid-eightiesmight be related to the reduction in corporate and income taxes. Also, to a new wave ofentrepreneurs and managers earning disproportionate incomes as they drove andparticipated in the ongoing technology boom. As Figure 3 shows, while in the early 20th
century capital income was the big chunk for the top 0.1% of households, the resurgencein their fortunes since the mid-eighties was mainly from oversized salaries. The rich inthe U.S. went from coupon-clipping, dividend-receiving rentiers to a ManagerialAristocracy indulged by their shareholders.
Figure 3. The Metamorphosis of the Highest 1% of Income Earners in the U.S.: from Rentier Rich to aManagerial Technocratic Aristocracy
0
10
20
30
40
50
60
70
80
90
100
16 26 36 46 56 66 76 86 960
10
20
30
40
50
60
70
80
90
100
Wage Entreprenurial Dividends
Interest Rents
1999
USA Sources of Income, Top 1%
Please see reference 18 in the bibliography at the end of the report for the data underlying the chart. Based on tax returns data.
Source: Citigroup Investment Research
EGALITARIAN JAPAN, CONTINENTAL EUROPE AND THE PLUTONOMIES OF CANADA AND THE UKHow did the Plutonomy fare in other countries over time? As Figures 4 and 5 show, theUK and Canada, pretty much follow the U.S. script. Japan, France, and the Netherlandsare a bit different.
These were all plutonomies before the Great Depression, but the War, taxation, and newpost-War institutional structures generated much more egalitarian societies, that holdeven today. Only Switzerland remained unchanged. Neutrality through the wars saw itscapital preserved, the lack of a progressive income and wealth tax regime, and low taxeshelped.
5

Figure 4. Plutonomy At Work: The Income Share of the Top 1% Has Risen Dramatically Since the Late 1970sin the U.S., the U.K., and Canada
5
7
9
11
13
15
17
19
60 63 66 69 72 75 78 81 84 87 90 93 96 99 025
7
9
11
13
15
17
19
USA
UK
Canada
Income Share of the Top 1%
Please see references 18, 4, 22 in the bibliography at the end of the report for the data underlying the chart. Estimates based on tax return data.
Source: Citigroup Investment Research
Figure 5. Of Egalitarian Bent: The Income Share of the Top 1% Is Much Smaller and Is Not Rising as Much, Ifat All, in Switzerland, the Netherlands, Japan, and France
5
7
9
11
13
15
17
19
60 63 66 69 72 75 78 81 84 87 90 93 96 99 025
7
9
11
13
15
17
19
Switzerland
France
Japan
Netherlands
Income Share of the Top 1%
Please see references 7,17,15,4 in the bibliography at the end of the report for the data underlying the chart. Estimates based on tax return data.
Source: Citigroup Investment Research
See Figures 6 thru 11 for a panorama of plutonomy and egalitarianism.
6

Figure 6. Plutonomy in the UK: The Income Share of the Top 0.5% Rose from Under 4% in the mid 70s to Over9% in the Late 1990s
0
5
10
15
20
25
30
1954 1959 1964 1969 1974 1979 1984 1989 1994 19990
5
10
15
20
25
30Top 1%-5%
Top 0.5%-1%
Top 0.5%
UK, Income Share of the Top 5%
Please see reference 4 in the bibliography at the end of the report for the data.
Source: Citigroup Investment Research
Figure 7. Return of Plutonomy in Canada: The Income Share of the Top 5% Is at the Highest Level Since the1940s
0
5
10
15
20
25
30
35
40
1920 1930 1940 1950 1960 1970 1980 1990 20000
5
10
15
20
25
30
35
40
Top 1%-5%
Top 0.1%-1%
Top 0.1%
Canada, Income Share of the Top 5%
Please see reference 22 in the bibliography at the end of the report for the data.
Source: Citigroup Investment Research and http://elsa.berkeley.edu/~saez/index.html
Figure 8. Switzerland Benefits From Neutrality: Remarkably Stable Income Share of the Very Rich Over thePast 60 Years
0
5
10
15
20
25
1933 1942 1951 1960 1969 1978 1987 19960
5
10
15
20
25
Top 1%-5%
Top 0.1%-1%
Top 0.1%
Switzerland, income share of top 5%
7

Please see reference 7 in the bibliography at the end of the report for the data. Source: Citigroup Investment Research
Figure 9. France: The Income Share of the Rich Fell During WWII But Stayed Stable in the 1980s and 1990s
0
5
10
15
20
25
30
35
17 26 35 44 53 62 71 80 89 980
5
10
15
20
25
30
35Top 1%-5%
Top 0.1%-1%
Top 0.1%
France, income share of top 5%
Please see reference 17 in the bibliography at the end of the report for the data.
Source: Citigroup Investment Research
Figure 10. The Netherlands: Decline in the Share of the Top 5% and the Very Rich Until 1980. ShareRelatively Stable in Recent Years
0
5
10
15
20
25
30
35
40
45
14 19 24 29 34 39 44 49 54 59 64 69 74 79 84 89 94 990
5
10
15
20
25
30
35
40
45
Top 1%-5%
Top 0.1%-1%
Top 0.1%
Netherlands, income share of top 5%
Please see reference 4 in the bibliography at the end of the report for the data.
Source: Citigroup Investment Research
Figure 11. Japan: The Income Share of the Top 0.1% and the Top 1% Remarkably Flat in the Post-War Period.
0
5
10
15
20
25
30
35
07 17 27 37 47 57 67 77 87 970
5
10
15
20
25
30
35Top 1%-5%
Top 0.1%-1%
Top 0.1%
Japan, income share of top 5%
2002
8
Please see reference 15 in the bibliography at the end of the report for the data.
Source: Citigroup Investment Research
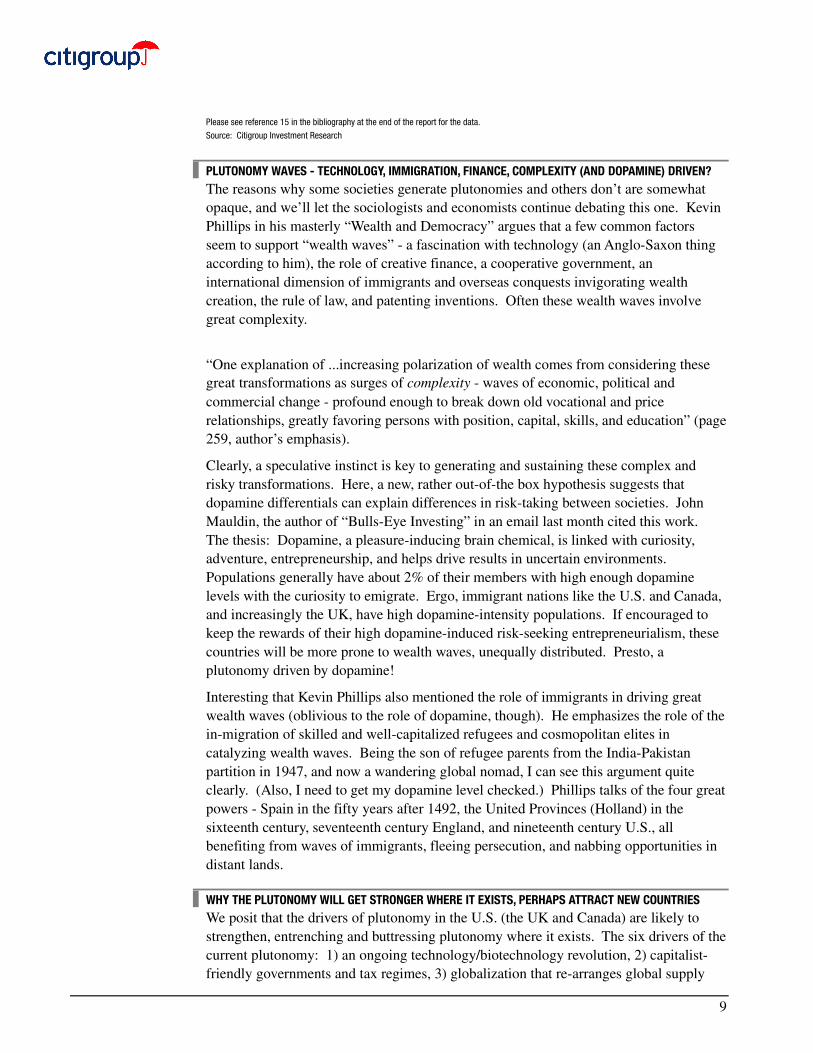
PLUTONOMY WAVES - TECHNOLOGY, IMMIGRATION, FINANCE, COMPLEXITY (AND DOPAMINE) DRIVEN?The reasons why some societies generate plutonomies and others don’t are somewhatopaque, and we’ll let the sociologists and economists continue debating this one. KevinPhillips in his masterly “Wealth and Democracy” argues that a few common factorsseem to support “wealth waves” - a fascination with technology (an Anglo-Saxon thingaccording to him), the role of creative finance, a cooperative government, aninternational dimension of immigrants and overseas conquests invigorating wealthcreation, the rule of law, and patenting inventions. Often these wealth waves involvegreat complexity.
“One explanation of ...increasing polarization of wealth comes from considering thesegreat transformations as surges of complexity - waves of economic, political andcommercial change - profound enough to break down old vocational and pricerelationships, greatly favoring persons with position, capital, skills, and education” (page259, author’s emphasis).
Clearly, a speculative instinct is key to generating and sustaining these complex andrisky transformations. Here, a new, rather out-of-the box hypothesis suggests thatdopamine differentials can explain differences in risk-taking between societies. JohnMauldin, the author of “Bulls-Eye Investing” in an email last month cited this work.The thesis: Dopamine, a pleasure-inducing brain chemical, is linked with curiosity,adventure, entrepreneurship, and helps drive results in uncertain environments.Populations generally have about 2% of their members with high enough dopaminelevels with the curiosity to emigrate. Ergo, immigrant nations like the U.S. and Canada,and increasingly the UK, have high dopamine-intensity populations. If encouraged tokeep the rewards of their high dopamine-induced risk-seeking entrepreneurialism, thesecountries will be more prone to wealth waves, unequally distributed. Presto, aplutonomy driven by dopamine!
Interesting that Kevin Phillips also mentioned the role of immigrants in driving greatwealth waves (oblivious to the role of dopamine, though). He emphasizes the role of thein-migration of skilled and well-capitalized refugees and cosmopolitan elites incatalyzing wealth waves. Being the son of refugee parents from the India-Pakistanpartition in 1947, and now a wandering global nomad, I can see this argument quiteclearly. (Also, I need to get my dopamine level checked.) Phillips talks of the four greatpowers - Spain in the fifty years after 1492, the United Provinces (Holland) in thesixteenth century, seventeenth century England, and nineteenth century U.S., allbenefiting from waves of immigrants, fleeing persecution, and nabbing opportunities indistant lands.
WHY THE PLUTONOMY WILL GET STRONGER WHERE IT EXISTS, PERHAPS ATTRACT NEW COUNTRIESWe posit that the drivers of plutonomy in the U.S. (the UK and Canada) are likely tostrengthen, entrenching and buttressing plutonomy where it exists. The six drivers of thecurrent plutonomy: 1) an ongoing technology/biotechnology revolution, 2) capitalist-friendly governments and tax regimes, 3) globalization that re-arranges global supply
9

chains with mobile well-capitalized elites and immigrants, 4) greater financialcomplexity and innovation, 5) the rule of law, and 6) patent protection are all wellensconced in the U.S., the UK, and Canada. They are also gaining strength in theemerging world.
Eastern Europe is embracing many of these attributes, as are China, India, and Russia.Even Continental Europe may succumb and be seduced by these drivers of plutonomy.As we argued in the Global Investigator, “Earnings - Don’t Worry, Capitalists Still onTop”, June 10, 2005, the profit share of GDP is highly likely to keep rising to the highsseen in the 1950s/60s. New markets like China and India, their contribution to theglobal labor supply, the ongoing productivity revolution, the quasi-Bretton Woodssystem in the U.S. dollar bloc, and inflation-fighting central banks should all help.However, a high profit share like in the 1950s/60s does not ensure plutonomy. Indeed,in the 1950s/60s, U.S. and other key countries did not see increasing income inequality.
Society and governments need to be amenable to disproportionately allow/encourage thefew to retain that fatter profit share. The Managerial Aristocracy, like in the Gilded Age,the Roaring Twenties, and the thriving nineties, needs to commandeer a vast chunk ofthat rising profit share, either through capital income, or simply paying itself a lot. Wethink that despite the post-bubble angst against celebrity CEOs, the trend of cost-cuttingbalance sheet-improving CEOs might just give way to risk-seeking CEOs, re-leveraging,going for growth and expecting disproportionate compensation for it. It sounds quiteunlikely, but that’s why we think it is quite possible. Meanwhile Private Equity andLBO funds are filling the risk-seeking and re-leveraging void, expecting and realizingdisproportionate remuneration for their skills.
THOSE SCARY “GLOBAL IMBALANCES” - REFLECT PLUTONOMY AND DEMOGRAPHY, QUITE LOGICAL ANDUNTHREATENINGWe have all heard the lament. A bearish guru, somber and serious, spelling out that theend is near if something is not done urgently about those really huge, nasty “GlobalImbalances”. The U.S. savings rate is too low, the U.S. current account deficit is toohigh, foreigners are not going to keep financing this unless compensated with higherinterest rates, and a sharply lower U.S. dollar. The world, being so imbalanced, is aboutto tip over it’s axis, all hell is going to break loose, so don’t any equities - the riskpremium is high reflecting these imbalances and is going to go higher (i.e., lower stockprices) when the earth finally does keel over.
A more balanced view acknowledges these nasty imbalances, but predicts a gentle,gradual dollar decline, a yuan revaluation, and the hope that Asians and European (ex-UK) consumers will embark on a spending journey, righting the world. A toughworkout, but she’ll be right.
Almost all the smart folks we know - our investors, our colleagues, our friends inacademia, politicians believe in some variant of these two stories. There are very fewexceptions who consider these “Global Imbalances” not scary but perfectly natural andrather harmless. (We can think of Gavekal as one of these exceptions, but their repose ofcomfort is different from ours - they have a new book out “The Brave New World”,elucidating the new business model of global “Platform” companies, etc).
10

Our point here is not to dismiss the conventional views as outright wrong. However, weoffer a competing view and, in some instance, a view that is complementary to theconventional explanation. Our view, if right, suggests that applying an excessive riskpremium to “Global Imbalances” is a flawed approach to equity investing. Note that ourhouse view, for instance, sees no cataclysmic collapse in the dollar. The U.S. currentaccount deficit is anticipated to remain flat at 6.8% of GDP. The Japanese and the Eurosurpluses are expected to continue. A plutonomy world is not inconsistent with theseforecasts.
Figure 12. Global Imbalances: Plutonomies Are Running Current Account Deficits. Non-Plutonomies AreRunning Current Account Surpluses
-6.0
-5.0
-4.0
-3.0
-2.0
-1.0
0.0
1.0
2.0
3.0
80 82 84 86 88 90 92 94 96 98 00 02 04 06-6.0
-5.0
-4.0
-3.0
-2.0
-1.0
0.0
1.0
2.0
3.0
Non-Plutonomies Current Account % GDP
Plutonomies Current Account % GDP
Note: For our purposes, Plutonomies = U.S., U.K. and Canada. Non-Plutonomies = EuroZone, Japan, and Switzerland. Missing are the newly
industrialized nations of Asia and China.
Source: International Monetary Fund and Datastream
First a quick glance at these Global imbalances. Figure 12 shows the current accountbalances for plutonomies (the U.S., UK, and Canada) and the others - continentalEurope and Japan. We have left out China and other emerging markets because we donot have their income inequality data, although they are definitely an important part ofthe “Global Imbalance” story.
Well, it seems that the plutonomies (the U.S., UK, and Canada together) havedeteriorating current account balances; the others are running a combined currentaccount surplus.
Current account balances are driven by three possible sources - the net savings of thegovernment, the corporate sector and the household sector. Figure 13 shows our bottom-up estimates for corporate free cash flow/sales, a close cousin of corporate savings -these look similarly good across the world, both for plutonomies and the others. Wewon’t pursue this avenue as a key driver of today’s imbalances.
11

Figure 13. Free Cash Flow to Sales Is High Across the Major Regions. No Difference Between Plutonomiesand the Others
-4
-3
-2
-1
0
1
2
3
4
5
6
1/88 1/91 1/94 1/97 1/00 1/03 1/06
US Europe Japan
FCF to Sales
Source: Citigroup Investment Research and Worldscope
How about government deficits? Well, they seem to be equally bad in the U.S., UK,Continental Europe, and very bad in Japan. Hmm. We’ll leave this one alone too.
Figure 14. The Gap in the Savings Rate of Plutonomies and the Others Moves Closely with the Gap in theCurrent Account Balance
-9.0
-8.5
-8.0
-7.5
-7.0
-6.5
-6.0
-5.5
-5.0
80 82 84 86 88 90 92 94 96 98 00 02 04 06-7.0
-6.0
-5.0
-4.0
-3.0
-2.0
-1.0
0.0
1.0
2.0Difference, Household Savings Rate ofPlutonomies less Non-Plutonomies
Difference, Current Acc % GDP ofPlutonomies less Non-Plutonomies (RS)
Note: For our purposes, Plutonomies = U.S., U.K. and Canada. Non-Plutonomies = EuroZone, Japan and Switzerland. Missing are the newly
industrialized nations of Asia and China.
Source: International Monetary Fund and Datastream
We need to focus on the household sector (the consumer in simple English) as the keydriver of those current account imbalances that so worry the equity bears. Indeed,Figure 14 shows the gap between the households sector’s savings rate for theplutonomies (U.S., UK, and Canada) less those of continental Europe and Japan. Thisgap is large and moves with the gap in the current accounts of these two blocs.
Our contention is simple - while the drivers of savings rates in countries are many - wefocus on plutonomy as a key new explanation for different savings rates in different
12

countries. (As an aside, considerable empirical research shows that the externalimbalances between the U.S., Europe, and Japan are driven by demography. The U.S. isjust younger than Japan, driving household savings differences that drive those currentaccount differences. This topic is beyond the scope of our story here. For thoseinterested, check out “Capital Flows Among the G-7 Nations: A DemographicPerspective”, Michael Feroli, U.S. Federal Reserve Board, October 2003).
Our contention: when the top, say 1% of households in a country see their share ofincome rise sharply, i.e., a plutonomy emerges, this is often in times of frenetictechnology/financial innovation driven wealth waves, accompanied by asset booms,equity and/or property. Feeling wealthier, the rich decide to consume a part of theircapital gains right away. In other words, they save less from their income, the well-known wealth effect. The key point though is that this new lower savings rate is appliedto their newer massive income. Remember they got a much bigger chunk of theeconomy, that’s how it became a plutonomy. The consequent decline in absolute savingsfor them (and the country) is huge when this happens. They just account for too large apart of the national economy; even a small fall in their savings rate overwhelms thedecisions of all the rest. Figure 15 provides a simple example of how this happens.
Figure 15. A Numerical Example: If the Income Share of the Top Group Is High, A Reduction in the SavingsRate of the Top Income Group (due to Asset Appreciation, for example) Can More than Offset Any Increase inthe Savings Rates of Others
Pre-PlutonomyIncome Savings rate Savings
Top 20% $20 10% $2Next 20% $20 10% $2Third 20% $20 10% $2Fourth 20% $20 10% $2Poorest 20% $20 10% $2Total $100 10% $10Plutonomy Emerges:
Income New savings rate SavingsTop 20% $60 5% or 8% or 9% $3 or $4.8 or $5.4Next 20% $10 11% $1.1Next 20% $10 11% $1.1Next 20% $10 11% $1.1Poorest $10 11% $1.1Total $100 7.4% or 9.2% or
9.8%$7.4 or $9.2 or$9.8
Source: Citigroup Investment Research
There is proof that high income earners, who saw their share of income go up in the U.S.in the nineties, and enjoyed the equity boom, reduced their savings rate as in ourexample. Indeed, in the real world, it went negative! Since that reduced savings ratewas applied to their new enlarged chunk of income, sure enough the total savings ratefell sharply.
Dean Maki and Michael Palumbo, wrote the paper (at Alan Greenspan’s suggestion) thatdemonstrated this fall in the savings rate of the rich in response to the equity boom (SeeMaki and Palumbo, “Disentangling the Wealth Effect: A Cohort Analysis of HouseholdSavings in the 1990s”, April 2001). Figure 16 demonstrates the savings rates at differentpoints for different income groups.) The very rich, the top 20%, had a savings rate of8%, much higher than other less affluent groups in 1992. By 2000 this savings rate hadgone from 8%- to -2%! The wealth effect at work. And then this reduced savings rate
13

of the rich hit their huge incomes, swollen by the plutonomy, savaging the U.S.’s overallsavings rate. This is our contribution to the debate. Plutonomy plus an asset boomequals a drop in the overall savings rate. (Asset booms by themselves, i.e., the wealtheffect by itself does not do the trick, as we will show soon.)
Figure 16. Household Savings Rates of the Rich Fell in the Stock Boom in the 1990s While Those of the LowerIncome Groups Rose (Maki-Palumbo Estimates)
-4
-2
0
2
4
6
8
10
Top Quintile 61-80% 41%-60% 21%-40% BottomQuintile
-4
-2
0
2
4
6
8
10
Year 1992
Year 2000
Savings Rate by Income Quintiles
Rich are saving a lower proportion of their income (actually dissaving) in 2000 compared to 1992 (Maki-Palumbo estimates)
Lower income savings rate higher
Please see reference 14 in the bibliography at the end of the report for the data underlying the chart. Based on tax returns data.
Source: Citigroup Investment Research
Let’s look at some of the coolest figures that amplify and verify this idea. Figure 17plots the share of the top 1% of U.S. households since 1929. Our thesis is that thehigher the share of income going to the top 1%, the lower the overall household savingsrate (shown inverted in Figure 17). There is a pretty tight correlation between the two,despite the many other drivers of savings rates (demography, interest rates, financialdeepening, retirement security, etc). The same information is shown in Figure 18, ascatter plot - when the rich take a very high share of overall income, the nationalhousehold savings rate drops, and vice versa. In a plutonomy, the rich drop their savingsrate, consume a larger fraction of their bloated, very large share of the economy. Thisbehavior overshadows the decisions of everybody else. The behavior of theexceptionally rich drives the national numbers - the “appallingly low” overall savingsrates, the “over-extended consumer”, and the “unsustainable” current accounts thataccompany this phenomenon. We want to spend little time worrying about these(non)issues, neither do we think they warrant any risk premium on equities. Theysimply reflect the reality of demographic differences between nations, and that somenations are plutonomies, while others are not. Unequal inequality among nations ismirrored in the logical imbalances between them.
14

Figure 17. The Aggregate U.S. Household Savings Rate and the Income Share of the Top 1% Moves MoreClosely Together
6
8
10
12
14
16
18
20
29 34 39 44 49 54 59 64 69 74 79 84 89 94 99 04
-4
-2
0
2
4
6
8
10
12
Income share of the top 1%
Savings Rate (RS, reverse scale)
World War II
Depression
Please see reference 18 in the bibliography at the end of the report for the data underlying income share.
Source: Bureau of Economic Analysis
Figure 18. There is a High and Negative Correlation Between the U.S. Household Savings Rate and IncomeConcentration (1929-02, World War II Years 1940-44 Excluded)
y = -0.74x + 15.07R2 = 0.70
-2
0
2
4
6
8
10
12
8 10 12 14 16 18 20-2
0
2
4
6
8
10
12Household Savings Rate
Income share of the top 1% of households
Note: Similar high correlations are obtained even if we use the income share of the top 10% (RSq = 0.70) or the income share of the top 5% (RSq =
0.73).
Please see reference 18 in the bibliography at the end of the report for the data underlying income share.
Source: Citigroup Investment Research
How about more empirical verification of the relationship between the householdsavings rate and the share of the rich in other plutonomies like the UK and Canada?Figure 19 shows the relationship for the UK using data from 1951 onwards. Note theclear negative relationship that we expect. In the nineties, there seems to have been anupward shift in the relationship between the UK personal savings rate and incomeinequality. There are number of drivers for the savings rate, as highlighted earlier, and
15

the impact of these other drivers could shift the relationship around - our comfort comesfrom the persistence of the negative relationship in the UK.
16

Figure 19. In the U.K., A Strongly Negative Relationship Between Income Concentration (Plutonomy) and theAggregate Household Savings Rate. The Relationship Shifted Upward in the 1990s
y = -1.72x + 28.48R2 = 0.81
y = -1.80x + 20.57R2 = 0.70
0
2
4
6
8
10
12
14
4 6 8 10 12 140
2
4
6
8
10
12
14
UK, Income Share of the Top 1%
Household Savings Rate
1990-991989
1951-88
Please see reference 4 in the bibliography at the end of the report for the data underlying the chart. Based on tax returns data.
Source: Citigroup Investment Research
Figure 20. Canada Also Shows a Close Relationship Between Income Concentration (Plutonomy) and theAggregate Household Savings Rate
7
8
9
10
11
12
13
14
61 64 67 70 73 76 79 82 85 88 91 94 97 00 03 06
-5
0
5
10
15
20
Canada, income share of top 1% of population
Household Savings Rate RS, reverse scale)
Please see reference 22 in the bibliography at the end of the report for the data underlying the chart. Based on tax returns data.
Source: Citigroup Investment Research and http://elsa.berkeley.edu/~saez/index.html
17
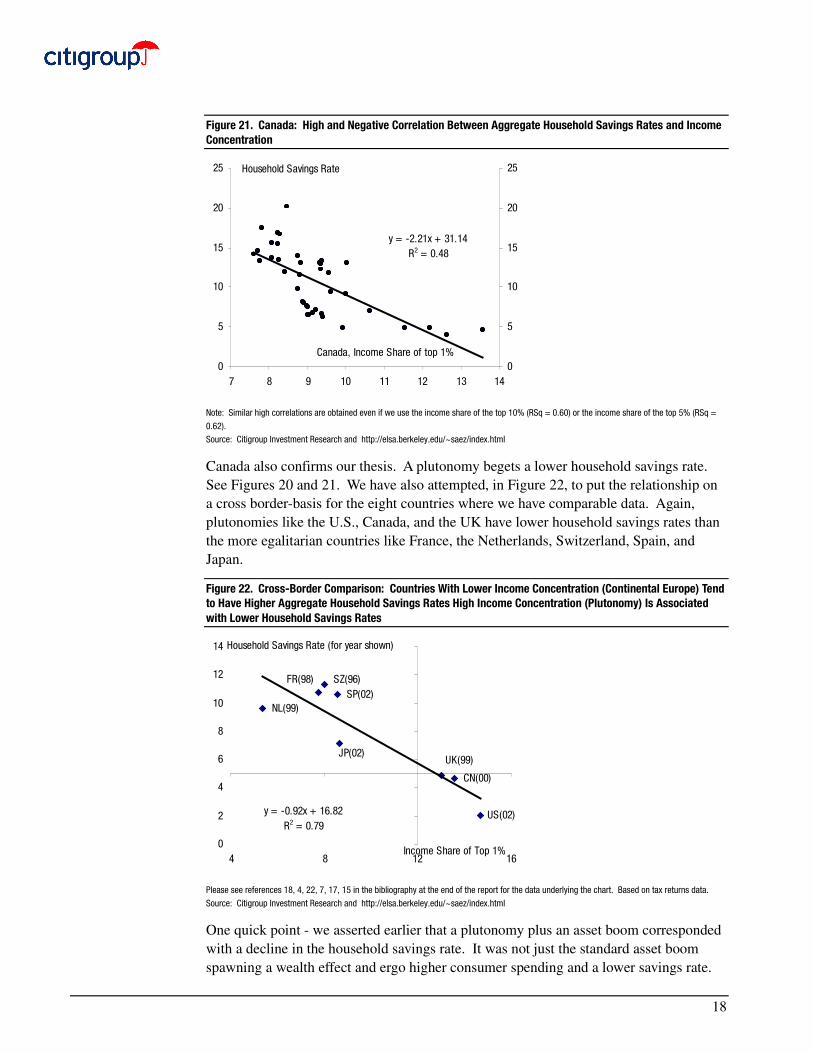
Figure 21. Canada: High and Negative Correlation Between Aggregate Household Savings Rates and IncomeConcentration
y = -2.21x + 31.14R2 = 0.48
0
5
10
15
20
25
7 8 9 10 11 12 13 140
5
10
15
20
25Household Savings Rate
Canada, Income Share of top 1%
Note: Similar high correlations are obtained even if we use the income share of the top 10% (RSq = 0.60) or the income share of the top 5% (RSq =
0.62).
Source: Citigroup Investment Research and http://elsa.berkeley.edu/~saez/index.html
Canada also confirms our thesis. A plutonomy begets a lower household savings rate.See Figures 20 and 21. We have also attempted, in Figure 22, to put the relationship ona cross border-basis for the eight countries where we have comparable data. Again,plutonomies like the U.S., Canada, and the UK have lower household savings rates thanthe more egalitarian countries like France, the Netherlands, Switzerland, Spain, andJapan.
Figure 22. Cross-Border Comparison: Countries With Lower Income Concentration (Continental Europe) Tendto Have Higher Aggregate Household Savings Rates High Income Concentration (Plutonomy) Is Associatedwith Lower Household Savings Rates
US(02)
CN(00)
UK(99)JP(02)
NL(99)
FR(98) SZ(96)SP(02)
y = -0.92x + 16.82R2 = 0.79
0
2
4
6
8
10
12
14
4 8 12 16
Household Savings Rate (for year shown)
Income Share of Top 1%
Please see references 18, 4, 22, 7, 17, 15 in the bibliography at the end of the report for the data underlying the chart. Based on tax returns data.
Source: Citigroup Investment Research and http://elsa.berkeley.edu/~saez/index.html
One quick point - we asserted earlier that a plutonomy plus an asset boom correspondedwith a decline in the household savings rate. It was not just the standard asset boomspawning a wealth effect and ergo higher consumer spending and a lower savings rate.
18
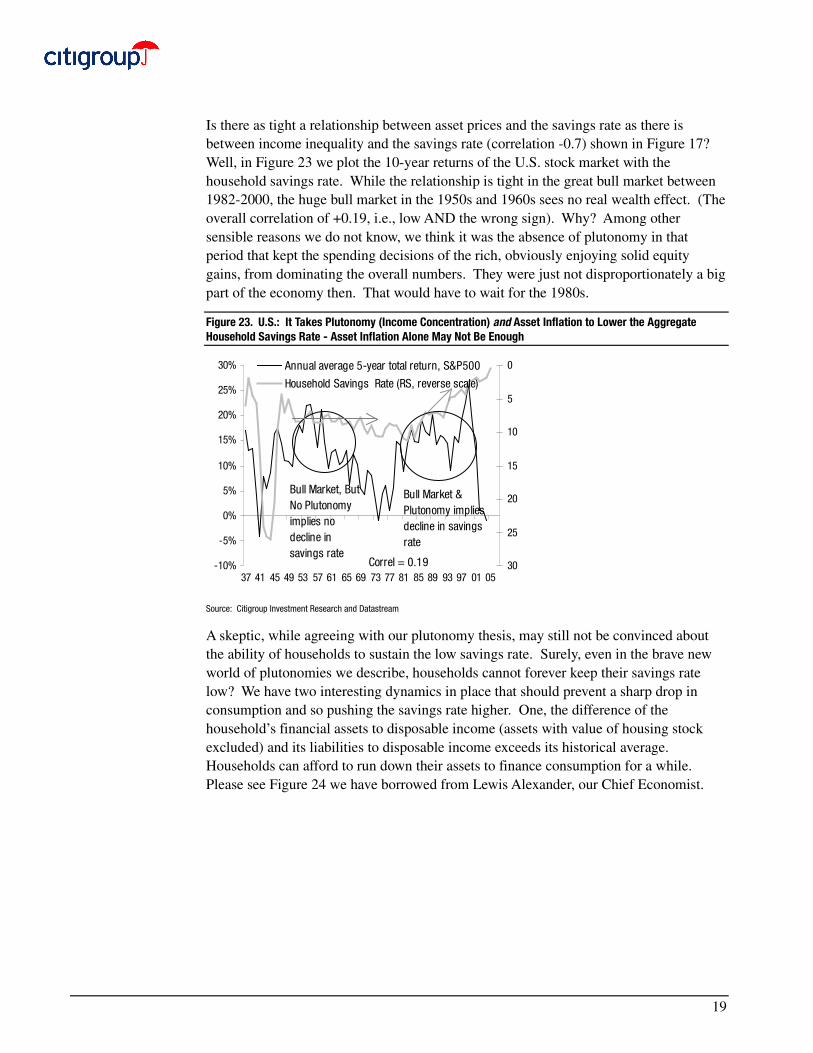
Is there as tight a relationship between asset prices and the savings rate as there isbetween income inequality and the savings rate (correlation -0.7) shown in Figure 17?Well, in Figure 23 we plot the 10-year returns of the U.S. stock market with thehousehold savings rate. While the relationship is tight in the great bull market between1982-2000, the huge bull market in the 1950s and 1960s sees no real wealth effect. (Theoverall correlation of +0.19, i.e., low AND the wrong sign). Why? Among othersensible reasons we do not know, we think it was the absence of plutonomy in thatperiod that kept the spending decisions of the rich, obviously enjoying solid equitygains, from dominating the overall numbers. They were just not disproportionately a bigpart of the economy then. That would have to wait for the 1980s.
Figure 23. U.S.: It Takes Plutonomy (Income Concentration) and Asset Inflation to Lower the AggregateHousehold Savings Rate - Asset Inflation Alone May Not Be Enough
-10%
-5%
0%
5%
10%
15%
20%
25%
30%
37 41 45 49 53 57 61 65 69 73 77 81 85 89 93 97 01 05
0
5
10
15
20
25
30
Annual average 5-year total return, S&P500
Household Savings Rate (RS, reverse scale)
Bull Market, But No Plutonomy implies no decline in savings rate
Bull Market & Plutonomy implies decline in savings rate
Correl = 0.19
Source: Citigroup Investment Research and Datastream
A skeptic, while agreeing with our plutonomy thesis, may still not be convinced aboutthe ability of households to sustain the low savings rate. Surely, even in the brave newworld of plutonomies we describe, households cannot forever keep their savings ratelow? We have two interesting dynamics in place that should prevent a sharp drop inconsumption and so pushing the savings rate higher. One, the difference of thehousehold’s financial assets to disposable income (assets with value of housing stockexcluded) and its liabilities to disposable income exceeds its historical average.Households can afford to run down their assets to finance consumption for a while.Please see Figure 24 we have borrowed from Lewis Alexander, our Chief Economist.
19
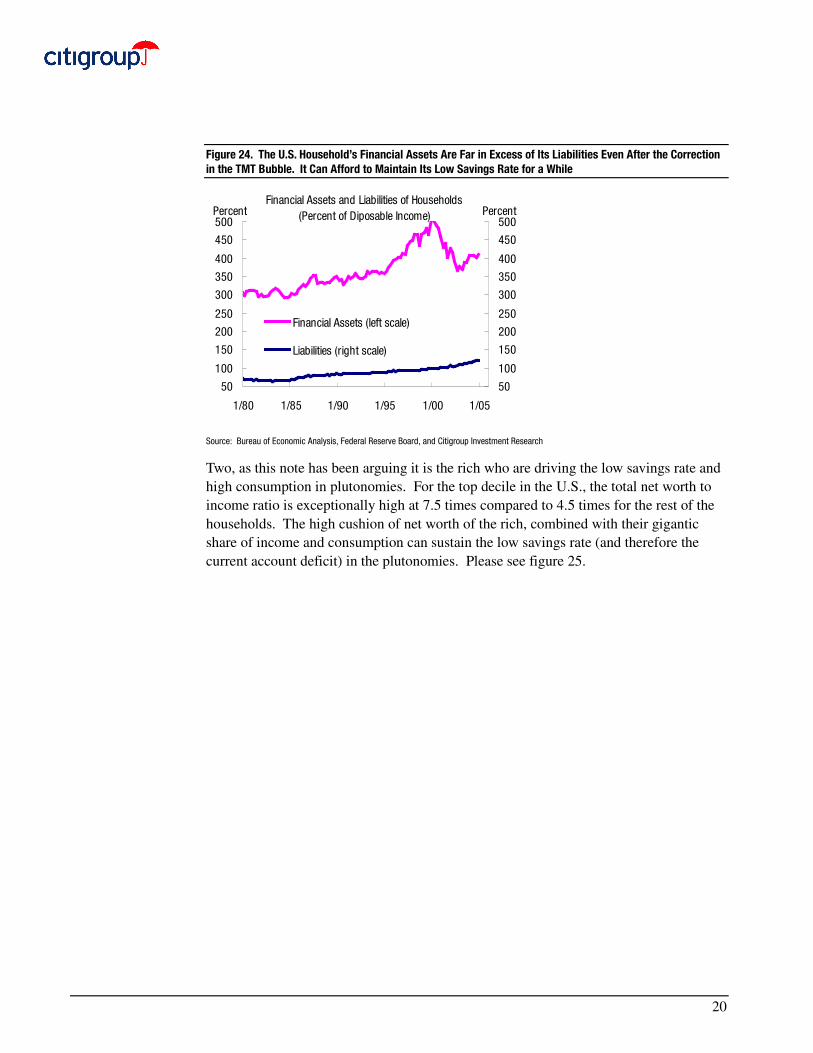
Figure 24. The U.S. Household’s Financial Assets Are Far in Excess of Its Liabilities Even After the Correctionin the TMT Bubble. It Can Afford to Maintain Its Low Savings Rate for a While
Financial Assets and Liabilities of Households (Percent of Diposable Income)
50
100
150
200
250
300
350
400
450
500
1/80 1/85 1/90 1/95 1/00 1/05
Percent
50
100
150
200
250
300
350
400
450
500Percent
Financial Assets (left scale)
Liabilities (right scale)
Source: Bureau of Economic Analysis, Federal Reserve Board, and Citigroup Investment Research
Two, as this note has been arguing it is the rich who are driving the low savings rate andhigh consumption in plutonomies. For the top decile in the U.S., the total net worth toincome ratio is exceptionally high at 7.5 times compared to 4.5 times for the rest of thehouseholds. The high cushion of net worth of the rich, combined with their giganticshare of income and consumption can sustain the low savings rate (and therefore thecurrent account deficit) in the plutonomies. Please see figure 25.
20

Figure 25. U.S.: Net Worth to Income Ratio for the Rich Is High and Rising. Drives and Sustains HighConsumption out of Their Massive Income; Keeping Aggregate Savings Rate Low and Current Account DeficitLarge
0
1
2
3
4
5
6
7
8
Less than20
20-39.9 40-59.9 60-79.9 80-89.9 90-1000
1
2
3
4
5
6
7
8
Income Percentiles of Families
Net Worth to Family Income, By Income PercentilesFor Survey Years 1989, 1992, 1995, 1998, 2001
Source: Survey of Consumer Finances, Federal Reserve Board, and Citigroup Investment Research
To summarize so far, plutonomies see the rich absorb a disproportionate chunk of theeconomy, their decision to lower their savings rate, often corresponding to the assetbooms that often accompany plutonomy, has a massive negative impact on reportedaggregate numbers like savings rates, current account deficits, consumption levels, etc.We believe the key global imbalance is that some large economies have becomeplutonomies, and others have not -- this imbalance in inequality expresses itself in thestandard scary “global imbalances” that so worry the bears and most observers. They donot worry us much. In addition, the emerging market entrepreneur/plutocrats (Russianoligarchs, Chinese real estate/manufacturing tycoons, Indian software moguls, LatinAmerican oil/agriculture barons), benefiting disproportionately from globalization arelogically diversifying into the asset markets of the developed plutonomies. They areattracted by the facets that facilitated the re-emergence of plutonomies in the U.S., UK,and Canada - technology, internationalism, the rule of law, financial innovation andcapitalist-friendly cooperative governments. This further inflates the asset markets inthese plutonomies, enabling the rich there to lower their savings rates further, andworsening their current account balances further. Just as misery loves company, weposit that the “plutos” like to hang out together.
We stress that our analysis of the relationship between income concentration(plutonomy) and the household savings rates is confined to industrialized countries.This relationship in emerging markets is weak or non-existent. As mentioned earlier, theemerging markets’ elites often do their spending and investment in developedplutonomies rather than at home.
WHAT MIGHT CHANGE THIS?Our view that plutonomy is driving savings and consumption imbalances is all very well.But before examining how to make money from this theme, we want to look at whatmight cause it to change.
21
THE DEATH OF PLUTONOMYAt the heart of plutonomy, is income inequality. Societies that are willing totolerate/endorse income inequality, are willing to tolerate/endorse plutonomy.
Earlier, we postulated a number of key tenets for the creation of plutonomy. As areminder, these were: 1) an ongoing technology/biotechnology revolution, 2) capitalist-friendly governments and tax regimes, 3) globalization that re-arranges global supplychains with mobile well-capitalized elites and immigrants, 4) greater financialcomplexity and innovation, 5) the rule of law, and 6) patent protection.
We make the assumption that the technology revolution, and financial innovation, arelikely to continue. So an examination of what might disrupt Plutonomy - or worse,reverse it - falls to societal analysis: will electorates continue to endorse it, or will theyend it, and why.
Organized societies have two ways of expropriating wealth - through the revocation ofproperty rights or through the tax system.
Capital markets, like human beings, generally strive for certainty and stability. Thepricing of assets is easier, projections more comfortable, etc. For this reason, indeveloped capital markets, governments have learnt the lessons of level playing fields,regulatory certainty, and the sanctity of property rights.
However this does not mean that governments are incapable of revoking property rights.While this tends to be something more often seen in countries with a shorter history ofcapitalist democracy, such as the Ukraine (attempts to undo prior privatizations), orRussia (where some of our clients believe events surrounding Mikhail Khodorovsky tobe a form of nationalization), it can happen in the strangest of places. For example, in2001, UK government withdrawal of financial support bankrupted Railtrack, the UK railoperator, effectively re-nationalizing railway assets on the cheap.
But these moves are exceptional and generally counter-productive as they raise the riskpremium, in theory, for future transactions with that power. If the government is willingto be a contestant and simultaneously set and change the rules of the game to theiradvantage, the rewards of the game must rise to attract other participants.
The more likely means of expropriation is through the tax system. Corporate tax ratescould rise, choking off returns to the private sector, and personal taxation rates could rise- dividend, capital-gains, and inheritance tax rises would hurt the plutonomy.
There is a third way to change things though not necessarily by expropriation, and that isto slow down the rate of wealth creation or accumulation by the rich - generally througha reduction in the profit share of GDP. This could occur through a change in rules thataffect the balance of power between labor and capital. Classic examples of this tend tofall under one of two buckets - the regulation of the domestic labor markets throughminimum wages, regulating the number of hours worked, deciding who can and cannotwork etc, or by dictating where goods and services can be imported from(protectionism).
22
WHERE DO WE STAND TODAY?In the plutonomies, there seems little threat from the first of these challenges: blatantexpropriation of property by governments. There are few examples of governmentschanging the rules in the plutonomies and engaging in widespread nationalization, orasset re-distribution.
Likewise, if anything, the trends of taxation are positive for corporates, with fiscalcompetition in Europe forcing rates lower, year by year. Ironically, this is happeningmost in non-plutonomy countries, like Germany. This is good for the profit share, ofwhich the mega-rich, through their holdings of equity, are “long”.
However, even if the profit share is rising, the fruits of those profits could be taxedbefore ending up in the pockets of the rich. In other words, dividend, capital gains andestate taxes could all rise. However, we struggle to find examples of this happening.Indeed, in the U.S., the current administration’s attempts to change the estate tax codeand make permanent dividend tax cuts, plays directly into the hands of the plutonomy.While such Pluto-friendly policies are not widely being copied around the world, wehave not found examples of the opposite occurring elsewhere.
Protectionism or regulation. Here, we believe lies a cornerstone of the current wave ofplutonomy, and with it, the potential for capitalists around the world to profit. The waveof globalization that the world is currently surfing, is clearly to the benefit of globalcapitalists, as we have highlighted. But it is also to the disadvantage of developedmarket labor, especially at the lower end of the food-chain.
There are periodic attempts by countries to redress this balance - Jospin’s introduction ofthe 35 hour working week in France to the anticipated benefit of labor being oneexample. But in general, on-going globalization is making it easier for companies toeither outsource manufacturing (source from cheap emerging markets like China andIndia) or “offshore” manufacturing (move production to lower cost countries).
Brunswick, the recreational services company, is typical of the “globalized” world wenow live in. We were intrigued to see in the company’s September 27 presentation, thatin 2000, the company had 17 manufacturing/procurement centers globally, 14 of them inNorth America, high cost European countries or Japan. Today, five years later, they have40 manufacturing/sourcing /engineering centers. Of these half are in low-cost countries.Such examples abound in today’s globalized world.
The final option for countries willing to consider it, is to in-source labor. For example,in the UK, between May 2004 accession of the 10 new countries into the EU, and March2005, 176,000 workers have moved from the accession countries to the UK and joinedthe workforce. Leaving aside any demand benefits they might bring, this does, in theorykeep the price of labor contained. It interests us that the Plutonomy countries (U.S.A,UK, Australia, and Canada) all have - generally - a welcoming attitude to skilledimmigration. Of the pre-accession EU 15 countries, only a handful, the UK and Irelandincluded allow full and free labor movement from the new EU 10 countries into theirlabor markets. The vast majority, Germany, Austria, Italy etc., are refusing to allowaccession countries full freedom of movement until 2009-11.
23
So, property rights look as if they are being protected, tax policies helpful, and the profitshare should continue to rise, through globalization and the productivity/technologywave.
Our conclusion? The three levers governments and societies could pull on to endplutonomy are benign. Property rights are generally still intact, taxation policies neutralto favorable, and globalization is keeping the supply of labor in surplus, acting as abrake on wage inflation.
IS THERE A BACKLASH BUILDING?Plutonomy, we suspect is elastic. Concentration of wealth and spending in the hands ofa few, probably has its limits. What might cause the elastic to snap back? We can see anumber of potential challenges to plutonomy.
The first, and probably most potent, is through a labor backlash. Outsourcing,offshoring or insourcing of cheap labor is done to undercut current labor costs. Thosebeing undercut are losers in the short term. While there is evidence that this is positivefor the average worker (for example Ottaviano and Peri) it is also clear that high-costsubstitutable labor loses.
Low-end developed market labor might not have much economic power, but it does haveequal voting power with the rich. We see plenty of examples of the outsourcing oroffshoring of labor being attacked as “unpatriotic” or plain unfair. This tends to lead tocalls for protectionism to save the low-skilled domestic jobs being lost. This is a causechampioned, generally, by left-wing politicians. At the other extreme, insourcing, orallowing mass immigration, which might price domestic workers out of jobs, leads tocalls for anti-immigration policies, at worst championed by those on the far right. Tothis end, the rise of the far right in a number of European countries, or calls (from theright) to slow down the accession of Turkey into the EU, and calls from the left torebuild trade barriers and protect workers (the far left of Mr. Lafontaine, garnered 8.5%of the vote in the German election, fighting predominantly on this issue), are concerningsignals. This is not something restricted to Europe. Sufficient numbers of politicians inother countries have championed slowing immigration or free trade (Ross Perot, PaulineHanson etc.).
A second related threat, might come from productive labor no longer maintaining itsproductive edge. Again, we find Kevin Phillips’s arguments in his book, Wealth andDemocracy, fascinating. Phillips highlights the problems in the late 1700s Netherlands,where an increasing obsession with financial speculation (sound familiar?) caused non-financial skilled labor that had built that country’s wealth, to seek their success in othercountries. Likewise, Britain’s failure to keep its educational advantage in what werethen high-tech areas caused them to lose their competitive advantage that had beenmaintained until the First World War. Are there similarities with Asian economies,versus the plutonomies, today?
A third threat comes from the potential social backlash. To use Rawls-ian analysis, theinvisible hand stops working. Perhaps one reason that societies allow plutonomy, isbecause enough of the electorate believe they have a chance of becoming a Pluto-participant. Why kill it off, if you can join it? In a sense this is the embodiment of the
24

“American dream”. But if voters feel they cannot participate, they are more likely todivide up the wealth pie, rather than aspire to being truly rich.
Could the plutonomies die because the dream is dead, because enough of society doesnot believe they can participate? The answer is of course yes. But we suspect this is athreat more clearly felt during recessions, and periods of falling wealth, than whenaverage citizens feel that they are better off. There are signs around the world thatsociety is unhappy with plutonomy - judging by how tight electoral races are. But asyet, there seems little political fight being born out on this battleground.
A related threat comes from the backlash to “Robber-barron” economies. Thepopulation at large might still endorse the concept of plutonomy but feel they have lostout to unfair rules. In a sense, this backlash has been epitomized by the media coverageand actual prosecution of high-profile ex-CEOs who presided over financialmisappropriation. This “backlash” seems to be something that comes with bull marketsand their subsequent collapse. To this end, the cleaning up of business practice, by high-profile champions of fair play, might actually prolong plutonomy.
Our overall conclusion is that a backlash against plutonomy is probable at some point.However, that point is not now. So long as economies continue to grow, and enough ofthe electorates feel that they are benefiting and getting rich in absolute terms, even ifthey are less well off in relative terms, there is little threat to Plutonomy in the U.S., UK,etc.
But the balance of power between right (generally pro-plutonomy) and left (generallypro-equality) is on a knife-edge in many countries. Just witness how close the U.S.election was last year, or how close the results of the German election were. A collapsein wealth in the plutonomies, felt by the masses, and/or prolonged recession could easilyraise the prospects of anti-plutonomy policy.
We should at this point make clear that we have no view on whether plutonomies aregood or bad, our analysis here is based on the facts, not what we want society to looklike.
HOW TO PLAY PLUTONOMYSo, Plutonomies exist, and explain much of the world’s imbalances. There is no suchthing as “The U.S. Consumer” or “UK Consumer”, but rich and poor consumers in thesecountries, with different savings habits and different prospects. The rich are gettingricher; they dominate spending. Their trend of getting richer looks unlikely to endanytime soon.
How do we make money from this theme? We see two ways. The first is simple. If youbelieve, like us, that the Plutonomy exists, and explains why global imbalances havebuilt up (for example the savings rate differentials), and you believe there is no imminentthreat to plutonomy, you must in turn believe that the current “end of the world is nigh”risk premium on equities, due to current account deficits, is too high. Conclusion: buyequities.
There is however a more refined way to play plutonomy, and this is to buy shares in thecompanies that make the toys that the Plutonomists enjoy.
25

As the rich have been getting progressively richer over the last 30 years, saving less andspending more, the fortunes of companies that sell to the rich ought to have been good.Not only have the rich been earning and spending more, but they are less price elasticthan typical consumers. In fact we believe they have a preference for Giffen goods, i.e.,the more expensive they are, the more they are purchased.
One way we can measure this is to look at price inflation for a basket of luxury goods.Thankfully, Forbes magazine each year publishes its “Cost of Living Extremely Well”Indices, which measures annual price changes in a basket of high end consumer items,from luxury yachts, to the cost of dinner at the world’s top restaurants, right down to thecost of a pair of fine English shoes.
Figure 26 shows this index, back to 1976, and the aggregate CPI for the U.S. Since1976, when this index started, the inflation rate of luxury products that the rich buy, hasrisen far faster than overall CPI. Turned around another way, the corporate price deflatorfor luxury items, or pricing power for luxury companies, has been relatively positive.
Figure 26. Forbes “The Cost of Living Extremely Well Index” - Pricing Power for Luxury Goods Much Strongerthan Overall CPI Over Time
100
200
300
400
500
600
700
1976 1980 1984 1988 1992 1996 2000 2004
100
200
300
400
500
600
700Clewi Index CPI
Source: Citigroup Investment Research, Forbes, and Datastream
This pricing power is surely a huge benefit to luxury related companies. In theory, allother things being equal, this added pricing power should have led to outperformance,and if maintained, should continue to do so.
26

Figure 27. The Plutonomy Basket: Stocks That Leverage of Plutonomy
Company RIC Rating GICS IndustryGroup
MarketVal. U$m
Price Oct 13
1. Porsche PSHG_p.DE 3H Autos &Components
6,282 EUR601.63
2. DicksonConcepts
0113.HK NR Capital Goods 452 $11.3
3. Beneteau BEN.PA NR Cons Durables &App
1,404 EUR67.5
4. Bulgari BULG.MI 1M Cons Durables &App
3,215 EUR9.055
5. Burberry BRBY.L 1M Cons Durables &App
3,093 £3.7125
6. Coach COH NR Cons Durables &App
11,116 $29.24
7. Hermes RMS.PA NR Cons Durables &App
8,058 EUR184.1
8. LVMH MC.PA NR Cons Durables &App
39,346 EUR67.3
9. Polo RalphLauren
RL NR Cons Durables &App
2,998 $49.26
10. Richemont CFR.VX 1M Cons Durables &App
21,304 SwF48.2
11. RodriguezGroup
ROD.PA NR Cons Durables &App
735 EUR49.3
12. TasakiShinju
7968 NR Cons Durables &App
161 ¥488
13. Tod's TOD.MI NR Cons Durables &App
1,776 EUR49.2
14. TollBrothers
TOL 1H Cons Durables &App
5,838 $37.5
15. Wolford WOF.F NR Cons Durables &App
101 EUR17
16. FourSeasonsHotels
FSH-SV.TO NR ConsumerServices
1,850 $66.54
17. Kuoni KUNN.S 1M ConsumerServices
1,178 SwF510
18. MandarinOriental
MOIL.SI NR ConsumerServices
801 $0.805
19. Shangri-LaAsia
0069.HK NR ConsumerServices
3,874 HK$11.9
20. Shinwa ArtAuction
2437 NR ConsumerServices
150 ¥920,000
21. Sothebys BID NR ConsumerServices
920 $16.04
22. Julius BaerBAER.VX 1H Div Financials 3,877 SwF95.1523. Vontobel VONN.SW NR Div Financials 1,801 SwF3624. Tiffany TIF NR Retailing 5,491 $38.55
Source: Citigroup Investment Research and Datastream
To test this, we built a basket of companies that serve or sell to the rich, the beneficiariesof Plutonomy. The companies - not all followed by Citigroup Investment Research - fallinto a number of areas, from Private Banking (for example Julius Baer), to traditionalluxury goods like Bulgari, through art auction houses (e.g., Sotheby’s), and of courseluxury toys, such as Porsche. The full basket is in Figure 27. We emphasize that astock’s inclusion in this basket in no way makes it a recommended buy, from CitigroupInvestment Research, unless rated so by our respective analyst.
The basis for inclusion was that a majority of the company’s revenues were/are derivedfrom the “rich”. Hence Bombardier, the manufacturer of Lear Jets, did not make the list,
27
though clearly that product is a typical plutonomy “toy”. This list is by no meansexhaustive.
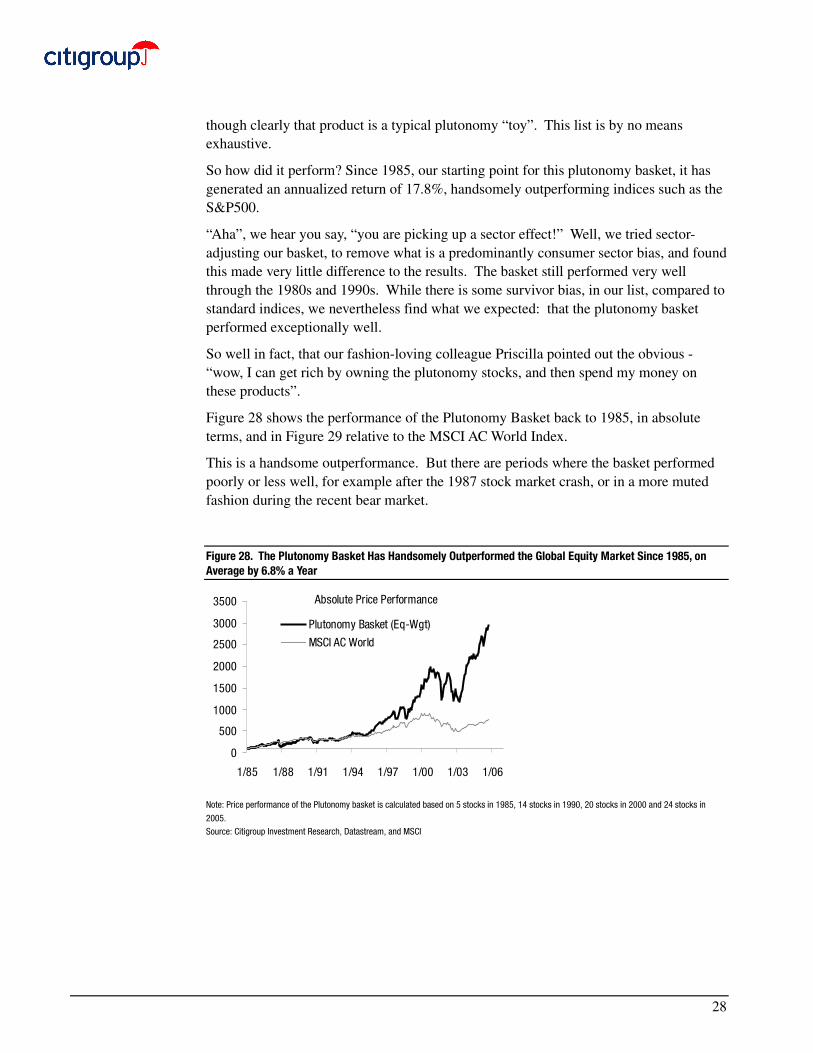
So how did it perform? Since 1985, our starting point for this plutonomy basket, it hasgenerated an annualized return of 17.8%, handsomely outperforming indices such as theS&P500.
“Aha”, we hear you say, “you are picking up a sector effect!” Well, we tried sector-adjusting our basket, to remove what is a predominantly consumer sector bias, and foundthis made very little difference to the results. The basket still performed very wellthrough the 1980s and 1990s. While there is some survivor bias, in our list, compared tostandard indices, we nevertheless find what we expected: that the plutonomy basketperformed exceptionally well.
So well in fact, that our fashion-loving colleague Priscilla pointed out the obvious -“wow, I can get rich by owning the plutonomy stocks, and then spend my money onthese products”.
Figure 28 shows the performance of the Plutonomy Basket back to 1985, in absoluteterms, and in Figure 29 relative to the MSCI AC World Index.
This is a handsome outperformance. But there are periods where the basket performedpoorly or less well, for example after the 1987 stock market crash, or in a more mutedfashion during the recent bear market.
Figure 28. The Plutonomy Basket Has Handsomely Outperformed the Global Equity Market Since 1985, onAverage by 6.8% a Year
0
500
1000
1500
2000
2500
3000
3500
1/85 1/88 1/91 1/94 1/97 1/00 1/03 1/06
Plutonomy Basket (Eq-Wgt)
MSCI AC World
Absolute Price Performance
Note: Price performance of the Plutonomy basket is calculated based on 5 stocks in 1985, 14 stocks in 1990, 20 stocks in 2000 and 24 stocks in
2005.
Source: Citigroup Investment Research, Datastream, and MSCI
28

Figure 29. Up, Up and Away: Plutonomy Basket Outperforms World Equities Handsomely
50
100
150
200
250
300
350
400
450
1/85 1/88 1/91 1/94 1/97 1/00 1/03 1/06
Plutonomy Basket Performance Relative to MSCI AC World
Source: Citigroup Investment Research, Datastream, and MSCI
This is hardly a major surprise; given that the Plutonomy is fuelled by an equity marketboom, and threatened by a bust, given the rich are disproportionately long the equitymarket.
The average person, by contrast, tends to have a disproportionate amount of their wealthtied up in housing. While a stock market boom should help the rich, a housing boomshould help the average Joe.
Belsky and Prakken’s paper suggests that housing booms tend to get reflected inspending more rapidly than stock market booms - in other words, the wealth effect fromhouse price rises gets turned on more quickly than from equity prices rising.
It is interesting when we look at the performance of the stock market relative to thehousing market, and compare this to the performance of the Plutonomy basket relative tothe broad equity market, we find that during periods of house price appreciation relativeto stock market appreciation, our plutonomy basket moves sideways. See Figure 30.
Figure 30. If Stocks beat Housing, Plutonomy Basket Does Even Better - The Rich Have disproportionatelyMore Equities than Housing
0
100
200
300
400
500
600
1/85 1/88 1/91 1/94 1/97 1/00 1/03 1/06
0
50
100
150
200
250
300
350
400US stock market / housing prices, LSPlutonomy basket rel to world stock market, RS
Equities underperformance stifles luxury basket advance. If equities beat housing going forward, luxury may do well.
Note: U.S. housing prices based on NAR Median Sales Prices of existing 1-Family Homes
Source: Citigroup Investment Research, Datastream, National Association of Realtors, and MSCI
29

If like us, you believe that attempts by the UK, U.S., and Australian authorities to coolthe housing market is likely to work, and you believe, like us, that equities are likely toperform well in coming years, this is a good time to switch out of stocks that sell to themasses and back to the plutonomy basket.
Conclusion
We are not often shocked. But shocked we were, when we published our note on theIrrelevance of Oil, several weeks ago, and discovered just how significant the rich werein terms of income, wealth and consumption in the U.S.
Looking into this in more detail, we have found that the U.S. is not alone. Un-equalsocieties abound in the Anglo-Saxon world. This income inequality, we have calledPlutonomy.
Outlandish it may sound, but examined through the prism of plutonomy, some of thegreat mysteries of the economic world seem to look less mystifying. As we showed,there is a clear relationship between income inequality and low savings rates: the richare happy to run low or negative savings given their growing pool of wealth. In turn,those countries with low/negative household savings rates tend to be the countriesassociated with current account deficits.
So why should we equity strategists care about this? Well simply, because the issue thatmost consistently seems to vex our equity client base, from a top down perspective, isthe U.S. current account deficit, the associated lack of savings, and the build-up of debt.It is both intellectually fashionable and elegant, apparently, to attack “the crazyAmerican consumer, and his/her overspending”.
This has of course, from a portfolio perspective, been a costly trade to run-with, over thelast 10 years. Those “crazy American consumers” seem to be in rude health. Theirimminent demise has been a long time imminent.
If we are right, that the rise of income inequality, the rise of the rich, the rise ofplutonomy, is largely to blame for these “perplexing” global imbalances. Surely, then, itis the collapse of plutonomy, rather than the collapse of the U.S. dollar that we shouldworry about to bring an end to imbalances. In other words, we are fretting unnecessarilyabout global imbalances. In turn, the risk premium on equities is probably too high.
Secondly, we hear so often about “the consumer”. But when we examine the data, thereis no such thing as “the consumer” in the U.S. or UK, or other plutonomy countries.There are rich consumers, and there are the rest. The rich are getting richer, we havecontended, and they dominate consumption.
As the rich have been getting richer, so too stocks associated with the rich, haveperformed exceptionally well. Our Plutonomy Basket, generated returns of 17.8% perannum, on average, from 1985. If Plutonomy continues, which we think it will, ifincome inequality is allowed to persist and widen, the plutonomy basket should continueto do very well. Names in this basket that our analysts recommend as buys includeJulius Baer, Bulgari, Burberry, Richemont, Kuoni, and Toll Brothers.
30
Bibliography
1. Alveredo, Facundo & Saez, Emmanuel. “Income and Wealth Concentration in Spainin a Historical and Fiscal Perspective. September 2005.
2. Atkinson, A.B. “Income Inequality in OECD Countries: Data and Explanations:Center for Economic Studies Working Paper No. 881.” Center for EconomicResearch, Feb. 2003
3. Atkinson, A.B. “Top Incomes in the United Kingdom over the Twentieth Century”.Discussion Paper in Economic and Social History, Univeristy of Oxford. December2003.
4. Atkinson, A.B. and Salverda, Wiemer “Top Incomes in the Netherlands and theUnited Kingdom over the Twentieth Century”. Discussion Paper in Economic andSocial History, Univeristy of Oxford. June 2003.
5. Bayoumi, Tamim & Edison, Hali “Is Wealth Increasingly Driving Consumption?”.DNB Staff Reports 2003, No. 101
6. © Belsky, Eric & Prakken, Joel. “Housing Wealth Effects: Housing’s Impact onWealth Accumulation, Wealth Distribution and Consumer Spending”. December2004. W-4-13. Joint Center for Housing Studies. © 2004 President and Fellows ofHarvard College.
7. Dell, Fabian; Piketty, Thomas; Saez, Emmanuel; “Income and Wealth Concentrationin the Switzerland Over the 20th Century”. Discussion Paper 590. Centre forEconomic Policy Research. May 2005.
8. Feroli, Michael. “Capital Flows Among the G-7 Nations: A DemographicPerspective”. Federal Research Board Division of Research and Statistics. October2003.
9. Heshmati, Almas “The World Distribution of Income and Income Inequality”, IZADiscussion Paper No. 1267. Institute for the Study of Labor. August 2004.
10. Juster F. Thomas; Lupton, Joseph P.; Smith, James P.; Stafford, Frank. “The Declinein Household Saving and the Wealth Effect”. University of Michigan, Board ofGovernors of the Federal Reserve System. April 2004.
11. Kaplan, Richard “Economic Inequality and the Role of Law”. Kaplan PP5.December 2003.
12. Kpczuk, Wojciech & Saez, Emmanuel. “Top Wealth Shares in the United States,1916-2000: Evidence From Estate Tax Returns”. National Bureau of EconomicResearch. March 2004.
13. Leigh, Andrew “Permanent Income Inequality: Australia, Britain, Germany, andUnited States Compared”. Social Policy Evaluation, Analysis and Research Centre,Research School of Social Sciences, Australian National University. September2005.
14. Maki, Dean M. & Palumbo, Michael G. “Disentangling the Wealth Effect: ACohort Analysis of Household Saving in the 1990’s”. Board of Governors of theFederal Reserve System & Putnam Investments. April 2001.
31
15. Moriguchi, Chiaki & Saez, Emmanuel. “The Evolution of Income Concentration inJapan, 1885 - 2002: Evidence from Income Tax Statistics”. National Bureau ofEconomic Research. August 2005.
16. Phillips, Kevin. “Wealth and Democracy”. Broadway Books. 2002.
17. Piketty, Thomas “Income Inequality in France 1901 - 1998” April 2001.
18. Piketty, Thomas & Saez, Emmanuel “Income Inequality in the United States, 1913- 2002. November 2004.
19. Schmidt-Hebbel, Kalus & Serven, Luis. “Income Inequality and AggregateSaving. The Cross-Country Evidence”. Policy Research Working Paper 1561. TheWorld Bank, Policy Research Department, Macroeconomics and Growth Division,January 1996.
20. Saez, Emmanual “Income and Wealth Concentration in a Historical andInternational Perspective”. February 2004.
21. Saez, Emmanuel “Reported Incomes and Marginal Tax Rates, 1960-2000:Evidence and Policy Implications”. National Bureau of Economic Research.January 2004.
22. Saez, Emmanuel. “Top Incomes in the United States and Canada over theTwentieth Century”
23. Saez, Emmanuel & Veall, Michael R. “The Evolution of High Incomes inNorthern America: Lessons from Canadian Evidence”. The American EconomicReview. June 2005.
24. Smeeding, Timothy. “Globalization, Inequality, and the Rich Countries of the G-20: Evidence From the Luxembourg Income Study”. The Maxwell School ofSyracuse University Center for Policy Research. November 2002.
25. Smeeding, Timothy M. “Public Policy, Economic Inequality, and Poverty: TheUnited States in Comparative Perspective”. The Maxwell School of SyracuseUniversity Center for Policy Research. May 2005.
26. Wolff, Edward N. “Changes in Household Wealth in the 1980’s and 1990’s in theU.S.” International Perspectives on Household Wealth, Elgar Publishing Ltd., April2004.
32

ANALYST CERTIFICATION APPENDIX A-1I, Ajay Kapur, Niall Macleod, Narendra Singh, research analyst and the author of this report, hereby certify that all of the views expressedin this research report accurately reflect my personal views about any and all of the subject issuer(s) or securities. I also certify that nopart of my compensation was, is, or will be directly or indirectly related to the specific recommendation(s) or view(s) in this report.
IMPORTANT DISCLOSURESAnalysts’ compensation is determined based upon activities and services intended to benefit the investor clients of Citigroup GlobalMarkets Inc. and its affiliates ("the Firm"). Like all Firm employees, analysts receive compensation that is impacted by overall firmprofitability, which includes revenues from, among other business units, the Private Client Division, Institutional Equities, and InvestmentBanking.
Citigroup Investment Research Ratings DistributionData current as of 30 September 2005 Buy Hold SellCitigroup Investment Research Global Fundamental Coverage (2650) 41% 42% 18%
% of companies in each rating category that are investment banking clients 48% 47% 32%Guide to Fundamental Research Investment Ratings:Citigroup Investment Research’s stock recommendations include a risk rating and an investment rating.Risk ratings, which take into account both price volatility and fundamental criteria, are: Low (L), Medium (M), High (H), and Speculative(S).Investment ratings are a function of Citigroup Investment Research’s expectation of total return (forecast price appreciation anddividend yield within the next 12 months) and risk rating.For securities in developed markets (US, UK, Europe, Japan, and Australia/New Zealand), investment ratings are: Buy (1) (expected totalreturn of 10% or more for Low-Risk stocks, 15% or more for Medium-Risk stocks, 20% or more for High-Risk stocks, and 35% or more forSpeculative stocks); Hold (2) (0%-10% for Low-Risk stocks, 0%-15% for Medium-Risk stocks, 0%-20% for High-Risk stocks, and0%-35% for Speculative stocks); and Sell (3) (negative total return).For securities in emerging markets (Asia Pacific, Emerging Europe/Middle East/Africa, and Latin America), investment ratings are: Buy(1) (expected total return of 15% or more for Low-Risk stocks, 20% or more for Medium-Risk stocks, 30% or more for High-Risk stocks,and 40% or more for Speculative stocks); Hold (2) (5%-15% for Low-Risk stocks, 10%-20% for Medium-Risk stocks, 15%-30% forHigh-Risk stocks, and 20%-40% for Speculative stocks); and Sell (3) (5% or less for Low-Risk stocks, 10% or less for Medium-Riskstocks, 15% or less for High-Risk stocks, and 20% or less for Speculative stocks).Investment ratings are determined by the ranges described above at the time of initiation of coverage, a change in risk rating, or achange in target price (subject to limited management discretion). At other times, the expected total returns may fall outside of theseranges because of market price movements and/or other short-term volatility or trading patterns. Such interim deviations from specifiedranges will be permitted but will become subject to review by Research Management. Your decision to buy or sell a security should bebased upon your personal investment objectives and should be made only after evaluating the stock’s expected performance and risk.
Between September 9, 2002, and September 12, 2003, Citigroup Investment Research’s stock ratings were based upon expectedperformance over the following 12 to 18 months relative to the analyst’s industry coverage universe at such time. An Outperform (1)rating indicated that we expected the stock to outperform the analyst’s industry coverage universe over the coming 12-18 months. AnIn-line (2) rating indicated that we expected the stock to perform approximately in line with the analyst’s coverage universe. AnUnderperform (3) rating indicated that we expected the stock to underperform the analyst’s coverage universe. In emerging markets, thesame ratings classifications were used, but the stocks were rated based upon expected performance relative to the primary market indexin the region or country. Our complementary Risk rating system -- Low (L), Medium (M), High (H), and Speculative (S) -- took intoaccount predictability of financial results and stock price volatility. Risk ratings for Asia Pacific were determined by a quantitative screenwhich classified stocks into the same four risk categories. In the major markets, our Industry rating system -- Overweight, Marketweight,and Underweight -- took into account each analyst’s evaluation of their industry coverage as compared to the primary market index intheir region over the following 12 to 18 months.
OTHER DISCLOSURESFor securities recommended in this report in which the Firm is not a market maker, the Firm is a liquidity provider in the issuers’ financialinstruments and may act as principal in connection with such transactions. The Firm is a regular issuer of traded financial instrumentslinked to securities that may have been recommended in this report. The Firm regularly trades in the securities of the subjectcompany(ies) discussed in this report. The Firm may engage in securities transactions in a manner inconsistent with this research reportand, with respect to securities covered by this report, will buy or sell from customers on a principal basis.
Securities recommended, offered, or sold by the Firm: (i) are not insured by the Federal Deposit Insurance Corporation; (ii) are notdeposits or other obligations of any insured depository institution (including Citibank); and (iii) are subject to investment risks, includingthe possible loss of the principal amount invested. Although information has been obtained from and is based upon sources that the Firmbelieves to be reliable, we do not guarantee its accuracy and it may be incomplete and condensed. Note, however, that the Firm hastaken all reasonable steps to determine the accuracy and completeness of the disclosures made in the Important Disclosures section ofthis report. In producing its research reports, members of the Firm’s research department may have received assistance from the subjectcompany(ies) referred to in this report. Any such assistance may have included access to sites owned, leased or otherwise operated orcontrolled by the issuers and meetings with management, employees or other parties associated with the subject company(ies). Firmpolicy prohibits research analysts from sending draft research to subject companies. However, it should be presumed that the author ofthis report has had discussions with the subject company to ensure factual accuracy prior to publication. All opinions, projections andestimates constitute the judgment of the author as of the date of the report and are subject to change without notice. Prices andavailability of financial instruments also are subject to change without notice. Although Citigroup Investment Research does not set apredetermined frequency for publication, if this is a fundamental research report, it is the intention of Citigroup Investment Research toprovide research coverage of this/these issuer(s), including in response to news affecting this issuer, subject to applicable quiet periods
33

and capacity constraints. This report is for informational purposes only and is not intended as an offer or solicitation for the purchase orsale of a security. Any decision to purchase securities mentioned in this research must take into account existing public information onsuch security or any registered prospectus.
Investing in non-U.S. securities, including ADRs, may entail certain risks. The securities of non-U.S. issuers may not be registered with,nor be subject to the reporting requirements of the U.S. Securities and Exchange Commission. There may be limited informationavailable on foreign securities. Foreign companies are generally not subject to uniform audit and reporting standards, practices andrequirements comparable to those in the U.S. Securities of some foreign companies may be less liquid and their prices more volatile thansecurities of comparable U.S. companies. In addition, exchange rate movements may have an adverse effect on the value of aninvestment in a foreign stock and its corresponding dividend payment for U.S. investors. Net dividends to ADR investors are estimated,using withholding tax rates conventions, deemed accurate, but investors are urged to consult their tax advisor for exact dividendcomputations. Investors who have received this report from the Firm may be prohibited in certain states or other jurisdictions frompurchasing securities mentioned in this report from the Firm. Please ask your Financial Consultant for additional details. Citigroup GlobalMarkets Inc. takes responsibility for this report in the United States. Any orders by non-US investors resulting from the informationcontained in this report may be placed only through Citigroup Global Markets Inc.
This report is made available in Australia to wholesale clients through Citigroup Global Markets Australia Pty Ltd. (ABN 64 003 114 832and AFSL No. 240992) and to retail clients through Citigroup Wealth Advisors Pty Ltd. (ABN 19 009 145 555 and AFSL No. 240813),Participants of the ASX Group and regulated by the Australian Securities & Investments Commission. If this publication is being madeavailable in certain provinces of Canada by Citigroup Global Markets (Canada) Inc. ("CGM Canada"), CGM Canada has approved thispublication. This report may not be distributed to private clients in Germany. This report is distributed in Germany by Citigroup GlobalMarkets Deutschland AG & Co. KGaA, which is regulated by Bundesanstalt fuer Finanzdienstleistungsaufsicht (BaFin). If this report ismade available in Hong Kong by, or on behalf of, Citigroup Global Markets Asia Ltd., it is attributable to Citigroup Global Markets AsiaLtd., Citibank Tower, Citibank Plaza, 3 Garden Road, Hong Kong. Citigroup Global Markets Asia Ltd. is regulated by Hong KongSecurities and Futures Commission. If this report is made available in Hong Kong by The Citigroup Private Bank to its clients, it isattributable to Citibank N.A., Citibank Tower, Citibank Plaza, 3 Garden Road, Hong Kong. The Citigroup Private Bank and Citibank N.A.is regulated by the Hong Kong Monetary Authority. This publication is made available in India by Citigroup Global Markets India PrivateLimited, which is regulated by Securities and Exchange Board of India. If this report was prepared by Citigroup Investment Research anddistributed in Japan by Nikko Citigroup Ltd., it is being so distributed under license. Nikko Citigroup Limited is regulated by FinancialServices Agency, Securities and Exchange Surveillance Commission, Japan Securities Dealers Association, Tokyo Stock Exchange andOsaka Securities Exchange. This publication is made available in Korea by Citigroup Global Markets Korea Securities Ltd., which isregulated by Financial Supervisory Commission and the Financial Supervisory Service. This publication is made available in Malaysia byCitigroup Global Markets Malaysia Sdn Bhd, which is regulated by Malaysia Securities Commission. This publication is made available inMexico by Acciones y Valores Banamex, S.A. De C. V., Casa de Bolsa, which is regulated by Comision Nacional Bancaria y de Valores.In New Zealand this report is made available through Citigroup Global Markets New Zealand Ltd., a Participant of the New ZealandExchange Limited and regulated by the New Zealand Securities Commission. This publication is made available in Poland by DomMaklerski Banku Handlowego SA an indirect subsidiary of Citigroup Inc., which is regulated by Komisja Papierów Wartosciowych i Gield.This publication is made available in the Russian Federation through ZAO Citibank, which is licensed to carry out banking activities in theRussian Federation in accordance with the general banking license issued by the Central Bank of the Russian Federation and brokerageactivities in accordance with the license issued by the Federal Service for Financial Markets. Neither this report nor any informationcontained in this report shall be considered as advertising the securities mentioned in this report within the territory of the RussianFederation or outside the Russian Federation. This report does not constitute an appraisal within the meaning of the Federal Law of theRussian Federation of 29 July 1998 No. 135-FZ (as amended) On Appraisal Activities in the Russian Federation. This publication ismade available in Singapore through Citigroup Global Markets Singapore Pte. Ltd., a Capital Markets Services Licence holder, andregulated by Monetary Authority of Singapore. Citigroup Global Markets (Pty) Ltd. is incorporated in the Republic of South Africa(company registration number 2000/025866/07) and its registered office is at 145 West Street, Johannesburg 2196. Citigroup GlobalMarkets (Pty) Ltd. is regulated by JSE Securities Exchange South Africa, South African Reserve Bank and the Financial Services Board.The investments and services contained herein are not available to private customers in South Africa. This publication is made availablein Taiwan through Citigroup Securities Investment Consulting Inc. which is regulated by Securities & Future Bureau. This publication ismade available in United Kingdom by Citigroup Global Markets Limited, which is regulated by Financial Services Authority. This materialmay relate to investments or services of a person outside of the UK or to other matters which are not regulated by the FSA and furtherdetails as to where this may be the case are available upon request in respect of this material. FSA rules require that a firm mustestablish, implement and make available a policy for managing conflicts of interest arising as a result of publication or distribution ofinvestment research. The policy applicable to Citigroup's equity research products can be found at www.citigroupgeo.com. Thispublication is made available in United States by Citigroup Global Markets Inc, which is regulated by NASD, NYSE and the US Securitiesand Exchange Commission. Unless specified to the contrary, within EU Member States, this publication is made available by CitigroupGlobal Markets Limited, which is regulated by Financial Services Authority. Compensation of equity research analysts is determined byequity research management and Citigroup's senior management and is not linked to specific transactions or recommendations. Thisreport may have been distributed simultaneously, in multiple formats, to the Firm's worldwide institutional and retail customers. Thisdocument is not to be construed as providing investment services in any jurisdiction where the provision of such services would be illegal.Subject to the nature and contents of this document, the investments described herein are subject to fluctuations in price and/or valueand investors may get back less than originally invested. Certain high-volatility investments can be subject to sudden and large falls invalue that could equal or exceed the amount invested. Certain investments contained herein may have tax implications for privatecustomers whereby levels and basis of taxation may be subject to change. If in doubt, investors should seek advice from a tax adviser.This advice has been prepared without taking account of the objectives, financial situation or needs of any particular investor.Accordingly, investors should, before acting on the advice, consider the appropriateness of the advice, having regard to their objectives,financial situation and needs.
© 2005 Citigroup Global Markets Inc. Citigroup Investment Research is a division and service mark of Citigroup Global Markets Inc. andits affiliates and is used and registered throughout the world. Citigroup and the Umbrella Device are trademarks and service marks ofCiticorp or its affiliates and are used and registered throughout the world. Nikko is a registered trademark of Nikko Cordial Corporation.All rights reserved. Any unauthorized use, duplication, redistribution or disclosure is prohibited by law and will result in prosecution. The
34

Firm accepts no liability whatsoever for the actions of third parties. The Firm makes no representations or warranties whatsoever as tothe data and information provided in any third party referenced website and shall have no liability or responsibility arising out of, or inconnection with, any such referenced website.
ADDITIONAL INFORMATION IS AVAILABLE UPON REQUEST
35