Cities Outlook 2016 - Home | Centre for CitiesCities Outlook 2016 Devolution, austerity and economic...
64
Cities Outlook 2016
Transcript of Cities Outlook 2016 - Home | Centre for CitiesCities Outlook 2016 Devolution, austerity and economic...

Cities Outlook 2016

of workplacewages
earned
63%
of population54%
of high-skilled
jobs
71%
of the welfare bill*
60%cities matter for growing the economyand lowering thewelfare bill
£
£
*excluding old age
but the challengesvary from city to city
Blackpool
Cambridge
21%
Oxford
Wake�eld
£630London
£390
Hull
average residentwages
welfare billper resident
£4.3k
£2.1k
high skills
60%
8%landmass

Centre for Cities
Cities Outlook 2016
Over the past year, there has been an increased recognition by central government that the UK’s cities are the engines of national economic growth, and that local leaders are best positioned to take decisions to make that growth even stronger. Year on year, Cities Outlook provides cities with the tools to make those decisions both through its timely policy analysis and evidence base.
Cities Outlook 2016 challenges the government to go further, by aligning welfare spend, housing priorities and skills provision at the local level, and understanding the varying economic priorities for the country at a spatial level. This level of control will be vital for Leeds if it is to stay globally and nationally competitive, and if it is to tackle poverty, and deliver on the jobs and growth that the country needs. Cllr Judith Blake, Leader, Leeds City Council
Cities Outlook is essential reading for anyone with an interest in city economies. The UK’s largest cities and towns are where the most significant economic activity takes place, where jobs are created and where businesses can thrive.
At the Greater Birmingham Chambers of Commerce, we represent over 2,500 members of all industries, sizes and walks of life from England’s second biggest city and the surrounding region. Understanding Birmingham’s strengths and weaknesses relative to other large cities and the impacts of government policy is crucial to our work.
With the government committed to supporting businesses to grow, boosting wages and cutting the welfare bill, this year’s report provides a timely and detailed picture of how different cities are performing, providing critical new insights on both the challenges and the opportunities they face as a result.
Every year Cities Outlook uses strong, reliable evidence and sharp analysis to give us in Greater Birmingham and the West Midlands the tools to help us understand our place better. Paul Faulkner, Chief Executive, Birmingham Chamber of Commerce
Cities Outlook 2016 once again tells us in the clearest terms what we can gain from delivering policies and encouraging investment decisions that recognise the growing economic importance of our cities. The Centre for Cities team is surely capturing the zeitgeist in their drive to champion more powerful cities all across the UK.
The policy context in Scotland is often very different to that in other parts of the UK; that is what devolution is all about after all. But Glasgow - as Scotland’s biggest city - has its own City Deal and is fully engaged with the UK Core Cities. We pay close attention to the publication of Cities Outlook as a thoughtful assessment of the relative progress that each of our cities is making.
The debate inside the business community about the role of the Living Wage is a forceful one. This year’s Outlook gives a helpful new perspective on why that is so. Stuart Patrick, Chief Executive, Glasgow Chamber of Commerce
The annual Centre for Cities Cities Outlook report provides a robust, independent view of the performance of our country’s cities and larger towns. We will all be tracking performance trends and benchmarking ourselves against our neighbours and similar cities which is essential for our planning for economic development. As local authorities move to increasingly localised income streams, such as the retention of business rates, it is ever more important to know how attractive and competitive each place is for business and housing growth and inward investment. The Outlook report provides a strong factual base for such comparisons and always picks up on the key economic policy themes of our times. I recommend it wholeheartedly as an essential read and reference point for all those interested in the economies and competitiveness of the featured cities and towns. Cllr David Renard, Leader, Swindon Borough Council

Centre for Cities
Cities Outlook 2016
Contents
01Cities Outlook 2016Devolution, austerity and economic growth 1
02Mapping the low wage, high welfare economyHow wages and welfare spending differ around the country 7
03City monitorThe latest data 23
Acknowledgements
All views expressed are those of Centre for Cities.

Centre for Cities
Cities Outlook 20161
01Cities Outlook 2016
Devolution, austerity and economic growth

Centre for Cities
Cities Outlook 2016 2
Centre for Cities
Cities Outlook 20163
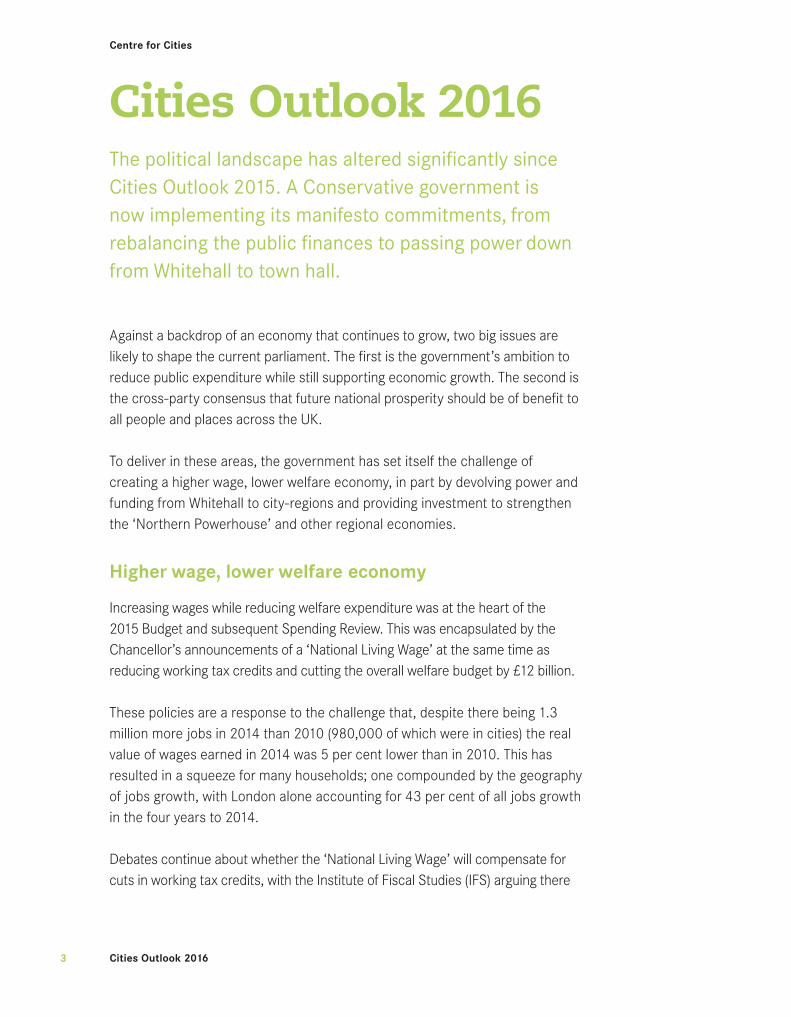
Cities Outlook 2016The political landscape has altered significantly since Cities Outlook 2015. A Conservative government is now implementing its manifesto commitments, from rebalancing the public finances to passing power down from Whitehall to town hall.
Against a backdrop of an economy that continues to grow, two big issues are likely to shape the current parliament. The first is the government’s ambition to reduce public expenditure while still supporting economic growth. The second is the cross-party consensus that future national prosperity should be of benefit to all people and places across the UK.
To deliver in these areas, the government has set itself the challenge of creating a higher wage, lower welfare economy, in part by devolving power and funding from Whitehall to city-regions and providing investment to strengthen the ‘Northern Powerhouse’ and other regional economies.
Higher wage, lower welfare economy
Increasing wages while reducing welfare expenditure was at the heart of the 2015 Budget and subsequent Spending Review. This was encapsulated by the Chancellor’s announcements of a ‘National Living Wage’ at the same time as reducing working tax credits and cutting the overall welfare budget by £12 billion.
These policies are a response to the challenge that, despite there being 1.3 million more jobs in 2014 than 2010 (980,000 of which were in cities) the real value of wages earned in 2014 was 5 per cent lower than in 2010. This has resulted in a squeeze for many households; one compounded by the geography of jobs growth, with London alone accounting for 43 per cent of all jobs growth in the four years to 2014.
Debates continue about whether the ‘National Living Wage’ will compensate for cuts in working tax credits, with the Institute of Fiscal Studies (IFS) arguing there

Centre for Cities
Cities Outlook 2016 4
will still be a hole in many families’ finances.1 There is also further discussion needed about the role of welfare expenditure in both supporting the most vulnerable (e.g. for those with disabilities) and helping people close to the labour market (e.g. top-ups for low wages, childcare support) while avoiding subsidising low paying employers or creating disincentives to work.
But as the policy agenda unfolds, there is an increasingly clear link between creating a higher wage, lower welfare economy and the government’s commitment to devolve more powers to cities.
Devolution Deals
Devolution has continued to gain momentum since the Chancellor set out his initial vision in July 2014 and announced the range of new powers for Greater Manchester in November 2014. Devolution, and the Northern Powerhouse, also featured in the Chancellor’s first speech after the May election. Since then Greg Clark, the new Secretary of State for Communities and Local Government and long-standing champion of devolution, has been working with city-regions to agree further Devolution Deals.
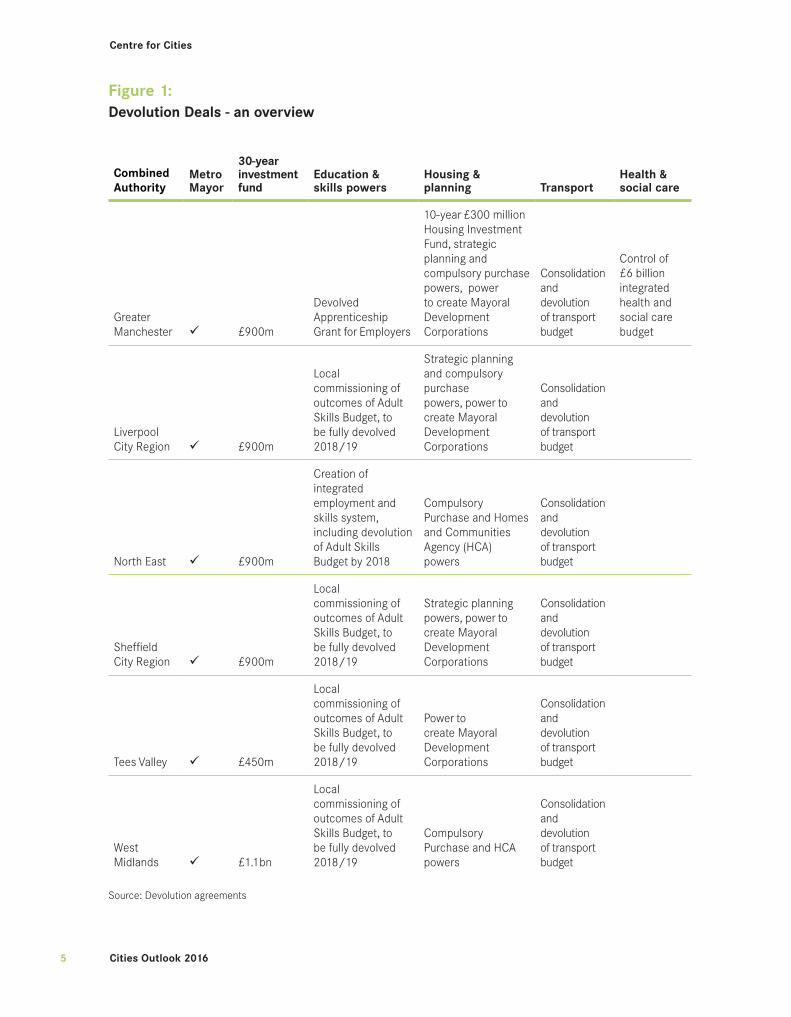
Five deals have been announced to date, with the Sheffield City Region, the North East, the Liverpool City Region, the West Midlands and Tees Valley agreeing to have directly elected metro mayors in exchange for greater powers over transport, skills, enterprise and labour market programmes, as well as additional funding. These deals are important steps towards providing cities with greater powers to adapt policy to their specific challenges. The hope is that, as has been the case in London and more recently Greater Manchester, more powers, funding and influence will flow to these areas over time.
Alongside these Devolution Deals, the local government funding settlement has also been radically reformed. In addition to managing further funding cuts (significant but less steep than initially feared), cities will have to adapt to a funding environment that is much more dependent on locally generated growth-based revenues – council tax and business rates – and much less reliant on central government needs-based grants.
1 IFS (2015) An assessment of the potential compensation provided by the new ‘National Living Wage’ for the personal tax and benefit measures announced for implementation in the current parliament”, London: IFS
Centre for Cities
Cities Outlook 20165
Figure 1:Devolution Deals - an overview
Combined Authority
Metro Mayor
30-year investment fund
Education & skills powers
Housing & planning Transport
Health & social care
Greater Manchester £900m
Devolved Apprenticeship Grant for Employers
10-year £300 million Housing Investment Fund, strategic planning and compulsory purchase powers, power to create Mayoral Development Corporations
Consolidation and devolution of transport budget
Control of £6 billion integrated health and social care budget
Liverpool City Region £900m
Local commissioning of outcomes of Adult Skills Budget, to be fully devolved 2018/19
Strategic planning and compulsory purchase powers, power to create Mayoral Development Corporations
Consolidation and devolution of transport budget
North East £900m
Creation of integrated employment and skills system, including devolution of Adult Skills Budget by 2018
Compulsory Purchase and Homes and Communities Agency (HCA) powers
Consolidation and devolution of transport budget
Sheffield City Region £900m
Local commissioning of outcomes of Adult Skills Budget, to be fully devolved 2018/19
Strategic planning powers, power to create Mayoral Development Corporations
Consolidation and devolution of transport budget
Tees Valley £450m
Local commissioning of outcomes of Adult Skills Budget, to be fully devolved 2018/19
Power to create Mayoral Development Corporations
Consolidation and devolution of transport budget
West Midlands £1.1bn
Local commissioning of outcomes of Adult Skills Budget, to be fully devolved 2018/19
Compulsory Purchase and HCA powers
Consolidation and devolution of transport budget
Source: Devolution agreements

Centre for Cities
Cities Outlook 2016 6
The elevation of cities policy to the forefront of the government’s growth agenda is significant and overdue in a country as centralised as the UK. But cities will be key to delivering other policy priorities too.
This is particularly important when it comes to reducing public expenditure, including the welfare bill. The siloed nature of public spending, by policy area and government department, has encouraged inefficiency and duplication. Given the scale of the government’s ambitious public expenditure agenda, devolving more public service budgets to city regions offers the best chance of achieving the greater savings, reforms and improvements required.

Centre for Cities
Cities Outlook 20167
02Mapping the low wage, high welfare economy

Centre for Cities
Cities Outlook 2016 8
Centre for Cities
Cities Outlook 20169
How can the government deliver on its high wage, low welfare promise?In the first Budget speech of the new Conservative government, Chancellor George Osborne set out his aim of both reducing the UK’s spending on welfare and increasing wages.
“We have to move Britain from a low wage, high tax, high welfare society to a higher wage, lower tax, lower welfare economy.” George Osborne, Summer Budget 2015
This chapter explores the lessons that successful cities offer the government and Chancellor as they attempt to realise this goal. These cities are places where residents already earn high wages and receive relatively low levels of welfare spending. By analysing the factors driving this success, insights can be gained into the kinds of policy support that other cities, where welfare spending is higher and wages are lower, will need in order to improve their performance.
Box 1: The use of primary urban areas
The analysis undertaken in Cities Outlook compares cities’ Primary Urban
Areas (PUAs) – a measure of the built up area of a city, rather than local
authority districts. Chapter 3 discusses PUAs, and the recent update of
the definition, in more detail.

Centre for Cities
Cities Outlook 2016 10
Cities, wages and welfare
Cities are where the majority of wages are earned in Britain, and where the majority of welfare spending takes place. As Figure 1 shows, cities account for 54 percent of the population, but generate 63 per cent of all wages in Britain. They are also home to 71 per cent of all knowledge intensive business services jobs, which tend to be higher skilled and better paid. But the wages of residents in cities tend to be lower, reflecting the fact that many urban workers actually live outside the city itself. City dwellers receive 54 per cent of all wages earned in Britain.
When looking at welfare overall, spending in cities is equivalent to population (54 per cent). But when old age benefits are removed – the majority of which are protected from cuts to welfare spending – the share of welfare spending in cities increases to 60 per cent, reflecting the younger demographic of urban Britain. These statistics underline the important role that improving city performance will have in achieving a higher wage, lower welfare economy.
Figure 2Cities’ share of population, wages and welfare spend
Source: ONS 2015, Annual Survey of Hours and Earnings; DWP 2015; HMRC 2015; DCLG 2015; Welsh Government 2015; Scottish Government 2015; NOMIS 2015, Population estimates; ONS 2015, Birth summary tables; National Registers of Scotland 2015, Births by sex, year and council area
Earnings made in cities don’tstay within city limits
Welfare spend in cities re�ectsthe size of the urban population...
...but this is not the case forpeople below retirement age
cities’ share ofpopulation, 2015
54%54%
wages earned bycity residents, 2015
GV
A
63%
welfare spendin cities excluding
old age spend, 2014/15
56%
cities’ share ofpopulation
under 65, 2015
60%
welfare spendin cities, 2014/15
54%
wages earnedin cities, 2015
£££££
£££££
£££££
£££££

Centre for Cities
Cities Outlook 201611
Aberdeen
Aldershot
Barnsley
Basildon
Birkenhead
Birmingham
Blackburn
Blackpool
Bournemouth
Bradford
Brighton
Bristol
Burnley
Cambridge
Cardiff
Chatham
Coventry
Crawley
Derby
Doncaster
Dundee
Edinburgh
Exeter
Glasgow
Gloucester
Huddersfield
Hull
Ipswich
Leeds
Leicester
Liverpool
London
Luton
Manchester
Mansfield
Middlesbrough
Milton Keynes
NewcastleNewport
Northampton
Norwich
Nottingham
Oxford
Peterborough
Plymouth
Portsmouth
Preston
Reading
Sheffield
Slough
Southampton
Southend
Stoke
Sunderland
Swansea
Swindon
Telford
Wakefield
Warrington
Wigan
Worthing
York
350
400
450
500
550
600
650 High wage, low welfare
GB
aver
age:
£3,
358
GB average: £504
High wage, high welfare
Low wage, low welfare Low wage, high welfare
2,000 2,500 3,000 3,500 4,000 4,500
Res
iden
t w
age,
201
4 (£
)
Welfare bill per capita, 2014/15 (£)
Which cities are already high wage, low welfare economies?
Some places are already delivering on the government’s desire to have a higher wage, lower welfare national economy. As Figure 3 shows:
• 14 cities, such as Aberdeen and Reading, already have above average wages and below average levels of welfare per capita.
• 18 cities have below average levels of welfare, but also below average wages.
• The category with the highest number of cities is the one that the government is most concerned about; 29 cities are low wage, high welfare economies.
• Just one city, Southend, is classed as a ‘high wage, high welfare’ city, which is driven by its higher than average spend on old age benefits. For presentation purposes Southend is excluded from the following analysis.
Figure 3Resident wages and welfare
Source: ONS 2015, Annual Survey of Hours and Earnings; DWP 2015; HMRC 2015; DCLG 2015; Welsh Government 2015; Scottish Government 2015; NOMIS, Population estimates; ONS 2015, Birth summary tables; National Registers of Scotland 2015, Births by sex, year and council area
Centre for Cities
Cities Outlook 2016 12
Dundee
EdinburghGlasgow
Newcastle
Sunderland
Middlesbrough
Hull
York
Leeds
Swansea
Cardiff
Newport
Bristol
Gloucester
Exeter
Plymouth
Portsmouth
Aberdeen
SouthamptonBournemouth Brighton
Worthing
SouthendBasildon
Chatham
Crawley
London
Norwich
Ipswich
Peterborough
Aldershot
Reading
Swindon
Oxford
Milton Keynes
Northampton
Luton
Cambridge
Stoke
Telford
Birmingham
Coventry
Leicester
Nottingham
Mansfield
Derby
Sheffield
DoncasterWakefield
Bradford
Birkenhead
LiverpoolWigan
Manchester
Burnley
BlackpoolPreston
Blackburn
Warrington
Barnsley
Slough
Huddersfield
High wage, low welfare
Low wage, low welfare
High wage, high welfare
Low wage, high welfare
Benefits typology
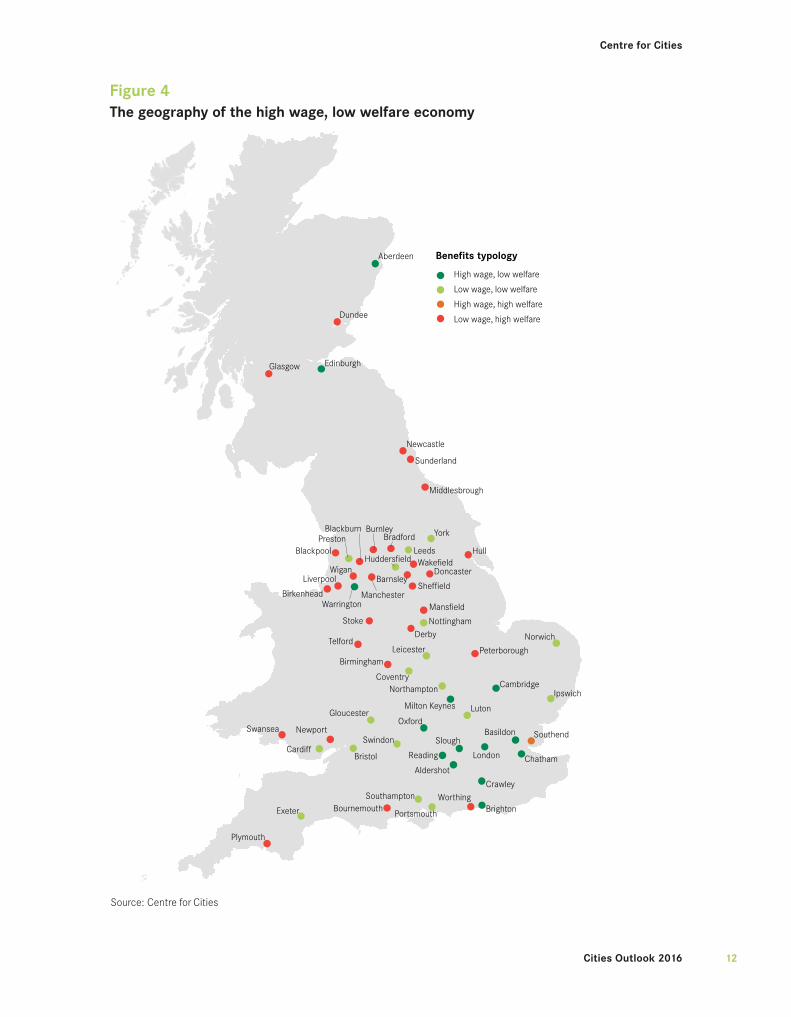
Figure 4The geography of the high wage, low welfare economy
Source: Centre for Cities

Centre for Cities
Cities Outlook 201613
There is a clear geography to these distinctions. As Figure 4 shows, 11 of the 14 cities that are ‘high wage, low welfare’ cities are in the South, with the exceptions being Aberdeen, Edinburgh and Warrington. And just four of the ‘low wage, high welfare’ cities are in the South – Bournemouth, Peterborough, Plymouth and Worthing.
For the government to achieve its ambition of creating a higher wage, lower welfare economy, a more detailed understanding is required of the factors driving these differences – including the ability of cities to create jobs, to attract and retain high skilled workers, and the recent growth in urban welfare spending.
Box 2: Measuring welfare in cities
Welfare spending in cities is overseen by three departments. The bulk
of benefit spend, including Employment and Support Allowance and
Housing Benefit, is overseen by the Department for Work and Pensions.
HMRC is responsible for Child Benefit and Child and Working Tax
Credits. And the Department for Communities and Local Government
is responsible for Council Tax Support in England, while the devolved
administrations deal with it in Wales and Scotland.
Most benefits have data available at the local authority level. Where this
wasn’t the case, the regional benefit spend was apportioned to the local
authority according to that authority’s demographic. For example, for
maternity benefits, the share of births in a region that was in a specific
local authority was used to allocate spend to the authority.
Centre for Cities
Cities Outlook 2016 14
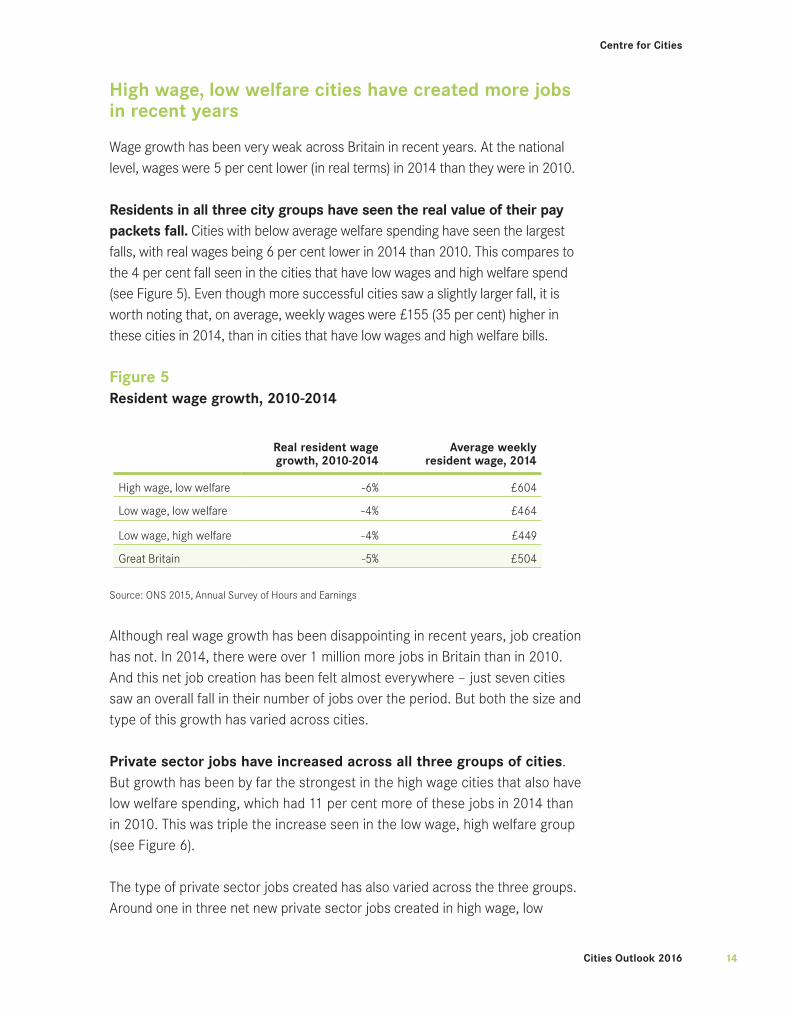
High wage, low welfare cities have created more jobs in recent years
Wage growth has been very weak across Britain in recent years. At the national level, wages were 5 per cent lower (in real terms) in 2014 than they were in 2010.
Residents in all three city groups have seen the real value of their pay packets fall. Cities with below average welfare spending have seen the largest falls, with real wages being 6 per cent lower in 2014 than 2010. This compares to the 4 per cent fall seen in the cities that have low wages and high welfare spend (see Figure 5). Even though more successful cities saw a slightly larger fall, it is worth noting that, on average, weekly wages were £155 (35 per cent) higher in these cities in 2014, than in cities that have low wages and high welfare bills.
Figure 5Resident wage growth, 2010-2014
Real resident wage growth, 2010-2014
Average weekly resident wage, 2014
High wage, low welfare -6% £604
Low wage, low welfare -4% £464
Low wage, high welfare -4% £449
Great Britain -5% £504
Source: ONS 2015, Annual Survey of Hours and Earnings
Although real wage growth has been disappointing in recent years, job creation has not. In 2014, there were over 1 million more jobs in Britain than in 2010. And this net job creation has been felt almost everywhere – just seven cities saw an overall fall in their number of jobs over the period. But both the size and type of this growth has varied across cities.
Private sector jobs have increased across all three groups of cities. But growth has been by far the strongest in the high wage cities that also have low welfare spending, which had 11 per cent more of these jobs in 2014 than in 2010. This was triple the increase seen in the low wage, high welfare group (see Figure 6).
The type of private sector jobs created has also varied across the three groups. Around one in three net new private sector jobs created in high wage, low

Centre for Cities
Cities Outlook 201615
-20
-15
-10
-5
0
5
10
15
20
Publiclyfunded
PublicAdmin
Education Health Private Private KIBS
High wage, low welfare
Low wage, high welfare
Low wage, low welfare
Other private
jobs
Cha
nge
in jo
bs, 2
010
to 2
014
(%)
welfare cities has been in knowledge intensive business services (KIBS), which tend to be higher skilled, better paid jobs. In the low wage cities that have high welfare spending, this figure was one in four. Interestingly, in low wage, low welfare cities - where private sector growth has been the lowest - the contribution of KIBS has been the highest – more than one in two net new private sector jobs was a KIBS job.
Figure 6 Change in jobs, 2010-2014
Source: NOMIS 2015, Business Register and Employment Survey
High wage cities with low welfare spending have also seen the strongest growth of publicly funded jobs in recent years. This is for two reasons: firstly, they have seen the smallest cuts to jobs in public administration. Secondly, reflecting their larger population growth and greater demand on services, they have also seen the largest increases in jobs in health and education, as shown in Figure 6.2
2 Despite cuts to public sector funding, the number of publicly funded jobs has actually increased slightly in recent years. This is because cuts to jobs in public administration have been offset by growth in education and health, both of which have had their budgets ring-fenced.

Centre for Cities
Cities Outlook 2016 16
Box 3: Definition of publicly-funded jobs
Publicly funded jobs are defined in this work as those jobs that fall into
the sectors of:
• Public administration and defence
• Education
• Health
This definition is not perfect. But according to the ONS, it captured 85
percent of what the ONS classes as ‘public sector’ in 2013.3 And of
the remaining 15 percent, 7 percent were jobs in financial services –
principally RBS, which is likely to be re-privatised – and communications
– principally Royal Mail, which has now been privatised.
Our definition also captures those jobs, such as GPs, universities and
sixth form colleges – the latter classed as public sector in Wales and
Scotland but private sector in England – that are principally funded by the
public sector. This does of course mean that private education and health
care providers are also captured in this measurement, but unfortunately
the data is not made available to create a more refined definition.
High wage, low welfare cities also tend to have much higher shares of skilled residents
High wage, low welfare cities tend to have more highly qualified people living in them. Cities with large shares of high skilled residents living in and around them are attractive to high skilled businesses. The higher skilled a person is, the more likely it is that they will be able to find employment and the less likely it is that they will require welfare support. For both of these reasons, skills is a very important factor in explaining the divergence seen between the different groups of cities.
3 ONS (2015) Guide to using public/private estimates from the Business Register and Employment Survey (BRES), Newport: ONS

Centre for Cities
Cities Outlook 201617
Figure 7Skills and school performance across cities
Category
Share of residents with a degree level
(or equivalent) qualification, 2014
Share of residents with no formal
qualification, 2014
Share of students achieving 5 A*-C including Maths
and English, 2014*
High wage, low welfare 47% 7% 61%
Low wage, low welfare 34% 9% 54%
Low wage, high welfare 30% 12% 53%
Source: NOMIS 2015, Annual Population Survey; Department for Education 2015, GCSE and Equivalent Results in England; Welsh Government 2015, Schools in Wales: Examination Performance; Department of Education Northern Ireland (DENI) 2015, Qualifications and Destinations. Note: data for Wales is for Maths & English or Welsh. *Excludes Scottish cities
As Figure 7 shows, almost half of working age people in cities with high wages have a degree, compared to around one in three in low wage cities. School performance tends to be much higher too – cities that have higher paid residents and low welfare spend tend to see a higher share of pupils get at least five good GCSEs. This means that not only do high wage, low welfare cities have a larger stock of high skilled residents, but also that those entering either the workplace or higher education tend to be more highly qualified.
But high wage, low welfare cities have seen the largest growth of welfare in recent years
Spending on benefits in Britain has risen sharply in recent years. Between 2004/05 and 2010/11, real benefit spending increased by 24 per cent. But the geography of this is surprising – it was the cities with the lowest benefit spend at the start of this period, rather than the highest, which saw the largest increases.
Milton Keynes saw the largest increase of all cities – its total welfare bill increased by 45 per cent. It was followed by Peterborough, Slough and Swindon. Meanwhile Aberdeen, Dundee and Glasgow saw the smallest increases.
There were two principal reasons for this. Firstly, high wage cities with low welfare spending saw larger increases in housing benefit spend than low wage cities with a high welfare spend (see Figure 8). Secondly these cities also saw much larger population growth, which increased benefits spending linked to demographics, such as maternity pay and child benefit.

Centre for Cities
Cities Outlook 2016 18
-5
0
5
10
15
20
25
30
High wagelow welfare
Low wagelow welfare
Low wagehigh welfare
Rea
l ter
ms
grow
th in
wel
fare
,20
04/0
5 to
201
0/11
(%) Maternity
Total
Tax Credits
Child benefit
Old age
JSA
ESA, IB and IS
Housing
Council Tax
Disability
Caring and bereavement
Figure 8Real terms growth in welfare, 2004/05 to 2010/11
Source: DWP 2015; HMRC 2015; NOMIS 2015, Population estimates, ONS 2015, Birth summary tables; National Registers of Scotland 2015, Births by sex, year and council area
Box 4: National welfare spending since 2004/05
Over the term of the last Labour government, welfare spending
outstripped economic growth. Between 2004/05 and 2010/11 the
welfare bill grew at over 4 per cent a year in real terms, compared to an
average annual growth rate of the national economy of 0.8 per cent. This
growth of welfare spending was driven by tax credits, pension benefits
and housing benefit.
In the first couple of years of the last parliament, welfare spending
slowed, particularly welfare spending on things other than old age
benefits, but it did continue to grow. This has changed since 2012/13.
Benefit spend has declined in real terms, with welfare spend excluding
old age benefits falling by 0.7 per cent a year. This decrease has been
driven in part by the fall in unemployment seen in recent years, which
has reduced spending on Jobseekers’ Allowance. But cuts to Child
Benefit and Child and Working Tax Credits have also been important.

Centre for Cities
Cities Outlook 201619
-2
-1
0
1
2
3
4
5
2004/05 to 2010/11
2010/11 to2012/13
2012/13 to2014/15
Real
ave
rage
ann
ual g
row
th r
ate
(%)
Total welfare bill
Welfare bill minusold-age benefits
Figure 9
Real terms annual average growth in welfare, 2014/15 prices
Source: DWP 2015; HMRC 2015; DCLG 2015; Welsh Government 2015; Scottish Government 2015 Note: Pension benefits are defined as State Pension, Pension Credit, over 75 TV licences, Winter Fuel Allowance and Cold Weather Payments
This pattern has continued since 2010/11. All categories of cities have continued to see an overall increase in real benefit spend between 2010/11 and 2014/15, mainly as a result of old age benefit spending, as discussed in Box 4. But this increase has been smallest for low wage, high welfare cities, with housing benefit once again being the principal difference between the groups (Figure 10).
This analysis reveals a number of things about the nature of welfare across our cities. Firstly, the size of the welfare bill in cities where spending is above average is not simply a result of increases in welfare budgets over the last 10 years – spend is above average despite these cities seeing slower population growth. The causes of high welfare spend in these cities are much more fundamental, and are likely to be due to long term structural weaknesses in their economies.
Secondly, the larger increases in benefit spend in high wage, low welfare cities is in part a result of their economic strength. Growing demand to live in these cities in order to access jobs has tended to outstrip increases in the supply of housing, pushing up rents, and in turn, spending on housing benefits. As Figure

Centre for Cities
Cities Outlook 2016 20
Maternity
Total
Tax Credits
Child benefit
Old age
JSA
ESA, IB and IS
Housing
Council Tax
Disability
Caring and bereavement
-4
-3
-2
-1
0
1
2
3
4
5
High wagelow Welfare
Low wagelow welfare
Low wagehigh welfare
Rea
l ter
ms
grow
th in
wel
fare
,20
10/1
1 to
201
4/15
(%)
6
11 shows, housing benefit payments in high wage, low welfare cities were more than 50 per cent higher than other cities. The increase in the benefit bill in recent years in these cities has occurred because of a structural problem not in their economies but in their housing markets.
Figure 10 Real terms growth in welfare, 2010/11-2014/15
Source: DWP 2015; HMRC 2015; DCLG 2015; Welsh Government 2015; Scottish Government 2015; NOMIS 2015, Population estimates, ONS 2015, Birth summary tables; National Registers of Scotland 2015, Births by sex, year and council area
Figure 11 Housing affordability and housing benefit payments
CategoryHousing affordability
ratio, 2015
Average weekly housing benefit
payment, Jun 2015
High wage, low welfare 14.5 £134
Low wage, low welfare 7.9 £81
Low wage, high welfare 6.8 £81
Source: Land Registry 2015, Price Paid Data, ONS 2015, Annual Survey of Hours and Earnings, DWP 2015; HMRC 2015; DCLG 2015; Welsh Government 2015; Scottish Government 2015
Centre for Cities
Cities Outlook 201621
What are the implications for policy?
Those cities that have higher than average wages and lower than average welfare bills have seen the strongest growth in jobs, but also in welfare, in recent years. And their stronger economies make them well placed to continue to grow in the coming years. The challenge for the government will be to limit further increases in welfare spending in these cities, which have in part been driven by a combination of high demand to live in them and an insufficient response in terms of the expansion of supply of housing.
In low wage, high welfare cities, the government faces a very different challenge. Welfare cuts alone will neither help improve wages in these cities or reduce their requirement for welfare. They can attempt to bring down welfare spending directly through the spending decisions they take – the intention is to reduce total welfare spending by £12 billion by 2020 - but ultimately, the size of the welfare bill and the performance of the economy are interlinked.
The weaker economies of these cities means that they will need a range of economic policy interventions if they are to experience sustained economic growth at the same time as cuts to welfare spending. And while the introduction of the ‘National Living Wage’ and reductions in the personal allowance4 will increase wages, they will not address the underlying reasons why wages are lower in these cities in the first place.
In responding to these challenges there are three main areas for the government to focus on in their attempt to move from a low wage, high welfare economy to a high wage, low welfare economy.
First, in cities with low wages and high welfare spending, cuts to bring down welfare must be accompanied by policies to improve the economy, particularly around skills. While much has been said about transport investment in the context of the Northern Powerhouse, much less has been said about improving school performance and adult education. But low skills will both hinder the opportunities available for people to move off welfare and into work and will hinder attempts by cities to attract investment from businesses.
4 Income exempt from income tax.

Centre for Cities
Cities Outlook 2016 22
Second, devolution would help all cities better integrate skills and employment interventions and welfare spending. Currently, spending on employment and skills programmes and benefit spending are not connected. This means that there are few financial incentives to invest in an employment and skills programme that helps to reduce welfare spend, because those responsible for investing in the former do not get to keep the savings made in the latter. This hinders the goal of getting people back into work.
Creating a link between these two areas of funding, for example through giving city regions control over both budgets and allowing them to keep some of the savings made, would be a way to address this. The devolution of health and social care budgets in Greater Manchester has been done with the aim of reducing spending by reducing duplication, better integrating services and allowing Greater Manchester to keep the savings made. The same principle holds for skills and employment and welfare spending, and the government should look to devolve these budgets to city regions too.
Finally, in high wage, low welfare cities, rising house prices will continue to increase demand for housing benefit. Short term freezes to housing benefit payments will temporarily limit increases in housing benefit spending, but they will not address the underlying cause of this increase. The simple answer is to build more houses in these cities. The government has announced its intention to build 400,000 extra affordable homes by 2020. These houses need to be built in cities where housing benefit payments are highest.
Each of these changes – improvements in education and skills levels, devolution and integration of budgets and services, and increases in housing supply within high demand cities – will take several years to deliver, and longer still for the full range of benefits to be felt. Creating a higher wage, lower welfare economy will, in all likelihood, be the work not of one Parliament, but of several.
Given the scale of the challenge facing a large number of cities, it is vital that the government acts now to lay the foundations for these changes, maintaining the momentum behind the devolution deals announced to date, and going much further in the years to come in equipping urban areas to fulfil their economic potential.
03City monitor
The latest data


Centre for Cities
2525 Cities Outlook 2016
City monitor: the latest dataThere is considerable variation in the economic performance of cities across the UK. The purpose of this chapter is to show the scale and nature of this variation by highlighting the performance of cities on 17 indicators covering:
• Population
• Business dynamics
• Productivity
• Innovation
• Employment
• Skills
• Wages
• Housing
• Environment
• Digital connectivity
For most indicators the 10 strongest and 10 weakest performing cities are presented. Tables of the full list of cities can be found on www.centreforcities.org/data-tool.

Centre for Cities
2626Cities Outlook 2016
Box 5: Defining cities
The Primary Urban Area (PUA) defines a city as the built up area that it
covers, which provides a consistent measure to compare concentrations
of economic activity across the UK. This makes PUAs distinct from city
region or combined authority geographies.
Of course, cities change throughout time. Some get larger, and some
decline, and our definitions must reflect this. The final releases of the
2011 Census have allowed us to review the cities that we look at. After
working with Newcastle University, the creators of the original PUA
definition, this year’s Outlook for the first time presents data from our
updated list of cities.
Basildon, Slough and Exeter have now been added to the list, while
Grimsby and Hastings have dropped out. Some other cities have seen a
change to their boundaries. The most noticeable is Manchester, which
has seen the former PUAs of Rochdale and Bolton merge with the
Manchester PUA.
For this reason comparisons with data in previous editions of Cities
Outlook should be undertaken with caution. You can read the full
methodological note on the PUA update at: www.centreforcities.org/
publication/the-changing-geography-of-the-uk-economy/.

Centre for Cities
2727 Cities Outlook 2016
Population
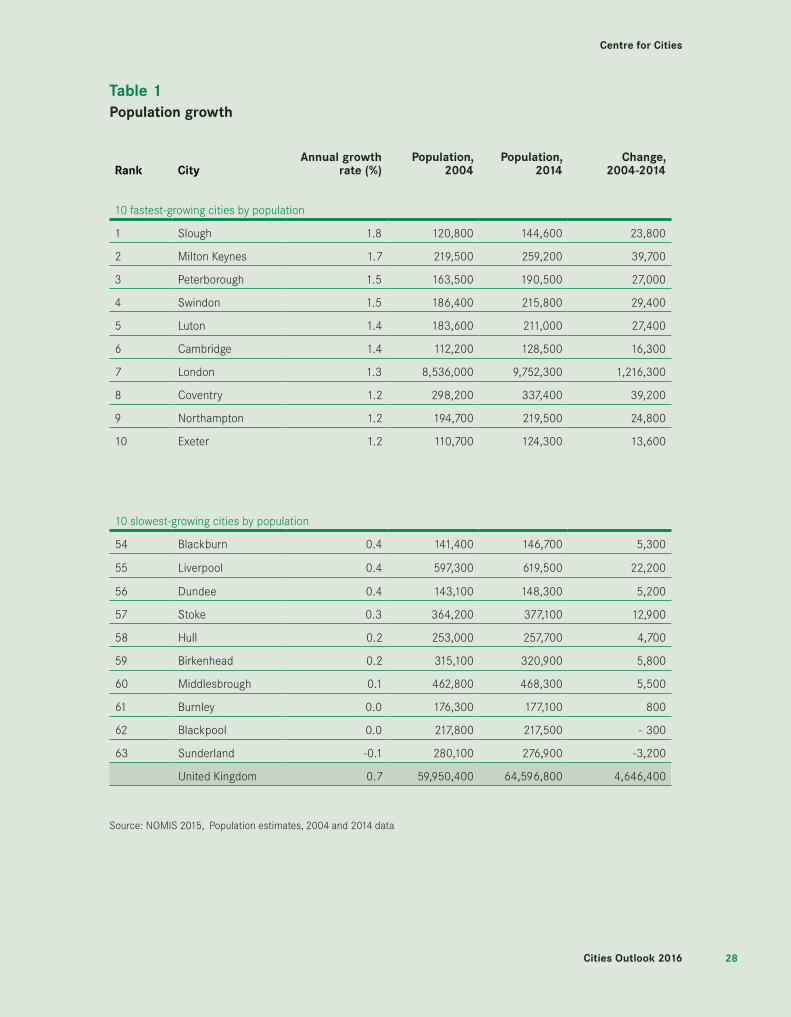
Growing populations can give an indication of the economic opportunity that is available in cities. Cities that provide more job and career opportunities are likely to retain and attract more people than cities that do not.
• In 2014, 54 per cent of the UK population (approximately 34.7 million out of 64.6 million) lived in cities.
• The four biggest cities (London, Birmingham, Manchester and Glasgow) accounted for almost a quarter of the total UK population (24 per cent) and 45 per cent of the total population in cities.
• London alone is home to 15 per cent of the UK population and accounted for 28 per cent of the population living in cities.
• 23 out of 63 cities experienced double digit growth in population over the ten years between 2004 and 2014. The UK population grew by 8 per cent over the same period.
• The fastest growing cities (Slough, Milton Keynes, Peterborough and Swindon) had growth rates more than twice the national average in the decade between 2004 and 2014.
• Only one city – Sunderland – experienced negative growth, while the population remained the same in Blackpool and Burnley.
Centre for Cities
2828Cities Outlook 2016
Table 1Population growth
Rank CityAnnual growth
rate (%)Population,
2004Population,
2014Change,
2004-2014
10 fastest-growing cities by population
1 Slough 1.8 120,800 144,600 23,800
2 Milton Keynes 1.7 219,500 259,200 39,700
3 Peterborough 1.5 163,500 190,500 27,000
4 Swindon 1.5 186,400 215,800 29,400
5 Luton 1.4 183,600 211,000 27,400
6 Cambridge 1.4 112,200 128,500 16,300
7 London 1.3 8,536,000 9,752,300 1,216,300
8 Coventry 1.2 298,200 337,400 39,200
9 Northampton 1.2 194,700 219,500 24,800
10 Exeter 1.2 110,700 124,300 13,600
10 slowest-growing cities by population
54 Blackburn 0.4 141,400 146,700 5,300
55 Liverpool 0.4 597,300 619,500 22,200
56 Dundee 0.4 143,100 148,300 5,200
57 Stoke 0.3 364,200 377,100 12,900
58 Hull 0.2 253,000 257,700 4,700
59 Birkenhead 0.2 315,100 320,900 5,800
60 Middlesbrough 0.1 462,800 468,300 5,500
61 Burnley 0.0 176,300 177,100 800
62 Blackpool 0.0 217,800 217,500 - 300
63 Sunderland -0.1 280,100 276,900 -3,200
United Kingdom 0.7 59,950,400 64,596,800 4,646,400
Source: NOMIS 2015, Population estimates, 2004 and 2014 data

Centre for Cities
2929 Cities Outlook 2016
Business Dynamics
Strong city economies depend on the dynamism of businesses and entrepreneurs. The overall number of businesses in a city and the rates at which businesses are starting up and closing down are key indicators of the health of a city’s economy.
Business starts and closures• 61 per cent of UK business start-ups in 2014 were in cities, up from 60
per cent in 2013 and 57 per cent in 2009. Meanwhile, 58 per cent of overall UK business closures were in cities.
• The number of new businesses in the UK has increased by almost 50 per cent since 2009 (from 236,000 in 2009 to over 350,000 in 2014). There were more businesses in 2014 than at any time since the data was first collected in 2000.
• For the second year in a row since the recession, the number of start-ups exceeded the number of closures in all UK cities in 2014. However, there was considerable variation in the churn rate between the bottom ranked and top ranked cities; the lowest, Belfast, was 1.2 and the highest, Northampton, was 11.7.
• London was the number one city for start-ups per 10,000 population (100.1), followed by Northampton (80.6) and Milton Keynes (75.4), whereas Hull (31.4), Sunderland (30.2) and Belfast (28.8) were the lowest ranked cities.
• London was also the city with the highest number of closures (61.1 per 10,000 population), considerably above the second ranked city Reading (48).

Centre for Cities
3030Cities Outlook 2016
Table 2Business starts and closures per 10,000 population
Rank CityBusiness start-ups per
10,000 population, 2014Business closures per
10,000 population, 2014 Churn rate*
10 cities with the highest start-up rate
1 London 100.1 61.1 7.5
2 Northampton 80.6 38.0 11.7
3 Milton Keynes 75.4 46.5 7.0
4 Reading 71.0 48.0 5.2
5 Brighton 67.2 46.5 4.8
6 Slough 64.3 46.3 5.3
7 Aldershot 58.8 41.8 4.1
8 Aberdeen 57.4 38.2 4.8
9 Edinburgh 56.1 37.9 5.2
10 Bristol 56.0 36.4 5.5
10 cities with the lowest start-up rate
54 Exeter 36.6 31.4 1.7
55 Barnsley 36.6 25.4 4.8
56 Plymouth 34.0 31.0 1.4
57 Dundee 33.7 25.3 3.9
58 Swansea 32.5 26.2 2.8
59 Stoke 32.4 26.8 2.4
60 Mansfield 32.2 25.0 3.2
61 Hull 31.4 25.2 2.8
62 Sunderland 30.2 22.4 4.0
63 Belfast 28.8 25.4 1.2
United Kingdom 54.3 38.1 4.5
Source: ONS 2015, Business Demography, 2014 data. NOMIS 2015, Population estimates, 2014 data. *Difference between business start-ups and business closures as a percentage of total business stock.

Centre for Cities
3131 Cities Outlook 2016
Business stock• Cities were home to 54 per cent of all UK businesses in 2014, up from 53
per cent in 2013 and 51 per cent in 2009.
• Northampton was the city with the fastest year on year growth in business stock (11 per cent between 2013 and 2014) followed by Doncaster (9 per cent). Over the last five years Slough has been the strongest performer, seeing growth of 29 per cent.
• London alone accounted for 22 per cent of total UK business stock, up from 19 per cent in 2009.
• The four biggest UK cities (London, Manchester, Birmingham and Glasgow) accounted for almost 30 per cent of the overall business stock in 2014. However the top 10 is dominated by medium-sized cities such as Reading and Brighton.
• Dundee (217), Plymouth (216) and Sunderland (192) had the lowest levels of business stock per 10,000 population in 2014.
• The geography of the top 10 and bottom 10 cities is stark. Seven of the top 10 cities were located in the Greater South East. Meanwhile no southern cities feature in the bottom 10.

Centre for Cities
3232Cities Outlook 2016
Table 3Business stock per 10,000 population
Rank CityBusiness stock per
10,000 population, 2014Business stock per
10,000 population, 2013Change,
2013-14 (%)
10 cities with the highest number of businesses
1 London 519 491 5.6
2 Reading 441 426 3.5
3 Brighton 431 415 3.7
4 Milton Keynes 415 390 6.2
5 Aldershot 414 405 2.4
6 Aberdeen 404 390 3.4
7 Bournemouth 372 366 1.8
8 Southend 367 357 2.8
9 Northampton 365 332 9.9
10 Basildon 364 352 3.3
10 cities with the lowest number of businesses
54 Liverpool 235 225 4.2
55 Middlesbrough 234 220 6.6
56 Barnsley 231 223 3.8
57 Newport 228 219 4.2
58 Swansea 225 220 2.4
59 Mansfield 223 218 2.4
60 Hull 218 215 1.4
61 Dundee 217 209 4.1
62 Plymouth 216 217 -0.2
63 Sunderland 192 186 3.4
United Kingdom 357 345 3.5
Source: ONS 2015, Business Demography, 2014 and 2013 data. NOMIS 2015, Population estimates, 2014 data.

Centre for Cities
3333 Cities Outlook 2016
Productivity and innovation
The creation and absorption of new ideas and innovations increase productivity, and productivity is the driver of long-run economic growth. Those economies that are better able to create and commercialise new ideas are better placed to grow in the future.
Productivity • Only 17 out of 62 cities in 2014 had levels of productivity above the
British average, with Reading, Slough and London having GVA per worker over 32 per cent above the national average of £53,700.
• Productivity increased between 2013 and 2014 in 48 out of 62 cities, with Leicester and Portsmouth recording GVA per worker growth of around 4 per cent.
• In the lowest ranked cities, York’s productivity decreased by 2.3 per cent, and Swindon’s GVA per worker was 3.3 per cent lower in 2014 than it was in 2013.

Centre for Cities
3434Cities Outlook 2016
Dundee
EdinburghGlasgow
NewcastleSunderland
Middlesbrough
Hull
York
Leeds
Swansea
Cardiff
Newport
Bristol
Gloucester
Exeter
Plymouth
Portsmouth
Aberdeen
Southampton
BournemouthBrightonWorthing
SouthendBasildon
Chatham
Crawley
London
Norwich
Ipswich
Peterborough
Aldershot
ReadingSwindon
Oxford
Milton Keynes
Northampton
Luton
Cambridge
Stoke
Telford
BirminghamCoventry
Leicester
Nottingham
Mansfield
Derby
Sheffield
DoncasterWakefield
Bradford
BirkenheadLiverpool
Wigan
Manchester
Burnley
BlackpoolPrestonBlackburn
Warrington
Barnsley
Slough
Huddersfield
61,700 - 73,400
52,400 - 61,600
48,100 - 52,300
44,600 - 48,000
40,300 - 44,500
GVA per worker, 2014
Figure 12GVA per worker, 2014
CityGVA per worker City
GVA per worker
Aberdeen 61,600 London 73,400
Aldershot 63,400 Luton 51,100
Barnsley 42,900 Manchester 47,100
Basildon 55,100 Mansfield 43,500
Birkenhead 43,500 Middlesbrough 45,100
Birmingham 45,700 Milton Keynes 63,700
Blackburn 40,300 Newcastle 43,900
Blackpool 40,400 Newport 43,900
Bournemouth 49,300 Northampton 48,200
Bradford 47,100 Norwich 47,700
Brighton 52,300 Nottingham 42,400
Bristol 53,200 Oxford 58,200
Burnley 48,500 Peterborough 50,600
Cambridge 55,900 Plymouth 47,100
Cardiff 44,400 Portsmouth 58,000
Chatham 54,200 Preston 45,300
Coventry 46,400 Reading 70,900
Crawley 57,200 Sheffield 43,700
Derby 55,200 Slough 70,900
Doncaster 42,900 Southampton 55,000
Dundee 46,600 Southend 49,100
Edinburgh 54,900 Stoke 44,300
Exeter 47,200 Sunderland 44,900
Glasgow 47,200 Swansea 41,800
Gloucester 52,100 Swindon 58,500
Huddersfield 45,200 Telford 44,500
Hull 42,300 Wakefield 44,200
Ipswich 48,500 Warrington 50,700
Leeds 48,000 Wigan 43,500
Leicester 45,900 Worthing 56,000
Liverpool 46,000 York 45,600
Great Britain 53,700

Centre for Cities
3535 Cities Outlook 2016
Table 4GVA per worker
Rank City GVA per worker, 2014 (£)
10 cities with the highest GVA per worker
1 London 73,400
2 Reading 70,900
3 Slough 70,900
4 Milton Keynes 63,700
5 Aldershot 63,400
6 Aberdeen 61,600
7 Swindon 58,500
8 Oxford 58,200
9 Portsmouth 58,000
10 Crawley 57,200
10 cities with the lowest GVA per worker
53 Mansfield 43,500
54 Wigan 43,500
55 Birkenhead 43,500
56 Doncaster 42,900
57 Barnsley 42,900
58 Nottingham 42,400
59 Hull 42,300
60 Swansea 41,800
61 Blackpool 40,400
62 Blackburn 40,300
Great Britain 53,700
Source: ONS 2015, Regional Value Added (Income Approach), 2014 data.

Centre for Cities
3636Cities Outlook 2016
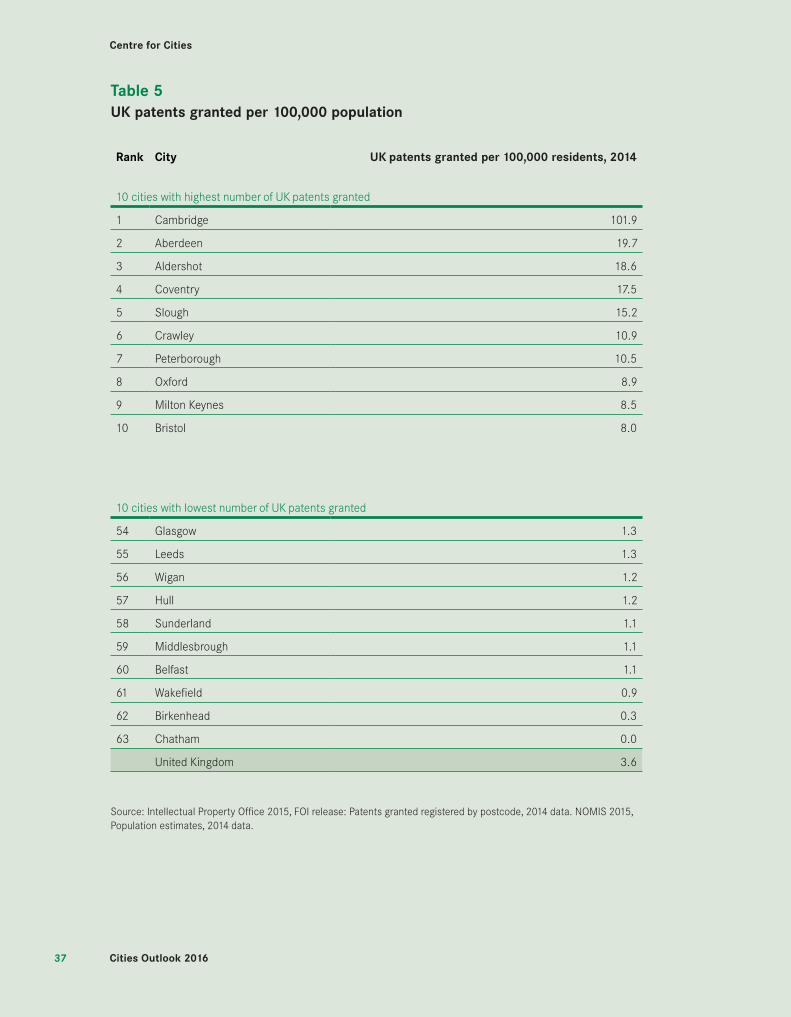
Innovation• 61 per cent of all patents granted in the UK in 2014 were registered in
cities.
• London was the city with the highest absolute number of patents in 2014 – its total of 370 represented 16 per cent of the UK total.
• Cambridge had by far the highest number of patents per 100,000 population, with almost 102. Aberdeen, the second ranked city, recorded 19.7 patents per 100,000 population in the same year.
• Small cities were the most innovative on this measure, with seven of the top 10 cities having fewer than 250,000 residents.
Box 6: Measuring Innovation
Patent data is widely used to measure innovation. There are a number of
limitations with the patent data used here:
• Data is for patents granted through the UK Intellectual Property
Office only, and so does not capture patents registered with the
European Patent Office.
• The address of the patentee does not confirm that the innovative
activity occurred at that address.
• Patents also only demonstrate more technical innovations and
exclude process innovations, trademarks and creative innovation,
much of which takes place within service sector businesses.
Despite its limitations, the data still offers some insight into where
innovation occurs across the UK and, as shown in the tables, there is a
great deal of variation across the country.
Centre for Cities
3737 Cities Outlook 2016
Table 5UK patents granted per 100,000 population
Rank City UK patents granted per 100,000 residents, 2014
10 cities with highest number of UK patents granted
1 Cambridge 101.9
2 Aberdeen 19.7
3 Aldershot 18.6
4 Coventry 17.5
5 Slough 15.2
6 Crawley 10.9
7 Peterborough 10.5
8 Oxford 8.9
9 Milton Keynes 8.5
10 Bristol 8.0
10 cities with lowest number of UK patents granted
54 Glasgow 1.3
55 Leeds 1.3
56 Wigan 1.2
57 Hull 1.2
58 Sunderland 1.1
59 Middlesbrough 1.1
60 Belfast 1.1
61 Wakefield 0.9
62 Birkenhead 0.3
63 Chatham 0.0
United Kingdom 3.6
Source: Intellectual Property Office 2015, FOI release: Patents granted registered by postcode, 2014 data. NOMIS 2015, Population estimates, 2014 data.

Centre for Cities
3838Cities Outlook 2016
Employment
High employment rates, employment growth and low unemployment point to well-functioning labour markets, with high demand for workers amongst employers. Low employment rates and high unemployment are suggestive of a combination of poor skills and weaker employer demand.
Employment rate• 43 out of 63 cities across the UK improved their employment rate in
2015, and 20 did so by two or more percentage points.
• Overall, the UK employment rate grew by 1.2 percentage points between 2014 and 2015, from 71.7 per cent to 72.9 per cent. The city average remained slightly lower than the national average, at 71 per cent.
• 32 cities had employment rates below the national average. To bring these cities up to the current UK average, 551,000 residents would need to find employment.
• Liverpool, the UK city with the lowest employment rate in 2015 (61.2 per cent), would need almost 48,600 of its residents to find employment to reach the UK average. Birmingham (the city with the highest deficit in absolute terms) would need 132,300 of its residents to find jobs to match the UK average.
• Southern cities tend to perform better than cities elsewhere. Only one of the top 10 cities was located in the North of England (Warrington, with 76.9 per cent in employment) and one in Scotland (Aberdeen, 77.3 per cent).
• Big cities tend to fare worse than the average, with Bristol being the only one of the 10 largest cities to have an employment rate above the national average.

Centre for Cities
3939 Cities Outlook 2016
Table 6Employment rate
Rank CityEmployment rate, Jul
2014-Jun 2015 (%)Employment rate, Jul
2013-Jun 2014 (%)Percentage
point change
10 cities with highest employment rate
1 Aldershot 83.4 77.9 5.6
2 Northampton 78.6 73.3 5.4
3 Cambridge 77.5 78.7 -1.2
4 Bristol 77.5 72.3 5.3
5 Aberdeen 77.3 76.1 1.2
6 Warrington 76.9 79.6 -2.7
7 Basildon 76.9 74.4 2.5
8 Southampton 76.8 74.2 2.6
9 Exeter 76.5 79.1 -2.6
10 Swindon 76.5 78.0 -1.5
10 cities with lowest employment rate
54 Burnley 67.0 61.9 5.1
55 Belfast 66.2 68.7 -2.5
56 Coventry 66.1 63.4 2.7
57 Blackburn 65.7 62.5 3.1
58 Bradford 64.9 66.0 -1.2
59 Birmingham 64.3 64.0 0.3
60 Hull 64.1 64.7 -0.6
61 Sunderland 63.9 66.1 -2.2
62 Dundee 63.8 61.4 2.4
63 Liverpool 61.2 60.9 0.2
United Kingdom 72.9 71.7 1.2
Source: NOMIS 2015, Annual Population Survey, residents analysis, July 2013 – June 2014 and July 2014 – June 2015; DETINI 2015, District Council Area Statistics for Belfast, 2013 and 2014 data.
Centre for Cities
4040Cities Outlook 2016
Unemployment• Almost two thirds (64 per cent) of out of work claimants5 lived in cities in
2015.
• 54 out of 63 UK cities experienced a reduction in the share of its claimants between 2014 and 2015.
• Interestingly, while cities such as Belfast, Bradford and Hull still had some of the highest claimant count rates, they were also the cities that experienced the largest reduction of claimants in the year from 2014 to 2015.
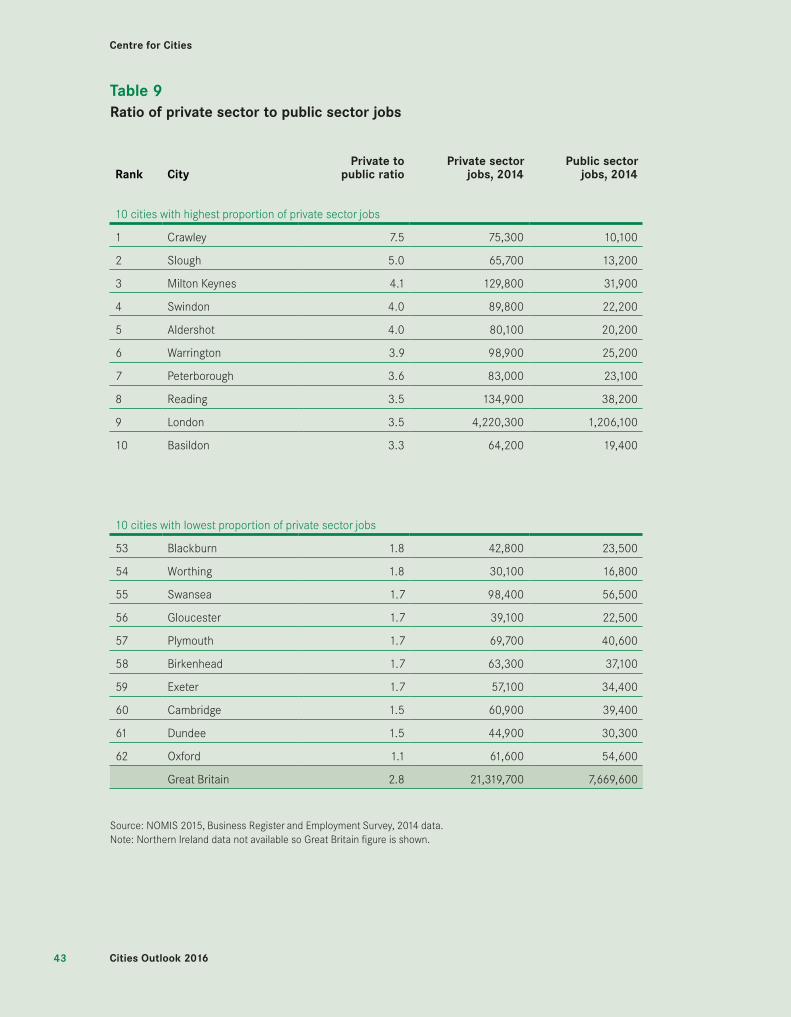
Private sector jobs growth• 57 of 62 cities increased their number of private sector jobs between
2013 and 2014, and 32 did so by more than the British average (3.4 per cent).
• Five cities saw reductions in the number of private sector jobs, and in two cities this number dropped by more than 2 per cent (Portsmouth, 2.2 per cent and Slough, 3.5 per cent).
Public and private sector jobs ratios• Out of 62 cities, only 16 had private to public sector jobs ratios above the
British average of 2.8 in 2014.
• Crawley, Slough and Milton Keynes were the top ranked cities, recording respectively 7.5, 5 and 4.1 private sector jobs for every public sector position.
• In the bottom 10 cities, Oxford had almost the same number of private and public sector employees.
5 The headline claimant count published by ONS now includes Universal Credit claimants who are out of work, as well as Jobseekers Allowance claimants.

Centre for Cities
4141 Cities Outlook 2016
Table 7Claimant count
Rank CityClaimant count
rate, Nov 2015 (%)Claimant count
rate, Nov 2014 (%)Percentage
point change
10 cities with the lowest claimant count
1 Aldershot 0.7 0.8 -0.1
2 Cambridge 0.8 0.7 0.0
3 York 0.8 0.9 -0.2
4 Oxford 0.8 0.9 -0.1
5 Exeter 0.8 0.9 -0.1
6 Reading 0.9 1.0 -0.1
7 Bournemouth 1.0 1.2 -0.2
8 Worthing 1.0 1.3 -0.3
9 Southampton 1.1 1.3 -0.2
10 Crawley 1.2 1.3 -0.1
10 cities with the highest claimant count
54 Sunderland 2.8 3.3 -0.5
55 Newport 2.8 3.6 -0.7
56 Blackburn 2.9 2.7 0.2
57 Dundee 2.9 3.4 -0.5
58 Blackpool 3.1 3.0 0.0
59 Birmingham 3.4 3.9 -0.5
60 Liverpool 3.6 3.6 0.0
61 Belfast 3.7 4.8 -1.2
62 Middlesbrough 3.7 4.0 -0.3
63 Hull 3.9 4.9 -1.0
United Kingdom 1.8 2.1 -0.3
Source: NOMIS 2015, Claimant count, November 2014 and November 2015 data; Population estimates, 2014 data. Note: data differ to NOMIS claimant count rates as latest available population estimates are used to calculate the figures above.

Centre for Cities
4242Cities Outlook 2016
Table 8Private sector jobs growth
Rank CityChange,
2013-2014 (%)Total private
sector jobs,2013Total private
sector jobs, 2014
Net job gains or
losses
10 cities with the highest net private sector jobs growth
1 Oxford 12.7 54,600 61,600 6,900
2 Worthing 9.2 27,600 30,100 2,500
3 Cambridge 8.8 56,000 60,900 4,900
4 Luton 8.4 62,900 68,200 5,300
5 Bristol 8.3 271,900 294,500 22,600
6 Mansfield 7.5 59,000 63,400 4,400
7 Aberdeen 6.9 137,200 146,600 9,400
8 Burnley 6.3 46,600 49,500 3,000
9 Barnsley 5.9 52,600 55,700 3,100
10 Ipswich 5.9 45,800 48,500 2,700
10 cities with the lowest net private sector jobs growth
53 Stoke 0.8 110,800 111,700 900
54 Leicester 0.5 156,700 157,400 700
55 Newport 0.4 70,700 71,000 300
56 Crawley 0.3 75,100 75,300 200
57 Bradford 0.0 130,400 130,500 100
58 Brighton -0.2 105,000 104,800 -200
59 Gloucester -0.4 39,300 39,100 -200
60 Preston -1.4 123,300 121,500 -1,700
61 Portsmouth -2.2 153,300 150,000 -3,300
62 Slough -3.5 68,100 65,700 -2,400
Great Britain 3.4 20,615,500 21,319,700 704,200
Source: NOMIS 2015, Business Register and Employment Survey, 2013 and 2014 data. Note: Northern Ireland data not available so Great Britain figure is shown.
Centre for Cities
4343 Cities Outlook 2016
Table 9 Ratio of private sector to public sector jobs
Rank CityPrivate to
public ratioPrivate sector
jobs, 2014Public sector
jobs, 2014
10 cities with highest proportion of private sector jobs
1 Crawley 7.5 75,300 10,100
2 Slough 5.0 65,700 13,200
3 Milton Keynes 4.1 129,800 31,900
4 Swindon 4.0 89,800 22,200
5 Aldershot 4.0 80,100 20,200
6 Warrington 3.9 98,900 25,200
7 Peterborough 3.6 83,000 23,100
8 Reading 3.5 134,900 38,200
9 London 3.5 4,220,300 1,206,100
10 Basildon 3.3 64,200 19,400
10 cities with lowest proportion of private sector jobs
53 Blackburn 1.8 42,800 23,500
54 Worthing 1.8 30,100 16,800
55 Swansea 1.7 98,400 56,500
56 Gloucester 1.7 39,100 22,500
57 Plymouth 1.7 69,700 40,600
58 Birkenhead 1.7 63,300 37,100
59 Exeter 1.7 57,100 34,400
60 Cambridge 1.5 60,900 39,400
61 Dundee 1.5 44,900 30,300
62 Oxford 1.1 61,600 54,600
Great Britain 2.8 21,319,700 7,669,600
Source: NOMIS 2015, Business Register and Employment Survey, 2014 data. Note: Northern Ireland data not available so Great Britain figure is shown.

Centre for Cities
4444Cities Outlook 2016
Skills
Skills levels are a key component of the success of a city economy. Those cities that have a high proportion of graduates tend to have stronger economies than those that have a large number of people with no formal qualifications.
High level qualifications• While cities were home to 55 per cent of the UK working age population
in 2014, they were home to 57 per cent of those with a degree or equivalent qualification.
• Only 16 cities out of 63 had shares of working age population with high level qualifications above the national average.
• The UK’s highly skilled population is concentrated in a few cities. The top 10 cities combined accounted for almost 30 per cent of the total UK highly skilled population (and 22 per cent of the working age population), whereas the bottom 10 only accounted for 2.4 per cent of the population with high level qualifications (and 3.8 per cent of the working age population).
• North-South disparities in the distribution of the high skilled population are stark. Six of the top 10 cities are located in the South, while only one southern city (Southend) is in the bottom 10.
• Scottish cities perform relatively well when compared with the rest of the UK. Edinburgh, Aberdeen and Glasgow rank in the top 10 and Dundee in 14th position.
No formal qualifications• Cities are home to 55 per cent of the UK working age population, but
almost 59 per cent of the population with no formal qualifications.
• 27 of the 63 cities had shares of population with no formal qualification below the national average in 2014.
• Most of the best performing UK cities were small or medium sized, while three of the UK’s biggest cities, Glasgow, Birmingham and Liverpool, had some of the highest shares of residents with no formal qualifications.
• Some cities have very polarised skills profiles: Glasgow had the 9th highest share of working age population with high level qualifications (43.6 per cent), but also had one of the highest shares of population with no formal qualifications (12.6 per cent). Similarly, Belfast was 15th in UK for highly skilled population (36.6 per cent), but had the second highest share of population with no formal qualifications (16.7 per cent).

Centre for Cities
4545 Cities Outlook 2016
Table 10Residents with high-level qualifications
Rank CityPercentage working age population with
NVQ4 & above, 2014 (%)
10 cities with the highest percentage of high level qualifications
1 Cambridge 61.4
2 Oxford 60.3
3 Edinburgh 56.3
4 London 48.1
5 Reading 47.5
6 Aberdeen 46.7
7 Brighton 46.5
8 Cardiff 46.0
9 Glasgow 43.6
10 Bristol 42.4
10 cities with the lowest percentage of high level qualifications
54 Burnley 23.6
55 Mansfield 23.5
56 Blackburn 23.5
57 Stoke 23.5
58 Sunderland 23.2
59 Southend 22.9
60 Crawley 22.7
61 Barnsley 22.6
62 Hull 21.1
63 Wakefield 20.7
United Kingdom 35.8
Source: NOMIS 2015, Annual Population Survey, residents analysis, 2014 data; DETINI 2015, District Council Area Statistics for Belfast, 2014 data.

Centre for Cities
4646Cities Outlook 2016
Table 11Residents with no formal qualifications
Rank CityPercentage working age population
with no formal qualifications, 2014 (%)
10 cities with the lowest percentage of no formal qualifications
1 Exeter 1.9
2 Brighton 3.3
3 Aldershot 4.1
4 Reading 4.5
5 Oxford 4.5
6 Crawley 4.7
7 Edinburgh 4.8
8 Plymouth 4.9
9 York 4.9
10 Southampton 5.0
10 cities with the highest percentage of no formal qualifications
54 Luton 12.2
55 Glasgow 12.6
56 Bradford 13.5
57 Dundee 14.3
58 Blackburn 14.6
59 Coventry 14.8
60 Birmingham 15.5
61 Liverpool 15.9
62 Belfast 16.7
63 Stoke 16.9
United Kingdom 9.0
Source: NOMIS 2015, Annual Population Survey, residents analysis, 2014 data; DETINI 2015, District Council Area Statistics for Belfast, 2014 data.

Centre for Cities
4747 Cities Outlook 2016
Wages
Wages reflect the types of jobs available in cities. Those cities that have higher wages typically have a greater number of high skilled jobs than those that have lower wages.
Wage growth• In 2015, the average weekly workplace wage in cities was equal to £545,
compared to the UK average of £508.
• Workers in only 17 of 63 cities earned more than the UK average in 2015. Most of these cities were located in the Greater South East (10 of 17).
• Real weekly workplace earnings were higher in 43 out of 63 cities in 2015 than they were in the previous year. For 14 of these growth exceeded £20 per week in real terms.
• Nine of the 10 cities with the fastest real earnings growth were located in the South of England, with Basildon experiencing the largest increase of £40.
• 20 cities saw their weekly salaries decrease in real terms between 2014 and 2015, with Stoke recording the worst performance (-£56 per week), considerably worse than the second worst city Northampton (-£16).
• In absolute terms, London retained first position for highest weekly earnings, averaging £675 (£2 less than the previous year), followed by Crawley (£641) and Slough (£636). Huddersfield had the lowest weekly wage, £399 per week (up by £2 from the previous year).

Centre for Cities
4848Cities Outlook 2016
Table 12Average workplace wages
Rank City
Wages, 2015 (av £ per week,
2015 prices)
Wages, 2015 (av £ per week,
2014 prices)
Wages, 2014 (av £ per week,
2014 prices)
Real wages growth, 2014-
2015 (£ per week)
10 cities with the highest weekly workplace wages
1 London 675 675 677 -2
2 Crawley 641 641 614 27
3 Slough 636 636 602 34
4 Reading 619 619 589 30
5 Aberdeen 617 617 624 -7
6 Derby 588 588 594 -6
7 Aldershot 587 587 597 -10
8 Cambridge 586 586 547 39
9 Oxford 585 585 556 29
10 Milton Keynes 577 577 577 -1
10 cities with the lowest weekly workplace wages
53 Swansea 440 440 439 1
54 Doncaster 434 434 438 -4
55 Norwich 433 433 422 11
56 Birkenhead 430 430 422 7
57 Stoke 429 429 485 -56
58 Wigan 418 418 400 19
59 Mansfield 418 418 431 -14
60 Burnley 416 416 429 -13
61 Southend 403 403 403 0
62 Huddersfield 399 399 397 2
United Kingdom 508 508 502 7
Source: ONS 2015, Annual Survey of Hours and Earnings (ASHE), average gross weekly workplace-based earnings, 2015 data; DETINI 2015, Annual Survey of Hours and Earnings (ASHE), average gross weekly workplace-based earnings, 2015 data. Own calculations for PUA-level weighted by number of jobs, CPI inflation adjusted (2005=100). Earnings data is for employees only, whereas the rest of the tables use employment data. Note: ASHE statistics are based on a sample survey, so the statistical significance of the results should be treated with caution. CPI inflation between 2014Q2 and 2015Q2 was equal to 0, so 2015 earnings do not change if expressed in 2014 or 2015 prices.
Centre for Cities
4949 Cities Outlook 2016
Housing
Housing stocks and prices together provide useful insights into cities’ housing markets, highlighting both supply and demand measures and their impact on house affordability.
Housing stock growth• Cities accounted for 52.5 per cent of the total UK dwelling stock in 2014.
• The UK’s dwelling stock increased by 0.6 per cent between 2013 and 2014.
• In 24 cities housing stock growth exceeded the UK average, with Cambridge topping the list and recording more than 2.6 per cent growth (more than twice the second placed city, Telford, with 1.2 per cent).
• Only one city (Dundee) did not increase its dwelling stock between 2013 and 2014.
House prices• 16 out of 63 cities saw average house prices decrease between 2014 and
2015.
• 27 cities experienced housing price growth above the British average of 3.4 per cent, with Luton (10.8 per cent), Slough (11.2 per cent) and Cambridge (12.5 per cent) seeing the largest increases.
• Apart from Swindon, all of the top 10 cities with the largest house price increases were located in the Greater South East.
• House prices in London in 2015 were more than twice the British average (£530,000 compared to £260,400). Cambridge and Oxford were second and third with £469,600 and £453,500, far above the next city, Reading, with £343,500.
• At the opposite end of the ranking, Burnley had the lowest average house prices in 2015, with £99,600 (down by £6,000 from the previous year).
• 21 of the 27 cities that experienced house price growth above the British average were in South East, South West and East of England regions. All of the cities that saw a fall in house prices, with the exception of Peterborough, were in the Midlands or North of England.

Centre for Cities
5050Cities Outlook 2016
Table 13Housing stock growth
Rank CityChange, 2013-
2014 (%)Housing
stock, 2013Housing
stock, 2014Change,
2013-2014
10 cities with the highest housing stock growth
1 Cambridge 2.6 49,100 50,400 1,300
2 Telford 1.2 70,040 70,880 800
3 Milton Keynes 1.2 104,890 106,130 1,200
4 Peterborough 1.1 78,270 79,140 900
5 Exeter 1.1 51,560 52,110 600
6 Northampton 0.9 92,420 93,260 800
7 Gloucester 0.9 53,740 54,220 500
8 Edinburgh 0.8 237,520 239,530 2,000
9 Coventry 0.8 134,780 135,870 1,100
10 Bristol 0.8 302,790 305,180 2,400
10 cities with the lowest housing stock growth
54 Burnley 0.3 79,380 79,600 200
55 Portsmouth 0.2 227,470 228,020 600
56 Luton 0.2 76,730 76,910 200
57 Birkenhead 0.2 145,970 146,270 300
58 Hull 0.2 117,110 117,350 200
59 Basildon 0.2 75,330 75,450 100
60 Blackpool 0.2 107,060 107,230 200
61 Oxford 0.1 57,690 57,760 100
62 York 0.1 86,860 86,930 100
63 Dundee 0.0 73,560 73,580 -
United Kingdom 0.6 27,919,000 28,079,300 160,300
Source: Department of Communities and Local Government (DCLG), 2015, Dwelling stock estimates by local authority district 2013 and 2014 data. Scottish Neighbourhood Statistics 2015, Dwelling stock estimates 2013 and 2014 data. Northern Ireland Neighbourhood information service 2015, Land and Property Services, 2013 and 2014 data.

Centre for Cities
5151 Cities Outlook 2016
Table 14 House price growth
Rank City
Annual growth, 2014-
2015 (%)
Average house price,
2014 (£)
Average house price,
2015 (£)
Difference in average prices,
2014-2015 (£)
10 cities with the highest rises in house prices
1 Cambridge 12.5 417,400 469,600 52,300
2 Slough 11.2 238,900 265,800 26,800
3 Luton 10.8 177,200 196,300 19,100
4 Aldershot 9.4 302,700 331,300 28,600
5 Reading 9.4 314,100 343,500 29,500
6 Crawley 8.9 240,100 261,500 21,400
7 Worthing 7.9 243,100 262,300 19,100
8 Southend 7.7 242,200 260,800 18,600
9 Milton Keynes 7.6 233,900 251,600 17,700
10 Swindon 7.2 180,900 193,900 12,900
10 cities with the lowest rises in house prices
53 Wakefield -1.7 144,500 142,000 -2,501
54 Newport -2.0 154,400 151,400 -3,022
55 Telford -2.0 161,400 158,200 -3,238
56 Blackpool -2.0 148,000 145,000 -3,034
57 Middlesbrough -3.1 142,900 138,400 -4,474
58 Sunderland -3.8 130,500 125,500 -5,012
59 Swansea -3.9 142,900 137,300 -5,562
60 Hull -4.0 106,900 102,600 -4,282
61 Barnsley -4.1 126,900 121,700 -5,182
62 Burnley -5.7 105,600 99,600 -6,055
Great Britain 3.4 251,700 260,400 8,600
Source: Land Registry 2015, Market Trend Data, Price Paid, 2014 and 2015 data. Scottish neighbourhood statistics 2015, Mean House prices, 2014 and 2015 data. Note: 2015 prices in Scotland are an average of the first three quarters of the year. 2015 house prices in England and Wales are an average of the period January to November.
Centre for Cities
5252Cities Outlook 2016
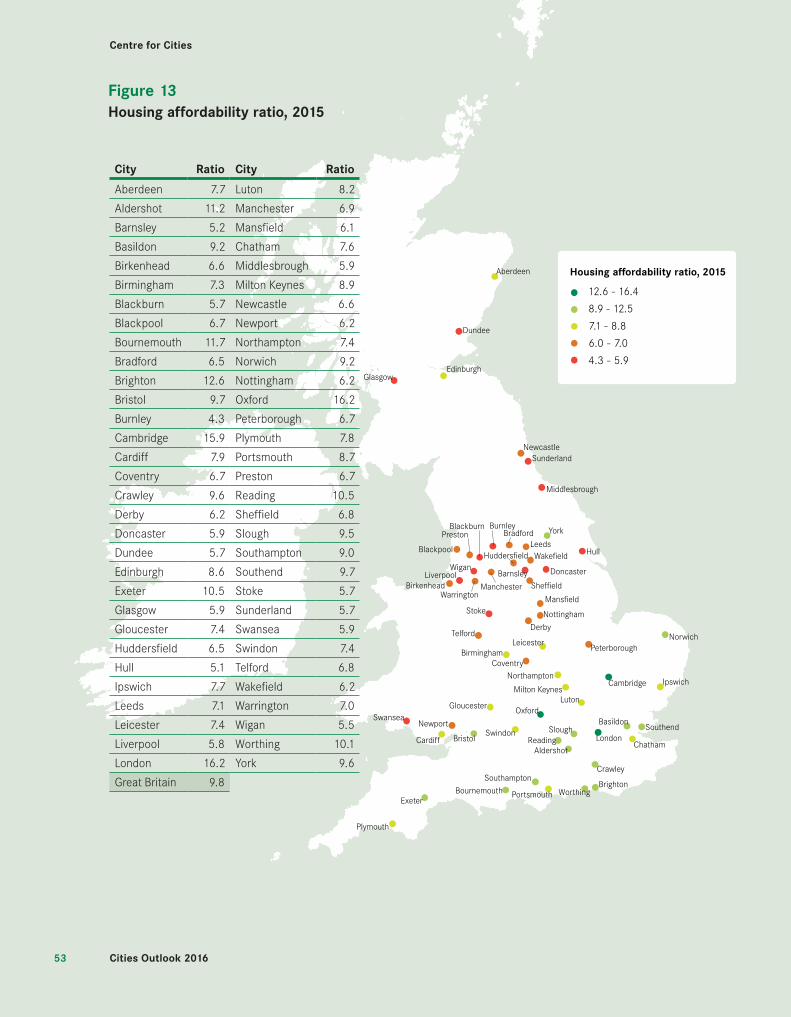
Housing affordability• In 2015, the average house price in Britain was 9.8 times the average
annual salary.
• Nine out of 62 cities were less affordable than the British average, with Oxford, London and Cambridge being the least affordable cities.
• In Oxford, the least affordable city, house prices were 16.2 times annual salaries. In Burnley, the most affordable city, this figure was 4.3.
• Annual earnings show much less variation across the UK than house prices do. In 2015, an average house in London (the most expensive) was 5.3 times more expensive than the average house in Burnley (the least expensive), while residents’ annual salaries in Reading (the highest) were only 1.6 times annual salaries in Hull (the lowest).
• All the top 10 least affordable cities are located in the South of England, whereas many of the most affordable locations are in the North of England.
Centre for Cities
5353 Cities Outlook 2016
Dundee
EdinburghGlasgow
NewcastleSunderland
Middlesbrough
Hull
York
Leeds
Swansea
Cardiff
Newport
Bristol
Gloucester
Exeter
Plymouth
Portsmouth
Aberdeen
Southampton
BournemouthBrighton
Worthing
SouthendBasildon
Chatham
Crawley
London
Norwich
Ipswich
Peterborough
AldershotReading
Swindon
Oxford
Milton Keynes
Northampton
Luton
Cambridge
Stoke
Telford
BirminghamCoventry
Leicester
Nottingham
Mansfield
Derby
Sheffield
Doncaster
Wakefield
Bradford
BirkenheadLiverpool
Wigan
Manchester
Burnley
Blackpool
PrestonBlackburn
Warrington
Barnsley
Slough
Huddersfield
12.6 - 16.4
8.9 - 12.5
7.1 - 8.8
6.0 - 7.0
4.3 - 5.9
Housing affordability ratio, 2015
Figure 13Housing affordability ratio, 2015
City Ratio City Ratio
Aberdeen 7.7 Luton 8.2
Aldershot 11.2 Manchester 6.9
Barnsley 5.2 Mansfield 6.1
Basildon 9.2 Chatham 7.6
Birkenhead 6.6 Middlesbrough 5.9
Birmingham 7.3 Milton Keynes 8.9
Blackburn 5.7 Newcastle 6.6
Blackpool 6.7 Newport 6.2
Bournemouth 11.7 Northampton 7.4
Bradford 6.5 Norwich 9.2
Brighton 12.6 Nottingham 6.2
Bristol 9.7 Oxford 16.2
Burnley 4.3 Peterborough 6.7
Cambridge 15.9 Plymouth 7.8
Cardiff 7.9 Portsmouth 8.7
Coventry 6.7 Preston 6.7
Crawley 9.6 Reading 10.5
Derby 6.2 Sheffield 6.8
Doncaster 5.9 Slough 9.5
Dundee 5.7 Southampton 9.0
Edinburgh 8.6 Southend 9.7
Exeter 10.5 Stoke 5.7
Glasgow 5.9 Sunderland 5.7
Gloucester 7.4 Swansea 5.9
Huddersfield 6.5 Swindon 7.4
Hull 5.1 Telford 6.8
Ipswich 7.7 Wakefield 6.2
Leeds 7.1 Warrington 7.0
Leicester 7.4 Wigan 5.5
Liverpool 5.8 Worthing 10.1
London 16.2 York 9.6
Great Britain 9.8
Centre for Cities
5454Cities Outlook 2016
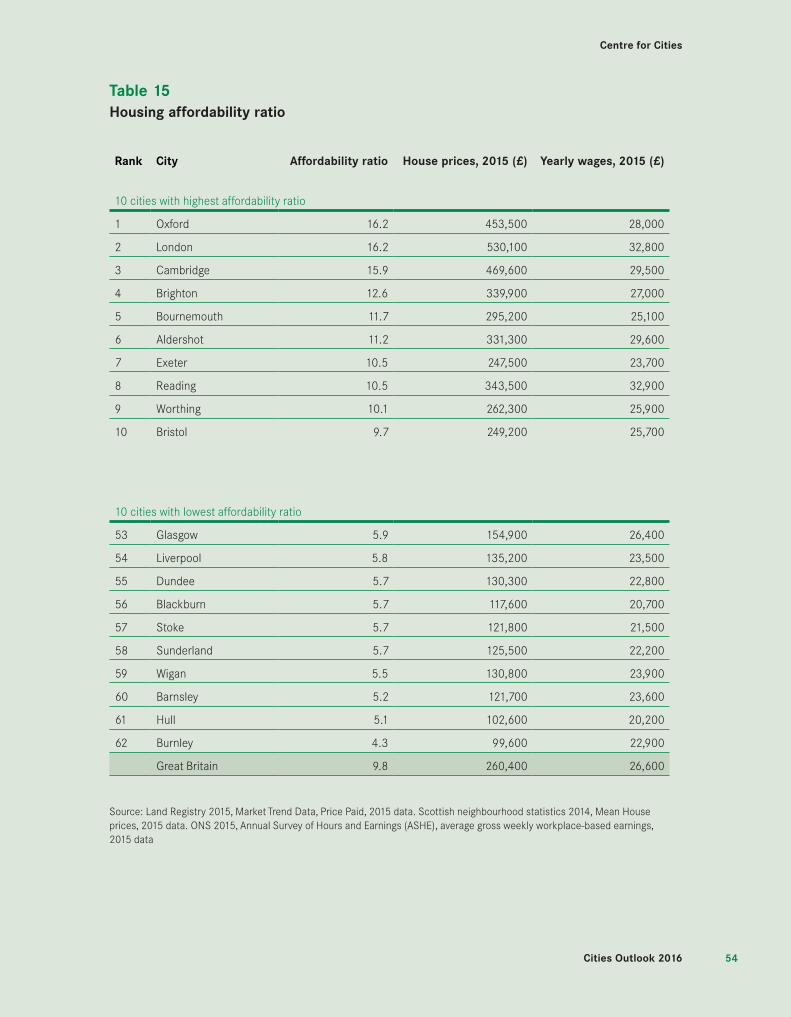
Table 15Housing affordability ratio
Rank City Affordability ratio House prices, 2015 (£) Yearly wages, 2015 (£)
10 cities with highest affordability ratio
1 Oxford 16.2 453,500 28,000
2 London 16.2 530,100 32,800
3 Cambridge 15.9 469,600 29,500
4 Brighton 12.6 339,900 27,000
5 Bournemouth 11.7 295,200 25,100
6 Aldershot 11.2 331,300 29,600
7 Exeter 10.5 247,500 23,700
8 Reading 10.5 343,500 32,900
9 Worthing 10.1 262,300 25,900
10 Bristol 9.7 249,200 25,700
10 cities with lowest affordability ratio
53 Glasgow 5.9 154,900 26,400
54 Liverpool 5.8 135,200 23,500
55 Dundee 5.7 130,300 22,800
56 Blackburn 5.7 117,600 20,700
57 Stoke 5.7 121,800 21,500
58 Sunderland 5.7 125,500 22,200
59 Wigan 5.5 130,800 23,900
60 Barnsley 5.2 121,700 23,600
61 Hull 5.1 102,600 20,200
62 Burnley 4.3 99,600 22,900
Great Britain 9.8 260,400 26,600
Source: Land Registry 2015, Market Trend Data, Price Paid, 2015 data. Scottish neighbourhood statistics 2014, Mean House prices, 2015 data. ONS 2015, Annual Survey of Hours and Earnings (ASHE), average gross weekly workplace-based earnings, 2015 data

Centre for Cities
5555 Cities Outlook 2016
Environment
Accounting for over 80 per cent of total greenhouse gas emissions, CO2 emissions are one way to gauge how ‘green’ a city is and the size of its carbon footprint.
• In 2013, cities accounted for 54 per cent of the UK population but only 47 per cent of the UK’s total CO2 emissions.
• Average UK emissions per capita in 2013 totalled 7 tonnes (slightly down from 7.1 tonnes in 2012), but the city average was lower at 6.1 tonnes. All but five cities reduced their emission level in the year between 2012 and 2013.
• Swansea and Middlesbrough are significant outliers. They were two of only seven cities to emit more CO2 than the national average.
• Big cities are significant emitters, but they are very efficient when emissions are considered on a per capita basis. London for example accounted for 11 per cent of total UK emissions in 2013, but was 16th out of 63 cities for per capita emissions with only 5.1 tonnes emitted for every resident (down from 5.3 tonnes in the previous year).

Centre for Cities
5656Cities Outlook 2016
Table 16Total CO2 emissions per capita
Rank CityTotal CO2 emissions per capita, 2013 (t)
Total CO2 emissions per capita, 2012 (t)
10 cities with the lowest emissions per capita
1 Chatham 4.2 4.4
2 Ipswich 4.2 4.3
3 Luton 4.2 4.4
4 Southend 4.2 4.4
5 Brighton 4.3 4.5
6 Worthing 4.3 4.5
7 Plymouth 4.7 4.9
8 Southampton 4.8 5.1
9 Portsmouth 4.8 5.0
10 Birkenhead 4.8 4.9
10 cities with the highest emissions per capita
54 Milton Keynes 6.8 7.0
55 Aberdeen 6.8 7.2
56 Preston 6.9 7.1
57 Barnsley 7.0 6.9
58 Wakefield 7.2 7.4
59 Doncaster 7.7 7.9
60 Warrington 7.9 8.1
61 Newport 8.3 8.1
62 Swansea 26.7 19.4
63 Middlesbrough 29.2 26.1
United Kingdom 7.0 7.1
Source: Department of Energy and Climate Change (DECC) 2015, CO2 emissions per capita, 2013 data. NOMIS 2015, Population Estimates, 2012 and 2013 data.

Centre for Cities
5757 Cities Outlook 2016
Digital Connectivity
Broadband connection is now a key component of the infrastructure offer that a city can make to businesses and entrepreneurs.
• In 2015 the percentage of fixed line connections reaching super-fast speeds across UK cities was 76 per cent, higher than the UK average of 63 per cent.
• In 58 out of 62 cities the proportion of postcodes achieving super-fast speed exceeded the UK average.
• Six of the top 10 cities were located in the Greater South East region, whereas eight of the bottom 10 cities were in the North West of England (Warrington, Burnley and Blackburn) and Yorkshire (Bradford, Sheffield, Doncaster, Huddersfield and Barnsley).
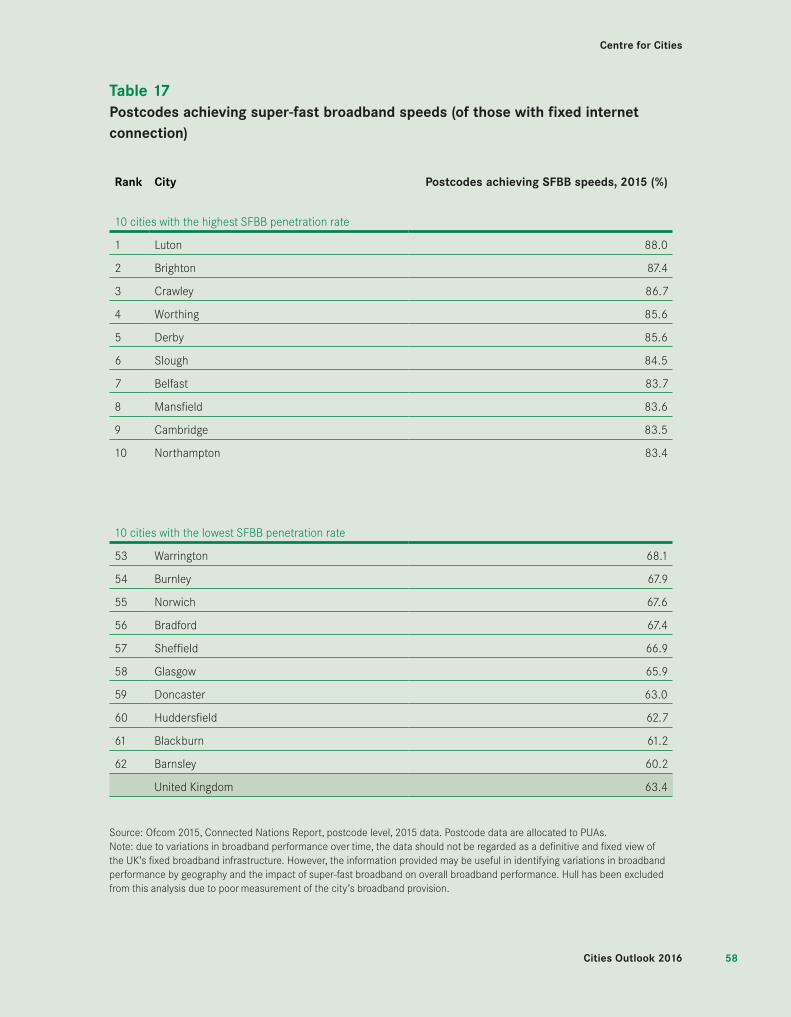
Centre for Cities
5858Cities Outlook 2016
Table 17Postcodes achieving super-fast broadband speeds (of those with fixed internet connection)
Rank City Postcodes achieving SFBB speeds, 2015 (%)
10 cities with the highest SFBB penetration rate
1 Luton 88.0
2 Brighton 87.4
3 Crawley 86.7
4 Worthing 85.6
5 Derby 85.6
6 Slough 84.5
7 Belfast 83.7
8 Mansfield 83.6
9 Cambridge 83.5
10 Northampton 83.4
10 cities with the lowest SFBB penetration rate
53 Warrington 68.1
54 Burnley 67.9
55 Norwich 67.6
56 Bradford 67.4
57 Sheffield 66.9
58 Glasgow 65.9
59 Doncaster 63.0
60 Huddersfield 62.7
61 Blackburn 61.2
62 Barnsley 60.2
United Kingdom 63.4
Source: Ofcom 2015, Connected Nations Report, postcode level, 2015 data. Postcode data are allocated to PUAs. Note: due to variations in broadband performance over time, the data should not be regarded as a definitive and fixed view of the UK’s fixed broadband infrastructure. However, the information provided may be useful in identifying variations in broadband performance by geography and the impact of super-fast broadband on overall broadband performance. Hull has been excluded from this analysis due to poor measurement of the city’s broadband provision.

January 2016
Centre for Cities Second Floor 9 Holyrood Street London SE1 2EL
020 7803 4300 [email protected] www.centreforcities.org
© Centre for Cities 2016
Centre for Cities is a registered charity (No 1119841) and a company limited by guarantee registered in England (No 6215397)