Citi Private Bank Office of Innovation Unstoppable trends ...
16
Citi Private Bank Office of Innovation Unstoppable trends: Examining the future of energy
Transcript of Citi Private Bank Office of Innovation Unstoppable trends ...
Citi Private Bank Office of Innovation
Unstoppable trends: Examining the future of energy
Citi Private Bank | Unstoppable trends: Examining the future of energy | 1
INVESTMENT PRODUCTS: NOT FDIC INSURED • NOT CDIC INSURED • NOT GOVERNMENT INSURED • NO BANK GUARANTEE • MAY LOSE VALUE
Contents
Foreword: Shifting sands in the energy sphere By Philip Watson 02
The new energy revolution 06
Energy storage will likely be a winner 12
Competition for EVs comes from gasoline vehicles not hydrogen 16
Conclusion: Approaching horizon favors investing in unstoppable
trends By Viswanathan Venugopala
18
Credits 22
About Citi Private Bank’s Office of Innovation 23

Citi Private Bank | Unstoppable trends: Examining the future of energy | 32 | Citi Private Bank | Unstoppable trends: Examining the future of energy
The world’s energy mix is currently undergoing profound
changes. Incremental electrification of the developing
world, proliferation of electric vehicles (EVs) in major
markets, rising climate change awareness and the general
public mood in favor of reducing reliance on fossil fuels
have been very visible for the past few years.
As this palpable drive was gaining traction, the outbreak
of the COVID-19 global pandemic towards the end of the
first quarter of 2020 also caused sudden shifts in crude oil
demand on an unprecedented scale. Before the pandemic
hit, global oil demand hovered around 100 million barrels
per day (bpd) levels and annual demand growth forecasts
were in the region of 1.1 to 1.3 million bpd.
However, when the COVID-19 outbreak was declared a
global pandemic, negative oil and gas market sentiment
went up several notches as restrictions to halt the spread
of the virus brought curbs on human mobility.
With whole economies in lockdown at various points in
2020; people driving and flying a lot less; and human
consumption patterns seeing abnormal shifts – oil prices
and demand projections took a knock. Market conjecture
in the immediate aftermath of the declaration of the
pandemic suggested around a fifth of global crude oil
demand or 20 million bpd might be wiped out in 2020.
Admittedly, this has not turned out to be the case.
The International Energy Agency (IEA) estimated the
demand slump in 2020 to be around 8.8 million bpd,
with global consumption of under 92 million bpd, largely
underpinned by petrochemicals and a gradual recovery1 of
human mobility. But what has also clearly emerged is the
unstoppable march towards a low carbon economy largely
predicated on energy generated from renewable sources.
Core OECD (or ‘Organisation for Economic Co-operation and
Development’) markets have made direct overtures towards
reducing their reliance on fossil fuels, that too in a climate of
near-term global oil demand destruction.
However, when it comes to a more holistic energy transition
and peak demand for fossil fuels, there is no market
unanimity on when we might get there.
1 International Energy Agency, Oil Market Report, December 2020 https://www.iea.org/reports/oil-market-report-december-2020
Foreword: Shifting sands in the energy sphere
Citi Private Bank | Unstoppable trends: Examining the future of energy | 54 | Citi Private Bank | Unstoppable trends: Examining the future of energy
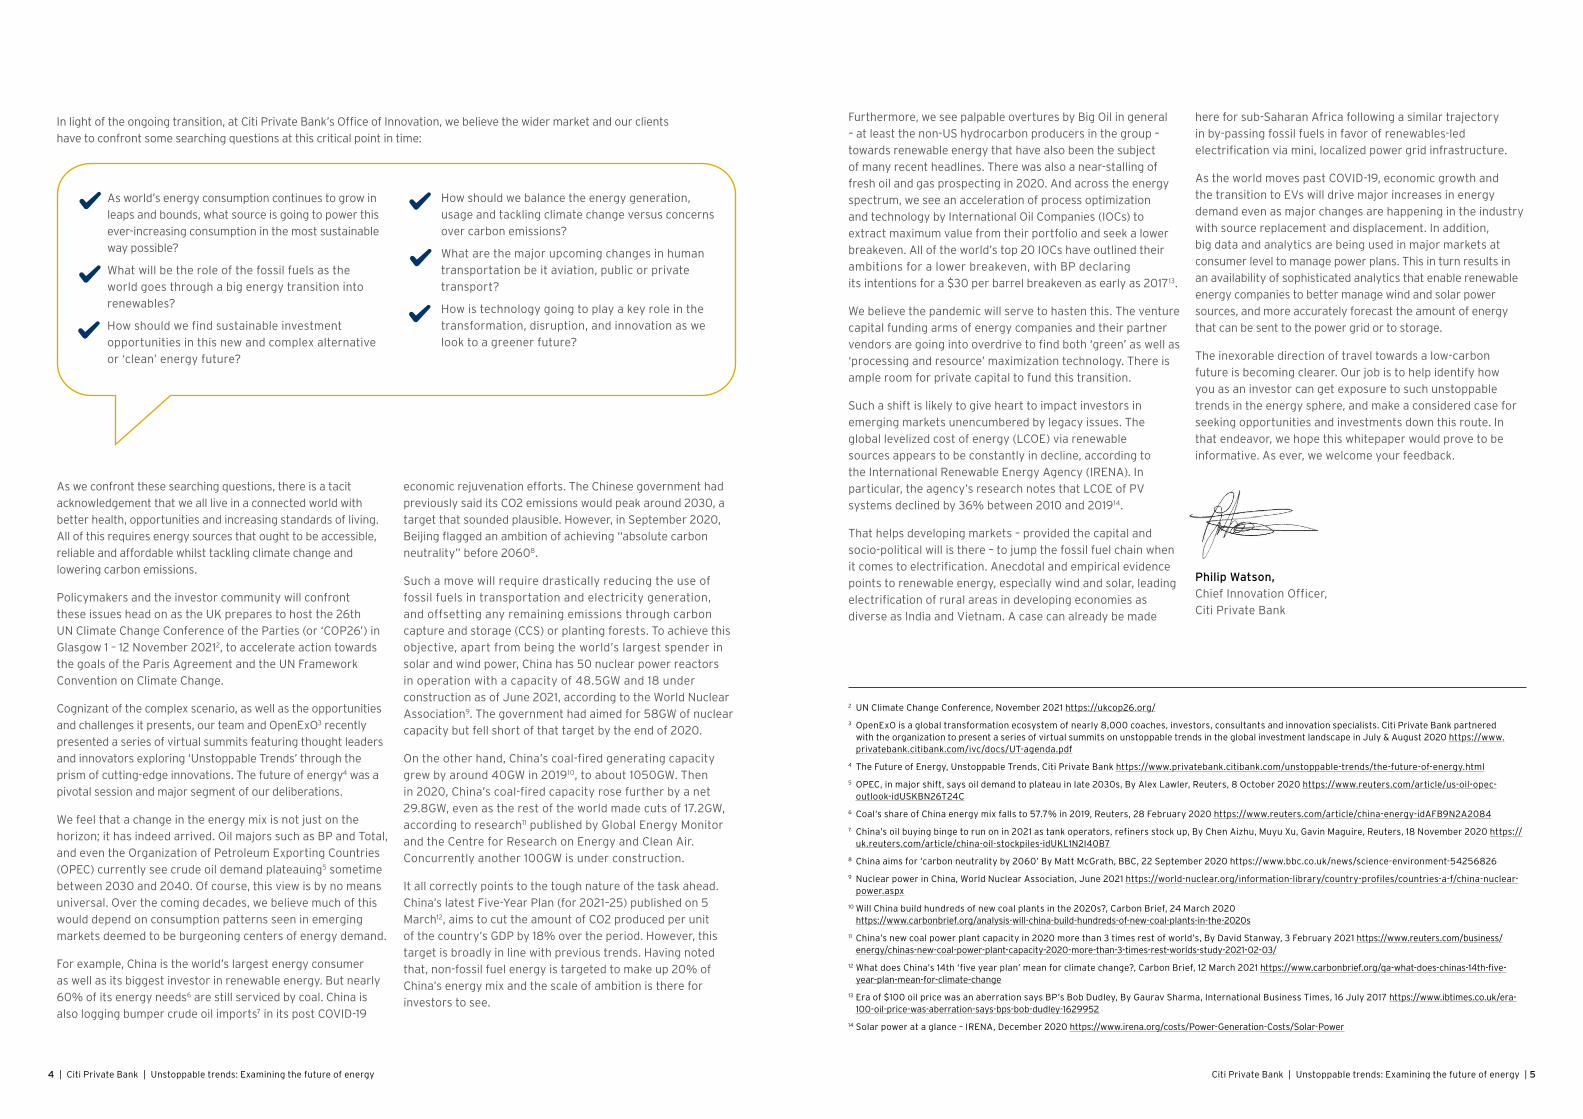
As world’s energy consumption continues to grow in
leaps and bounds, what source is going to power this
ever-increasing consumption in the most sustainable
way possible?
What will be the role of the fossil fuels as the
world goes through a big energy transition into
renewables?
How should we find sustainable investment
opportunities in this new and complex alternative
or ‘clean’ energy future?
How should we balance the energy generation,
usage and tackling climate change versus concerns
over carbon emissions?
What are the major upcoming changes in human
transportation be it aviation, public or private
transport?
How is technology going to play a key role in the
transformation, disruption, and innovation as we
look to a greener future?
economic rejuvenation efforts. The Chinese government had
previously said its CO2 emissions would peak around 2030, a
target that sounded plausible. However, in September 2020,
Beijing flagged an ambition of achieving “absolute carbon
neutrality” before 20608.
Such a move will require drastically reducing the use of
fossil fuels in transportation and electricity generation,
and offsetting any remaining emissions through carbon
capture and storage (CCS) or planting forests. To achieve this
objective, apart from being the world’s largest spender in
solar and wind power, China has 50 nuclear power reactors
in operation with a capacity of 48.5GW and 18 under
construction as of June 2021, according to the World Nuclear
Association9. The government had aimed for 58GW of nuclear
capacity but fell short of that target by the end of 2020.
On the other hand, China’s coal-fired generating capacity
grew by around 40GW in 201910, to about 1050GW. Then
in 2020, China’s coal-fired capacity rose further by a net
29.8GW, even as the rest of the world made cuts of 17.2GW,
according to research11 published by Global Energy Monitor
and the Centre for Research on Energy and Clean Air.
Concurrently another 100GW is under construction.
It all correctly points to the tough nature of the task ahead.
China’s latest Five-Year Plan (for 2021–25) published on 5
March12, aims to cut the amount of CO2 produced per unit
of the country’s GDP by 18% over the period. However, this
target is broadly in line with previous trends. Having noted
that, non-fossil fuel energy is targeted to make up 20% of
China’s energy mix and the scale of ambition is there for
investors to see.
In light of the ongoing transition, at Citi Private Bank’s Office of Innovation, we believe the wider market and our clients
have to confront some searching questions at this critical point in time:
Furthermore, we see palpable overtures by Big Oil in general
– at least the non-US hydrocarbon producers in the group –
towards renewable energy that have also been the subject
of many recent headlines. There was also a near-stalling of
fresh oil and gas prospecting in 2020. And across the energy
spectrum, we see an acceleration of process optimization
and technology by International Oil Companies (IOCs) to
extract maximum value from their portfolio and seek a lower
breakeven. All of the world’s top 20 IOCs have outlined their
ambitions for a lower breakeven, with BP declaring
its intentions for a $30 per barrel breakeven as early as 201713.
We believe the pandemic will serve to hasten this. The venture
capital funding arms of energy companies and their partner
vendors are going into overdrive to find both ‘green’ as well as
‘processing and resource’ maximization technology. There is
ample room for private capital to fund this transition.
Such a shift is likely to give heart to impact investors in
emerging markets unencumbered by legacy issues. The
global levelized cost of energy (LCOE) via renewable
sources appears to be constantly in decline, according to
the International Renewable Energy Agency (IRENA). In
particular, the agency’s research notes that LCOE of PV
systems declined by 36% between 2010 and 201914.
That helps developing markets – provided the capital and
socio-political will is there – to jump the fossil fuel chain when
it comes to electrification. Anecdotal and empirical evidence
points to renewable energy, especially wind and solar, leading
electrification of rural areas in developing economies as
diverse as India and Vietnam. A case can already be made
here for sub-Saharan Africa following a similar trajectory
in by-passing fossil fuels in favor of renewables-led
electrification via mini, localized power grid infrastructure.
As the world moves past COVID-19, economic growth and
the transition to EVs will drive major increases in energy
demand even as major changes are happening in the industry
with source replacement and displacement. In addition,
big data and analytics are being used in major markets at
consumer level to manage power plans. This in turn results in
an availability of sophisticated analytics that enable renewable
energy companies to better manage wind and solar power
sources, and more accurately forecast the amount of energy
that can be sent to the power grid or to storage.
The inexorable direction of travel towards a low-carbon
future is becoming clearer. Our job is to help identify how
you as an investor can get exposure to such unstoppable
trends in the energy sphere, and make a considered case for
seeking opportunities and investments down this route. In
that endeavor, we hope this whitepaper would prove to be
informative. As ever, we welcome your feedback.
Philip Watson,
Chief Innovation Officer,
Citi Private Bank
2 UN Climate Change Conference, November 2021 https://ukcop26.org/
3 OpenExO is a global transformation ecosystem of nearly 8,000 coaches, investors, consultants and innovation specialists. Citi Private Bank partnered with the organization to present a series of virtual summits on unstoppable trends in the global investment landscape in July & August 2020 https://www.privatebank.citibank.com/ivc/docs/UT-agenda.pdf
4 The Future of Energy, Unstoppable Trends, Citi Private Bank https://www.privatebank.citibank.com/unstoppable-trends/the-future-of-energy.html
5 OPEC, in major shift, says oil demand to plateau in late 2030s, By Alex Lawler, Reuters, 8 October 2020 https://www.reuters.com/article/us-oil-opec-outlook-idUSKBN26T24C
6 Coal’s share of China energy mix falls to 57.7% in 2019, Reuters, 28 February 2020 https://www.reuters.com/article/china-energy-idAFB9N2A2084
7 China’s oil buying binge to run on in 2021 as tank operators, refiners stock up, By Chen Aizhu, Muyu Xu, Gavin Maguire, Reuters, 18 November 2020 https://uk.reuters.com/article/china-oil-stockpiles-idUKL1N2I40B7
8 China aims for ‘carbon neutrality by 2060’ By Matt McGrath, BBC, 22 September 2020 https://www.bbc.co.uk/news/science-environment-54256826
9 Nuclear power in China, World Nuclear Association, June 2021 https://world-nuclear.org/information-library/country-profiles/countries-a-f/china-nuclear-power.aspx
10 Will China build hundreds of new coal plants in the 2020s?, Carbon Brief, 24 March 2020 https://www.carbonbrief.org/analysis-will-china-build-hundreds-of-new-coal-plants-in-the-2020s
11 China’s new coal power plant capacity in 2020 more than 3 times rest of world’s, By David Stanway, 3 February 2021 https://www.reuters.com/business/energy/chinas-new-coal-power-plant-capacity-2020-more-than-3-times-rest-worlds-study-2021-02-03/
12 What does China’s 14th ‘five year plan’ mean for climate change?, Carbon Brief, 12 March 2021 https://www.carbonbrief.org/qa-what-does-chinas-14th-five-year-plan-mean-for-climate-change
13 Era of $100 oil price was an aberration says BP’s Bob Dudley, By Gaurav Sharma, International Business Times, 16 July 2017 https://www.ibtimes.co.uk/era-100-oil-price-was-aberration-says-bps-bob-dudley-1629952
14 Solar power at a glance – IRENA, December 2020 https://www.irena.org/costs/Power-Generation-Costs/Solar-Power
As we confront these searching questions, there is a tacit
acknowledgement that we all live in a connected world with
better health, opportunities and increasing standards of living.
All of this requires energy sources that ought to be accessible,
reliable and affordable whilst tackling climate change and
lowering carbon emissions.
Policymakers and the investor community will confront
these issues head on as the UK prepares to host the 26th
UN Climate Change Conference of the Parties (or ‘COP26’) in
Glasgow 1 – 12 November 20212, to accelerate action towards
the goals of the Paris Agreement and the UN Framework
Convention on Climate Change.
Cognizant of the complex scenario, as well as the opportunities
and challenges it presents, our team and OpenExO3 recently
presented a series of virtual summits featuring thought leaders
and innovators exploring ‘Unstoppable Trends’ through the
prism of cutting-edge innovations. The future of energy4 was a
pivotal session and major segment of our deliberations.
We feel that a change in the energy mix is not just on the
horizon; it has indeed arrived. Oil majors such as BP and Total,
and even the Organization of Petroleum Exporting Countries
(OPEC) currently see crude oil demand plateauing5 sometime
between 2030 and 2040. Of course, this view is by no means
universal. Over the coming decades, we believe much of this
would depend on consumption patterns seen in emerging
markets deemed to be burgeoning centers of energy demand.
For example, China is the world’s largest energy consumer
as well as its biggest investor in renewable energy. But nearly
60% of its energy needs6 are still serviced by coal. China is
also logging bumper crude oil imports7 in its post COVID-19
https://world-nuclear.org/information-library/country-profiles/countries-a-f/china-nuclear-power.asp

Citi Private Bank | Unstoppable trends: Examining the future of energy | 76 | Citi Private Bank | Unstoppable trends: Examining the future of energy
The new energy revolution
In Outlook 202115, Citi Private Bank called the new energy
revolution an unstoppable trend. Market forces – rather than
government mandates alone – are now powering the switch
from fossil fuels to renewables. The investment case for
renewables has become even more compelling as the world
attempts to shake-off the COVID-19 downturn.
As previously noted in this paper, a historic global pandemic
with unprecedented economic lockdowns sweeping across
the world has in fact aided in the reimagining and rebuilding
of how the world powers itself. For nearly a hundred years,
economic growth and fossil fuel consumption have been
inextricably linked. But that bridge has been broken and we
will attempt to demonstrate how the current wave of new
energy solutions could soon swamp the fossil fuel sector.
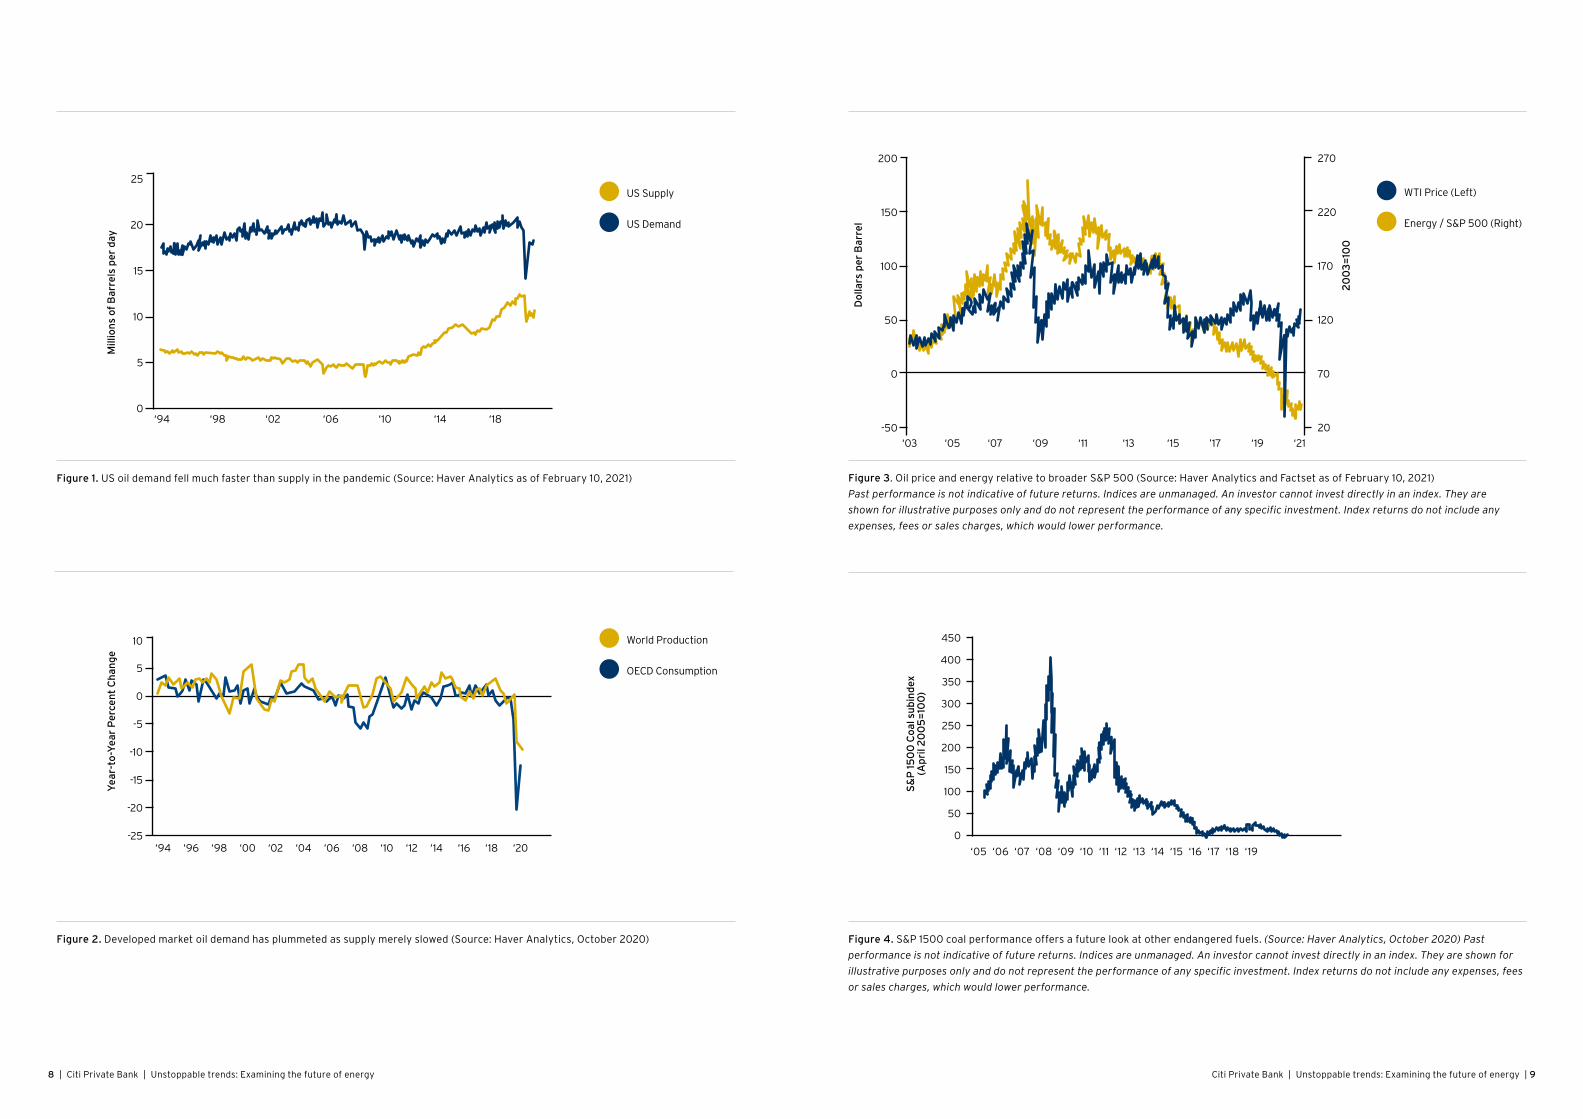
The COVID-19 pandemic which no one could have dreamed up
in late 2019 drastically cut US and global oil demand as well
as production in 2020 (see Figures 1 & 2). The OECD countries
saw 7% aggregated drop in oil demand year-on-year for the
first half of 2020 before a sluggish recovery began to take
shape. The initial shock was so large that it briefly sent oil
prices on to a negative turf (see Figure 3), driving a dramatic
underperformance of the traditional energy sector in the US
and Global markets.
And while we often see value in beaten down sectors, for
those who are not looking at a very short run price bounce,
we would note that in markets just like in physics not
everything that goes down comes up (see Figure 4). The
now decades-long underperformance of the coal sector
offers a case in point. For every $100 invested in the coal
sector back in April 2005, would now be worth just $8.40
even accounting for dividends, a shocking -92% total return
(as derived from figure 4).
15 ‘Citi Private Bank Outlook 2021 https://www.privatebank.citibank.com/outlook.html
Citi Private Bank | Unstoppable trends: Examining the future of energy | 98 | Citi Private Bank | Unstoppable trends: Examining the future of energy
Figure 1. US oil demand fell much faster than supply in the pandemic (Source: Haver Analytics as of February 10, 2021)
US Supply
US Demand
Figure 2. Developed market oil demand has plummeted as supply merely slowed (Source: Haver Analytics, October 2020)
‘94 ‘96 ‘98 ‘00 ‘02 ‘04 ‘06 ‘08 ‘10 ‘12 ‘14 ‘16 ‘18 ‘20
10
5
0
-5
-10
-15
-20
-25
Yea
r-to
-Yea
r P
erce
nt
Ch
ang
e
World Production
OECD Consumption
‘94 ‘98 ‘02 ‘06 ‘10 ‘14 ‘18
25
20
15
10
5
0
Mill
ion
s of
Bar
rels
per
day
Figure 3. Oil price and energy relative to broader S&P 500 (Source: Haver Analytics and Factset as of February 10, 2021)
Past performance is not indicative of future returns. Indices are unmanaged. An investor cannot invest directly in an index. They are
shown for illustrative purposes only and do not represent the performance of any specific investment. Index returns do not include any
expenses, fees or sales charges, which would lower performance.
‘03 ‘05 ‘07 ‘09 ‘11 ‘13 ‘15 ’17 ‘19 ‘21
200
150
100
50
0
-50
Do
llars
per
Bar
rel
WTI Price (Left)
Energy / S&P 500 (Right)
Figure 4. S&P 1500 coal performance offers a future look at other endangered fuels. (Source: Haver Analytics, October 2020) Past
performance is not indicative of future returns. Indices are unmanaged. An investor cannot invest directly in an index. They are shown for
illustrative purposes only and do not represent the performance of any specific investment. Index returns do not include any expenses, fees
or sales charges, which would lower performance.
‘05 ‘06 ‘07 ‘08 ‘09 ‘10 ‘11 ‘12 ‘13 ‘14 ‘15 ‘16 ‘17 ‘18 ‘19
450
400
350
300
250
200
150
100
50
0
S&
P 1
50
0 C
oal
su
bin
dex
(Ap
ril 2
00
5=
100
)
270
220
170
120
70
20
20
03
=10
0
Citi Private Bank | Unstoppable trends: Examining the future of energy | 1110 | Citi Private Bank | Unstoppable trends: Examining the future of energy
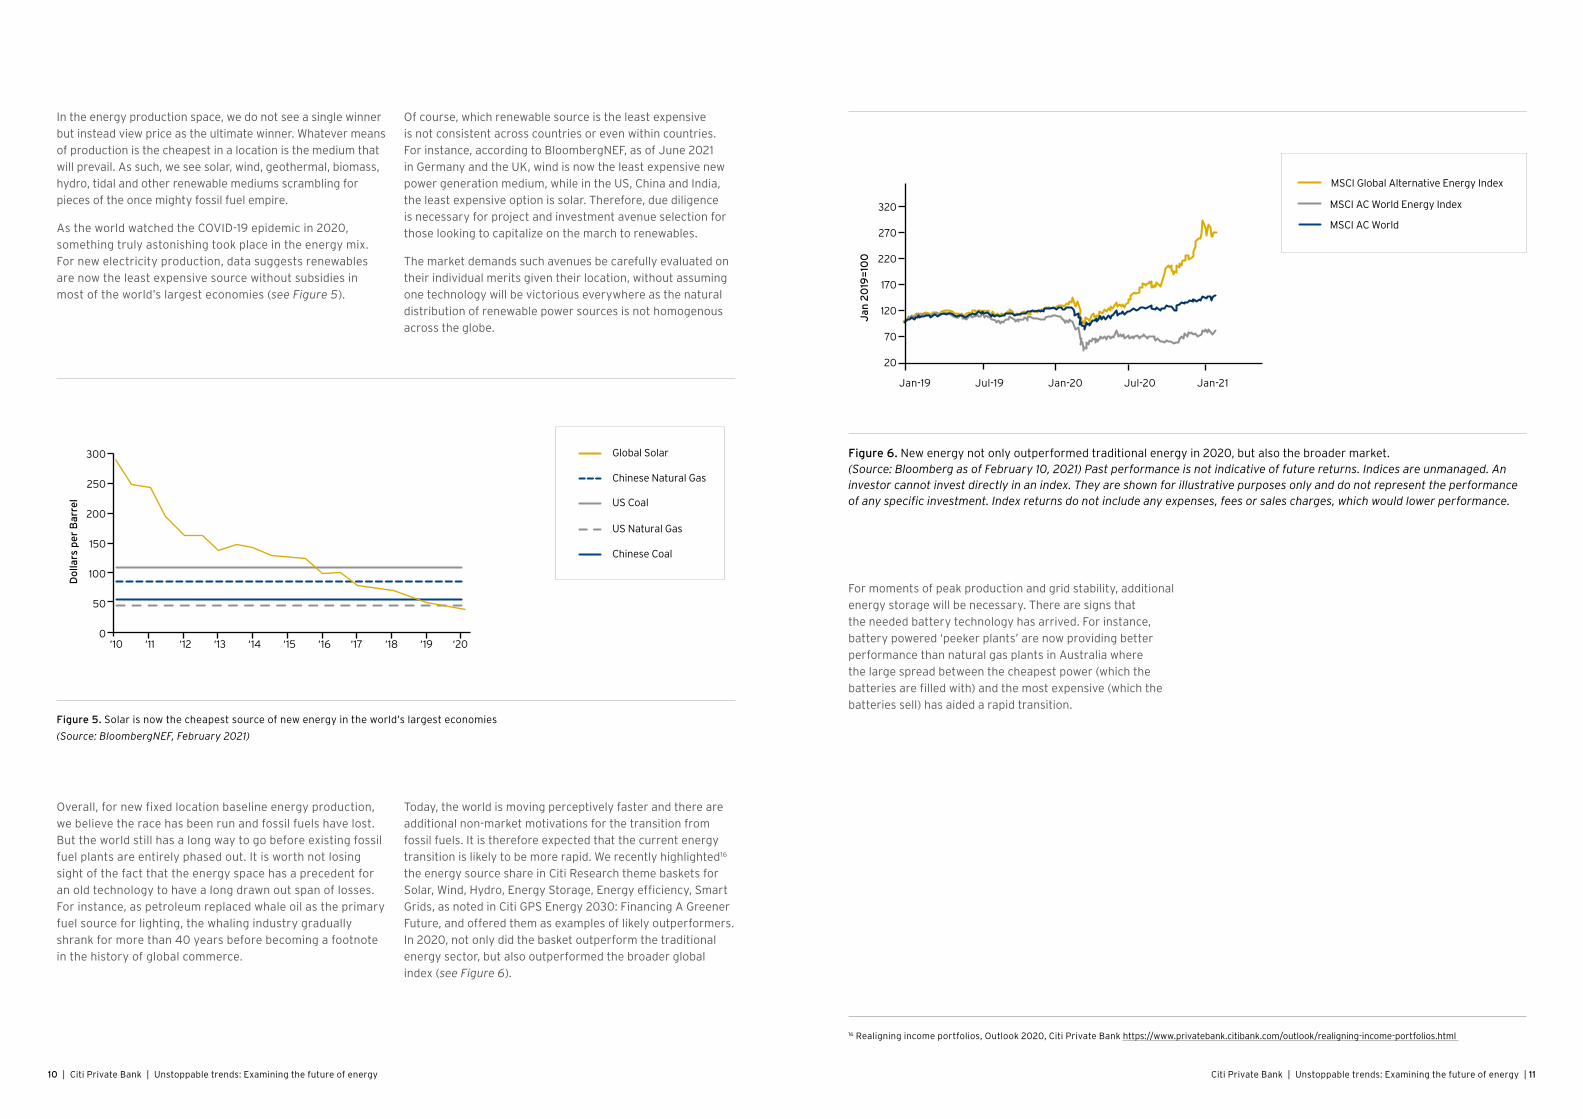
Figure 5. Solar is now the cheapest source of new energy in the world’s largest economies
(Source: BloombergNEF, February 2021)
‘10 ‘11 ‘12 ‘13 ‘14 ‘15 ‘16 ‘17 ‘18 ‘19 ‘20
300
250
200
150
100
50
0
Do
llars
per
Bar
rel
Global Solar
Chinese Natural Gas
US Coal
US Natural Gas
Chinese Coal
In the energy production space, we do not see a single winner
but instead view price as the ultimate winner. Whatever means
of production is the cheapest in a location is the medium that
will prevail. As such, we see solar, wind, geothermal, biomass,
hydro, tidal and other renewable mediums scrambling for
pieces of the once mighty fossil fuel empire.
As the world watched the COVID-19 epidemic in 2020,
something truly astonishing took place in the energy mix.
For new electricity production, data suggests renewables
are now the least expensive source without subsidies in
most of the world’s largest economies (see Figure 5).
Of course, which renewable source is the least expensive
is not consistent across countries or even within countries.
For instance, according to BloombergNEF, as of June 2021
in Germany and the UK, wind is now the least expensive new
power generation medium, while in the US, China and India,
the least expensive option is solar. Therefore, due diligence
is necessary for project and investment avenue selection for
those looking to capitalize on the march to renewables.
The market demands such avenues be carefully evaluated on
their individual merits given their location, without assuming
one technology will be victorious everywhere as the natural
distribution of renewable power sources is not homogenous
across the globe.
Overall, for new fixed location baseline energy production,
we believe the race has been run and fossil fuels have lost.
But the world still has a long way to go before existing fossil
fuel plants are entirely phased out. It is worth not losing
sight of the fact that the energy space has a precedent for
an old technology to have a long drawn out span of losses.
For instance, as petroleum replaced whale oil as the primary
fuel source for lighting, the whaling industry gradually
shrank for more than 40 years before becoming a footnote
in the history of global commerce.
Today, the world is moving perceptively faster and there are
additional non-market motivations for the transition from
fossil fuels. It is therefore expected that the current energy
transition is likely to be more rapid. We recently highlighted16
the energy source share in Citi Research theme baskets for
Solar, Wind, Hydro, Energy Storage, Energy efficiency, Smart
Grids, as noted in Citi GPS Energy 2030: Financing A Greener
Future, and offered them as examples of likely outperformers.
In 2020, not only did the basket outperform the traditional
energy sector, but also outperformed the broader global
index (see Figure 6).
Figure 6. New energy not only outperformed traditional energy in 2020, but also the broader market. (Source: Bloomberg as of February 10, 2021) Past performance is not indicative of future returns. Indices are unmanaged. An investor cannot invest directly in an index. They are shown for illustrative purposes only and do not represent the performance of any specific investment. Index returns do not include any expenses, fees or sales charges, which would lower performance.
Jan-19 Jul-19 Jan-20 Jul-20 Jan-21
320
270
220
170
120
70
20
Jan
20
19=
100
MSCI AC World Energy Index
MSCI AC World
MSCI Global Alternative Energy Index
For moments of peak production and grid stability, additional
energy storage will be necessary. There are signs that
the needed battery technology has arrived. For instance,
battery powered ‘peeker plants’ are now providing better
performance than natural gas plants in Australia where
the large spread between the cheapest power (which the
batteries are filled with) and the most expensive (which the
batteries sell) has aided a rapid transition.
16 Realigning income portfolios, Outlook 2020, Citi Private Bank https://www.privatebank.citibank.com/outlook/realigning-income-portfolios.html
Citi Private Bank | Unstoppable trends: Examining the future of energy | 1312 | Citi Private Bank | Unstoppable trends: Examining the future of energy
Energy generation will be a patchwork, storage will likely be the winner
As discussed throughout this paper, renewables appear to
be winning the race for new fixed electric power generation.
But by far the largest use of crude oil products globally is
in transportation not fixed power generation. Typically, the
power needed to drive a personal car is now cheaper from
the grid in many locations than the equivalent power from
gasoline, but getting that power into the right location and
storing it in the vehicle remain the primary challenges.
There are many potential solutions to this problem, but
two of the furthest along that actually have vehicles for
sale in this day and age, with accompanying infrastructural
networks, are hydrogen and batteries. As such, it is
important for investors to not just find assets with a green
label but work with trusted partners to pick technologies
that will set the standard and not fall by the wayside. In
our view the market has already spoken, and the battery
solution is the clear winner.
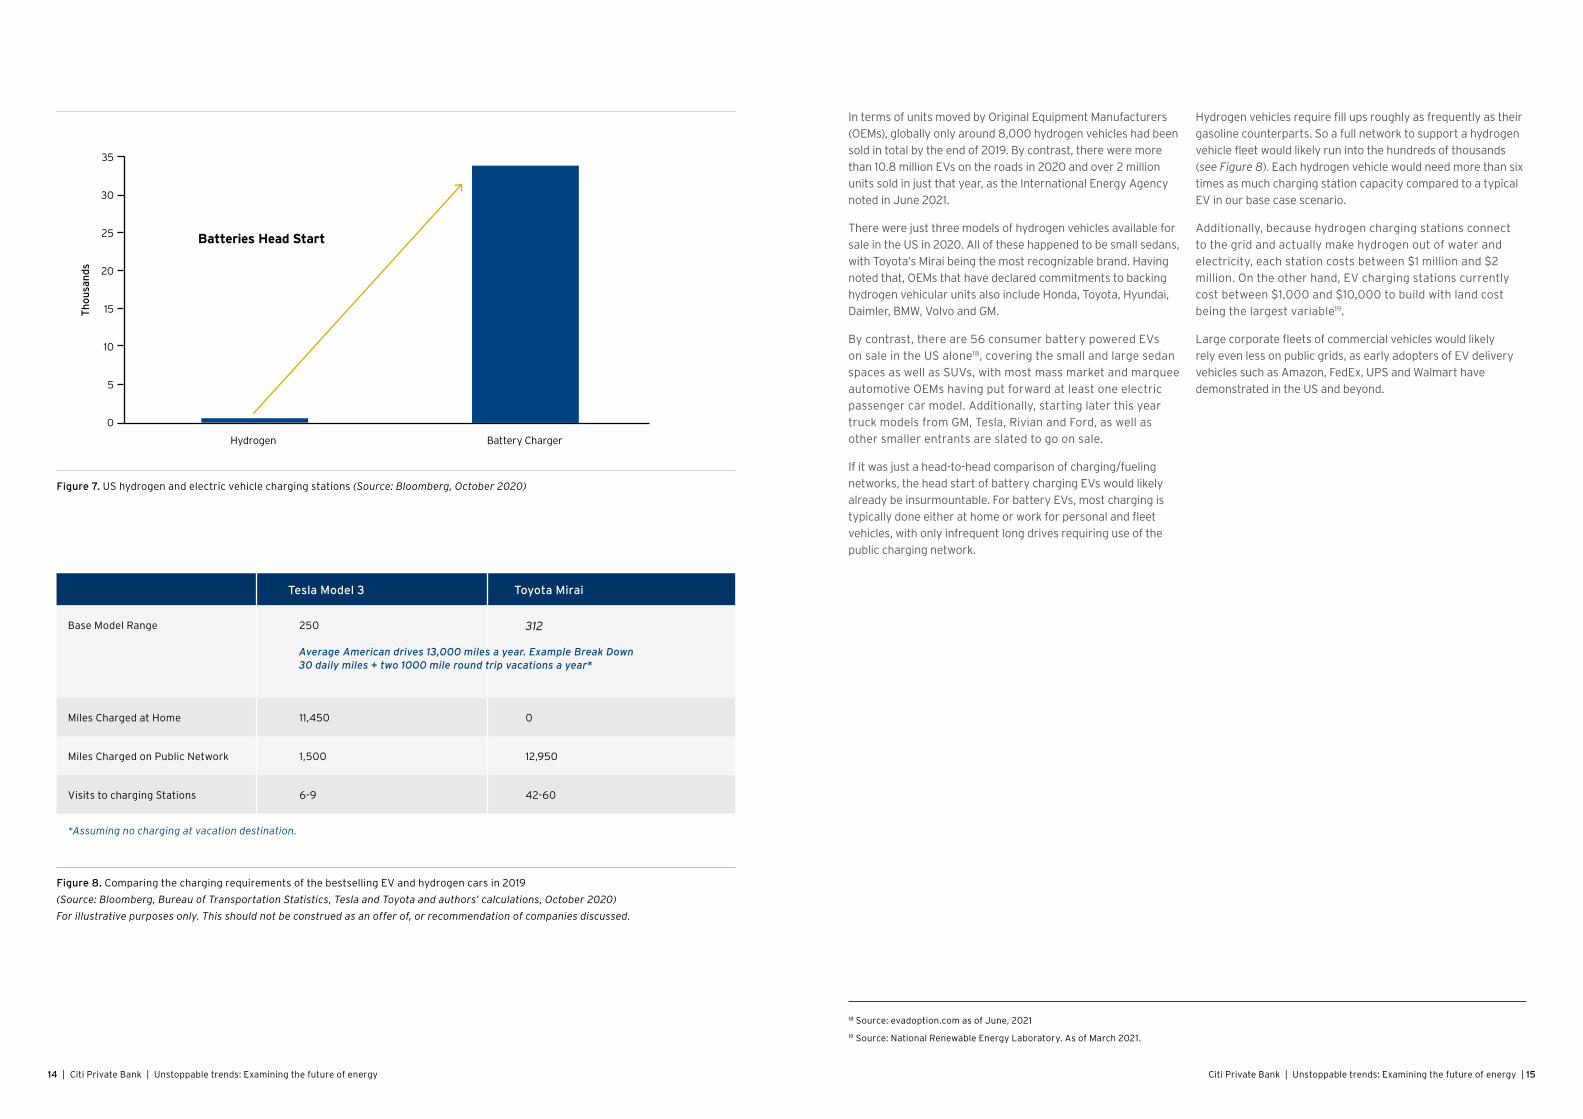
When it comes to market assessment, numbers tell their
own story. According to the US department of Energy,
there are currently 54 hydrogen fueling stations in the
US, with nearly all of them, bar a handful, in California.
Concurrently, all of China – one of the most significant
markets for vehicle sales – has less than 30. The only
other markets with reasonably credible hydrogen fueling
infrastructure are Japan and Germany, with 114 and 84
fuel points respectively, as of June 202017. By contrast,
there are more than 49,000 battery vehicle charging
stations spread across the US alone (see Figure 7).
17 Hydrogen mobility tracker https://h2.live/en
Citi Private Bank | Unstoppable trends: Examining the future of energy | 1514 | Citi Private Bank | Unstoppable trends: Examining the future of energy
Figure 7. US hydrogen and electric vehicle charging stations (Source: Bloomberg, October 2020)
Hydrogen Battery Charger
35
30
25
20
15
10
5
0
Th
ou
san
ds
Batteries Head Start
In terms of units moved by Original Equipment Manufacturers
(OEMs), globally only around 8,000 hydrogen vehicles had been
sold in total by the end of 2019. By contrast, there were more
than 10.8 million EVs on the roads in 2020 and over 2 million
units sold in just that year, as the International Energy Agency
noted in June 2021.
There were just three models of hydrogen vehicles available for
sale in the US in 2020. All of these happened to be small sedans,
with Toyota’s Mirai being the most recognizable brand. Having
noted that, OEMs that have declared commitments to backing
hydrogen vehicular units also include Honda, Toyota, Hyundai,
Daimler, BMW, Volvo and GM.
By contrast, there are 56 consumer battery powered EVs
on sale in the US alone18, covering the small and large sedan
spaces as well as SUVs, with most mass market and marquee
automotive OEMs having put forward at least one electric
passenger car model. Additionally, starting later this year
truck models from GM, Tesla, Rivian and Ford, as well as
other smaller entrants are slated to go on sale.
If it was just a head-to-head comparison of charging/fueling
networks, the head start of battery charging EVs would likely
already be insurmountable. For battery EVs, most charging is
typically done either at home or work for personal and fleet
vehicles, with only infrequent long drives requiring use of the
public charging network.
Hydrogen vehicles require fill ups roughly as frequently as their
gasoline counterparts. So a full network to support a hydrogen
vehicle fleet would likely run into the hundreds of thousands
(see Figure 8). Each hydrogen vehicle would need more than six
times as much charging station capacity compared to a typical
EV in our base case scenario.
Additionally, because hydrogen charging stations connect
to the grid and actually make hydrogen out of water and
electricity, each station costs between $1 million and $2
million. On the other hand, EV charging stations currently
cost between $1,000 and $10,000 to build with land cost
being the largest variable19.
Large corporate fleets of commercial vehicles would likely
rely even less on public grids, as early adopters of EV delivery
vehicles such as Amazon, FedEx, UPS and Walmart have
demonstrated in the US and beyond.
Figure 8. Comparing the charging requirements of the bestselling EV and hydrogen cars in 2019
(Source: Bloomberg, Bureau of Transportation Statistics, Tesla and Toyota and authors’ calculations, October 2020)
For illustrative purposes only. This should not be construed as an offer of, or recommendation of companies discussed.
Tesla Model 3 Toyota Mirai
Base Model Range 250 312
Miles Charged at Home 11,450 0
Miles Charged on Public Network 1,500 12,950
Visits to charging Stations 6-9 42-60
*Assuming no charging at vacation destination.
Average American drives 13,000 miles a year. Example Break Down 30 daily miles + two 1000 mile round trip vacations a year*
18 Source: evadoption.com as of June, 2021
19 Source: National Renewable Energy Laboratory. As of March 2021.

Citi Private Bank | Unstoppable trends: Examining the future of energy | 1716 | Citi Private Bank | Unstoppable trends: Examining the future of energy
We believe the main competitor of battery powered EVs is
gasoline, and not rival alternative sources. However, the
writing appears to be on the wall for gasoline vehicles, even if
they take a long time to be phased out. Seventeen countries
have set targets for the end of gasoline powered vehicle
sales or their registration.
Most notably, Norway has a target of 2025; the UK and
Germany have a 2030 phase-out, while China has a target
of 2040. The US has not set a target date for a gasoline
powered vehicle ban, but the state of California set itself
a target year of 2035 in September 202020. Given that
California is the fifth-largest economy in the world on its
own standing, the US state’s stance matters.
Additionally, global gasoline vehicle sales appear to have
peaked in 2017, barring a complete reversal of consumer
trends which does not appear to be on the horizon. As
additional market segments are served by EV manufacturers,
most notably small sedans and pickup trucks, the electric
share of vehicle sales will likely only grow.
However, it must be noted that COVID-19 has made
breakeven scenarios for ownership costs for EVs versus
gasoline vehicles confusing. For instance, many observers
such as Car and Driver magazine21 had previously assumed
that a $100/KWhr battery would be cost competitive with an
internal combustion engine. Instead oil prices plummeted in
2020, thereby giving gasoline vehicles a reprieve.
Of course, many industry commentators do suggest that
some of the technologies already announced will put
battery prices substantially below $100/KWhr sooner rather
than later. If that is the case, either EV makers will be able
to have very large margins or sell for less than gasoline
vehicle makers can compete with.
For their part, most OEMs could continue the juggling act of
marketing as well as manufacturing EVs and gasoline vehicles
contingent upon the domestic dynamic of each market they
operate in, before phasing in what is incrementally appearing
to be a world where human mobility, especially ground
transportation, will be powered by electricity.
20 Theclimatecenter.org, June 2021
21 Car and Driver Magazine: Focus on EVs https://www.caranddriver.com/ev/
Competition for EVs comes from gasoline vehicles not hydrogen
Citi Private Bank | Unstoppable trends: Examining the future of energy | 1918 | Citi Private Bank | Unstoppable trends: Examining the future of energy
Given the ongoing innovation and technological changes,
we are now at a ‘point of no return’ with a clear emphasis
on clean energy. However, we have to be pragmatic
enough to acknowledge that the trends tracked in this
paper are long-term trends, albeit ones that investors with
faith in the spirit of human ingenuity would want to back.
As fuel cell powered mobility thrives, fossil fuels face a
precarious near-term as well as long-term future. Focusing
on the here and now, the world is likely to have lost over two
years’ worth of net crude demand growth as the COVID-19
pandemic recedes. And near-term demand growth trends
remain weak, given that the pandemic hit human mobility
with the rise of the remote working, lower vehicular traffic
and stunted appetite for commercial flying.
While multiple factors are accelerating energy transition,
the fossil fuels business is being reshaped as well to
cope with medium-term challenges to begin with. As
bankruptcies mount, the oil and gas industry is being
restructured. That includes the US, the world’s largest
oil liquids producer, catapulted to that position by shale
exploration and production.
Yet, no one should write off either the US, as it should
remain a critical global marginal hydrocarbon supplier, or
the oil and gas industry which would re-gear itself more
towards petrochemicals and aviation where there appear
to be no near-term viable substitutes.
From the Office of Innovation’s perspective, the future
of clean energy looks positive given the substantial
focus on addressing climate change that we continue to
witness, alongside the drive towards investments focused
on technology and data. It is generally inescapable that
the costs of renewable energy are coming down in key
Conclusion: Approaching horizon favors investing in unstoppable trends
Citi Private Bank | Unstoppable trends: Examining the future of energy | 2120 | Citi Private Bank | Unstoppable trends: Examining the future of energy
markets, as variously noted earlier in this paper. A recent
study by BloombergNEF22 noted that, it is now cheaper to
build and operate new large scale wind or solar plants in
nearly half the world, than it would be to run an existing
coal or gas-fired power plant.
Furthermore, it is not just the adoption of the new, but the
steady, if not rapid, phase out of the old that suggests both
energy transition and efficiency would be the hallmarks of
a low carbon global economy. Of course, policy regulations,
socioeconomic and geopolitical challenges will continue
to play a major role in setting energy policies as more and
more countries embrace these exponential changes. To
offer a few cases in point:
• Policy Initiatives: The European Union has an explicit
policy target through its Renewable Energy Directive II
(RED II) setting a new binding renewable energy target of
at least 32% across the 27-nation economic bloc23.
• Low carbon overtures: Clothing supply chain and
transportation companies are looking to lower their
energy costs and transfer savings down the value chain
with online sales outgrowing in-store sales in many
developed e-commerce markets.
• Fuel efficiencies: Major airline companies around the
world have retired their Boeing 747 four-engine jet planes
with British Airways, the largest transatlantic operator
of the model, announcing an immediate end to its fleet’s
usage in the wake of the pandemic. These aircrafts are
being replaced by new fuel efficient two-engine models.
• Oil demand recovery will remain challenging: The
International Energy Agency expects global oil demand
to recover by 5.5 million bpd to 96.6 million bpd in 2021,
following an unprecedented collapse of 8.8 million bpd in
202024. That is still well short of global demand recorded
in 2019, with the pandemic reversing nearly a decade’s
worth of demand growth.
In many ways, the energy sector offers an opportunity
for investors seeking to add growth potential to their
investment portfolios by harnessing the power of
unstoppable trends. Many investors have little to no
renewable energy exposure in their portfolios. Hence, this
sector presents an opportunity, more particularly so given
how we perceive the global growth outlook to be in step
with the technology revolution in major economies that
lean towards clean energy and sustainability.
Environmental, social and governance (ESG) based
strategies are growing significantly along with the assets
under management (AUMs) managed by professional
managers who place emphasis on it. We are strategically
placed to assist you in tapping emerging opportunities
arising out of unstoppable trends like the ongoing energy
transition. Both Citi Private Bank and the wider Citi
family are committed to the highest ESG principles and
opportunities that the ongoing energy transition brings
for investors and consumers alike.
In August 2020, we announced our 2025 Sustainable
Progress Strategy; a new five-year effort to accelerate the
transition to a sustainable future which will focus on climate
risk, low carbon transition and sustainable operations. Going
a step further on 1 March 2021, our group CEO Jane Fraser
committed Citi to net-zero emissions by 205025. It reaffirms
our commitment to reducing our greenhouse gas emissions
to as close to zero as possible and removing the rest from
our atmosphere. For us, such a transition to more sustainable
business practices can mitigate risk, unlock value over the
long-term and can be another competitive advantage.
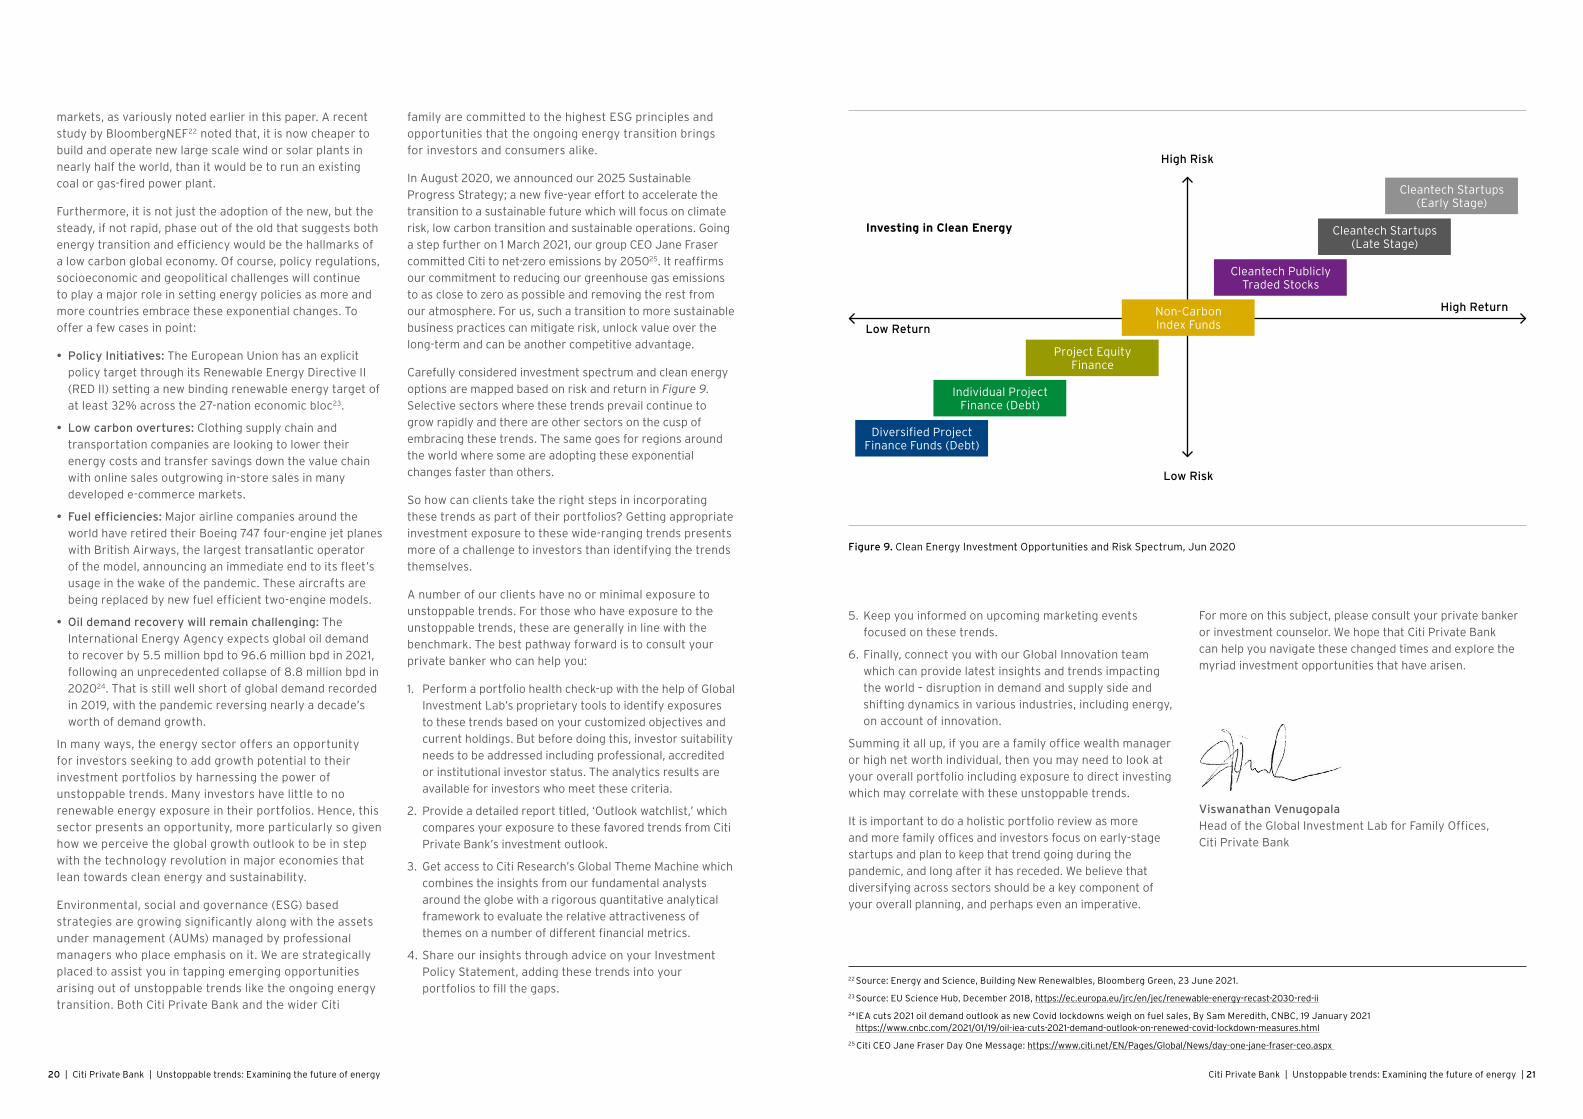
Carefully considered investment spectrum and clean energy
options are mapped based on risk and return in Figure 9.
Selective sectors where these trends prevail continue to
grow rapidly and there are other sectors on the cusp of
embracing these trends. The same goes for regions around
the world where some are adopting these exponential
changes faster than others.
So how can clients take the right steps in incorporating
these trends as part of their portfolios? Getting appropriate
investment exposure to these wide-ranging trends presents
more of a challenge to investors than identifying the trends
themselves.
A number of our clients have no or minimal exposure to
unstoppable trends. For those who have exposure to the
unstoppable trends, these are generally in line with the
benchmark. The best pathway forward is to consult your
private banker who can help you:
1. Perform a portfolio health check-up with the help of Global
Investment Lab’s proprietary tools to identify exposures
to these trends based on your customized objectives and
current holdings. But before doing this, investor suitability
needs to be addressed including professional, accredited
or institutional investor status. The analytics results are
available for investors who meet these criteria.
2. Provide a detailed report titled, ‘Outlook watchlist,’ which
compares your exposure to these favored trends from Citi
Private Bank’s investment outlook.
3. Get access to Citi Research’s Global Theme Machine which
combines the insights from our fundamental analysts
around the globe with a rigorous quantitative analytical
framework to evaluate the relative attractiveness of
themes on a number of different financial metrics.
4. Share our insights through advice on your Investment
Policy Statement, adding these trends into your
portfolios to fill the gaps.22 Source: Energy and Science, Building New Renewalbles, Bloomberg Green, 23 June 2021.
23 Source: EU Science Hub, December 2018, https://ec.europa.eu/jrc/en/jec/renewable-energy-recast-2030-red-ii
24 IEA cuts 2021 oil demand outlook as new Covid lockdowns weigh on fuel sales, By Sam Meredith, CNBC, 19 January 2021 https://www.cnbc.com/2021/01/19/oil-iea-cuts-2021-demand-outlook-on-renewed-covid-lockdown-measures.html
25 Citi CEO Jane Fraser Day One Message: https://www.citi.net/EN/Pages/Global/News/day-one-jane-fraser-ceo.aspx
5. Keep you informed on upcoming marketing events
focused on these trends.
6. Finally, connect you with our Global Innovation team
which can provide latest insights and trends impacting
the world – disruption in demand and supply side and
shifting dynamics in various industries, including energy,
on account of innovation.
Summing it all up, if you are a family office wealth manager
or high net worth individual, then you may need to look at
your overall portfolio including exposure to direct investing
which may correlate with these unstoppable trends.
It is important to do a holistic portfolio review as more
and more family offices and investors focus on early-stage
startups and plan to keep that trend going during the
pandemic, and long after it has receded. We believe that
diversifying across sectors should be a key component of
your overall planning, and perhaps even an imperative.
Figure 9. Clean Energy Investment Opportunities and Risk Spectrum, Jun 2020
Low Risk
High Risk
Low Return
High Return
Investing in Clean Energy
Diversified Project Finance Funds (Debt)
Cleantech Startups (Late Stage)
Cleantech Startups (Early Stage)
Non-Carbon Index Funds
Cleantech Publicly Traded Stocks
Project Equity Finance
Individual Project Finance (Debt)
Viswanathan Venugopala
Head of the Global Investment Lab for Family Offices,
Citi Private Bank
For more on this subject, please consult your private banker
or investment counselor. We hope that Citi Private Bank
can help you navigate these changed times and explore the
myriad investment opportunities that have arisen.
Citi Private Bank | Unstoppable trends: Examining the future of energy | 2322 | Citi Private Bank | Unstoppable trends: Examining the future of energy
About Citi Private Bank’s Office of Innovation
Principal authors
Philip Watson,
Chief Innovation Officer,
Citi Private Bank
Viswanathan Venugopala,
Head of the Global Investment
Lab for Family Offices,
Citi Private Bank
Research
Caroline Garkisch,
Senior Vice President,
Global Innovation Office,
Citi Private Bank
Malcolm Spittler,
Vice President and Global
Investment Strategist,
Citi Private Bank
Gaurav Sharma,
Vice President and
Lead Analyst/Financial Editor,
Citi Private Bank
Credits
Acknowledgements
Edward Morse,
Managing Director and
Global Head of
Commodities Strategy,
Citi Research
Steven Wieting,
Chief Investment Strategist
and Chief Economist,
Citi Private Bank
Media enquiries
Gabriel Morales,
Global Public Affairs,
Citi Private Bank
About Citi Private Bank’s Office of Innovation
Citi Private Bank’s Office of Innovation was established
specifically to help clients meet the challenges and
opportunities which our rapidly changing the world
presents us with. Technological advancements are
constantly transforming the way that we live and do
business. Citi Private Bank clients are typically innovators
by their very nature. They and their families have often
generated their wealth via innovative businesses or
business practices.
The challenge they now face is trying to preserve and grow
that wealth by ensuring that their investment portfolios
reflect and anticipate innovation’s effects upon the
economy and their assets. A key part of this exercise is
keeping up with and understanding the rapid developments
that are occurring.
Our purpose
The Office of Innovation not only better prepares our clients,
but also the Private Bank for the future. Embedded within
the innovation network of the wider Citi family, the Office of
Innovation is both a sense maker and a connector — sharing
insight by bringing the outside in and the inside out.
How we serve that purpose
• Events and forums — bringing clients and distinguished
thought leaders together to make connections
• White papers and thought pieces — illustrating how
innovation topics are relevant to private banking clients
and their offices
• Global insights – sharing global themes, industry insights,
and investment methodology from research and investment
professionals
• Connecting clients to our internal network — bringing the
best of Citi’s innovation from Treasury and Trade strategies,
to Citi Innovation Labs, Citi Ventures, and different research
areas to clients
• Investor community — participating in wider forums
across the private wealth and asset management industry
• Collaboration and partnership — collaborating with
academic and technology partners such as Imperial
College London.
Citi Private Bank | Unstoppable trends: Examining the future of energy | 2524 | Citi Private Bank | Unstoppable trends: Examining the future of energy
Glossary
Asset class definitions:
Cash is represented by US 3-month Government Bond TR, measuring
the US dollar-denominated active 3-Month, fixed-rate, nominal debt
issues by the US Treasury.
Commodities asset class contains the index composites — GSCI
Precious Metals Index, GSCI Energy Index, GSCI Industrial Metals Index,
and GSCI Agricultural Index — measuring investment performance in
different markets, namely precious metals (e.g., gold, silver), energy
commodity (e.g., oil, coal), industrial metals (e.g., copper, iron ore),
and agricultural commodity (i.e., soy, coffee) respectively. Reuters/
Jeffries CRB Spot Price Index, the TR/CC CRB Excess Return Index,
an arithmetic average of commodity futures prices with monthly
rebalancing, is used for supplemental historical data.
Emerging Markets (EM) Hard Currency Fixed Income is represented
by the FTSE Emerging Market Sovereign Bond Index (ESBI), covering
hard currency emerging market sovereign debt.
Global Developed Market Corporate Fixed Income is composed of
Bloomberg Barclays indices capturing investment debt from seven
different local currency markets. The composite includes investment
grade rated corporate bonds from the developed-market issuers.
Global Developed Market Equity is composed of MSCI indices
capturing large-, mid- and small-cap representation across
23 individual developed-market countries, as weighted by the
market capitalization of these countries. The composite covers
approximately 95% of the free float-adjusted market capitalization
in each country.
Global Developed Investment Grade Fixed Income is composed of
Bloomberg Barclays indices capturing investment-grade debt from
twenty different local currency markets. The composite includes
fixed-rate treasury, government-related, and investment grade
rated corporate and securitized bonds from the developed market
issuers. Local market indices for US, UK and Japan are used for
supplemental historical data.
Global Emerging Market Fixed Income is composed of Bloomberg
Barclays indices measuring performance of fixed-rate local currency
emerging markets government debt for 19 different markets across
Latin America, EMEA and Asia regions. iBoxx ABF China Govt. Bond,
the Markit iBoxx ABF Index comprising local currency debt from
China, is used for supplemental historical data.
Global High Yield Fixed Income is composed of Bloomberg Barclays
indices measuring the non-investment grade, fixed-rate corporate
bonds denominated in US dollars, British pounds and euros. Securities
are classified as high yield if the middle rating of Moody’s, Fitch, and
S&P is Ba1/BB+/BB+ or below, excluding emerging market debt.
Ibbotson High Yield Index, a broad high yield index including bonds
across the maturity spectrum, within the BB-B rated credit quality
spectrum, included in the below-investment-grade universe, is used
for supplemental historical data.
Hedge Funds are composed of investment managers employing
different investment styles as characterized by different sub
categories – HFRI Equity Long/Short: Positions both long and short
in primarily equity and equity derivative securities; HFRI Credit:
Positions in corporate fixed income securities; HFRI Event Driven:
Positions in companies currently or prospectively involved in wide
variety of corporate transactions; HFRI Relative Value: Positions
based on a valuation discrepancy between multiple securities;
HFRI Multi Strategy: Positions based on realization of a spread
between related yield instruments; HFRI Macro: Positions based
on movements in underlying economic variables and their impact
on different markets; Barclays Trader CTA Index: The composite
performance of established programs (Commodity Trading
Advisors) with more than four years of performance history.
High Yield Bank Loans are debt financing obligations issued by a
bank or other financial institution to a company or individual that
holds legal claim to the borrower’s assets in the event of a corporate
bankruptcy. These loans are usually secured by a company’s
assets, and often pay a high coupon due to a company’s poor
(noninvestment grade) credit worthiness.
Private Equity characteristics are driven by those for Developed
Market Small Cap Equities, adjusted for illiquidity, sector
concentration, and greater leverage.
Index definitions:
Bloomberg Barclays US Corporate Bond Index measures the
investment grade, fixed-rate, taxable corporate bond market. It
includes US dollar denominated securities publicly issued by US and
non-US industrial, utility and financial issuers.
Bloomberg Barclays US Treasury Index measures US dollar-
denominated, fixed-rate, nominal debt issued by the US Treasury.
FTSE All-World Index is a stock market index representing global
equity performance that covers over 3,100 companies in 47
countries starting in 1986.
MSCI AC Asia ex-Japan Index captures large and mid-cap
representation across two of three Developed Markets (DM) countries*
(excluding Japan) and 9 Emerging Markets (EM) countries* in Asia.
With 1,187 constituents, the index covers approximately 85% of the free
float-adjusted market capitalization in each country.
MSCI China Index captures large and mid-cap representation across
China A shares, H shares, B shares, Red chips, P chips and foreign
listings (e.g. ADRs). With 704 constituents, the index covers about
85% of this China equity universe.
MSCI Emerging Markets Index captures large and mid- cap
representation across twenty-four Emerging Markets (EM) countries.
With 837 constituents, the index covers approximately 85% of the
free float-adjusted market capitalization in each country.
MSCI Emerging Markets EMEA Index captures large and midcap
representation across 11 Emerging Markets (EM) countries* in
Europe, the Middle East and Africa (EMEA). With 173 constituents, the
index covers approximately 85% of the free float adjusted market
capitalization in each country.
MSCI Emerging Markets (EM) Latin America Index captures large
and mid-cap representation across five Emerging Markets (EM)
countries in Latin America. With 113 constituents, the index covers
approximately 85% of the free float-adjusted market capitalization in
each country.
MSCI Europe Index captures large- and mid- cap representation
across 15 Developed Markets (DM) countries in Europe*. With 437
constituents, the index covers approximately 85% of the free float-
adjusted market capitalization across the European Developed Markets
equity universe.
MSCI Global Alternative Energy Index includes developed and
emerging market large, mid and small cap companies that derive
50% or more of their revenues from products and services in
Alternative energy.
MSCI ACWI Energy Index includes large and midcap securities
across 23 Developed Markets (DM) and 27 Emerging Markets (EM)
countries. All securities in the index are classified in the Energy as
per the Global Industry Classification Standard (GICS).
MSCI ACWI Index is MSCI’s flagship global equity index, is designed
to represent performance of the full opportunity set of large and
midcap stocks across 23 developed and 27 emerging markets. As
of November 2020, it covers more than 3,000 constituents across
11 sectors and approximately 85% of the free float-adjusted market
capitalization in each market.
The VIX or the Chicago Board Options Exchange (CBOE) Volatility
Index, is a real-time index representing the market’s expectation of
30-day forward looking volatility, derived from the price inputs of the
S&P 500 index options.
Other terminology:
Adaptive Valuations Strategies is Citi Private Bank’s own strategic
asset allocation methodology. It determines the suitable long-term
mix of assets for each client’s investment portfolio.
Correlation is a statistical measure of how two assets or asset
classes move in relation to one another. Correlation is measured
on a scale of 1 to -1. A correlation of 1 implies perfect positive
correlation, meaning that two assets or asset classes move in the
same direction all of the time. A correlation of -1 implies perfect
negative correlation, such that two assets or asset classes move in
the opposite direction to each other all the time. A correlation of 0
implies zero correlation, such that there is no relationship between
the movements in the two over time.
EU or the European Union is a political and economic union of 27
member states in Europe.
IEA or the International Energy Agency is an autonomous
intergovernmental organization established in the framework of the
OECD in the wake of the 1973 oil crisis to further energy consumers’
interests.
IRENA or the International Renewable Energy Agency is an
intergovernmental organization supporting countries in their
transition to a sustainable energy future.
LIBOR or London interbank offered rate is the rate of interest at
which banks offer to lend funds to each other. It is used a reference
rate for large amounts of financial contracts.
OECD or the Organisation for Economic Co-operation and
Development is an intergovernmental economic organization with
38 member countries, aimed at stimulating economic progress and
world trade.
OPEC or the Organization of the Petroleum Exporting Countries is an
intergovernmental organization of 13 oil producing countries.
Sharpe ratio is a measure of risk-adjusted return, expressed as excess
return per unit of deviation, typically referred to as risk.
Citi Private Bank | Unstoppable trends: Examining the future of energy | 2726 | Citi Private Bank | Unstoppable trends: Examining the future of energy
Important InformationThis communication is prepared by Citi Private Bank (“CPB”), a business of Citigroup, Inc. (“Citigroup”), which provides its clients access to
a broad array of products and services available through Citigroup, its bank and non-bank affiliates worldwide (collectively, “Citi”). Not all
products and services are provided by all affiliates, or are available at all locations.
All views, opinions and estimates expressed in this communication (i) may change without notice, and (ii) may differ from those views, opinions
and estimates held or expressed by Citigroup or other Citigroup personnel. Some of the information contained in this Communication is based
on generally available information and, although obtained from sources believed by Citi to be reliable, its accuracy and completeness cannot be
assured, and such information may be incomplete or condensed. Any assumptions or information contained in this Communication constitute a
judgment only as of the date of this document or on any specified dates and is subject to change without notice.
This document is for information purposes only and does not constitute an offer to sell or a solicitation of an offer to buy any securities to any
person in any jurisdiction. The information set out herein may be subject to updating, completion, revision, verification and amendment and
such information may change materially.
Citigroup, its affiliates and any of the officers, directors, employees, representatives or agents shall not be held liable for any direct, indirect,
incidental, special, or consequential damages, including loss of profits, arising out of the use of information contained herein, including through
errors whether caused by negligence or otherwise.
Recipients of this communication should obtain advice based on their individual circumstances from their own tax, financial, legal and other
advisors before making an investment decision, and only make such decisions on the basis of the investor’s own objectives, experience and
resources.
Citi Private Bank is a business of Citigroup Inc. (“Citigroup”), which provides its clients access to a broad array of products and services available
through bank and non-bank affiliates of Citigroup. Not all products and services are provided by all affiliates or are available at all locations.
In the U.S., investment products and services are provided by Citigroup Global Markets Inc. (“CGMI”), member FINRA and SIPC, and also Citi
Private Advisory, LLC (“Citi Advisory”), member FINRA and SIPC. CGMI accounts are carried by Pershing LLC, member FINRA, NYSE, SIPC.
CGMI, Citi Advisory and Citibank, N.A. are affiliated companies under the common control of Citigroup.
Outside the U.S., investment products and services are provided by other Citigroup affiliates. Investment Management services (including
portfolio management) are available through CGMI, Citi Advisory, Citibank, N.A. and other affiliated advisory businesses. This document is
for informational purposes only. All opinions are subject to change without notice. Opinions expressed herein may differ from the opinions
expressed by other businesses of Citigroup Inc., are not intended to be a forecast of future events or a guarantee of future results.
Although information in this document has been obtained from sources believed to be reliable, Citigroup Inc. and its affiliates do not guarantee
its accuracy or completeness and accept no liability for any direct or consequential losses arising from its use.
Citibank, N.A., Hong Kong / Singapore organised under the laws of U.S.A. with limited liability. This communication is distributed in Hong Kong by
Citi Private Bank operating through Citibank N.A., Hong Kong Branch, which is registered in Hong Kong with the Securities and Futures Commission
for Type 1 (dealing in securities), Type 4 (advising on securities), Type 6 (advising on corporate finance) and Type 9 (asset management) regulated
activities with CE No: (AAP937) or in Singapore by Citi Private Bank operating through Citibank, N.A., Singapore Branch which is regulated by the
Monetary Authority of Singapore. Any questions in connection with the contents in this communication should be directed to registered or licensed
representatives of the relevant aforementioned entity. The contents of this communication have not been reviewed by any regulatory authority in
Hong Kong or any regulatory authority in Singapore. This communication contains confidential and proprietary information and is intended only
for recipient in accordance with accredited investors requirements in Singapore (as defined under the Securities and Futures Act (Chapter 289 of
Singapore) (the “Act” )) and professional investors requirements in Hong Kong(as defined under the Hong Kong Securities and Futures Ordinance
and its subsidiary legislation). For regulated asset management services, any mandate will be entered into only with Citibank, N.A., Hong Kong
Branch and/or Citibank, N.A. Singapore Branch, as applicable. Citibank, N.A., Hong Kong Branch or Citibank, N.A., Singapore Branch may sub-
delegate all or part of its mandate to another Citigroup affiliate or other branch of Citibank, N.A. Any references to named portfolio managers are
for your information only, and this communication shall not be construed to be an offer to enter into any portfolio management mandate with any
other Citigroup affiliate or other branch of Citibank, N.A. and, at no time will any other Citigroup affiliate or other branch of Citibank, N.A. or any
other Citigroup affiliate enter into a mandate relating to the above portfolio with you. To the extent this communication is provided to clients who
are booked and/or managed in Hong Kong: No other statement(s) in this communication shall operate to remove, exclude or restrict any of your
rights or obligations of Citibank under applicable laws and regulations. Citibank, N.A., Hong Kong Branch does not intend to rely on any provisions
herein which are inconsistent with its obligations under the Code of Conduct for Persons Licensed by or Registered with the Securities and Futures
Commission, or which mis-describes the actual services to be provided to you.
Citibank, N.A. is incorporated in the United States of America and its principal regulators are the US Office of the Comptroller of Currency and
Federal Reserve under US laws, which differ from Australian laws. Citibank, N.A. does not hold an Australian Financial Services Licence under
the Corporations Act 2001 as it enjoys the benefit of an exemption under ASIC Class Order CO 03/1101 (remade as ASIC Corporations (Repeal
and Transitional) Instrument 2016/396 and extended by ASIC Corporations (Amendment) Instrument 2021/510)
In the United Kingdom, Citibank N.A., London Branch (registered branch number BR001018), Citigroup Centre, Canada Square, Canary Wharf,
London, E14 5LB, is authorised and regulated by the Office of the Comptroller of the Currency (USA) and authorised by the Prudential Regulation
Authority. Subject to regulation by the Financial Conduct Authority and limited regulation by the Prudential Regulation Authority. Details about
the extent of our regulation by the Prudential Regulation Authority are available from us on request. The contact number for Citibank N.A.,
London Branch is +44 (0)20 7508 8000.
Citibank Europe plc (UK Branch), is a branch of Citibank Europe plc, which is authorised by the European Central Bank and regulated by the
Central Bank of Ireland and the European Central Bank (reference number is C26553). Citibank Europe plc (UK Branch) is also authorised by
the Prudential Regulation Authority and with deemed variation of permission. Citibank Europe plc (UK Branch) is subject to regulation by the
Financial Conduct Authority and limited regulation by the Prudential Regulation Authority. Details of the temporary permissions regime, which
allows EEA based firms to operate in the UK for a limited period while seeking full authorisation, are available on the FCA’s website. Citibank
Europe plc (UK Branch) is registered as a branch in the register of companies for England and Wales with registered branch number BR017844.
Its registered address is Citigroup Centre, Canada Square, Canary Wharf, London E14 5LB. VAT No.: GB 429 6256 29. Citibank Europe plc is
registered in Ireland with number 132781, with its registered office at 1 North Wall Quay, Dublin 1. Citibank Europe plc is regulated by the Central
Bank of Ireland. Ultimately owned by Citigroup Inc., New York, USA.
Citibank Europe plc, Luxembourg Branch is a branch of Citibank Europe plc with trade and companies register number B 200204. It is authorised
in Luxembourg and supervised by the Commission de Surveillance du Secteur Financier. It appears on the Commission de Surveillance du
Secteur Financier register with company number B00000395. Its business office is at 31, Z.A. Bourmicht, 8070 Bertrange, Grand Duchy of
Luxembourg. Citibank Europe plc is registered in Ireland with company registration number 132781. It is regulated by the Central Bank of Ireland
under the reference number C26553 and supervised by the European Central Bank. Its registered office is at 1 North Wall Quay, Dublin 1, Ireland.
In Jersey, this document is communicated by Citibank N.A., Jersey Branch which has its registered address at PO Box 104, 38 Esplanade, St
Helier, Jersey JE4 8QB. Citibank N.A., Jersey Branch is regulated by the Jersey Financial Services Commission. Citibank N.A. Jersey Branch
is a participant in the Jersey Bank Depositors Compensation Scheme. The Scheme offers protection for eligible deposits of up to £50,000.
The maximum total amount of compensation is capped at £100,000,000 in any 5 year period. Full details of the Scheme and banking groups
covered are available on the States of Jersey website www.gov.je/dcs, or on request.
In Canada, Citi Private Bank is a division of Citibank Canada, a Schedule II Canadian chartered bank. References herein to Citi Private Bank and
its activities in Canada relate solely to Citibank Canada and do not refer to any affiliates or subsidiaries of Citibank Canada operating in Canada.
Certain investment products are made available through Citibank Canada Investment Funds Limited (“CCIFL”), a wholly owned subsidiary of
Citibank Canada. Investment Products are subject to investment risk, including possible loss of principal amount invested. Investment Products
are not insured by the CDIC, FDIC or depository insurance regime of any jurisdiction and are not guaranteed by Citigroup or any affiliate thereof.
CCIFL is not currently a member, and does not intend to become a member of the Mutual Fund Dealers Association of Canada (“MFDA”);
consequently, clients of CCIFL will not have available to them investor protection benefits that would otherwise derive from membership of
CCIFL in the MFDA, including coverage under any investor protection plan for clients of members of the MFDA.
© 2021 Citigroup Inc. All Rights Reserved. Citi, Citi and Arc Design and other marks used herein are service marks of Citigroup Inc. or its
affiliates, used and registered throughout the world.

© 2021 Citigroup Inc., All Rights Reserved. Citi, Citi and Arc Design and other marks used herein are service marks of Citigroup Inc. or its affiliates, used and registered throughout the world.
GRA34667 09/21