Citi Global Energy and Utilities Conference -...
34
Citi Global Energy and Utilities Conference Boston, Mass. | May 14-15, 2014
-
Upload
nguyenminh -
Category
Documents
-
view
215 -
download
0
Transcript of Citi Global Energy and Utilities Conference -...

Citi Global Energy and Utilities Conference
Boston, Mass. | May 14-15, 2014

Page 2
Pierce Norton President and Chief Executive Officer

Page 3
Forward-Looking Statements
Statements contained in this presentation that include company expectations or predictions should be
considered forward-looking statements that are covered by the safe harbor provisions of the Securities Act of
1933 and the Securities and Exchange Act of 1934.
It is important to note that the actual results could differ materially from those projected in such forward-looking
statements.
For additional information that could cause actual results to differ materially from such forward-looking
statements, refer to ONE Gas’ Securities and Exchange Commission filings.
All future cash dividends (declared or paid) discussed in this presentation are subject to the approval of the
ONE Gas board of directors.
All references in this presentation to guidance are based on news releases issued on Dec. 2, 2013, and May
5, 2014, and are not being updated or affirmed by this presentation.

Page 4
Key Points
Competitive Strengths
– 100% regulated natural gas utility focus
– Third largest publicly traded natural gas distributor
Regulatory Overview
– Mechanisms and timelines
Financial
– Capital investments result in rate base growth
Creating value for stakeholders
– Employees, customers, investors and communities
What We’ll Cover
Page 5
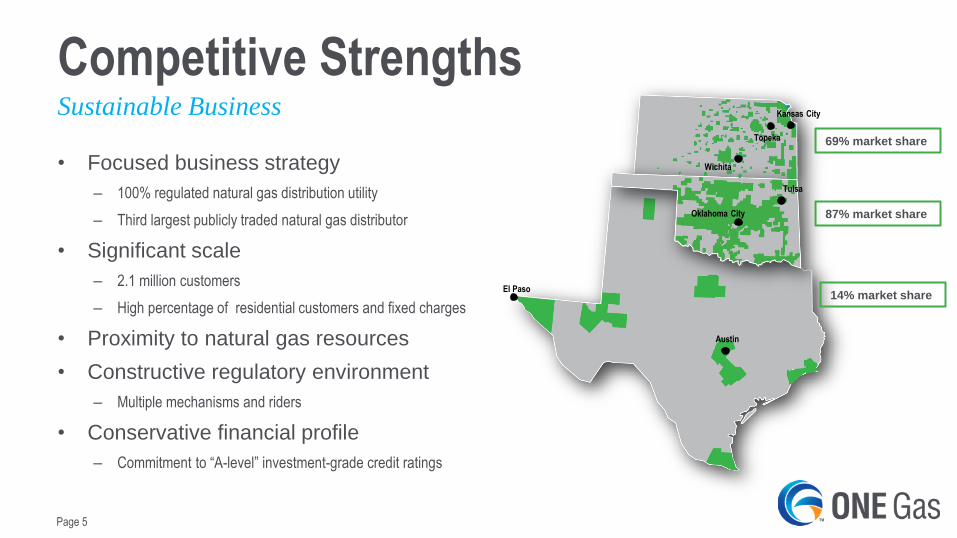
Competitive Strengths
• Focused business strategy
– 100% regulated natural gas distribution utility
– Third largest publicly traded natural gas distributor
• Significant scale
– 2.1 million customers
– High percentage of residential customers and fixed charges
• Proximity to natural gas resources
• Constructive regulatory environment
– Multiple mechanisms and riders
• Conservative financial profile
– Commitment to “A-level” investment-grade credit ratings
Sustainable Business Kansas City
Wichita
Tulsa
Oklahoma City
Austin
El Paso
Topeka 69% market share
87% market share
14% market share
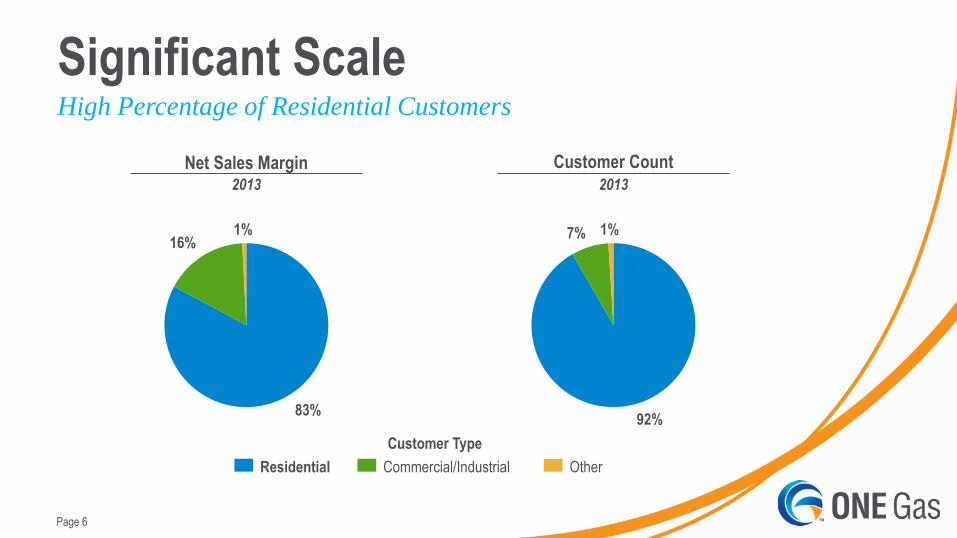
Page 6
2013
Significant Scale High Percentage of Residential Customers
2013
Customer Count
83%
16% 1%
Residential Commercial/Industrial Other
92%
7% 1%
Net Sales Margin
Customer Type

Page 7
Significant Scale High Percentage of Fixed Charges
Kansas Oklahoma Texas Total
Fixed Charges – Sales
customers 51% 83% 70% 69%
Average Heating
Degree Days – Normal 4,860 3,316 1,785 -
Weather Normalization 100% 100% 62% 87%
Residential Margin 68% 71% 67% 69%
Governance
Kansas Corporation Commission
(three commissioners appointed by
the governor to four-year staggered
terms)
Oklahoma Corporation Commission
(three commissioners elected to six-
year staggered terms)
“Home Rule” with 10 jurisdictions
(Texas Railroad Commission has
appellate authority)
Note: Based on 2013 annual results
Page 8
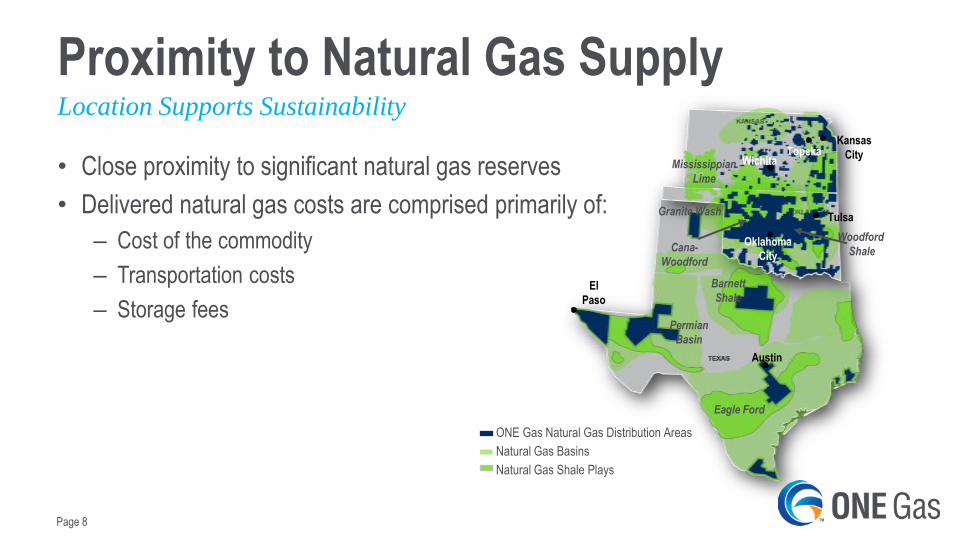
Proximity to Natural Gas Supply
• Close proximity to significant natural gas reserves
• Delivered natural gas costs are comprised primarily of:
– Cost of the commodity
– Transportation costs
– Storage fees
Location Supports Sustainability Kansas
City Wichita
Tulsa
Oklahoma
City
Austin
El
Paso
ONE Gas Natural Gas Distribution Areas
Natural Gas Basins
Natural Gas Shale Plays
Eagle Ford
Permian
Basin
Mississippian
Lime
Cana-
Woodford
Granite Wash
Woodford
Shale
Barnett
Shale
Topeka
Page 9
Regulatory Mechanisms
• Oklahoma Natural Gas
– Performance-based rate structure provides annual rate reviews between rate cases to ensure
achieved ROE is within the established band of 10-11 percent
• Kansas Gas Service
– Gas System Reliability Surcharge – for incremental safety-related and government-mandated
capital investments made between rate cases
• Texas Gas Service
– Cost-of-service adjustments and El Paso Annual Rate Review for capital investments and certain
changes in operating expenses
– Gas Reliability Infrastructure Program for capital investments made between rate cases
Overview

Page 10
Five-year Financial Outlook
• Expected average annual net income growth of 4-6% between 2014-
2018
– Driven by regulatory filings
– Rate base expected to grow an average of 5-6% per year between 2013-2018
• Expected average annual dividend growth of 5% between 2014-2018
– Target dividend payout ratio of 55-65% of net income
• Expected capital expenditures of between $240-$285 million per year
in 2014-2018
Page 11
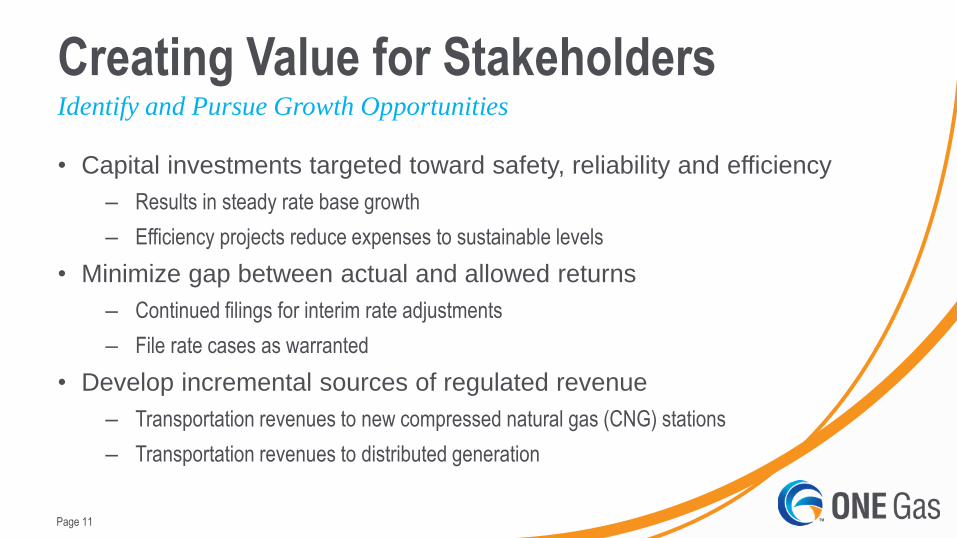
Creating Value for Stakeholders
• Capital investments targeted toward safety, reliability and efficiency
– Results in steady rate base growth
– Efficiency projects reduce expenses to sustainable levels
• Minimize gap between actual and allowed returns
– Continued filings for interim rate adjustments
– File rate cases as warranted
• Develop incremental sources of regulated revenue
– Transportation revenues to new compressed natural gas (CNG) stations
– Transportation revenues to distributed generation
Identify and Pursue Growth Opportunities
Page 12
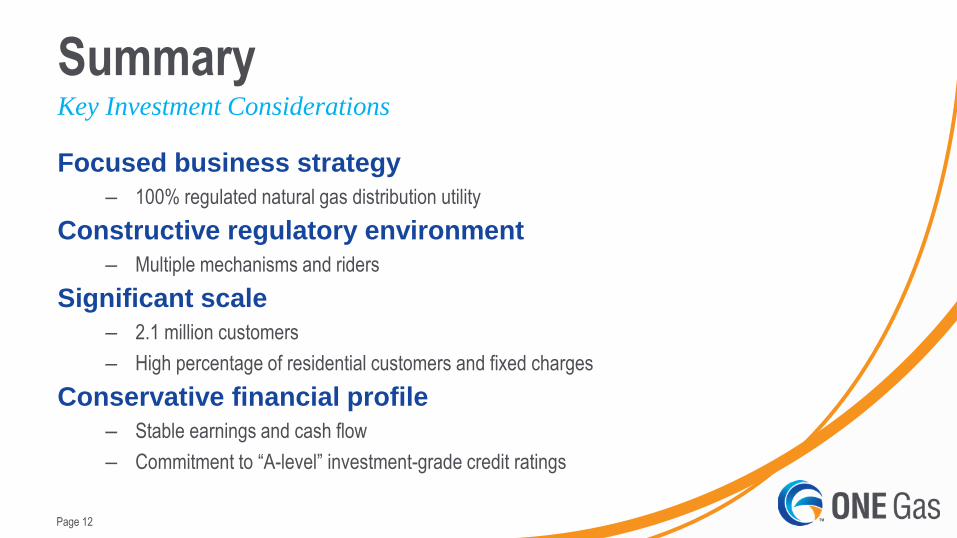
Summary
Focused business strategy
– 100% regulated natural gas distribution utility
Constructive regulatory environment
– Multiple mechanisms and riders
Significant scale
– 2.1 million customers
– High percentage of residential customers and fixed charges
Conservative financial profile
– Stable earnings and cash flow
– Commitment to “A-level” investment-grade credit ratings
Key Investment Considerations

Page 13
Appendix
Page 14
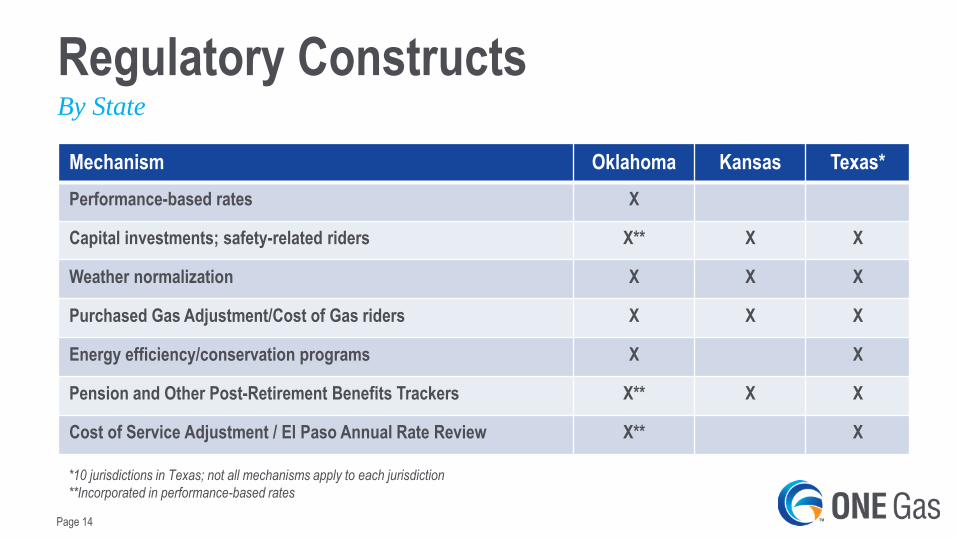
Regulatory Constructs
Mechanism Oklahoma Kansas Texas*
Performance-based rates X
Capital investments; safety-related riders X** X X
Weather normalization X X X
Purchased Gas Adjustment/Cost of Gas riders X X X
Energy efficiency/conservation programs X X
Pension and Other Post-Retirement Benefits Trackers X** X X
Cost of Service Adjustment / El Paso Annual Rate Review X** X
By State
*10 jurisdictions in Texas; not all mechanisms apply to each jurisdiction
**Incorporated in performance-based rates
Page 15
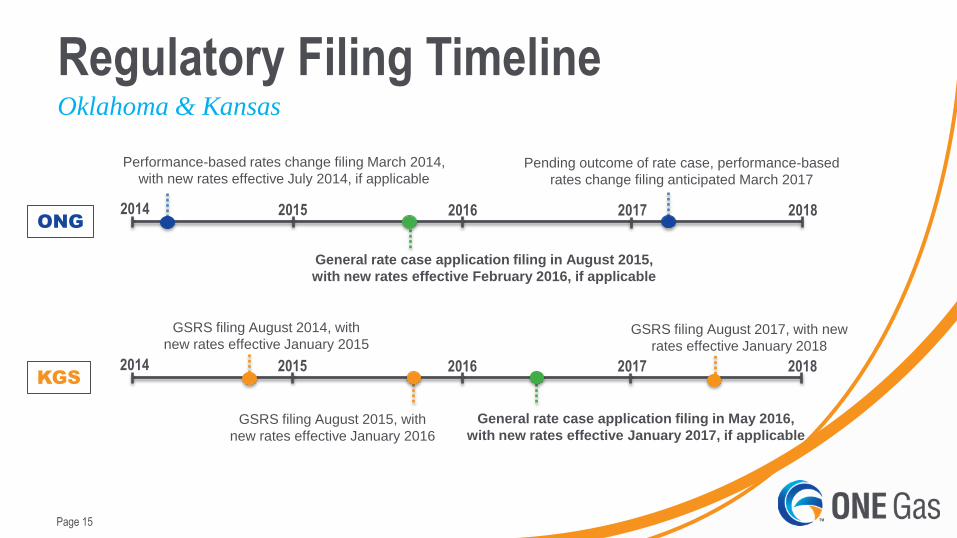
Regulatory Filing Timeline Oklahoma & Kansas
2014 2015 2016 2017 2018
Performance-based rates change filing March 2014,
with new rates effective July 2014, if applicable
General rate case application filing in August 2015,
with new rates effective February 2016, if applicable
ONG
Pending outcome of rate case, performance-based
rates change filing anticipated March 2017
2014 2015 2016 2017 2018
GSRS filing August 2014, with
new rates effective January 2015
GSRS filing August 2015, with
new rates effective January 2016
KGS
General rate case application filing in May 2016,
with new rates effective January 2017, if applicable
GSRS filing August 2017, with new
rates effective January 2018
Page 16
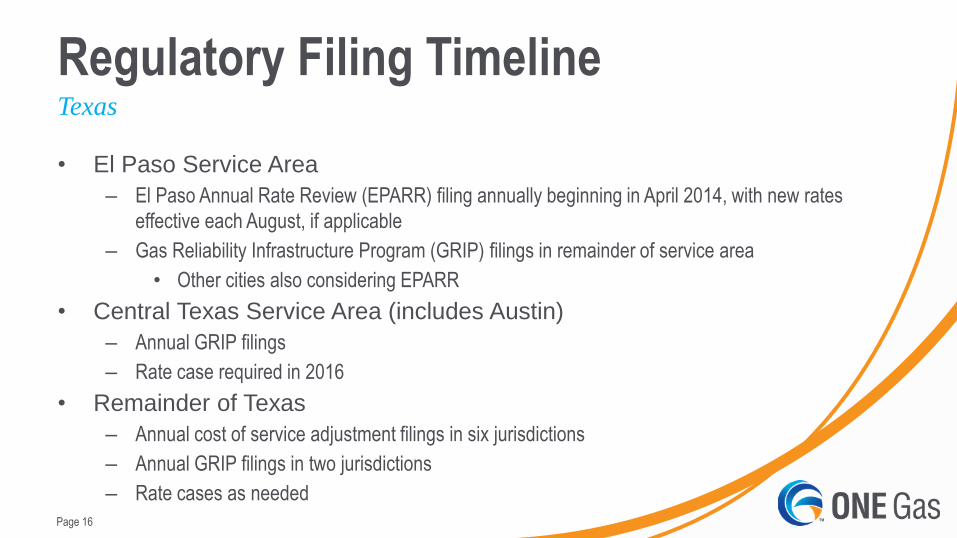
Regulatory Filing Timeline Texas
• El Paso Service Area
– El Paso Annual Rate Review (EPARR) filing annually beginning in April 2014, with new rates
effective each August, if applicable
– Gas Reliability Infrastructure Program (GRIP) filings in remainder of service area
• Other cities also considering EPARR
• Central Texas Service Area (includes Austin)
– Annual GRIP filings
– Rate case required in 2016
• Remainder of Texas
– Annual cost of service adjustment filings in six jurisdictions
– Annual GRIP filings in two jurisdictions
– Rate cases as needed

Page 17
Regulatory Information By State
Rate Base
(in millions)
Authorized
Rate of Return
Authorized
Return on Equity
Oklahoma Natural Gas¹ $896 8.535% 10-11%
Kansas Gas Service² $770 N/A N/A
Texas Gas Service¹ $504 8.55% 10.4%
¹ The rate base, authorized rate of return and authorized return on equity presented in this table are those from the last approved rate filings for each
jurisdiction. These amounts are not necessarily indicative of current or future rate bases, rates of return or returns on equity.
² Last rate case was settled without a determination of rate base, return on equity or rate of return; rate base includes the amounts included in the
company’s filings and is not necessarily indicative of current or future rate base.
Page 18
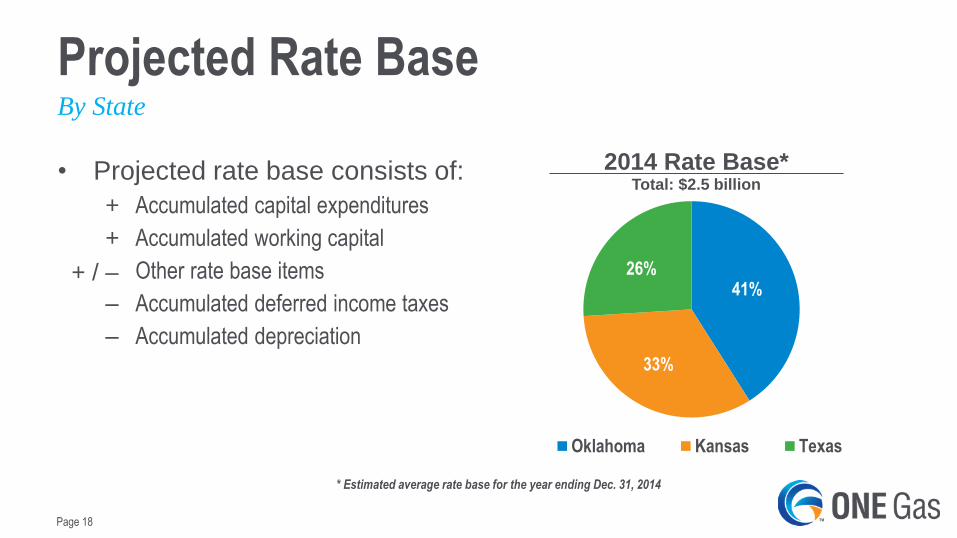
Projected Rate Base By State
41%
33%
26%
2014 Rate Base* Total: $2.5 billion
Oklahoma Kansas Texas
* Estimated average rate base for the year ending Dec. 31, 2014
• Projected rate base consists of:
+ Accumulated capital expenditures
+ Accumulated working capital
+ Other rate base items
– Accumulated deferred income taxes
– Accumulated depreciation
+ / –
Page 19
Financial Highlights
• ONE Gas will maintain a conservative financial posture
– Prudent capital investment results in steady rate base growth
– Financial metrics necessary to maintain strong investment-grade credit ratings
– Dividend policy in line with peers
• Financings completed in conjunction with the legal separation from ONEOK
– $700 million revolving credit facility
– Issued $1.2 billion of long-term debt at weighted average coupon rate of 3.75 percent
– Distributed $1.13 billion to ONEOK at separation; retained $60 million
• Utilize operating cash flows and short-term borrowings for working capital and capital
expenditures
Maintain Conservative Posture

Page 20
Balance Sheet
• Strong investment-grade credit ratings, consistent with peers
– Moody’s: A2 (Stable)
– S&P: A- (Stable)
• Capital structure
– Long-term debt-to-capitalization ratio of 40%
– Long-term debt-to-EBITDA of 3.5x
– EBIT-to-interest of 4.0x
• Strong liquidity position will support capital expenditure and working capital needs
– Stable operating cash flows
– $700 million revolving credit facility
– Commercial paper program
• Pension funding of approximately 99% at Jan. 1, 2014
Commitment to Strong Investment-Grade Ratings
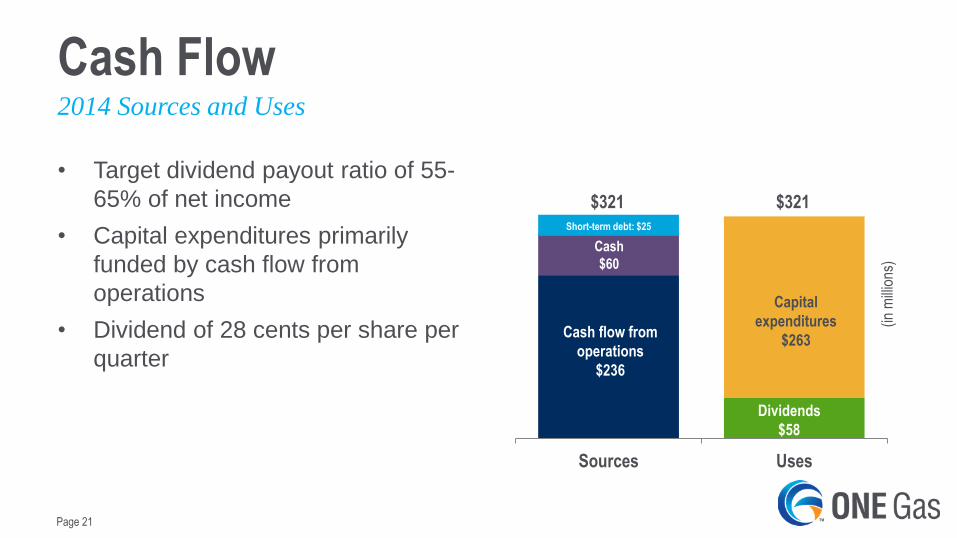
Page 21
• Target dividend payout ratio of 55-
65% of net income
• Capital expenditures primarily
funded by cash flow from
operations
• Dividend of 28 cents per share per
quarter
Cash Flow
Sources Uses
(in m
illio
ns)
Cash
$60
Dividends
$58
Capital
expenditures
$263 Cash flow from
operations
$236
$321 $321
2014 Sources and Uses
Short-term debt: $25

Page 22
• Goal: Minimize the gap between
allowed and actual returns*
– 2014 ROE estimate: 7.4%
– 2013 ROE achieved: 8.0%
– 2012 ROE achieved: 8.3%
Operating Income
$200
$216
$220** $217
2011 2012 2013 2014G
Opportunity to Narrow the Gap
(in
mill
ion
s)
*ROE calculations are consistent with utility ratemaking in each jurisdiction
**Includes $10.2 million charge related to separation
Page 23
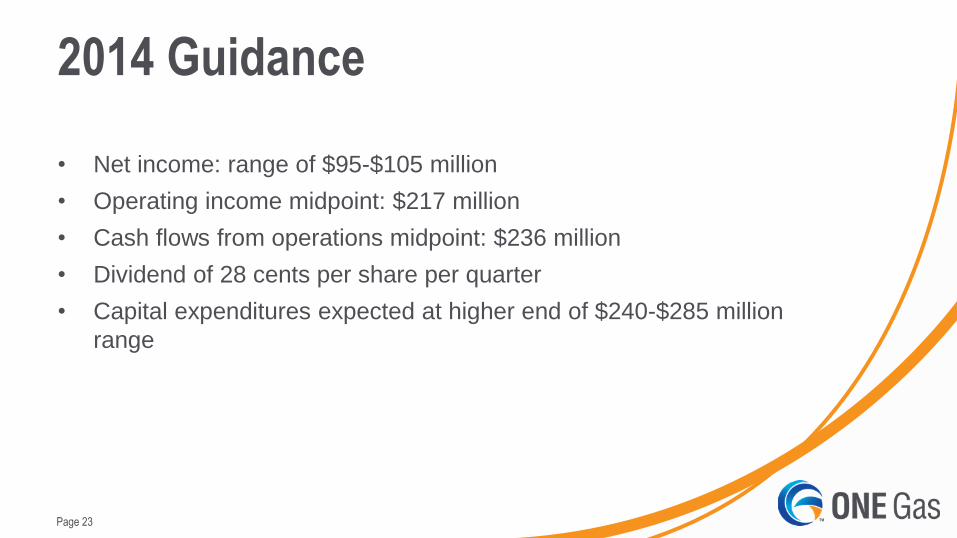
2014 Guidance
• Net income: range of $95-$105 million
• Operating income midpoint: $217 million
• Cash flows from operations midpoint: $236 million
• Dividend of 28 cents per share per quarter
• Capital expenditures expected at higher end of $240-$285 million
range

Page 24
• Majority of capital expenditures for safety,
reliability and efficiency
– System integrity and replacements
– Efficiency
• Automated meter reading (64% coverage)
• Operational efficiency efforts
• New service lines and main extensions
for customer growth
• 2014 by state:
• Oklahoma: ~40%
• Kansas: ~30%
• Texas: ~30%
Capital Expenditures Capital Spending Exceeds Depreciation
$23 $19 $34 $33 $31 $37
$55 $31
$7 $5
$3 $13
$182 $219 $195
$186
$106 $112 $112 $120
2011 2012 2013 2014G
(in m
illio
ns)
Efficiency Customer Growth
IT/Other System Integrity
Depreciation
$243
$280 $287 $263*
* Midpoint of provided guidance range
Note: Capital expenditures include accruals and any adjustments in the fiscal year.
Page 25
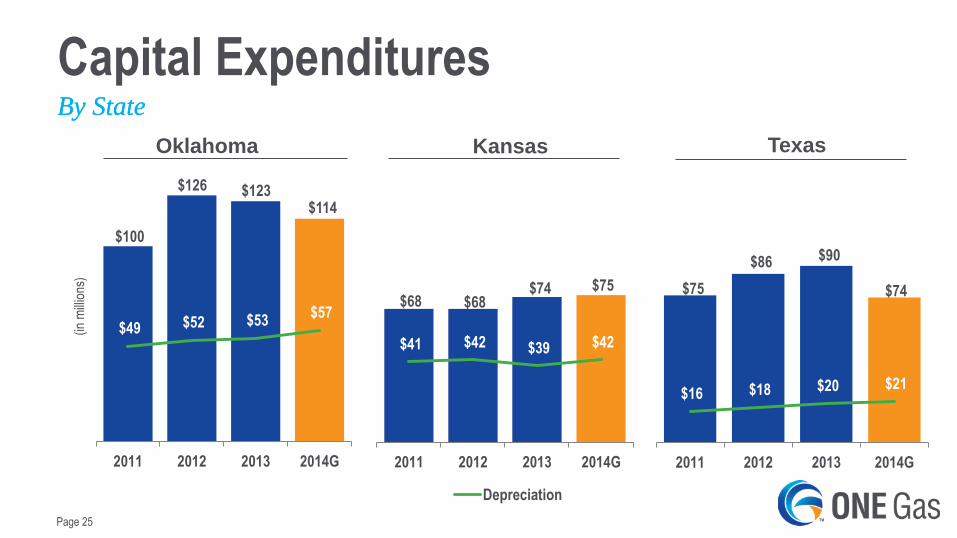
Capital Expenditures By State
$100
$126 $123 $114
$49 $52 $53 $57
2011 2012 2013 2014G
(in m
illio
ns)
Oklahoma
$68 $68 $74 $75
$41 $42 $39 $42
2011 2012 2013 2014G
Kansas
Depreciation
By State
$75
$86 $90
$74
$16 $18 $20 $21
2011 2012 2013 2014G
Texas
Page 26
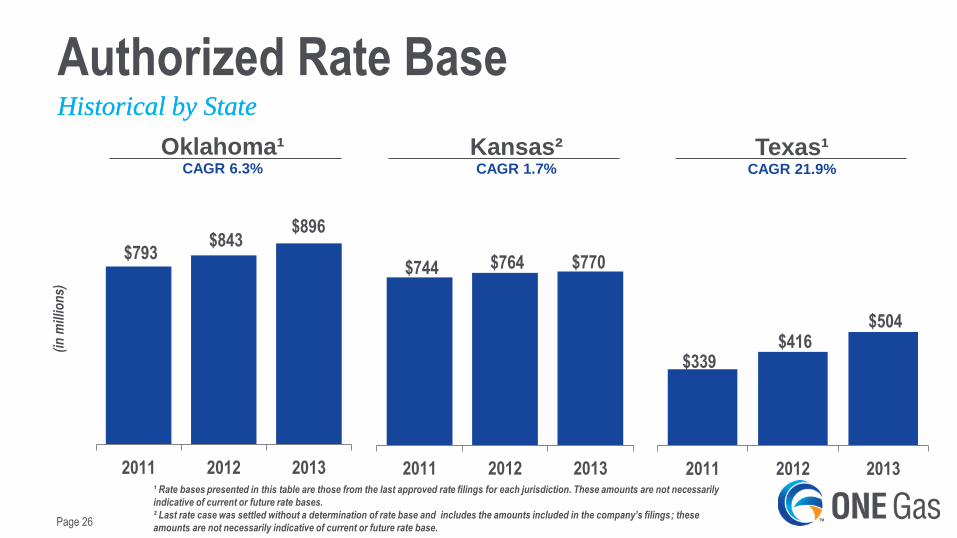
Authorized Rate Base Historical by State
$793 $843
$896
2011 2012 2013
(in
mill
ion
s)
Oklahoma¹ CAGR 6.3%
$744 $764 $770
2011 2012 2013
Kansas² CAGR 1.7%
Historical by State
$339 $416
$504
2011 2012 2013
Texas¹ CAGR 21.9%
¹ Rate bases presented in this table are those from the last approved rate filings for each jurisdiction. These amounts are not necessarily
indicative of current or future rate bases.
² Last rate case was settled without a determination of rate base and includes the amounts included in the company’s filings; these
amounts are not necessarily indicative of current or future rate base.

Page 27
Heating Degree Days First Quarter 2014
Three months ended March 31,
Normal 2014 2013 Variance to
Normal (%)
Variance to
Last Year (%)
Oklahoma Natural Gas 1,803 2,142 1,901 18.8 12.7
Kansas Gas Service 2,502 2,879 2,570 15.1 12.0
Texas Gas Service 997 984 1,053 (1.3) (6.6)
Total 5,302 6,005 5,524 13.3 8.7
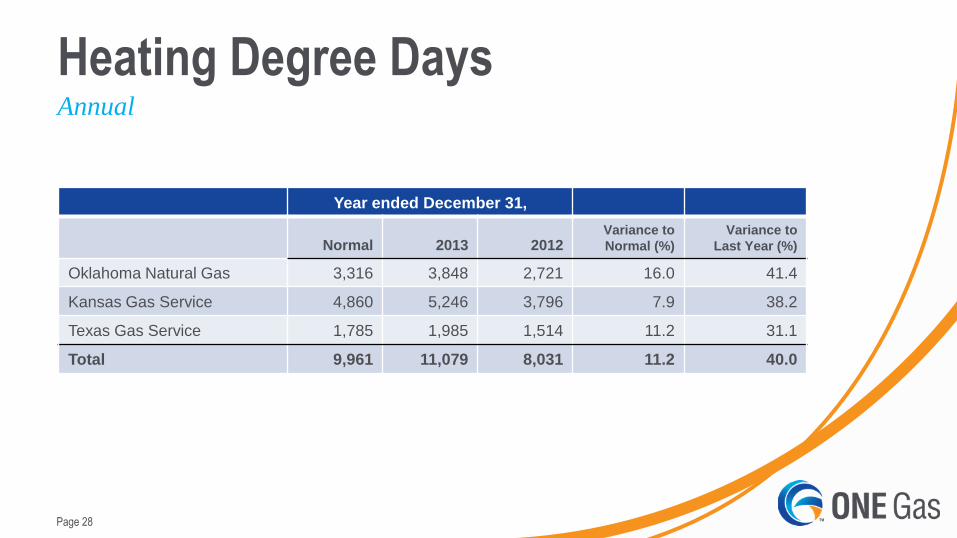
Page 28
Heating Degree Days
Year ended December 31,
Normal 2013 2012 Variance to
Normal (%)
Variance to
Last Year (%)
Oklahoma Natural Gas 3,316 3,848 2,721 16.0 41.4
Kansas Gas Service 4,860 5,246 3,796 7.9 38.2
Texas Gas Service 1,785 1,985 1,514 11.2 31.1
Total 9,961 11,079 8,031 11.2 40.0
Annual

Page 29
Customer and Asset Mix Key Statistics as of Dec. 31, 2013
Kansas Oklahoma Texas Total
Average Number of Customers 632,638 847,023 634,251 2,113,912
Number of Employees 1,000 1,100 700 3,100*
Miles of Service Lines 8,000 4,600 5,700 18,300
Distribution – Miles 11,400 18,200 9,600 39,200
Transmission – Miles 1,600 800 400 2,800
High Density Cities Kansas City,
Topeka, Wichita Oklahoma City, Tulsa Austin, El Paso
7 cities make up the
majority of customers
Percentage of Customers in
Metropolitan Areas 59% 81% 75% 73%
Market Share - Customers Served 69% 87% 14%
*Includes corporate employees
Page 30
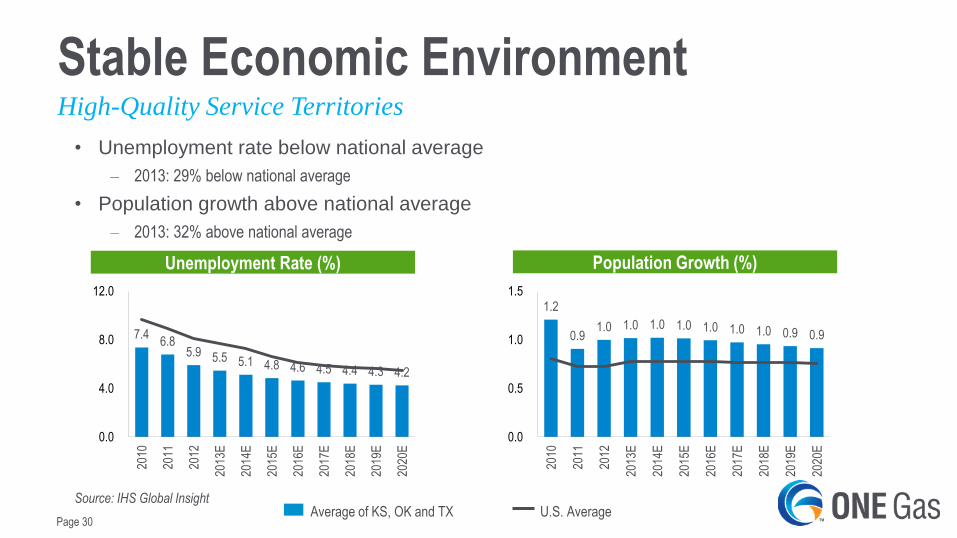
Stable Economic Environment High-Quality Service Territories
• Unemployment rate below national average
– 2013: 29% below national average
• Population growth above national average
– 2013: 32% above national average
Unemployment Rate (%) Population Growth (%)
Average of KS, OK and TX U.S. Average Source: IHS Global Insight
7.4 6.8
5.9 5.5 5.1 4.8 4.6 4.5 4.4 4.3 4.2
0.0
4.0
8.0
12.0
2010
2011
2012
2013
E
2014
E
2015
E
2016
E
2017
E
2018
E
2019
E
2020
E
1.2
0.9 1.0 1.0 1.0 1.0 1.0 1.0 1.0 0.9 0.9
0.0
0.5
1.0
1.5
2010
2011
2012
2013
E
2014
E
2015
E
2016
E
2017
E
2018
E
2019
E
2020
E

Page 31
Cost of Gas
• Actual costs of the commodity, transportation and storage of natural gas are passed through to customers without markup
– Natural gas used in operations is recovered in “Purchased Gas” or “Cost of Gas” riders
• Cost of Gas component of bad debts is included in cost of gas
• No direct commodity risk to ONE Gas divisions
• 52 Bcf of natural gas storage leased for 2014/2015 heating season
– 17 Bcf in storage at Mar. 31, 2014
• Purchased 189 Bcf of natural gas in 2013
Passed Through to Customers

Page 32
Compressed Natural Gas (CNG)
• Currently operate 27 fueling stations accessible to the public
• Currently providing supply to 39 retail and 31 private CNG stations
• Increased CNG volumes 45% between 2013 and 2014
• Supporting industry efforts to encourage development of more vehicle options by car and truck
manufacturers
• Industry – Increased interest in CNG for transportation, particularly by fleet operators
– Tax incentives further contribute to positive economics
– Increased industry investments in fueling stations
• Benefits – Use of CNG increases load
• One vehicle is equivalent to one home
• One pickup truck is equivalent to two homes
• One refuse truck is equivalent to 12 homes
• One transit bus is equivalent to 25 homes
• Incremental margins from CNG demand could mitigate residential rate increases, enhancing competitive position
• Home-fueling technology innovations could be a game changer
Current Environment

Page 33
Non-GAAP Reconciliations
ONE Gas has disclosed in this presentation targeted long-term debt-to-EBITDA and EBIT-to-interest
ratios, which are calculated using amounts disclosed in our financial statements in accordance with
generally accepted accounting principles (GAAP) and EBITDA and EBIT amounts that are non-GAAP
financial measures.
Management believes these measures provide useful information to investors as a measure of
financial performance as a stand-alone public company for comparison with peer companies;
however, these calculations may vary from company to company, so the Company’s computations
may not be comparable with those of other companies. Additionally, we have not calculated these
measures for the periods in which we were part of ONEOK.
EBITDA is defined as net income adjusted for interest expense, depreciation and amortization and
income taxes. EBIT is defined as net income adjusted for interest expense and income taxes.
These measures should not be considered in isolation or as a substitute for net income, income from
operations or other measures of financial performance determined in accordance with GAAP.