For Citi Personal Wealth Management Citi Personal Investments

2009 Citi Industrial Manufacturing and Transportation Conference
Ed ArditteSr. Vice President, Strategy & Investor Relationse at o s
George OliverPresident, Tyco Safety Products
November 12, 2009

Tyco_International_SHOW_FILE_FINAL.ppt November 11, 2009
1
Forward-Looking Statements / Safe HarborCertain statements in this presentation are ‘‘forward-looking statements’’ within the meaning of the U.S. Private Securities Litigation Reform Act of 1995. All forward-looking statements involve risks and uncertainties. All statements contained herein that are not clearly historical in nature are forward looking, and the words ‘‘anticipate,’’ ‘‘believe,’’ ‘‘expect,’’ ‘‘estimate,’’ ‘‘project’’ and similar expressions are generally intended to identify forward-looking statements. Any forward-looking statement contained herein, in press releases, written statements or other documents filed with the Securities and Exchange Commission (‘‘SEC’’), or in Tyco’s communications and discussions with investors and analysts in the normal course of business through meetings, webcasts, phone calls and conference calls, regarding expectations with respect to sales, earnings, cash flows, operating and tax efficiencies, product expansion, backlog, the consummation and benefits of acquisitions and divestitures, as well as financings and repurchases of debt or equity securities, are subject to known and unknown risks, uncertainties and contingencies. Many of these risks, uncertainties and contingencies are beyond our control, and may cause actual results, performance or achievements to differ materially from anticipated results, performances or achievements. Factors that might affect such forward-looking statements include, among other things:
overall economic and business conditions;
the demand for Tyco’s goods and services;
competitive factors in the industries in which Tyco competes;
changes in tax requirements (including tax rate changes, new tax laws and revised tax law interpretations);
results and consequences of Tyco’s internal investigations and governmental investigations concerning the Company’s governance, management, internal controls and operations including its business operations outside the United States;
availability of and fluctuations in the prices of key raw materials, including steel and copper;
economic and political conditions in international markets, including governmental changes and restrictions on the ability to transfer capital across borders;
the ability to achieve cost savings in connection with the company’s strategic restructuring and Six Sigma initiatives;
potential further impairment of our goodwill and/or our long-lived assets;
the impact of fluctuations in the price of Tyco common shares;
2
the outcome of litigation and governmental proceedings;
effect of income tax audit settlements;
our ability to repay or refinance our outstanding indebtedness as it matures;
our ability to operate within the limitations imposed by financing arrangements and to maintain our credit ratings;
interest rate fluctuations and other changes in borrowing costs;
other capital market conditions, including availability of funding sources and currency exchange rate fluctuations;
risks associated with the change in our jurisdiction of incorporation from Bermuda to Switzerland, including the possibility of reduced flexibility with respect to certain aspects of capital management, increased or different regulatory burdens, and the possibility that we may not realize anticipated tax benefits;
changes in U.S. and non-U.S. government laws and regulations; and
the possible effects on us of pending and future legislation in the United States that may limit or eliminate potential U.S. tax benefits resulting from Tyco’s jurisdiction of incorporation or deny U.S. government contracts to us based upon Tyco’s jurisdiction of incorporation.
Tyco is under no obligation (and expressly disclaims any obligation) to update its forward-looking statements.
Utilizing Technology and Globalization to Drive Growth
George OliverPresident, Tyco Safety Products es de t, yco Sa ety oducts

Tyco_International_SHOW_FILE_FINAL.ppt November 11, 2009
2
Technology Leadership in the Fire and Security Markets
16 Engineering Centers of Excellence (COE) globally
Technology Spend
4
Excellence (COE) globally
Opened COEs in Shanghai and Bangalore in 2008
Maintained investment spending despite economy
Continued innovation and
$134M $137M$144M $145M
localization of product in emerging markets
2006 2007 2008 2009
An Important Area Of Focus Driving New Products And Services4
IP ServersMetadataAnalysis
Service Vans Tracked by GPS
Remote Diagnostics For Fire Services
On-Site Tech Confers with
Remote Services
Remote Services Tech Diagnoses
Issue & Dispatches
Tracked by GPS
Web-enabled Fire Panel
5
Remote diagnostics, predictive service, and improved first-time fix rate
Drives service revenue in Fire Protection Services
Enhances productivity through more efficient service visits
Fix Potential Problems Before They Occur5

Tyco_International_SHOW_FILE_FINAL.ppt November 11, 2009
3
Utilizing Mobile Network Technology to Improve Communications for Firefighters
2nd Generation of ScottEmergency Management SystemSystem
Patented Mobile Network enables firefighters and Site Commanders to move freely around a fire
Provides critical real-time data to Site Commander
6
Integrates with other Scott safety equipment; ability to locate downed fire fighters
VideoEdge Provides IP-enabled Enterprise Security and Intrusion System
One computer system to manage and control network id d l dvideo recorders, analog and
IP video cameras, and intrusion security devices
Combines video, alert management, and user management in one system
Next generation Windows
7
Next generation Windows technology provides ease of use, better performance, and compatibility with XP, Vista and Windows 7

Tyco_International_SHOW_FILE_FINAL.ppt November 11, 2009
4
Key Actions
Developing local products in China, India, Eastern Europe and other key
Increased Focus on Emerging Markets: Innovation and Localization
, p ymarkets
Investing in local sales / marketing capabilities
Focused on key vertical markets, including:
– Petrochemical, Oil & Gas
8
– Retail
– Marine
– Mining
Developing Localized Products to Penetrate High-Growth Emerging Markets
Fire Detection Life Safety Sensormatic
9
InfoAlarm replaces two existing fire detection panels with a single display
SCBA features a vibration alarm system to warn firefighters when their tank is running low on air
New Mini Hard Tag is a low cost, electronic article surveillance (EAS) multi-use anti-theft device for the India market

Tyco_International_SHOW_FILE_FINAL.ppt November 11, 2009
5
Operational Excellence “Finances” Our Technology Investment
Cost-Out
Ongoing 5% cost-out program annually across all product cost elements
Restructuring
Globalizing manufacturing footprint to low-cost regionsRe-sizing operational structure and aligning organization around key verticals
Pricing
10
Pricing
Continuing to expand strategic pricing initiatives to drive incremental margin improvement
Our Goal Is To Deliver Growth AND Margin
Appendix
Tyco_International_SHOW_FILE_FINAL.ppt November 11, 2009
6
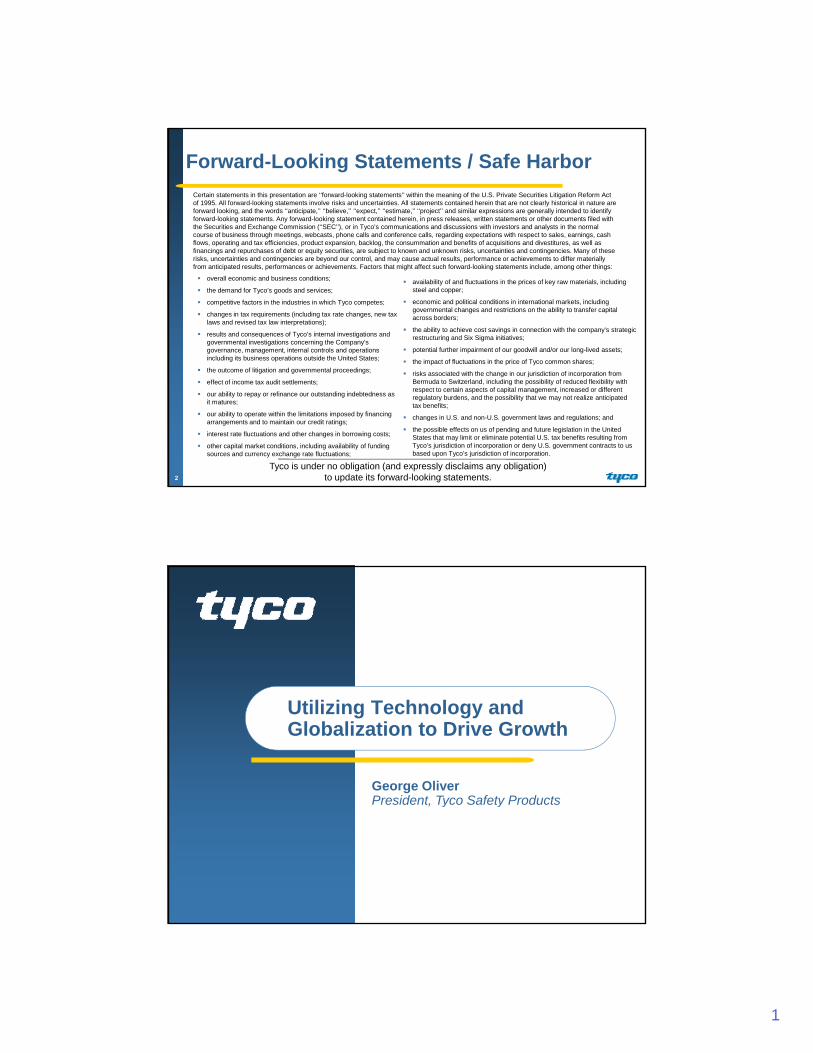
A Diverse Portfolio of Businesses with Strong Brands
Electrical &
ADT $7.0
Flow Control $3.8
Electrical & Metal Products
$1.4
2009 Revenue $17.2B
Fire Protection Services
$3.4
Safety Products $1.6
12
Most Businesses Are Market Leaders
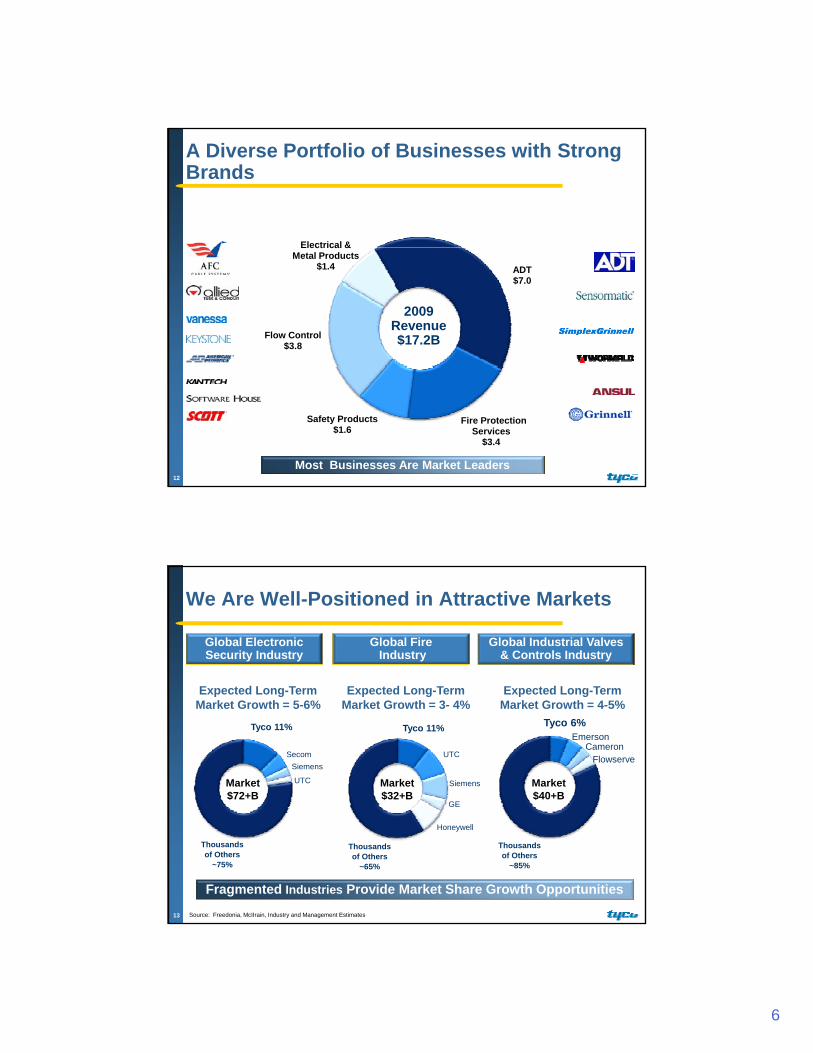
We Are Well-Positioned in Attractive Markets
Global Electronic Security Industry
Global FireIndustry
Global Industrial Valves & Controls Industry
Tyco 11%
SecomSiemens
UTC
Tyco 11%
UTC
Siemens
GE
Tyco 6%Emerson
CameronFlowserve
Market $72+B
Market $32+B
Market$40+B
Expected Long-Term Market Growth = 3- 4%
Expected Long-Term Market Growth = 4-5%
Expected Long-Term Market Growth = 5-6%
GE
Honeywell
13
Thousands of Others
~75%
Fragmented Industries Provide Market Share Growth Opportunities
Thousands of Others
~65%
Thousands of Others
~85%
Source: Freedonia, McIIrain, Industry and Management Estimates
Tyco_International_SHOW_FILE_FINAL.ppt November 11, 2009
7
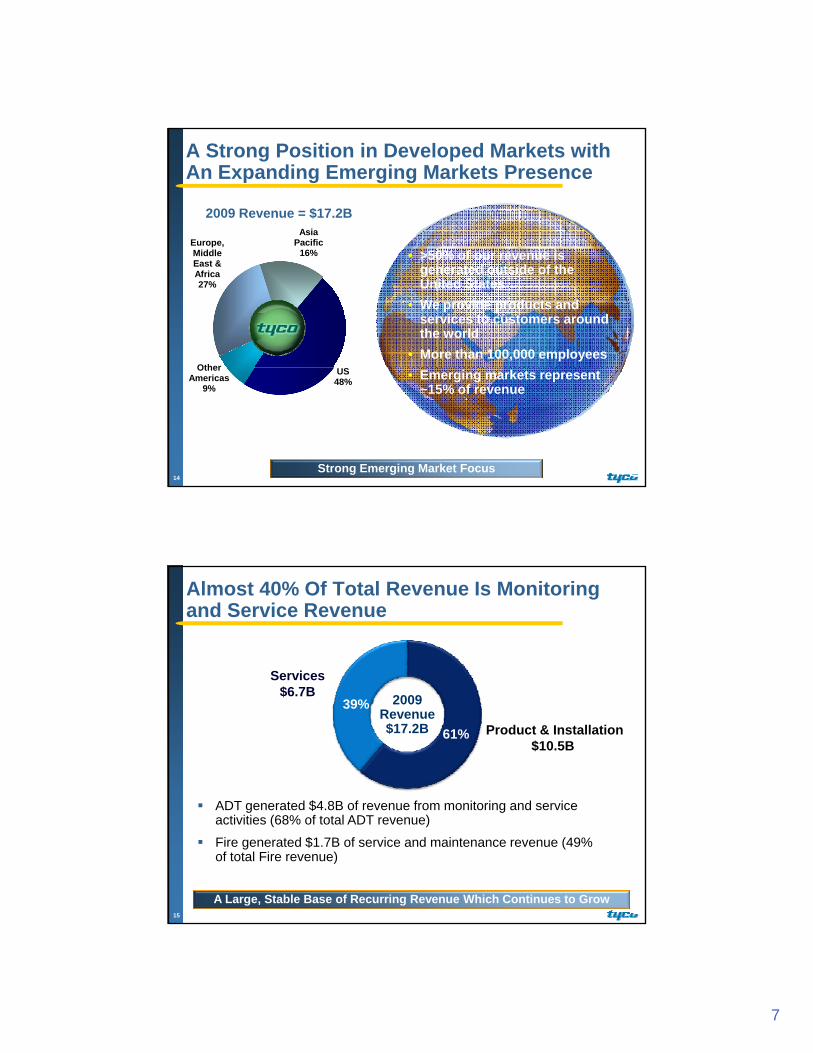
A Strong Position in Developed Markets with An Expanding Emerging Markets Presence
2009 Revenue = $17.2B
Europe, Asia
Pacific
Other
Middle East & Africa27%
16% • >50% of our revenue is generated outside of the United States
• We provide products and services to customers around the world
• More than 100,000 employees
14Strong Emerging Market Focus
US48%
Other Americas
9%• Emerging markets represent
~15% of revenue
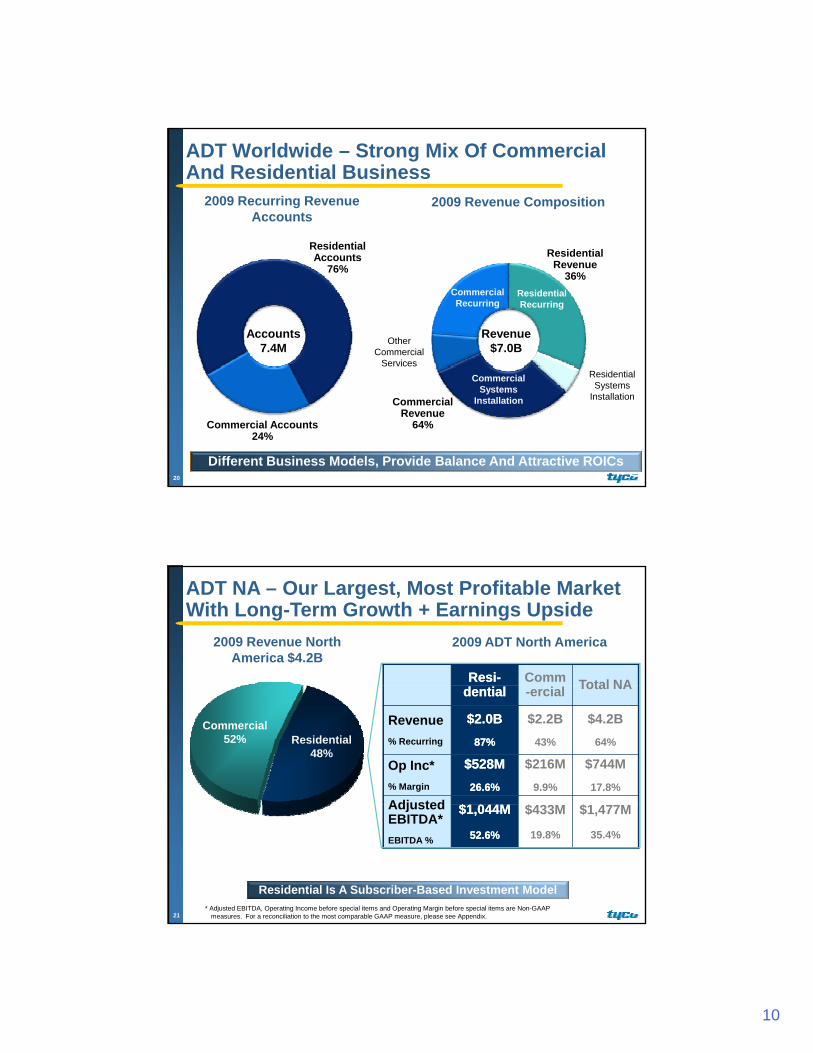
Almost 40% Of Total Revenue Is Monitoring and Service Revenue
Services
ADT generated $4 8B of revenue from monitoring and service
Product & Installation$10.5B
$6.7B 39%
61%
2009 Revenue$17.2B
15
ADT generated $4.8B of revenue from monitoring and service activities (68% of total ADT revenue)
Fire generated $1.7B of service and maintenance revenue (49% of total Fire revenue)
A Large, Stable Base of Recurring Revenue Which Continues to Grow

Tyco_International_SHOW_FILE_FINAL.ppt November 11, 2009
8
ADT Worldwide at a Glance
2009 Revenue of $7.0B – 64% Commercial, 36% Residential– 55% Recurring Revenue
7.4M recurring revenue customersGlobal provider of residential and commercial security systemsMarket leadership positionBroad geographic reachoad geog ap c eac– 60% North America, 26% EMEA, 14%
ROW– Over 1,000 locations in 40 countries
16
ADT Worldwide – More Than Two Thirds of Revenue is Service Related
Service 68%
2009 ADT Worldwide Revenue Composition
Commercial 64%
Revenue$7.0B
~40% is Recurring
Revenue$7.0B
17
Product & Installation32%
85% is Recurring
Residential36%
Large Base Of Stable Recurring Revenue

Tyco_International_SHOW_FILE_FINAL.ppt November 11, 2009
9
Service Revenue is Predictable and Has Been Growing
Recurring revenue represents
Service Revenue ($B) Recurring Revenue
$3.6 $3.6 $3.7 $4.0 $3.9
$0.9 $0.9 $1.0 $1.1 $0.9
$4.5 $4.5 $4.7$5.1 $4.8
more than 80% of service revenue
14 consecutive quarters of organic revenue growth
– 4.2% organic revenue growth in 4th quarter
2005 2006 2007 2008 2009
Contractual Recurring Other Service
18
Growth in all geographic regions
Recurring revenue generates higher margins
Solid Progress Globally
Product & Installation Revenue...
Govt7%
Other 4%
2009 System Installation Revenue $2.2B
Asia/Pacific ROW 4%
Retailer 24%
Residential 12%
Banking 7%
7%
Diverse End
Markets EMEA36%
7%
GeographicMix
Middle Market 30%
Comm/Ind16%
19
North America 53%
… Is Diversified Across End Markets And Geographies
Tyco_International_SHOW_FILE_FINAL.ppt November 11, 2009
10
ADT Worldwide – Strong Mix Of Commercial And Residential Business
Residential
2009 Recurring Revenue Accounts
2009 Revenue Composition
Residential Accounts
76%
Accounts 7.4M
Revenue$7.0B
Residential Revenue
36%
Other Commercial
Services
Residential Recurring
Commercial Recurring
20
Commercial Accounts24%
Commercial Revenue
64%
Residential Systems
Installation
Commercial Systems
Installation
Different Business Models, Provide Balance And Attractive ROICs
2009 Revenue North America $4.2B
2009 ADT North America
ResiResi-- Comm Total NA
ADT NA – Our Largest, Most Profitable Market With Long-Term Growth + Earnings Upside
Residential48%
Commercial52%
dentialdential -ercial Total NA
Revenue% Recurring
$2.0B$2.0B87%87%
$2.2B43%
$4.2B64%
Op Inc*% Margin
$528M$528M26.6%26.6%
$216M9.9%
$744M17.8%
Adjusted $1 044M$1 044M $433M $1 4 M
21* Adjusted EBITDA, Operating Income before special items and Operating Margin before special items are Non-GAAP
measures. For a reconciliation to the most comparable GAAP measure, please see Appendix.
Adjusted EBITDA*EBITDA %
$1,044M$1,044M
52.6%52.6%
$433M
19.8%
$1,477M
35.4%
Residential Is A Subscriber-Based Investment Model

Tyco_International_SHOW_FILE_FINAL.ppt November 11, 2009
11
Account GrowthR t
Definition Focus Areas
Customer additionsMulti-channel strategy
Robust sales productivity
In The Subscriber-Based Model, Performance Is Driven By Four Key Factors
Rate
SAC(Subscriber
Acquisition Cost)
Robust sales productivity initiatives
Monthly revenue generated per account
Increasing RPU through expansion of offerings
Costs to establish customer (e.g. install, sales/marketing)
Reducing product and installation costs
Balancing Direct and Dealer
RPU(Revenue Per User)
22
Acquisition Cost)
DisconnectRate
( g , g) Balancing Direct and Dealer models
% of recurring revenue lostDifferentiated customer service performance
Installed base risk modeling
Managing The Relationship Throughout The Customer Lifecycle
ADT NA Continues To Grow Its Residential Customer Base And Revenue Per User
North American Residential Account Growth
Monthly Revenue per New Residential Customer
4.1M 4.2M 4.3M 4.4M
$24$26$28$30$32$34$36$38$40
23
2006 2007 2008 2009 $222003 2004 2005 2006 2007 2008 2009
Base Burglar Alarm (B.A.) QSP MaintenanceSmoke / Heat / CO Flood / TempTwo Way Voice Cellguard (Cellular Backup)VideoView Other
Continued Growth Despite Difficult Environment

Tyco_International_SHOW_FILE_FINAL.ppt November 11, 2009
12
Strong Performance Improvements Yield An Attractive Economic Model
Cash Economic Model
nue
Inst
all R
even
Upf
ront
ve
stm
ent
crib
er A
cqui
sitio
n C
ost
24
0 1 2 3 4 5 6 7 8 9 10
YearsRevenueOperating CostsCumulative Cash FlowCash Break - Even Point
UIn
v
Subs
c
We Expect Our Expansion Into Interactive Services To Fuel Continued Growth In RPU
Interactive Services2010+
Security IndustryPast 20 Years
Intrusion Detection
Fire/Smoke Detection
Security Gateway Hub Connects Alarm Panel & Interactive Services PeripheralsFire/Smoke Detection
Carbon Monoxide Detection
Flood Detection
Interactive Services PeripheralsBroadband / GSM (cell)Security Control / Digital Picture FramePremise Control and Live Camera FeaturesInternet Widgets (Traffic and Weather)Z-way: Lamp Modules, Thermostats, Locks
25

Tyco_International_SHOW_FILE_FINAL.ppt November 11, 2009
13
In North America, Our Commercial Business Contributes More Than Half Of Total Revenue
2009 Revenue North America $4.2B
2009ADT North America
Resi-d ti l
CommCommi li l
Total NAdential --ercialercial NA
Revenue% Recurring
$2.0B87%
$2.2B$2.2B43%43%
$4.2B64%
Op Inc*% Margin
$528M26.6%
$216M$216M9.9%9.9%
$744M17.8%
Adjusted $1 004M $433M$433M $1 477M
Residential48%
Commercial52%
26* Adjusted EBITDA, Operating Income before special items and Operating Margin before special items are Non-GAAP
measures. For a reconciliation to the most comparable GAAP measure, please see Appendix.
Adjusted EBITDA*EBITDA %
$1,004M
52.6%
$433M$433M
19.8%19.8%
$1,477M
35.4%
Commercial Emphasizes System Sales, But Has A Solid Recurring Base
2009 North America Commercial Revenue $2.2B
Other
Systems Installation Revenue by Vertical
Systems Installation Revenue Is Diversified Across End Markets
L i tiHealthcare
EducationOther
11%
47%42%Recurring
Systems Installation
ServicesRetailer
Banking
Government
Small BusinessLogistics Other
27
Diverse Base Provides Balance, Focused On Growing Key Verticals
Comm / Industrial
Other/Middle Market

Tyco_International_SHOW_FILE_FINAL.ppt November 11, 2009
14
ADT Europe, Middle East & Africa – Focusing The Business To Improve Operating Margin
2009 EMEA Revenue $1.8B
ADT ADT NA
2009 ADT EMEA
UK$0.6B
Continental Europe$1.0B
EMEAEMEA Comm
Revenue% Recurring
$1.8B$1.8B38%38%
$2.2B43%
Op Inc*% Margin
$91M$91M5.0%5.0%
$216M9.9%
Adjusted
28
Middle East & Africa$0.2B
* Adjusted EBITDA, Operating Income before special items and Operating Margin before special items are Non-GAAP measures. For a reconciliation, please see Appendix.
Adjusted EBITDA*EBITDA %
$166M$166M
9.1%9.1%
$433M
19.8%
Managing Cost Structure To Current Market Realities
* Adjusted EBITDA, Operating Income before special items and Operating Margin before special items are Non-GAAP measures. For a reconciliation to the most comparable GAAP measure, please see Appendix.
ADT Rest of World – Strong Revenue Growth And Solid Margins
2009 Rest of World Revenue $1.0B
ADTADT NA
2009 ADT ROW
Latin America$0.3B
Asia Pacific$0.7B
ADT ADT ROWROW
NA Comm
Revenue% Recurring
$1.0B$1.0B48%48%
$2.2B43%
Op Inc*% Margin
$120M$120M11.9%11.9%
$216M9.9%
29* Adjusted EBITDA, Operating Income before special items and Operating Margin before special items are Non-GAAP
measures. For a reconciliation, please see Appendix.
Adjusted EBITDA*EBITDA %
$197M$197M
19.5%19.5%
$433M
19.8%
Good Returns…Focused On Growth* Adjusted EBITDA, Operating Income before special items and Operating Margin before special items are Non-GAAP
measures. For a reconciliation to the most comparable GAAP measure, please see Appendix.

Tyco_International_SHOW_FILE_FINAL.ppt November 11, 2009
15
2009 Revenue of $3.8B
4 consecutive years of solid operating margin performance
Flow Control At A Glance
performance
Well positioned in large, fragmented markets
Global leader in valves, controls and related products
Well known market-leading brands
Geographic diversity – 80% of revenue t d t id th U Sgenerated outside the U.S.
End market diversity – serves a broad range of industries and customers
Strong backlog
30
AmericasAmericas
Asia2009 Revenue
$568M
Lines of Business:
Asia2009 Revenue
$568M
Lines of Business:
EMEA2009 Revenue
EMEA2009 Revenue
Flow Control – A Strong Global/Business
2009 Revenue $996M
Lines of Business:Valves & Automation,
Heat Tracing
2009 Revenue $996M
Lines of Business:Valves & Automation,
Heat Tracing Pacific2009 Revenue
$742M
Li f B i
Pacific2009 Revenue
$742M
Li f B i
Lines of Business:Valves & Automation,
Heat Tracing
Lines of Business:Valves & Automation,
Heat Tracing
$1,544M
Lines of Business:Valves & Automation, Water, Heat Tracing
$1,544M
Lines of Business:Valves & Automation, Water, Heat Tracing
31
Lines of Business:Water, Valves &
Automation
Lines of Business:Water, Valves &
Automation
Approximately 80% of Revenue Is From Outside the U.S.

Tyco_International_SHOW_FILE_FINAL.ppt November 11, 2009
16
Flow Control – Business Mix
Valves &Thermal MRO*/
S i
2009Revenue
$3.8B60%60%
40%40%
Valves & Controls
Water
2009Revenue
$3.8B59%59%
26%26%
15%15%
Project
Service
3232
Balanced Revenue Mix
* MRO maintenance, repair and operations
Project
Flow Control—Three Business Platforms
2009 Revenue: ~$2.3BOrganic Growth*: 4%
2009 Revenue: ~$1.0BOrganic Growth*: (15)%
2009 Revenue: ~$550MOrganic Growth*: (3)%
Water & Environmental Systems
Thermal Controls
Valves & Controls
Global leader in heat-tracing solutionsIndustrial, global project servicesCommercial and residential products for floor warming, snow melting and de-icing
Strong regional presence with products and services for water systemsDelivery, transport, storage and treatment of waterGovernment, residential, agriculture and industrial use—from dam to the
World’s largest provider of flow control products and servicesProducts include valves, actuators and controlsDelivery and control of liquids, powders and gases for energy and processing
Organic Growth : 4% Organic Growth : (15)% Organic Growth : (3)%
33
g ghousehold
gy p gindustries
* Organic Revenue is Non-GAAP measures. For a reconciliation to the most comparable GAAP measure, please see Appendix.

Tyco_International_SHOW_FILE_FINAL.ppt November 11, 2009
17
Flow Control – Balanced Across End Markets
Transmission & Distribution
Other / Industrial
Distribution
Process & Control
EnvironmentalPetrochemical
Chemical/Pharma
Mining
Food & Beverage
End Markets Served
Process Process -- 30%30% Water Water -- 31%31%
34
Oil & GasPower
Provides Revenue & Earnings Diversification
Energy Energy -- 39%39%
Based on 2008 revenue
Valves & Controls - Well Positioned in a Large and Fragmented Market
Competitive Position
O f th b d t tf li f
Valves & ControlsMarket Revenue ~ $40B
Next 8
Tyco
Others
One of the broadest portfolios of valves, actuators, controls and associated services
Sales and service locations across the globe
Strong global project execution bilit
35 Source: McIlvaine, Management Estimates
capability
Serve multiple industries which leverages our knowledge and provides growth and diversificationTyco
2009 Revenue: ~$2.3B

Tyco_International_SHOW_FILE_FINAL.ppt November 11, 2009
18
A World Leader in Products & Services That Control the Flow of Fluids and Gases in Wide Range of Environments
Focus on premium k t 1/3 f t t l
Butterfly Valves
Gate Valves
Valves & Controls - Flow Control’s Largest Business
Wide range of highly i d d tmarket ~1/3 of total
addressable market
Proven technology and trusted brands
Strong technical support with deep applications knowledge
Ball Valves
Check Valves
Safety Relief Valves
Valve P iti
engineered products– Cryogenic
conditions(-425° F)
– Extreme heat (1,500° F)
– High pressure and low pressureR t i l t d
36
knowledge
Large installed base with demonstrated experience Control Valves
Valve Actuators
Check Valves Positioners & Controls
– Remote, isolated locations
Tyco Water – Well Positioned with Strong Presence in Asia Pacific and EMEA
Asia PacificRegional leader across three broad segments
Global Water
Tyco
Top 2
g– Transmission & distribution– Process & control– Environmental & water
managementExpansive line of products and services built around core of pipes and valves
Tyco
MarketRevenue
~$25BNext 6
Tyco Flow
Control
Others
37
pipes and valves
Europe, Middle East and Africa
Portfolio focused on hydrants, valves, fittings and couplings
EMEA
U.S.
Asia / Pacific
Source: McIlvaine, Company Reports Management Estimates
2009 Revenue ~$1.0B

Tyco_International_SHOW_FILE_FINAL.ppt November 11, 2009
19
Municipal and industrial water
treatment plants
Water transmission
networks
Irrigation systems
Water pollution
monitoring
Municipal and industrial
wastewater treatment plants
Storage systems
Water & Environmental Systems- A Diverse Set of Products and Services
Wastewater transmission
networks
Water distribution Hydro power
generation
Emissions monitoring
38
ValvesPipesFittings,
flanges andcouplings
Pumps Meters and instruments
Tanks Hydrants
Broad Capabilities And Proven Technology
Total Sales ($M)
Pacific pipeline
Tyco Water - Strong Historical Growth Combined with Project Spikes
Pacific pipeline business doubled between 2005 and 2007 due to strong project activity
Pacific pipeline business growth
CAGR1.0%
CAGR12.5%
$983$816
$577 $600
39
2005 2006 2007 2008 2009Pacific Pipe Business Water (ex Pacific Pipe)
gslowed down in 2008
Challenging Revenue Comparison In 2009

Tyco_International_SHOW_FILE_FINAL.ppt November 11, 2009
20
Thermal Controls- Well Positioned in a Large and Fragmented Market
Competitive Position
Global sales and service locations
V ll iti d t t
Heat Tracing Products & Services
Market Revenue ~$15B
Next 4*
Tyco
OthersOthers
Very well positioned to execute complex global projects
– Track record of successful project execution
– Demonstrated ability to reduce customers’ total installed cost
40 Source: McKinsey, Management Estimates
Leveraging recognized brand into full turnkey solutions
Ability to offer “Warm Pipe” warranty for turnkey projectsTyco
2009 Revenue: ~$550M
* Next 4 industrial product providers excluding broadline engineering houses
Steam Powered & Electrically Powered Heat Delivery Systems
Pipe, Vessel & Tank Thermal Insulation
Tank Heating Systems
Pipe and Tank Corrosion Prevention
Thermal Controls—A Broad Set of Industrial Heat Management Products and Services
Heat Tracing Power Distribution Systems
Fire Performance
Systems
Leak Detection Systems
Ramp Heating
Heat Traced Tubing Bundles and Instrument Winterization
Temperature Control and Monitoring Systems
Outdoor Pipe and Valve Freeze Protection
Mineral Insulated and Polymeric cables
41

Tyco_International_SHOW_FILE_FINAL.ppt November 11, 2009
21
Flow Control—Backlog
Backlog declined 1% in Q4, excluding currency, on a quarter sequential basis
Total Backlog ($M)
$2,083
Order rates slowed in 2009; signs of order stabilization
– Year-over-year Q4 orders down 18%, excluding currency
$616$771
$1,115
$1,579$1,698
42
– Sequentially Q4 orders grew 11%, excluding currency
2004 2005 2006 2007 2008 2009
Valves Water Thermal
$616
Fire Protection Services at a Glance
2009 Revenue of $3.4B; 49% service revenue
Market-leading industry position
Strong global presence
Broad offering of fire products and services
Diversified customer base
Direct contracting and service provider
Highest ROIC* in Tyco…over 100% excluding goodwill
43* Industry and Management Estimates*ROIC is a non-GAAP measure. Please see Appendix for a description of how ROIC is calculated.

Tyco_International_SHOW_FILE_FINAL.ppt November 11, 2009
22
Fire – Almost Half Of Total Revenue Is Service
2009 Revenues
ServiceSuppression
$0 5BService$1.68B
Sprinkler$1.1B
$0.5B
$3.4B $3.4B
49%49%
51%51%
44
Installation$1.75B
Electronic$1.8B
Service Revenue is More Resilient
SimplexGrinnell is Our Largest and Most Profitable Business
Rest Of WorldRest Of World
EMEA
17%17%
25%25%
58%58%
13%13%
79%79%
8%8%Revenue
$3.4BOp Inc* $293M
45
North America(SimplexGrinnell)
79%79%
Leverage North America Best Practices
* Operating Income before special items is a Non-GAAP measure. For a reconciliation to the most comparable GAAP measure, please see Appendix.

Tyco_International_SHOW_FILE_FINAL.ppt November 11, 2009
23
Fire - Product Lines and End Markets
InstitutionalFire alarms, mass notification,
End MarketsElectronic
Schools/UniversitiesHospitalsDefenseGovernment buildingsAirports
CommercialHotelsRetailerOffice buildingsShopping centers
hospital nurse call, integrated systems
Sprinklers, engineered solutions, special hazards, water spray foam, gas systems
Sprinkler
46
Shopping centersFinancial institutions
IndustrialOil and gasManufacturingMarine/OffshoreMining
Fire extinguishers, specialty systems
Suppression
Safety Products At A Glance
2009 Revenue of $1.6B
Market-leading provider of Fire Suppression, Electronic Security & Life Safety Products
Well known brands
Strong market position with leading technologies
Attractive markets with long-term growth and fit t iti
47
profit opportunities
Deep technology pipeline
Focus on emerging market growth

Tyco_International_SHOW_FILE_FINAL.ppt November 11, 2009
24
Broad-Based Fire and Security Product Platforms
Fire Suppression Electronic Security Life Safety
48
Water and chemical fire suppressions systems
– Water sprinkler heads– Fire extinguishers
Intrusion security Access controlVideo management systemsElectronic fire detectionRetail anti-theft electronic article surveillance
Personal protective equipment
– Breathing PAKThermal imaging device
Safety Products Participates in Attractive Markets
Life Safety
Fire Suppression & Building Products
Expected Market Expected Market
Electronic Security
Expected MarketpGrowth: 3-5%
pGrowth: 3%
pGrowth 4-5%
Market ~4.0B
Market ~13.4B
Market ~5.4B
Tyco 31% Tyco 3% Tyco 7%
49
Tyco 2009Revenue: $314M
Organic Growth*: (12)%
Tyco 2009 Revenue: $882M
Organic Growth*: (15)%
Tyco 2009Revenue: $356M
Organic Growth*: (12)%
Source: Frost & Sullivan, JP Freeman, Freedonia and Management Estimates* Organic revenue is a Non-GAAP measure. For a reconciliation to the most comparable GAAP measure, please see Appendix.
FY09 Operating Margin Impacted by 14% Organic Revenue Decline

Tyco_International_SHOW_FILE_FINAL.ppt November 11, 2009
25
Electrical & Metal Products At-A-Glance
2009 Revenue of $1.4B
Generates strong operating margin and strong cash Generates strong operating margin and strong cash flow over the cycle
Market leader in steel tubes and pipes, armored cable and electrical conduit products
Strong, well-known brands
Processes approximately one million tons of steel per year
50
per year
Profit is dependent on metal spreads – primarily steel and copper
Currently being impacted by historically low volume
Markets Served Are Large
Tyco 32% Tyco 9% Tyco 23%
Electrical Mechanical Standard Pipe
NAMarket$3.5B
NAMarket$3.9B
NAMarket$1.8B
Tyco 2009Revenue: $194M
Tyco 2009 Revenue: $783M
Tyco 2009Revenue: $415M
51
Key Performance DriversSteel and copper costsProduct pricingCommercial and residential construction activityChanges in fire codes and regulations requiring sprinklers
Source: Preston Pipe Reports and Management Estimates
Tyco_International_SHOW_FILE_FINAL.ppt November 11, 2009
26
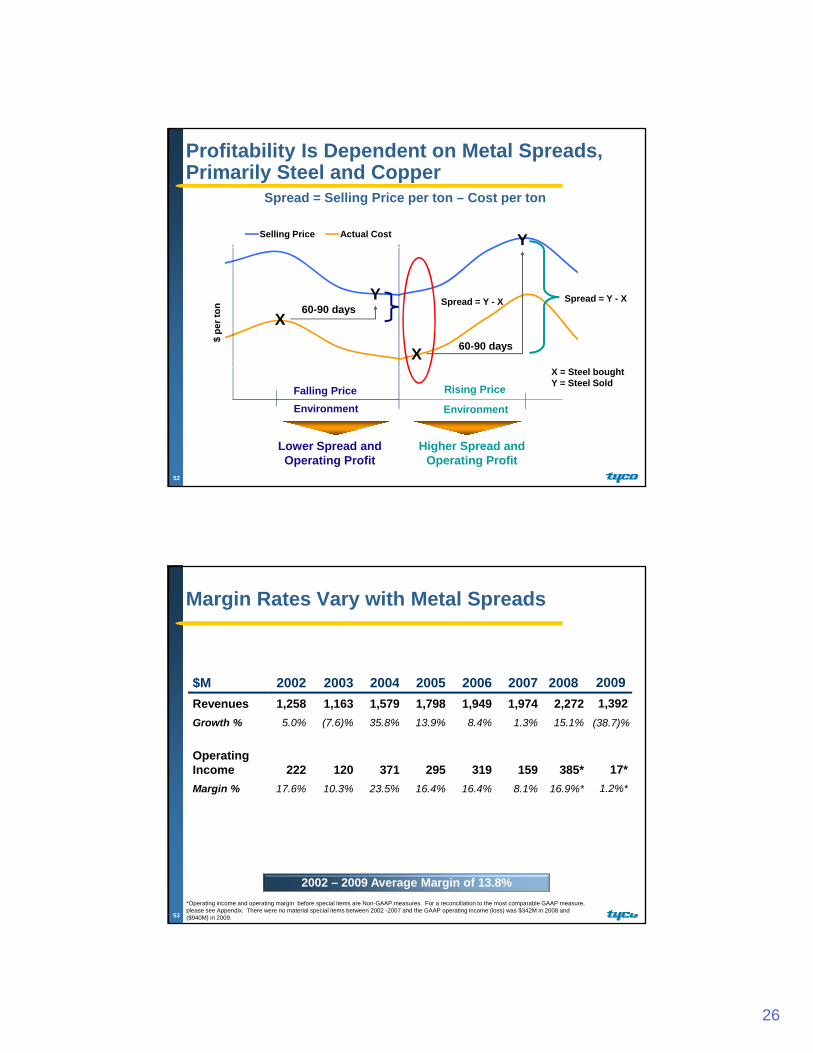
Profitability Is Dependent on Metal Spreads, Primarily Steel and Copper
Selling Price Actual Cost Y
Spread = Selling Price per ton – Cost per ton
60-90 daysX
Y
$ pe
r ton
60-90 daysX
Spread = Y - X Spread = Y - X
52
Falling PriceEnvironment
Lower Spread and Operating Profit
Rising Price
Environment
Higher Spread and Operating Profit
X = Steel boughtY = Steel Sold
Margin Rates Vary with Metal Spreads
200820072006200520032002 2004$M 2009
16.9%*
385*
15.1%
2,2722008
8.1%
159
1.3%
1,9742007
16.4%
319
8.4%
1,9492006
16.4%
295
13.9%
1,7982005
10.3%
120
(7.6)%
1,1632003
17.6%
222
5.0%
1,2582002
23.5%
371
35.8%
1,5792004
Margin %
Operating Income
Growth %
Revenues$M
1.2%*
17*
1,3922009
(38.7)%
53
2002 – 2009 Average Margin of 13.8%*Operating income and operating margin before special items are Non-GAAP measures. For a reconciliation to the most comparable GAAP measure, please see Appendix. There were no material special items between 2002 -2007 and the GAAP operating income (loss) was $342M in 2008 and ($940M) in 2009.

Tyco_International_SHOW_FILE_FINAL.ppt November 11, 2009
27
Non-GAAP Reconciliations
We Generate Strong Incremental Returns on Invested Capital
ADT Worldwide
2009 Return on Invested Capital*
Electrical & Metal Products
Safety Products
Flow Control
Fire Protection Services
55
ROIC ROIC (Excluding Goodwill)
0% 20% 40% 60% 80% 100% 120% 140% 160%
Total Tyco
*ROIC is a non-GAAP measure. Please see following tables for a description of how ROIC is calculated.

Tyco_International_SHOW_FILE_FINAL.ppt November 11, 2009
28
Return on Invested Capital(Including Goodwill)
$M 2009Op Inc*
After Tax
2009 Avg Invested
Capital2009ROICp
ADT Worldwide $805 $8,206 10%
Fire Protection $247 $1,540 16%
Flow Control $465 $3,228 14%
Safety Products $193 $2,437 8%
El & M t l $14 $994 1%Elec. & Metal $14 $994 1%
Corporate ($378) ($256) NM
Total $1,346 $16,149 8%
56 *Operating income is before special items, which is a Non-GAAP measure. For a reconciliation, please see following tables.
Return on Invested Capital(Excluding Goodwill)
2009 2009 Op Inc* Avg Invested 2009
After Tax Capital ROIC
$M
After Tax Capital ROIC
ADT Worldwide $805 $3,733 22%
Fire Protection $247 $168 147%
Flow Control $465 $1,344 35%
Safety Products $193 $834 23%
Elec & Metal $14 $552 3%
57 *Operating income is before special items, which is a Non-GAAP measure. For a reconciliation, please see following tables.
Elec. & Metal $14 $552 3%
Corporate ($378) ($232) NM
Total $1,346 $6,399 21%

Tyco_International_SHOW_FILE_FINAL.ppt November 11, 2009
29
FY09 Organic Revenue Growth
$M FY08
RevenuesAcq/Disp& Other FX
Organic Growth
FY09 Revenues Organic %
ADT Worldwide 7,731 152 (590) (278) 7,015 (3.6)%
Flow Control 4,418 23 (462) (129) 3,850 (2.9)%
Fire Protection 3,839 (18) (294) (99) 3,428 (2.6)%
Electrical & Metal 2,272 (43) (52) (785) 1,392 (34.6)%
Safety Products 1,934 4 (122) (264) 1,552 (13.7)%
58
Corporate & Other 5 - - (5) - N/M
Total 20,199 118 (1,520) (1,560) 17,237 (7.7)%
Q409 Organic Revenue Growth
$M Q4FY08 Revenues
Acq/Disp & Other FX
Organic Growth
Q4FY09 Revenues Organic %
ADT Worldwide 1,981 (4) (79) (99) 1,799 (5.0)%
Flow Control 1,188 3 (57) (124) 1,010 (10.4)%
Fire Protection 1,015 (5) (37) (69) 904 (6.8)%
Electrical & Metal 591 (15) (8) (242) 326 (40.9)%
Safety Products 507 2 (15) (112) 382 (22.1)%
59
Corporate & Other 2 - - (2) - N/M
Total 5,284 (19) (196) (648) 4,421 (12.3)%

Tyco_International_SHOW_FILE_FINAL.ppt November 11, 2009
30
2009 Operating Income Before Special Items
$M
ADT Flow Fire Protection Electrical & Safety CorporateWorldwide Control Services Metal Products Products and Other Revenue
Revenue (GAAP) $7,015 $3,850 $3,428 $1,392 $1,552 - $17,237
IncomeFire Electrical Interest from
ADT Flow Protection & Metal Safety Corporate Operating Income, Other Income Minority ContinuingWorldwide Control Services Products Products and Other Income net Expense, net Taxes Interest Operations
As Reported (GAAP) $233 $518 $68 ($940) ($789) ($577) ($1,487) ($257) ($7) ($78) ($4) ($1,833) ($3.87)
Restructuring and asset impairment charges, net 76 23 45 16 36 9 205 (54) 151 0.32
Restructuring charges in cost of sales and SG&A 5 2 - 7 18 1 33 (11) 22 0.05
Other additional charges resulting from restructuring actions - 5 - 1 9 - 15 (4) 11 0.02
Losses on divestitures 6 4 - (2) - 6 14 (3) 11 0.03
Intangible impairments 22 - - - 42 - 64 (25) 39 0.08
Goodwill impairments 613 - 180 935 913 - 2,641 (41) 2,600 5.47
Diluted EPS from
Continuing Operations
Operating Income
60
Tax items - - - - - - - 3 3 0.01
Legacy legal items - - - - - 114 114 4 118 0.25
Total Before Special Items $955 $552 $293 $17 $229 ($447) $1,599 ($257) ($7) ($209) ($4) $1,122 $2.36
Diluted Shares Outstanding 473 Diluted Shares Outstanding - Before Special Items 475
2008 Operating Income Before Special Items
$M
ADT Flow Fire Protection Electrical & Safety CorporateWorldwide Control Services Metal Products Products and Other Revenue
Previously Reported Revenue (GAAP) $8,017 $4,418 $3,553 $2,272 $1,934 $5 $20,199
Segment Realignment (286) - 286 - - - -
Recasted Revenue (GAAP) $7,731 $4,418 $3,839 $2,272 $1,934 $5 $20,199
IncomeFire Electrical Total Interest from
ADT Flow Protection & Metal Safety Corporate Operating Expense, Other Income Minority ContinuingWorldwide Control Services Products Products and Other Income net Expense, net Taxes Interest Operations
As Previously Reported (GAAP) $910 $618 $321 $342 $284 ($534) $1,941 ($286) ($224) ($335) ($1) $1,095 $2.25
Segment Realignment (4) - 4 - - - - - -
As Reported (GAAP) $906 $618 $325 $342 $284 ($534) $1,941 ($286) ($224) ($335) ($1) $1,095 $2.25
Restructuring and asset impairment charges, net 93 5 25 34 67 1 225 (65) 160 0.33
Restructuring charges in cost of sales and SG&A 1 9 - 9 6 3 28 (9) 19 0.04
Losses on divestitures - - - - - 1 1 - 1 0.00
Goodwill impairment - - 9 - - - 9 - 9 0.02
Diluted EPS from
Continuing Operations
Operating Income
61
Tax items - - - - - - - 21 21 0.04
Class action settlement, net - - - - - (10) (10) - (10) (0.02)
Legacy legal items - - - - - 29 29 - 29 0.06
Reserve adjustment - - - - - (9) (9) 3 (6) (0.02)
Separation costs - - - - - 5 5 47 225 (102) 175 0.36
Total Before Special Items $1,000 $632 $359 $385 $357 ($514) $2,219 ($239) $1 ($487) ($1) $1,493 $3.06
Diluted Shares Outstanding 488 Diluted Shares Outstanding - Before Special Items 488

Tyco_International_SHOW_FILE_FINAL.ppt November 11, 2009
31
Q409 Operating Income Before Special Items$M, except for share data
ADT Flow Fire Protection Electrical & Safety CorporateWorldwide Control Services Metal Products Products and Other Revenue
Revenue (GAAP) $1,799 $1,010 $904 $326 $382 - $4,421
IncomeFire Electrical Interest from
ADT Flow Protection & Metal Safety Corporate Operating Income, Other Income Minority ContinuingWorldwide Control Services Products Products and Other Income net Expense, net Taxes Interest Operations
As Reported (GAAP) $226 $126 $65 $12 $46 ($160) 315 ($64) ($19) ($23) ($2) 207 $0.44
Restructuring and asset impairment charges, net 24 14 31 9 9 2 89 (22) 67 0.14
Restructuring charges in cost of sales and SG&A 1 - - 5 - 6 (1) 5 0.01
Other additional charges resulting from restructuring actions 1 - - 1 - 1 -
Losses on divestitures 6 - - 4 10 (3) 7 0.01
Goodwill impairments - 2 2 0.00
Tax items - (3) (3) 0.00
Operating IncomeDiluted EPS
from Continuing Operations
62
Legacy legal items 5 5 5 0.01
Total Before Special Items $257 $141 $96 $21 $60 ($149) $426 ($64) ($19) ($50) ($2) $291 $0.61
Diluted Shares Outstanding 476 Diluted Shares Outstanding - Before Special Items 476
Q408 Operating Income Before Special Items
$M, except for share data
ADT Flow Fire Protection Electrical & Safety CorporateWorldwide Control Services Metal Products Products and Other Revenue
(G )Previously Reported Revenue (GAAP) $2,052 $1,188 $944 $591 $507 $2 $5,284
Segment Realignment (71) 71
Recasted Revenue (GAAP) $1,981 $1,188 $1,015 $591 $507 $2 $5,284
IncomeFire Electrical Total Interest from
ADT Flow Protection & Metal Safety Corporate Operating Expense, Other Income Minority ContinuingWorldwide Control Services Products Products and Other Income net Expense, net Taxes Interest Operations
As Previously Reported (GAAP) $200 $152 $74 $88 $65 ($150) $429 ($62) ($19) ($86) $2 $264 $0.55
Segment Realignment 3 (3)
As Reported (GAAP) $203 $152 $71 $88 $65 ($150) $429 ($62) ($19) ($86) $2 $264 $0.55
Restructuring and asset impairment charges, net 47 3 20 28 32 1 131 (39) 92 0.19
Restructuring charges in cost of sales and SG&A 1 6 1 3 2 13 (5) 8 0.02
Goodwill impairment 9 9 9 0.02
Diluted EPS from
Continuing Operations
Operating Income
63
Class action settlement, net (3) (3) (3) (0.01)
Separation costs 17 17 0.04
Total Before Special Items $251 $161 $101 $119 $99 ($152) $579 ($62) ($2) ($130) $2 $387 $0.81
Diluted Shares Outstanding 478 Diluted Shares Outstanding - Before Special Items 478

Tyco_International_SHOW_FILE_FINAL.ppt November 11, 2009
32
2009 Adjusted EBITDA Reconciliation
$M
ADT ADT Residential
NACommercial
NAADT NA
ADT EMEA
ADT ROW
ADT Worldwide
Revenue 1,986$ 2,184$ 4,170$ 1,834$ 1,011$ 7,015$
Operating Income 520$ 186$ 706$ (589)$ 116$ 233$ Restructuring and asset impairment charges, net 8$ 30$ 38$ 680$ 4$ 722$
Operating Income Before Special Items 528$ 216$ 744$ 91$ 120$ 955$ Operating Margin Before Special Items 26.6% 9.9% 17.8% 5.0% 11.9% 13.6%
Depreciation & Amortization 516$ 217$ 733$ 75$ 77$ 885$
64
Depreciation & Amortization 516$ 217$ 733$ 75$ 77$ 885$
Adjusted EBITDA 1,044$ 433$ 1,477$ 166$ 197$ 1,840$ Adjusted EBITDA Margin 52.6% 19.8% 35.4% 9.1% 19.5%
Non-GAAP Measures“Organic revenue,” “free cash flow (outflow)” (FCF), “income from continuing operations before special items”, “earnings per share (EPS) from continuing operations before special items”, “operating income before special items” and “operating margin before special items” are non-GAAP measures and should not be considered replacements for GAAP results.
Organic revenue is a useful measure used by the company to measure the underlying results and trends in the business. The difference between reported net revenue (the most comparable GAAP measure) and organic revenue (the non-GAAP measure) consists of the i t f f i i iti d di tit d th h th t d t fl t th d l i lt d t d (fimpact from foreign currency, acquisitions and divestitures, and other changes that do not reflect the underlying results and trends (for example, revenue reclassifications and changes to the fiscal year). Organic revenue is a useful measure of the company’s performance because it excludes items that: i) are not completely under management’s control, such as the impact of foreign currency exchange; or ii) do not reflect the underlying results of the company’s existing businesses, such as acquisitions and divestitures. It may be used as a component of the company’s compensation programs. The limitation of this measure is that it excludes items that have an impact on the company’s revenue. This limitation is best addressed by using organic revenue in combination with the GAAP numbers. See the accompanying tables to this press release for the reconciliation presenting the components of organic revenue.
FCF is a useful measure of the company’s cash which is free from any significant existing obligation. The difference between cash flows from operating activities (the most comparable GAAP measure) and FCF (the non-GAAP measure) consists mainly of significant cash outflows that the company believes are useful to identify. FCF permits management and investors to gain insight into the number that management employs to measure cash that is free from any significant existing obligation. It, or a measure that is based on it, may be used as a component in the company’s incentive compensation plans. The difference reflects the impact from:
65
net capital expenditures,accounts purchased from the ADT dealer network,cash paid for purchase accounting and holdback liabilities, voluntary pension contributions, andthe sale of accounts receivable programs.
Capital expenditures and the ADT dealer program are subtracted because they represent long-term commitments. Cash paid for purchase accounting and holdback liabilities is subtracted because these cash outflows are not available for general corporate uses. Voluntary pension contributions and the impact from the sale of accounts receivable programs are added or subtracted because this activity is driven by economic financing decisions rather than operating activity.

Tyco_International_SHOW_FILE_FINAL.ppt November 11, 2009
33
Non-GAAP Measures ContinuedThe limitation associated with using FCF is that it subtracts cash items that are ultimately within management’s and the Board of Directors’ discretion to direct and therefore may imply that there is less or more cash that is available for the company's programs than the most comparable GAAP measure. This limitation is best addressed by using FCF in combination with the GAAP cash flow numbers.
FCF as presented herein may not be comparable to similarly titled measures reported by other companies. The measure should be used in conjunction with other GAAP financial measures. Investors are urged to read the company’s financial statements as filed with the Securities and Exchange Commission as well as the accompanying tables to this pressstatements as filed with the Securities and Exchange Commission, as well as the accompanying tables to this press release that show all the elements of the GAAP measures of Cash Flows from Operating Activities, Cash Flows from Investing Activities, Cash Flows from Financing Activities and a reconciliation of the company's total cash and cash equivalents for the period. See the accompanying tables to this press release for a cash flow statement presented in accordance with GAAP and a reconciliation presenting the components of FCF.
The company has presented its income and EPS from continuing operations before special items and operating income and margin before special items. Special Items include charges and gains related to divestitures, acquisitions, restructurings, impairments, legacy legal and tax charges and other income or charges that may mask the underlying operating results and/or business trends of the company or business segment, as applicable. The company utilizes income and EPS from continuing operations before special items and operating income and margin before special items to assess overall operating performance and segment level core operating performance, as well as to provide insight to management in evaluating overall and segment operating plan execution and underlying market conditions. They may be used as components in the company’s incentive compensation plans. Operating income, operating margin, and income and EPS from continuing operations before special items are useful measures for investors because they permit more meaningful comparisons of the company’s underlying operating results and business trends
66
because they permit more meaningful comparisons of the company s underlying operating results and business trends between periods. The difference between income and EPS from continuing operations before special items and income and EPS from continuing operations (the most comparable GAAP measures) consists of the impact of charges and gains related to divestitures, acquisitions, restructurings, impairments, legacy legal and tax charges and other income or charges that may mask the underlying operating results and/or business trends. Operating income and margin before special items do not reflect any additional adjustments that are not reflected in income from continuing operations before special items. The limitation of these measures is that they exclude the impact (which may be material) of items that increase or decrease the company’s reported operating income and margin and operating income and EPS from continuing operations. This limitation is best addressed by using the non-GAAP measures in combination with the most comparable GAAP measures in order to better understand the amounts, character and impact of any increase or decrease on reported results. Tyco provides general corporate services to its segments and those costs are reported in the “Corporate and other” segment. This segment’s operating income (loss) is presented as “Corporate Expense”.