Citation for published version - Research Database -...
35
Research Archive Citation for published version: Jianqin Zhu, Kai Wang, Guoqing Li, Hongwei Wu, Zhaowu Jiang, Feng Lin, and Yongliang Li, 'Experimental study of the energy and exergy performance for a pressurized volumetric solar receiver', Applied Thermal Engineering, Vol. 104, July 2016, pp. 212-221. DOI: https://doi.org/10.1016/j.applthermaleng.2016.05.075 . Document Version: This is the Accepted Manuscript version. The version in the University of Hertfordshire Research Archive may differ from the final published version. Users should always cite the published version of record. Copyright and Reuse: This manuscript version is made available under the terms of the CC-BY-NC-ND 4.0 license http://creativecommons.org/licenses/by-nc-nd/4.0/. © 2015 Elsevier Ltd. All rights reserved. Enquiries If you believe this document infringes copyright, please contact the Research & Scholarly Communications Team at [email protected]
Transcript of Citation for published version - Research Database -...

Research Archive
Citation for published versionJianqin Zhu Kai Wang Guoqing Li Hongwei Wu ZhaowuJiang Feng Lin and Yongliang Li Experimental study of the energy and exergy performance for a pressurized volumetric solar receiver Applied Thermal Engineering Vol 104 July 2016 pp 212-221
DOI httpsdoiorg101016japplthermaleng201605075
Document Version This is the Accepted Manuscript versionThe version in the University of Hertfordshire Research Archive may differ from the final published version Users should always cite the published version of record
Copyright and Reuse This manuscript version is made available under the terms of the CC-BY-NC-ND 40 license httpcreativecommonsorglicensesby-nc-nd40
copy 2015 Elsevier Ltd All rights reserved
EnquiriesIf you believe this document infringes copyright please contact the Research amp Scholarly Communications Team at rschertsacuk
Experimental Study of the Energy and Exergy performance 1
for a Pressurized Volumetric Solar Receiver 2
Jianqin Zhua Kai Wangb Zhaowu Jiangb Hongwei Wuc 3
Dunjin Wangb Feng Linb Yongliang Lid 4 a National Key Lab of Science and Technology on Aero-Engines 5
School of Energy and Power Engineering Beihang University Beijing 100191 China 6 b Institute of Engineering Thermophysics Chinese Academy of Sciences 7
Beijing 100190 China 8 c Department of Mechanical and Construction Engineering Faculty of Engineering and Environment 9
Northumbria University Newcastle upon Tyne NE1 8ST United Kingdom 10 d School of Chemical Engineering University of Birmingham 11
Edgbaston Birmingham B15 2TT United Kingdom 12 13
Corresponding author Email wang_kaiietcn Tel +86(10)82543147 Fax +86(10)82613328 14 Corresponding author Email hongweiwunorthumbriaacuk Tel +44(0)1913495365 15
16
Abstract 17
This article presents an experimental investigation of the heat transfer 18
characteristics as well as energy and exergy performance for a pressurised volumetric 19
solar receiver under variable mass flow rate conditions During a two hour period of 20
continuous operation in the morning the solar irradiance is relatively stable and 21
maintained at approximately 600 Wm2 which is beneficial for analyzing the energy 22
and exergy performance of the solar receiver Experimental results show that the mass 23
flow rate fluctuation has slight effect on the solar receiver outlet temperature 24
Whereas the mass flow rate plays an important role in the solar receiver power 25
energy efficiency and exergy efficiency The efficiency of the solar receiver is 26
normally above 55 with the highest efficiency of 87 and at steady state the 27
efficiency is maintained at around 60 A very low value of the heat loss factor 28
(0014 kWK) could be achieved during the current steady state operating conditions 29
The highest exergy efficiency is approximately 36 In addition as the temperature 30
difference increases the impact of the exergy factor increases The highest exergy 31
factor is 041 during the entire test 32
Keywords solar receiver exergy energy efficiency heat transfer radiation 33
34
Nomenclature
Aap effective aperture area of dish [m2] 119864119909119904 rate of solar exergy delivery
[kw]
Ap project area [m2] G direct solar radiation [w m2frasl ]
119888119886119907 average specific heat capacity
[JkgK] mass flow rate [kgs]
Df focus point diameter [m] 119899119889 parabolic dish combined
optical efficiency [-]
119864119863 concentrated solar radiation power
[kw] rc concentration ratio
119864119871 heat loss [kw] 119879119894119899 inlet temperature of the air [K]
119864119877 receiver power [kw] 119879119900119906119905 outlet temperature of the air[K]
119864119878 solar radiation power on the dish
[kw] 119879119886119907119890
average temperature of the
air[K]
119864119909119863 rate of dish exergy concentrated
[kw] 119880119871 heat loss coefficient [kw m2Kfrasl ]
119864119909119891 exergy factor [-] 120578119905ℎ119877 energy efficiency of the
receiver [-]
119864119909119877 receiver exergy [kw] 120578119890119909119877 exergy efficiency of the
receiver [-]
35
1 Introduction 36
With rapidly increasing energy prices and globalization process industries seek 37
opportunities to reduce production costs and improve energy efficiency Among the 38
energy-efficient technologies Concentrated Solar Power (CSP) system is considered 39
as one of the most attractive ways to solve the energy crisis in the future [12] Many 40
developed countries like the United State and the European Commission have been 41
devoted to the solarised Brayton micro-turbines system over the past decades [3-5] 42
Compared to the traditional gas turbine solarised Brayton turbines use solar 43
receiver to replace the combustion chamber in the traditional gas turbine [6] The 44
solar concentration part which is used to provide high temperature air is very crucial 45
for the entire solar power system The system efficiency and the cost of the power 46
generation are highly depended on the solar concentration conversion efficiency from 47
solar radiation to thermal fluid Thus the solar concentration part has to be well 48
designed in order to achieve high efficiency and low pressure loss Many studies have 49
been devoted to the design and performance of the receiver Neber and Lee [7] 50
designed a high temperature cavity receiver using silicon carbide Then a scaled test 51
section was placed at the focal point of a parabolic dish collector and reached a 52
maximum temperature of 1248 K Fernandez et al [8] presented a multidisciplinary 53
design optimization of a 5 MW Small Particle Heat Exchange Receiver (SPHER) for 54
a central receiver solar plants The new developed solar receiver aims to heat air to 55
temperatures in excess of 1300 K and use this high-temperature energy to drive a 56
Brayton cycle or a combined BraytonRankine cycle It was found that the receiver 57
efficiency can be increased by 6 with respect to the previous baseline design from 58
the same author [9] Buck et al [10] introduced a receiver module consisting of a 59
secondary concentrator and a volumetric receiver unit which was closed with a domed 60
quartz window to transmit the concentrated solar radiation Hischier et al [11 12] 61
proposed a novel design of a high-temperature pressurized solar air receiver for power 62
generation via combined Brayton-Rankine cycles It consists of an annular reticulate 63
porous ceramic bounded by two concentric cylinders The heat transfer mechanism 64
was analyzed by the finite volume technique and by using the Rosseland diffusion P1 65
and Monte-Carlo radiation method It was found that for a solar concentration ratio of 66
3000 suns the outlet air temperature can reach 1000 degC at 10 bars yielding a thermal 67
efficiency of 78 68
It is recognized that the flow and heat transfer processes in the solar receiver are 69
very complicated Over the past years many studies have been devoted to the 70
optimization of the design using theoretical and numerical method Cui et al [13] 71
developed a three-dimensional optical model and simulated the solar transmission 72
process for a pressurized volumetric receiver using the Monte Carlo Ray Tracing 73
(MCRT) method Wang et al [14] developed a three-dimensional model of parabolic 74
dish-receiver system with argon gas as the working fluid to simulate the thermal 75
performance of a dish-type concentrated solar energy system Lu et al [15] proposed 76
heat and mass transfer models of the solar heat receiver and associated heat 77
absorption and exergetic performance were further investigated by considering the 78
heat loss outside the receiver and fluid viscous dissipation inside the receiver Song et 79
al [16] analyzed the effect of the solar incidence angle in order to accurately simulate 80
the heat flux distribution around the absorber tube outer surface Le Roux et al [17] 81
investigated the effect of wind receiver inclination rim angle atmospheric 82
temperature and pressure recuperator height solar irradiance and concentration ratio 83
on the optimum geometries and performance Lu et al [18] theoretically investigated 84
the nonuniform heat transfer model and performance of parabolic trough solar 85
receiver and the results showed that the heat loss of solar receiver from the 86
nonuniform model is a slight higher than that from the uniform model 87
On the other hand many numerical research works are also conducted to simulate 88
the detail heat transfer process Flesch et al [19] numerically analyzed the impact of 89
head-on and side-on wind on large cavity receivers with inclination angles ranges 90
from 0deg(horizontal cavity) to 90deg(vertical cavity) and compared with the data 91
published in the open literature Wei et al [20] presented an original CFD-based 92
evolutionary algorithm to determine the optimal fluid distribution in a tubular solar 93
receiver for the minimization of its peak temperature Tu et al [21] proposed a 94
modified combined method to simulate the thermal performance of a saturated 95
watersteam solar cavity receiver Capeillere et al [22] numerically studied the 96
thermomechanical behavior of a plate solar receiver with asymmetric heating The 97
numerical results showed that the choice of the shape and levels of the solar irradiance 98
map is crucial The distribution of the most relevant incident solar flux and the 99
geometry compromise were determined Wang et al [23] conducted a numerical 100
study focusing on the thermal performance of porous medium receiver with quartz 101
window Their results indicated that the pressure distribution and temperature 102
distribution for the condition of fluid inlet located at the side wall was different from 103
that for the condition of fluid inlet located at the front surface 104
Exergy analysis has been applied in various power studies [24-26] 105
Thermodynamic analyses and optimization of a recompression N2O Brayton power 106
cycle have been performed [27] The performance of a regenerative Brayton heat 107
engine has been studied by focusing on the minimization of irreversibility [28] In the 108
authors earlier studies [29 30] a coiled tube solar receiver has been designed and 109
tested in the real solar radiation condition But due to the limitation of the tube 110
material the coiled tube solar receiver can not achieve very high temperature Thus a 111
pressurized volumetric solar receiver using metal foam as thermal absorbing core is 112
designed in this work It appears from the previous investigation that the key point for 113
the solarised Brayton micro-turbines is to develop solar receivers which have terrific 114
performance on the pressure loss and heat transfer To the best of the authorsrsquo 115
knowledge there is a lack of available experimental data under real concentrate solar 116
and variable mass flow conditions especially for the cases of extremely high heat flux 117
and high temperature To this end the present research is aimed to experimentally 118
analyze both the efficiency and heat loss of a pressurized volumetric solar receiver 119
under real solar radiation and variable mass flow conditions in more detail 120
121
2 Experimental apparatus and method 122
21 Experimental apparatus 123
The experimental study was conducted at a location with the geographical 124
position of 30deg36 latitude and 120deg22 longitude Hangzhou China The whole 125
system shown schematically in Fig 1 mainly consists of three components dish 126
compressor and receiver The dish used for the experimental tests of the developed 127
solar heat receiver was listed in Fig 2 All 40 trapezoidal pre-bent mirrors are resin 128
molded and laminated The reflective surface is applied as an adhesive foil At the 129
bottom of the dish a cut out is made for the tower The main dish parameters utilized 130
in the current study are illustrated in Table 1 which is provided by the dish reflector 131
manufacturer To make sure that the light reflected by the mirror focus on the aperture 132
of the receiver each mirror was adjusted carefully 133
The dish is controlled by a solar tracker which is embedded in the inner program to 134
make the dish face the Sun automatically The inner program could accurately 135
calculate the attitude angle in terms of the dish location of the earth and the local time 136
As illustrated in Fig 1 the attitude angel is formed between the boom line and 137
horizon line A stepping motor can be well controlled to change the dish attitude angle 138
slowly When the dish is in operation during the morning the attitude angle is lower 139
than 40deg for the sun just rising over the horizontal line Whereas the dish is operated 140
in the noon the attitude angle is approximately 80deg It should be recognized that the 141
initial setting for the location and accurate time is very crucial during the test An 142
uninterruptible power supply (UPS) system is also adopted to assist the dish off the 143
solar direction in some emergency to further protect the receiver During the 144
experiments a 20 kw piston compressor driven by the electricity is used to compress 145
the air The pressurized air is compressed at environmental temperature and pressure 146
After the filter the air is pressurized into the air tank with the pressure of 08 Mpa to 147
guarantee the enough air flow during the experiment process After that the 148
pressurized air is supplied into the receiver Two valves are installed at the receiver 149
inlet and outlet to ensure the receiver works under designed pressure about 04 Mpa 150
Because the light incident surface of the receiver is made of quartz glass too high 151
pressure could damage the receiver Hence by adjusting this valve the pressure of the 152
whole system as well as the portion of the receiver can be well controlled The output 153
mass flow rate is variable Thermocouple and pressure sensor are placed at the inlet 154
and outlet of the pipe respectively to obtain the receiver efficiency and heat loss The 155
receiver itself is mounted onto the cantilever arm In the current study the heat flux of 156
the focus power could achieve 1000 kWm2 for the dish concentrator has the 157
concentrate ratio of 1750 It can be expected that except for the receiver and 158
protecting panel other components of the system would be burned in a short time To 159
protect other part of the receiver from misaligned radiation an additional protecting 160
panel is mounted circumferentially to the receiver As shown in Fig 3 the protecting 161
panel is made of Calcium silicate board with 10 mm in thickness The diameter of the 162
aperture in the protecting panel is 250 mm Four K-type thermocouples with an 163
accuracy of 05 degC are fixed on the back to monitor the temperature of the protecting 164
panel When the temperature is over 850 it means that the concentrate solar spot is 165
not located into the aperture As a result the inner program has to be reset to adjust 166
the attitude angle in order to prevent fatal damage 167
22 Solar receiver model 168
For the current experimental evaluation as shown in Fig 4 the solar receiver is 169
designed as a type of pressurized volumetric solar receiver Fig 4(a) shows the 3D 170
view of the model and Fig 4(b) presents the cross sectional view of the receiver The 171
advantage of the pressurized volumetric solar receiver is high outlet air temperature 172
and high thermal efficiency It should be stressed here that the key point for the design 173
of the pressurized volumetric solar receiver is the cooling of the light incident glass 174
and the equally distributed mass flow in the heat absorbing core The light incident 175
glass is made of quartz glass which can endure a temperature up to 1500 Cdeg But the 176
concentrated solar focuses on the quartz glass directly the glass cooling using the 177
inlet air could extend the life span of the receiver and make the receiver working 178
process more secure For this reason a big inlet tube is used with the diameter of 50 179
mm The pressured air is injected into the inlet tube and then it is divided into three 180
small tubes with the diameter of 20 mm The three small tubes that circumferentially 181
uniformly distributed are welded at the end of the pressure cavity which forms the 182
main part of the solar receiver The air flow along the edge of the cavity and inject on 183
the quartz glass forming the cooling of the light incident glass The diameter and the 184
height of the main part of the receiver are 400 mm and 360 mm respectively The 185
concentrate solar radiation (CSR) passes through the quartz glass and heat the 186
absorbing core As shown in Fig 5 the material of the absorbing core is Nickel foam 187
which could endure the temperature up to 1453 To increase the absorbing ability 188
65mm Nickel foam with the PPI (Pores per Inch) value of 75 is selected PPI which is 189
a common parameter is usually used in industry to indicate the pore diameter of the 190
metal foam The 75 PPM value means that the pore diameter is about 034 mm One 191
can imagine that the small pore diameter would enhance the heat transfer coefficient 192
and heat transfer area easily At last to minimize the heat loss the receiver is 193
surrounded by Aluminum silicate whose heat conductivity coefficient is 194
006 W m2frasl Kminus1 195
23 Energy and exergy analysis 196
Experimental energy and exergy parameters to characterize the thermal 197
performance of the receiver are presented in this section 198
231 Energy analysis [31 32] 199
The energy that the whole system receives comes from the solar radiation The 200
solar radiation power on the parabolic dish reflector can be expressed as 201
ES = AapG 202
(1) 203
where ES is the solar radiation power on the dish 119860119886119901 is the effective aperture 204
area of the parabolic dish and G is the direct solar irradiation from the Sun to the dish 205
G is measured with a normal incidence pyrheliometer (NIP) Hukseflux DR01 206
attached to the solar tracker 207
The solar radiation is concentrated and delivered to the receiver by the parabolic 208
dish The concentrated solar radiation power (ED) can be expressed as 209
ED = ndES = ndAapG (2) 210
where ED is the concentrated solar radiation power from parabolic dish to the 211
receiver nd is the parabolic dish combined with optical efficiency described in 212
Table 1 213
The concentrated solar radiation on the receiver is absorbed by the heat-transfer 214
fluid flowing in the pressurized cavity of the receiver The energy rate that air absorbs 215
or receives power is given by 216
ER = mcav(Tout minus Tin) (3) 217
where m is the mass flow rate of the air cav is the average specific heat 218
capacity of the air which is a function of the average air inlet temperature (Tin) and air 219
outlet temperature (Tout) The average temperature of the receiver (Tave) can be 220
defined by 221
Tave = (Tin + Tout)2 (4) 222
Thus the relation between the average specific heat capacity of the air and the 223
average temperature can be obtained as 224
cav = 09956 + 0000093Tave (5) 225
Based on the energy conservation the receiver power is the difference between 226
the concentrated solar radiation power and the overall heat losses are relative low The 227
receiver power can also be described as 228
ER = ED minus EL (6) 229
where EL is the rate of the heat loss from the receiver to the surroundings 230
which contains the convective heat losses conductive heat losses and radioactive heat 231
losses EL can be expressed as 232
EL = ULAR(Tave minus Tamb) (7) 233
where UL is the total heat loss coefficient determined AR is the effective 234
receiver area and Tamb is the ambient temperature The product ULAR is referred as 235
the heat loss factor given by 236
ULprime = ULAR 237
(8) 238
Therefore combination of Eqs (2) (3) (6) and (7) can yield 239
mcav(Tout minus Tin) = ndAapG minus ULprime (Tave minus Tamb) 240
(9) 241
The thermal energy efficiency of the receiver is defined as the ratio of the 242
receiver power to the concentrated solar radiation power from the parabolic dish to 243
the receiver which is expressed as 244
ηthR =ER
ED=
mcav(ToutminusTin)
ndAapG 245
(10) 246
By dividing AapG on both side of Eq (9) and combine with Eq (10) leads to 247
ηthRnd = nd minusUL
prime (TaveminusTamb)
AapG (11) 248
232 Exergy analysis [31 32] 249
The exergy rate of the receiver or the quality of the energy delivered to the 250
circulating fluid with reference to the surroundings can be expressed as 251
ExR = ER minus mcavTamb ln (Tout
Tin) (12) 252
Substituting Eq (3) into Eq (12) yields 253
ExR = mcav [(Tout minus Tin) minus Tamb ln (Tout
Tin)] (13) 254
The rate of the solar exergy delivery by the Sun to the dish and then to the 255
concentrator is given by the Petela expression [33] and is expressed as 256
Exs = GAap [1 +1
3(
Tamb
Ts)
4
minus4Tamb
3Ts] (14) 257
where Ts is the surface temperature of the Sun which is approximately 5762 K 258
So the concentrated solar radiation exergy (ExD) can be expressed as 259
ExD = ndGAap [1 +1
3(
Tamb
Ts)
4
minus4Tamb
3Ts] 260
(15) 261
The exergy efficiency is defined as the ratio of the receiver exergy rate to the rate 262
of the concentrated solar radiation exergy and can be determined as follows 263
ηexR =ExR
ExD=
mcav[(ToutminusTin)minusTamb ln(ToutTin
)]
ndGAap[1+1
3(
TambTs
)4
minus4Tamb
3Ts]
(16) 264
The exergy factor is defined as the ratio of the receiver exergy rate to the 265
receiver energy rate and can be represented by equation 266
Exf =ExR
ER=
mcav[(ToutminusTin)minusTamb ln(ToutTin
)]
mcav(ToutminusTin) (17) 267
3 Uncertainty analysis 268
The uncertainties of the measurement in the experiment are dependent on the 269
experimental conditions and the measurement instruments An uncertainty analysis is 270
performed on the receiver power ER and the receiver exergy ExR which are the 271
most important derived quantities from the measurements of using the propagation of 272
error method described by Moffat [34] The uncertainty of the receiver power could 273
be calculated by the following equation 274
δER = radic(δER
δm)
2(δm)2 + (
δER
δTout)
2(δTout)2 + (
δER
δTin)
2(δTin)2 (17) 275
While the uncertainty of the receiver exergy rate is given by 276
δExR = radic(
δExR
δm)
2(δm)2 + (
δExR
δTout)
2(δTout)2
+ (δExR
δTin)
2(δTin)2 + (
δExR
δTamb)
2(δTamb)2
(18) 277
In the current study the main uncertainty parameters are the mass flow rate () 278
the inlet temperature (119879119894119899) and the outlet temperature (119879119900119906119905) The relative uncertainty 279
of the mass flow rate is given by the float flowmeter with the value of 2 Therefore 280
120575 = 2 times = plusmn0001 119896119892119904 The uncertainty of the temperature is given by the 281
K-type thermocouple with the value of 120575119879119900119906119905 = 120575119879119894119899 = plusmn05 119870 282
The maximum experimental values for the receiver power and exergy rate are 283
around 185 kW and 728 kW respectively The uncertainty of the receiver power is 284
0372 kW and the uncertainty of the receiver exergy rate is 0147 kW Overall the 285
overall uncertainty of the receiver power and exergy rate are 201 and 202 286
respectively 287
4 Results and discussion 288
Fig 6 shows the variation of the solar irradiance (G) during a test period from 289
1000 am to 1330 pm The experimental data were collected on November 6th 2015 290
which is a local autumn season in Hangzhou China According to Fig 6 it is shown 291
that the solar irradiance fluctuates at around 600 Wm2 all the time And the solar 292
irradiance data increases slowly with time except two fast drops observed in the 293
afternoon for about 15 mins The reason could be due to the fact that two short period 294
of passing cloud occurred From this figure it can be seen clearly that the solar 295
irradiance is almost stable and maintained at around 600 Wm2 from 1000 am to 296
1200 pm It is obviously that the stable solar irradiation condition is beneficial for 297
analyzing the energy and exergy performance of the solar receiver For this purpose a 298
test period of continuous 2 h from 1000 am to 1200 pm is selected Dynamic 299
acquisition system is used to record the parameters automatically during the test The 300
ambient temperature is maintained at around 25 during the experiment process 301
Fig 7 shows the variation of the inlet pressure outlet pressure and mass flow rate For 302
the design pressure of the solar receiver is 04 Mpa the experiment should be 303
conducted at the same pressure Since the heating from the concentrate solar 304
irradiation could lead to the rising of the internal pressure the inlet valve is adjusted 305
during the experimental process to ensure the solar receiver working safety Therefore 306
the mass flow rate fluctuates all the time The average value of the mass flow rate is 307
about 0036 kgs In the current study the main purpose is to test the energy and 308
exergy performance of the solar receiver under the fluctuant mass flow rate condition 309
Fig 8 presents the time series of air temperatures at the inlet and outlet of the 310
receiver The inlet temperature maintains nearly constant about 42 oC The outlet 311
temperature rises very quickly at the starting stage and achieves the highest 312
temperature of 480 oC at the end of the experiment process From 1000 am to 1030 313
am it takes about half an hour to rise the solar receiver outlet temperature from 42 oC 314
to 430 oC After 1030 am the outlet temperature increases very slowly with the time 315
The first half an hour is used for preheating It is due to the fact that the receiver tubes 316
are surrounded by the insulation materials with high specific heat capability (Cp) It is 317
noteworthy that the rising speed of the receiver efficiency is very high within the first 318
30 mins This phenomenon is very important and should be stressed here since the 319
sunshine is limited in the day time quick start up can make the overall solar power 320
generation system to generate more electricity Therefore the cost of the power 321
generation will be lower and the investment recovery period could be shorter There is 322
also another interesting phenomenon that the mass flow rate fluctuation has little 323
effect on the solar receiver outlet temperature It may be due to the reason that the 324
porous metal is used as the heat absorbing core The pore size is very small with the 325
value about 034 mm This small size pore could increase the heat transfer coefficient 326
and area obviously The heat transfer between the porous metal and the air is strong 327
enough that the air outlet temperature could be very close to the temperature of the 328
porous metal Therefore the effect of the mass flow rate fluctuation on the solar 329
receiver outlet temperature is very small 330
Fig 9 presents a comparison of the power for the concentrated solar radiation 331
and receiver power For the case of the nearly constant solar irradiance of 600 Wm2 332
the concentrated solar radiation power (119864119863 ) is maintained at around 225 kW with the 333
fluctuation lower than plusmn10 In addition the accurate control system can make sure 334
the reflection focus located at the aperture of the receiver The red line shown in Fig 335
9 is the receiver power during the testing period At the first 10 mins the solar 336
receiver power (119864119877 ) rise quickly from nearly 0 kW to 12 kW After that the value of 337
119864119877 has the same trend with the mass flow rate according to the time In other words 338
the mass flow rate has great influence on the solar receiver power This can be easily 339
explained by the Eq (3) As previously mentioned the mass flow fluctuation has little 340
influence on the value of cav Tout and Tin so the solar receiver power is mainly 341
affected by the mass flow rate especially after the starting stage The maximum solar 342
receiver power is achieved at about 1150am with the value of 185 kW 343
Fig 10(a) shows the time series of the solar receiver efficiency It is found that 344
when the solar receiver turns into steady state the efficiency of the solar receiver can 345
be above 55 The peak value of the efficiency is 87 and finally the efficiency is 346
maintained at around 60 And it is also found that the value of ηthR has the same 347
trend with the mass flow rate after the receiver entering into steady stage In other 348
words the energy efficiency is positively related with the mass flow rate as shown in 349
Fig 10(b) The main reason for this phenomenon can be explained by Eq (10) As 350
described above the concentrated solar radiation power (119864119863 ) is nearly maintained 351
constant at around 225 kW but the mass flow rate has great influence on the solar 352
receiver power ( 119864119877 ) Therefore the ratio of 119864119877 and 119864119863 has the positive 353
relationship with the mass flow rate This is a very beneficial conclusion Because in 354
out experiment the mass flow rate is obviously lower than the real solarised gas 355
turbine system So the efficiency of the real solarised gas turbine system will be very 356
high Correspondingly the usage of the gas will be lower and the investment recovery 357
period could be shorter 358
Fig 11 demonstrates the evolution of the heat loss factor (119880119871prime) At the starting 359
point 119880119871prime is very high (117 kWK) because of the receiver preheating and then it 360
drops very quickly within the first 5 mins When the receiver works at steady state 361
the heat loss becomes lower and 119880119871prime achieves the minimum value of 0014 kWK In 362
the current study the heat loss mainly consist of the conduction heat loss conviction 363
heat loss and radioactive heat loss Conduction heat loss could be reduced by using 364
material with low thermal conductivity In the present work the receiver is 365
surrounded by Aluminum silicate whose thermal conductivity is 006 W m2frasl Kminus1 The 366
Aluminum silicate can be acted as the thermal insulator to minimize the heat lossThe 367
thermal convection between the solar receiver and ambient is very low as well this is 368
because the absorbing core is sealed in a pressurized cavity As a result only small 369
natural convection occurs around the external cavity of the receiver It is noted that 370
the use of the insulator could obviously reduce the natural convection The radioactive 371
heat loss is also an important part of the heat loss but it can be reduced by using small 372
aperture as shown in Fig 4 In the design of solar receiver choosing appropriate 373
aperture diameter is very important for the receiver performance 374
Fig 12 shows the comparison between the receiver exergy (ExR) and the 375
concentrated solar energy as well as the receiver energy From this figure the exergy 376
rate and energy rate vary in a similar manner the mass flow rate also has the same 377
influence on the exergy rate It is noted that the highest value of the exergy rate during 378
the test period is around 728 kW whereas the maximum energy rate can reach 185 379
kW It can be concluded that the quality of the energy from the receiver is low due to 380
a large amount of irreversible energy changes such as heat losses and the transfer of 381
high quality solar energy to a fluid that circulating at a relatively low temperature 382
From Eq (13) it can be concluded that under the same temperature difference(119879119900119906119905 minus383
119879119894119899) and the same energy rate 119888119886119907(119879119900119906119905 minus 119879119894119899) condition increasing the receiver 384
inlet temperature (119879119894119899) can achieve higher exergy rate (119864119909119877) This will be very 385
helpful for the design of the solar power system As a result some recuperator or heat 386
exchanger should be used in the inlet of the solar receiver to recover the waste heat 387
and increase the solar inlet temperature 388
Fig 13 presents the comparison between the energy efficiency and exergy 389
efficiency It is shown from Fig 13 that similar trends in the exergy efficiency and the 390
energy efficiency are obtained The highest exergy efficiency is approximately 36 391
whereas the highest energy efficiency is around 87 This suggests that low quality 392
energy obtained from the receiver It is because the inlet temperature of the receiver is 393
lower than 316 K whereas the outlet temperature is very high and with the maximum 394
value of 850 K The temperature ratio (ToutTin) is very high so that too much exergy 395
loss is observed Therefore increasing the inlet temperature could be a potential way 396
to increase the exergy efficiency 397
Fig14 shows the exergy factor plotted as a function of the temperature 398
difference between the outlet and inlet temperature of the receiver with a linear fitting 399
equation The exergy factor is also usually used as a measure of the performance of 400
the receiver Obviously as the temperature difference increases the exergy factor also 401
increases This plot suggests that the higher exergy factor can be obtained when high 402
temperature difference is available As seen from this figure the highest exergy factor 403
is 041 during the entire test 404
5 Conclusions 405
This paper performed an experimental study to investigate the thermal 406
performance of a pressurized volumetric solar receiver under real solar radiation 407
condition The mass flow rate is variable during the experimental process A parabolic 408
dish with solar tracker system is designed and analysed using energy and exergy 409
analyse method Experimental results reveal that the solar irradiance is almost stable 410
and maintained at around 600 Wm2 from 1000 am to 1200 pm It takes about half 411
an hour to rise the solar receiver outlet temperature from 42 oC to 430 oC After 1030 412
am the outlet temperature increases very slowly with the time The mass flow rate 413
fluctuation has little effect on the solar receiver outlet temperature However the mass 414
flow rate has great influence on the solar receiver power energy efficiency and 415
exergy efficiency The efficiency of the solar receiver can be above 55 The peak 416
value of the efficiency is 87 and finally the efficiency is maintained at around 60 417
During the steady state the heat loss becomes lower and 119880119871prime achieves the minimum 418
value of 0014 kWK The highest exergy efficiency is approximately 36 whereas 419
the highest energy efficiency is around 87 As the temperature difference increases 420
the impact of the exergy factor increases The highest exergy factor is 041 during the 421
entire test 422
423
Acknowledgements 424
The authors would like to acknowledge the financial support from National Natural 425
Science Foundation of China (No 51206164) 426
References 427
[1] Steinfeld A 2005 Solar thermochemical production of hydrogen - a review 428
Solar Energy 78603-15 429
[2] Le Roux WG Bello-Ochende T Meyer JP 2011 Operating conditions of an 430
open and direct solar thermal Brayton cycle with optimised cavity receiver and 431
recuperator Energy 366027-36 432
[3] Uri Fisher Chemi Sugarmen Arik Ring Joseph Sinai 2004 Gas Turbine 433
ldquoSolarizationrdquo-Modifications for SolarFuel Hybrid Operation J Sol Energy 434
Eng 126(3) 872-878 435
[4] Peter Heller Markus Pfaumlnder Thorsten Denk Felix Tellez Antonio Valverde 436
Jesuacutes Fernandez Arik Ring 2006 Test and evaluation of a solar powered gas 437
turbine system Solar Energy 80(10) 1225-1230 438
[5] Peter Schwarzboumlzl Reiner Buck Chemi Sugarmen Arik Ring Ma Jesuacutes 439
Marcos Crespo Peter Altwegg Juan Enrile 2006 Solar gas turbine systems 440
Design cost and perspectives Solar Energy 80(10) 1231-1240 441
[6] Chen Lingen Zhang Wanlin Sun Fengrui 2007 Power efficiency 442
entropy-generation rate and ecological optimization for a class of generalized 443
irreversible universal heatengine cycles Appl Energy 84512-25 444
[7] Matthew Neber Hohyun Lee 2012 Design of a high temperature cavity receiver 445
for residential scale concentrated solar power Energy 47481-487 446
[8] Fernandez P Miller F J 2015 Performance analysis and preliminary design 447
optimization of a small particle heat exchange receiver for solar tower power 448
plants Solar Energy 112458-68 449
[9] Fernandez P 2013 Numerical-Stochastic Modeling Simulation and Design 450
Optimization of Samll Particle Solar Receviers for Concentrated Solar Power 451
Plants Proyecto Fin de Carrera University of Valladolid Span 452
[10] Buck R Brauning T Denk T Pfander M Schwarzbozl P Tellez F 2001 453
Solar-hybrid gas turbine-based power tower systems J Sol Energy Eng 454
124(1)2-9 455
[11] Hischier I Hess D Lipinski W Modest M Steinfield A 2009 Heat transfer 456
analysis of a novel pressurized air receiver for concentrated solar power via 457
combined cycles J Thermal Sci Eng Appl 11-6 458
[12] Hischier I Hess D Lipinski W Modest M Steinfield A 2009 Heat transfer 459
analysis of a novel pressurized air receiver for concentrated solar power via 460
combined cycles ASME Vol 1 041002-1 461
[13] Cui FQ He YL Cheng ZD Li D Tao YB 2012 Numerical simulations of 462
the solar transmission process for a pressurized volumetric receiver Energy 463
46618-628 464
[14] Wang M Siddiqui K 2010 The impact of geometrical parameters on the 465
thermal performance of a sola receiver of dish-type concentrated solar energy 466
system Renew Energy 352501-13 467
[15] Lu J Ding J Yang J Yang X 2012 Exergetic optimization for solar heat 468
receiver with heat loss and viscous dissipation Solar Energy 86 2273-81 469
[16] Song Xingwang Dong Guobo Gao Fangyuan Diao Xungang Zheng Liqing 470
Zhou Fuyun 2014 A numerical study of parabolic trough receiver with 471
no-uniform heat flux and helical screw-tape inserts Energy 77771-782 472
[17] Le Roux WG Bello-Ochende T Meyer JP 2011 Operating conditions of an 473
open and direct solar thermal Brayton cycle with optimized cavity receiver and 474
recuperator Energy 366027-6036 475
[18] Jianfeng Lu Jing Ding Jianping Yang Xiaoxi Yang 2013 Nonuniform heat 476
transfer model and performance of parabolic trough solar receiver Energy 477
59666-675 478
[19] Flesch R Stadler H Uhlig R 2014 Numerical analysis of the influence of 479
inclination angle and wind on the heat losses of cavity receivers for solar thermal 480
power towers Solar Energy 110427-37 481
[20] Min Wei Yilin Fan Lingai Luo Gilles Flamant 2015 Fluid flow distribution 482
optimization for minimizing the peak temperature of a tubular solar receiver 483
Energy 91663-677 484
[21] Tu N Wei J Fang J 2015 Numerical investigation on uniformity of heat flux 485
for semi-gray surfaces inside a solar cavity receiver Solar Energy 112128-43 486
[22] Capeillere J Toutant A Olalde G Boubault A 2014 Thermomechanical 487
behavior of a plate ceramic solar receiver irradiated by concentrated sunlight 488
Solar Energy 110 174-87 489
[23] Wang F Tan J Ma L Shuai Y Tan H Leng Y 2014 Thermal performance 490
analysis of porous medium solar receiver with quartz window to minimize heat 491
flux gradient Solar Energy 108 348-59 492
[24] Torres Reyes E Picon Nunez M Cervantes de GJ 1998 Exergetic analysis and 493
optimization of a solar-assisted heat pump Energy 23(4)337e44 494
[25] Ameri M Behbahaninia A Abbas Tanha A 2010 Thermodynamic analysis of 495
a tri-generation system based on micro-gas turbine with a steam ejector 496
refrigeration system Energy 352203-9 497
[26] Blanco-Marigorta AM Victoria Sanchez-Henriacutequez M Pentildea-Quintana JA 2011 498
Exergetic comparison of two different cooling technologies for the power cycle 499
of a thermal power plant Energy 361966-72 500
[27] Sarkar J 2010 Thermodynamic analyses and optimization of a recompression 501
N2O Brayton power cycle Energy 353422-8 502
[28] Wu C Chen L Sun F 1996 Performance of a regenerative Brayton heat engine 503
Energy 21(2)71-6 504
[29] Jianqin Zhu Kai Wang Hongwei Wu Dunjin Wang Juan Du AGOlabi 505
Experimental investigation on the energy and exergy performance of a coiled 506
tube solar receiver Applied Energy 2015 156 519-527 507
[30] Kai Wang Hongwei Wu Dunjin Wang Yongsheng Wang Zhiting Tong Feng 508
Lin AG Olabi Experimental Study on a Coiled Tube Solar Receiver under 509
Variable Solar Radiation Condition Solar Energy 2015122 1080ndash1090 510
[31] Mawire A Taole S 2014 Experimental energy and exergy performance of a 511
solar receiver for a domestic parabolic dish concentrator for teaching purposes 512
Energy Sustain Dev 19162-9 513
[32] Macphee D Dincer I 2009 Thermal modeling of a packed bed thermal energy 514
storage system during charging Appl Therm Eng 29695-705 515
[33] Petela R 2003 Exergy of undiluted thermal radiation Solar Energy 74469-88 516
[34] Moffat RJ Describing the uncertainties in the experimental results Exp Therm 517
Fluid Sci 1988 13-17 518
[35] 519
[36] Fig 1 Schematic drawing of experimental test rig 520
Receiver
Compressor
Filter
P T P T
Inlet
Outlet
Boom
Dish
Pedestal Control cabinet
Air tank
Flow meter
[37] 521
[38] Fig 2 Parabolic dish 522
[39] 523
[40] Fig 3 Protecting shield under the concentrated solar radiation 524
[41] 525
[42] (a) 526
[43] 527
Inlet
Outlet
CSR
[44] 528 [45] (b) 529
[46] Fig 4 Pressurized volumetric solar receiver (a) 3D model (b) cross sectional 530
view 531
[47] 532
[48] Fig5 Nickel foam 533
Inlet tube
Outlet tubeExternal cavity
Heat absorbing core
Quartz glass
Internal cavity
[49] 534
[50] Fig 6 Solar irradiance data during the day 535
[51] 536
[52] Fig 7 Variation of the inlet pressure outlet pressure and mass flow rate 537
1000 1030 1100 1130 1200 1230 1300 13300
100
200
300
400
500
600
700
800
Sola
r ir
rad
iacn
e (W
m2
)
Time
G
Testing process
1000 1030 1100 1130 120000
01
02
03
04
05
Pre
ssu
re(M
pa)
Time
Pi
Po
m
000
002
004
006
008
010
[53] 538
[54] Fig 8 Variation of the inlet temperature outlet temperature and mass flow rate 539
[55] 540
[56] Fig 9 Variation of the dish power receiver power and mass flow rate 541
1000 1030 1100 1130 12000
50
100
150
200
250
300
350
400
450
500
Tem
per
atu
re(
oC
)
Time
Tin
Tout
m
000
002
004
006
008
010
1000 1030 1100 1130 12000
5
10
15
20
25
Pow
er(k
W)
Time
ED
ER
m000
002
004
006
008
010
[57] 542
[58] (a) 543
[59] 544
[60] 545
[61] (b) 546
[62] Fig 10 Efficiency results (a) during the test period (b) efficiency vs mass flow 547
rate 548
1000 1030 1100 1130 1200
00
02
04
06
08
10
Efficiency
m
Time
Eff
icie
ncy
001
002
003
004
005
006
007
008
Mass
flo
w r
ate
0015 0020 0025 0030 0035 0040 0045 005002
03
04
05
06
07
08
09
10
Eff
icie
ncy
Mass flow rate(kgs)
Efficiency
[63] 549
[64] Fig 11 Heat loss factor profile during the test period 550
[65] 551
[66] Fig 12 Variation 552
of the power for the receiver energy and exergy 553
[67] during the test period 554
1000 1030 1100 1130 120000
02
04
06
08
10
12
Hea
t lo
ss f
acto
r U
L(k
wK
)
Time
U
L
1000 1030 1100 1130 12000
5
10
15
20
25
Pow
er(k
w)
Time
ED
ER
ExR
[68] 555
[69] Fig 13 Energy and Exergy efficiency profile during the test period 556
[70] 557
[71] Fig 14 The effect of temperature difference on the exergy factor 558
[72] 559
1000 1030 1100 1130 120000
01
02
03
04
05
06
07
08
09
10
Eff
icie
ncy
Time
Energy Efficiency
Exergy Efficiency
0 100 200 300 400 500000
005
010
015
020
025
030
035
040
045
Ex
erg
y f
acto
r
Tout-Tin
Exergy factor
Ex=013194+0000649(Tout
-Tin)
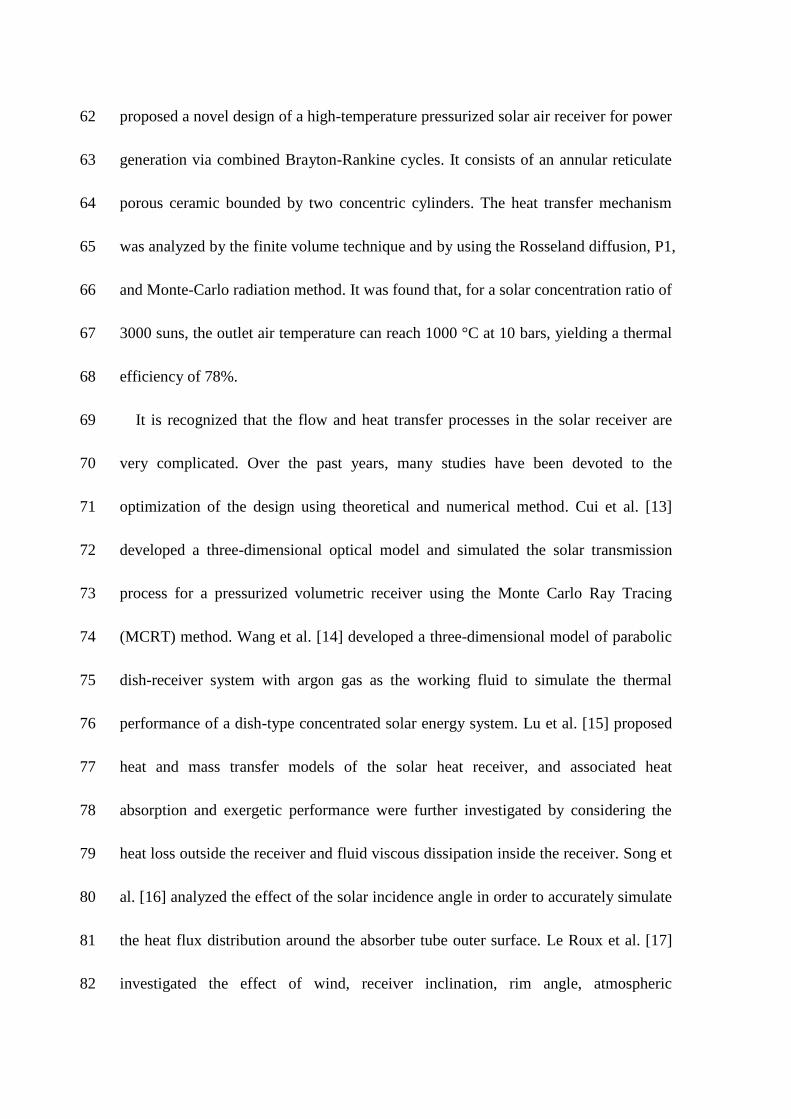
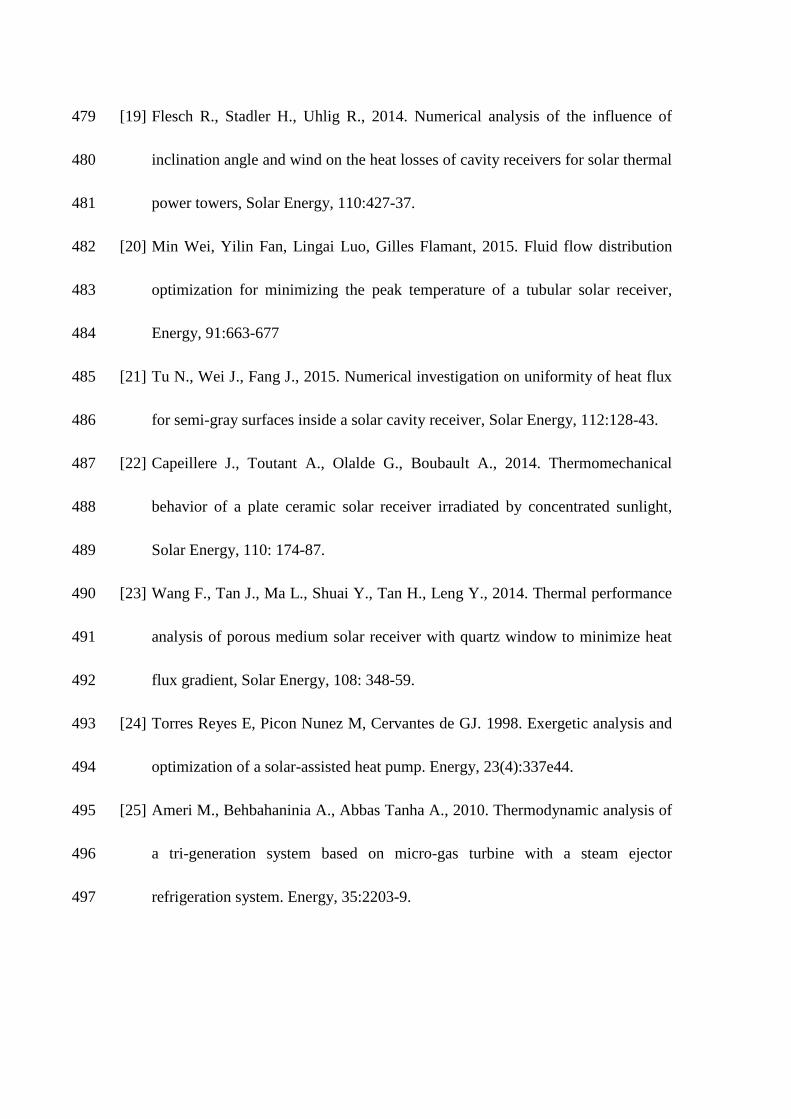
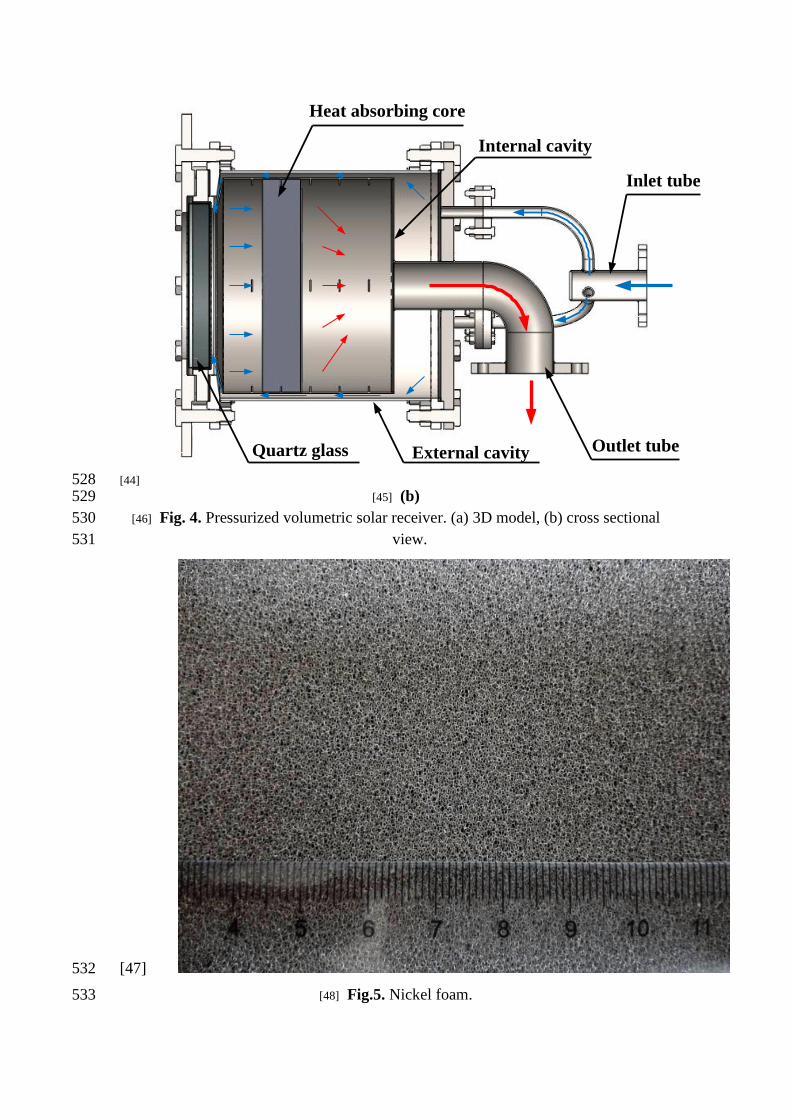
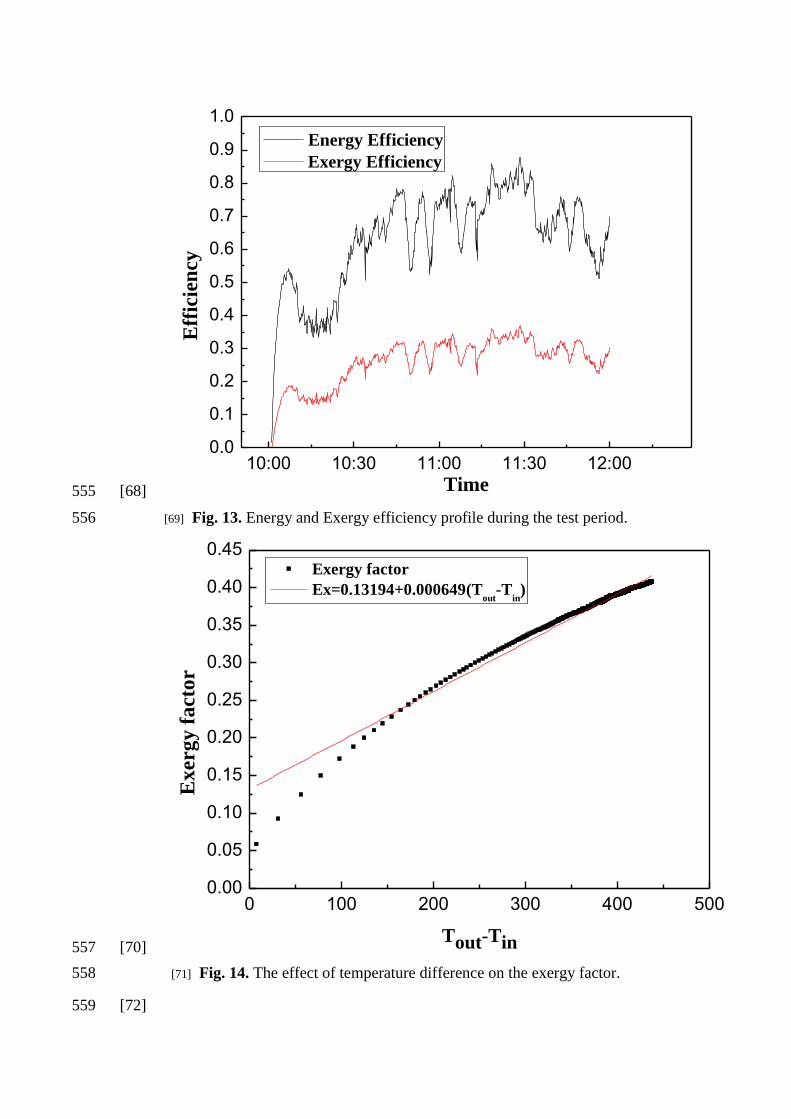