Cisco Connected Workplace pauses work at Cisco for a 1 -2 year period Flex Time Variation in when...
44
Cisco Connected Workplace Transformational Workspace Head, Capital Program Mgmt APJ September, 2014 Lisa Ng
Transcript of Cisco Connected Workplace pauses work at Cisco for a 1 -2 year period Flex Time Variation in when...

Cisco Connected Workplace
Transformational Workspace
Head, Capital Program Mgmt APJ September, 2014
Lisa Ng
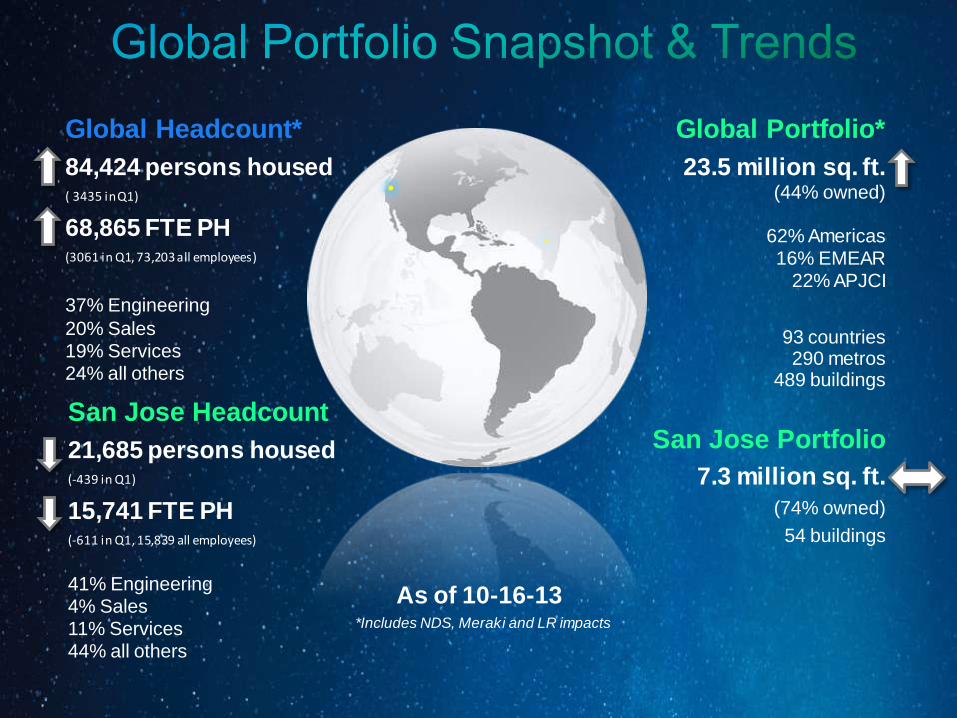
Global Headcount*
84,424 persons housed ( 3435 in Q1)
68,865 FTE PH (3061 in Q1, 73,203 all employees)
37% Engineering 20% Sales 19% Services 24% all others
Global Portfolio*
23.5 million sq. ft. (44% owned)
62% Americas 16% EMEAR
22% APJCI
93 countries 290 metros
489 buildings
San Jose Headcount
21,685 persons housed (-439 in Q1)
15,741 FTE PH (-611 in Q1, 15,839 all employees)
41% Engineering
4% Sales 11% Services 44% all others
San Jose Portfolio
7.3 million sq. ft.
(74% owned)
54 buildings
*Includes NDS, Meraki and LR impacts
As of 10-16-13

Real Estate Transactions
Workplace Solutions
Capital Program Mgmt
Facility Mgmt and Services
Customer Relationship Mgmt
Sales Support - EBCs
WPR
Strategic Planning
Functional Responsibilities

Why CCW?

Work Styles Have Evolved Work anytime, from anywhere

103.0
84.4
49.6
100%
82%
48%
0%
10%
20%
30%
40%
50%
60%
70%
80%
90%
100%
0
10
20
30
40
50
60
70
80
90
100
Seats in Portfolio Seats 'Assigned' (PH) Average Seats Utilized
Se
ats
(000s
) Global Office Space Utilization
Unused
Total
Capacity
Unused
“Assigned”
Capacity

Cisco Work Styles
1. Highly Mobile 2. Campus Mobile 3. Remote/Distant
Collaborator 4. Neighborhood
Collaborator 5. Workstation
Anchored
Highly mobile; Travels
extensively to customer
and partner locations;
frequently interacts with
customers
Internally mobile;
Interacts cross-
functionally in face-to-
face scheduled
meetings; Often in
leadership roles
Non-mobile employee
who works frequently
with remote colleagues,
and frequently works
from home
Neighborhood-based
employee who is mobile
within the group area;
interacts with,
coordinates and
manages teams
Desk-bound, non-
mobile employee who
performs highly focused
individual work; some
team interaction

22
4
44
6 4 4
58
19
8
4
19
16
8
4
11
14
9
28
10
16
29
31 50 32
10
19
24
33
15
38
33
33 39
13
28
18
49
5 12
24
13 14
5
25
0%
10%
20%
30%
40%
50%
60%
70%
80%
90%
100%
CA_AdvancedServices(n=1301)
CDO Consol(n=2478)
Cisco Services(n=249)
CorporateComms(n=182)
Finance, WPR& Admin(n=334)
Legal (n=52) Operations(n=1184)
WW Sales(n=1567)
GlobalPopulation(n=7612)
1. Highly Mobile 2. Campus Mobile 3. Remote/ Distant Collaborator 4. Neighborhood Collaborator 5. Workstation Anchored
Work Styles by Organization (2012 WPS)

Mobile vs. Remote vs. Fixed Work Styles (2012 WPS)
53
41
78
60%
45
37
54
85
56
28
10
16
29
31 50
32
10
19
18
49
5 12
24
13 14
5
25
0%
10%
20%
30%
40%
50%
60%
70%
80%
90%
100%
CA_AdvancedServices (n=1301)
CDO Consol(n=2478)
Cisco Services(n=249)
Corporate Comms(n=182)
Finance, WPR &Admin (n=334)
Legal (n=52) Operations(n=1184)
WW Sales(n=1567)
Global Population(n=7612)
Mobile Remote/Distance Collaborator Fixed

We are only
5 years away
from the Net Gen
entering the
workforce.
Traditionalist Boomer Generation X
1928–1945 1946–1964 1965–1980 1980–2000 2000–20??
Net Generation
Millennials
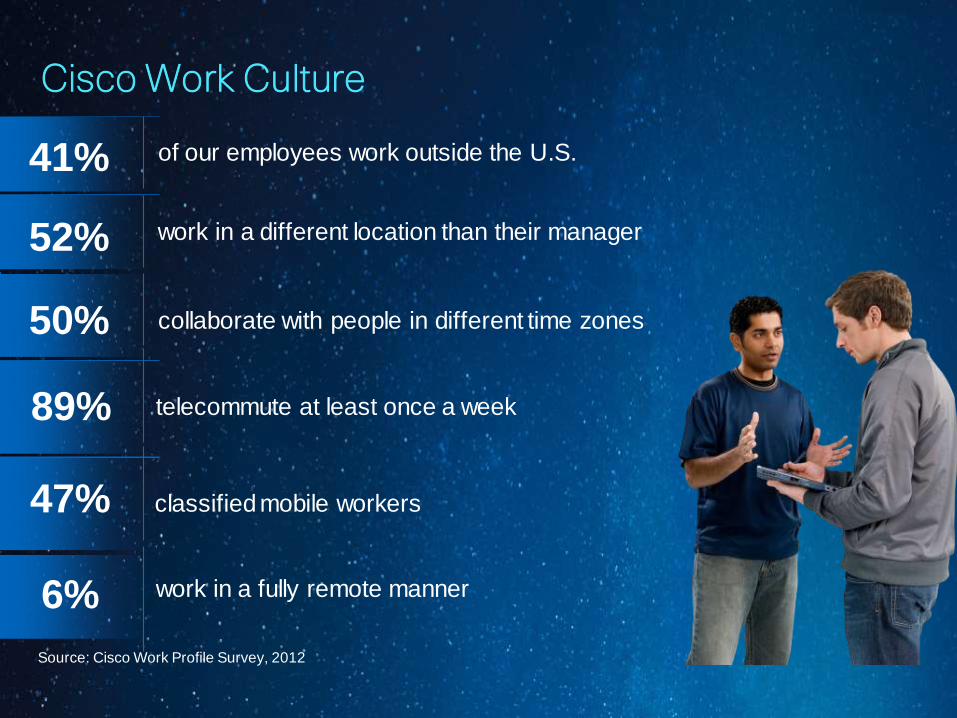
Cisco Work Culture
41%
52%
50%
89%
47%
6%
collaborate with people in different time zones
telecommute at least once a week
classified mobile workers
work in a fully remote manner
work in a different location than their manager
of our employees work outside the U.S.
Source: Cisco Work Profile Survey, 2012

2010 Cisco Connected World Report
Source: The 2010 Cisco Connected World Report
Participants preferred jobs with workplace flexibility and remote
access at lower salary to less-flexible jobs at higher salary.
Nearly half with remote access worked up to three extra hours
a day; a quarter worked four or more hours.
Three of every five employees (60 percent) believed it was
unnecessary to be in the office to be productive. This was
especially true in Asia and Latin America.
Two of every three employees (66 percent) expected IT to
allow the use of any device -- personal or company issued - to
access corporate data anywhere, at any time.
Click here for further information.............
What is CCW?

Workplace Design Strategy
Quadrant 1
Effectiveness
Work performance and productivity
Quadrant 2
Engagement
Employee engagement /
retention
Quadrant 3
Efficiency
Portfolio utilization and services improvement
Quadrant 4
Environment
Reductions in energy demands
and CO2 emissions
Cisco
on
Cisco

3 Concepts Combined
Technology
Cisco Connected Workplace
Policy
Environment

Flexible Work Practices
Part Time Employee works less than full-time hours
Telecommute Work performed outside of a Cisco office
Off / On
Ramp Employees pauses work at Cisco for a 1-2-year period
Flex Time Variation in when work is completed

Global Space Policy

Space Policy
Global Space Policy transforms Cisco’s workplace occupancy model from individual to group assignment.
A group assigned workplace provides flexibility and choice to the business while increasing the utilization of our assets.
Global Space Policy aligns with current work practices and does not require a change in current flexible work practices.

Enabling Messaging and Mobility Anywhere on any device
Single voice mailbox across all phone numbers
Simultaneous ring on all phones
Seamlessly move calls between mobile and
desktop phones
Extend your office phone
Place mobile calls through Cisco UCM

PCs & Macs Android & iOS Tablets Smart Phones
Explosion of Mobile Devices
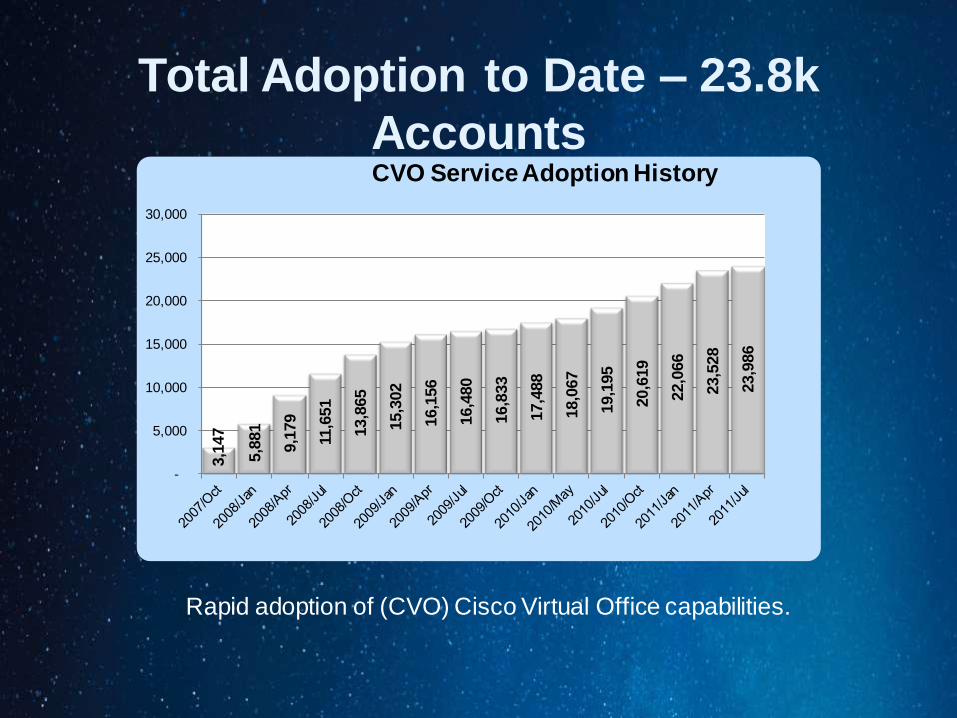
Total Adoption to Date – 23.8k
Accounts
3,1
47
5,8
81
9,1
79
11,6
51
13,8
65
15,3
02
16,1
56
16,4
80
16,8
33
17,4
88
18,0
67
19,1
95
20,6
19
22,0
66
23,5
28
23,9
86
-
5,000
10,000
15,000
20,000
25,000
30,000
CVO Service Adoption History
Rapid adoption of (CVO) Cisco Virtual Office capabilities.
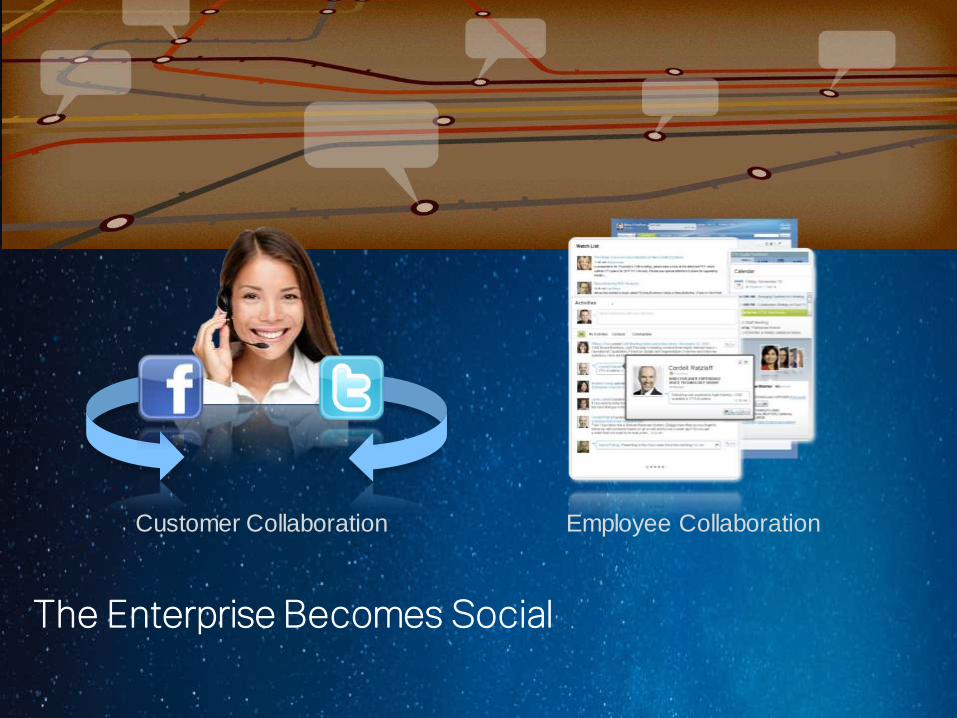
The Enterprise Becomes Social
Employee Collaboration Customer Collaboration
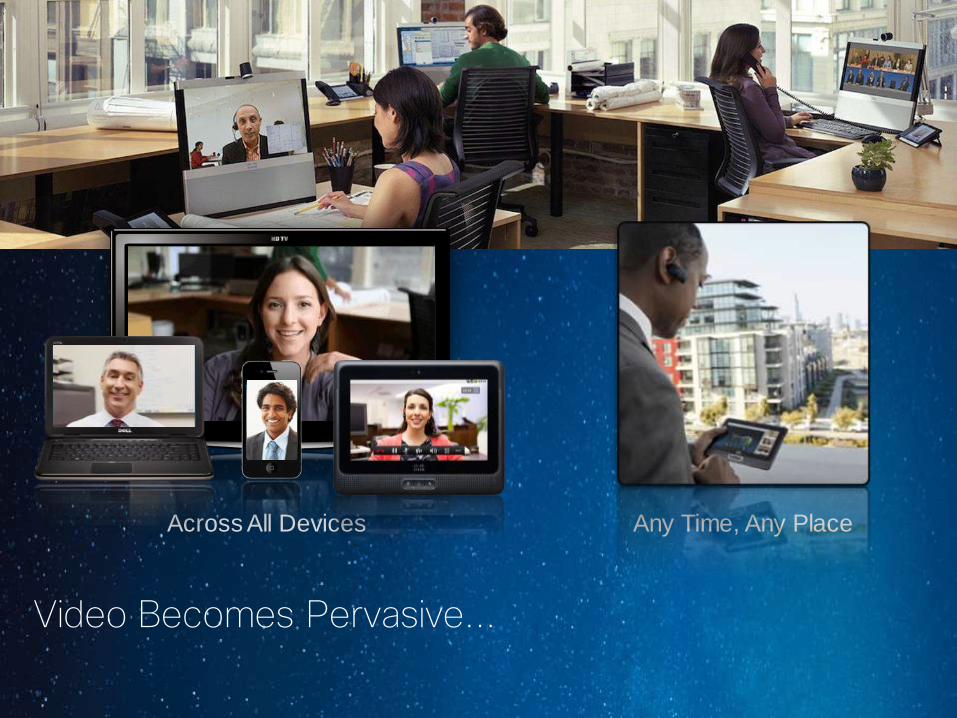
Any Time, Any Place
Video Becomes Pervasive...
Across All Devices

The New Collaborative Workspace
Mobile, Social, Visual, Virtual

SUSTAINABLE MANAGEMENT TEAMS
“SMT’s’ are local governance structures established to assure
the ongoing success in group assignments as determined by the
Global Space Policy. SMTs are comprised of an Office Council
of local business representatives and the WPR & HR teams that
support them.”

Proof of Concept
People
Prefer environment: + 77%
Improved communications: + 82%
Workforce satisfaction: + 82%
Ease of finding quiet space: + 62%
Ease of finding meeting room: + 80%
Financials
CAPEX Cable and IT Infrastructure - 50%
CAPEX for furniture - 55%
Space reduction for headcount - 30%
Return on Investment < 3 yrs

Cisco FY13–FY17 Environmental Goals
Goal Area Description
GHG Emissions
• Reduce Cisco’s scope 1 and 2 emissions 40% by 2017 with 2007
baseline
• Reduce Cisco’s Scope 3 air travel emissions 40% through 2017
with 2007 baseline
• Reduce electricity emission factor 50% below IEA World Average
by 2017
Energy Intensity • Reduce total operational energy use per revenue 15% by 2017
with 2007 baseline
Renewable
Energy
• Consume at least 25% of total electricity from renewable sources
each year through 2017
Extended Ops
(Supply Chain)
CDP Reporting
• Manufacturing, Tier 1 partner: 100% of spend report (Goal = 100%)
• Components, Tier 2 partner: 80% of spend report (Goal = 80%)
• Global transportation, Tier 1 partner: 93% of spend report (Goal =
90%)

Combining collaborative and networking technologies with an open floor plan and an emphasis on mobility — reconciling productive working patterns with environmental responsibility.
Sustainable Workplace at Cisco
Estimated Energy Efficiency Gains with Connected Workplace
Number of Employees
Traditional Office
300
Cisco Connected Workspace
Percent Change
400 33%
Increase
Connected Electrical Load (watts/square footage)
2.6 1.7 36%
Reduction
Connected Electrical Load (watts/employee)
432.9 178.7 58%
Reduction
Total Connected Electrical Load (watts)
127,169 71,476 44%
Reduction
Total Cooling Loads (BTUs) 433.646 243,733 44%
Reduction
Total Cooling Provision Tonnage 36 20 44%
Reduction
How do we implement CCW?

Solution Development
Heat maps provide building historical usage data
Data is used to populate the CCW Programming Template which provides breakdown and ratio’s of all space types
Universal Planning Guide provides high level performance specifications

Understanding Resistance
Tha
t’s Y
our J
ob!
I’m an
Engineer!
What about my equipment?
I’m a
Dire
cto
r!
…but I can’t
work in that Environment!
Everything I do is confidential!
That might be
fine for Sales but
it won’t work for me
But I’m
at m
y d
esk
every
day!
This isn’t fair!
I don’t care what the policy says,
just give me what I want.
This is just one more
thing that Cisco is taking
away from its employees
Give me my own
desk or I’ll
quit!
No! I’m going to just
work from home and
never go to the office
again!
I was promised an
office when I was hired
I w
on
’t g
et
an
y r
esp
ec
t
wit
ho
ut m
y
ow
n o
ffic
e

Change Management Curve
Support
for
Change
Time
Sponsors Consumers
No Commitment
Let it Happen
Passively Helping
Actively Helping
Making it Happen
Institutionalize
Unaware Understanding
Self Concern
Hands on Trial
Acceptance
Internalization
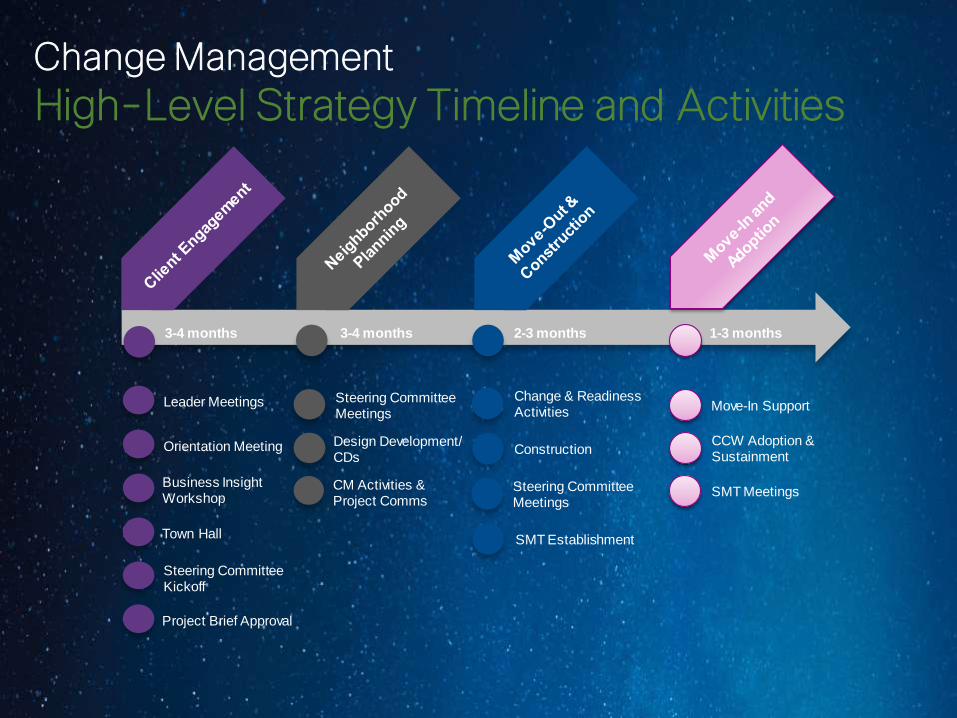
Change Management
High-Level Strategy Timeline and Activities
Leader Meetings
Orientation Meeting
Town Hall
Steering Committee Kickoff
Project Brief Approval
Steering Committee Meetings
Design Development/ CDs
CM Activities & Project Comms
Change & Readiness Activities
Construction
Steering Committee Meetings
SMT Establishment
Move-In Support
CCW Adoption & Sustainment
SMT Meetings
3-4 months 3-4 months 2-3 months 1-3 months
Business Insight Workshop

CCW Facts

Assessing Workplace Performance
Quadrant 1
Effectiveness
Work performance and productivity
Quadrant 2
Engagement
Employee engagement /
retention
Quadrant 3
Efficiency
Portfolio utilization and services improvement
Quadrant 4
Environment
Reductions in energy demands
and CO2 emissions
Cisco
on
Cisco
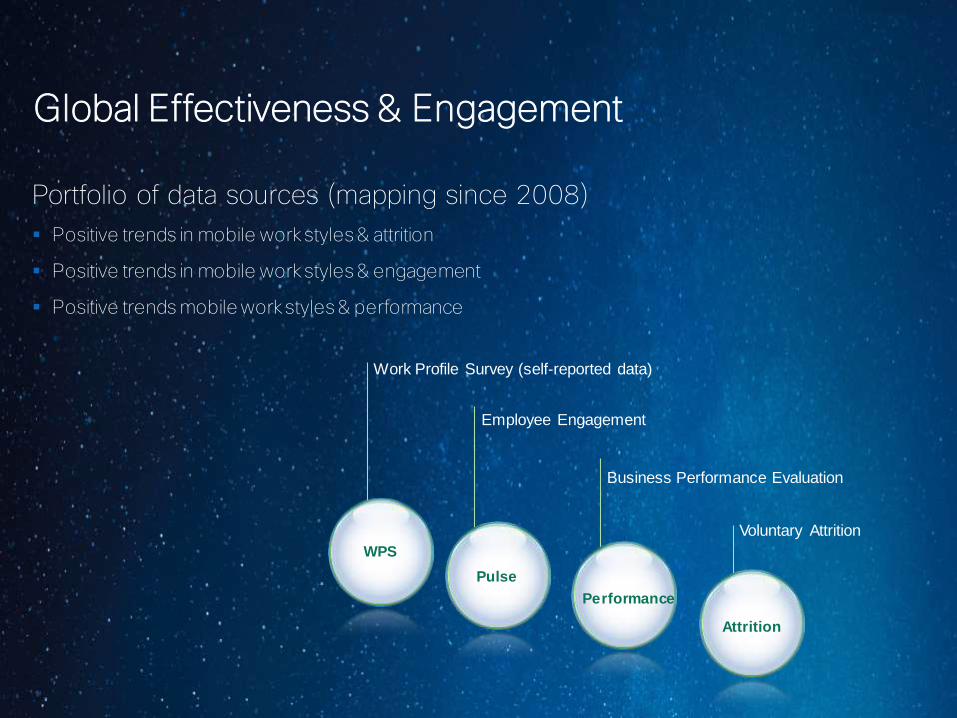
Portfolio of data sources (mapping since 2008)
Positive trends in mobile work styles & attrition
Positive trends in mobile work styles & engagement
Positive trends mobile work styles & performance
Global Effectiveness & Engagement
Work Profile Survey (self-reported data)
Employee Engagement
Business Performance Evaluation
Voluntary Attrition
WPS
Pulse
Performance
Attrition
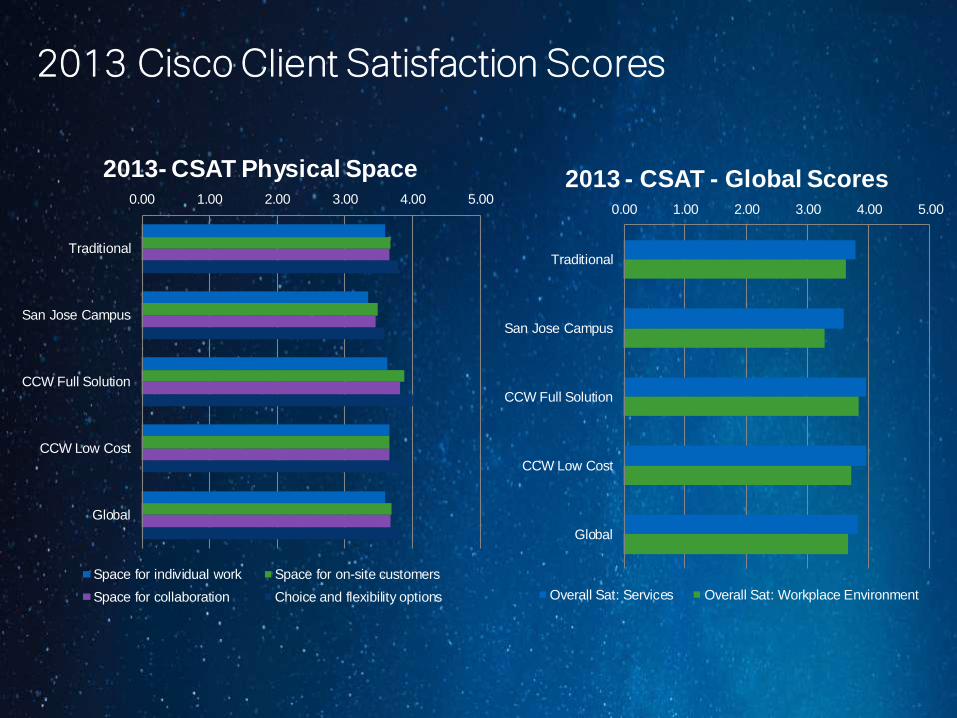
2013 Cisco Client Satisfaction Scores
0.00 1.00 2.00 3.00 4.00 5.00
Traditional
San Jose Campus
CCW Full Solution
CCW Low Cost
Global
2013- CSAT Physical Space
Space for individual work Space for on-site customers
Space for collaboration Choice and flexibility options
0.00 1.00 2.00 3.00 4.00 5.00
Traditional
San Jose Campus
CCW Full Solution
CCW Low Cost
Global
2013 - CSAT - Global Scores
Overall Sat: Services Overall Sat: Workplace Environment

Efficiency Savings
143
175
215
242
269
140
180
222
249
277
302
394
485
546
606
299
391
481
541
602
0 500 1000 1500 2000
Traditional Seat Count(Existing)
CCW Seat Count (Including oneseat per APR)
80% of Programmed Capacity(Based on 65% show up rate
and new seats)
90% of Programmed Capacity(Based on 65% show up rate
and new seats)
100% of Programmed Capacity(Based on 65% show up rate
and new seats)
CCW Loading Options (Typical SJ Footprint w/ 50% labs on floors 1 & 2)
Floor 1 Floor 2 Floor 3 Floor 4
-60% -40% -20% 0%
CCW Seat Count(Including one seat per
APR)
80% of ProgrammedCapacity (Based on 65%
show up rate and newseats)
90% of ProgrammedCapacity (Based on 65%
show up rate and newseats)
100% of ProgrammedCapacity (Based on 65%
show up rate and newseats)
Typical Cost Savings (884 persons housed in a leased building in
SJ vs Traditional)
Annual Rent Variance
Annual Operations Cost Variance
Total Buildout Cost Variance

Combining collaborative and networking technologies with an open floor plan and an emphasis on mobility — reconciling productive working patterns with environmental responsibility.
Environmental Savings
Estimated Energy Efficiency Gains with Connected Workplace
Number of Employees
Traditional Office
300
Cisco Connected Workspace
Percent Change
400 33%
Increase
Connected Electrical Load (watts/square footage)
2.6 1.7 36%
Reduction
Connected Electrical Load (watts/employee)
432.9 178.7 58%
Reduction
Total Connected Electrical Load (watts)
127,169 71,476 44%
Reduction
Total Cooling Loads (BTUs) 433.646 243,733 44%
Reduction
Total Cooling Provision Tonnage 36 20 44%
Reduction
Source: CCW Environment Sustainability Report

Closing Thoughts
40
Cloud computing, any device, any where…..

Thank you

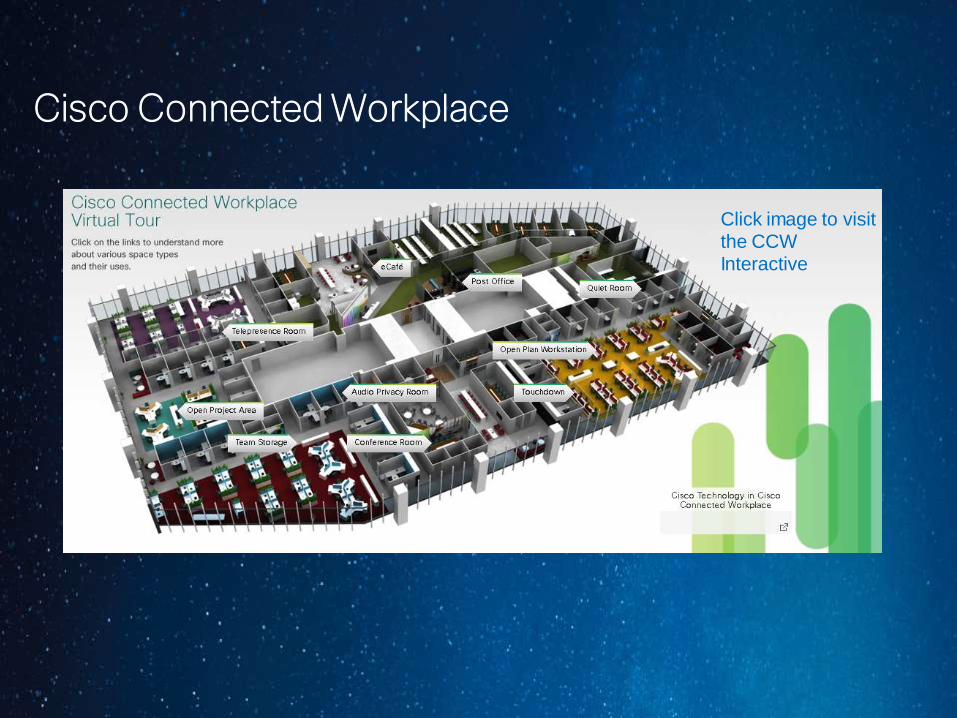
Cisco Connected Workplace
Click image to visit the CCW Interactive

Typical Results
Typical floor in San Jose Legacy Environment Cisco Connected Workplace
Usable Area 49,000 sq. ft. 49,000 sq. ft.
Work Space 70% individual 30% individual
30% collaborative 70% collaborative
Use Pattern Traditional, Assigned Flexible, Unassigned
Seat Capacity 300 375
Enclosed Meeting Spaces 16 72
Usable Area / Capacity* 163 sq. ft. 111 sq. ft.
Chargeback per Employee $5,162 per year $2,596 per year
Persons Housed 255 400-500 *
* Based on 75% Badge-In Rate