A global review of dry recycling and food waste collections and
Upload
promocionmusicalesCategory
view
121download
5
Report 2015
CISAC GLOBAL COLLECTIONS
Reproduction Rights
Europe
DRAMAPrivate copying
ASIa-PACIFIc

ContentsThe statistics presented in this survey were compiled from data supplied to CISAC by its members (including Members, Provisionals and Associates).
The calculations are based on the gross domestic collections of CISAC societies. These generally correspond to the royalties collected for the use of the global repertoire in the societies’ respective territories. Therefore, international exchanges between societies are not included.
The figures presented in this survey do not cover all the royalties that may be received by creators around the world, but only the royalties collected on behalf of creators by the collective management organisations that are members of CISAC. For example, royalties collected directly by music publishers for songwriters and composers (such as synchronisation royalties) do not fall within the remit of this survey.
The regional groupings reflect the five CISAC regions (Africa, Asia-Pacific, Canada-USA, Europe, and Latin America & Caribbean), as opposed to the regions defined by the United Nations.
The collection figures are calculated in current Euros. This means that the figures shown for the previous years are not recalculated based on the value of the Euro in 2013.
The external sources used to enhance this report were: The World Bank (population and GDP data), GfK and the UN (smartphone data), and ZenithOptimedia and Carat (advertising market data).
Part 1: Overview
P.1 Foreword – Jean Michel JarreP.2 Chairman’s Message – Eric BaptisteP.3 Introduction – Gadi Oron P.4 2013 Key FiguresP.6 Global Revenue Trends by Region 2010-2013P.8 Performing Rights Reached €6bn in 2013
Part 2: CISAC Data Analysis
P.10 Europe CollectionsP.12 Canada-USA CollectionsP.14 Asia-Pacific CollectionsP.16 Latin America & Caribbean CollectionsP.18 Africa CollectionsP.20 Focus on the BRICSP.22 Trends in Music CollectionsP.23 Trends in Non-Music CollectionsP.24 2013 Collections per Head of PopulationP.25 2013 Collections as a Percentage of GDPP.26 Trends in Global Collections by Type of RightP.28 Performing Rights in 2013P.29 Reproduction Rights in 2013P.30 Other Rights in 2013P.31 Source of Collections by Region in 2013P.32 Exchange Rate Table
Part 3: Market Trends
P.34 Understanding the Digital Music MarketP.35 Understanding the Live Music MarketP.36 Advertising Revenues 2013-2016P.38 Internet Penetration P.39 Smartphone PenetrationP.40 GlossaryP.41 CISAC MembershipP.43 About CISAC
Methodology
1
Foreword - Jean Michel Jarre
As the President of an organisation that represents more than three million creators – music composers like me, lyricists, film directors and screenwriters, painters, photographers and many other creative people – I am delighted to introduce this royalties report.
CISAC member societies work tirelessly and efficiently around the world to collect and distribute royalties from the use of our creative works. They have managed to maintain a high level of collections in 2013 despite a tough economic climate and an even tougher copyright environment – a testimony to the hard work done on behalf of creators by our authors’ societies.
The relationship that we have with our authors' societies is very special and quite often misunderstood. Let's be clear: authors' rights ensure us rewards for our creative endeavours. It is fair compensation for the use of our works. We have empowered our societies – represented by CISAC – to guarantee that our rights are respected and our royalties collected.
Creators are the singular force behind the works – films, paintings, songs, books, poems, pictures – that millions around the world enjoy. Yet we are often at the mercy of groups that control the channels of distribution of our works. This is acutely felt in today's digital ecosystem where creators are the most fragile element. For this reason, we rely heavily on our authors' societies and CISAC to take care of our interests. Alone, we are vulnerable, but when we combine our strengths, via the societies that represent us and protect our works, we have a voice.
As creators, we are attached to the fairly simple and extremely modern concept of collective management of rights. This is a system that allows us to devote time to creation, with the insurance that even the most modest use of our works will be tracked and remunerated. This collection report shows that creators in Africa, the Americas, Asia, Australasia and Europe fully benefit from this system. Let's make sure that it continues to successfully serve the wide community of creators for many years to come.
Jean Michel Jarre President, CISAC
2
Chairman’s Message - Eric Baptiste
The creative industries make a unique contribution to the economic and cultural well-being of nations and individuals all around the world. At the heart of these industries – which generate revenues and create jobs – are the creators. CISAC’s members represent some three million creators worldwide in all creative fields. Our network of member societies are the custodians of the works that these creators have written, painted, composed, filmed or photographed. These creative works are engines of growth and enable many businesses to be more successful and, in many cases, simply to exist: think of online services without music, movies and TV series without scripts, auction houses without paintings…
Our responsibility is thus to ensure that these works are treated with respect, and that creators are remunerated properly and fairly when their works are used in both the physical and the digital world. CISAC’s annual global collections report reflects the widespread use of creative works around the world and the crucial role played by all our member societies in creating value for creators (and for music publishers). As you will see in this report and in Gadi Oron’s overview, recent years have been very successful despite a challenging legal and economic environment. This does not happen by sheer luck; it reflects the hard work and dedication of the boards, management teams and all staff within CISAC societies around the world. We are proud to report this, and to underline how adaptable and efficient collective management of rights has become in the digital age.
Through the system of collective management of rights, societies are harnessing the individual voices of each creator into a collective one to give them more clout, more strength, and more bargaining power at a time when, on the other side of the table, major global corporations use creative content to build their businesses.
Our member societies also act as market enablers for the wide range of users who need this creative content. We facilitate access to creative works, we license thousands of users and services across the globe, and, in return, we ensure that creators get properly compensated.
CISAC will continue to relentlessly advocate for the rights of creators, ensuring that the Marcelo Piñeyros, Angélique Kidjos, Ousmane Sows, Javed Akhtars and Jean Michel Jarres of tomorrow are able to develop their craft in a world that recognises their value and their contribution.
Eric Baptiste Chairman of the Board of Directors, CISAC
3
Introduction - Gadi Oron
CISAC member societies posted good results in 2013, having together collected €7.8bn on behalf of creators and publishers worldwide. Whilst top line revenues in Euros fell ever so slightly from the previous year (down 0.8%), this drop reflects fluctuations in exchange rates, with most currencies weakening against the Euro. Excluding the impact of foreign exchange, the underlying revenue growth, in constant Euros, reached +4.6%.
Our collections report aggregates data from 230 member societies in 120 countries, covering all artistic repertoires—music, audiovisual, drama, literary and visual arts. The music repertoire accounts for the vast majority of royalty collections by our members (87% of global collections), but we are seeing encouraging progress in other areas such as audiovisual collections, which were up 8%.
Geographically, Europe remains the largest market, accounting for 61% of global collections. This region continued to show stable growth of 2% in 2013, in line with previous years. The second largest region was Canada-USA, followed by Asia-Pacific, where collections declined by 16% owing to unfavourable exchange rates. We witnessed a significant 17% increase in collections in Latin America & Caribbean, and the share of the African region in global collections in 2013 was 0.7%. In the BRICS countries, collections jumped by 30% although total revenues were only €365 million. Considering that one third of the world’s population lives in these countries, this figure represents very low per capita income. The growth potential in these markets is clear and evident.
The digital market continues to show great promise. In 2013, royalties collected by CISAC members from digital services rose 25% over the previous year. However, digital income still accounts for a mere 5% of the total royalties collected by CISAC societies around the world. This figure demonstrates both the potential of the digital market and the critical importance of achieving fair revenue models for creators.
Overall, 45% of global collections still come from traditional media outlets (radio, TV, cable and satellite), which remain a major source of income for creators. Royalty collections in this category were resilient in 2013, adapting effectively to advances in the market. The surge in the live music sector led to an increase of 5% in royalties collected for the use of music in live performances.
Once again in 2013, CISAC’s societies worked diligently on behalf of their affiliated creators and publishers. Their unwavering commitment to providing services that meet shifting market demands, whilst upholding and promoting authors’ rights globally, is essential to fostering a dynamic creative sector in which creators can make a living from their work now and in the future.
Gadi Oron Director General, CISAC

4
€7.8bnThe amount CISAC member societies collected in 2013
+17%The growth experienced
in Latin America & Caribbean in 2013
+30%The growth experienced
in the BRICS countries in 2013
€6bnPerforming Rights collections reached
€6bn for the first time
+25%Digital & Multimedia year-on-year growth
+4.6%Year-on-year growth in
total collections, in constant currency
61%of total collections came from Europe
87%Music accounted for 87%
of total collections in 2013
€1.30
The average collections per head of population
in CISAC countries/ territories
78%
Performing Rights accounted for 78% of total collections
2013 Key FiguresBASED ON 2013 COLLECTIONS

5
ANNUAL CHANGE IN GLOBAL COLLECTIONSSource: CISAC
Key Highlights: Underlying growth of 4.6% in 2013
2013 was another solid year for royalty collections by CISAC member societies around the world. Total collections stayed at around €7.8 billion, in spite of a slightly negative growth rate (-0.8%) which is attributed to currency exchange rates.
Indeed, excluding the impact of foreign exchange, global royalty collections would have grown by 4.6% to a new high of €8.2bn in 2013.
Exchange rate fluctuations adversely affected both mature markets (e.g. Australia, Canada) and emerging markets (e.g. Brazil, Argentina, South Africa and Russia). The Japanese Yen was the most affected currency, falling 21% against the Euro.
Collective management of authors’ rights once again showed its relevance in the digital age and its strong contribution to national economies, as evidenced by the diversity of the types of royalties collected, by societies’ ability to offset a decline experienced by certain repertoires (e.g. literary) with growth in others (e.g. audiovisual) and by the impressive increase in collections in many emerging countries. Live music also continued to grow and is a key source of revenue for creators in emerging markets.
While there is still significant room for progress, collections from digital use of creative works increased by 25% in 2013. They still represent only a tiny share (5%) of overall global collections, indicating future opportunities for growth.
E7 000
E8 000
E9 000
E6 000
E4 000
E5 000
E2 000
E1 000
E3 000
E0
7 820 7 757 7 820
2012 2013
8 180
Fixed Exchange Rates
Floating Exchange Rates
Milli
ons
-0.8% +4.6%

6
GLOBAL COLLECTIONS BY REGIONSource: CISAC
Global Revenue Trends by Region 2010–2013
E7 000
E8 000
E6 000
E4 000
E5 000
E2 000
E1 000
E3 000
E0
2011 2012 20132010
Europe
Canada-USA
Asia-Pacific
Latin America & Caribbean
Africa
7 514 7 5847 820 7 757
1 123 1 270 1 452 1 223
303 365439 51449 44
56 54
1 449 1 368 1 277 1 265
4 591 4 537 4 596 4 702
Milli
ons

7
-20%
-10%
0%
10%
20%
Europe
Canada-USA
Asia-Pacific
Latin America & Caribbean
Africa
2013 SHARE OF REGIONS IN GLOBAL COLLECTIONSSource: CISAC
% CHANGE BY REGION 2012-2013Source: CISAC
0.7%
16.9%
2.3%
-3.3%-1.0%
-15.8%
Global Collections in 2013
16.3%
6.6%
60.6%
15.8%

8
TOTAL CISAC COLLECTIONS: €7 757M IN 2013Source: CISAC
Performing Rights Reached e6bn in 2013
Exploitation of Performing Rights accounted for the vast majority (78%) of total royalties for CISAC societies. Performing Rights royalty collections were worth €6 025m in 2013, up 2.4% from €5 886m in 2012, exceeding six billion Euros for the first time.
In 2013, 18% of CISAC society collections came from Reproduction Rights. Royalty collections from Reproduction Rights fell to €1 392m in 2013, a significant decline of 13.4% compared to royalty collections of €1 607m in 2012.
The remaining 4% of global society collections came from a variety of other rights, including Rental/Lending, Private Copying levies and income from the visual artist’s Resale Right. Collections from Other Rights generated €340m in 2013, compared to €327m collected in 2012, an increase of 3.8%.
Private Copying levies grew by 5% in 2013 (€237m).In million € 2012 2013 % change % share 2013
Performing Rights 5 886 6 025 +2.4% 77.7%
Reproduction Rights 1 607 1 392 -13.4% 17.9%
Other Rights 327 340 +3.8% 4.4%
Total Collections 7 820 7 757 -0.8%
E7 000
E6 000
E4 000
E5 000
E2 000
E1 000
E3 000
E0
5 886 6 025
1 607
2012 2013
327 340
1 392
ReproductionRights
OtherRights
Performing Rights
Milli
ons
9
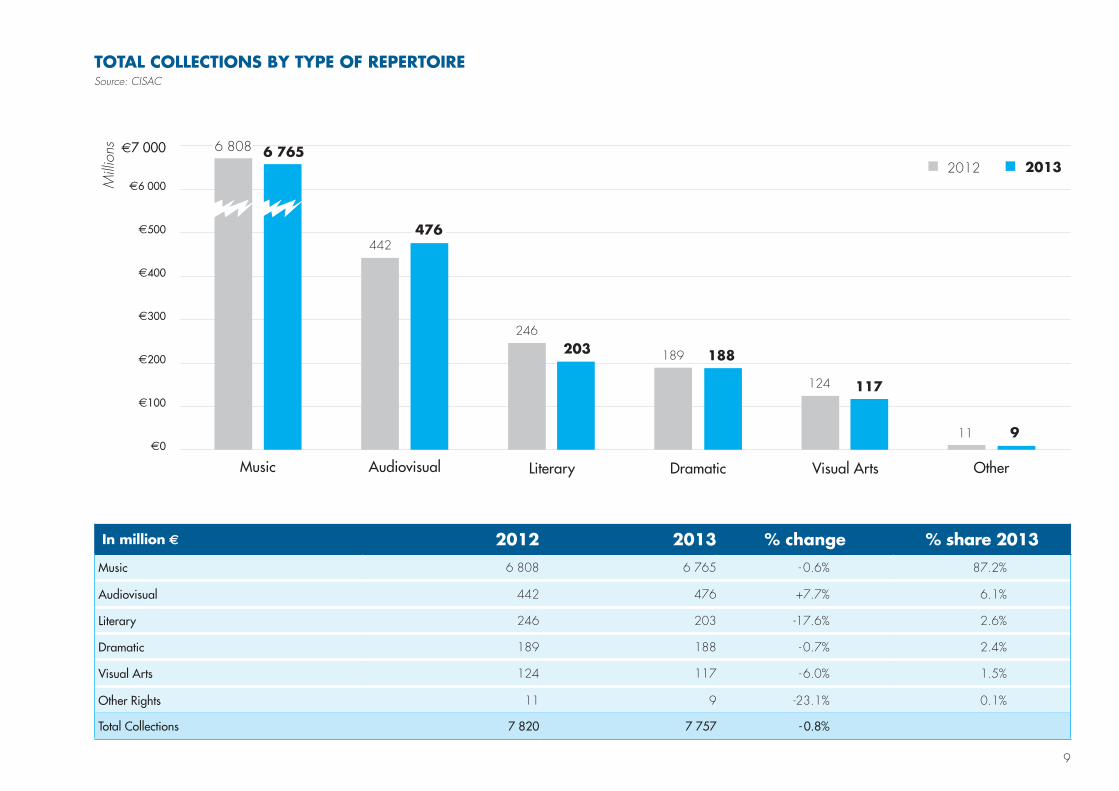
TOTAL COLLECTIONS BY TYPE OF REPERTOIRESource: CISAC
In million € 2012 2013 % change % share 2013
Music 6 808 6 765 - 0.6% 87.2%
Audiovisual 442 476 +7.7% 6.1%
Literary 246 203 -17.6% 2.6%
Dramatic 189 188 - 0.7% 2.4%
Visual Arts 124 117 - 6.0% 1.5%
Other Rights 11 9 -23.1% 0.1%
Total Collections 7 820 7 757 - 0.8%
E7 000
E6 000
E400
E500
E200
E100
E300
E0
6 808
442
246
189
124
11
6 765
476
203 188
117
9
Audiovisual Literary Dramatic Visual Arts OtherMusic
2012 2013
Milli
ons

10
CISAC’S EUROPEAN SOCIETIES COLLECTED €4 702M IN 2013Source: CISAC
Europe: €4 702m ; 60.6% of Total Collections
CISAC’s European societies collected €4 702m in 2013, a 2.3% increase on their collections of €4 596m in 2012. European societies contributed 60.6% of CISAC global collections in 2013, up from 58.8% in 2012.
Exploitation of Performing Rights accounted for 76% of income for European societies. Performing Rights royalty collections were worth €3 566m in 2013, up 4% from €3 431m in 2012.
In 2013, 18% of European society collections came from Reproduction Rights. Royalty collections from Reproduction Rights in Europe fell to €840m in 2013, a decline of 5.8% compared to royalty collections of €893m in 2012.
The remaining 6% of European society collections came from a variety of other rights, including Rental/Lending, Private Copying levies and income from the visual artist’s Resale Right. Collections from Other Rights generated €295m in 2013, compared to €272m collected in 2012, an increase of 8.2%.
In million € 2012 2013 % change % share 2013
Performing Rights 3 431 3 566 +4.0% 75.9%
Reproduction Rights 893 840 -5.8% 17.9%
Other Rights 272 295 +8.2% 6.3%
Total Europe Collections 4 596 4 702 +2.3%
E3 500
E4 000
E3 000
E2 000
E2 500
E1 000
E500
E1 500
E0
3 431 3 566
893
2012 2013
272 295
840
ReproductionRights
OtherRights
Performing Rights
Milli
ons
11
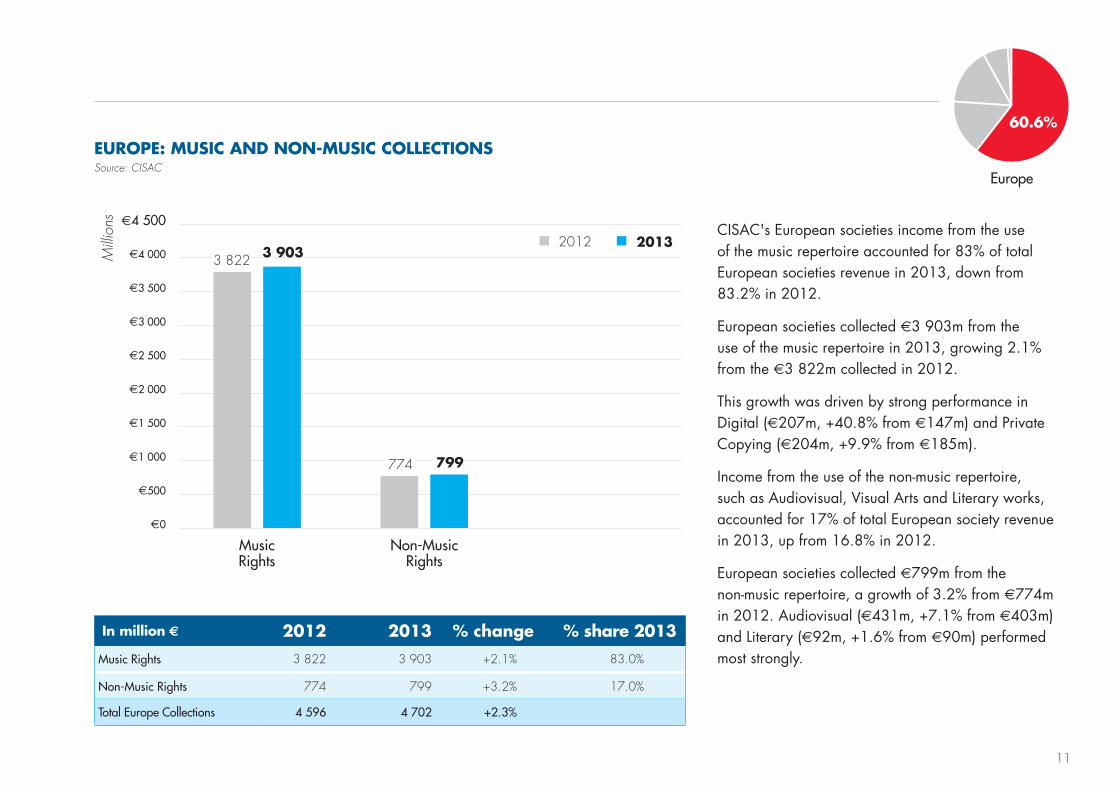
EUROPE: MUSIC AND NON-MUSIC COLLECTIONSSource: CISAC
CISAC's European societies income from the use of the music repertoire accounted for 83% of total European societies revenue in 2013, down from 83.2% in 2012.
European societies collected €3 903m from the use of the music repertoire in 2013, growing 2.1% from the €3 822m collected in 2012.
This growth was driven by strong performance in Digital (€207m, +40.8% from €147m) and Private Copying (€204m, +9.9% from €185m).
Income from the use of the non-music repertoire, such as Audiovisual, Visual Arts and Literary works, accounted for 17% of total European society revenue in 2013, up from 16.8% in 2012.
European societies collected €799m from the non-music repertoire, a growth of 3.2% from €774m in 2012. Audiovisual (€431m, +7.1% from €403m) and Literary (€92m, +1.6% from €90m) performed most strongly.
In million € 2012 2013 % change % share 2013
Music Rights 3 822 3 903 +2.1% 83.0%
Non-Music Rights 774 799 +3.2% 17.0%
Total Europe Collections 4 596 4 702 +2.3%
E3 500
E4 000
E4 500
E3 000
E2 000
E2 500
E1 000
E500
E1 500
E0
3 822
774
3 903
799
2012 2013
Non-MusicRights
Music Rights
Milli
ons
60.6%
Europe
12
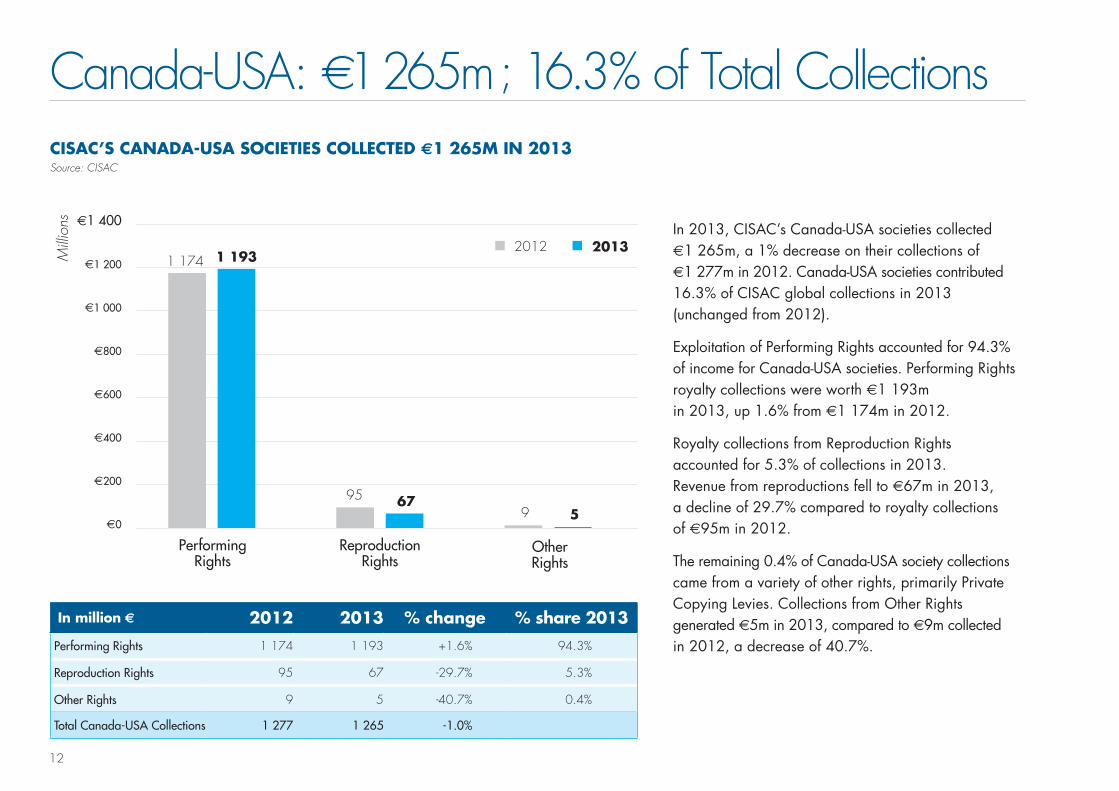
CISAC’S CANADA-USA SOCIETIES COLLECTED €1 265M IN 2013Source: CISAC
Canada-USA: €1 265m ; 16.3% of Total Collections
In 2013, CISAC’s Canada-USA societies collected €1 265m, a 1% decrease on their collections of €1 277m in 2012. Canada-USA societies contributed 16.3% of CISAC global collections in 2013 (unchanged from 2012).
Exploitation of Performing Rights accounted for 94.3% of income for Canada-USA societies. Performing Rights royalty collections were worth €1 193m in 2013, up 1.6% from €1 174m in 2012.
Royalty collections from Reproduction Rights accounted for 5.3% of collections in 2013. Revenue from reproductions fell to €67m in 2013, a decline of 29.7% compared to royalty collections of €95m in 2012.
The remaining 0.4% of Canada-USA society collections came from a variety of other rights, primarily Private Copying Levies. Collections from Other Rights generated €5m in 2013, compared to €9m collected in 2012, a decrease of 40.7%.
In million € 2012 2013 % change % share 2013
Performing Rights 1 174 1 193 +1.6% 94.3%
Reproduction Rights 95 67 -29.7% 5.3%
Other Rights 9 5 -40.7% 0.4%
Total Canada-USA Collections 1 277 1 265 -1.0%
E1 400
E1 200
E800
E1 000
E400
E200
E600
E0
1 174 1 193
95
2012 2013
9 5 67
ReproductionRights
OtherRights
Performing Rights
Milli
ons
13
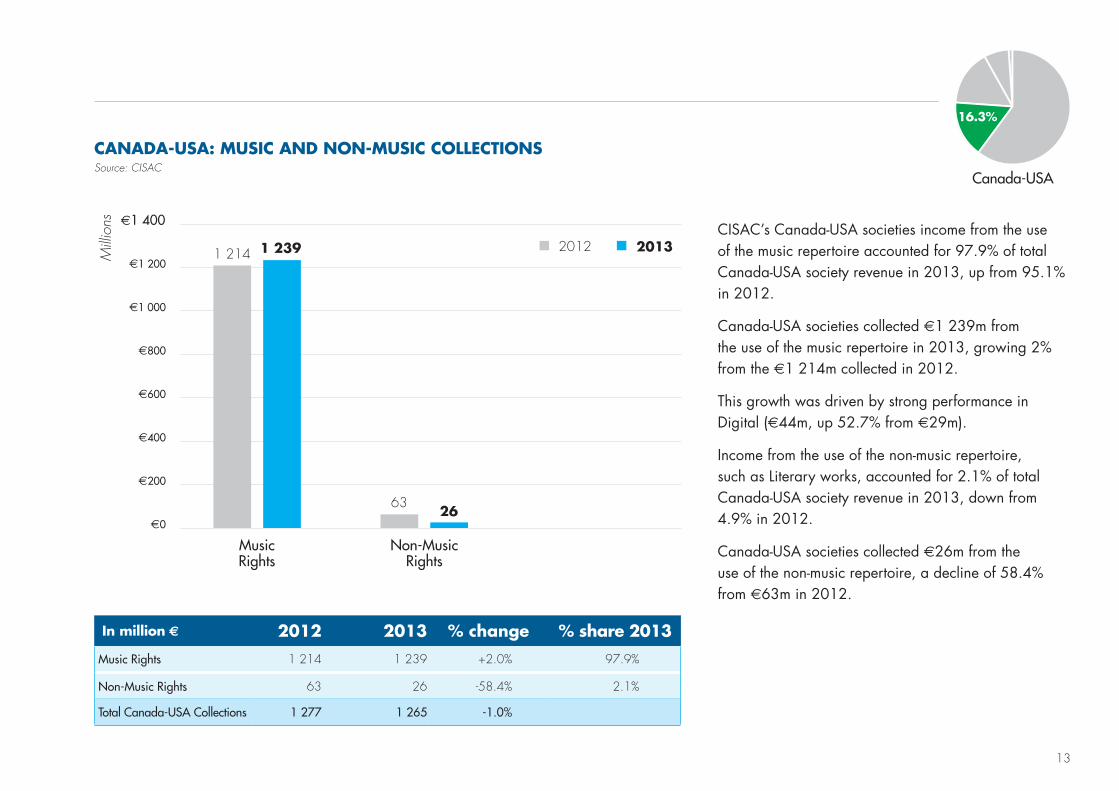
CANADA-USA: MUSIC AND NON-MUSIC COLLECTIONSSource: CISAC
CISAC’s Canada-USA societies income from the use of the music repertoire accounted for 97.9% of total Canada-USA society revenue in 2013, up from 95.1% in 2012.
Canada-USA societies collected €1 239m from the use of the music repertoire in 2013, growing 2% from the €1 214m collected in 2012.
This growth was driven by strong performance in Digital (€44m, up 52.7% from €29m).
Income from the use of the non-music repertoire, such as Literary works, accounted for 2.1% of total Canada-USA society revenue in 2013, down from 4.9% in 2012.
Canada-USA societies collected €26m from the use of the non-music repertoire, a decline of 58.4% from €63m in 2012.
In million € 2012 2013 % change % share 2013
Music Rights 1 214 1 239 +2.0% 97.9%
Non-Music Rights 63 26 -58.4% 2.1%
Total Canada-USA Collections 1 277 1 265 -1.0%
E1 000
E1 200
E1 400
E800
E400
E600
E200
E0
1 214
63
1 239
26
2012 2013
Non-MusicRights
Music Rights
Milli
ons
Canada-USA
16.3%

14
CISAC’S ASIA-PACIFIC SOCIETIES COLLECTED €1 223M IN 2013Source: CISAC
Asia-Pacific: €1 223m ; 15.8% of Total Collections
In 2013, CISAC’s Asia-Pacific societies collected €1 223m, a 15.8% decrease on their collections of €1 452m in 2012. Asia-Pacific societies contributed 15.8% of CISAC global collections in 2013 (down from 18.6% in 2012).
The Asia-Pacific region was particularly impacted by exchange rates. Japan was the most affected, with the Yen falling 21% against the Euro.
Income from the use of Performing Rights accounted for 59.8% of income for Asia-Pacific societies, worth €731m in 2013 (-11.6% from €827m in 2012).
In 2013, 37.3% of Asia-Pacific society collections came from Reproduction Rights. Royalty collections from Reproduction Rights in Asia-Pacific fell to €456m in 2013, a decline of 21.9% compared to royalty collections of €584m in 2012.
The remaining 2.9% of Asia-Pacific societies’ collections came from a variety of other rights, including Private Copying Levies. Collections from Other Rights generated €36m in 2013, compared to €41m collected in 2012, a decrease of 13.3%.
In million € 2012 2013 % change % share 2013
Performing Rights 827 731 -11.6% 59.8%
Reproduction Rights 584 456 -21.9% 37.3%
Other Rights 41 36 -13.3% 2.9%
Total Asia-Pacific Collections 1 452 1 223 -15.8%
E700
E900
E800
E600
E400
E500
E200
E100
E300
E0
827
731
584
2012 2013
41 36
456
ReproductionRights
OtherRights
Performing Rights
Milli
ons

15
ASIA-PACIFIC: MUSIC AND NON-MUSIC COLLECTIONSSource: CISAC
CISAC’s Asia-Pacific societies income from the use of the music repertoire accounted for 91.8% of total Asia-Pacific society revenue in 2013, down from 92.3% in 2012.
Asia-Pacific societies collected €1 122m from the use of the music repertoire in 2013, declining 16.3% from the €1 340m collected in 2012.
This decline was driven by weak performance in Video & Cinema (€149m, down 28% from €207m).
Income from the use of the non-music repertoire, such as Audiovisual and Literary works, accounted for 8.2% of total Asia-Pacific society revenue in 2013, up from 7.7% in 2012.
Asia-Pacific societies collected €101m from the non-music repertoire, a decline of 10% from €112m in 2012.
In million € 2012 2013 % change % share 2013
Music Rights 1 340 1 122 -16.3% 91.8%
Non-Music Rights 112 101 -10.0% 8.2%
Total Asia-Pacific Collections 1 452 1 223 -15.8%
E1 000
E1 200
E1 600
E1 400
E800
E400
E600
E200
E0
1 340
112
1 122
101
2012 2013
Non-MusicRights
Music Rights
Milli
ons
Asia-Pacific
15.8%
16
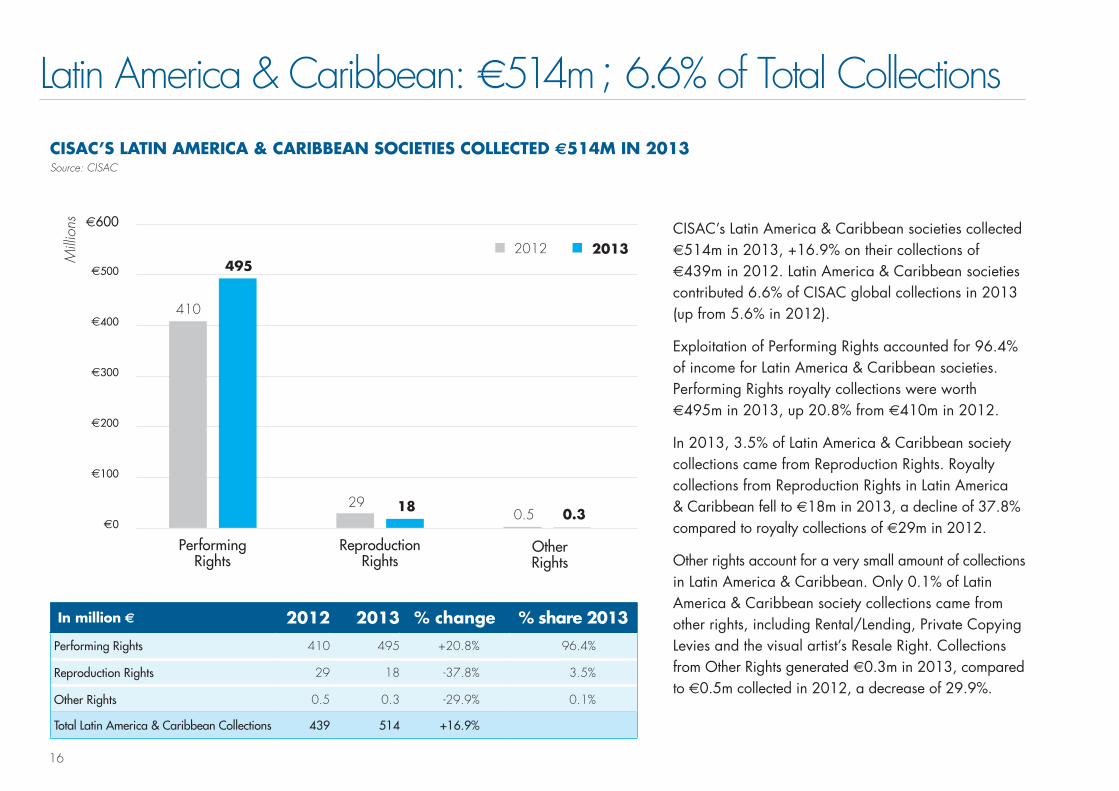
CISAC’S LATIN AMERICA & CARIBBEAN SOCIETIES COLLECTED €514M IN 2013Source: CISAC
Latin America & Caribbean: €514m ; 6.6% of Total Collections
CISAC’s Latin America & Caribbean societies collected €514m in 2013, +16.9% on their collections of €439m in 2012. Latin America & Caribbean societies contributed 6.6% of CISAC global collections in 2013 (up from 5.6% in 2012).
Exploitation of Performing Rights accounted for 96.4% of income for Latin America & Caribbean societies. Performing Rights royalty collections were worth €495m in 2013, up 20.8% from €410m in 2012.
In 2013, 3.5% of Latin America & Caribbean society collections came from Reproduction Rights. Royalty collections from Reproduction Rights in Latin America & Caribbean fell to €18m in 2013, a decline of 37.8% compared to royalty collections of €29m in 2012.
Other rights account for a very small amount of collections in Latin America & Caribbean. Only 0.1% of Latin America & Caribbean society collections came from other rights, including Rental/Lending, Private Copying Levies and the visual artist’s Resale Right. Collections from Other Rights generated €0.3m in 2013, compared to €0.5m collected in 2012, a decrease of 29.9%.
In million € 2012 2013 % change % share 2013
Performing Rights 410 495 +20.8% 96.4%
Reproduction Rights 29 18 -37.8% 3.5%
Other Rights 0.5 0.3 -29.9% 0.1%
Total Latin America & Caribbean Collections 439 514 +16.9%
E600
E400
E500
E200
E100
E300
E0
410
495
29
2012 2013
0.5 0.3 18
ReproductionRights
OtherRights
Performing Rights
Milli
ons

17
LATIN AMERICA & CARIBBEAN: MUSIC AND NON-MUSIC COLLECTIONSSource: CISAC
CISAC’s Latin America & Caribbean societies’ income from the use of the music repertoire accounted for 88.2% of total Latin America & Caribbean society revenue in 2013, up from 87.2% in 2012.
Latin America & Caribbean societies collected €453m from the use of the music repertoire in 2013, up 18.3% from the €383m collected in 2012.
This growth was driven by strong performance in Digital (€6m, up 162.4% from €2m) and Cable & Satellite (€111m, up 67.5% from €66m).
Income from the use of the non-music repertoire, such as Audiovisual and Literary, accounted for 11.8% of total Latin America & Caribbean revenue in 2013, down from 12.8% in 2012.
Latin America & Caribbean societies collected €60m from the non-music repertoire, growth of 7.2% from €56m in 2012. Visual Arts (€0.5m, up 26% from €0.4m) and Audiovisual (€43m, up 17.9% from €36m) performed most strongly.
In million € 2012 2013 % change % share 2013
Music Rights 383 453 +18.3% 88.2%
Non-Music Rights 56 60 +7.2% 11.8%
Total Latin America & Caribbean Collections 439 514 +16.9%
E300
E350
E500
E450
E400
E250
E150
E200
E50
E100
E0
383
56
453
60
453 2012 2013
Non-MusicRights
Music Rights
Milli
ons
6.6%
Latin America & Caribbean
18
CISAC’S AFRICA SOCIETIES COLLECTED €54M IN 2013Source: CISAC
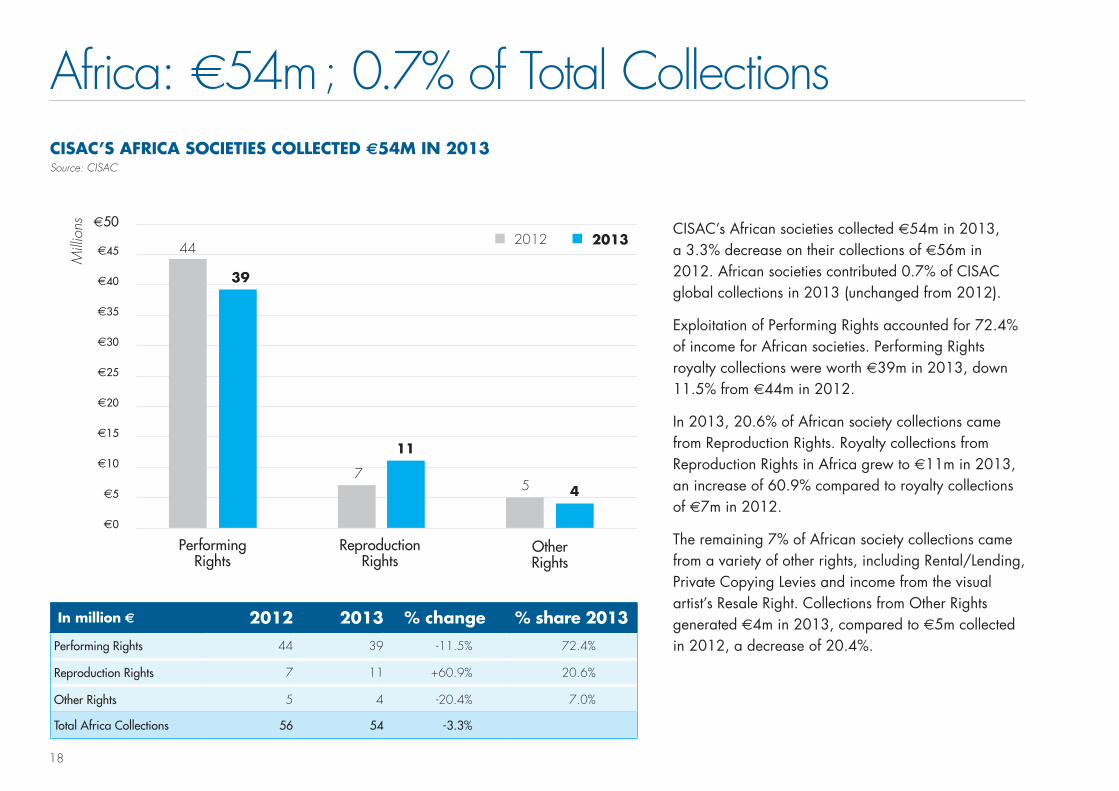
Africa: €54m ; 0.7% of Total Collections
CISAC’s African societies collected €54m in 2013, a 3.3% decrease on their collections of €56m in 2012. African societies contributed 0.7% of CISAC global collections in 2013 (unchanged from 2012).
Exploitation of Performing Rights accounted for 72.4% of income for African societies. Performing Rights royalty collections were worth €39m in 2013, down 11.5% from €44m in 2012.
In 2013, 20.6% of African society collections came from Reproduction Rights. Royalty collections from Reproduction Rights in Africa grew to €11m in 2013, an increase of 60.9% compared to royalty collections of €7m in 2012.
The remaining 7% of African society collections came from a variety of other rights, including Rental/Lending, Private Copying Levies and income from the visual artist’s Resale Right. Collections from Other Rights generated €4m in 2013, compared to €5m collected in 2012, a decrease of 20.4%.
In million € 2012 2013 % change % share 2013
Performing Rights 44 39 -11.5% 72.4%
Reproduction Rights 7 11 +60.9% 20.6%
Other Rights 5 4 -20.4% 7.0%
Total Africa Collections 56 54 -3.3%
E50
E40
E35
E45
E20
E15
E10
E5
E30
E25
E0
44
39
7
2012 2013
5 4
11
ReproductionRights
OtherRights
Performing Rights
Milli
ons

19
AFRICA: MUSIC AND NON-MUSIC COLLECTIONSSource: CISAC
CISAC’s African societies’ income from the use of the music repertoire accounted for 89.1% of total African society revenue in 2013, up from 87.4% in 2012.
African societies collected €48m from the use of the music repertoire in 2013, -1.4% from €49m collected in 2012.
Video & Cinema performed well (€0.9m, up 53.3% from €0.6m).
Income from the use of the non-music repertoire, such as Audiovisual and Literary works, accounted for 10.9% of total African society revenue in 2013, down from 12.6% in 2012.
African societies collected €6m from the non-music repertoire, a decline of 16.6% from €7m in 2012. Dramatic (€1.4m, up 42.3% from €1 m) performed most strongly.
In million € 2012 2013 % change % share 2013
Music Rights 49 48 -1.4% 89.1%
Non-Music Rights 7 6 -16.6% 10.9%
Total Africa Collections 56 54 -3.3%
E60
E50
E30
E40
E10
E20
E0
49
7 6
48
2012 2013
Non-MusicRights
Music Rights
Milli
ons
0.7%
Africa
20
CISAC’S BRICS SOCIETIES COLLECTED €365M IN 2013Source: CISAC
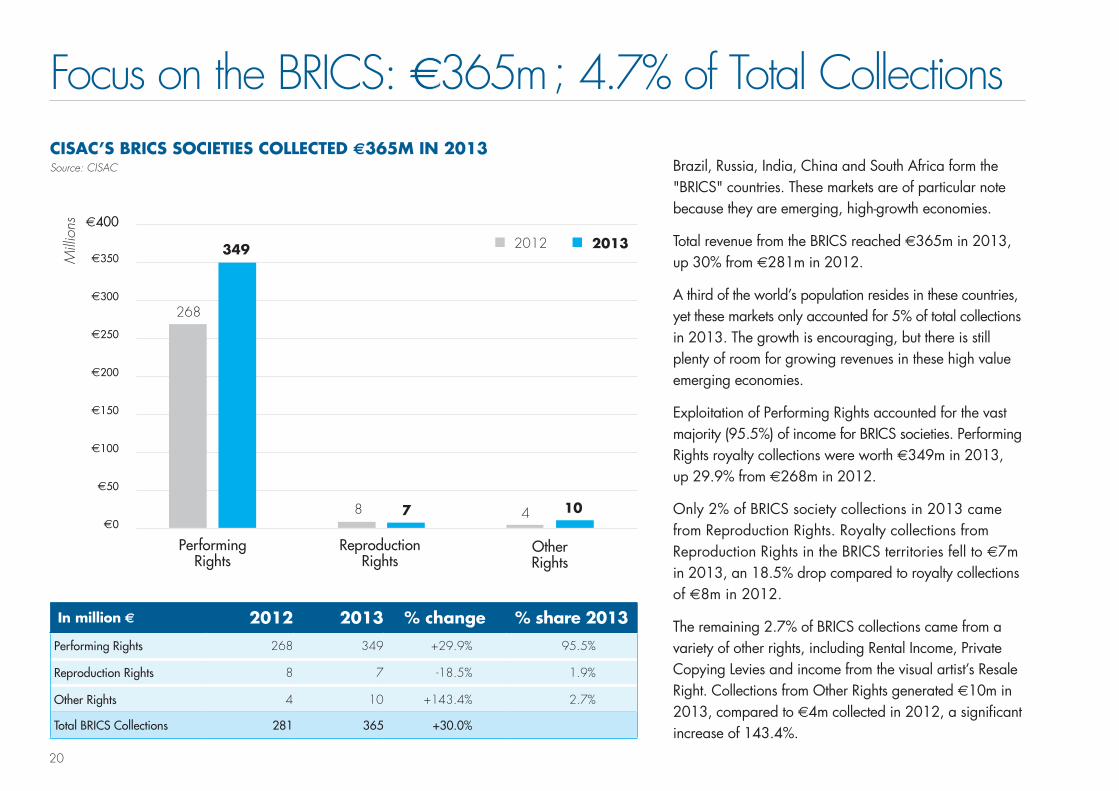
Focus on the BRICS: €365m ; 4.7% of Total Collections
Brazil, Russia, India, China and South Africa form the "BRICS" countries. These markets are of particular note because they are emerging, high-growth economies.
Total revenue from the BRICS reached €365m in 2013, up 30% from €281m in 2012.
A third of the world’s population resides in these countries, yet these markets only accounted for 5% of total collections in 2013. The growth is encouraging, but there is still plenty of room for growing revenues in these high value emerging economies.
Exploitation of Performing Rights accounted for the vast majority (95.5%) of income for BRICS societies. Performing Rights royalty collections were worth €349m in 2013, up 29.9% from €268m in 2012.
Only 2% of BRICS society collections in 2013 came from Reproduction Rights. Royalty collections from Reproduction Rights in the BRICS territories fell to €7m in 2013, an 18.5% drop compared to royalty collections of €8m in 2012.
The remaining 2.7% of BRICS collections came from a variety of other rights, including Rental Income, Private Copying Levies and income from the visual artist’s Resale Right. Collections from Other Rights generated €10m in 2013, compared to €4m collected in 2012, a significant increase of 143.4%.
In million € 2012 2013 % change % share 2013
Performing Rights 268 349 +29.9% 95.5%
Reproduction Rights 8 7 -18.5% 1.9%
Other Rights 4 10 +143.4% 2.7%
Total BRICS Collections 281 365 +30.0%
E400
E350
E200
E150
E100
E50
E300
E250
E0
268
349
8
2012 2013
4 10 7
ReproductionRights
OtherRights
Performing Rights
Milli
ons
21
E400
E350
E200
E150
E100
E50
E300
E250
E0
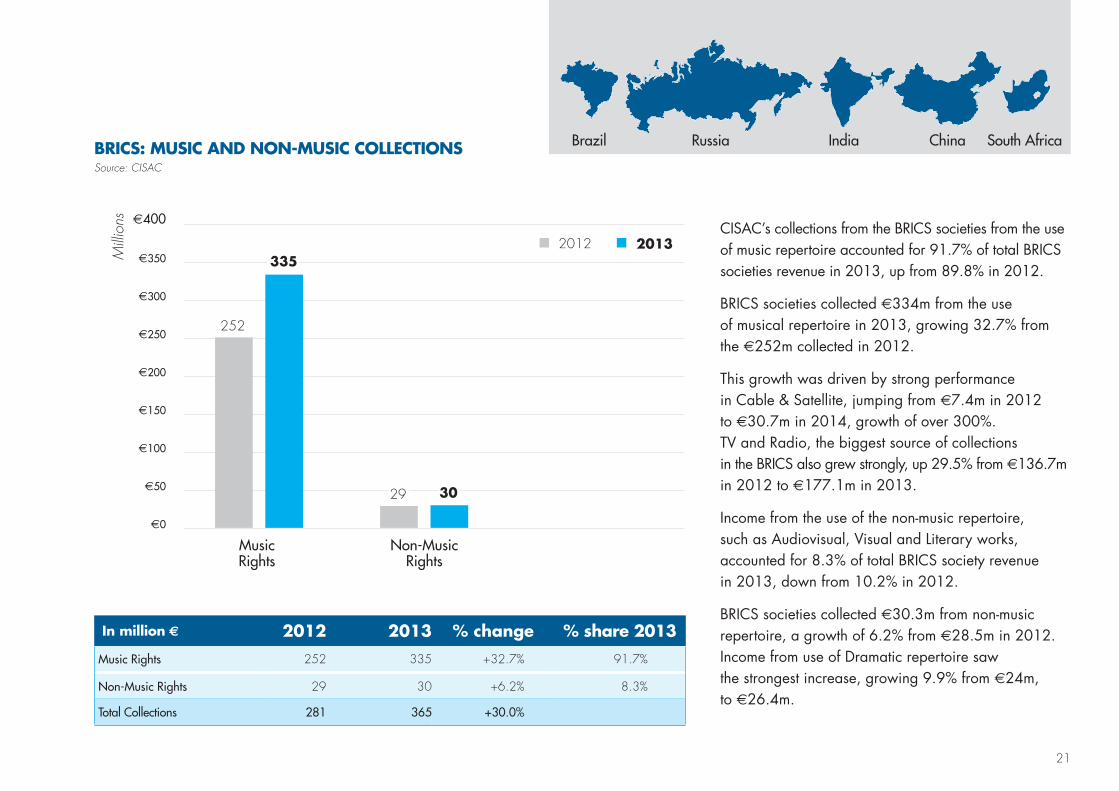
BRICS: MUSIC AND NON-MUSIC COLLECTIONSSource: CISAC
In million € 2012 2013 % change % share 2013
Music Rights 252 335 +32.7% 91.7%
Non-Music Rights 29 30 +6.2% 8.3%
Total Collections 281 365 +30.0%
252
29 30
3352012 2013
Non-MusicRights
Music Rights
Milli
ons
CISAC’s collections from the BRICS societies from the use of music repertoire accounted for 91.7% of total BRICS societies revenue in 2013, up from 89.8% in 2012.
BRICS societies collected €334m from the use of musical repertoire in 2013, growing 32.7% from the €252m collected in 2012.
This growth was driven by strong performance in Cable & Satellite, jumping from €7.4m in 2012 to €30.7m in 2014, growth of over 300%. TV and Radio, the biggest source of collections in the BRICS also grew strongly, up 29.5% from €136.7m in 2012 to €177.1m in 2013.
Income from the use of the non-music repertoire, such as Audiovisual, Visual and Literary works, accounted for 8.3% of total BRICS society revenue in 2013, down from 10.2% in 2012.
BRICS societies collected €30.3m from non-music repertoire, a growth of 6.2% from €28.5m in 2012. Income from use of Dramatic repertoire saw the strongest increase, growing 9.9% from €24m, to €26.4m.
Brazil Russia India China South Africa
22
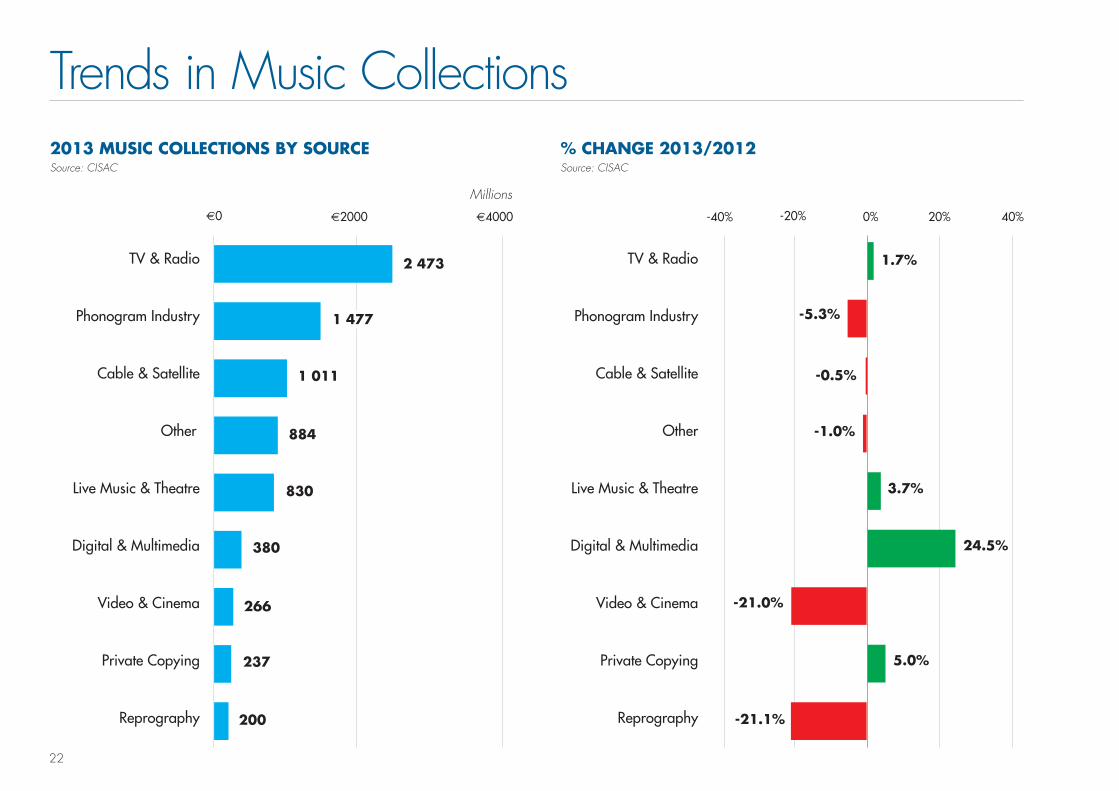
2013 MUSIC COLLECTIONS BY SOURCESource: CISAC
% CHANGE 2013/2012Source: CISAC
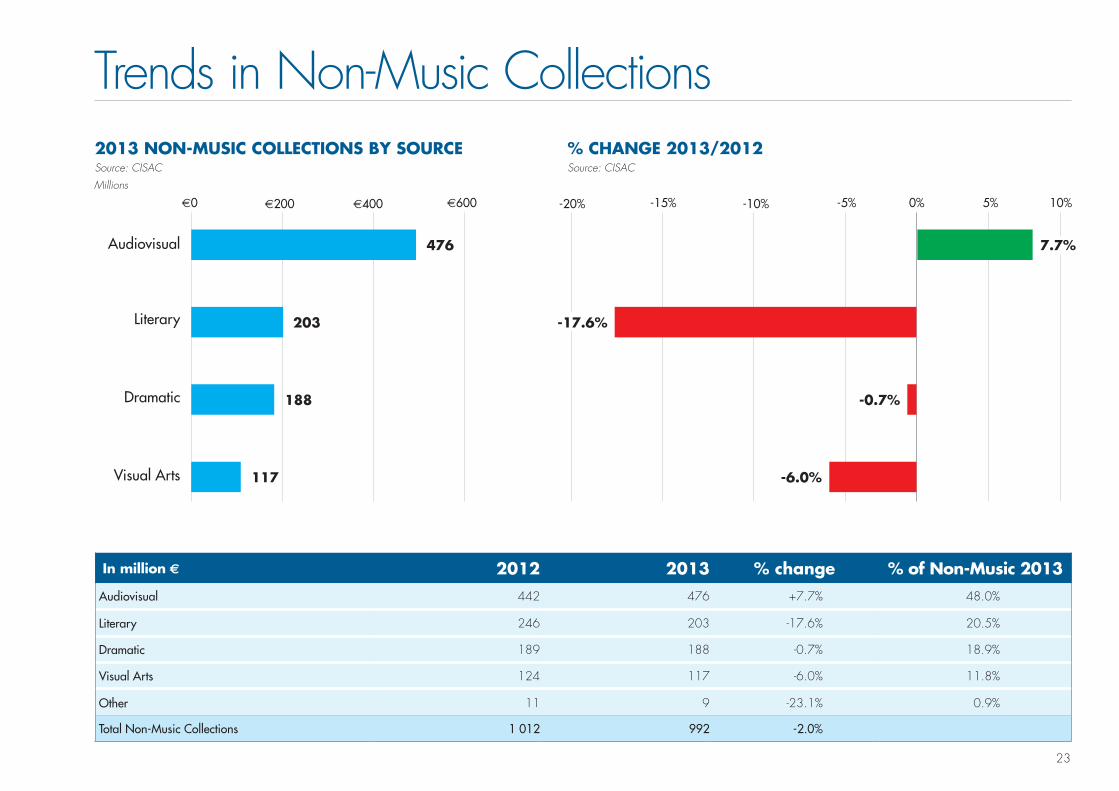
Trends in Music Collections
E4000 40%20%E2000 0%E0 -40% -20%
2 473 1.7%
-1.0%
-5.3%
-0.5%
-21.0%
-21.1%
3.7%
24.5%
5.0%
1 477
1 011
884
830
380
266
237
200
TV & Radio TV & Radio
Phonogram Industry Phonogram Industry
Cable & Satellite Cable & Satellite
Other Other
Live Music & Theatre Live Music & Theatre
Digital & Multimedia Digital & Multimedia
Video & Cinema Video & Cinema
Private Copying Private Copying
Reprography Reprography
Millions
23
In million € 2012 2013 % change % of Non-Music 2013
Audiovisual 442 476 +7.7% 48.0%
Literary 246 203 -17.6% 20.5%
Dramatic 189 188 -0.7% 18.9%
Visual Arts 124 117 -6.0% 11.8%
Other 11 9 -23.1% 0.9%
Total Non-Music Collections 1 012 992 -2.0%
Trends in Non-Music Collections2013 NON-MUSIC COLLECTIONS BY SOURCESource: CISAC
% CHANGE 2013/2012Source: CISAC
E0 -20%E200 -15%E400 -10%E600 -5% 0% 5% 10%
476 7.7%
203
188 -0.7%
117 -6.0%
Audiovisual
Literary
Dramatic
Visual Arts
Millions
-17.6%

24
2013 Collections per Head of Population
E-
E5
E15
E25
E10
E20
E30
COLLECTIONS PER HEAD, BY REGION (€)Source: CISAC, World Bank
Europe
Canada-USA
Latin America & Caribbean
World Average
Asia-Pacific
Africa
Den
mar
k
Japa
n
Nor
way
Cro
atia
Finl
and
Slov
enia
Italy
Gre
ece
Slov
akia
Fran
ce
Irela
nd
Ger
man
y
Cze
ch R
ep.
Sing
apor
e
Aus
tralia
Arg
entin
a
Luxe
mbo
urg
Uru
guay
Kore
a (R
ep.)
Switz
erla
nd
Hun
gary
Net
herla
nds
USA
Latv
ia
Belg
ium
Israe
l
Icel
and
Pola
nd
St. L
ucia
Aus
tria
Spai
n
UK
Esto
nia
Barb
ados
Swed
en
Portu
gal
Can
ada
Hon
g Ko
ng
Lithu
ania
Wor
ld A
vera
ge
Note: Denmark includes NCB’s total collections from the eight Nordic & Baltic countries.
COLLECTIONS PER HEAD, BY COUNTRYSource: CISAC, World Bank
1.30
5.32
3.60
1.30
0.88
0.36
0.07

25
2013 Collections as a Percentage of GDP
0.00%
0.01%
0.02%
0.03%
0.04%
0.05%
0.06%
0.07%
COLLECTIONS AS A % OF GDP, BY REGION Source: CISAC, World Bank
Europe
World
Canada-USA
Latin America & Caribbean
Asia-Pacific
Africa
Den
mar
k
Hun
gary
Fran
ce
Switz
erla
nd
Aus
tria
Finl
and
Belg
ium
Italy
Arg
entin
a
Cro
atia UK
Ger
man
y
Net
herla
nds
Sain
t Luc
ia
Pola
nd
Slov
enia
Swed
en
Icel
and
Aus
tralia
Spai
n
Japa
n
Cze
ch R
ep.
Esto
nia
Portu
gal
Mon
tene
gro
Serb
ia
Uru
guay
Latv
ia
Barb
ados
Gre
ece
Israe
l
Can
ada
Mac
edon
ia
Irela
nd
WO
RLD
Note: Denmark includes NCB’s total collections from the eight Nordic & Baltic countries.
COLLECTIONS AS A % OF GDP, BY COUNTRYSource: CISAC, World Bank
0.015%
0.028%
0.015%
0.011%
0.009%
0.008%
0.005%
26
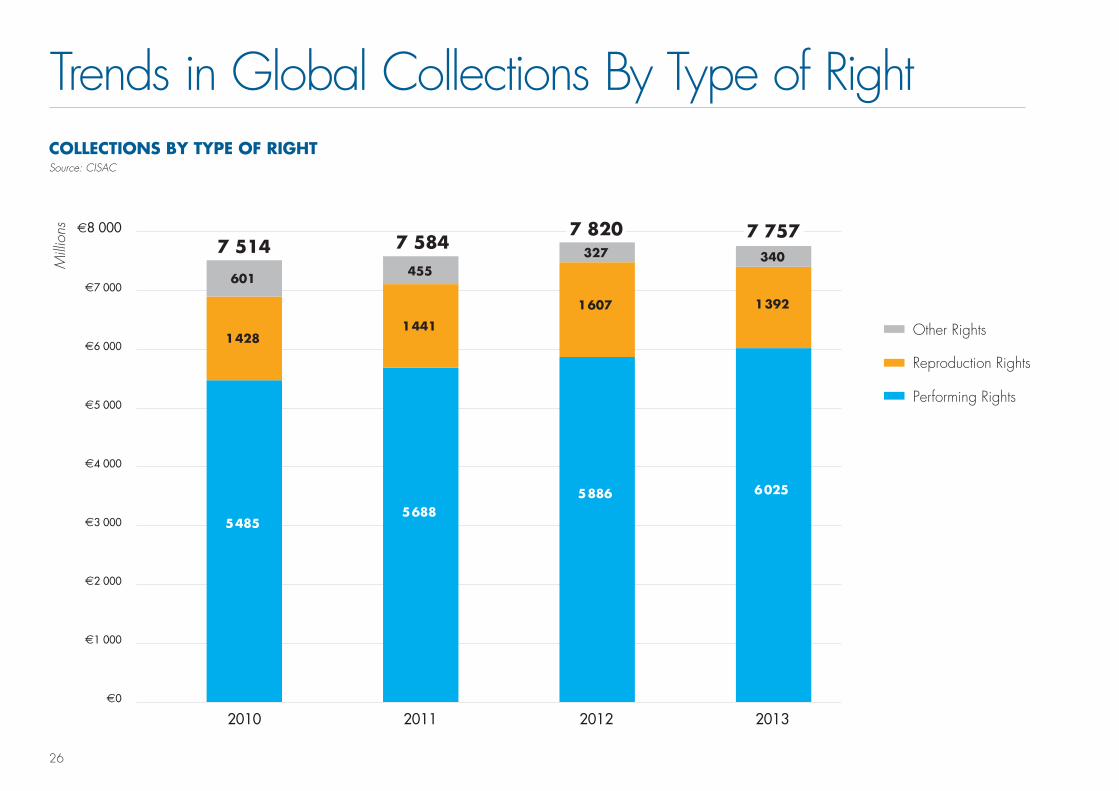
COLLECTIONS BY TYPE OF RIGHTSource: CISAC
Trends in Global Collections By Type of Right
E7 000
E8 000
E6 000
E4 000
E5 000
E2 000
E1 000
E3 000
E0
Performing Rights
Reproduction Rights
Other Rights
2010
7 514
601
1 428
5 485
2011
7 584 455
1 441
5 688
2012
7 820 327
1 607
5 886
2013
7 757 340
1 392
6 025
Milli
ons

27
In million € Performing Rights Reproduction Rights Other Rights % share of total in 2013
Europe 3 566 840 295 60.6%
Canada-USA* 1 193 67* 5 16.3%
Asia-Pacific 731 456 36 15.8%
Latin America & Caribbean 495 18 0.3 6.6%
Africa 39 11 4 0.7%
Total Collections 6 025 1 392 340
2013 Global Collections by Type of Right
* This report focuses on revenue from CISAC members. Harry Fox Agency (HFA) is not a CISAC member, so their revenues are not included. This accounts for the relatively low share for Reproduction Rights reported for the Canada-USA region.
SHARE OF REVENUE BY TYPE OF RIGHTSource: CISAC
100%
90%
80%
70%
60%
50%
40%
30%
20%
10%
0%
World Europe 61%
Canada-USA 16%
Asia-Pacific 16%
Latin America & Caribbean
7%
Africa 1%
Performing rights
Reproduction rights
Other rights
4%
18%
78%
6%
18%
76%
3%
37%
60%
7%
21%
72%
4%
96%
1%5%
94%
Milli
ons

28
Performing Rights in 2013: €6 025 ; Up 2.4%
In million € 2012 2013 % change % share 2013
TV & Radio 2 174 2 207 +1.5% 36.6%
Phonogram Industry 1 000 1 022 +2.1% 17.0%
Cable & Satellite 1 016 1 011 -0.5% 16.8%
Live Music & Theatre 800 830 +3.7% 13.8%
Other 625 633 +1.4% 10.5%
Digital & Multimedia 180 236 +31.4% 3.9%
Video & Cinema 91 86 -5.2% 1.4%
Total Performing Rights Collections 5 886 6 025 +2.4%
E2 000
E2 500
E1 000
E500
E1 500
E0
2 174
1 000 1 016 800
625
180 91
2 207
1 022 1 011 830
633
236 86
TV & Radio Video & CinemaDigital & Multimedia
OtherLive Music & Theatre
Cable & SatellitePhonogram Industry
2012 2013PERFORMING RIGHTSSource: CISAC
Milli
ons
29
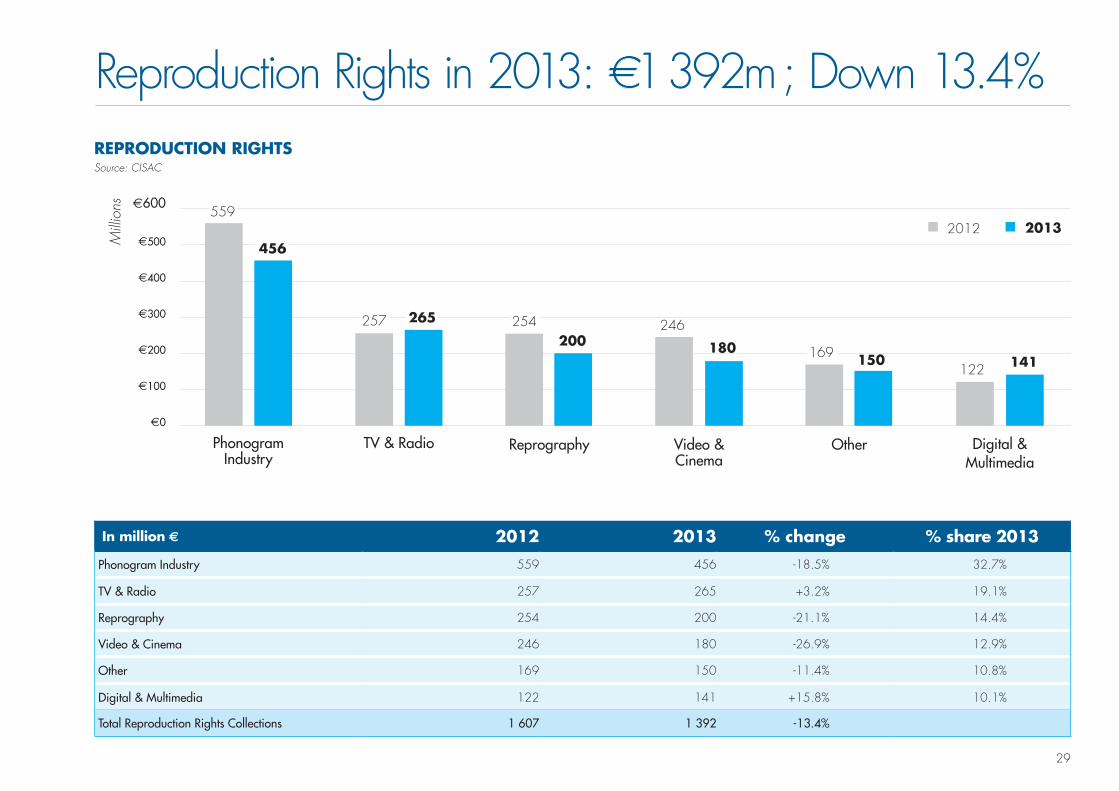
Reproduction Rights in 2013: €1 392m ; Down 13.4%
In million € 2012 2013 % change % share 2013
Phonogram Industry 559 456 -18.5% 32.7%
TV & Radio 257 265 +3.2% 19.1%
Reprography 254 200 -21.1% 14.4%
Video & Cinema 246 180 -26.9% 12.9%
Other 169 150 -11.4% 10.8%
Digital & Multimedia 122 141 +15.8% 10.1%
Total Reproduction Rights Collections 1 607 1 392 -13.4%
E400
E600
E500
E200
E100
E300
E0
559
456
Phonogram Industry
122 141
Digital & Multimedia
169 150
Other
246
180
Video & Cinema
254 200
Reprography
257 265
TV & Radio
2012 2013
REPRODUCTION RIGHTSSource: CISAC
Milli
ons
30
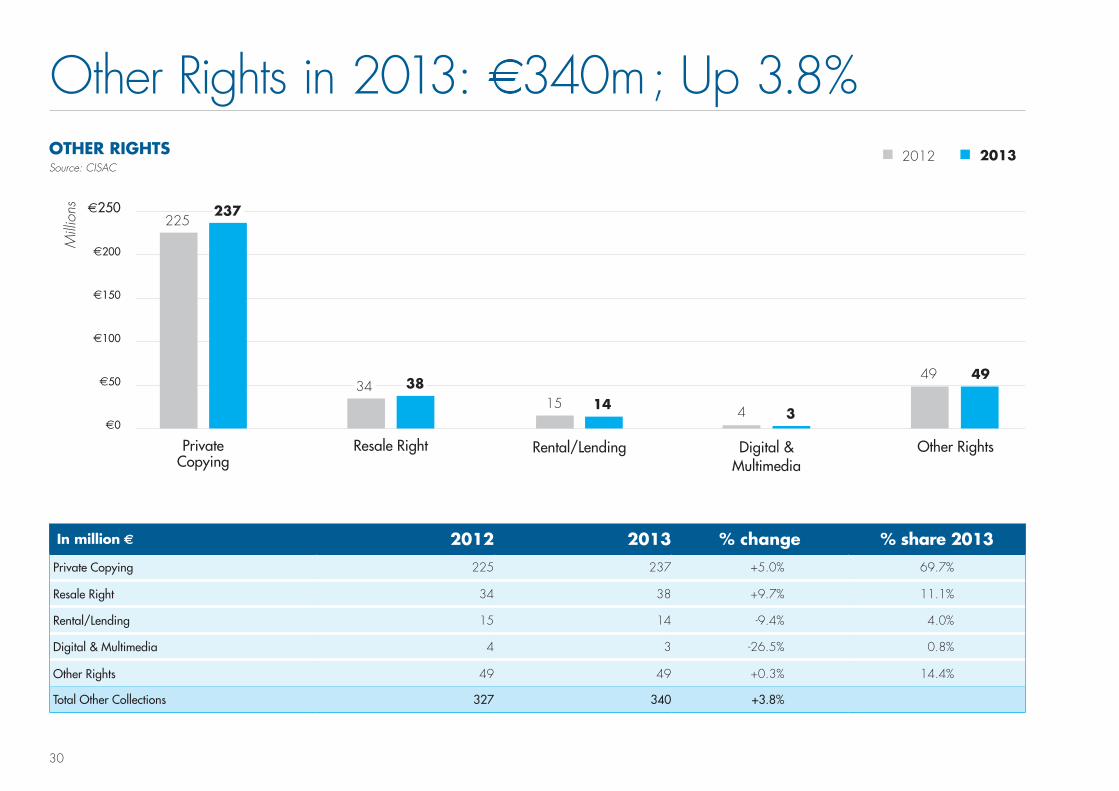
Other Rights in 2013: €340m ; Up 3.8%
In million € 2012 2013 % change % share 2013
Private Copying 225 237 +5.0% 69.7%
Resale Right 34 38 +9.7% 11.1%
Rental/Lending 15 14 -9.4% 4.0%
Digital & Multimedia 4 3 -26.5% 0.8%
Other Rights 49 49 +0.3% 14.4%
Total Other Collections 327 340 +3.8%
E200
E250
E100
E50
E150
E0
225 237
Private Copying
Other Rights
49 49
Digital & Multimedia
4 3
Rental/Lending
15 14
Resale Right
34 38
2012 2013OTHER RIGHTSSource: CISAC
Milli
ons
31
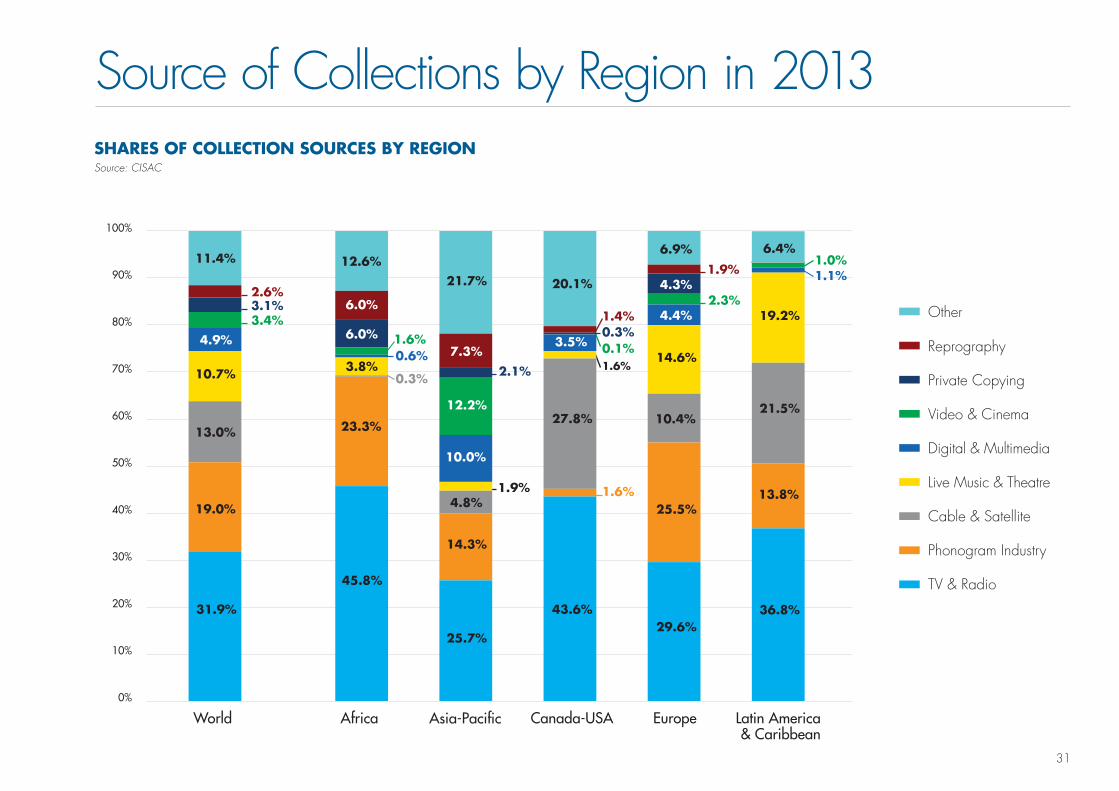
SHARES OF COLLECTION SOURCES BY REGIONSource: CISAC
Source of Collections by Region in 2013
100%
90%
80%
70%
60%
50%
40%
30%
20%
10%
0%
Africa Asia-Pacific Canada-USA Europe Latin America & Caribbean
World
Reprography
Other
Private Copying
Digital & Multimedia
Video & Cinema
Live Music & Theatre
Cable & Satellite
Phonogram Industry
TV & Radio
0.3%0.1%0.6%
0.3%
11.4% 12.6%21.7% 20.1%
6.9% 6.4%
2.6%6.0%
7.3%
1.4%
1.9%
3.1%
6.0%
2.1%
4.3%
3.4%1.6%
12.2%
2.3%
1.0%
4.9%
10.0%
3.5%
4.4%
1.1%
10.7% 3.8%
1.9%
1.6%14.6%
19.2%
13.0%
4.8%
27.8% 10.4%21.5%
19.0%
23.3%
14.3%
1.6%25.5%
13.8%
31.9%
45.8%
25.7%
43.6%29.6%
36.8%

32
Exchange Rate Table
Country Currency Code 2012-2013 % Change Local Currency vs. €
Japan JPY -21%
Argentina ARS -20%
South Africa ZAR -18%
Brazil BRL -13%
India INR -11%
Australia AUD -10%
Turkey TRY -9%
Colombia COP -6%
Canada CAD -6%
Russian Federation RUB -5%
Chile CLP -5%
United Kingdom GBP -4%
Norway NOK -4%
Czech Rep. CZK -3%
USA USD -3%
Hungary HUF -2%
Switzerland CHF -2%
China CNY -1%
Korea (rep.) KRW 0%
Poland PLN 0%
Denmark DKK 0%
Mexico MXN 0%
Bulgaria BGN 0%
Sweden SEK 1%
Romania RON 1%
Israel ILS 3%

33
Market Trends
P.34 Understanding the Digital Music Market
P.35 Understanding the Live Music Market
P.36 Digital, TV and Radio Advertising Revenues, 2013-2016
P.37 Global Advertising Spend Forecast
P.38 Internet Penetration
P.39 Smartphone Penetration
P.40 Glossary
P.41 CISAC Membership
P.43 About CISAC
34
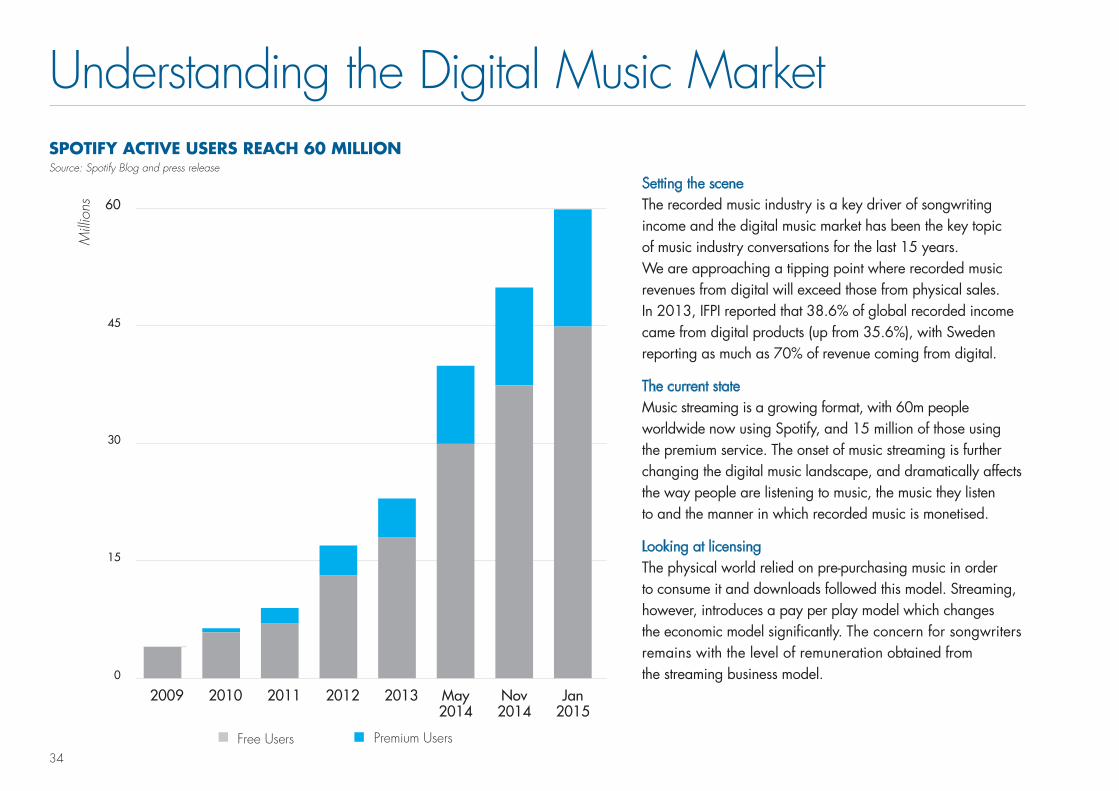
SPOTIFY ACTIVE USERS REACH 60 MILLIONSource: Spotify Blog and press release
Understanding the Digital Music Market
Setting the sceneThe recorded music industry is a key driver of songwriting income and the digital music market has been the key topic of music industry conversations for the last 15 years. We are approaching a tipping point where recorded music revenues from digital will exceed those from physical sales. In 2013, IFPI reported that 38.6% of global recorded income came from digital products (up from 35.6%), with Sweden reporting as much as 70% of revenue coming from digital.
The current stateMusic streaming is a growing format, with 60m people worldwide now using Spotify, and 15 million of those using the premium service. The onset of music streaming is further changing the digital music landscape, and dramatically affects the way people are listening to music, the music they listen to and the manner in which recorded music is monetised.
Looking at licensingThe physical world relied on pre-purchasing music in order to consume it and downloads followed this model. Streaming, however, introduces a pay per play model which changes the economic model significantly. The concern for songwriters remains with the level of remuneration obtained from the streaming business model.
60
30
15
45
0
Free Users Premium Users
2009 2010 2011 2012 2013 May 2014
Nov 2014
Jan 2015
Milli
ons

35
LIVE MUSIC COLLECTIONS GROWTHSource: CISAC
Understanding the Live Music MarketSetting the sceneThe shift to digital, and the subsequent increase in piracy, meant that recorded music was not generating as much revenue as before. As such, performing artists started to rely more on their live performances as a revenue source and, in turn, this has brought greater revenue to songwriters for the live performances of their works. The live music industry has gone from strength to strength, which is reflected in the 4.5% growth in live revenues that CISAC societies experienced in 2013.
The current stateThe live music industry is continuing to grow, with gigs and festivals more popular than ever. The infrastructure now built around events is designed to maximise revenue at every opportunity; booking fees, car parking, merchandise, food, drinks, VIP upgrades, etc. As the live music industry prospers, artists are becoming more savvy, demanding a cut of these additional revenue streams. However, creators are losing out on some of these upsides as their benefits are often limited to the face value of the ticket.
Looking at licensingWhen it comes to live music licensing, not all societies are equal. Many European societies receive upwards of 7% of the ticket value to compensate writers for their contribution, whereas others receive 3% or less. Similarly, the base on which these shares are calculated often excludes the fastest growing revenue streams, such as ‘at the event spend’ or the secondary ticket spend (where tickets are re-sold by fans or by professional touts). As these areas continue to make significant revenues for artists, there should to be a conversation about how writers share in this activity.
E800
E700
E600
E200
E100
E400
E500
E300
E0
2012 2013
656686
Milli
ons
36
16.1%
4.8%3.7% 3.3% 2.9%
-1.6%-2.5%
DigitalTelevision Radio
OutdoorCinema
MagazinesNewspapers
5%
0%
15%
20%
10%
-5%
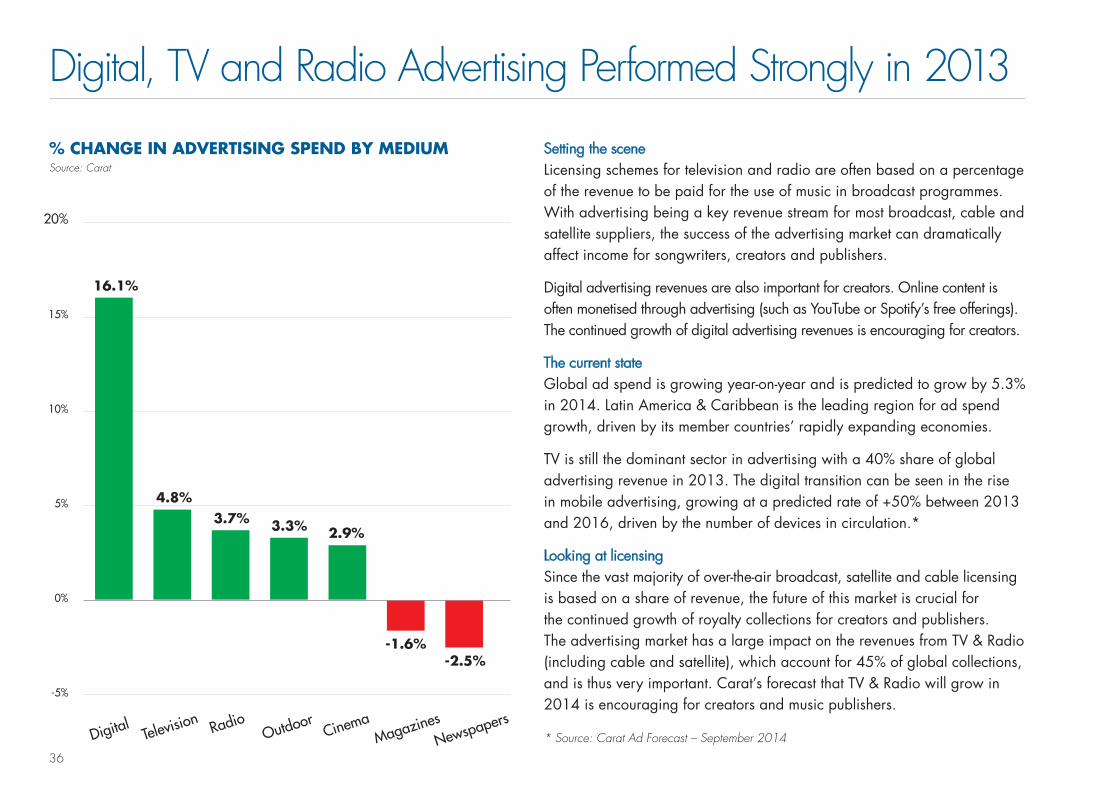
% CHANGE IN ADVERTISING SPEND BY MEDIUMSource: Carat
Digital, TV and Radio Advertising Performed Strongly in 2013
Setting the sceneLicensing schemes for television and radio are often based on a percentage of the revenue to be paid for the use of music in broadcast programmes. With advertising being a key revenue stream for most broadcast, cable and satellite suppliers, the success of the advertising market can dramatically affect income for songwriters, creators and publishers.
Digital advertising revenues are also important for creators. Online content is often monetised through advertising (such as YouTube or Spotify’s free offerings). The continued growth of digital advertising revenues is encouraging for creators.
The current stateGlobal ad spend is growing year-on-year and is predicted to grow by 5.3% in 2014. Latin America & Caribbean is the leading region for ad spend growth, driven by its member countries’ rapidly expanding economies.
TV is still the dominant sector in advertising with a 40% share of global advertising revenue in 2013. The digital transition can be seen in the rise in mobile advertising, growing at a predicted rate of +50% between 2013 and 2016, driven by the number of devices in circulation.*
Looking at licensingSince the vast majority of over-the-air broadcast, satellite and cable licensing is based on a share of revenue, the future of this market is crucial for the continued growth of royalty collections for creators and publishers. The advertising market has a large impact on the revenues from TV & Radio (including cable and satellite), which account for 45% of global collections, and is thus very important. Carat’s forecast that TV & Radio will grow in 2014 is encouraging for creators and music publishers.
* Source: Carat Ad Forecast – September 2014

37
Global Advertising Spend Forecast
FASTEST GROWING AD MARKETS IN ABSOLUTE TERMS 2013-2016Source: ZenithOptimedia
Television
Newspapers
Desktop Internet
Magazines
Mobile Internet
Outdoor
Radio
Cinema
SHARE OF GLOBAL ADVERTISING SPEND BY MEDIUMSource: ZenithOptimedia
2.9%
18.3%
39.6%
6.9%
8.0%
16.8%
6.9%
0.6%
USA China Indonesia Argentina UK Brazil Japan Mexico South Korea India
15 806
6 023 5 374 4 866 4 4142 988 2 198 2 154 1 946
19.7%
38.3%
6.4%
6.4%
13.2%
0.6%
8.6%
6.8%
$0
$5 000
$10 000
$15 000
$20 000
$25 000
2013 ($523 bn)
2016 ($583 bn)
22 769
Milli
ons
38
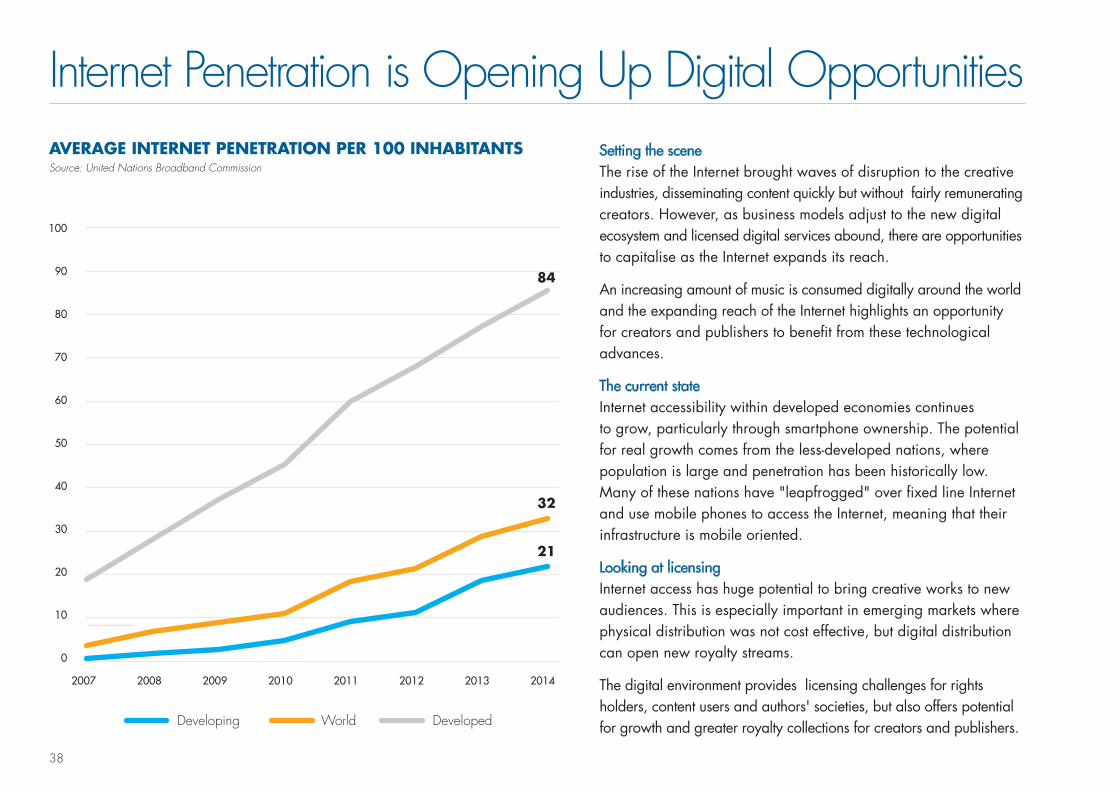
AVERAGE INTERNET PENETRATION PER 100 INHABITANTSSource: United Nations Broadband Commission
Internet Penetration is Opening Up Digital OpportunitiesSetting the sceneThe rise of the Internet brought waves of disruption to the creative industries, disseminating content quickly but without fairly remunerating creators. However, as business models adjust to the new digital ecosystem and licensed digital services abound, there are opportunities to capitalise as the Internet expands its reach.
An increasing amount of music is consumed digitally around the world and the expanding reach of the Internet highlights an opportunity for creators and publishers to benefit from these technological advances.
The current stateInternet accessibility within developed economies continues to grow, particularly through smartphone ownership. The potential for real growth comes from the less-developed nations, where population is large and penetration has been historically low. Many of these nations have "leapfrogged" over fixed line Internet and use mobile phones to access the Internet, meaning that their infrastructure is mobile oriented.
Looking at licensingInternet access has huge potential to bring creative works to new audiences. This is especially important in emerging markets where physical distribution was not cost effective, but digital distribution can open new royalty streams.
The digital environment provides licensing challenges for rights holders, content users and authors' societies, but also offers potential for growth and greater royalty collections for creators and publishers.
100
90
80
70
60
50
40
30
20
10
0
Developing World Developed
2007 20112009 20132008 20122010 2014
84
32
21
39
2015 2014
1
2
3
4
5
6
7
8
9
10
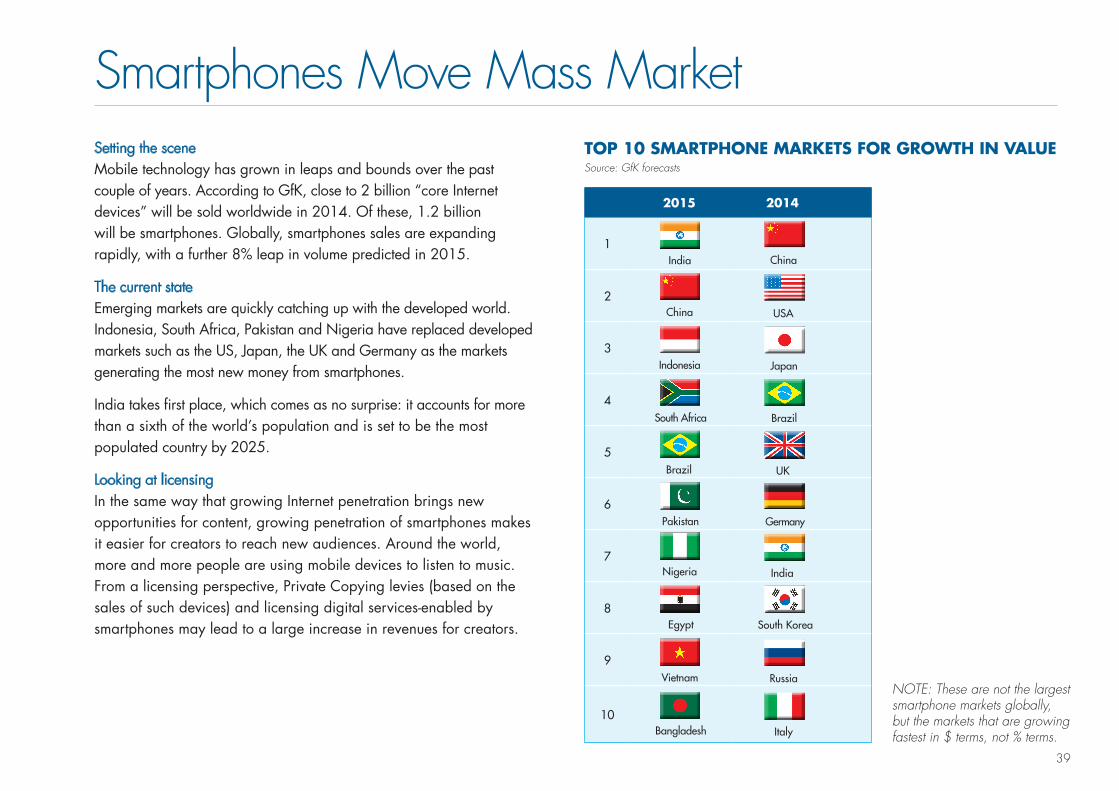
Smartphones Move Mass MarketSetting the sceneMobile technology has grown in leaps and bounds over the past couple of years. According to GfK, close to 2 billion “core Internet devices” will be sold worldwide in 2014. Of these, 1.2 billion will be smartphones. Globally, smartphones sales are expanding rapidly, with a further 8% leap in volume predicted in 2015.
The current stateEmerging markets are quickly catching up with the developed world. Indonesia, South Africa, Pakistan and Nigeria have replaced developed markets such as the US, Japan, the UK and Germany as the markets generating the most new money from smartphones.
India takes first place, which comes as no surprise: it accounts for more than a sixth of the world’s population and is set to be the most populated country by 2025.
Looking at licensingIn the same way that growing Internet penetration brings new opportunities for content, growing penetration of smartphones makes it easier for creators to reach new audiences. Around the world, more and more people are using mobile devices to listen to music. From a licensing perspective, Private Copying levies (based on the sales of such devices) and licensing digital services-enabled by smartphones may lead to a large increase in revenues for creators.
TOP 10 SMARTPHONE MARKETS FOR GROWTH IN VALUESource: GfK forecasts
NOTE: These are not the largest smartphone markets globally, but the markets that are growing fastest in $ terms, not % terms.
ChinaIndia
USAChina
JapanIndonesia
BrazilSouth Africa
UKBrazil
GermanyPakistan
IndiaNigeria
RussiaVietnam
ItalyBangladesh
South KoreaEgypt

40
GlossaryAuthors’ SocietiesAlso referred to as Collective Management Organisations (CMOs), authors’ societies represent creators of music, visual arts, audiovisual, literary and dramatic works, and manage their rights on a collective basis.
BRICSBrazil, Russia, India, China and South Africa are often referred to collectively as the BRICS. They are grouped together because of their strong economic growth and future potential.
CollectionsThe money collected by an authors’ society before administrative costs. For the purpose of this report, collections refer to money collected within the territory.
Collective Management Organisation (CMO)An organisation that collectively manages rights for a variety of rights holders.
Fixed Exchange RatesFixed exchange rates use the same exchange rates for the current year as the previous years. This means that market trends can be seen without changes in exchange rates influencing them.
Floating Exchange RatesFloating exchange rates use different exchange rates for each year. As such changes in exchange rates can positively or negatively impact the market trends.
Gross Domestic Product (GDP)GDP is the measure of economic output within a territory. It excludes revenue from exports.
Reproduction/Mechanical/Reprography RightsThe right to make a copy of a work protected under authors rights/copyright. The term “Mechanical Rights” is typically used to describe the rights obtained by record producers in order to make a sound recording of a musical work. “Reprography” is used in the context of reproduction of literary and printed works.
Performing RightsThe right to communicate a copyright work to the public, whether by way of live performance, radio broadcast, cable transmission or dissemination via digital platforms such as streaming.
Private CopyingCreating a copy of a copyright work, by an individual, for private and personal use (for example, copying from a CD to an iPod). Acts of private copying are, in some countries, subject to a levy which is applied to blank media and storage devices.
Resale Right A right granted to creators of visual art to obtain a percentage of the sale price when their work of art (for example, a painting) is re-sold by an auction house or gallery.
RoyaltiesA payment which is based on the use of a copyright work, for example: payment by radio broadcasters in respect of the broadcasting of music.

41
CISAC Membership230 AUTHORS’ SOCIETIES IN 120 COUNTRIES(January 2015)
Status within CISAC M= Member A = Associate P = Provisional Repertoire: MU = Musical L = Literature AV = Audiovisual AGP = Visual Art D = Drama
SOCIETY STATUS REPERTOIRE COUNTRY/TERRITORY
ONDA M MU ALGERIA
SADIA M MU ANGOLA
BUBEDRA M MU BENIN
BBDA M MU BURKINA FASO
CMC M MU CAMEROON
SOCILADRA M D CAMEROON
BCDA M MU CONGO
SACERAU M MU EGYPT
BGDA M MU GUINEA
BURIDA M MU IVORY COAST
MCSK M MU KENYA
OMDA M MU MADAGASCAR
COSOMA M MU MALAWI
BUMDA M MU MALI
MASA M MU MAURITIUS
BMDA M MU MOROCCO
SOMAS M MU MOZAMBIQUE
NASCAM M MU NAMIBIA
BNDA M MU NIGER
COSON P MU NIGERIA
MCSN M MU NIGERIA
RSAU P MU RWANDA
BSDA M MU SENEGAL
SACS M MU SEYCHELLES
DALRO M L SOUTH AFRICA
SAMRO M MU SOUTH AFRICA
COSOTA M MU TANZANIA
BUTODRA M MU TOGO
OTPDA M MU TUNISIA
UPRS M MU UGANDA
ZAMCOPS M MU ZAMBIA
ZIMURA M MU ZIMBABWE
AFRICA
SOCIETY STATUS REPERTOIRE COUNTRY/TERRITORY
AMCOS A MU AUSTRALIA
APRA M MU AUSTRALIA
ASDACS M AV AUSTRALIA
AWGACS M AV AUSTRALIA
CAL P L AUSTRALIA
VISCOPY M AGP AUSTRALIA
BEAT P MU BRUNEI DARUSSALAM
MCSC M MU CHINA
CASH M MU HONG KONG
IPRS M MU INDIA
PAPPRI A MU INDONESIA
WAMI P MU INDONESIA
APG-Japan A AGP JAPAN
JASPAR P AGP JAPAN
JASRAC M MU JAPAN
KOMCA M MU KOREA (REPUBLIC OF)
KOSA M L KOREA (REPUBLIC OF)
SACK M AGP KOREA (REPUBLIC OF)
MACA P MU MACAU
MACP M MU MALAYSIA
MOSCAP P MU MONGOLIA
CPSN A MU NEPAL
MRCSN P MU NEPAL
FILSCAP M MU PHILIPPINES
COMPASS M MU SINGAPORE
MÜST M MU TAIWAN, CHINESE TAIPEI
MCT M MU THAILAND
VCPMC M MU VIETNAM
ASIA-PACIFIC
SOCIETY STATUS REPERTOIRE COUNTRY/TERRITORY
ACCESS COPYRIGHT M L CANADA
CARCC M AGP CANADA
CMRRA M MU CANADA
CSCS M AV CANADA
DRCC M AV CANADA
SARTEC A AV CANADA
SOCAN M MU CANADA
SODRAC M MU CANADA
SPACQ A MU CANADA
AMRA M MU UNITED STATES
ARS M AGP UNITED STATES
ASCAP M MU UNITED STATES
BMI M MU UNITED STATES
DGA A AV UNITED STATES
SESAC Inc. M MU UNITED STATES
The Author's Registry Inc. A L UNITED STATES
VAGA M AGP UNITED STATES
WGA A AV UNITED STATES
CANADA-USA
NB: The information concerning each society’s repertoire is based solely on the collection figures that the society provided to CISAC (I&E tool)

42
SOCIETY STATUS REPERTOIRE COUNTRY/TERRITORY
SDADV P AV ANDORRAARMAUTHOR M D ARMENIAAKM M MU AUSTRIAAUSTRO-MECHANA M MU AUSTRIABILDRECHT M AGP AUSTRIALITERAR-MECHANA M L AUSTRIAVDFS M AV AUSTRIAAAS M MU AZERBAIJANNCIP M MU BELARUSGESAC A NA BELGIUMSABAM M MU BELGIUMSOFAM M AGP BELGIUMAMUS P MU BOSNIA AND HERZEGOVINASQN M MU BOSNIA AND HERZEGOVINAFILMAUTOR M AV BULGARIAMUSICAUTOR M MU BULGARIADHFR P AV CROATIAHDS-ZAMP M MU CROATIADILIA M AV CZECH REPUBLICGESTOR M AGP CZECH REPUBLICOSA M MU CZECH REPUBLICCOPY-DAN BILLEDKUNST M AGP DENMARKKODA M MU DENMARKNCB M MU DENMARKEAU M MU ESTONIAKOPIOSTO M AV FINLANDKUVASTO M AGP FINLANDSANASTO P L FINLANDTEOSTO M MU FINLANDUFW A L FINLANDADAGP M AGP FRANCESACD M AV FRANCESACEM M MU FRANCESACENC M MU FRANCESAIF M AGP FRANCESCAM M AV FRANCESESAM A NA FRANCESGDL A L FRANCEGCA M MU GEORGIABILD-KUNST M AGP GERMANYGEMA M MU GERMANYAEPI M MU GREECEAUTODIAHIRISI P MU GREECESOPE M D GREECEUFFICIO LEGALE A NA HOLY SEE (VATICAN CITY STATE)ARTISJUS M MU HUNGARYFILMJUS M AV HUNGARYHUNGART M AGP HUNGARYSTEF M MU ICELANDIMRO M MU IRELANDIVARO M AGP IRELANDSDCSI P AV IRELAND
SOCIETY STATUS REPERTOIRE COUNTRY/TERRITORY
ACUM M MU ISRAELTALI M AV ISRAELSIAE M MU ITALYKAZAK M MU KAZAKSTANKYRGYZPATENT M MU KYRGYZSTANAKKA-LAA M MU LATVIALATGA M MU LITHUANIASACEMLUXEMBOURG M MU LUXEMBOURGZAMP - Macédoine M MU MACEDONIA (FYROM)AsDAC M MU MOLDOVAPAM CG M MU MONTENEGROBUMA M MU NETHERLANDSLIRA M L NETHERLANDSPICTORIGHT M AGP NETHERLANDSSTEMRA M MU NETHERLANDSVEVAM M AV NETHERLANDSBONO M AGP NORWAYTONO M MU NORWAYZAIKS M MU POLANDZAPA M AV POLANDSPA M MU PORTUGALUCMR-ADA M MU ROMANIARAO M MU RUSSIAN FEDERATIONRUR P AV RUSSIAN FEDERATIONUPRAVIS P AGP RUSSIAN FEDERATIONSOKOJ M MU SERBIALITA M AV SLOVAKIASOZA M MU SLOVAKIASAZAS M MU SLOVENIAZAMP Association of Slovenia M L SLOVENIADAMA M AV SPAINSGAE M MU SPAINVEGAP M AGP SPAINBUS M AGP SWEDENSTIM M MU SWEDENPROLITTERIS M L SWITZERLANDSSA M AV SWITZERLANDSUISA M MU SWITZERLANDSUISSIMAGE M AV SWITZERLANDMESAM M MU TURKEYMSG M MU TURKEYSETEM M AV TURKEYAuPO CINEMA P AV UKRAINEUACRR M D UKRAINEACS M AGP UNITED KINGDOMALCS M L UNITED KINGDOMDACS M AGP UNITED KINGDOMDIRECTORS UK M AV UNITED KINGDOMMCPS M MU UNITED KINGDOMPRS M MU UNITED KINGDOMGAI UZ M MU UZBEKISTAN
EUROPE EUROPE (CONT'd)
SOCIETY STATUS REPERTOIRE COUNTRY/TERRITORY
ARGENTORES M AV ARGENTINA
DAC M AV ARGENTINA
SADAIC M MU ARGENTINA
SAVA M AGP ARGENTINA
COSCAP M MU BARBADOS
BSCAP M MU BELIZE
SOBODAYCOM M MU BOLIVIA
ABRAMUS M MU BRAZIL
ADDAF M MU BRAZIL
AMAR M MU BRAZIL
ASSIM M MU BRAZIL
AUTVIS M AGP BRAZIL
SADEMBRA M MU BRAZIL
SBACEM M MU BRAZIL
SICAM M MU BRAZIL
SOCINPRO M MU BRAZIL
UBC M MU BRAZIL
ATN M D CHILE
CREAIMAGEN M AGP CHILE
SCD M MU CHILE
DASC P AV COLOMBIA
SAYCO M MU COLOMBIA
ACAM M MU COSTA RICA
ACDAM M MU CUBA
ADAVIS A AGP CUBA
SGACEDOM M MU DOMINICAN REPUBLIC
ARTEGESTION A AGP ECUADOR
SAYCE M MU ECUADOR
SACIM, EGC M MU EL SALVADOR
AEI M MU GUATEMALA
AACIMH M MU HONDURAS
JACAP M MU JAMAICA
DIRECTORES M AV MEXICO
SACM M MU MEXICO
SOGEM M AV MEXICO
SOMAAP M AGP MEXICO
NICAUTOR M MU NICARAGUA
SPAC M MU PANAMA
APA M MU PARAGUAY
APDAYC M MU PERU
APSAV M AGP PERU
ECCO M MU SAINT-LUCIA
SASUR M MU SURINAME
ACCS A MU TRINIDAD AND TOBAGO
COTT M MU TRINIDAD AND TOBAGO
AGADU M MU URUGUAY
LATINAUTOR A NA URUGUAY
AUTORARTE A AGP VENEZUELA
SACVEN M MU, D VENEZUELA
LATIN AMERICA & CARIBBEAN
NB: The information concerning each society’s repertoire is based solely on the collection figures that the society provided to CISAC (I&E tool)

43
About CISACCISAC – the International Confederation of Societies of Authors and Composers – is the world’s leading network of authors’ societies (also referred to as Collective Management Organisations, or CMOs).
With 230 member societies in 120 countries, CISAC represent more than 3 million creators from all geographic areas and all artistic repertoires; music, audiovisual, drama, literature and visual arts. CISAC is presided over by electronic music pioneer Jean Michel Jarre and our four vice-presidents are: Beninese creator and singer Angélique Kidjo, Senegalese sculptor Ousmane Sow, Indian poet, scriptwriter and lyricist Javed Akhtar and Argentinean film director Marcelo Piñeyro.
CISAC works to protect the rights and promote the interests of creators worldwide. We enable collective management organisations to seamlessly represent creators across the globe and ensure that royalties flow to authors for the use of their works anywhere in the world. To this end, CISAC provides the highest business, legal, and IT standards to protect creators’ rights and to support the development of the international network of collective management societies.
Founded in 1926, CISAC is a non-governmental, not-for-profit organisation with headquarters in France and regional offices in Africa (Burkina Faso), South America (Chile), Asia-Pacific (China) and Europe (Hungary).
COUNTRIES/TERRITORIES COVERED BY CISAC MEMBER SOCIETIES (January 2015)


This report was prepared with the assistance of:Media Insight Consulting (Chris Carey)MIC is a boutique media research company, specialising in music industry data. We offer analysis of market trends, analysis of companies internal data (including Big Data analytics) and running international consumer surveys. Before MIC, Chris was Senior Economist at PRS for Music, Global Insight Director at EMI Group and Global Insight Director at Universal Music Group.IMV Conseil (Frédéric Patissier) Founded in 2008, IMV Conseil is a Paris-based independent consultancy company, specialising in business consulting services (project management, strategy, marketing and market research). We enjoy a solid experience in a wide array of industries, with a strong focus on the cultural and entertainment sectors.Translations: Hélène Caruyer, Paz Juan GutiérrezPhotos and Credits: Santana©E. Kabik, courtesy of BMIPublished by the Communications Department of CISAC (January 2015).Design and production : 01 55 76 11 11 • 13095 •

CISACConfédération Internationale des Sociétés d’Auteurs et CompositeursFrance • Burkina Faso • Chile • China • Hungarywww.cisac.org