Circulatory microRNAs are not effective biomarkers of ...
22
Circulatory microRNAs are not effective biomarkers of muscle size and function in 1 middle-aged men 2 R.F. D’Souza 1 , N. Zeng 1 , S.D. Poppitt 2,3 , D. Cameron-Smith 1,3,4 , C. J. Mitchell 1* 3 1 Liggins Institute, The University of Auckland, Auckland, New Zealand. 4 2 School of Biological Sciences, The University of Auckland, Auckland, New Zealand 5 3 Riddet Institute, Centre of Research Excellence (CoRE), Palmerston North, New Zealand 6 4 Food & Bio-based Products Group, AgResearch, Palmerston North, New Zealand 7 8 * Correspondence: Dr Cameron Mitchell 9 The Liggins Institute, 10 University of Auckland, 11 85 Park Road, Grafton, Private Bag, 92019, 12 Auckland 2018, New Zealand. 13 Phone +64 9 923 6606 14 Fax + 64 9 373 7039 15 Email: [email protected] 16 17 Running title: c-miRNA biomarkers of muscle size and function 18 Downloaded from www.physiology.org/journal/ajpcell at Univ of Auckland Lib (130.216.158.078) on January 23, 2019.
Transcript of Circulatory microRNAs are not effective biomarkers of ...
Circulatory microRNAs are not effective biomarkers of muscle size and function in 1
middle-aged men 2
R.F. D’Souza1, N. Zeng1, S.D. Poppitt2,3, D. Cameron-Smith1,3,4, C. J. Mitchell1* 3
1 Liggins Institute, The University of Auckland, Auckland, New Zealand. 4
2School of Biological Sciences, The University of Auckland, Auckland, New Zealand 5
3Riddet Institute, Centre of Research Excellence (CoRE), Palmerston North, New Zealand 6
4Food & Bio-based Products Group, AgResearch, Palmerston North, New Zealand 7
8
*Correspondence: Dr Cameron Mitchell 9
The Liggins Institute, 10
University of Auckland, 11
85 Park Road, Grafton, Private Bag, 92019, 12
Auckland 2018, New Zealand. 13
Phone +64 9 923 6606 14
Fax + 64 9 373 7039 15
Email: [email protected] 16
17
Running title: c-miRNA biomarkers of muscle size and function 18
Downloaded from www.physiology.org/journal/ajpcell at Univ of Auckland Lib (130.216.158.078) on January 23, 2019.
Abstract 19
Loss of muscle size and strength with aging are a major cause of morbidity. Whilst, muscle 20
size and strength are measured by imaging or fiber cross-sectional staining and exercise 21
testing respectively, the development of circulatory biomarkers for these phenotypes would 22
greatly simplify identification of muscle function deficits. MicroRNAs (miRNAs) are short 23
non-coding RNAs that regulate gene translation and thereby contribute to muscle phenotype. 24
To assess circulatory miRNAs (c-miRNAs) applicability as potential biomarkers of muscular 25
phenotypes, fasting plasma and muscle samples were obtained from 50 middle-aged healthy 26
men (mean ± SD: age 48.8 ± 4.5 years, BMI 26.6 ± 3.3 kg/m2). RT-PCR of 38 miRNAs with 27
known regulatory function within skeletal muscle identified four c-miRNAs (miR-221, -451a, 28
-361 and -146a) related to either total body lean mass, leg lean mass and 50% thigh cross 29
sectional area (CSA) but not strength. There was no relationship with the expression of these 30
miRNAs in muscle. 6 miRNAs within muscle were correlated with whole body lean mass, 31
leg lean mass and isometric knee extension torque (miR-133a, -and 146a,), 50% thigh CSA 32
(miR-486, -208b, -133b and -208a). Only miR-23b demonstrated a relationship between 33
tissue and circulatory expression, however only 10% of the variance was explained. miR-34
146a in both plasma and muscle was related to phenotype, however no relationship between 35
plasma and muscle expression was evident. A different subset of miRNAs related to muscle 36
phenotype in muscle compared to plasma samples suggesting that c-miRNA biomarkers of 37
muscle phenotype are likely unrelated to muscle expressions in healthy individuals. 38
Keywords: miRNA, skeletal muscle, circulatory microRNAs, biomarkers, RT-PCR 39
40
Downloaded from www.physiology.org/journal/ajpcell at Univ of Auckland Lib (130.216.158.078) on January 23, 2019.
Introduction 41
Skeletal muscle strength and size are important determinants of physical function and 42
mobility in the elderly. Reduced muscle mass and physical function often become clinically 43
relevant with sarcopenia onset resulting in increased falls and fractures risk and a reduced 44
quality of life (15). In addition to declines in muscle size; changes in composition, 45
architecture and innervation, together explain the greater observed loss of muscle strength 46
than size (25, 27). Whilst severe phenotype impairments with age generally present in later 47
age, it is believed declines in muscle mass may commence as early as the 5th decade of life. 48
Central to the determination of the complex processes that regulate muscle mass is a range of 49
miRNA species thought to inhibit translation of specific mRNAs involved in muscle 50
phenotype regulation. Differences in expression of pri-miRNAs, miR-1,-133 and -206 were 51
identified in young compared to aged muscle (11). However, miR-451a, -15a and 16 were 52
elevated in aged muscle (1, 2). These miRNAs inhibit cyclin-dependent cell cycle activity 53
and along with miR-126 regulate angiogenesis (9, 13). miR-1, -133a, -206, -486 and let -7 54
family miRNAs mediate satellite cell-dependent muscle remodeling and repair (4, 10, 29). 55
miR-23a/b inhibit atrophy via downregulation of catabolic factors, MuRF1 and Atrogin1 (30) 56
and correlations between miR-23a and Atrogin1 miRNA expression were demonstrated in-57
vivo following an atrophic stimulus (8). Several miRNAs mentioned above and others have 58
additionally been implicated in the regulation of atrophy (8), dystrophy (19), cancer cachexia 59
(17) and in various aspects of muscle regulation contributing to muscle size and strength. 60
In an increasingly diverse range of cancers, organ system diseases including muscular 61
dystrophy and cardiovascular diseases, analyses of circulatory miRNA (c-miRNAs) profiles 62
have provided proxies for risk prediction, disease severity and diagnosis. While factors 63
measured, including miRNA, within skeletal muscle are likely the best predictors of muscle 64
Downloaded from www.physiology.org/journal/ajpcell at Univ of Auckland Lib (130.216.158.078) on January 23, 2019.
health and function, the process of skeletal muscle biopsy collection is invasive and not 65
possible in all population groups (12). It is likely that a subgroup of c-miRNAs may be 66
directly secreted from muscle and therefore might reflect intramuscular miRNA expression or 67
muscle phenotype. Given that plasma is a more readily available sample matrix than muscle 68
tissue, plasma biomarkers of muscle phenotype are an attractive prospect. As yet, two studies 69
have identified c-miRNAs as potential biomarkers of whole body aerobic capacity following 70
periods of aerobic training in healthy individuals (3, 24). 71
The study aimed to identify from a cohort of 50 healthy middle-aged men, the ability of c-72
miRNA or intramuscular miRNAs to act as predictive biomarkers of skeletal muscle mass, 73
size and strength. An a priori set of 38 previously established target miRNA species 74
regulating key processes related to muscle size and function were included. The secondary 75
aim was to determine if a relationship exists between microRNA expression of muscular and 76
circulatory compartments in order to assess the ability of c-miRNA to function as proxies of 77
miRNA measurements made directly from skeletal muscle. 78
79
Downloaded from www.physiology.org/journal/ajpcell at Univ of Auckland Lib (130.216.158.078) on January 23, 2019.
Methods 80
Participants and Sample Collection 81
50 healthy middle-aged men (mean ± SD: age 48.8 ± 4.5 years, BMI 26.6 ± 3.3 kg/m2) were 82
recruited to the study. Participants underwent strength testing and muscle imaging analyses 83
prior to participating in two separate trials (21, 23) which were registered with the Australia 84
New Zealand Clinical Trial Registry# ACTRN12615000454572 and 85
ACTRN12615001375549 on 11th May 2015 and 17th December 2015 respectively. 86
Participants were sedentary to recreationally active, did not perform regular resistance 87
exercise and were free from any metabolic, oncological or neuromuscular injury or disease. 88
Written consent was obtained prior to study commencement which was approved by the 89
Northern Health and Disability Ethics Committee (New Zealand), (15/NTB/154/AM01 and 90
14/NTA/146). 91
Participants were instructed not to perform any exercise or strenuous activity for >48 hours 92
prior to the trial day to ensure sampling was not affected by previous activity. Following an 93
an overnight fast, participants arrived at the laboratory at ~7 am for the trial day. 94
Imaging 95
As previously described , whole body dual energy x-ray absorptiometry (DXA, Lunar 96
Prodigy, GE, Waltham, MA, USA) scans were performed with automatic segmentation by 97
Lunar Prodigy encore 2007 Version 11.40.004 (GE, Madison, WI, USA), and tissue regions 98
were defined by lines positioned on the image, allowing measures of total body lean mass and 99
leg lean mass to be determined (21, 23). 100
Muscle cross sectional area (CSA) at 50% of femur length was assessed using a Stratec XCT 101
3000 peripheral quantitative computed tomograph (pQCT) with software version 6.20C 102
Downloaded from www.physiology.org/journal/ajpcell at Univ of Auckland Lib (130.216.158.078) on January 23, 2019.
(Stratec Medizintechnik, Pforzheim, Germany). pQCT CSA measures were determined as per 103
(21), and were analyzed by the same operator. 104
Muscle function 105
Isometric knee extensor strength was measured using a Biodex dynamometer (Shirley, New 106
York, United States) with the knee angle set to 90º of flexion. Three maximal isometric knee 107
extensions of 5 s each with 30 s of rest was completed. The highest values were used for 108
analysis. 109
Blood sampling 110
A cannula (20-gauge) was inserted into an antecubital vein from which 10 mL of plasma 111
was collected into an EDTA-vacutainer. Samples were centrifuged immediately upon 112
collection at 4°C at 1900 g for 15 minutes. The supernatant was collected in 1.6 mL sterile 113
tubes as 1 mL aliquots and stored at -800C. 114
Muscle biopsy sampling 115
Muscle biopsies (~100 mg) were collected at rest from the vastus lateralis under local 116
anesthesia (1% Xylocaine) using a Bergstrom needle modification of manual suction. 117
Biopsies were frozen in N2 and stored at -80°C. 118
miRNA isolation 119
Muscle miRNA was extracted from ~20 mg of tissue using the AllPrep® DNA/RNA/miRNA 120
Universal Kit (QIAGEN GmbH, Hilden, Germany). Plasma miRNA was isolated from 200 121
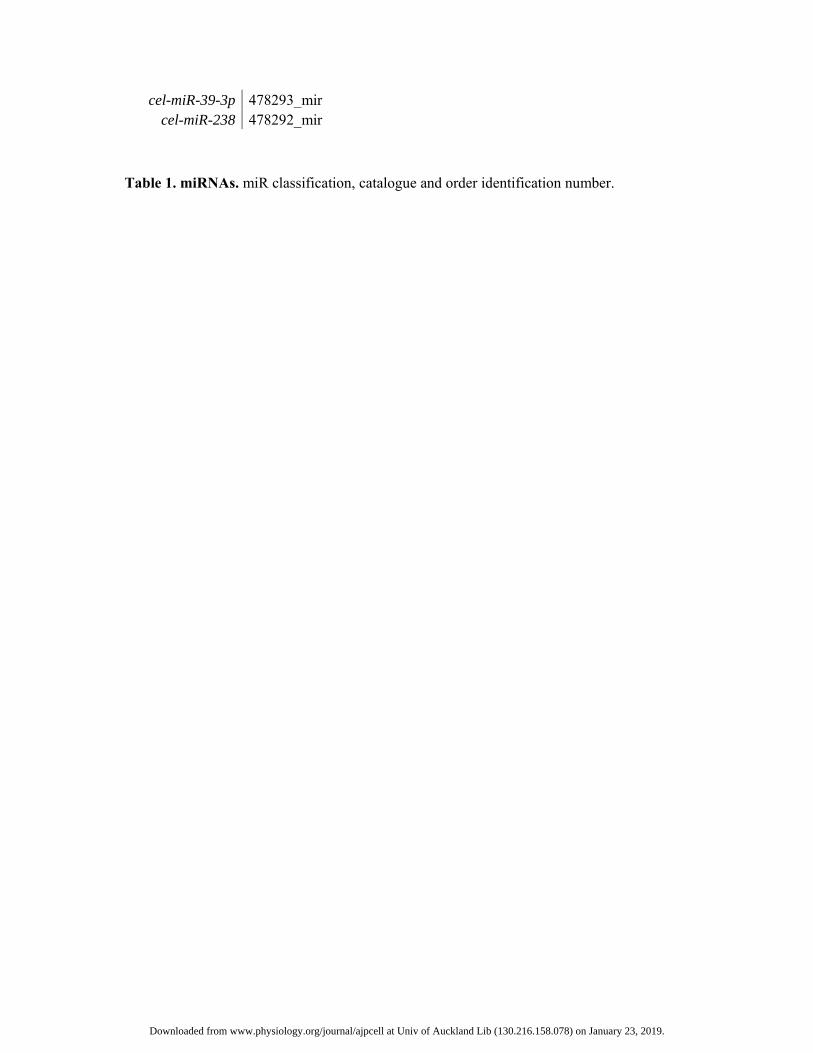
µL plasma as per (6). 10 pg of the exogenous spike-in cel-miR-39 and cel-miR-238 were 122
added to samples prior to extraction and cDNA synthesis to account for variation in sample 123
preparation. 124
Muscle and circulatory miRNA cDNA/RTPCR 125
Downloaded from www.physiology.org/journal/ajpcell at Univ of Auckland Lib (130.216.158.078) on January 23, 2019.
RNA from muscle and plasma were used for cDNA synthesis using TaqMan™ Advanced 126
miRNA cDNA Synthesis Kit (Thermo Fisher Scientific, Carlsbad, CA, USA) and miRNA 127
abundances were measured by RT‐PCR on a QuantStudio 6 (Thermo Fisher Scientific, 128
Carlsbad, CA, USA) using Applied Biosystems Fast Advanced Master Mix (Thermo Fisher 129
Scientific, Carlsbad, CA, USA). 130
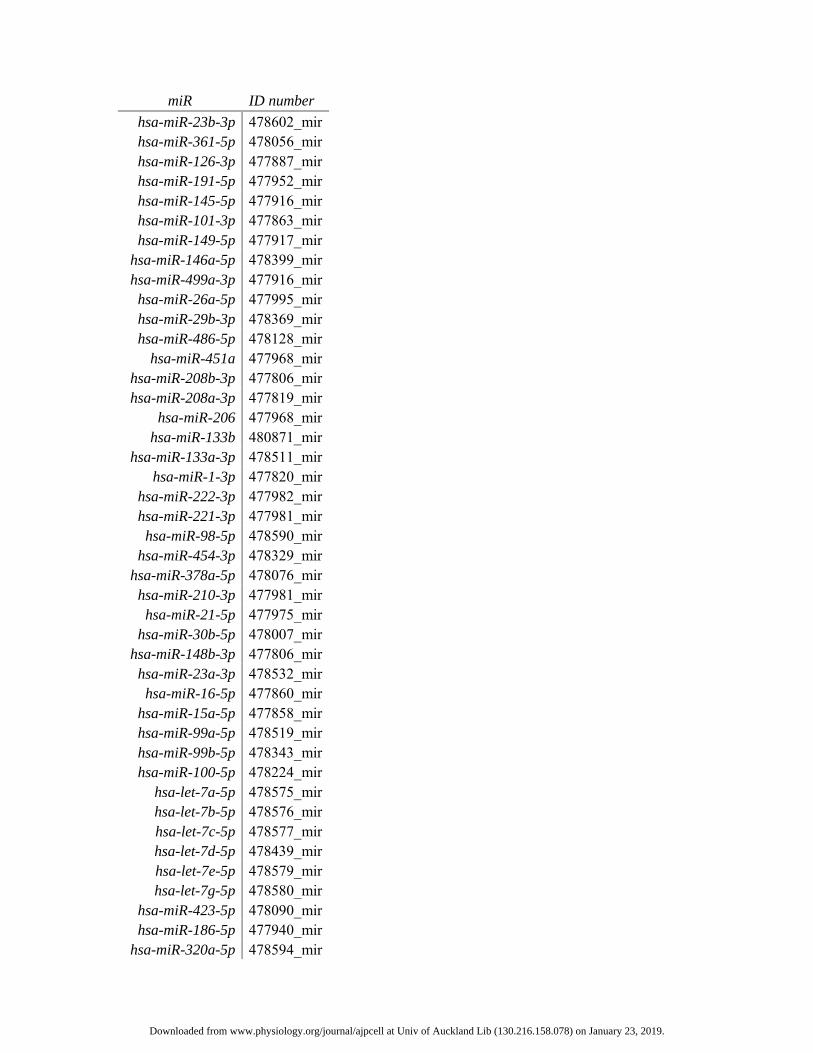
Target miRNAs described in table 1 (Thermo Fisher Scientific, Carlsbad, CA, USA), were 131
chosen from a literature search for miRNAs suggested to regulate muscle function, 132
myogenesis or be altered following exercise. Probes performance and CT assessment were 133
carried out as per (6). The geometric mean of three reference miRNAs (miR-361, -191 and -134
186) for muscle and four for plasma (miR-191 and -186, -320a and -423) were used for 135
normalization using miRNAs that showed least variance in the current sample set. The CT 136
mean ± SD for each geomean was 26.28 ± 0.67 cycles in muscle and 27.06 ± 0.81 in plasma 137
respectively. Data was analyzed using the 2-ΔCT method (26). For plasma samples, hemolysis 138
was assessed using differences between miR-451a and miR-23a-3p with a CT difference >7 139
used as the cut off for sample hemolysis, as values lower than 7 indicate little to no 140
hemolysis. 141
Statistical analysis 142
Stepwise linear regressions were used to examine the relationships between measures of 143
phenotype including total body and leg lean mass, isometric knee extension strength, age and 144
50% thigh muscle CSA as dependent variables with miRNAs of interest as independent 145
variables (IBM SPSS Version 23 (IBM Corp. USA)). Alpha was set as <0.05. Graphs show 146
the miRNAs with the strongest relationship to each phenotype measure. Independent R2 for 147
these miRNAs are expressed in their respective graphs. 148
149
Downloaded from www.physiology.org/journal/ajpcell at Univ of Auckland Lib (130.216.158.078) on January 23, 2019.

Results 150
Plasma miRNAs related to phenotype 151
No relationships were observed between any measures of muscle phenotype and 152
chronological age so all analysis was conducted on the full cohort without age adjustment. 153
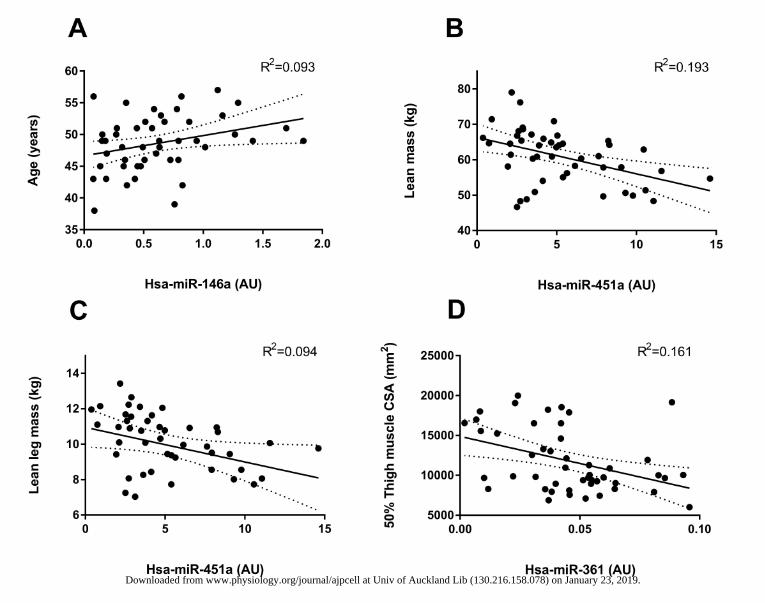
Linear regression of plasma miRNA expression indicated a positive relationship between age 154
and c-miR-146a (R2 = 0.0938 and p=0.038) (Figure 1A). Total body lean mass was 155
significantly negatively correlated with c-miR-451a expression (R2 = 0.193 and p=0.002) 156
(Figure 1B). c-miR-451a was best negatively correlated with leg lean mass (Figure 1C) and 157
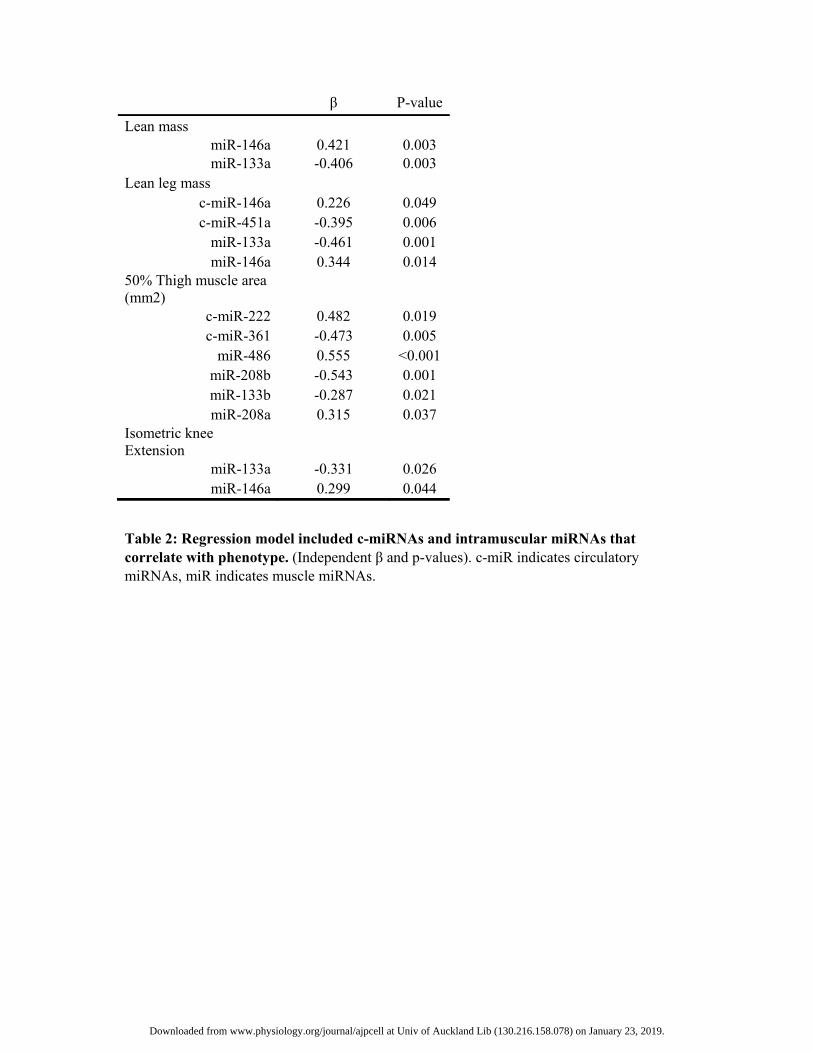
together with miR-146a which demonstrated a positive relationship, predicted ~25% of 158
subject variability (R2 = 0.252 and p=0.002) (Table 2) while 50% thigh muscle cross 159
sectional area was most strongly negatively correlated with c-miR-361 (Figure 1D), together 160
with c-miR-222 which was positively related with thigh CSA, predicted ~40% of the 161
observed participant variance(R2 = 0.392 and p<0.001) (Figure 1D). Isometric knee extension 162
strength showed no relationship to abundance of any of the c-miRNAs analyzed in the 163
present study. Beta and p-values for multiple miRNA independently correlated with a single 164
phenotype measure are presented in Table 2. 165
Muscle miRNAs related to phenotype 166
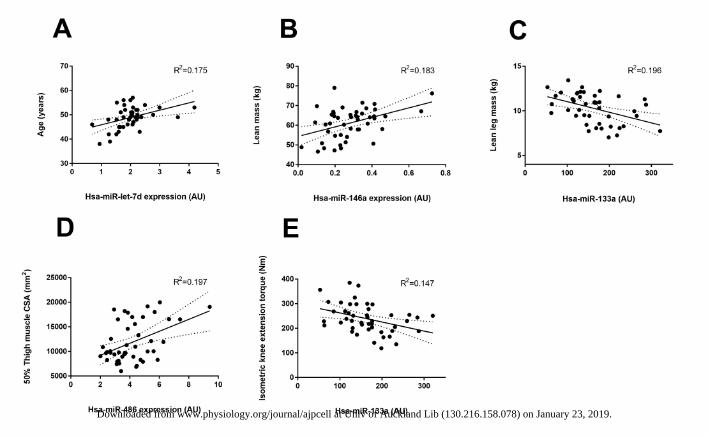
Linear regression analyses indicated a significant positive relationship between muscle let-167
7d-5p expression and age (R2 = 0.175 and p=0.0047) (Figure 2A). Lean mass was best found 168
to positively correlate with miR-146a (Figure 2B) and together with miR-133a which 169
demonstrated a negative relationship, predicted ~34% of participant variability. miR-133a 170
was found to best correlate negatively lean leg mass (Figure 2C) and together with miR-146 171
which had a positive correlation, explained ~33% of the observed participant variance. 50% 172
thigh muscle CSA was positively associated with miR-486 and -208a but negatively related 173
Downloaded from www.physiology.org/journal/ajpcell at Univ of Auckland Lib (130.216.158.078) on January 23, 2019.
with miR-208b and -133b. The combined expression of these miRNAs explained roughly 174
~51% of subject variance (R2 = 0.509 and p<0.001) of which, miR-486 was the most strongly 175
related to this measure (positively) (Figure 2D). Isometric knee extension strength was found 176
to best correlate negatively with miR-133a and (Figure 2E) together with miR-146a which 177
demonstrated a positive relationship explained ~20% participant variability (R2 = 0.203 and 178
p=0.002) Beta values and p-value for independent c-miRNAs significantly correlated with 179
phenotype are presented in Table 2. 180
Muscle miRNA to plasma miRNA abundance correlates 181
Only miR-23b showed a significant relationship between fasted, non-exercised muscle and 182
plasma miRNA abundances (R2 =0.102 and p =0.030). 183
184
Downloaded from www.physiology.org/journal/ajpcell at Univ of Auckland Lib (130.216.158.078) on January 23, 2019.
Discussion 185
The current cohort of middle-aged men showed a ~1.7 fold range in total body lean mass, a 186
~1.9 fold range in leg lean mass, ~3.3 fold range in 50% thigh CSA and ~3.3 fold spread in 187
peak knee extensor torque. The chronological age of the participants (38-57 years) did not 188
affect any of the muscle phenotype measures and therefore other factors would be responsible 189
for the observed variance in phenotype. 190
c-miRNAs related to phenotype 191
c-miR-222 was positively related with thigh muscle CSA. However, as c-miR-222 expression 192
predicts less than 25% of the observed phenotype variance, it has limited utility as a 193
biomarker. c-miR-451a was negatively related to total body lean mass and leg lean mass and 194
c-miR-361 was negatively related with thigh CSA. Previously, miR-451a was shown to be 195
elevated in aged muscle of non-human primates (20). There was however, no relationship to 196
participant age in the current cohort of men. Given the disconnect between muscle and 197
circulatory miRNA content, it is not surprising that abundances of c-miR-451a were 198
unrelated to participant age. 199
miR-146a, was elevated in muscle of individuals with increased total body lean mass, leg 200
lean mass, increased 50% thigh CSA and knee extensor strength. However, c-miR-146a was 201
found to positively relate with age and lean leg mass. Oxidative stress is thought to increase 202
with age and the relationship between c-miR-146a and age is consistent with other reports 203
(28) and may reflect oxidative stress. The current analyses are limited however due to 204
miRNAs being promiscuous molecules capable of being transcribed, released and functioning 205
in multiple tissue types making it impossible to isolate whether the observed c-miRNAs 206
trends are indeed reflective of muscle regulation or whether they are driven by miRNA 207
expression in non-muscle tissues. It is also possible that miRNA may play only an indirect 208
Downloaded from www.physiology.org/journal/ajpcell at Univ of Auckland Lib (130.216.158.078) on January 23, 2019.
secondary role in muscle regulation or that these miRNAs are simply the product of 209
metabolism and are biomarkers without regulatory function. 210
Intramuscular miRNAs related to phenotype. 211
Of the eight previously identified canonical myomiRs in muscle, miR-133a, -133b, -208a, -212
208b and -486 were all related to measures of muscle size and function. miR-133a was 213
negatively related with whole body muscle mass, leg muscle mass and isometric knee 214
extensor strength. miR-486 and 208a were positively related with 50% thigh CSA whilst 215
miR-133b and -208b demonstrate a negative relationship with the same measure. miR-208a/b 216
are involved in regulating muscle fiber type expression and therefore it seems reasonable that 217
these miRNAs would be reflective of muscle size measures (9, 14). miR-133a and -486 are 218
crucial regulators of satellite cell dependent muscle repair and remodeling via inhibition of 219
PAX7 (4, 10, 29), this presents a plausible mechanism for the observed relationship with 220
muscle phenotype. These data are consistent with our previous demonstration of miR-133a’s 221
negative but non-significant trend with both muscle strength and CSA (p=0.078 and p=0.101 222
respectively) in a similar cohort of middle-aged men via miRNA sequencing analyses (22). 223
Likewise in overload induced plantaris hypertrophy in rats following surgical soleus and 224
gastrocnemius, miR-133a was found to negatively correlate with muscle mass (16). 225
Additionally, lower miR-133a expression was evident in powerlifters compared to healthy 226
controls (5). Together these findings suggest a consistent negative relationship between miR-227
133a expression and skeletal muscle size across multiple studies and models. 228
The observed cross-sectional relationships fit well with previous longitudinal intervention 229
studies. However, predictors of age and lean mass within muscle only explained ~33% of the 230
observed variance, and ~50% of thigh CSA. The present study is potentially limited by the 231
lack of inclusion of a dystrophic, sarcopenic or elderly group. The findings suggest a clear 232
Downloaded from www.physiology.org/journal/ajpcell at Univ of Auckland Lib (130.216.158.078) on January 23, 2019.
potential for the utility of intramuscular miRNA content when explaining thigh muscle 233
phenotype and identify key miRNA targets for future mechanistic studies of muscle 234
phenotype regulation. 235
Applicability of c-miRNAs as phenotype biomarkers 236
Of the 38 miRNAs assessed, only miR-23b expression demonstrated a weak relationship 237
between plasma and muscle samples. Only miR-146a abundance related to phenotype in both 238
circulation and muscle, but no relationship was evident between sample matrices (R2 = 0.011 239
and p=0.493). Additionally, the inability of any c-miRNA to explain variance in muscle 240
strength further highlights the limited capacity for c-miRNA abundances to act as effective 241
proxies of muscle miRNA expression. To date, most studies that report relationships between 242
muscle phenotype and miRNAs expression involve disease states or periods of exercise 243
training. The model employed by the present study of fasted and rested sampling in men free 244
from major chronic or acute illness and showing large variations in muscle strength allowed 245
for muscle phenotype per se to be isolated from possible confounders such as age, cachexia 246
or organ system disease. The present findings indicate that the measured c-miRNAs selected 247
due to their enrichment in muscle, role in myogenesis or exercise responsiveness cannot be 248
used, in our cohort of middle-aged men, as proxy for measurements made directly from 249
sampling muscle tissue or to function as biomarkers of muscle strength. Independently the 250
best c-miRNA predictor of muscle phenotype was miR-451 which predicted ~20% of the 251
subject variance in whole body lean mass, however, no c-miRNA effectively predicted 252
muscle strength. The best muscle miRNA predictor of phenotype was miR-486 which also 253
predicted ~20% of variance in 50% thigh muscle CSA. These data suggest that plasma 254
miRNA are stronger predictors of whole body muscle mass compared to muscle miRNA 255
predictors which better relate to the muscle size and function of the muscle which they are 256
isolated from. Additionally this does not preclude the possibility that these and other non 257
Downloaded from www.physiology.org/journal/ajpcell at Univ of Auckland Lib (130.216.158.078) on January 23, 2019.

analysed c-miRNAs could become important predictors of muscle function and disease 258
progression in conditions such as myopathies, dystrophies or cancer cachexia. 259
Most miRNAs are abundant in multiple tissues for example, miR-451a is highly expressed in 260
skeletal muscle, erythrocytes, thyroid, spleen, liver and brain (18). The lack of tissue 261
specificity for all but an extremely limited set of miRNAs make it impossible to identify the 262
tissue source of c-miRNAs and therefore limits the ability to make inferences about the 263
mechanistic functions from c-miRNAs analyses. Emerging evidence suggests most c-264
miRNAs are riboprotein bound with a small proportion being associated with exosomes that 265
contain a miRNA profile unique to both muscle and plasma (7). Taken together with the 266
present study it appears that circulating and exosomal miRNA levels are regulated by the cell 267
state within secreting tissues rather than simple changes in tissue concentrations. Future 268
studies ought to characterize miRNA content within muscle specific exosomes which may 269
better identify circulatory miRNA biomarkers for muscle size and strength. 270
Conclusions 271
The current findings agree with previous work suggesting relationships between expression 272
of the myomiRs particularly miR-133a and miR-146a and muscle phenotype. There was no 273
evidence that the selected subset of c-miRNAs are related to their intramuscular expression. 274
c-miRNAs showed a similar ability to intramuscular miRNA to predict whole body muscle 275
mass however, only intramuscular miRNA showed relationships with local muscle size and 276
strength. The identified miRNAs should be investigated further a potential mechanistic 277
regulators of muscle phenotype however, given that the strongest individual miRNA 278
accounted for ~20% of the variance in muscle phenotype and the strongest combination of 279
miRNAs accounted for ~50% of the variance in muscle phenotype the clinical utility of these 280
miRNAs as biomarkers of muscle size and function in healthy men is currently limited. 281
Downloaded from www.physiology.org/journal/ajpcell at Univ of Auckland Lib (130.216.158.078) on January 23, 2019.
282
Acknowledgments 283
The authors would like to acknowledge Mr. Aaron C. Fanning for his research support. 284
285
Contributions 286
The study was designed by CJM, DC-S, SDP and RFD. Performed experiments: RFD and 287
NZ. Sample Collection: RFD and CJM Analysed data: RFD. Critically evaluated and 288
contributed to the manuscript: RFD, NZ, SDP, CJM, and DC-S. CJM is responsible for the 289
final content of the manuscript. 290
291
Funding 292
Funding for this study was provided by the New Zealand Primary Growth Partnership (PGP) 293
post-farm gate programme, funded by Fonterra Co-operative Group Ltd and the NZ Ministry 294
for Primary Industries (MPI). The sponsor of the study was not involved in the conduct of the 295
study or in the interpretation of the findings. 296
297
Disclosure Statement 298
RFD, DC-S and CJM received financial support from the New Zealand Primary Growth 299
Partnership (PGP) post-farm gate programme, funded by Fonterra Co-operative Group Ltd 300
and the NZ Ministry for Primary Industries (MPI). SDP is the Fonterra Chair in Human 301
Nutrition, University of Auckland. 302
Downloaded from www.physiology.org/journal/ajpcell at Univ of Auckland Lib (130.216.158.078) on January 23, 2019.
References 303
1. Abdelmohsen K, de Cabo R, Gorospe M, Cookson MR, Mattison J, Bernier M, 304 Kim J, Guo R, Ding J, and Majounie E. Age-associated miRNA Alterations in Skeletal 305 Muscle from Rhesus Monkeys reversed by caloric restriction. Aging 5: 692-703, 2013. 306 2. Aqeilan RI, Calin GA, and Croce CM. miR-15a and miR-16-1 in cancer: discovery, 307 function and future perspectives. Cell death and differentiation 17: 215-220, 2010. 308 3. Baggish AL, Hale A, Weiner RB, Lewis GD, Systrom D, Wang F, Wang TJ, and 309 Chan SY. Dynamic regulation of circulating microRNA during acute exhaustive exercise and 310 sustained aerobic exercise training. The Journal of physiology 589: 3983-3994, 2011. 311 4. Chen J-F, Mandel EM, Thomson JM, Wu Q, Callis TE, Hammond SM, Conlon 312 FL, and Wang D-Z. The role of microRNA-1 and microRNA-133 in skeletal muscle 313 proliferation and differentiation. Nature genetics 38: 228, 2006. 314 5. D'Souza RF, Bjørnsen T, Zeng N, Aasen KM, Raastad T, Cameron-Smith D, and 315 Mitchell CJ. MicroRNAs in Muscle: Characterizing the Powerlifter Phenotype. Frontiers in 316 physiology 8: 383, 2017. 317 6. D'Souza RF, Markworth JF, Aasen KMM, Zeng N, Cameron-Smith D, and 318 Mitchell CJ. Acute resistance exercise modulates microRNA expression profiles: Combined 319 tissue and circulatory targeted analyses. PLoS One 12: e0181594, 2017. 320 7. D'Souza RF, Woodhead JST, Zeng N, Blenkiron C, Merry TL, Cameron-Smith 321 D, and Mitchell CJ. Circulatory exosomal miRNA following intense exercise is unrelated to 322 muscle and plasma miRNA abundances. American journal of physiology Endocrinology and 323 metabolism 2018. 324 8. D'souza RF, Zeng N, Figueiredo VC, Markworth JF, Durainayagam BR, 325 Mitchell SM, Fanning AC, Poppitt SD, Cameron‐Smith D, and Mitchell CJ. Dairy 326 Protein Supplementation Modulates the Human Skeletal Muscle microRNA Response to 327 Lower Limb Immobilization. Molecular nutrition & food research 62: 1701028, 2018. 328 9. D'Souza RF, Zeng N, Markworth JF, Figueiredo VC, Roberts LA, Raastad T, 329 Coombes JS, Peake JM, Cameron-Smith D, and Mitchell CJ. Divergent effects of cold 330 water immersion versus active recovery on skeletal muscle fiber type and angiogenesis in 331 young men. American Journal of Physiology-Regulatory, Integrative and Comparative 332 Physiology 2018. 333 10. Dey BK, Gagan J, and Dutta A. miR-206 and-486 induce myoblast differentiation 334 by downregulating Pax7. Molecular and cellular biology 31: 203-214, 2011. 335 11. Drummond MJ, McCarthy JJ, Fry CS, Esser KA, and Rasmussen BB. Aging 336 differentially affects human skeletal muscle microRNA expression at rest and after an 337 anabolic stimulus of resistance exercise and essential amino acids. American Journal of 338 Physiology-Endocrinology and Metabolism 295: E1333-E1340, 2008. 339 12. Evans WJ, and Lexell J. Human aging, muscle mass, and fiber type composition. 340 The Journals of Gerontology Series A: Biological Sciences and Medical Sciences 50: 11-16, 341 1995. 342 13. Fish JE, Santoro MM, Morton SU, Yu S, Yeh R-F, Wythe JD, Ivey KN, Bruneau 343 BG, Stainier DY, and Srivastava D. miR-126 regulates angiogenic signaling and vascular 344 integrity. Developmental cell 15: 272-284, 2008. 345 14. Hitachi K, and Tsuchida K. Role of microRNAs in skeletal muscle hypertrophy. 346 Frontiers in physiology 4: 408, 2014. 347 15. Janssen I, Heymsfield SB, and Ross R. Low relative skeletal muscle mass 348 (sarcopenia) in older persons is associated with functional impairment and physical disability. 349 Journal of the American Geriatrics Society 50: 889-896, 2002. 350
Downloaded from www.physiology.org/journal/ajpcell at Univ of Auckland Lib (130.216.158.078) on January 23, 2019.
16. Koltai E, Bori Z, Chabert C, Dubouchaud H, Naito H, Machida S, Davies KJ, 351 Murlasits Z, Fry AC, and Boldogh I. SIRT1 may play a crucial role in overload‐induced 352 hypertrophy of skeletal muscle. The Journal of Physiology 595: 3361-3376, 2017. 353 17. Lee DE, Brown JL, Rosa-Caldwell ME, Blackwell TA, Perry RA, Jr., Brown LA, 354 Khatri B, Seo D, Bottje WG, Washington TA, Wiggs MP, Kong BW, and Greene NP. 355 Cancer cachexia-induced muscle atrophy: evidence for alterations in microRNAs important 356 for muscle size. Physiol Genomics 49: 253-260, 2017. 357 18. Ludwig N, Leidinger P, Becker K, Backes C, Fehlmann T, Pallasch C, 358 Rheinheimer S, Meder B, Stähler C, and Meese E. Distribution of miRNA expression 359 across human tissues. Nucleic acids research 44: 3865-3877, 2016. 360 19. Matsuzaka Y, Tanihata J, Komaki H, Ishiyama A, Oya Y, Ruegg U, Takeda SI, 361 and Hashido K. Characterization and Functional Analysis of Extracellular Vesicles and 362 Muscle-Abundant miRNAs (miR-1, miR-133a, and miR-206) in C2C12 Myocytes and mdx 363 Mice. PLoS One 11: e0167811, 2016. 364 20. Mercken EM, Majounie E, Ding J, Guo R, Kim J, Bernier M, Mattison J, 365 Cookson MR, Gorospe M, and de Cabo R. Age-associated miRNA alterations in skeletal 366 muscle from rhesus monkeys reversed by caloric restriction. Aging (Albany NY) 5: 692, 2013. 367 21. Mitchell CJ, D'Souza RF, Mitchell SM, Figueiredo VC, Miller BF, Hamilton KL, 368 Peelor FF, 3rd, Coronet M, Pileggi CA, Durainayagam B, Fanning AC, Poppitt SD, and 369 Cameron-Smith D. The impact of dairy protein during limb immobilization and recovery on 370 muscle size and protein synthesis; a randomized controlled trial. Journal of applied 371 physiology (Bethesda, Md : 1985) jap 00803 02017, 2017. 372 22. Mitchell CJ, D'Souza RF, Schierding W, Zeng N, Ramzan F, O'Sullivan JM, 373 Poppitt SD, and Cameron-Smith D. Identification of human skeletal muscle miRNA 374 related to strength by high-throughput sequencing. Physiol Genomics 50: 416-424, 2018. 375 23. Mitchell CJ, Zeng N, D’Souza RF, Mitchell SM, Aasen K, Fanning AC, Poppitt 376 SD, and Cameron-Smith D. Minimal dose of milk protein concentrate to enhance the 377 anabolic signalling response to a single bout of resistance exercise; a randomised controlled 378 trial. Journal of the International Society of Sports Nutrition 14: 17, 2017. 379 24. Mooren FC, Viereck J, Krüger K, and Thum T. Circulating microRNAs as 380 potential biomarkers of aerobic exercise capacity. American Journal of Physiology-Heart and 381 Circulatory Physiology 306: H557-H563, 2014. 382 25. Narici MV, Maganaris CN, Reeves ND, and Capodaglio P. Effect of aging on 383 human muscle architecture. Journal of applied physiology 95: 2229-2234, 2003. 384 26. Schmittgen TD, and Livak KJ. Analyzing real-time PCR data by the comparative C 385 T method. Nature protocols 3: 1101, 2008. 386 27. Suetta C, Andersen JL, Dalgas U, Berget J, Koskinen S, Aagaard P, Magnusson 387 SP, and Kjaer M. Resistance training induces qualitative changes in muscle morphology, 388 muscle architecture, and muscle function in elderly postoperative patients. Journal of applied 389 physiology 105: 180-186, 2008. 390 28. Vasa-Nicotera M, Chen H, Tucci P, Yang AL, Saintigny G, Menghini R, Mahè 391 C, Agostini M, Knight RA, and Melino G. miR-146a is modulated in human endothelial 392 cell with aging. Atherosclerosis 217: 326-330, 2011. 393 29. Wang XH. Microrna in myogenesis and muscle atrophy. Current Opinion in Clinical 394 Nutrition and Metabolic Care 16: 258-266, 2013. 395 30. Winbanks CE, Ooi JY, Nguyen SS, McMullen JR, and Bernardo BC. Micro RNA 396 s differentially regulated in cardiac and skeletal muscle in health and disease: Potential drug 397 targets? Clinical and Experimental Pharmacology and Physiology 41: 727-737, 2014. 398
399
Downloaded from www.physiology.org/journal/ajpcell at Univ of Auckland Lib (130.216.158.078) on January 23, 2019.
Figure legends 400
Figure 1: Strongest c-miRNA related to participant (A) Age, (B) lean mass, (C) 50% 401 thigh CSA and (D) lean leg mass. miRNAs are plotted as 2-ΔCT on the x-axis. The solid line 402 represents the line of best fit as determined by linear regression with 95% confidence 403 intervals. 404
405
Figure 2: Strongest muscle miRNAs related to participant (A) Age, (B) lean mass, (C) leg 406 lean mass, (D) 50% thigh CSA and (E) isometric knee extension torque. miRNAs included in 407 each model plotted as 2-ΔCT on the x-axis. The solid line represents the line of best fit as 408 determined by linear regression with 95% confidence intervals. 409
Downloaded from www.physiology.org/journal/ajpcell at Univ of Auckland Lib (130.216.158.078) on January 23, 2019.
Downloaded from www.physiology.org/journal/ajpcell at Univ of Auckland Lib (130.216.158.078) on January 23, 2019.
Downloaded from www.physiology.org/journal/ajpcell at Univ of Auckland Lib (130.216.158.078) on January 23, 2019.
miR ID number hsa-miR-23b-3p 478602_mir hsa-miR-361-5p 478056_mir hsa-miR-126-3p 477887_mir hsa-miR-191-5p 477952_mir hsa-miR-145-5p 477916_mir hsa-miR-101-3p 477863_mir hsa-miR-149-5p 477917_mir
hsa-miR-146a-5p 478399_mir hsa-miR-499a-3p 477916_mir hsa-miR-26a-5p 477995_mir hsa-miR-29b-3p 478369_mir hsa-miR-486-5p 478128_mir
hsa-miR-451a 477968_mir hsa-miR-208b-3p 477806_mir hsa-miR-208a-3p 477819_mir
hsa-miR-206 477968_mir hsa-miR-133b 480871_mir
hsa-miR-133a-3p 478511_mir hsa-miR-1-3p 477820_mir
hsa-miR-222-3p 477982_mir hsa-miR-221-3p 477981_mir hsa-miR-98-5p 478590_mir
hsa-miR-454-3p 478329_mir hsa-miR-378a-5p 478076_mir hsa-miR-210-3p 477981_mir hsa-miR-21-5p 477975_mir
hsa-miR-30b-5p 478007_mir hsa-miR-148b-3p 477806_mir hsa-miR-23a-3p 478532_mir hsa-miR-16-5p 477860_mir
hsa-miR-15a-5p 477858_mir hsa-miR-99a-5p 478519_mir hsa-miR-99b-5p 478343_mir hsa-miR-100-5p 478224_mir
hsa-let-7a-5p 478575_mir hsa-let-7b-5p 478576_mir hsa-let-7c-5p 478577_mir hsa-let-7d-5p 478439_mir hsa-let-7e-5p 478579_mir hsa-let-7g-5p 478580_mir
hsa-miR-423-5p 478090_mir hsa-miR-186-5p 477940_mir
hsa-miR-320a-5p 478594_mir
Downloaded from www.physiology.org/journal/ajpcell at Univ of Auckland Lib (130.216.158.078) on January 23, 2019.
cel-miR-39-3p 478293_mir cel-miR-238 478292_mir
Table 1. miRNAs. miR classification, catalogue and order identification number.
Downloaded from www.physiology.org/journal/ajpcell at Univ of Auckland Lib (130.216.158.078) on January 23, 2019.
β P-valueLean mass
miR-146a 0.421 0.003miR-133a -0.406 0.003
Lean leg mass c-miR-146a 0.226 0.049 c-miR-451a -0.395 0.006
miR-133a -0.461 0.001 miR-146a 0.344 0.014
50% Thigh muscle area (mm2)
c-miR-222 0.482 0.019 c-miR-361 -0.473 0.005
miR-486 0.555 <0.001 miR-208b -0.543 0.001 miR-133b -0.287 0.021 miR-208a 0.315 0.037
Isometric knee Extension
miR-133a -0.331 0.026 miR-146a 0.299 0.044
Table 2: Regression model included c-miRNAs and intramuscular miRNAs that correlate with phenotype. (Independent β and p-values). c-miR indicates circulatory miRNAs, miR indicates muscle miRNAs.
Downloaded from www.physiology.org/journal/ajpcell at Univ of Auckland Lib (130.216.158.078) on January 23, 2019.