
CIP Performance Dashboard User Guide Performance Dashboard User Guide . ... CIP map can utilize the...
27
CIP Performance Dashboard User Guide November 2017 Costed Implementation Plan Resource Kit Produced by: Familyplanning2020.org/cip
Transcript of CIP Performance Dashboard User Guide Performance Dashboard User Guide . ... CIP map can utilize the...
CIP Performance
Dashboard User Guide November 2017
Costed Implementation Plan Resource Kit
Produced by:
Familyplanning2020.org/cip
Costed Implementation Plan Resource Kit | familyplanning2020.org/cip 2
Disclaimer
Health Policy Plus (HP+) is a five-year
cooperative agreement funded by the U.S.
Agency for International Development under
Agreement No. AID-OAA-A-15-00051, beginning
August 28, 2015. HP+ is implemented by
Palladium, in collaboration with Avenir Health,
Futures Group Global Outreach, Plan
International USA, Population Reference
Bureau, RTI International, ThinkWell, and the
White Ribbon Alliance for Safe Motherhood.
The information provided in this document is not
official U.S. Government information and does
not necessarily reflect the views or positions of
the U.S. Agency for International Development
or the U.S. Government.
Contact Us
Health Policy Plus
1331 Pennsylvania Ave NW,
Suite 600
Washington, DC 20004
Phone: (202) 775-9680
Email: [email protected]
www.healthpolicyplus.com/

Costed Implementation Plan Resource Kit | familyplanning2020.org/cip 3
TABLE OF CONTENTS
Background ................................................................................................................................ 4
Monitoring the Performance of a Family Planning CIP ............................................................... 5
CIP Performance Dashboard Application Process ..................................................................... 8
Tool Overview: Tabs, Content, and Functions ...........................................................................10
Tool Set Up ...............................................................................................................................12
Entry of Performance Data ........................................................................................................20
Monitoring Outputs ....................................................................................................................22
Annex 1. Glossary .....................................................................................................................25
Annex 2. Instructions for the Backup and Restore Feature .......................................................26
Costed Implementation Plan Resource Kit | familyplanning2020.org/cip 4
Background
In recent years, a global focus on family planning has resulted in significant strides being made
toward achieving universal access to voluntary family planning and improving public health as a
result. In 2011, the Ouagadougou Partnership was launched to strengthen collaboration and
coordination of family planning efforts in West African countries. The following year, the London
Summit on Family Planning brought together stakeholders from country governments, civil
society, donors, and implementing partners to create a series of country commitments to
improve access to voluntary family planning information and services by 2020, known as
FP2020.
To achieve national family planning objectives aligned with Sustainable Development Goals and
“Every Woman, Every Child, Every Adolescent” commitments, many countries have developed
costed implementation plans (CIPs) for family planning. These operational plans allow
stakeholders to work together through a shared strategic roadmap to identify required resources
and accelerate progress toward FP2020 commitments. As of October 2017, 35 countries and
sub-national regions have developed a CIP.
The CIP development phase includes several core components: analyzing a country’s current
family planning context, identifying key issues, defining strategic results and corresponding
intervention activities to achieve the results, and calculating the costs of implementing those
activities. The development phase sets the foundation for the CIP’s transition into execution, a
process that operationalizes the plan into sustained actions and results. To bridge the gap
between CIP development and execution, four key elements must be in place: fostering country
ownership; establishing and implementing a governance and coordination framework; mobilizing
and managing resources; and monitoring the CIP’s performance in achieving intended results.
Continuous stakeholder support is essential for CIP success.
The CIP performance dashboard applies a focused monitoring approach that allows countries to
monitor a set of key results drawn from the broader set of indicators included in their CIP. These
key results are aligned with the CIP map and the priority results achievement chart. Monitoring
key results refines a country’s ability to assess progress in achieving CIP results, strategic
goals, and commitments.
Costed Implementation Plan Resource Kit | familyplanning2020.org/cip 5
Monitoring the Performance of a Family Planning CIP
Description
The Health Policy Plus (HP+) project, funded by the U.S. Agency for International Development
(USAID), with additional financial support from the United Nations Foundation, developed the
CIP performance dashboard, an Excel-based data visualization tool. The tool allows users to
assess progress on key results by comparing targets to key performance indicator (KPI) data
within an identified performance period—most often one year. The resulting color-coded
performance assessment can be used to show progress in CIP status reports.
Inputs for the CIP performance dashboard are produced by creating a CIP map and a priority
results achievement chart. The CIP map outlines a country’s key results by thematic area. The
priority results achievement chart specifies key performance indicators, activities, and annual
targets. More information about the CIP map and the priority results achievement chart can be
found in the glossary (Annex 1).
Although it is recommended that countries complete a CIP map before beginning performance
monitoring, the map is not required to use the CIP performance dashboard. Countries without a
CIP map can utilize the priority results achievement chart to ensure that key results, key
performance indicators, and annual targets are clearly defined to use in the dashboard.
Discussions surrounding inputs and outputs generated from the CIP map are a useful
opportunity for governments and family planning stakeholders to build consensus around which
results best capture a successfully implemented CIP.
Once the tool’s settings have been populated with the information from the CIP map and priority
results achievement chart, the dashboard should be updated regularly—as frequently as every
quarter. Performance data for each indicator can be entered and tracked against annual targets.
Using the dashboard, users can visualize the status of a country’s progress toward achieving
family planning goals and commitments. These visualizations can also assist in identifying
bottlenecks to effective implementation through two distinct features: (1) color-coded key results
and (2) a performance dashboard comprised of a set of graphs that automatically update as
new data is entered.
Components
The CIP performance dashboard is organized around a select group of key results categorized
as beneficiaries, beneficiary-facing program processes, or foundational supportive thematic
areas. Each category is further explained in Table 1.

Costed Implementation Plan Resource Kit | familyplanning2020.org/cip 6
Table 1. Categories for Key Results
Key Result Category Explanation Examples
Beneficiaries Beneficiaries are individuals the
CIP targets, commonly referred to
as clients
Women of reproductive age
Youth and adolescents
Men
Beneficiary-facing program
processes
Program processes or thematic
areas that have a direct effect on
CIP beneficiaries
Demand generation
Service delivery
Supply chain or commodity
security
Policy and advocacy
Foundational supportive
thematic areas
Major systems needed for
effective CIP execution
Financing
Monitoring and evaluation
Governance and coordination
In addition to the overarching key result categories, the CIP map status feature details the
enabling bodies that drive CIP execution: the key stakeholders that contribute to CIP execution
in collaboration with the government agency responsible for stewarding the CIP implementation
process.
Users can reference their CIP map to enter beneficiaries, beneficiary-facing program processes,
and foundational supportive thematic areas. The priority results achievement chart can also be
used to enter results, KPIs, annual targets, and activities that allow for customization of the
dashboard. The tool will display a “traffic light” performance indicator color of green, yellow, or
red for each result that will also be displayed in the CIP map status feature.
Software
The dashboard was developed in Microsoft Excel due to ease of use, sharing, and adaptation to
specific country context. The tool has been automated so that tables are populated based on
information entered in columns and rows with headings that are clearly labeled. To promote
accurate data entry, green cells indicate areas where a user must enter data; yellow cells are
recommended, optional fields; and white cells are locked so that required data is not
overwritten. (White cells will automatically populate based on data entered in green and yellow
cells.) Adding or deleting columns or rows is discouraged as this may alter embedded formulas.
Use
The dashboard is intended for use by government entities stewarding the CIP execution
process as well as key stakeholders at the national or sub-national level. The tool provides
guidance for decision-makers to answer the following questions:
Is progress toward achieving key results leading to incremental improvements in the
strategic goal? What is making a difference? What is not?
What is the current status of key results outlined in the CIP map?
Are current family planning efforts helping a country reach its annual targets?

Costed Implementation Plan Resource Kit | familyplanning2020.org/cip 7
Are there any activities that increased coordination or resources to achieve the key
results?
The dashboard can be used as a foundation for quarterly or semi-annual review meetings. It
can also assist in broader strategy reviews on an annual, mid-term, or end-term basis to
determine if key results should be modified for improved CIP implementation. Additional
information on CIP reviews can be found in the CIP toolkit’s Guidance for Developing a
Technical Strategy for Family Planning CIP.
In addition to facilitating monitoring, review, and coordination of activity implementation,
dashboard outputs can be used to raise awareness of the family planning CIP among senior
government staff by sharing implementation progress and bottlenecks. It also promotes
transparency and accountability, as progress can be shared with civil society, allowing them to
see if the government and key family planning stakeholders have upheld their CIP
commitments. Furthermore, the process of regular performance monitoring can promote a
sense of shared accountability among family planning stakeholders toward achieving a common
goal.
Tool Limitations
While the CIP performance dashboard allows for monitoring, reviewing, and coordinating activity
implementation as well as promoting awareness, transparency, and accountability, it is
important to note that there are limitations to its use.
The key results highlighted in the CIP performance dashboard and accompanying tools
are for performance monitoring purposes only.
The performance results displayed in the tool reflect the availability and quality of data
entered. It is critical to ensure that the data entered has been collected from quality
sources.
While the dashboard provides valuable information on performance, meaningful impact
cannot be accomplished without stakeholder engagement and buy-in for the CIP
monitoring process.

Costed Implementation Plan Resource Kit | familyplanning2020.org/cip 8
CIP Performance Dashboard Application Process
The performance monitoring process ideally includes developing a CIP map and priority results
achievement chart; setting up the performance monitoring dashboard tool; entering data;
reviewing outputs; and engaging stakeholders. The steps are described in greater detail as
follows:
Develop a CIP map. The CIP performance dashboard draws information on key results
from the CIP map, categorized by beneficiaries, program processes, and foundational
supportive thematic areas (as previously described in Table 1). These results are
considered priorities because they address key issues that can either constrain or
enable a country in achieving their CIP goals and commitments. Because of this, it is
recommended that the map be developed prior to initiation of the dashboard
performance monitoring process. However, if a country does not have a map developed,
stakeholders can use the dashboard application process as an opportunity to discuss
and identify key results for CIP performance monitoring. More information on the CIP
map and key results can be found in the CIP toolkit’s Guidance for Developing a
Technical Strategy for Family Planning Costed Implementation Plans.
Develop a priority results achievement chart. CIP performance dashboard inputs are
derived from the priority results achievement chart and include: (1) KPIs that measure
progress in achieving a priority result; (2) activities that need to occur to achieve a
priority result; and (3) annual targets that key stakeholders involved in CIP execution can
strive to achieve to reach goals. More information on the priority results achievement
chart can be found in the CIP toolkit’s Guidance for Developing a Technical Strategy and
forthcoming Monitoring Performance of CIPs for Results.
Identify a skilled person to conduct and manage the CIP performance monitoring
process. To ensure consistent and regular performance monitoring, it is necessary to
identify a skilled person to manage the performance monitoring process. As outlined in
the 10-Step Process for CIP Planning, Development, and Execution, Guidance for
Developing a Technical Strategy, and other resources in the CIP toolkit, monitoring staff
should be involved throughout the CIP development process.
Set up the tool. Use the CIP map (or pre-determined key results) and the priority results
achievement chart to set up the tool. This step includes entering information on key
results, KPIs, activities, and annual targets into the settings tabs in Excel.
Enter performance data. Performance data should be entered as frequently as every
quarter; at the very least, annually. This data is entered into green and yellow cells.
White cells will automatically populate. More information on sources for performance
data can be found in the CIP toolkit’s Guidance for Developing a Technical Strategy.
Review outputs. Users can visually display CIP execution progress via two features in
the tool: CIP map status and a custom graph with accompanying dashboard.

Costed Implementation Plan Resource Kit | familyplanning2020.org/cip 9
Share findings with in-country stakeholders. The CIP map status and dashboard
should be shared with in-country stakeholders to promote critical thinking about
programmatic challenges that can affect results, the functionality of the CIP execution
performance data collection system, and whether there is a need to better coordinate
activity timing and resources to improve progress toward key results.

Costed Implementation Plan Resource Kit | familyplanning2020.org/cip 10
Tool Overview: Tabs, Content, and Functions
The CIP performance dashboard includes three groups of tabs to: set up the tool, enter
performance data, and review data.
Setting Up the Tool
It is important for users to carefully review this information as these settings establish the
parameters for the rest of the tool’s inputs. The four yellow settings tabs are:
Settings–Global: This tab sets the tool parameters based on the CIP map. Users will
enter the timeframe of the CIP, the beneficiaries for whom the CIP aims to create value,
the thematic areas within beneficiary-facing program processes (e.g., demand
generation, service delivery, supply chain/commodity security, policy and advocacy), and
foundational supportive thematic areas (e.g., monitoring and evaluation, governance and
coordination, finance). To accommodate the tool’s use in countries that do not have a
CIP map, this tab is pre-populated except for the timeframe. Users should customize
settings based on country context.
Settings–Results: Users will enter key results by beneficiary name and thematic area,
as well as the corresponding number of key performance indicators per result. This
information should be drawn from the priority result achievement chart and will set up the
number of KPIs for each result.
Settings–Targets: Data from the Settings–Global and Settings–Results will populate
parts of this tab. Users will enter the KPIs, indicator definitions, indicator weighting,
activities that contribute to achieving results, data sources for indicator performance
data, and annual targets per result.
Custom Graph: This feature allows users to create bar or line graphs that display
indicator progress. Graphs can be set up at any time during the monitoring process and
can be transferred to the dashboard.
Entering Performance Data for Each Result
The results (RES) tabs are colored blue. These tabs are created from the key result categories
that are specified in the settings tabs.
As performance data for indicators is entered into these tabs and the tool is refreshed, users will
find that the tool categorizes key results using a color scheme that compares performance to
established annual targets. The color coding scheme is summarized in Table 2. Further
explanation on how performance assessment value is calculated is covered in Box 1 in the Tool
Set Up section and in Tool Set Up, Step 3.

Costed Implementation Plan Resource Kit | familyplanning2020.org/cip 11
Table 2. Performance Assessment Color Coding Scheme
Color
Code
Condition
Status Explanation
Variance from
Target
Exceeded
KPI performance has exceeded the set annual target. This
suggests sustained achievement of a key result. Occasionally,
exceeded performance may indicate over-emphasis and over-
funding in a given area.
≥ 110%
Met Activities for achieving the key result are on track. 90–109.99%
Close to
Target
Programmatic challenges and delays have been encountered
but overall performance is manageable and strong. 75–89.99%
Not Met
Significant challenges or delays in implementation of activities
have been encountered. This key result and its associated
activities need collective attention from stakeholders in order
to improve.
< 75%
None
Data is not available. This key result should be prioritized by
the monitoring and evaluation team to review whether the
necessary CIP data collection systems and processes are
functioning appropriately.
No data; 0
Reviewing the Data
The CIP map status and dashboard tabs are green. These features allow users to review data
on CIP execution performance.
CIP Map Status: The CIP map is customized based on data entered for key results.
Like the results tabs, the CIP map status uses a traffic light performance assessment by
result. Users can review data by performance period.
Dashboard: This tab stores graphs that were developed in the custom graph tab. The
dashboard updates when KPI data is entered. The dashboard can be used for reporting
a set of results and/or a specific CIP performance data measure.

Costed Implementation Plan Resource Kit | familyplanning2020.org/cip 12
Tool Set Up
Users should enter data in the green colored cells. Optional fields in the Settings–Targets tab
are yellow. Although optional, users are encouraged to enter data if known. All corresponding
white cells will be automatically populated after the user clicks the “Setup Results Sheets” and
“Update KPIs” buttons embedded at the top of the settings tab sheets.
Step 1: Settings–Global. To define the parameters of the tool, the user will need to provide
information in several fields. The first section is the timeframe that covers the start and end
years and quarters of the country’s CIP. These dates mark the performance period for the
Settings–Targets tab, where users will enter annual targets; the results tabs, which act as a
reporting template in which key performance indicator data is entered; the CIP map in the CIP
Map Status tab, which displays progress for key results achievement; and the Custom Graph
tab, which generates graphs of KPI progress. Users can select the years and quarters from the
dropdown menu as shown in Figure 1.
Figure 1. Setting the CIP Timeframe
A B
The next series of fields are pre-populated but can be individualized by country context. These
fields include the thematic areas that make up the program processes, the enabling bodies that
support CIP implementation, and the beneficiaries for which the CIP aims to create value (see
Figure 2).
Program processes reflect the thematic areas that are “beneficiary-facing.” Thematic
areas have a direct impact on clients and include demand generation, service delivery,
and supply chain or commodity security.
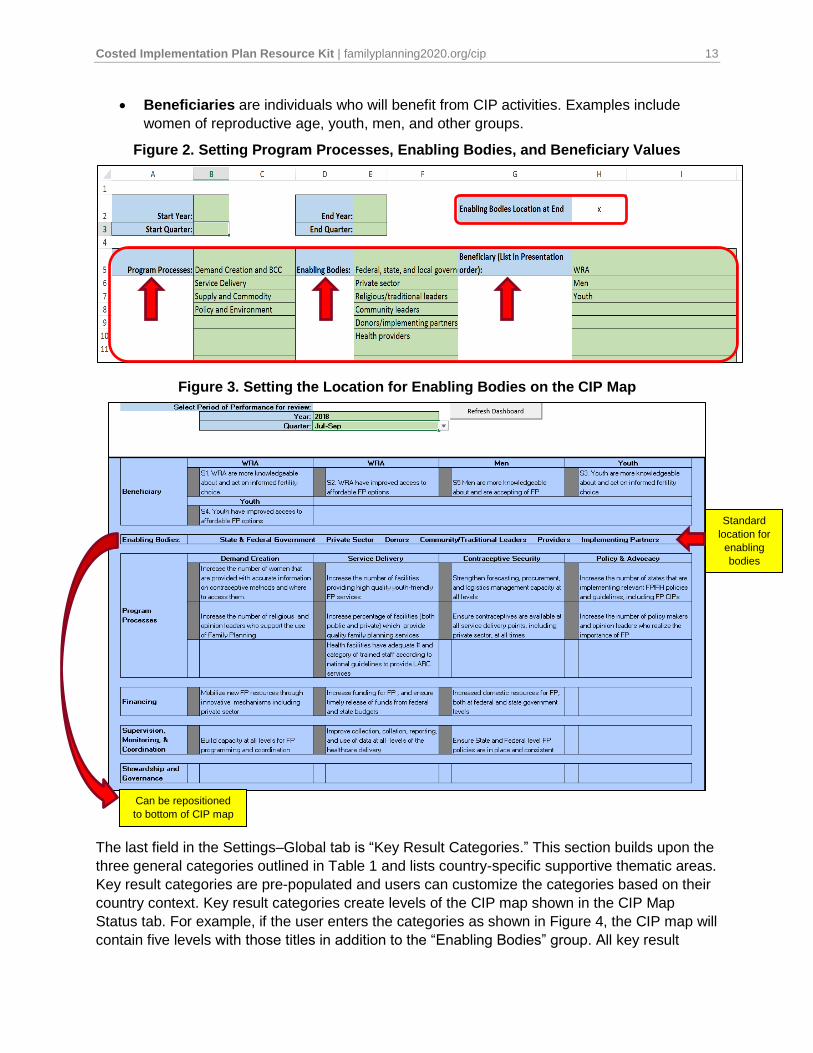
Enabling bodies are the major players involved in CIP execution. They include key
stakeholders including government agencies and ministries, the private sector, donors,
implementing partners, and providers that influence successful CIP implementation. The
list of enabling bodies is located at the second level of the CIP map (see Figure 3),
though some countries have positioned it at the bottom of their CIP map. To allow for
customization, users can select the box for Enabling Bodies Location at End. Any
value typed into the white box beside this label (for example, the “x” shown in Figure 2)
will reposition the list of enabling bodies to the bottom of the map.
Costed Implementation Plan Resource Kit | familyplanning2020.org/cip 13
Beneficiaries are individuals who will benefit from CIP activities. Examples include
women of reproductive age, youth, men, and other groups.
Figure 2. Setting Program Processes, Enabling Bodies, and Beneficiary Values
Figure 3. Setting the Location for Enabling Bodies on the CIP Map
Standard
location for
enabling
bodies
Can be repositioned
to bottom of CIP map
The last field in the Settings–Global tab is “Key Result Categories.” This section builds upon the
three general categories outlined in Table 1 and lists country-specific supportive thematic areas.
Key result categories are pre-populated and users can customize the categories based on their
country context. Key result categories create levels of the CIP map shown in the CIP Map
Status tab. For example, if the user enters the categories as shown in Figure 4, the CIP map will
contain five levels with those titles in addition to the “Enabling Bodies” group. All key result

Costed Implementation Plan Resource Kit | familyplanning2020.org/cip 14
categories can be viewed on the left side of the CIP map. Additionally, the designated
categories automatically create the tool’s results tabs where key performance indicator data is
entered.
Figure 4. Key Result Categories
Step 2: Settings–Results. The Settings–Results sheet sets up basic information for the results
tabs (see Figure 5). Inputs for this tab can be found in the CIP priority results achievement
chart.
Figure 5. Settings–Results Tab
To complete the Settings–Results tab, users need to provide information for the following fields,
as displayed in Figure 5:
Key Results: Enter one key result for each cell under the key results column.

Costed Implementation Plan Resource Kit | familyplanning2020.org/cip 15
# of KPIs: Provide the number of KPIs that contribute to each result as articulated in the
CIP priority results achievement chart. For example, three KPIs may be chosen to
measure the progress of achieving one result. In this instance, the user would enter “3”
in the corresponding “# of indicators” cell for that result. Providing this information will set
up the number of KPI cells for each key result in the corresponding results tabs.
Key Result Categories: Users should select one key result category from the dropdown
menu. Each selected category should correspond to the result entered. These
categories match those that were entered in the Settings–Global tab. If a user selects
program processes or beneficiary for a category, the following instructions apply:
Program Processes: By selecting program processes, a green cell under the
program processes column will appear. Select one program process that the
result is linked to from the dropdown menu (see Figure 6A).
Beneficiary: By selecting beneficiary, a green cell under the beneficiary name
column will automatically appear. Select one beneficiary from the dropdown
menu (see Figure 6B).
Figure 6. Dropdown Menus for Program Processes and Beneficiary Name
A
B
Once all information for these fields has been entered, users should click the “Setup Results
Sheets” button at the upper right corner of the sheet. This will add the key results to their
respective results sheets. Clicking the “Setup Results Sheets” button will reset the Settings–
Targets tab and corresponding results tabs. A pop-up notification will appear when a user clicks
the “Setup Results Sheets” button to remind them of this. It is important to review information
entered in the Settings–Results tab before moving on to this step. If other settings or
performance data have been previously entered and the user is planning to modify the tool, it is
advisable to copy the data into another Excel file prior to modification as a record-keeping

Costed Implementation Plan Resource Kit | familyplanning2020.org/cip 16
measure. As a reminder, brief instructions will appear in a pop-up box after clicking on the
“Setup Results Sheets.”
Step 3: Settings–Targets. Key results and key result categories that were entered in the
Settings–Results tab are populated in the white cells in the Settings–Targets tab. Users should
enter the corresponding KPIs, indicator weighting, and annual targets in the green cells, as
shown in Figure 7. If applicable, users can also enter indicator definitions, activities, and data
sources in the optional yellow cells (see Figure 7). Users should refer to the CIP priority results
achievement chart as a guide when completing this tab.
Figure 7. Settings–Targets Tab
The dashboard uses indicator weighting to account for multiple KPIs measuring progress toward
achieving one result; collectively, all KPIs for a key result should equal 100 percent (see Figure
8). If the weighting for a result does not equal 100 percent, an error message will appear. These
weighted targets will be used in the results tabs to calculate the weighted average performance
of indicators, displayed through the traffic light performance assessment at the key result level.
More information on indicator weighting and the calculations for indicator performance can be
found in Box 1.
Figure 8. Indicator Weighting Example
These three indicators contribute to achieving one priority result. The sum of their weight must equal 100 percent.
When all information for the required fields has been entered, select “Update KPIs” at the top
center of the sheet. This will update all of the results tabs with the corresponding indicators and
annual targets. As a reminder for the user, brief instructions are also included at the top of the
sheet.

Costed Implementation Plan Resource Kit | familyplanning2020.org/cip 17
Box 1. Indicator Weighting: Why Provide Weighting and How Is It Used?
Indicator weighting is required to calculate the priority result performance, as key results may have
multiple KPIs that measure their achievement. Stakeholders may opt to have multiple KPIs to track one
priority result for several reasons. In some cases, a key result may include various components that
contribute to its success. For example, a demand creation key result to increase awareness and
acceptance of family planning among men may require direct outreach to men and to influencers such as
community and religious leaders. Progress in one area may not fully achieve the result when other
elements lag behind. In this case, stakeholders may choose an indicator for number of men reached and
another indicator for community and religious leaders reached.
In other cases, stakeholders may choose a set of linked, progressive KPIs to track progress toward
achieving a priority result. In the example of demand creation among men, one indicator may be output-
based (e.g., number of campaigns conducted), a second KPI may be a near-term outcome (e.g., number
of men reached), and a third KPI may be a longer-term outcome (e.g., proportion of men who accept
family planning methods for their partner).
By assigning weight to each KPI, progress toward the target can be calculated per result. Stakeholders
may place equal weight across the KPIs, or may opt to place greater weight on prioritized indicators.
Performance is calculated based on the following basic equation:
Key result performance = weighted average of each KPI performance
KPI performance is calculated by taking the most recent performance value and dividing by the annual
target (see Example 1). If the performance value for a KPI is not available within the two most recent
quarters, then the performance for that KPI would not be calculated and the condition status indicator
would be grey (no data). To account for indicators that may be over-performing (e.g., significantly over
100%) the KPI performance calculation has been modified so that indicators above 100% are capped at
100% (see Example 2).
Example 1: Typical Scenario
Weighting Year 1, Q1 Year 1, Q2 Year 1, Q3 Year 1, Q4 Year 1 Target
KPI Performance
KPI #1 70% 25% 50% 95% 52.6%
KPI #2 30% 1,000,000 1,500,000 2,000,000 2,500,000 3,500,000 71.4%
Key result performance = (52.6% * 70%) + (71.4% * 30%) = 58.2%
Based on the color-coding scheme presented in Table 2, this indicator performance would be
categorized as Red: Target Not Met.
Example 2: Scenario with an Over-Performing Indicator
Weighting Year 1, Q1 Year 1, Q2 Year 1, Q3 Year 1, Q4 Year 1 Target
KPI Performance
KPI #1 70% 25% 50% 95% 52.6%
KPI #2 30% 1,000,000 2,000,000 3,000,000 4,000,000 3,500,000 114.2%
Key result performance = (52.6% * 70%) + (100% * 30%) = 66.8%
Again, this indicator performance would be categorized as Red: Target Not Met. The dashboard
automatically calculates the key result performance when the performance data is entered and the
“Refresh Dashboard” button on the CIP Map Status tab is clicked (see more in the “Entry of Performance
Data” section).

Costed Implementation Plan Resource Kit | familyplanning2020.org/cip 18
Step 4: Custom Graph. The Custom
Graph tab allows users to create graphs
that can be transferred to the Dashboard
tab for continual performance monitoring.
Bar and line graphs can be generated for
each KPI. Additionally, users can graph
indicator performance against annual
targets. Users can come back to this step
at any time during the monitoring process.
Users enter the graph settings by selecting the chart type along with the CIP timeframe by start
and end years and quarters. Each of the fields can be selected from a dropdown menu as seen
in Figure 9. To review progress of cumulative indicators, users can select "year" in the Period
Start Quarter and Period End Quarter dropdown menus. This will display all data from Q1 to Q4.
For non-cumulative indicators, selecting "year" will only display Q4 data, as these indicators are
not additive. Users can review non-cumulative indicators by quarter. More information about
cumulative and non-cumulative indicators can be found in Box 2.
After the graph settings are in place, users will select the key result category, key results, and
KPIs that they would like to create a graph for. Information for these fields can be selected from
the dropdown menu as seen in Figure 10. To create new chart settings, users can clear all
information by selecting “Clear Entire Chart Settings.” Users can clear the key result category,
key results, and KPIs only by selecting “Clear Key Result Selections Only.”
Figure 10. Results Group Dropdown Menu
Figure 9. Graph Settings
A customized graph will appear if a user selects “Generate Graph” (see Figure 11). Generated
graphs can be added to the Dashboard tab by selecting “Add Graph to Dashboard.” Because
graphs will automatically update as performance data is entered, setting up the relevant graphs
early will allow easy access to an updated dashboard as needed.

Costed Implementation Plan Resource Kit | familyplanning2020.org/cip 19
Figure 11. Creating Indicator Progress Graphs
Your graph will appear here

Costed Implementation Plan Resource Kit | familyplanning2020.org/cip 20
Entry of Performance Data
Step 5: Results. Enter data for each performance indicator in the results (RES) tabs. The tool
will generate results (RES) tabs based on the key results categories entered in the Settings–
Global tab. Each sheet in the results tabs will be contain white cells that are populated with the
corresponding key results, key performance indicators, and annual targets. Users can enter
quarterly performance data into the green cells.
Figure 12 shows the beneficiary results tab before key performance indicator data is entered.
Additionally, users can see indicator definitions that were entered into the Settings–Targets tab
by viewing the comments in the cells of each indicator.
Figure 12. Sample Results Tab with Indicator Definition
Prior to entering performance data for each KPI, users should consider whether the KPI is
cumulative or non-cumulative. Cumulative indicators will add quarterly performance data from
the previous quarter. Non-cumulative indicators will display performance data that reflects the
performance only from that quarter. Examples of cumulative versus non-cumulative indicators
can be found in Box 2.
Box 2. Entering Performance Data for Cumulative and Non-Cumulative Indicators
Indicator performance should be entered in a way that is comparable to the benchmark. The data must
be entered so that it is always consistent against the annual target. The following is an example of
cumulative and non-cumulative indicators:
Number of family planning commodities distributed (cumulative indicator): If the annual
target is set at 1 million, then the indicator performance by quarter should be entered so that it
includes the previous quarter’s performance.
Stock-out rates (non-cumulative indicator): If the annual target is 5 percent, then the indicator
performance by quarter should be entered for that quarter’s performance only.

Costed Implementation Plan Resource Kit | familyplanning2020.org/cip 21
As previously noted, each of the results tabs contains a colored performance assessment to
monitor progress toward achieving a key result, which can be found in the condition status cell
located in the key performance indicator column (see Figure 13). The designated color code is
based on calculations that take the weighted average of the KPI value against the target as well
as on the period of performance that is selected in the CIP Map Status tab. The condition status
can be updated in the results tabs by clicking the “Refresh Dashboard” button in the CIP Map
Status tab after KPI data has been entered and updated (see Figure 14).
Figure 13. Key Result Condition Status
Key Result
Figure 14. Updating the Key Results Condition Status

Costed Implementation Plan Resource Kit | familyplanning2020.org/cip 22
Monitoring Outputs
Once all key results, KPIs, corresponding activities, targets, and performance data have been
entered into the settings and results tabs, the user can view outputs using the following
features.
CIP Map Status
The CIP Map Status tab shows a simplified version of the CIP map (see Figure 15). Users can
select the performance period by selecting year and quarter from a dropdown menu (see Figure
16). Similar to the custom graph settings, users can select the year view in the CIP Map Status
tab by selecting “Year” in the quarter dropdown menu, as shown in Figure 16B. By selecting
“Year,” key result condition status will be displayed for the last quarter of a specified year. More
information about the year view can be found in Step 4: Custom Graph in the “Tool Set Up”
section of this guide.
After selecting the performance period, users can select “Refresh Dashboard” at the top of the
sheet. This will update the map with the color coding scheme for the selected performance
review period. The map can then be used to guide decisions on what results may need
additional support and/or resources to effectively execute the CIP. The Guidance for Developing
a Technical Strategy for Family Planning CIP in the CIP toolkit provides additional guidance on
the periodic plan review process and how CIP map status outputs can be used to guide a
review.

Costed Implementation Plan Resource Kit | familyplanning2020.org/cip 23
Figure 15. CIP Map Status Example
Figure 16. Dropdown Menus to Select Period of Performance for Review
A B
Dashboard
The Dashboard tab displays the graphs that the user has created in the Custom Graph tab.
Users can add multiple graphs to the dashboard by selecting “Add Graph to Dashboard” in the
Custom Graph tab as shown previously in Figure 11. A sample dashboard can be seen in
Figure 17.

Costed Implementation Plan Resource Kit | familyplanning2020.org/cip 24
Figure 17. Sample Dashboard
As users enter quarterly KPI data into the results tabs, these generated graphs will
automatically update. The CIP map status and the dashboard provide performance data that
can be disseminated to key stakeholders during the CIP performance review period.

Costed Implementation Plan Resource Kit | familyplanning2020.org/cip 25
Annex 1. Glossary
Beneficiaries: Groups of people that the CIP aims to target. Examples include women of
reproductive age, youth and adolescents, and men.
Beneficiary-facing program processes: Most CIPs address six key thematic areas for family
planning: demand creation; service delivery and access; contraceptive security; policy and
enabling environment; financing; and stewardship, accountability, and management. Within the
context of the CIP map, beneficiary-facing program processes refer to the thematic areas that
have a direct effect on the CIP’s beneficiaries; examples include demand creation, service
delivery, supply chain or commodity security, and policy and advocacy.
CIP map: A tool for monitoring CIP implementation that visually displays a snapshot of key
results.
Enabling bodies: The major players involved in CIP execution—namely, key stakeholders and
implementers that influence and support successful implementation of the CIP. Examples
include government agencies or ministries, private sector partners, donors, implementing
partners, and providers.
Foundational supportive thematic areas: Thematic areas that represent the major systems
that need to be in place for CIP execution to be conducted as intended; examples include
financing, monitoring and evaluation, and governance and coordination.
Key performance indicators: A measurable value that is used to monitor progress toward
achieving a CIP’s key result.
Key result categories: A CIP’s thematic areas, consisting of beneficiaries, beneficiary-facing
program processes, and foundational supportive thematic areas.
Key results: A set of prioritized results from the broader list of strategic results in a country’s
complete CIP document. These specific results are selected as priorities because they are key
bottlenecks to advancing the CIP and are considered to be catalytic to achieving a country’s CIP
goals.
Priority results achievement chart: A tool for monitoring CIP implementation that captures the
following information in one table: (1) key performance indicators that can measure progress in
achieving a priority result, (2) activities that need to occur to achieve a priority result, and (3)
annual targets that key stakeholders involved in execution can strive to achieve to meet goals.

Costed Implementation Plan Resource Kit | familyplanning2020.org/cip 26
Annex 2. Instructions for the Backup and Restore Feature
Recognizing that a country’s CIP map and priority results achievement chart are not static
documents, the CIP performance dashboard is equipped with a backup and restore feature that
enables users to make changes to key results, indicators, and annual targets even after the tool
has been set up and performance data has been added. In order to add additional key results or
make changes to existing results, the following steps to backup and restore data need to be
taken in order to retain information that was previously entered in the Settings–Targets tab and
elsewhere in the tool.
Step 1: Backup current sheets
1) In Row 4 of the Settings–Results sheet, type an “X” in cell F4 next to the words “Backup
Result Sheets,” as shown in Figure 18-A.
2) Next, click the “Setup Results Sheets” button at the top of the sheet (see Figure 18-B).
This will create backups of the current Settings–Targets and results (RES) sheets.
These newly created sheets will appear at the bottom of the screen in red tabs, as
shown in Figure 19.
Figure 18. Setup for the Backup Results Sheet Feature
A
B
Figure 19. Generated Backup Sheets
Backup Results and Settings–Targets Sheets

Costed Implementation Plan Resource Kit | familyplanning2020.org/cip 27
Step 2: Revise key results and KPIs for performance monitoring of the CIP as needed
1) Users can add or delete results and/or KPIs based on decisions made by government
entities and stakeholders involved in CIP execution.
o To add results and/or KPIs, enter new information in the remaining green cells in
the Settings–Results sheet below previously entered information.
o To delete results and/or KPIs, remove information from the current list in the
Settings–Results sheet. Do this by deleting information from the cells—do not
delete any rows or columns as this can alter the formulas embedded elsewhere
in the tool.
2) Previous key results and KPIs will still be included in the revised Settings–Results sheet
after generating backup sheets.
Step 3: Restoring information from the backup
1) Once revisions are complete, remove the “X” in cell F4, next to the words “Backup
Result Sheets” and place an “X” in cell F5, next to the words “Restore Result Sheets”
(see Figure 20-A). Click the “Setup Result Sheets” button at the top of the Settings–
Results sheets (see Figure 20-B). This will pull information that was saved in the backup
to the new Settings–Target and results (RES) sheets.
Figure 20. Restore Results Sheets
A
B
2) Revise the KPI information in the Settings–Targets sheet based on edits made to the
Settings–Results sheet. Keep an “X” in cell F5, next to “Restore Result Sheets” in the
Settings–Results sheet. Click the “Update KPIs” button at the top of the Settings–
Targets sheet when revisions are complete.
3) All information from previous backups should be transferred over to the new results
(RES) sheets. For missing data points, manually re-enter information in the backup
results sheets in the red tabs.


