CIO EMEA English
17
Nine positions Focus The big picture Investment traffic lights Portfolio High-conviction ideas CIO View | Europe, Middle East & Africa Edition | April 2014 1 Europe, Middle East & Africa Edition China’s metamorphosis Deutsche Asset & Wealth Management CIO View
Transcript of CIO EMEA English

Nine positions
Focus
The big picture
Investment traffic lights
Portfolio
High-conviction ideas
CIO View | Europe, Middle East & Africa Edition | April 2014 1
Europe, Middle East & Africa Edition
China’s metamorphosis
Deutsche Asset& Wealth Management
CIO View
2 CIO View | Europe, Middle East & Africa Edition | April 2014
Nine positions
Focus
The big picture
Investment traffic lights
Portfolio
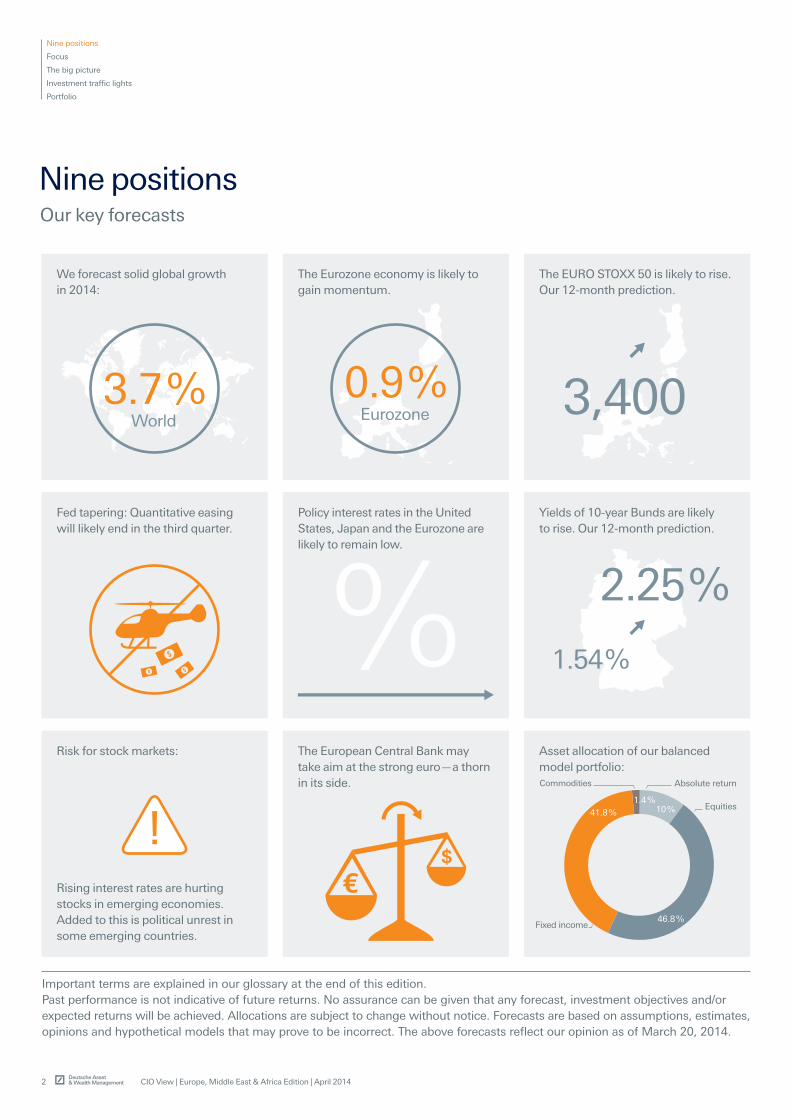
Asset allocation of our balanced model portfolio:
We forecast solid global growth in 2014:
Important terms are explained in our glossary at the end of this edition.Past performance is not indicative of future returns. No assurance can be given that any forecast, investment objectives and/orexpected returns will be achieved. Allocations are subject to change without notice. Forecasts are based on assumptions, estimates,opinions and hypothetical models that may prove to be incorrect. The above forecasts reflect our opinion as of March 20, 2014.
Fed tapering: Quantitative easing will likely end in the third quarter.
Risk for stock markets:
Rising interest rates are hurting stocks in emerging economies. Added to this is political unrest in some emerging countries.
!
3.7 % World
Yields of 10-year Bunds are likely to rise. Our 12-month prediction.
The EURO STOXX 50 is likely to rise. Our 12-month prediction.
The Eurozone economy is likely to gain momentum.
0.9 % Eurozone 3,400
Commodities
2.25 %
1.54 %
Policy interest rates in the United States, Japan and the Eurozone are likely to remain low.
The European Central Bank may take aim at the strong euro—a thorn in its side.
1.4 %10 %
46.8 %
41.8 %
Nine positions Our key forecasts
Equities
Absolute return
Fixed income

CIO View | Europe, Middle East & Africa Edition | April 2014 3
Nine positions
Focus
The big picture
Investment traffic lights
Portfolio
Letter to investors
Whenever the U.S. economy is chugging along smoothly, emerging economies seem to come under pressure. The reason: the change in the direction of capital flows. The massive hikes in the benchmark rate by the U.S. Federal Reserve Board (the Fed) between 1993 and 1998 caused money to flow out of Asia, Latin America and eastern Europe and into developed economies. This resulted in a num-ber of crises: Mexico in 1994, Asia starting in 1997 and Russia in 1998.
The parallels to today are easy to spot. Inves-tors reacted to the Fed’s tapering announcement —which implied a future increase in interest rates—by pulling capital out of emerging economies. This led to massive losses on emerging bond and stock markets. Investors made little distinction between individual markets.
No doubt some countries are once again living beyond their means, as indicated by excessive current account deficits. We expect Turkey and South Africa, for instance, to have current account deficits for 2014 of 5.9 % and 4 % of gross domestic product (GDP), respectively.
Many emerging economies, though, boast con-siderably stronger fundamentals. India, for example, is only marginally dependent on for-eign money—and China does not need any. Nonetheless, prices on stock markets in China have also fallen. Evidence that China’s eco-nomic momentum may be losing steam has
contributed to this slide. At the same time, the Chinese government is trying to put a damper on credit growth, which negatively impacts the economy. But it is also pressing ahead with structural
reforms, which could potentially strengthen the Chinese economy over the long term.
In any case, despite the slowdown in some emerging economies, global growth is likely to remain solid. As developed economies pick up speed, we expect that interest rates will rise and bond prices will tend to fall. By itself, this would weigh on equities. But accelerating growth is also fueling corporate earnings and thus creating potential for higher equity prices. This is an argument for over-weighting stocks.
Accelerating economic growth should fuel corporate earnings.
Differentiation is necessary Investors are drawing comparisons between emerging markets’ current problems and the crises that hit these economies between 1994 and 1998. But there are important differences that give cause for optimism.
Download our macro outlook: www.deawm.com/ CIOView-NinePositions_EMEA
Asoka Wöhrmann,Co-chief investment officer

4 CIO View | Europe, Middle East & Africa Edition | April 2014
Nine positions
Focus
The big picture
Investment traffic lights
Portfolio
China: achieving metamorphosisBeijing pushes a new growth model
Focus
China’s success story is breathtaking. Growth rates have, in the past, even gone into the double digits. That is why the news coming out of China today is all the more foreign. The latest shock is that China’s exports were down 18.1 % year- on-year in February.1 This precipitous drop adds to the evidence that China’s growth model, which relies heavily on foreign demand, can no longer do its job.
Reducing export dependency
This is not a new issue for the Chinese government. For years now it has been working to strengthen domestic demand and decrease China’s dependence on exports. To spur domestic consumption, it has promoted wage increases and allowed the renminbi to gradually appreciate. Wage increases and other policy-related price rises have, in turn, caused China’s global competitiveness to wane by nearly 20 % between 2007 and October 2013.2 We therefore expect the contribution of net exports to growth to remain low in 2014.
Can consumption pull the plow?
As indicated by the current account surplus’s downward slide, foreign trade has not made any significant contribution to eco-nomic growth in China for many years now. Instead, the pillars of growth have become domestic consumption and gross fixed capital formation. The Chinese government aims to accelerate this trend and transform China’s export-led growth model into one powered by consumption. The growing purchasing power of China’s middle class—coupled with increased social welfare spending—signals that this transformation is now taking hold.
Banking sector starts to reform
China’s government has also decided to reform the country’s financial system. In the past, the formal banking sector granted only state-owned enterprises and major companies access to loans. In addition, state banks offered only low interest rates on savings. This led to the emergence of a shadow banking sector outside the formal sector that offered higher interest rates on savings and issued unregulated loans. This sector is now facing potential loan defaults that could negatively impact the economy. The introduction of a more market-oriented formal banking system is expected to improve lending practices. In addition, the government hopes that a more efficient and market-driven system will bolster economic growth.
Private banks may go legitimate
As part of a pilot program, China’s banking regulator has approved the establishment of five private banks within the for-mal banking sector. Privately owned businesses and households are likely to prove attractive customers for the new private banks to be located in Shanghai, Tianjin, Guangdong province and Zhejiang province. Such banks may also start to reverse the rise of the shadow banking sector, so reducing risks to the financial system.
Implications for growth
We are optimistic that China’s political leadership will succeed in steering the country onto a long-range, stable growth course with such reforms as the authorization of private banks, the strengthening of property rights, the creation of an efficient antitrust authority and the restructuring of the Chinese tax system. Nonetheless, these simultaneous efforts to achieve economic transformation and manage the country’s legacy burden are likely to put a damper on China’s economic momen-tum. For these reasons, we lower our growth outlook for 2014 to 7.2 %—slow for China, but still a rate to be envied.
Past performance is not indicative of future returns. No assur-ance can be given that any forecast, investment objectives and/or expected returns will be achieved. Allocations are subject to change without notice. Forecasts are based on assumptions, estimates, opinions and hypothetical models that may prove to be incorrect.
1General Administration of Customs, 03/2014 2Deutsche Bundesbank: Macroeconomic approaches to assess-ing price competitiveness, Monthly Report October 2013.
CIO View | Europe, Middle East & Africa Edition | April 2014 5
Nine positions
Focus
The big picture
Investment traffic lights
Portfolio
Drivers of economic growth in China
in %
10
8
6
4
2
0
– 2
– 4
– 6
2000 2001 2002 2003 2004 2005 2006 2007 2008 2009 2010 2011 2012 2013
Consumption Gross fixed capital formation Foreign trade
Sources: National Bureau of Statistics of China, National Australia Bank; as of December 2013
As the financial crisis started to drag down developed economies’ import demand, the contribution of foreign trade to China’s economic growth shrunk, prompting the government initially to push up investment. Recent moves to bolster domestic consumption may provide a more sustainable way of keeping economic growth on track.
1979Special Economic Zones (SEZs) are introduced.
A brief history of the Chinese economic miracle
1949The People’s Republic of China is established under the leadership of Mao Zedong. Its state-planned economy and approach to agricultural collectivization are modeled on the Soviet Union.
1992Reforms are launched with the aim of creating a socialist market economy. Some state-owned enterprises are privatized.
2007The major successes achieved in foreign trade push GDP growth up to a remarkable 14.2 % for the year.
2013With reforms to support private companies, liberalize markets and open the financial sec-tor, the Chinese government intends to boost the market economy and strengthen the drivers of economic growth.
1959 –1961Severe famine results from The Great Leap Forward.
1987Prices are liberalized; food prices climb dramatically; political unrest ensues.
2001China accedes to the World Trade Organiza-tion (WTO); the Chinese market is gradually opened to foreign com-panies; Chinese exports increase.
2011The Chinese government releas-es the new Five-Year Plan with the aim of bolstering domestic consumption.
7.2 % Our growth outlook for 2014
–18 % Current year-on-year decline in exports
Under Xi Jinping, the Chinese government has a number of extensive economic reforms planned. Key topics include:
— Introduction of more competition to raw-material and factor prices
— Establishment of equal access to production factors
— Revision of land and property rights
— Restructuring of the tax system
— Creation of an efficient antitrust authority
— Strengthening of environmental and consumer- protection laws as well as labor laws
Economic reforms on the agenda in China
6 CIO View | Europe, Middle East & Africa Edition | April 2014
Nine positions
Focus
The big picture
Investment traffic lights
Portfolio
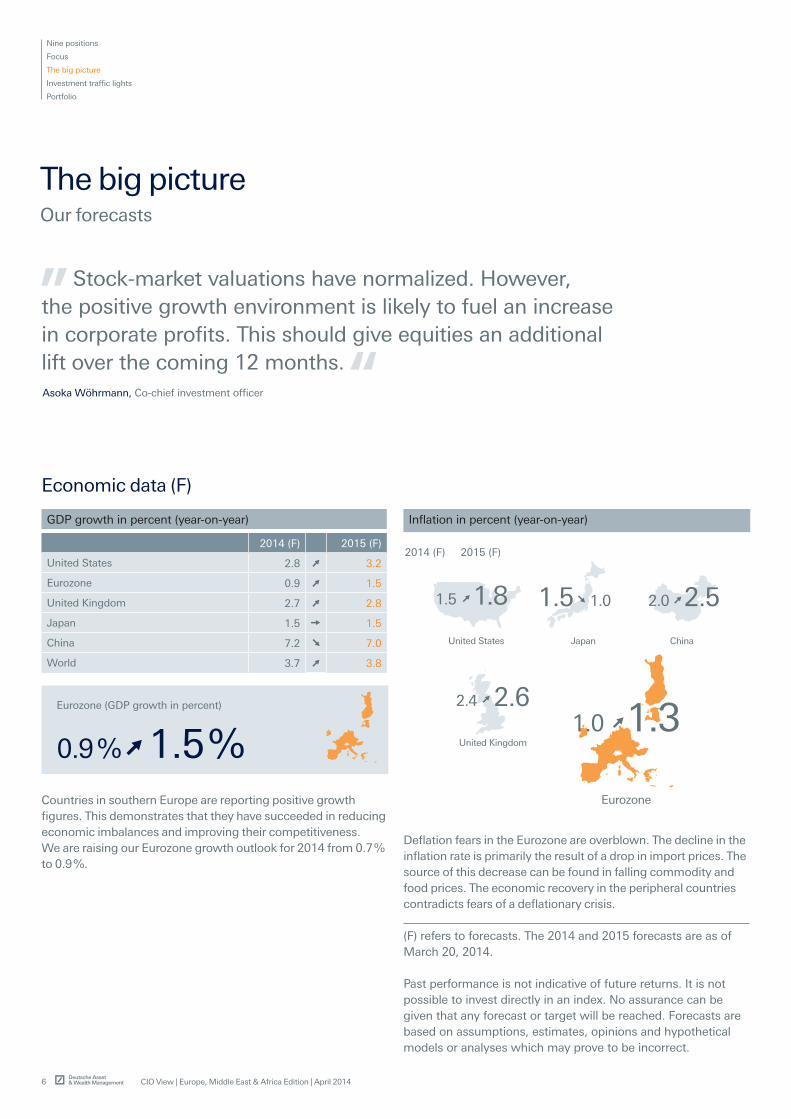
Economic data (F)
Inflation in percent (year-on-year)
1.8
United States
1.5
Japan
1.5 1.0
China
2.52.0
United Kingdom
2.62.4
2014 (F) 2015 (F)
Deflation fears in the Eurozone are overblown. The decline in the inflation rate is primarily the result of a drop in import prices. The source of this decrease can be found in falling commodity and food prices. The economic recovery in the peripheral countries contradicts fears of a deflationary crisis.
Countries in southern Europe are reporting positive growth figures. This demonstrates that they have succeeded in reducing economic imbalances and improving their competitiveness. We are raising our Eurozone growth outlook for 2014 from 0.7 % to 0.9 %.
(F) refers to forecasts. The 2014 and 2015 forecasts are as of March 20, 2014.
Past performance is not indicative of future returns. It is not possible to invest directly in an index. No assurance can be given that any forecast or target will be reached. Forecasts are based on assumptions, estimates, opinions and hypothetical models or analyses which may prove to be incorrect.
Eurozone
1.31.0
GDP growth in percent (year-on-year)
2014 (F) 2015 (F)
United States 2.8 3.2
Eurozone 0.9 1.5
United Kingdom 2.7 2.8
Japan 1.5 1.5
China 7.2 7.0
World 3.7 3.8
Eurozone (GDP growth in percent)
1.5 %0.9 %
Stock-market valuations have normalized. However, the positive growth environment is likely to fuel an increase in corporate profits. This should give equities an additional lift over the coming 12 months. Asoka Wöhrmann, Co-chief investment officer
The big picture Our forecasts

CIO View | Europe, Middle East & Africa Edition | April 2014 7
Nine positions
Focus
The big picture
Investment traffic lights
Portfolio
Germany (DAX)**
10,1509,434As of March 26, 2014
Fundamentals are pointing to a continuation of German equities’ upward trend. As the year progresses, new record highs are within the realm of possibility. But in a rising-rate environment, investors must be prepared for higher volatility. This could create some attractive entry opportunities.
Commodities in U.S. dollars
Current* Mar 2015 (%)
Crude oil (WTI) 99.60 94.00 –5.62
Gold 1,304.04 1,400.00 7.36
Silver 19.84 25.00 26.01
Copper (LME) 6,603.00 6,500.00 –1.56
Aluminum (LME) 1,752.50 1,800.00 2.71
Benchmark rates in percent
Current * Mar 2015
United States (federal funds rate)*** 0 – 0.25 0.25
Eurozone (refi rate) 0.25 0.25
United Kingdom (repo rate) 0.50 0.50
Japan (overnight call rate) 0.10 0.10
Currencies
Current * Mar 2015 (%)
EUR / USD 1.3752 1.30 –5.47
USD / JPY 102.194 110.00 7.64
EUR / CHF 1.2190 1.24 1.72
GBP / USD 1.6628 1.62 –2.57
USD / CNY 6.2132 6.00 –3.43
Despite the economic upswing, Eurozone inflation has hovered under the 1 % mark in recent months. For this reason, the ECB is likely to keep the key rate low.
Increasing export capacities for U.S. oil are fueling a rise in the price of WTI crude oil in the United States. On the other hand, growing oil production in Canada has a price-reducing effect.
The Chinese government expanded the trading band for the exchange rate. This led to a devaluation of the renminbi, but this should only be short-lived.
Eurozone (refi rate)
0.25 % 0.25 %
Crude oil (WTI)
94.099.6
USD / CNY
6.2132 6.00
LME = London Metal Exchange, WTI = West Texas Intermediate; as of March 26, 2014
As of March 26, 2014
As of March 26, 2014
Capital markets (F)
Equity markets (index value in points)
Current* Mar 2015 (%)
United States (S&P 500 Index) 1,868.50 1,975.00 5.70
Eurozone (EURO STOXX 50 Index) 3,130.15 3,400.00 8.62
Germany (DAX)** 9,434.00 10,150.00 7.59
Europe (STOXX Europe 600 Index) 331.24 360.00 8.68
Japan (MSCI Japan Index) 721.58 830.00 15.02
MSCI Asia ex Japan Index (U.S. dollars) 535.15 570.00 6.51
MSCI Emerging Markets Index (U.S. dollars) 969.71 1,000.00 3.12
Capital market yields (sovereign bonds) in percent
Current * Mar 2015
United States, 2-year 0.45 1.25
United States, 10-year 2.72 3.55
Germany, 2-year 0.17 0.35
Germany, 10-year 1.57 2.25
United Kingdom, 10-year 2.70 3.50
Japan, 2-year 0.07 0.15
Japan, 10-year 0.62 0.90
In light of increased market volatility, German Bunds were in demand as a safe haven. The result: a decline in the yields of long Bunds. We expect yields to increase as the market stabilizes.
(F) refers to forecasts. The 2014 and 2015 forecasts are as of March 20, 2014.* Source: Bloomberg Finance LP ** Total return index (includes dividends)*** Lower end of 0 – 0.25 rangePast performance is not indicative of future returns. It is not possible to invest directly in an index. No assurance can be given that any forecast or target will be reached. Forecasts are based on assumptions, estimates, opinions and hypothetical models or analyses which may prove to be incorrect.
Germany, 10-year
2.25%1.57 %As of March 26, 2014
8 CIO View | Europe, Middle East & Africa Edition | April 2014
Nine positions
Focus
The big picture
Investment traffic lights
Portfolio
Equities
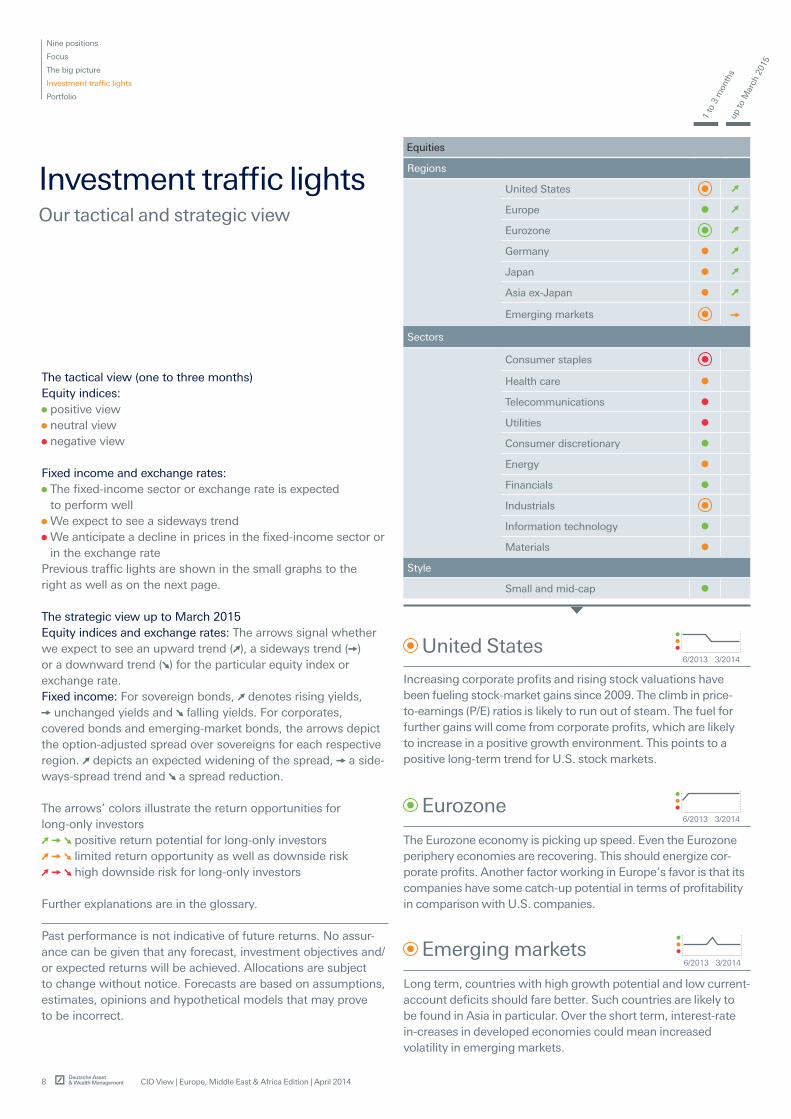
Regions
United States
Europe
Eurozone
Germany
Japan
Asia ex-Japan
Emerging markets
Sectors
Consumer staples
Health care
Telecommunications
Utilities
Consumer discretionary
Energy
Financials
Industrials
Information technology
Materials
Style
Small and mid-cap
1 to
3 m
onth
sup
to M
arch
201
5
Investment traffic lights Our tactical and strategic view
United States
Increasing corporate profits and rising stock valuations have been fueling stock-market gains since 2009. The climb in price-to-earnings (P/E) ratios is likely to run out of steam. The fuel for further gains will come from corporate profits, which are likely to increase in a positive growth environment. This points to a positive long-term trend for U.S. stock markets.
Eurozone
The Eurozone economy is picking up speed. Even the Eurozone periphery economies are recovering. This should energize cor-porate profits. Another factor working in Europe‘s favor is that its companies have some catch-up potential in terms of profitability in comparison with U.S. companies.
Emerging markets
Long term, countries with high growth potential and low current-account deficits should fare better. Such countries are likely to be found in Asia in particular. Over the short term, interest-rate in-creases in developed economies could mean increased volatility in emerging markets.
Past performance is not indicative of future returns. No assur-ance can be given that any forecast, investment objectives and/or expected returns will be achieved. Allocations are subject to change without notice. Forecasts are based on assumptions, estimates, opinions and hypothetical models that may prove to be incorrect.
The tactical view (one to three months)Equity indices: positive view neutral view negative view
Fixed income and exchange rates: The fixed-income sector or exchange rate is expected to perform well We expect to see a sideways trend We anticipate a decline in prices in the fixed-income sector or in the exchange rate
Previous traffic lights are shown in the small graphs to the right as well as on the next page.
The strategic view up to March 2015Equity indices and exchange rates: The arrows signal whether we expect to see an upward trend ( ), a sideways trend ( )or a downward trend ( ) for the particular equity index or exchange rate.Fixed income: For sovereign bonds, denotes rising yields,
unchanged yields and falling yields. For corporates, covered bonds and emerging-market bonds, the arrows depict the option-adjusted spread over sovereigns for each respective region. depicts an expected widening of the spread, a side-ways-spread trend and a spread reduction.
The arrows’ colors illustrate the return opportunities for long-only investors positive return potential for long-only investors limited return opportunity as well as downside risk high downside risk for long-only investors
Further explanations are in the glossary.
6/2013 3/2014
6/2013 3/2014
6/2013 3/2014
CIO View | Europe, Middle East & Africa Edition | April 2014 9
Nine positions
Focus
The big picture
Investment traffic lights
Portfolio
Fixed income
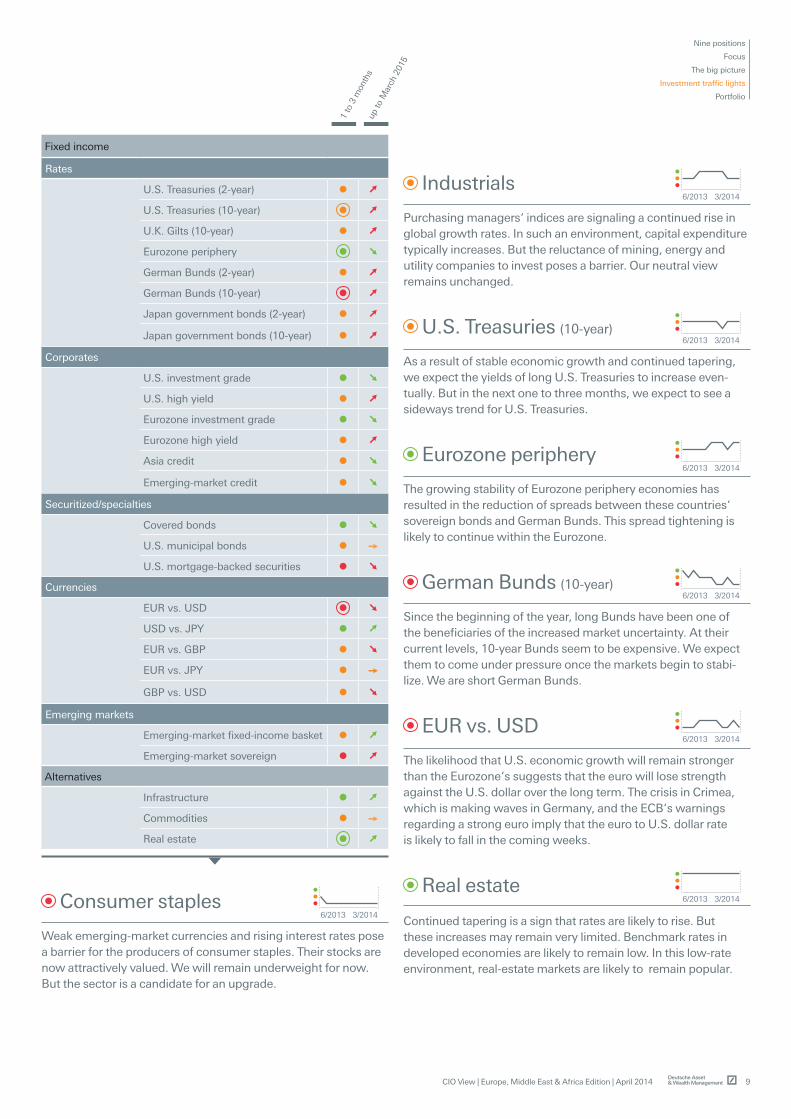
Rates
U.S. Treasuries (2-year)
U.S. Treasuries (10-year)
U.K. Gilts (10-year)
Eurozone periphery
German Bunds (2-year)
German Bunds (10-year)
Japan government bonds (2-year)
Japan government bonds (10-year)
Corporates
U.S. investment grade
U.S. high yield
Eurozone investment grade
Eurozone high yield
Asia credit
Emerging-market credit
Securitized/specialties
Covered bonds
U.S. municipal bonds
U.S. mortgage-backed securities
Currencies
EUR vs. USD
USD vs. JPY
EUR vs. GBP
EUR vs. JPY
GBP vs. USD
Emerging markets
Emerging-market fixed-income basket
Emerging-market sovereign
Alternatives
Infrastructure
Commodities
Real estate
1 to
3 m
onth
sup
to M
arch
201
5
Consumer staples
Weak emerging-market currencies and rising interest rates pose a barrier for the producers of consumer staples. Their stocks are now attractively valued. We will remain underweight for now. But the sector is a candidate for an upgrade.
Industrials
Purchasing managers‘ indices are signaling a continued rise in global growth rates. In such an environment, capital expenditure typically increases. But the reluctance of mining, energy and utility companies to invest poses a barrier. Our neutral view remains unchanged.
German Bunds (10-year)
Since the beginning of the year, long Bunds have been one of the beneficiaries of the increased market uncertainty. At their current levels, 10-year Bunds seem to be expensive. We expect them to come under pressure once the markets begin to stabi-lize. We are short German Bunds.
Eurozone periphery
The growing stability of Eurozone periphery economies has resulted in the reduction of spreads between these countries‘ sovereign bonds and German Bunds. This spread tightening is likely to continue within the Eurozone.
U.S. Treasuries (10-year)
As a result of stable economic growth and continued tapering, we expect the yields of long U.S. Treasuries to increase even-tually. But in the next one to three months, we expect to see a sideways trend for U.S. Treasuries.
EUR vs. USD
The likelihood that U.S. economic growth will remain stronger than the Eurozone‘s suggests that the euro will lose strength against the U.S. dollar over the long term. The crisis in Crimea, which is making waves in Germany, and the ECB‘s warnings regarding a strong euro imply that the euro to U.S. dollar rate is likely to fall in the coming weeks.
Real estate
Continued tapering is a sign that rates are likely to rise. But these increases may remain very limited. Benchmark rates in developed economies are likely to remain low. In this low-rate environment, real-estate markets are likely to remain popular.
6/2013 3/2014
6/2013 3/2014
6/2013 3/2014
6/2013 3/2014
6/2013 3/2014
6/2013 3/2014
6/2013 3/2014

10 CIO View | Europe, Middle East & Africa Edition | April 2014
Nine positions
Focus
The big picture
Investment traffic lights
Portfolio
Source: Deutsche Asset & Wealth Management EMEA Regional Investment Committee (RIC). As of March 18, 2014. Suggested allocation for USD based investors. This allocation may not be suitable for all investors. Investments in alternative asset classes are dealt with separately on page 12.
Equities
Developed markets 46.5 %
Emerging markets 5.5 %
Fixed income
Credit 16.5 %
Sovereign 21.0 %
Emerging markets 6.5 %
Cash 2.5 %
Commodities
Commodities 1.5 %
Weight
52.0 %
46.5 %
Fixed income
Commodities
1.5 %
5.5 %
6.5 %
1.5 %
21.0% 46.5 %
16.5 %
2.5 %
Europe, Middle East, Africa
Our core portfolio allocationWith our core portfolio, we cover assets such as equities, fixed income and commodities. The chart shows how we would currently design a balanced portfolio.
Past performance is not indicative of future returns. No assurance can be given that any forecast, investment objectives and/or expected returns will be achieved. Allocations are subject to change without notice. Fore-casts are based on assumptions, estimates, opinions and hypothetical models that may prove to be incorrect.
Equities
Fixed income: limited opportunities U.S. yields are now expected to move higher as the Fed continues to normalize monetary policy. German Bund yields will follow suit although opportunities may still exist in the Eurozone periph-ery. Recent good investment-grade and high-yield performance has left some corporate bonds looking rather expensive. For investors with certain risk profiles looking for higher real yield levels, emerging-market- hard currency bonds may soon appeal.
Equities: growth with volatilityGlobal growth will benefit equities over the course of 2014, with dividend yields and share buybacks also supportive factors. But with developed-market valuations looking stretched, we need more evidence of sustained corporate-earnings growth to pull prices higher. This may take some months to materialize. Emer-ging-market valuations may look more attractive, but must be accompanied by a marked change in investor sentiment toward these markets (perhaps prompted by better news on China). So, in the short term, expect periods of volatility.
Commodities: price gains not sustainableCommodities have had an unexpectedly good start to 2014. But gravity cannot be defied forever. As recent economic worries recede, gold prices are unlikely to move higher. More normal weather and reduced supply concerns will keep the lid on oil prices. For industrial metals, China’s economic health will be key.
Portfolio How we allocate assets

CIO View | Europe, Middle East & Africa Edition | April 2014 11
Nine positions
Focus
The big picture
Investment traffic lights
Portfolio
CIO View: European equities—room for further gains?LONG Valuations may look high, and there are concerns about the implications of euro strength, but the positives still predomi-nate. European corporate-earnings growth is likely to pick up during 2014. As the Eurozone’s structural problems recede, we could also get some positive rerating.
European corporate credit—attractive over the medium term?SHORT Spreads are near cyclical lows but demand remains strong and this keeps us positive here on a tactical, short-term basis. But the risk/return relationship is likely to deteriorate, particularly as company leverage is expected to rise. This keeps us cautious on the medium-term outlook.
U.S. equities—stay relaxed on valuations?LONG Trailing P/E ratios remain above their average and look unlikely to move much higher. Moreover, first-quarter 2014 corporate earnings could prove disappointing, due to the weather earlier this year. But earnings are likely to pick up in subsequent quarters—particularly if we see more evidence of corporate revenue growth—supporting equities.
Emerging market equities—time to buy the market?SHORT Emerging market valuations are at a 30 % discount to developed markets. But cheap valuations on their own can’t turn these markets around. We need catalysts to change overall investor sentiment—for example, better economic news out of China. For the moment, stay selective.
Japanese equities—can Abenomics maintain upward momentum?LONG Doubts about the effectiveness of Abenomics remain, and the impact of the April consumption tax hike will be closely scrutinized. But we expect the effects of this to be short-lived and expect further domestic buyer support for Japanese equities in the second half of 2014.
U.S. dollar—still expecting long-term strength?LONG The dollar’s lackluster performance so far in 2014 has surprised many, including myself. But Fed tapering, when combined with renewed signs of strong U.S. growth—once the weather-related weakness is behind us—will eventually boost its appeal, if perhaps not for another few months.
Past performance is not indicative of future returns. No assur-ance can be given that any forecast, investment objectives and/or expected returns will be achieved. Allocations are subject to change without notice. Forecasts are based on assumptions, estimates, opinions and hypothetical models that may prove to be incorrect.
LONG Stands for a positive answer
SHORT Stands for a negative answer
Long or short, Stéphane Junod?Six market views from our regional chief investment officer
Stéphane Junod is the Multi Asset Group chief investment officer for Europe, Middle East and Africa (EMEA).

12 CIO View | Europe, Middle East & Africa Edition | April 2014
Liquid alternatives: above averageLiquid alternatives should again beat their long-term average returns this year. However, market conditions favor certain types of strategy, such as equity long/short and event driven. In contrast, improving global growth and low yields are making life tougher for trend followers and certain credit strategies.
Private equity: recovery continues Private equity continues to recover from its post-crisis slump and fundraising is picking up. Managers are generating healthy cash returns from exiting portfolio companies. Meanwhile, capital deployment is gathering momentum and the number of private-equity deals should continue to rise.
Infrastructure: improving cash flowsInfrastructure should see stable to improving cash flows this year, with assets that are more exposed to economic cycles—such as toll roads, airports and railroads—faring best. Private-sector involvement in infrastructure continues to increase, broadening the opportunity set for investors.
Real estate: rental growthRising demand for commercial real estate coupled with limited new construction is supporting rental growth in markets such as the United States, Germany, United Kingdom, Australia and Japan. Property yields remain above average relative to sover-eign yields. When this occurred in the past, real estate delivered strong returns.
Absolute Return PortfolioOur alternatives portfolio covers nontraditional liquid and illiquid assets. For most investors, this will account for a relatively small share of their total investments.
Private equity
Investments in private firms or public- company buyouts. Not quoted on a public exchange and with a long time horizon.
Real estate
Direct or indirect investment in commer-cial real estate with the aim of delivering rental income and/or capital gains.
Infrastructure
Long-term defensive investment in infra-structure assets that may offer low correla-tion to traditional asset classes.
Liquid alternatives
Investments that offer exposure to hedge-fund strategies and claiming higher liquidity than their underlying components.
Past performance is not indicative of future returns. No assurance can be given that any forecast, investment objectives and/or expected returns will be achieved. Allocations are subject to change without notice. Fore-casts are based on assumptions, estimates, opinions and hypothetical models that may prove to be incorrect.In our balanced model portfolio, we currently allocate 10 % to alternative investments (see “Nine positions” on page 2).
Nine positions
Focus
The big picture
Investment traffic lights
Portfolio
Europe, Middle East, Africa

CIO View | Europe, Middle East & Africa Edition | April 2014 13
CIO View: How do you expect liquid alternatives to perform this year?LONG The asset class should be able to beat its historical average returns again, with a number of strategies particularly well suited to the improving market environment.
Can equity long/short funds repeat their success?LONG Equity long/short was the top performer last year and, with the global recovery taking hold, conditions should benefit it again. The strategy tends to do better in steadily rising mar-kets, which we expect to see this year—albeit with pockets of volatility. It’s a much better environment for stock pickers and fund managers are once again being rewarded for research into individual companies.
What’s your view on fixed-income liquid alternatives?LONG Tight spreads and the potential for rising interest rates will be challenging for credit strategies. But on balance we’re taking a positive stance. There should be enough opportunities to help them deliver a reasonable return. For example, long/short credit strategies should benefit from the fact that fundamentals—rather than risk sentiment—will become more dominant in markets this year. Even so, astute research will be needed to identify profitable investments.
What is the outlook for commodity trading advisors (CTAs) and other trend followers?SHORT Strategies that try to profit from medium- and long-term trends in markets, particularly CTAs, are likely to struggle. Trends will be in short supply in an environment of gradually rising equity markets where returns are primarily driven by stock picking. That said, some short-term strategies may benefit from the intermittent volatility we expect to see across certain asset classes.
What about distressed funds?SHORT The dearth of bankruptcies, both current and expected, should drag on realized returns for liquid-alternatives manag-ers in the distressed sector throughout 2014. Default rates are currently at an historically low level of 2.2 % compared with an average of 4.9 %. Hence: underweight.
How are you positioning for event-driven managers?LONG We particularly favor activist managers who generate returns from driving change in the companies they invest in. Many companies have a significant amount of cash on their balance sheets, which management teams will be expected to put to use now that confidence is picking up. For funds that specialize in mergers, the potential for consolidation in the telecoms and materials sectors in particular should provide opportunities.
LONG Stands for a positive answer
SHORT Stands for a negative answer
Long or short, Tim Gascoigne?The head of liquid alternatives advisory shares his views
Past performance is not indicative of future returns. No assur-ance can be given that any forecast, investment objectives and/or expected returns will be achieved. Allocations are subject to change without notice. Forecasts are based on assumptions, estimates, opinions and hypothetical models that may prove to be incorrect.
Offers and sales of alternative investments are subject to regulatory requirements and such investments may be available only to investors who are “Qualified Purchasers” as defined by the U.S. Investment Company Act of 1940 and ”Accredited Investors” as defined in Regulation D of the 1933 Securities Act. Alternative investment programs may not be suitable for certain eligible investors.
Nine positions
Focus
The big picture
Investment traffic lights
Portfolio

14 CIO View | Europe, Middle East & Africa Edition | April 2014
GlossaryHere we explain central terms from CIO View
Abenomics refers to the growth-oriented economic policies advocated by Japan’s prime minister Shinz Abe.
The Barclays U.S. Convertibles Index tracks the performance of U.S. convertible bonds.
The Bloomberg JP Morgan Asia Dollar Index tracks the perfor-mance of emerging Asia‘s most actively traded currency pairs valued against the U.S. dollar.
Commodity trading advisers (CTAs), also known as managed futures funds, are predominantly computer-driven systematic trend-following hedge fund vehicles. These funds’ managers run different strategies using futures contracts across all futures markets, options on futures contracts and FX forwards.
Correlation is a measure of how closely two variables move together over time. A 1.0 equals perfect correlation. A –1.0 equals perfect negative correlation.
Deflation is a general and persistent (not only temporary) fall in the level of prices for goods and services. It is not to be confused with a fall in prices in only one economic sector (energy for example) and also not to be confused with low and falling rates of inflation (which is disinflation).
The Deutscher Aktien Index (DAX) tracks the performance of the 30 major German companies trading on the Frankfurt Stock Exchange.
Distressed securities are securities of companies that are in financial difficulties. Distressed funds invest in such securities.
The EURO STOXX 50 Index tracks the performance of blue-chip stocks in the eurozone.
The Eurozone is an economic and monetary union of 18 Euro-pean Union member states that have adopted the euro as their common currency and sole legal tender.
Event-driven investing is an investment strategy that seeks to exploit pricing inefficiencies that may occur before or after a corporate event, such as a merger, acquisition, spinoff, or bankruptcy.
A long/short strategy seeks to profit from gains in the long positions and price declines in the short positions, while trying to minimize market exposure.
The materials sector is a category of stocks that includes com-panies involved in the discovery, development and processing of raw materials.
The Morgan Stanley Cyclical Index tracks the performance of economically sensitive industries’ stocks within the U.S. economy.
The MSCI Asia ex Japan Index tracks the performance of non-Japanese Asian stocks.
The MSCI Emerging Markets Index tracks the performance of stocks in select emerging markets.
The MSCI Japan Index tracks the performance of Japanese stocks.
The MSCI World Industrials Index tracks the performance of mid- and large-cap stocks in 23 developed countries around the world.
Periphery countries are those member states of the European Monetary Union, which got into financial troubles in the course of the sovereign debt crisis.
Price-to-earnings (P/E) ratio compares a company’s current share price to its per-share earnings.
Quantitative easing is an unconventional measure of the central bank applied in the context of its monetary policy, which is coined by purchases of assets and thereby inducing an increase in the monetary base and keeping short-term interest rates low.
The shadow banking system (or shadow financial system) is a network of financial institutions comprised of non-depository banks that generally serve as intermediaries between investors and borrowers, providing credit and capital. Because shadow banking institutions don‘t receive traditional deposits, they are not subject to all of the regulations imposed on the traditional banking system.
CIO View | Europe, Middle East & Africa Edition | April 2014 15
Spread refers to the yield differential between various bond sectors and financial instruments with similar maturities. Here the yield difference reflects the higher risk compared to best rated bonds.
The S&P 500 Consumer Staples Index tracks the performance of S&P 500 Index consumer staples companies.
The S&P 500 Index tracks the performance of 500 leading U.S. stocks and is widely considered representative of the U.S. equity market.
The STOXX Europe Mid 200 Index tracks the performance of mid-cap European companies.
The STOXX Europe Small 200 Index tracks the performance of small-cap European companies.
The STOXX Europe 600 Index tracks the performance of 600 companies across 18 countries of the European region.
The Tokyo Stock Exchange REIT Index tracks the performance of all real estate investment trusts listed on the Tokyo Stock Exchange (J-REITs).
Investment traffic lights (pages 8 – 9):comments regarding our tactical and strategic view Tactical view: — The focus of our tactical view for fixed income is on trends
in bond prices, not yields.
Strategic view: — The focus of our strategic view for corporate bonds is on
yields, not trends in bond prices. — For corporates and covered bonds, the arrows depict the
respective option-adjusted spread. — For bonds not denominated in euros, the illustration depicts
the spread in comparison with U.S. Treasuries. For bonds denominated in euros, the illustration depicts the spread in comparison with German Bunds.
— For EM sovereign bonds, the illustration depicts the spread in comparison with U.S. Treasuries.
— Both spread and yield trends influence the bond value. Investors who aim to profit only from spread trends must hedge against changing interest rates.
— The basket of EM currencies comprises CNY, THB, MYR, PHP, IDR, INR, RUB, TRY, HUF, PLN, ZAR, BRL and MXN. These currencies are equally weighted. The currency basket is measured against the U.S. dollar (75 %) and the euro (25 %).

Nine positions
Focus
The big picture
Investment traffic lights
Portfolio
High-conviction ideas
CIO View | Europe, Middle East & Africa Edition | April 2014 16
Past performance is no guarantee of future results; nothing contained herein shall constitute any representation or warranty as to future performance. Further information is available upon investor’s request.
This Document may not be distributed in Canada, Japan, the United States of America, or to any U.S. person. © 2014 Deutsche Bank AG
Important information – UK
Deutsche Asset & Wealth Management offers wealth management solutions for wealthy individuals, their families and select institutions worldwide. Deutsche Asset & Wealth Management, through Deutsche Bank AG, its affiliated companies and its officers and employees (collectively “Deutsche Bank”) are communicating this document in good faith and on the following basis.
This document is for information purposes only and is not intended to be an offer or solicitation, or the basis for any contract to purchase or sell any security, or other instrument, or for Deutsche Bank to enter into or arrange any type of transaction as a consequence of any information contained herein. It has been prepared without consideration of the investment needs, objectives or financial circumstances of any investor.
This document does not identify all the risks (direct and indirect) or other considerations which might be material to you when entering into a transaction. Before making an investment decision, investors need to consider, with or without the assistance of an investment adviser, whether the investments and strategies described or provided by Deutsche Bank, are appropriate, in light of their particular investment needs, objectives and financial circumstances. We assume no responsibility to advise the recipients of this document with regard to changes in our views. Deutsche Bank does not give taxation or legal advice. Investors should seek advice from their own taxation agents and lawyers, in considering investments and strategies suggested by Deutsche Bank. The terms of any investment will be exclusively subject to the detailed provisions, including risk considerations, contained in the Offering Documents. When making an investment decision, you should rely on the final documentation relating to the investment and not the summary contained in this document. Further information is available upon investor’s request.
Although information in this document has been obtained from sources believed to be reliable, we do not guarantee its accuracy, completeness or fairness, and it should not be relied upon as such. All opinions and estimates herein, including forecast returns, reflect our judgement on the date of this report, are subject to change without notice and involve a number of assumptions which may not prove valid.
Further, investment in international markets can be affected by a host of factors, including political or social conditions, diplomatic relations, limitations or removal of funds or assets or imposition of (or change in) exchange control or tax regulations in such markets. Additionally, investments denominated in an alternative currency will be subject to currency risk, changes in exchange rates which may have an adverse effect on the value, price or income of the investment. Past performance is no guarantee of future results. Nothing contained herein shall constitute any representation or warranty as to future performance. The products mentioned in this document are subject to investment risk including market fluctuations, regulatory change, counterparty risk, possible delays in repayment and loss of income and principal invested. The value of an investment can fall as well as rise and you might not get back the amount originally invested at any point in time.
No assurance can be given that any investment described herein would yield favorable investment results or that the investment objectives will be achieved. In general, the securities and financial instruments presented herein are not insured by the Federal Deposit Insurance Corporation (“FDIC”), and are not guaranteed by or obligations of Deutsche Bank AG or its affiliates. We or our affiliates or persons associated with us may act upon or use material in this report prior to publication. DB may engage in transactions in a manner inconsistent with the views discussed herein. Opinions expressed herein may differ from the opinions expressed by departments or other divisions or affiliates of Deutsche Bank.
This document contains forward looking statements. Forward looking statements include, but are not limited to assumptions, estimates, projections, opinions, models and hypothetical performance analysis. The forward looking statements expressed constitute the author’s judgement as of the date of this material. Forward looking statements involve significant elements of subjective judgements and analyses and changes thereto and/or consideration of different or additional factors could have a material impact on the results indicated. Therefore, actual results may vary, perhaps materially, from the results contained herein. No representation or warranty is made by Deutsche Bank as to the reasonableness or completeness of such forward looking statements or to any other financial information contained in this document.
This document may not be reproduced or circulated without our written authority. The manner of circulation and distribution of this document may be restricted by law or regulation in certain countries, including the United States. This document is not directed to, or intended for distribution to or use by, any person or entity who is a citizen or resident of or located in any locality, state, country or other jurisdiction, including the United States, where such distribution, publication, availability or use would be contrary to law or regulation or which would subject Deutsche Bank to any registration or licensing requirement within such jurisdiction not currently met within such jurisdiction. Persons into whose possession this document may come are required to inform themselves of, and to observe, such restrictions. This document was not produced, reviewed or edited by any research department within Deutsche Bank and is not investment research. Therefore, laws and regulations relating to investment research do not apply to it.

Nine positions
Focus
The big picture
Investment traffic lights
Portfolio
High-conviction ideas
CIO View | Europe, Middle East & Africa Edition | April 2014 17
Disclaimer – EMEA
Deutsche Asset & Wealth Management offers wealth management solutions for wealthy individuals, theirfamilies and select institutions worldwide. Deutsche Asset & Wealth Management, through Deutsche Bank AG,its affiliated companies and its officers and employees (collectively “Deutsche Bank”) are communicating thisdocument in good faith and on the following basis.
This document has been prepared without consideration of the investment needs, objectives or financialcircumstances of any investor. Before making an investment decision, investors need to consider, with orwithout the assistance of an investment adviser, whether the investments and strategies described or providedby Deutsche Bank, are appropriate, in light of their particular investment needs, objectives and financialcircumstances. Furthermore, this document is for information/ discussion purposes only and does not constitutean offer, recommendation or solicitation to conclude a transaction and should not be treated as givinginvestment advice.
Deutsche Bank does not give tax or legal advice. Investors should seek advice from their own tax expertsand lawyers, in considering investments and strategies suggested by Deutsche Bank. Investments withDeutsche Bank are not guaranteed, unless specified. Unless notified to the contrary in a particular case,investment instruments are not insured by the Federal Deposit Insurance Corporation (“FDIC”) or anyother governmental entity, and are not guaranteed by or obligations of Deutsche Bank AG or its affiliates.
Although information in this document has been obtained from sources believed to be reliable, we do notguarantee its accuracy, completeness or fairness, and it should not be relied upon as such. All opinions andestimates herein, including forecast returns, reflect our judgment on the date of this report and are subject to change without notice and involve a number of assumptions which may not prove valid.
Investments are subject to various risks, including market fluctuations, regulatory change, counterparty risk,possible delays in repayment and loss of income and principal invested. The value of investments can fall as wellas rise and you may not recover the amount originally invested at any point in time. Furthermore, substantialfluctuations of the value of the investment are possible even over short periods of time.
This publication contains forward looking statements. Forward looking statements include, but are not limitedto assumptions, estimates, projections, opinions, models and hypothetical performance analysis. The forwardlooking statements expressed constitute the author’s judgment as of the date of this material. Forward lookingstatements involve significant elements of subjective judgments and analyses and changes thereto and/orconsideration of different or additional factors could have a material impact on the results indicated. Therefore,actual results may vary, perhaps materially, from the results contained herein. No representation or warrantyis made by Deutsche Bank as to the reasonableness or completeness of such forward looking statements or toany other financial information contained herein. The terms of any investment will be exclusively subject tothe detailed provisions, including risk considerations, contained in the Offering Documents. When making aninvestment decision, you should rely on the final documentation relating to the transaction and not the summarycontained herein.
This document may not be reproduced or circulated without our written authority. The manner of circulationand distribution of this document may be restricted by law or regulation in certain countries, including the UnitedStates. This document is not directed to, or intended for distribution to or use by, any person or entity who is acitizen or resident of or located in any locality, state, country or other jurisdiction, including the United States,where such distribution, publication, availability or use would be contrary to law or regulation or which wouldsubject Deutsche Bank to any registration or licensing requirement within such jurisdiction not currently metwithin such jurisdiction. Persons into whose possession this document may come are required to informthemselves of, and to observe, such restrictions.
Past performance is no guarantee of future results; nothing contained herein shall constitute any representation or warranty as to futureperformance. Further information is available upon investor’s request.
This Document may not be distributed in Canada, Japan, the United States of America, or to any U.S. person.© 2014 Deutsche Bank AG
Publisher: Deutsche Bank AG, Taunusanlage 12, D-60325 Frankfurt am Main, GermanyGraphic Design: Vier für Texas GmbH, Frankfurt Print: Adelmann GmbH, Frankfurt