CIO Conference
35
CIO Conference October 31-November 2, 2012
-
Upload
lael-malone -
Category
Documents
-
view
23 -
download
1
description
CIO Conference. October 31-November 2, 2012. Questions?. Enrollment Survey Fall 2012. Year FallChange SpringChange 2007-08 1,694,7965.0%1,704,0225.0% 2008-09 1,793,5085.8%1,813,1046.4% 2009-10 1,795,9690.1%1,747,977-3.6% - PowerPoint PPT Presentation
Transcript of CIO Conference

CIO Conference
October 31-November 2, 2012

Questions?
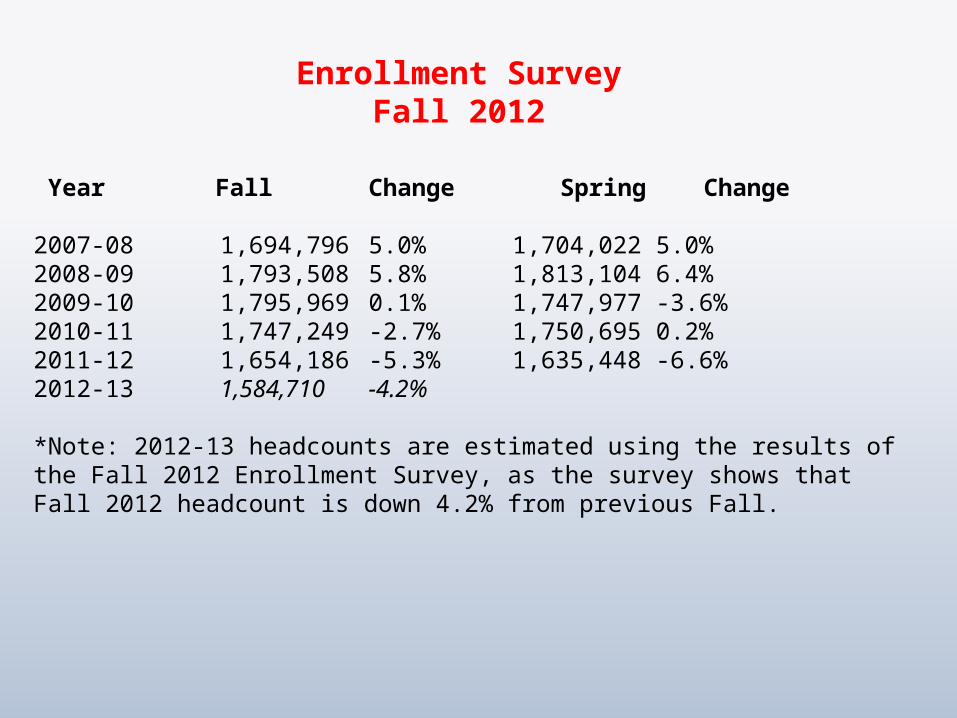
Year Fall Change Spring Change
2007-08 1,694,796 5.0% 1,704,022 5.0%2008-09 1,793,508 5.8% 1,813,104 6.4%2009-10 1,795,969 0.1% 1,747,977 -3.6%2010-11 1,747,249 -2.7% 1,750,695 0.2%2011-12 1,654,186 -5.3% 1,635,448 -6.6%2012-13 1,584,710 -4.2%
*Note: 2012-13 headcounts are estimated using the results of the Fall 2012 Enrollment Survey, as the survey shows that Fall 2012 headcount is down 4.2% from previous Fall.
Enrollment SurveyFall 2012
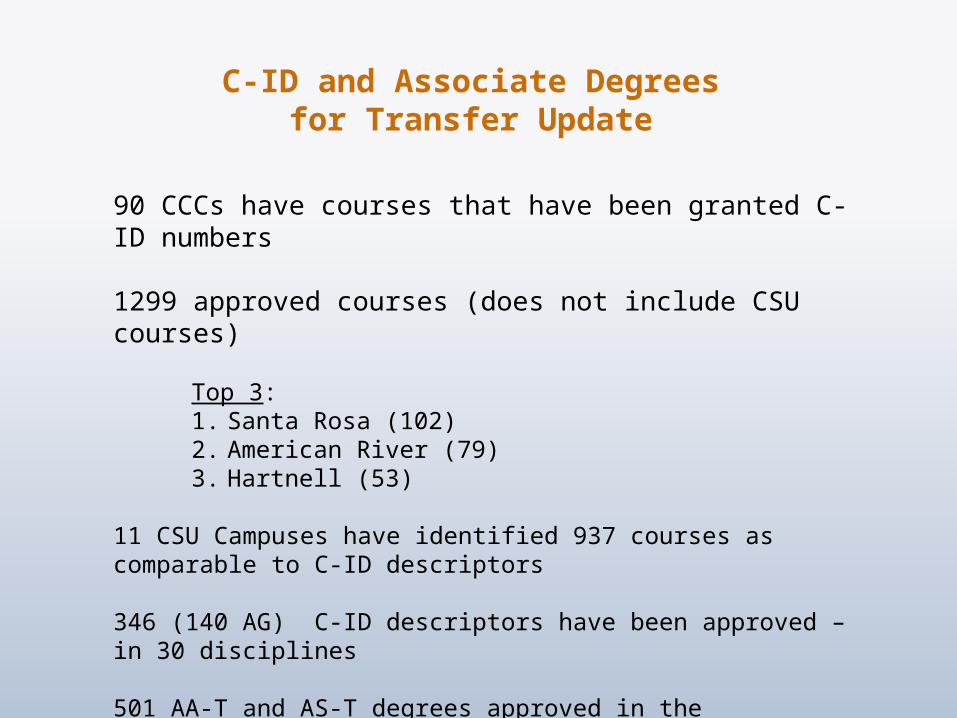
90 CCCs have courses that have been granted C-ID numbers
1299 approved courses (does not include CSU courses)
Top 3: 1. Santa Rosa (102) 2. American River (79)3. Hartnell (53)
11 CSU Campuses have identified 937 courses as comparable to C-ID descriptors
346 (140 AG) C-ID descriptors have been approved – in 30 disciplines
501 AA-T and AS-T degrees approved in the Chancellor’s Office
C-ID and Associate Degrees for Transfer Update
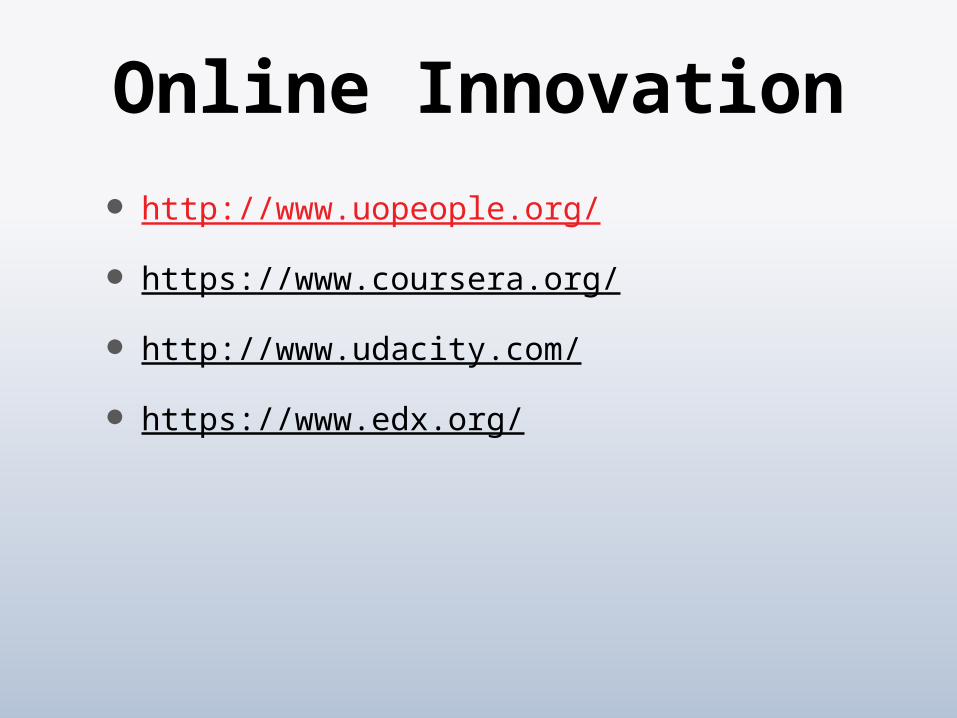
Online Innovation http://www.uopeople.org/
https://www.coursera.org/
http://www.udacity.com/
https://www.edx.org/
Food for Thought TBA, Independent Study (Directed Studies)
in Catalogs and Schedules?
Bachelor Degrees
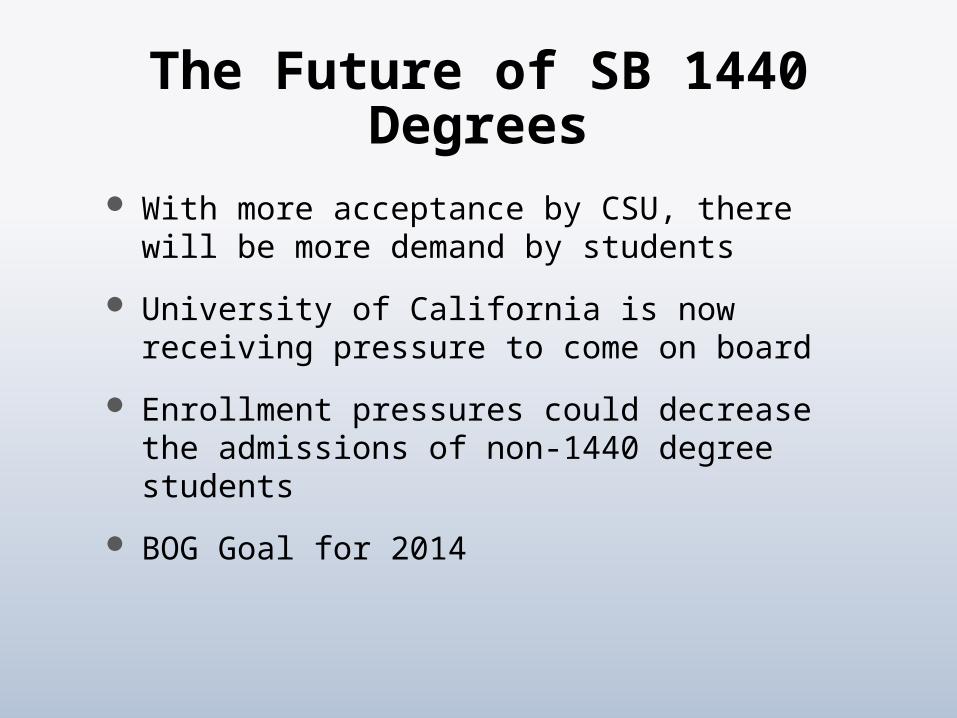
The Future of SB 1440 Degrees
With more acceptance by CSU, there will be more demand by students
University of California is now receiving pressure to come on board
Enrollment pressures could decrease the admissions of non-1440 degree students
BOG Goal for 2014
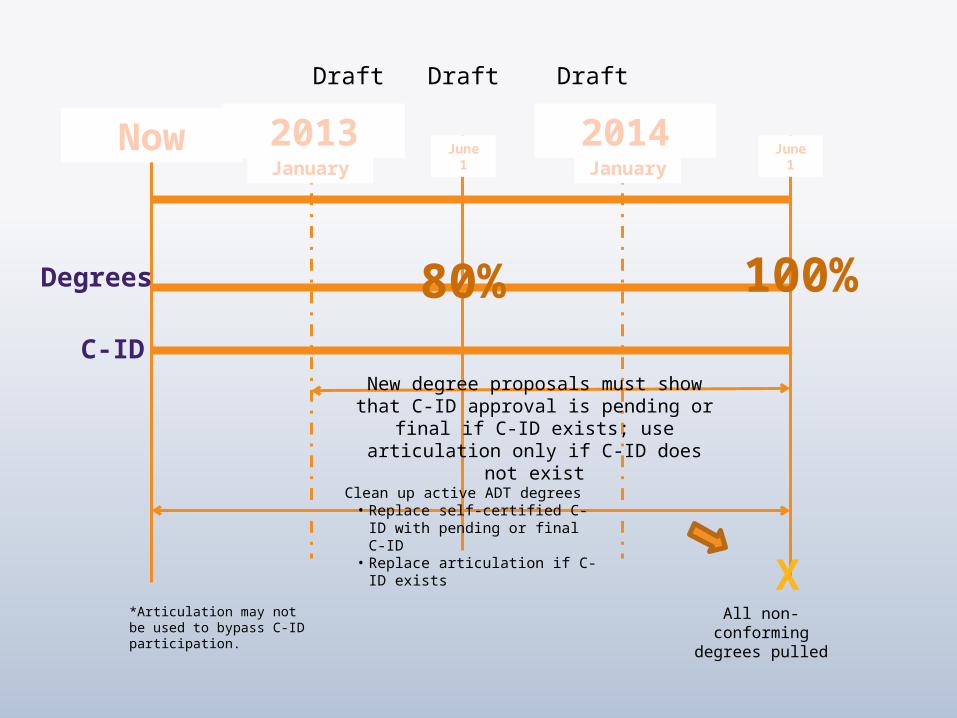
Now 2013 2014January January
Degrees
C-ID
80% 100%
New degree proposals must show that C-ID approval is pending or final if C-ID exists; use articulation only if C-ID
does not exist
June 1
Clean up active ADT degrees• Replace self-certified C-ID with
pending or final C-ID• Replace articulation if C-ID
exists XAll non-
conforming degrees pulled
*Articulation may not be used to bypass C-ID participation.
June 1
Draft Draft Draft
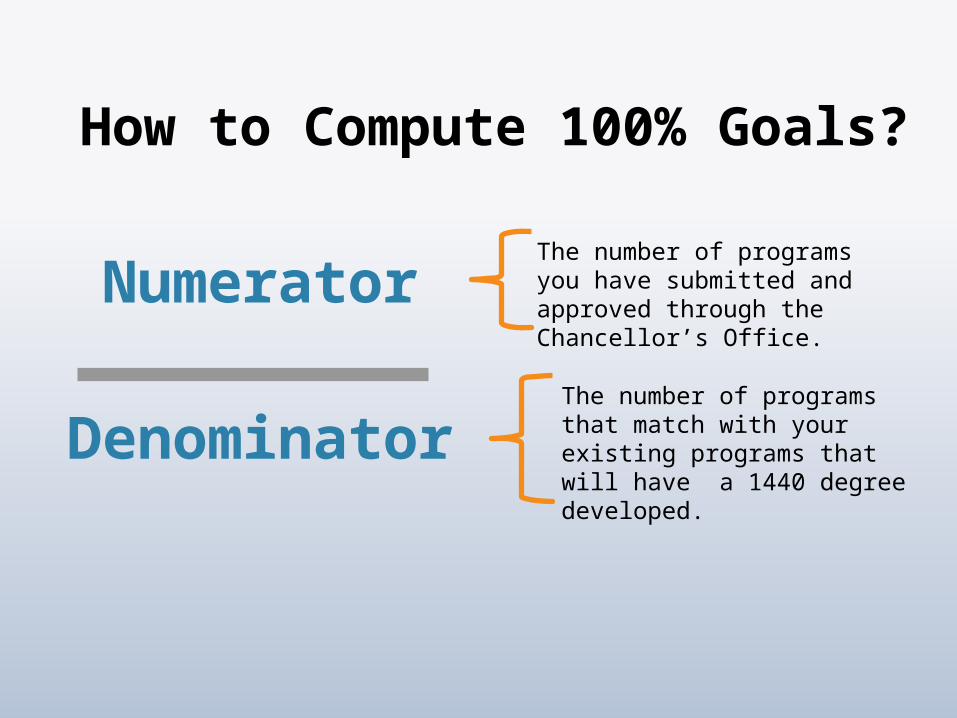
How to Compute 100% Goals?
Numerator
DenominatorThe number of programs that match with your existing programs that will have a 1440 degree developed.
The number of programs you have submitted and approved through the Chancellor’s Office.
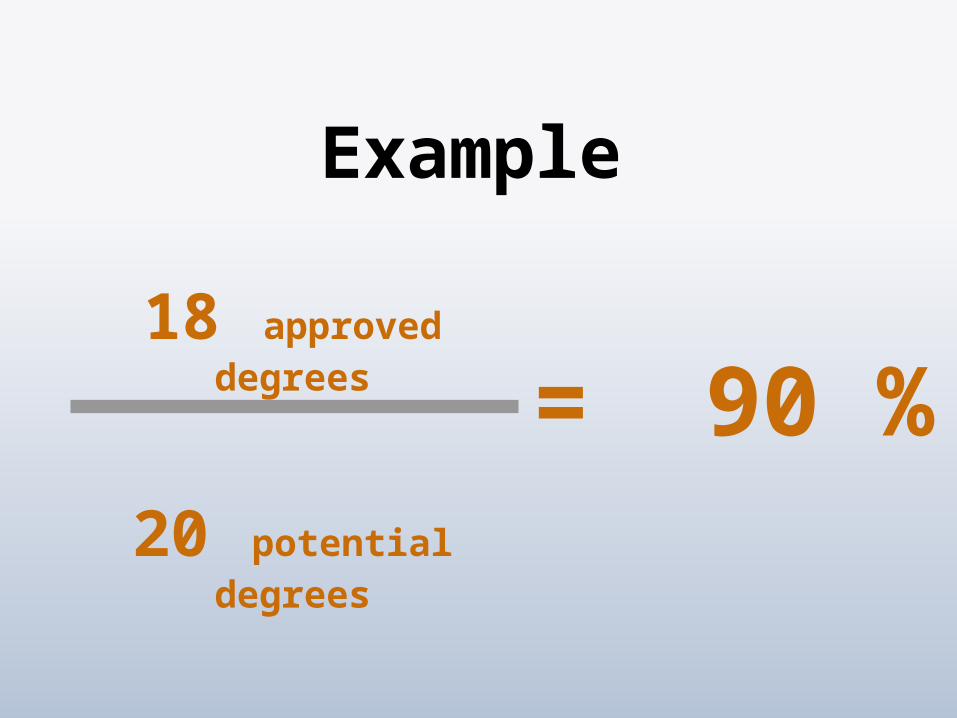
Example
18 approved degrees
20 potential degrees
= 90 %

Professional Development Summit
Workgroups Developed
Vision Statement Being Created
Flex Calendar Being Reviewed
Online Resources Being Collected
Accountability Reporting for the California
Community Colleges (ARCC) 2.0
Proposed Framework
(October 2012)
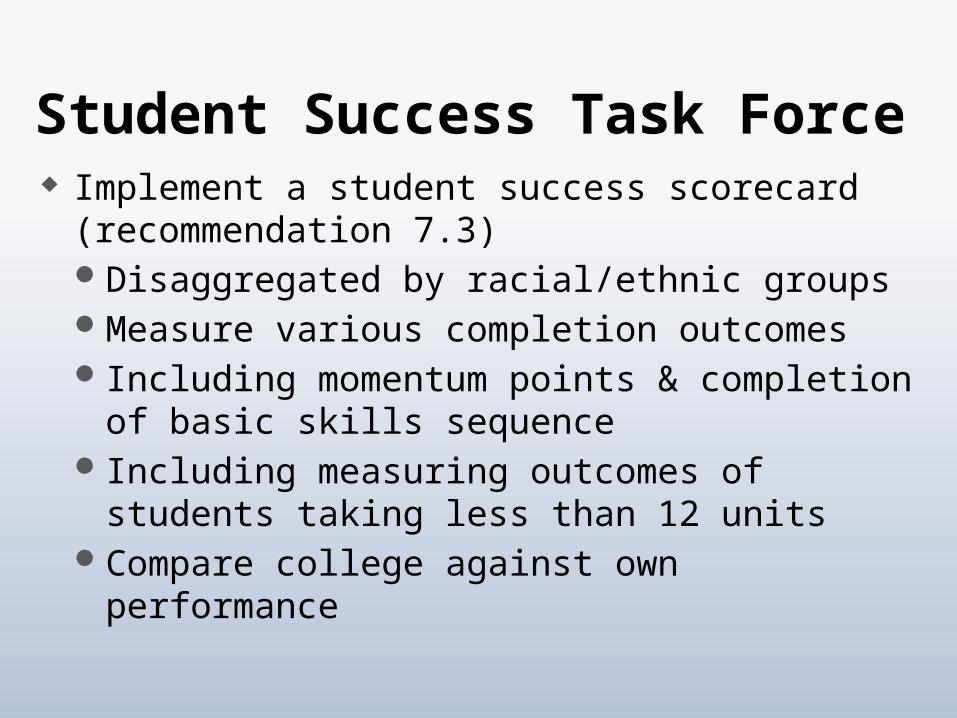
Student Success Task Force Implement a student success scorecard
(recommendation 7.3) Disaggregated by racial/ethnic groupsMeasure various completion outcomes Including momentum points & completion
of basic skills sequence Including measuring outcomes of students
taking less than 12 unitsCompare college against own performance
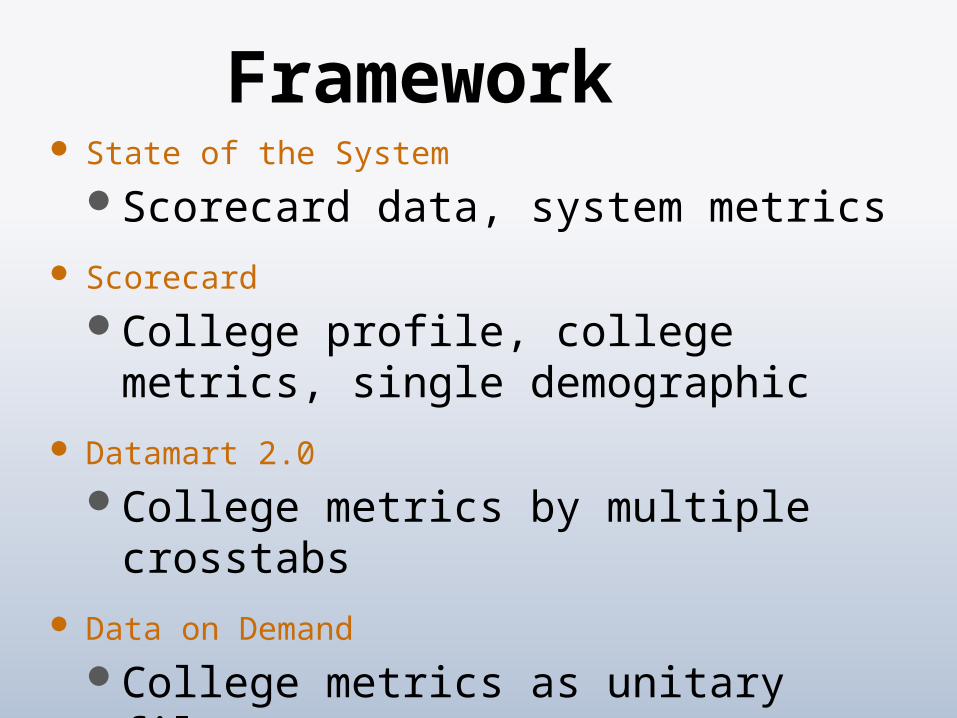
Framework State of the System
Scorecard data, system metrics Scorecard
College profile, college metrics, single demographic
Datamart 2.0
College metrics by multiple crosstabs
Data on Demand
College metrics as unitary files
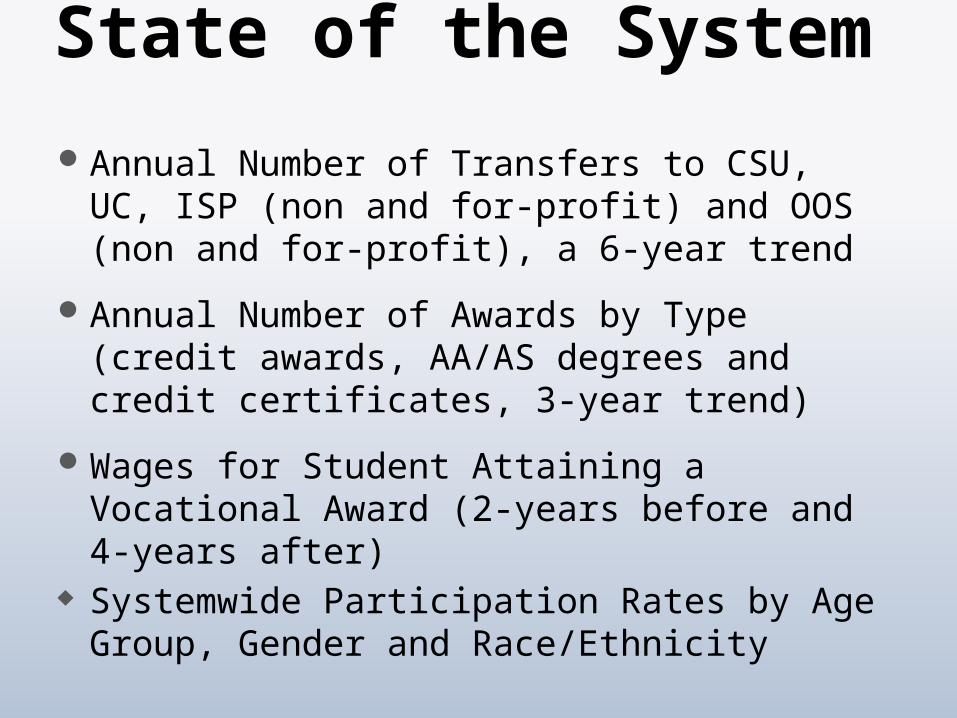
State of the System Annual Number of Transfers to CSU, UC,
ISP (non and for-profit) and OOS (non and for-profit), a 6-year trend
Annual Number of Awards by Type (credit awards, AA/AS degrees and credit certificates, 3-year trend)
Wages for Student Attaining a Vocational Award (2-years before and 4-years after)
Systemwide Participation Rates by Age Group, Gender and Race/Ethnicity
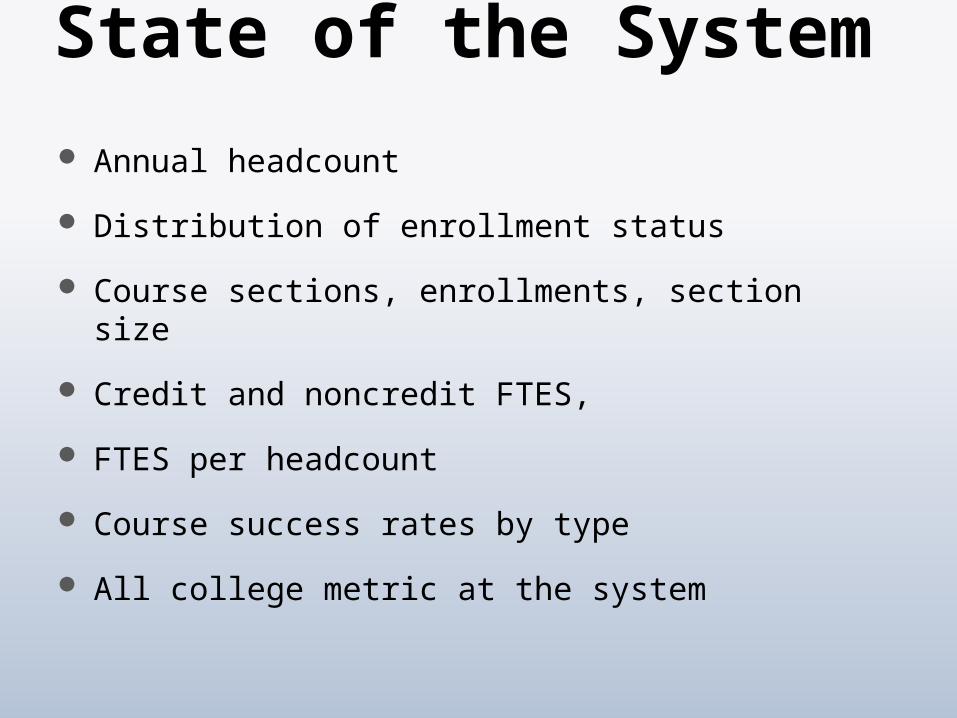
State of the System Annual headcount
Distribution of enrollment status
Course sections, enrollments, section size
Credit and noncredit FTES,
FTES per headcount
Course success rates by type
All college metric at the system
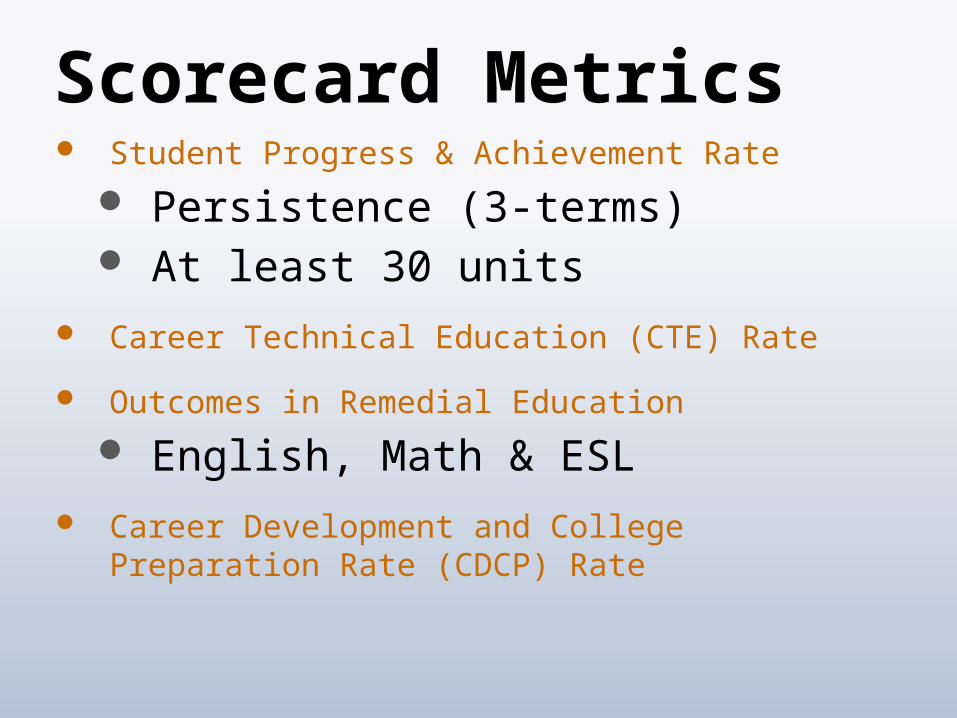
Scorecard Metrics Student Progress & Achievement Rate
Persistence (3-terms) At least 30 units
Career Technical Education (CTE) Rate
Outcomes in Remedial Education
English, Math & ESL Career Development and College
Preparation Rate (CDCP) Rate
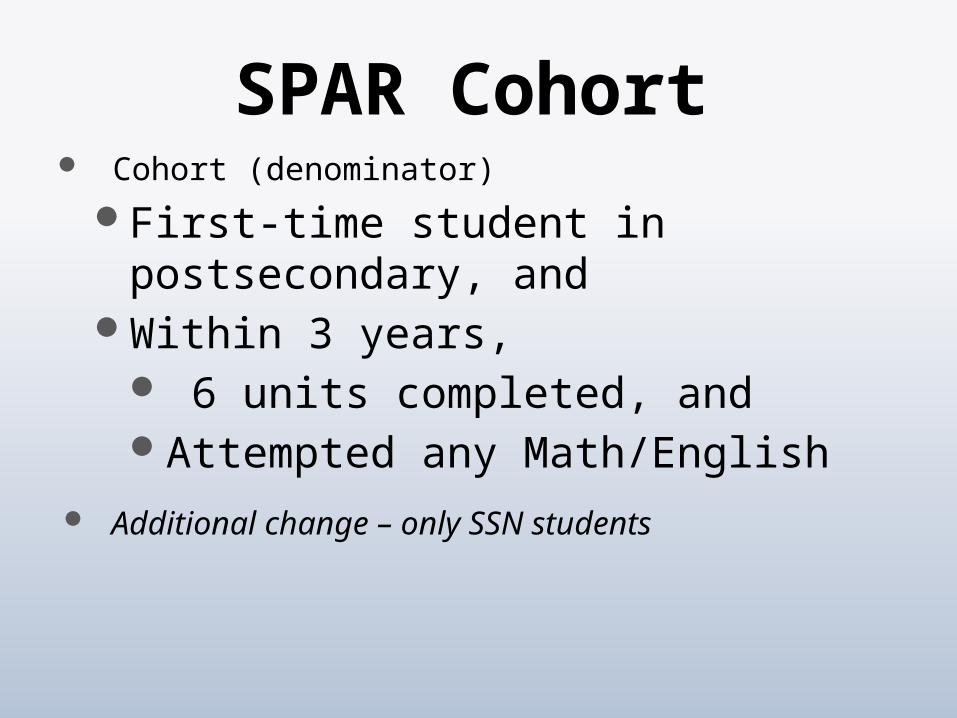
SPAR Cohort Cohort (denominator)
First-time student in postsecondary, and
Within 3 years, 6 units completed, andAttempted any Math/English
Additional change – only SSN students
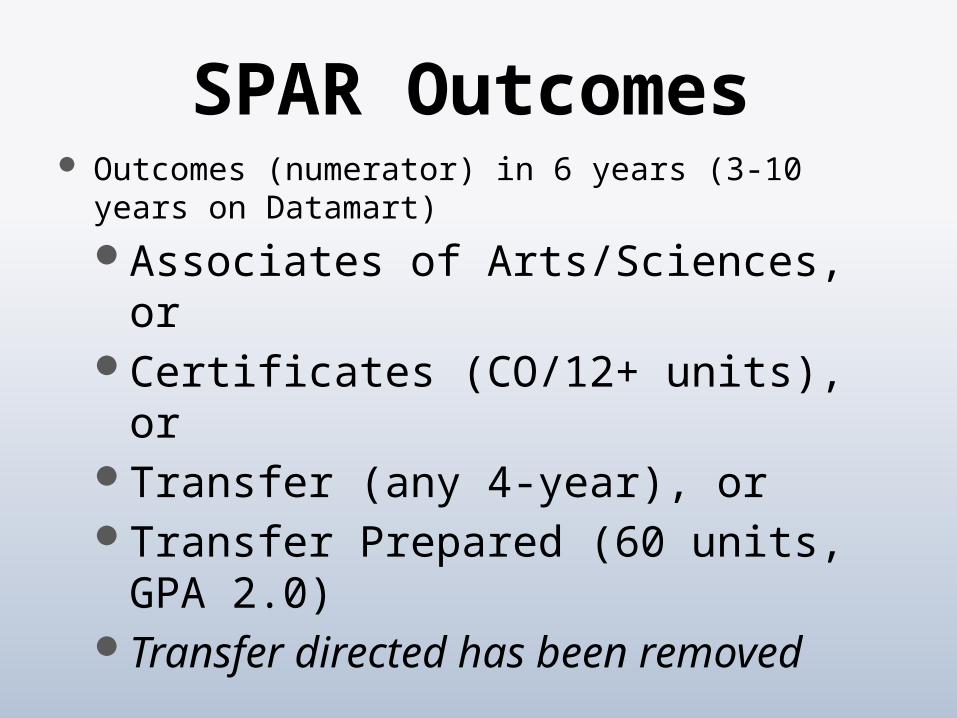
SPAR Outcomes Outcomes (numerator) in 6 years (3-10 years on
Datamart)
Associates of Arts/Sciences, orCertificates (CO/12+ units), orTransfer (any 4-year), or Transfer Prepared (60 units, GPA
2.0) Transfer directed has been removed
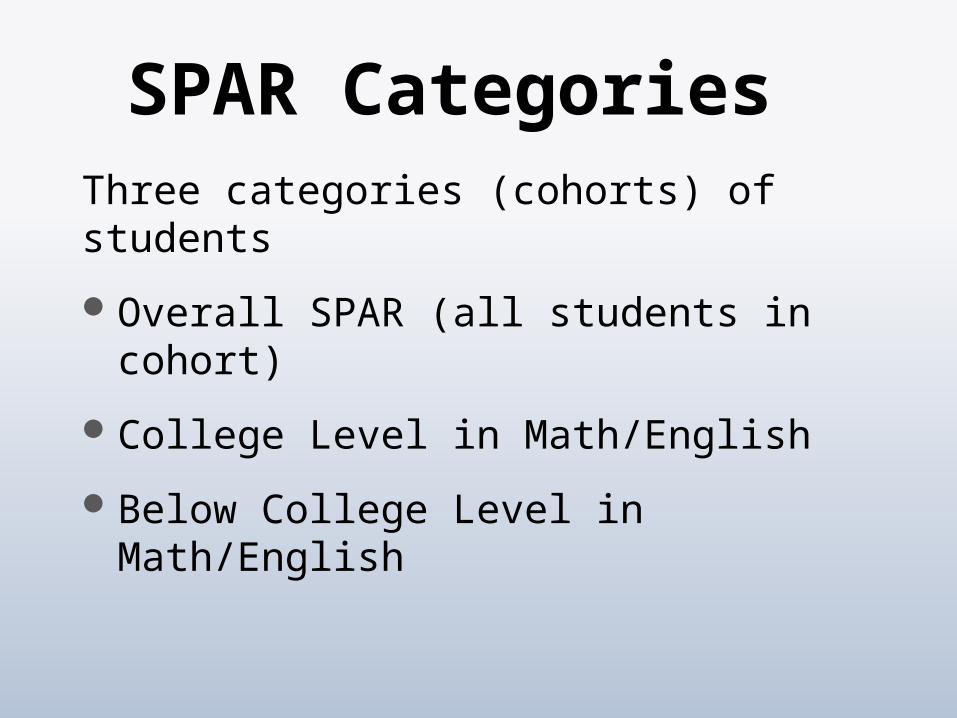
SPAR Categories Three categories (cohorts) of students
Overall SPAR (all students in cohort)
College Level in Math/English
Below College Level in Math/English
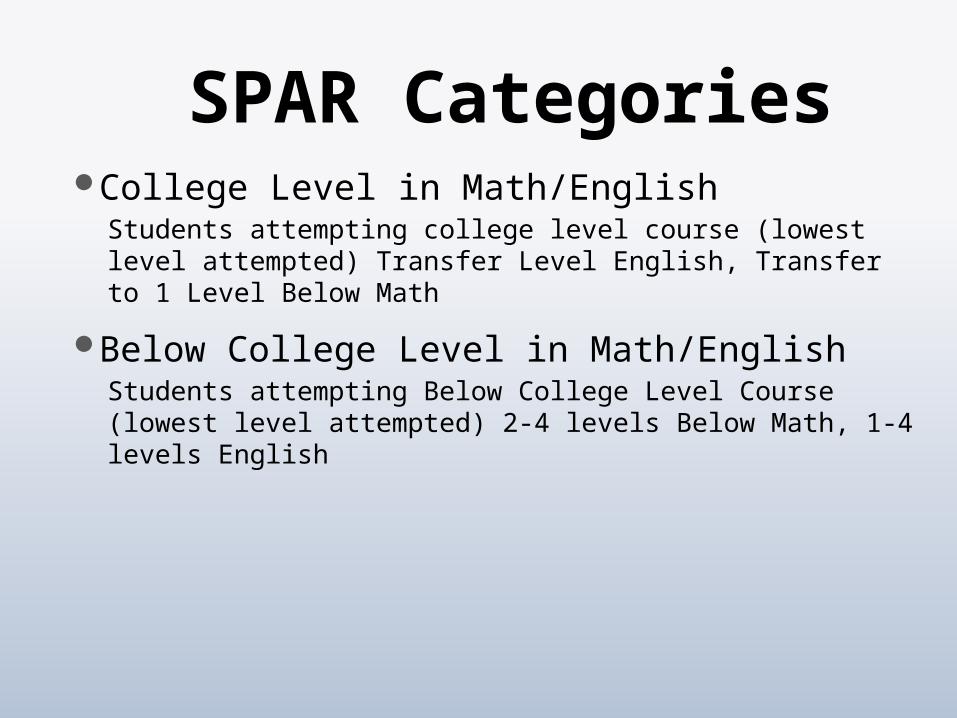
SPAR CategoriesCollege Level in Math/English
Students attempting college level course (lowest level attempted) Transfer Level English, Transfer to 1 Level Below Math
Below College Level in Math/EnglishStudents attempting Below College Level Course (lowest level attempted) 2-4 levels Below Math, 1-4 levels English
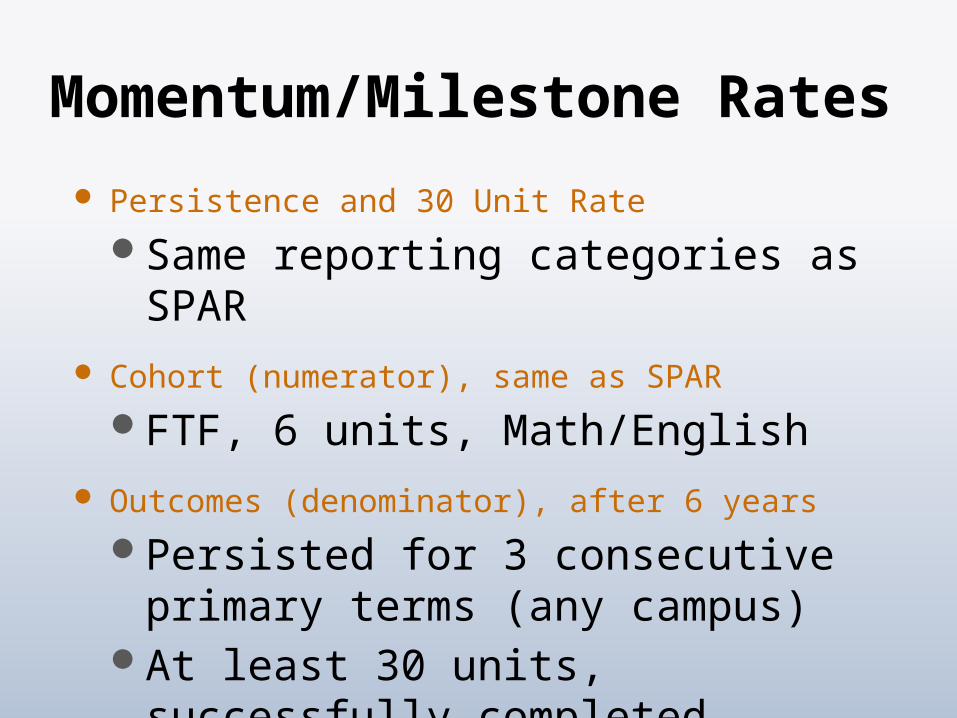
Momentum/Milestone Rates
Persistence and 30 Unit Rate
Same reporting categories as SPAR Cohort (numerator), same as SPAR
FTF, 6 units, Math/English Outcomes (denominator), after 6 years
Persisted for 3 consecutive primary terms (any campus)
At least 30 units, successfully completed
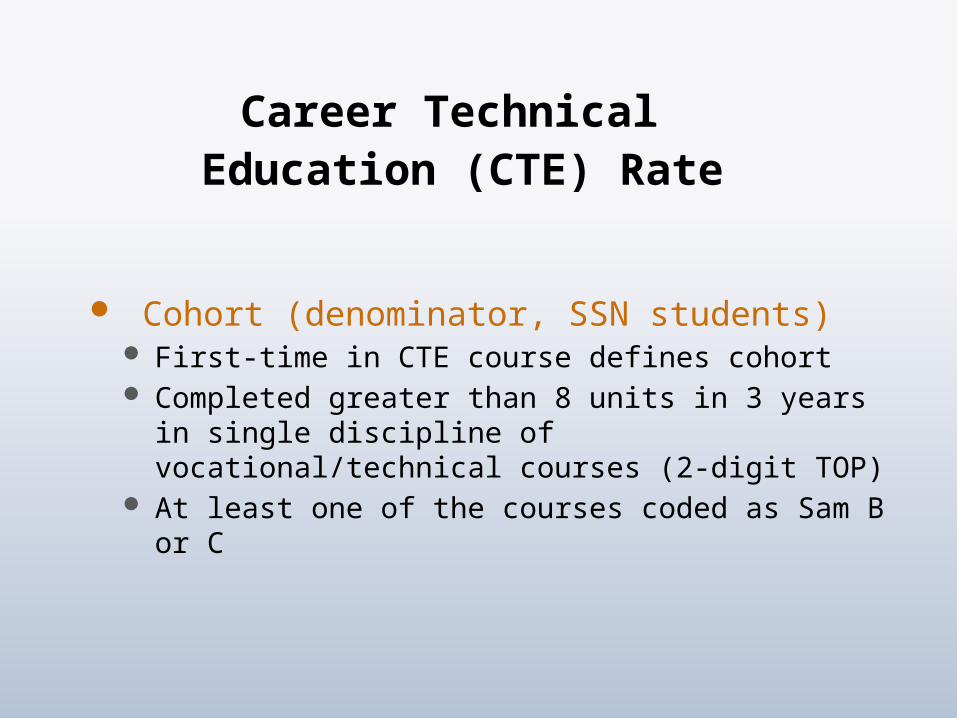
Career Technical Education (CTE) Rate
Cohort (denominator, SSN students) First-time in CTE course defines cohort Completed greater than 8 units in 3 years in
single discipline of vocational/technical courses (2-digit TOP)
At least one of the courses coded as Sam B or C
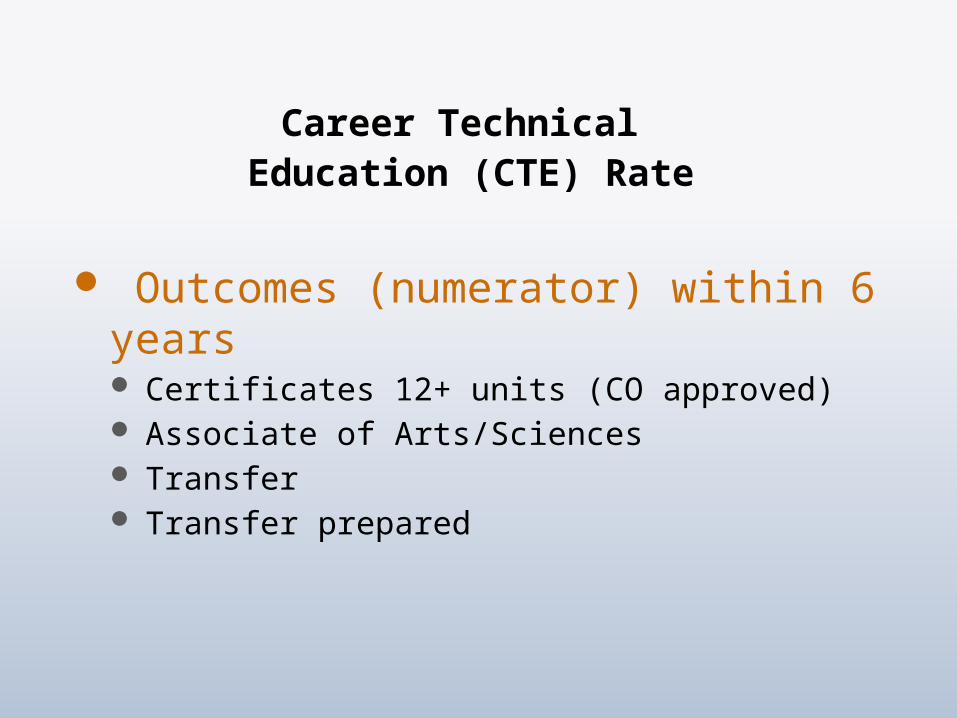
Career Technical Education (CTE) Rate
Outcomes (numerator) within 6 years Certificates 12+ units (CO approved) Associate of Arts/Sciences Transfer Transfer prepared
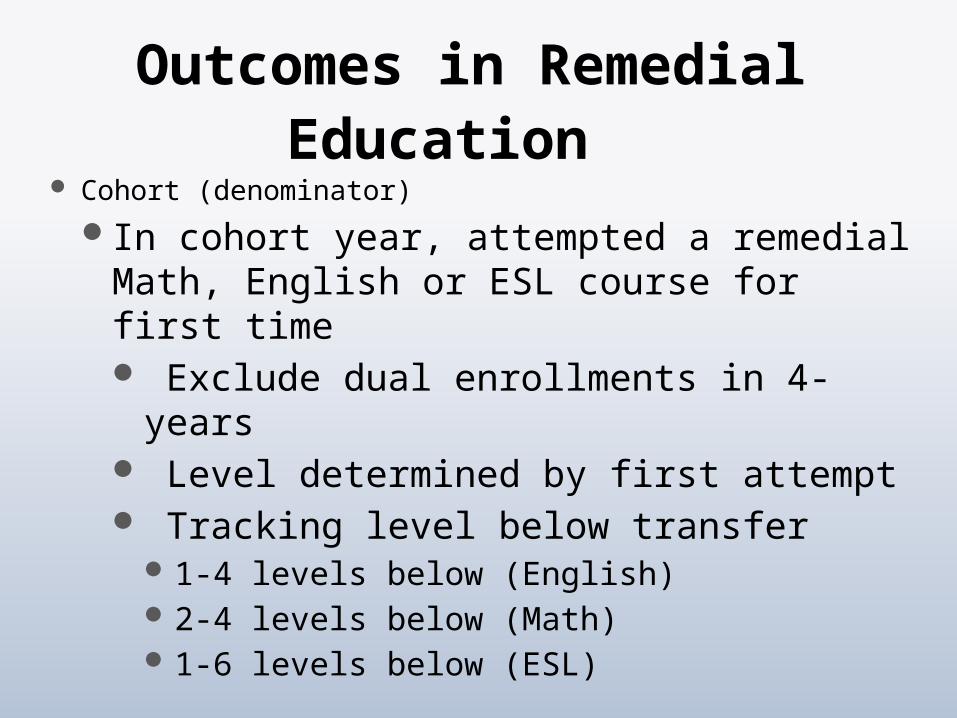
Outcomes in Remedial Education
Cohort (denominator)
In cohort year, attempted a remedial Math, English or ESL course for first time Exclude dual enrollments in 4-years Level determined by first attempt Tracking level below transfer
1-4 levels below (English)2-4 levels below (Math)1-6 levels below (ESL)
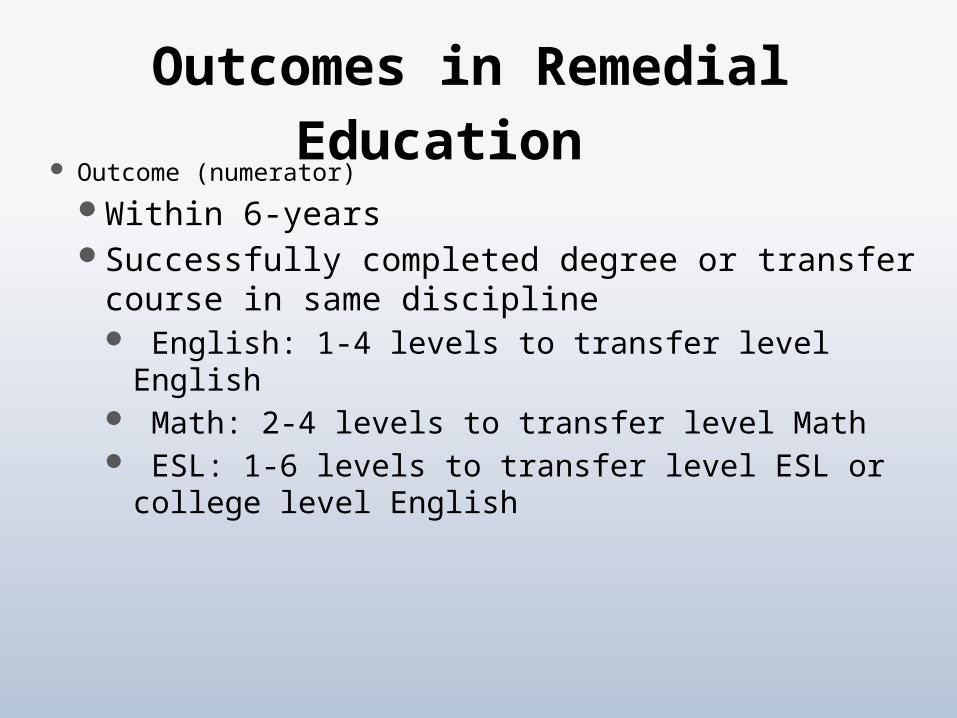
Outcomes in Remedial Education
Outcome (numerator)
Within 6-years Successfully completed degree or transfer
course in same discipline English: 1-4 levels to transfer level English Math: 2-4 levels to transfer level Math ESL: 1-6 levels to transfer level ESL or
college level English
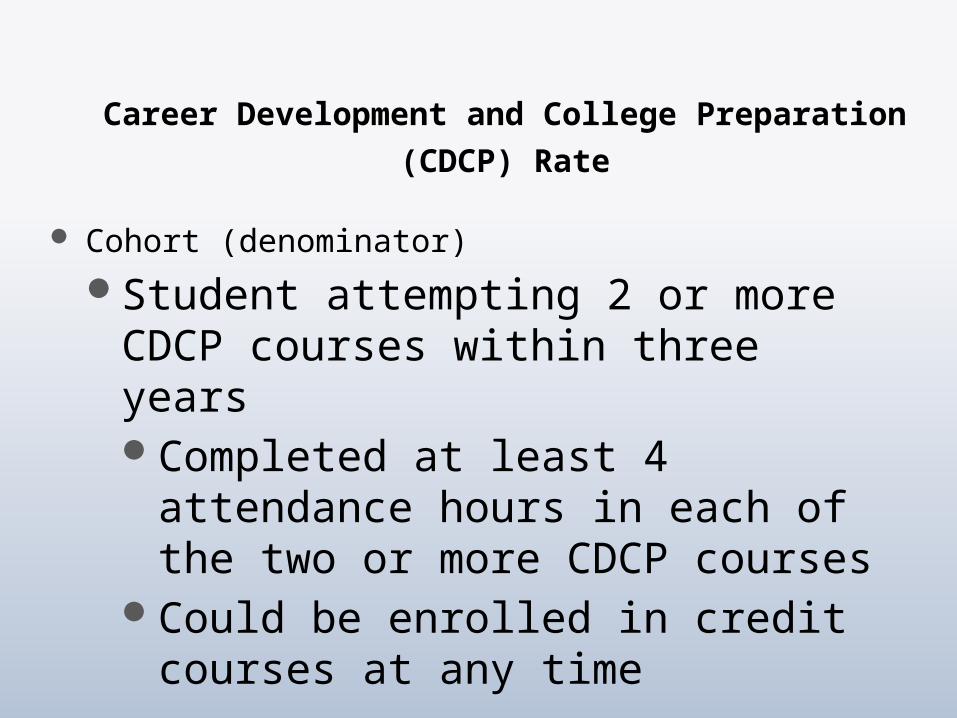
Career Development and College Preparation
(CDCP) Rate
Cohort (denominator)
Student attempting 2 or more CDCP courses within three yearsCompleted at least 4 attendance
hours in each of the two or more CDCP courses
Could be enrolled in credit courses at any time
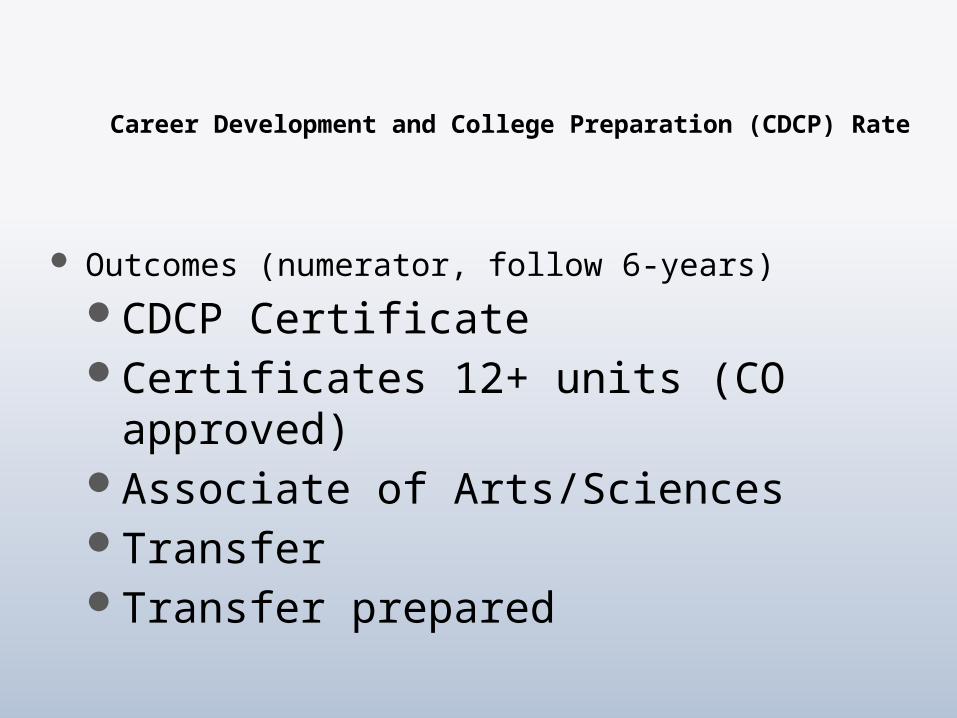
Career Development and College Preparation (CDCP) Rate
Outcomes (numerator, follow 6-years)
CDCP CertificateCertificates 12+ units (CO
approved)Associate of Arts/SciencesTransferTransfer prepared
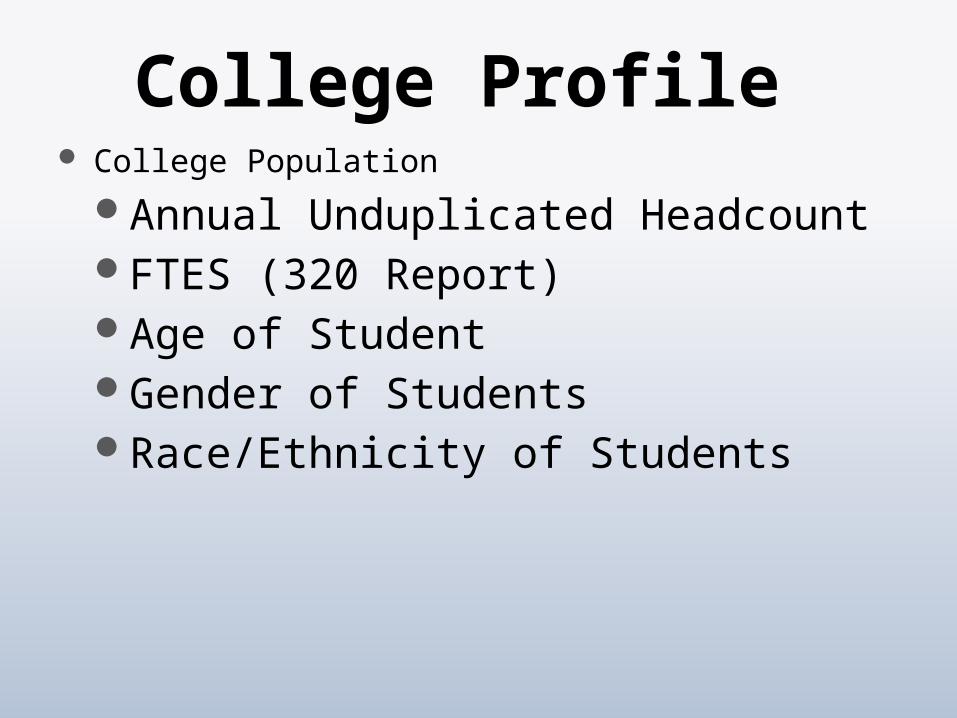
College Profile College Population
Annual Unduplicated HeadcountFTES (320 Report)Age of StudentGender of StudentsRace/Ethnicity of Students
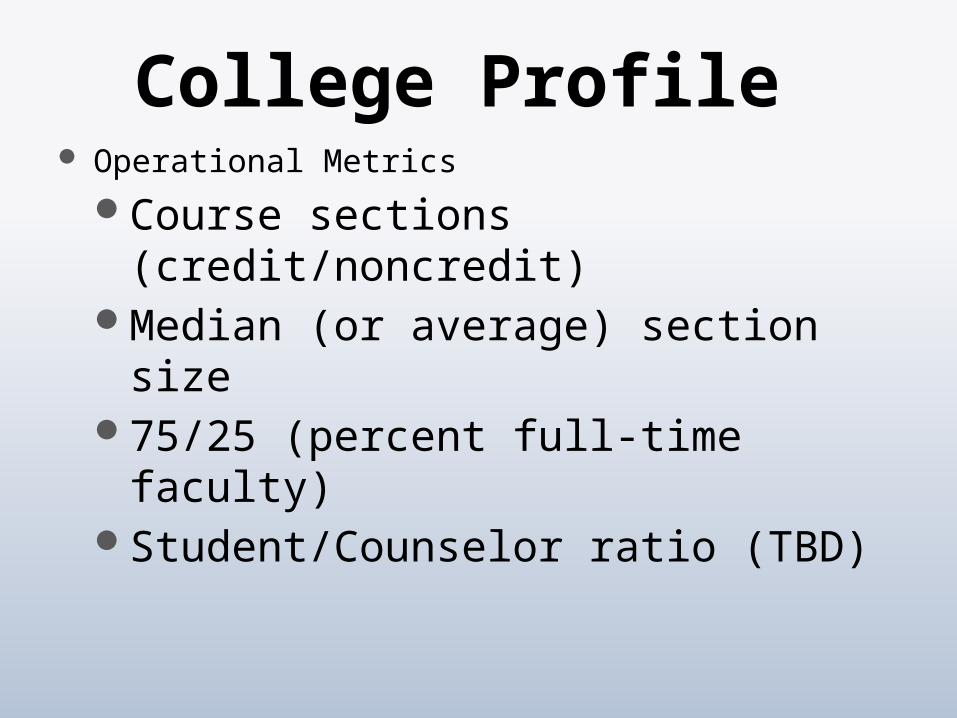
College Profile Operational Metrics
Course sections (credit/noncredit)Median (or average) section size75/25 (percent full-time faculty)Student/Counselor ratio (TBD)
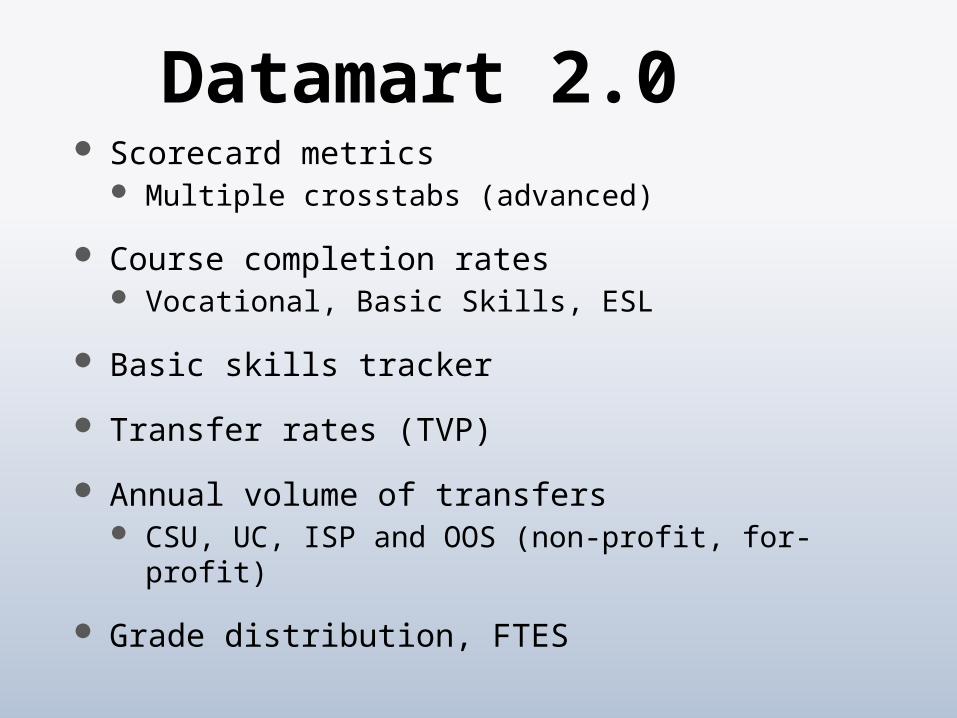
Datamart 2.0 Scorecard metrics
Multiple crosstabs (advanced)
Course completion rates Vocational, Basic Skills, ESL
Basic skills tracker
Transfer rates (TVP)
Annual volume of transfers CSU, UC, ISP and OOS (non-profit, for-profit)
Grade distribution, FTES
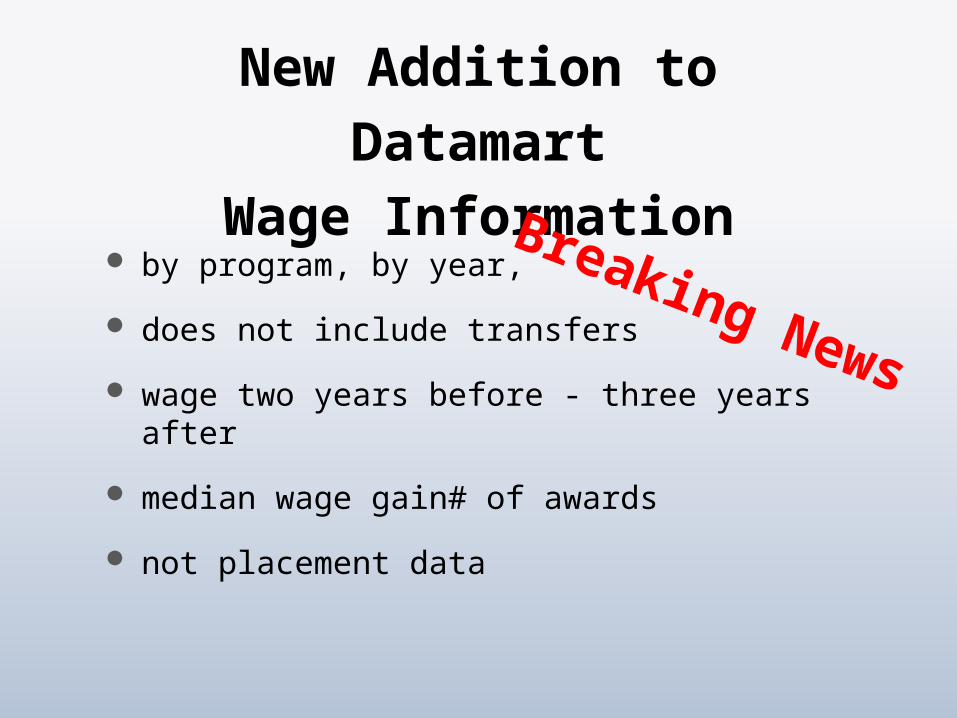
New Addition to Datamart
Wage Information by program, by year,
does not include transfers
wage two years before - three years after
median wage gain# of awards
not placement data
Breaking News
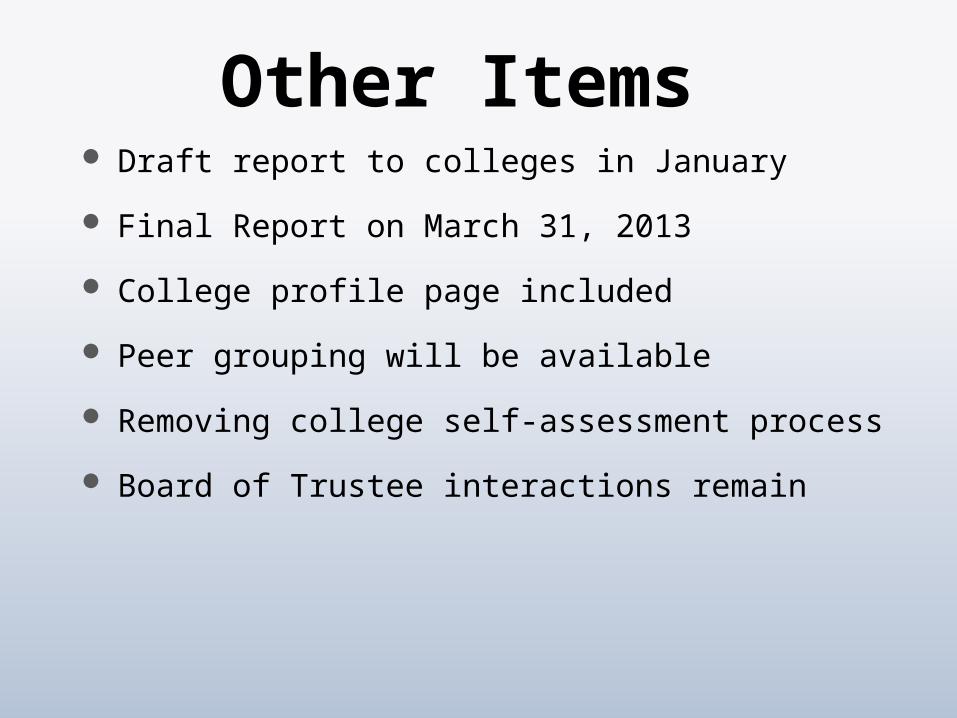
Other Items Draft report to colleges in January
Final Report on March 31, 2013
College profile page included
Peer grouping will be available
Removing college self-assessment process
Board of Trustee interactions remain