Cincinnati Tableau User Group Event #8 (Mapping)
36
Tableau USER GROUP CINCINNATI Event #8 – Mapping!
-
Upload
russell-spangler -
Category
Data & Analytics
-
view
815 -
download
0
Transcript of Cincinnati Tableau User Group Event #8 (Mapping)

Tableau USER GROUP
CINCINNATIEvent #8 – Mapping!
2
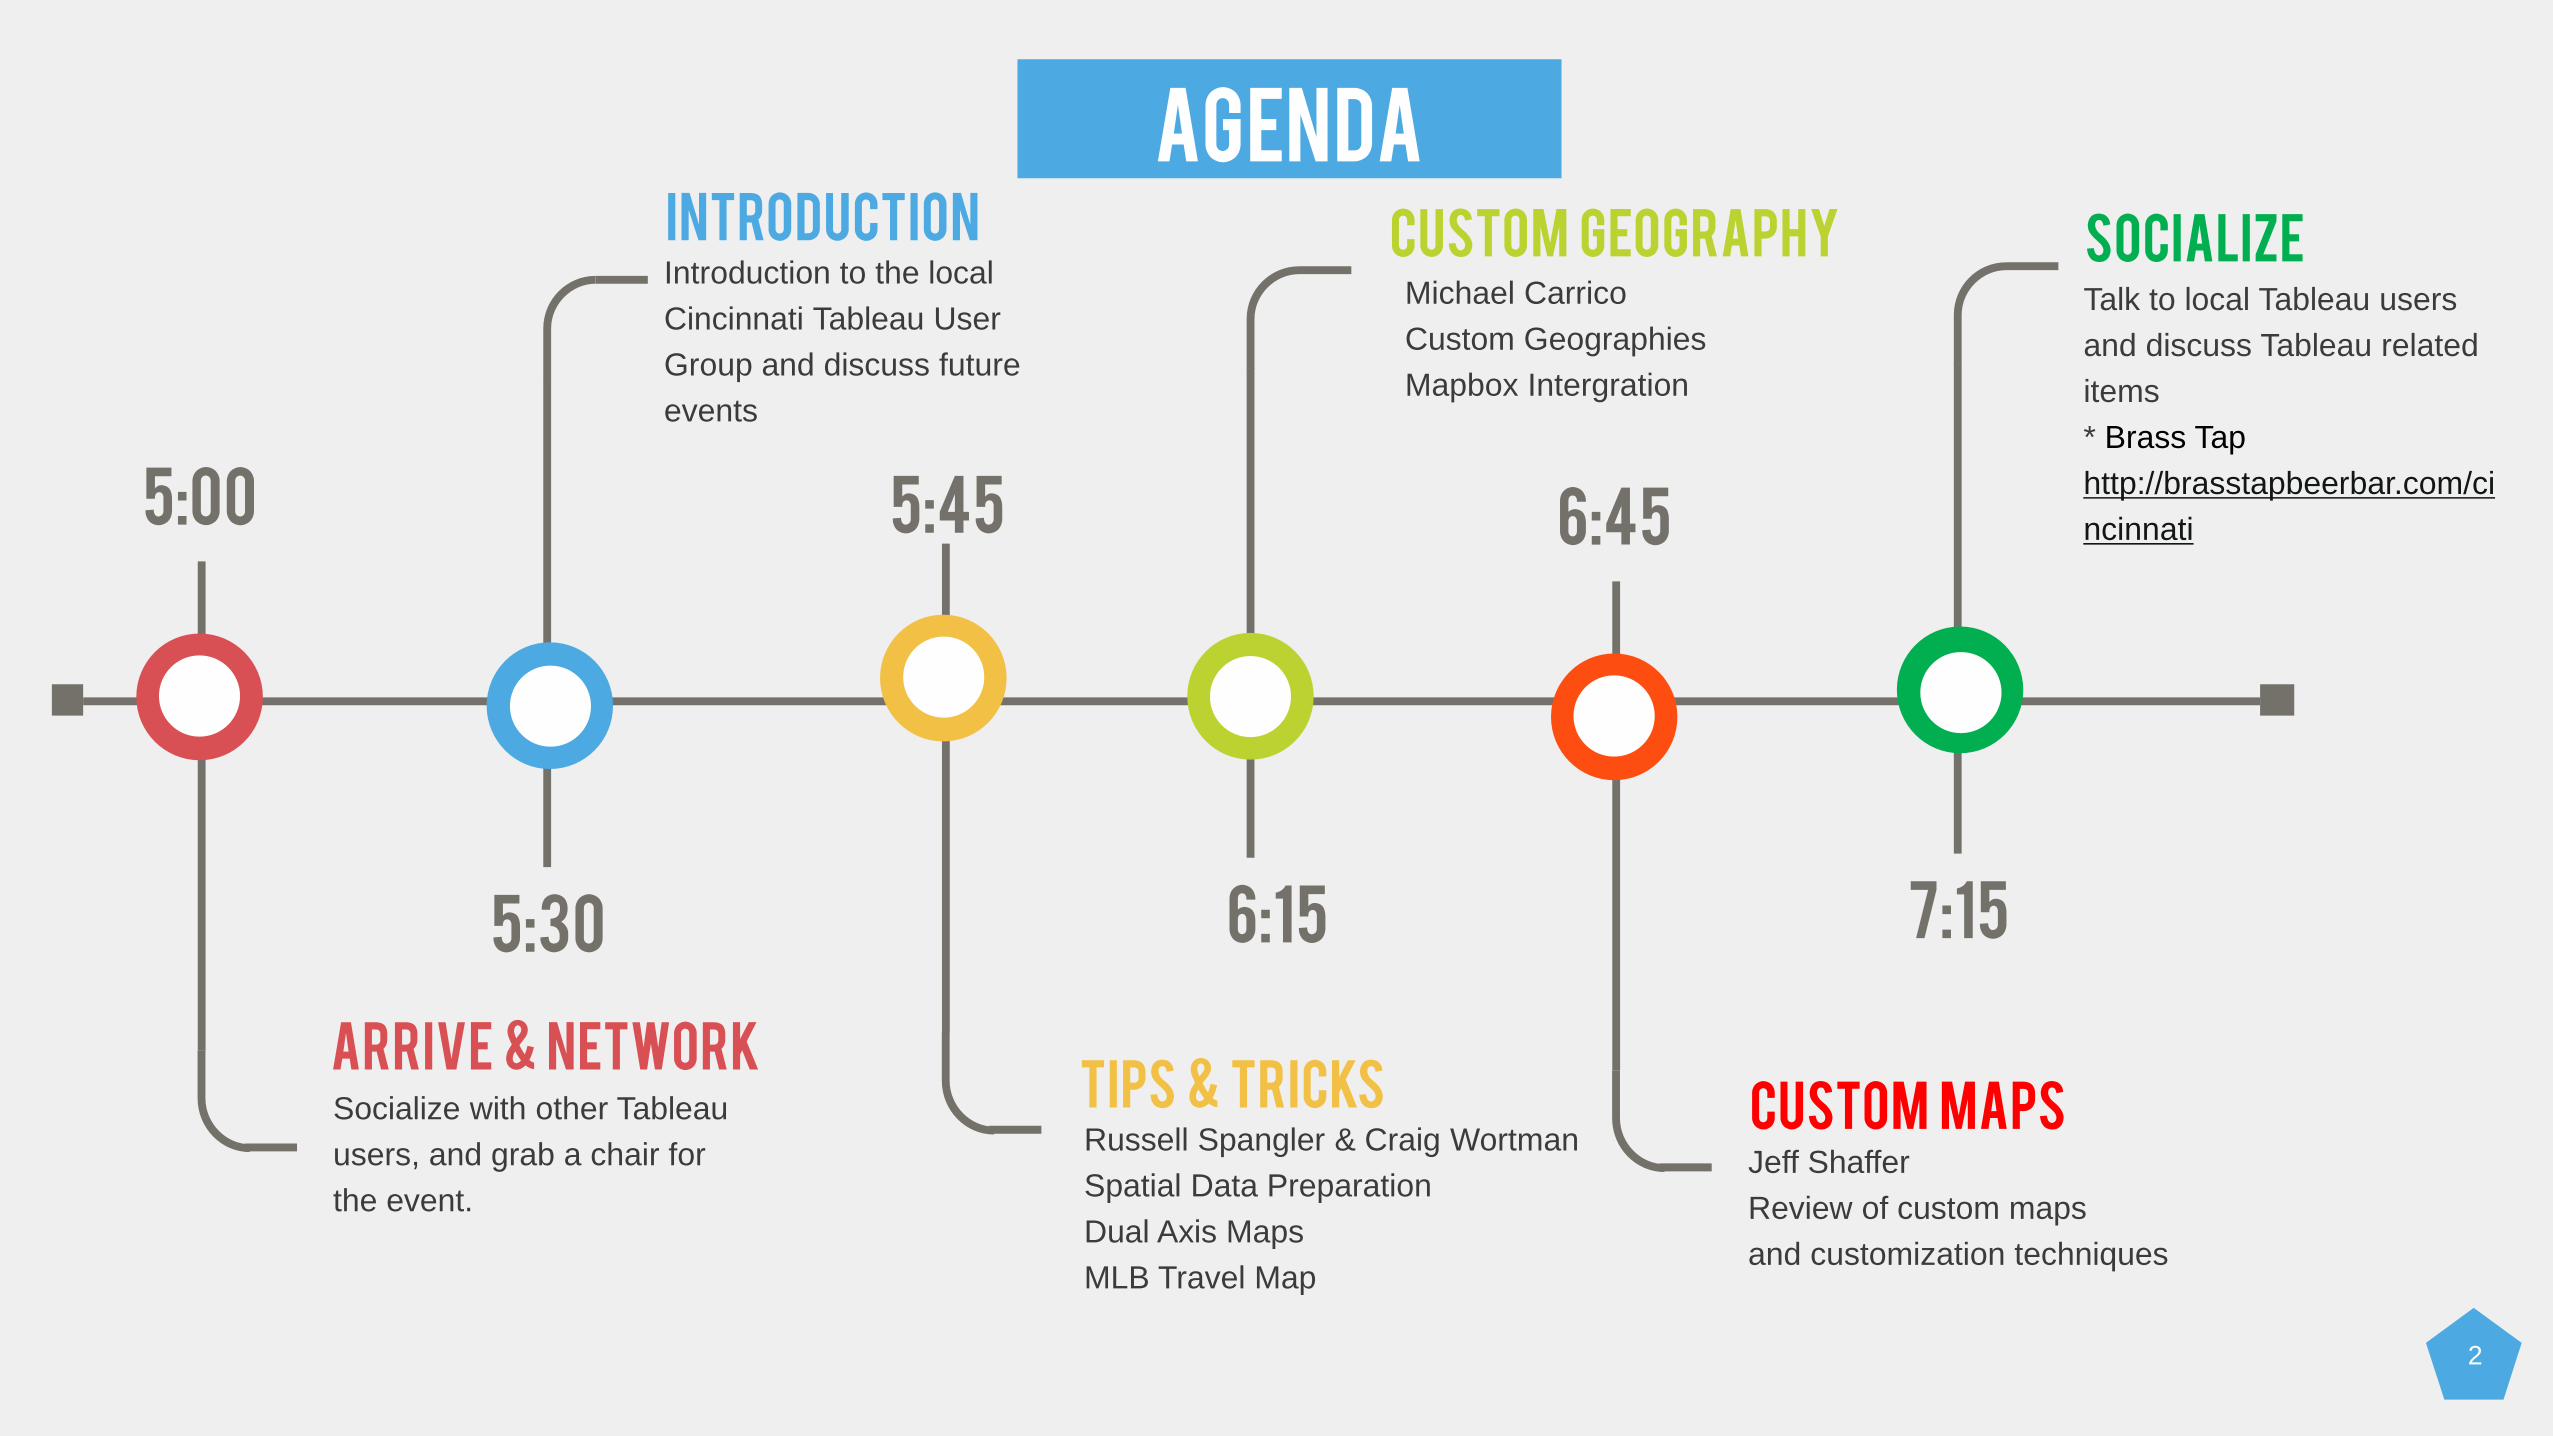
ARRIVE & NETWORK
Socialize with other Tableau
users, and grab a chair for
the event.
TIPS & TRICKS
Russell Spangler & Craig Wortman
Spatial Data Preparation
Dual Axis Maps
MLB Travel Map
CUSTOM GEOGRAPHY
Michael Carrico
Custom Geographies
Mapbox Intergration
AGENDA
5:0o
Introduction to the local
Cincinnati Tableau User
Group and discuss future
events
INTRODUCTION
5:30
5:45
6:15
6:45
SOCIALIZE
Talk to local Tableau users
and discuss Tableau related
items
* Brass Tap
http://brasstapbeerbar.com/ci
ncinnati
7:15
CUSTOM MAPS
Jeff Shaffer
Review of custom maps
and customization techniques
3
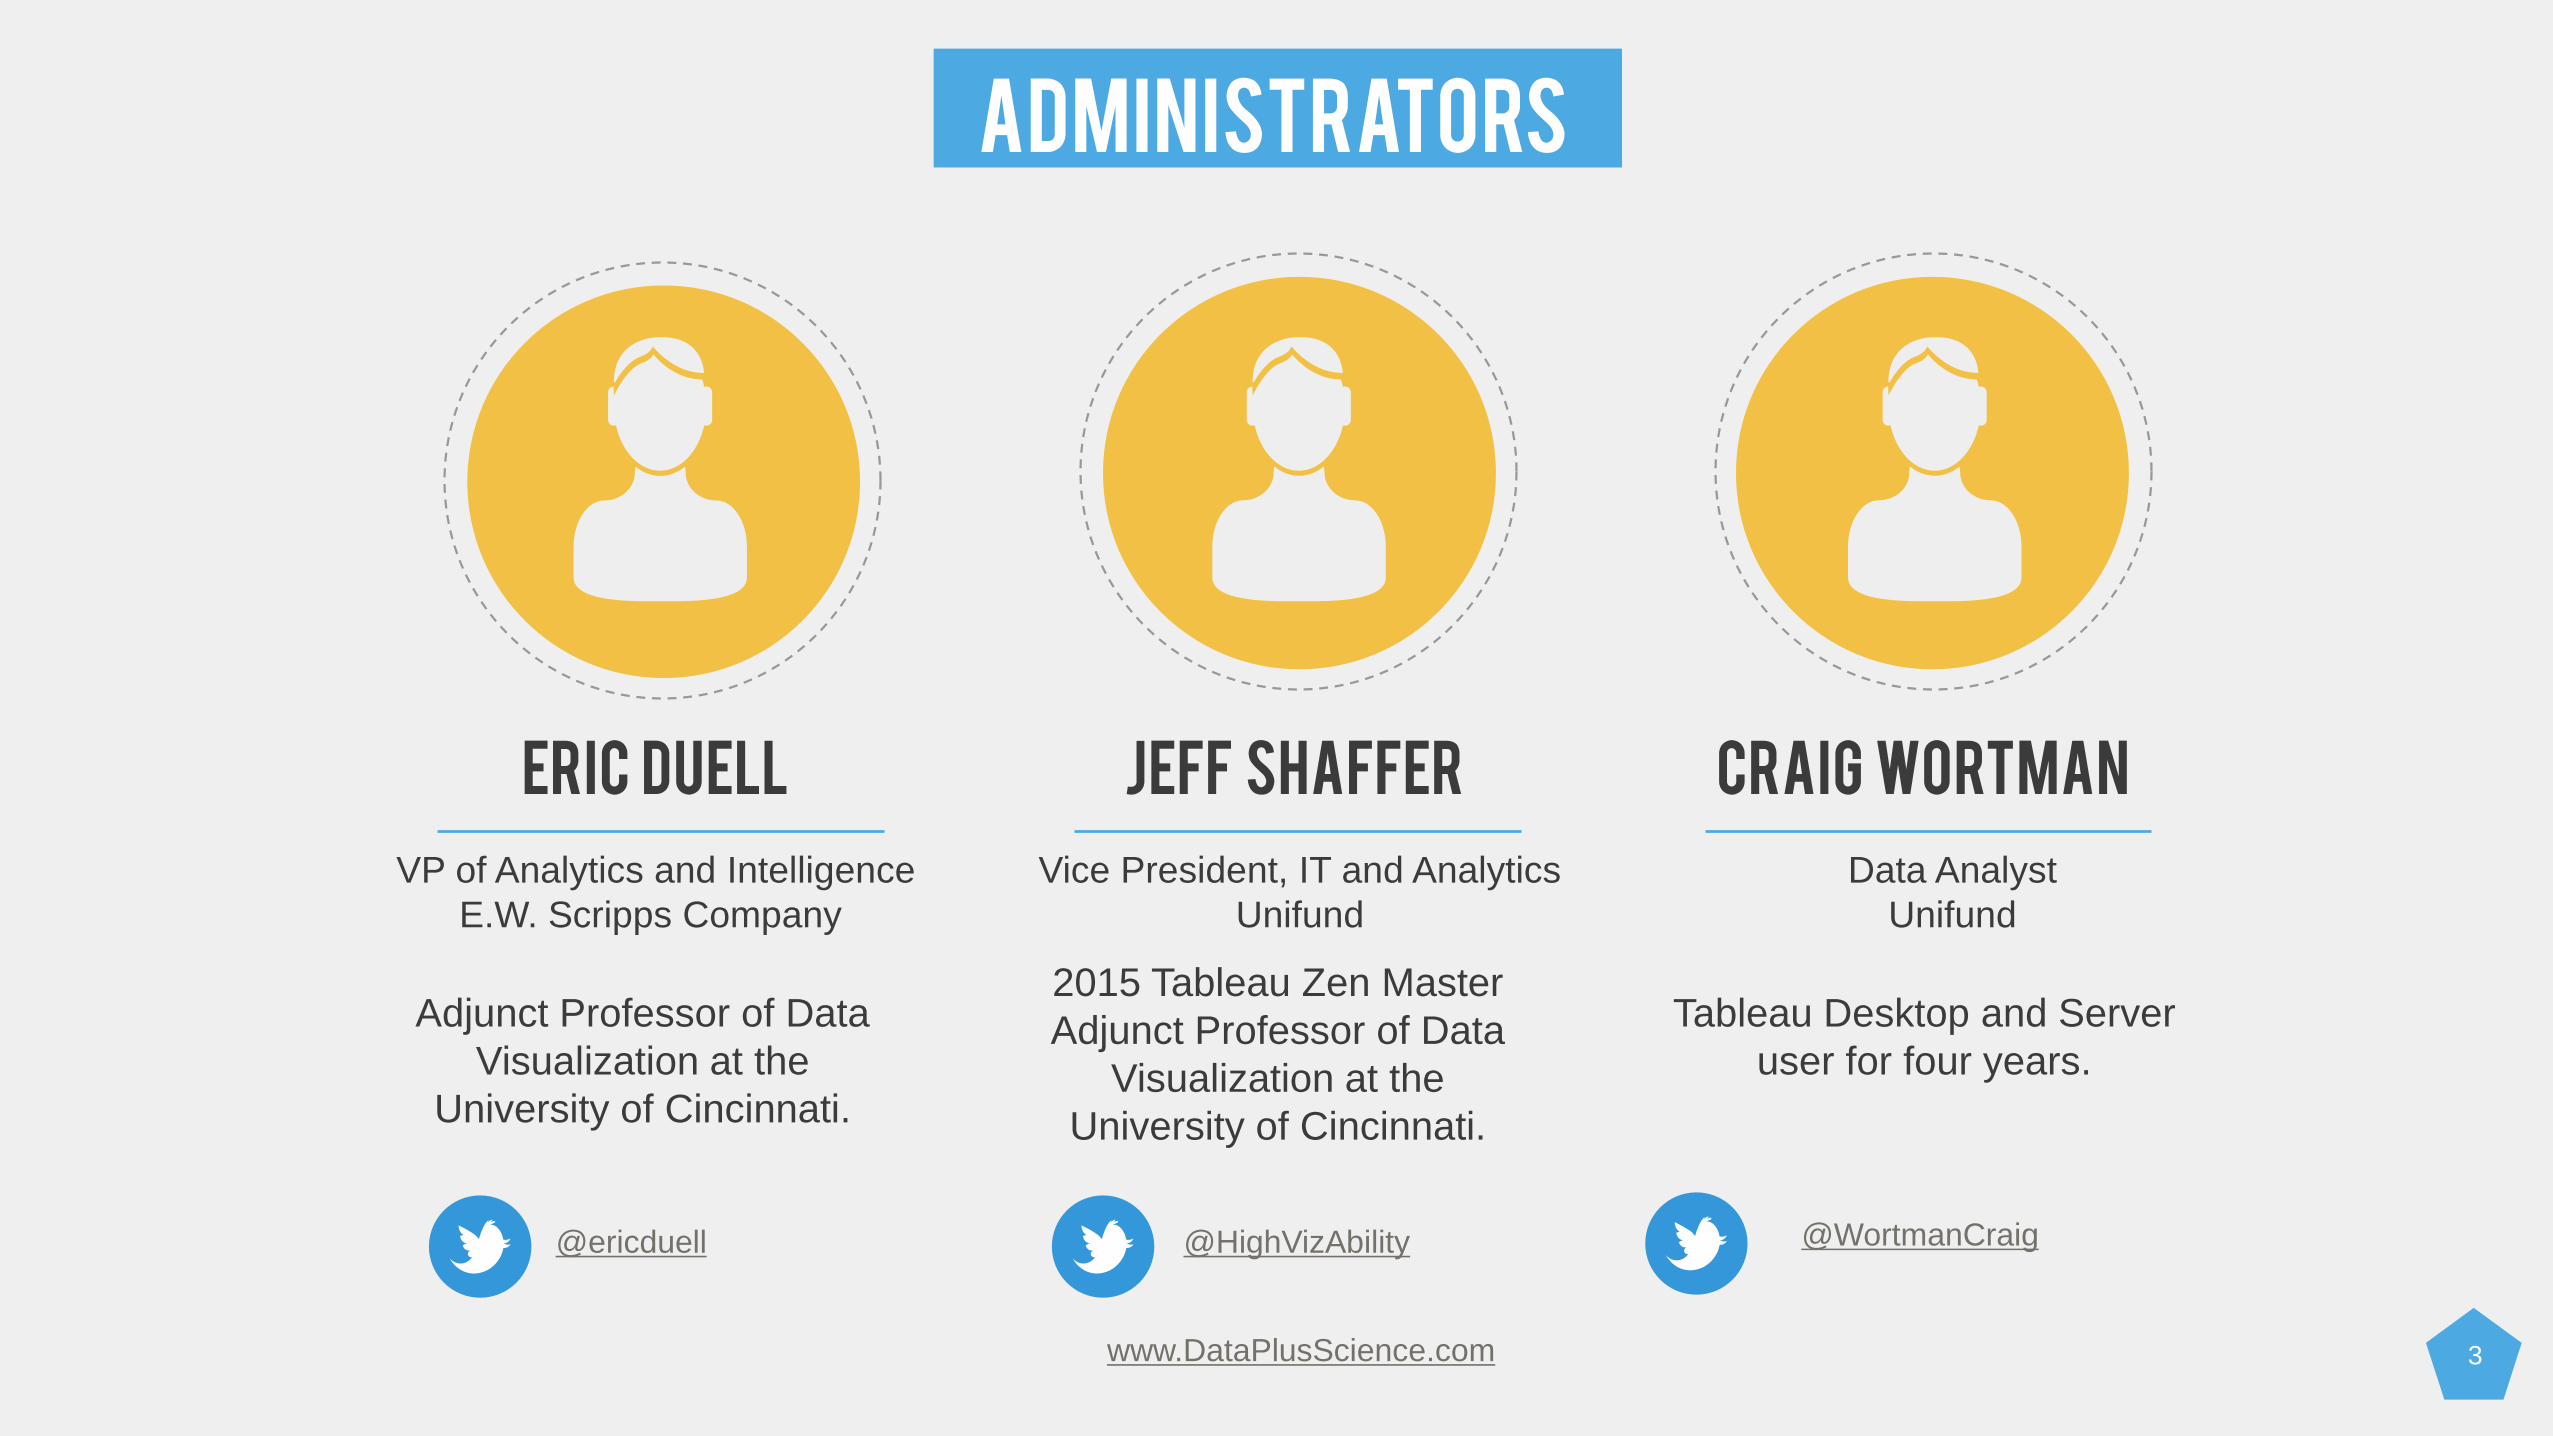
Administrators
ERIC DUELL JEFF SHAFFER CRAIG WORTMAN
VP of Analytics and Intelligence
E.W. Scripps Company
Vice President, IT and Analytics
Unifund
Data Analyst
Unifund
Adjunct Professor of Data
Visualization at the
University of Cincinnati.
2015 Tableau Zen Master
Adjunct Professor of Data
Visualization at the
University of Cincinnati.
Tableau Desktop and Server
user for four years.
@ericduell @HighVizAbility @WortmanCraig
www.DataPlusScience.com

4
GROUP LEADER
@russellspangler [email protected]/in/russellspangler/
RUSSELL SPANGLER
Sr. Manager, Data Visualization
Senior Manager, Data Visualization at
Convergys. Adjunct Professor for Data
Management at the University of Cincinnati.
Master of Science and Bachelor of Science in
Information Systems. Tableau Server
administrator and Tableau desktop user for
about 5 Years.

5
JOIN US
You Should Join The Cincinnati Tableau User Group
- Abraham Lincoln
Please Join The Cincinnati
User Group Pagehttp://community.tableau.com/groups/midwest
Search for “Cincinnati Tableau User Group”
6
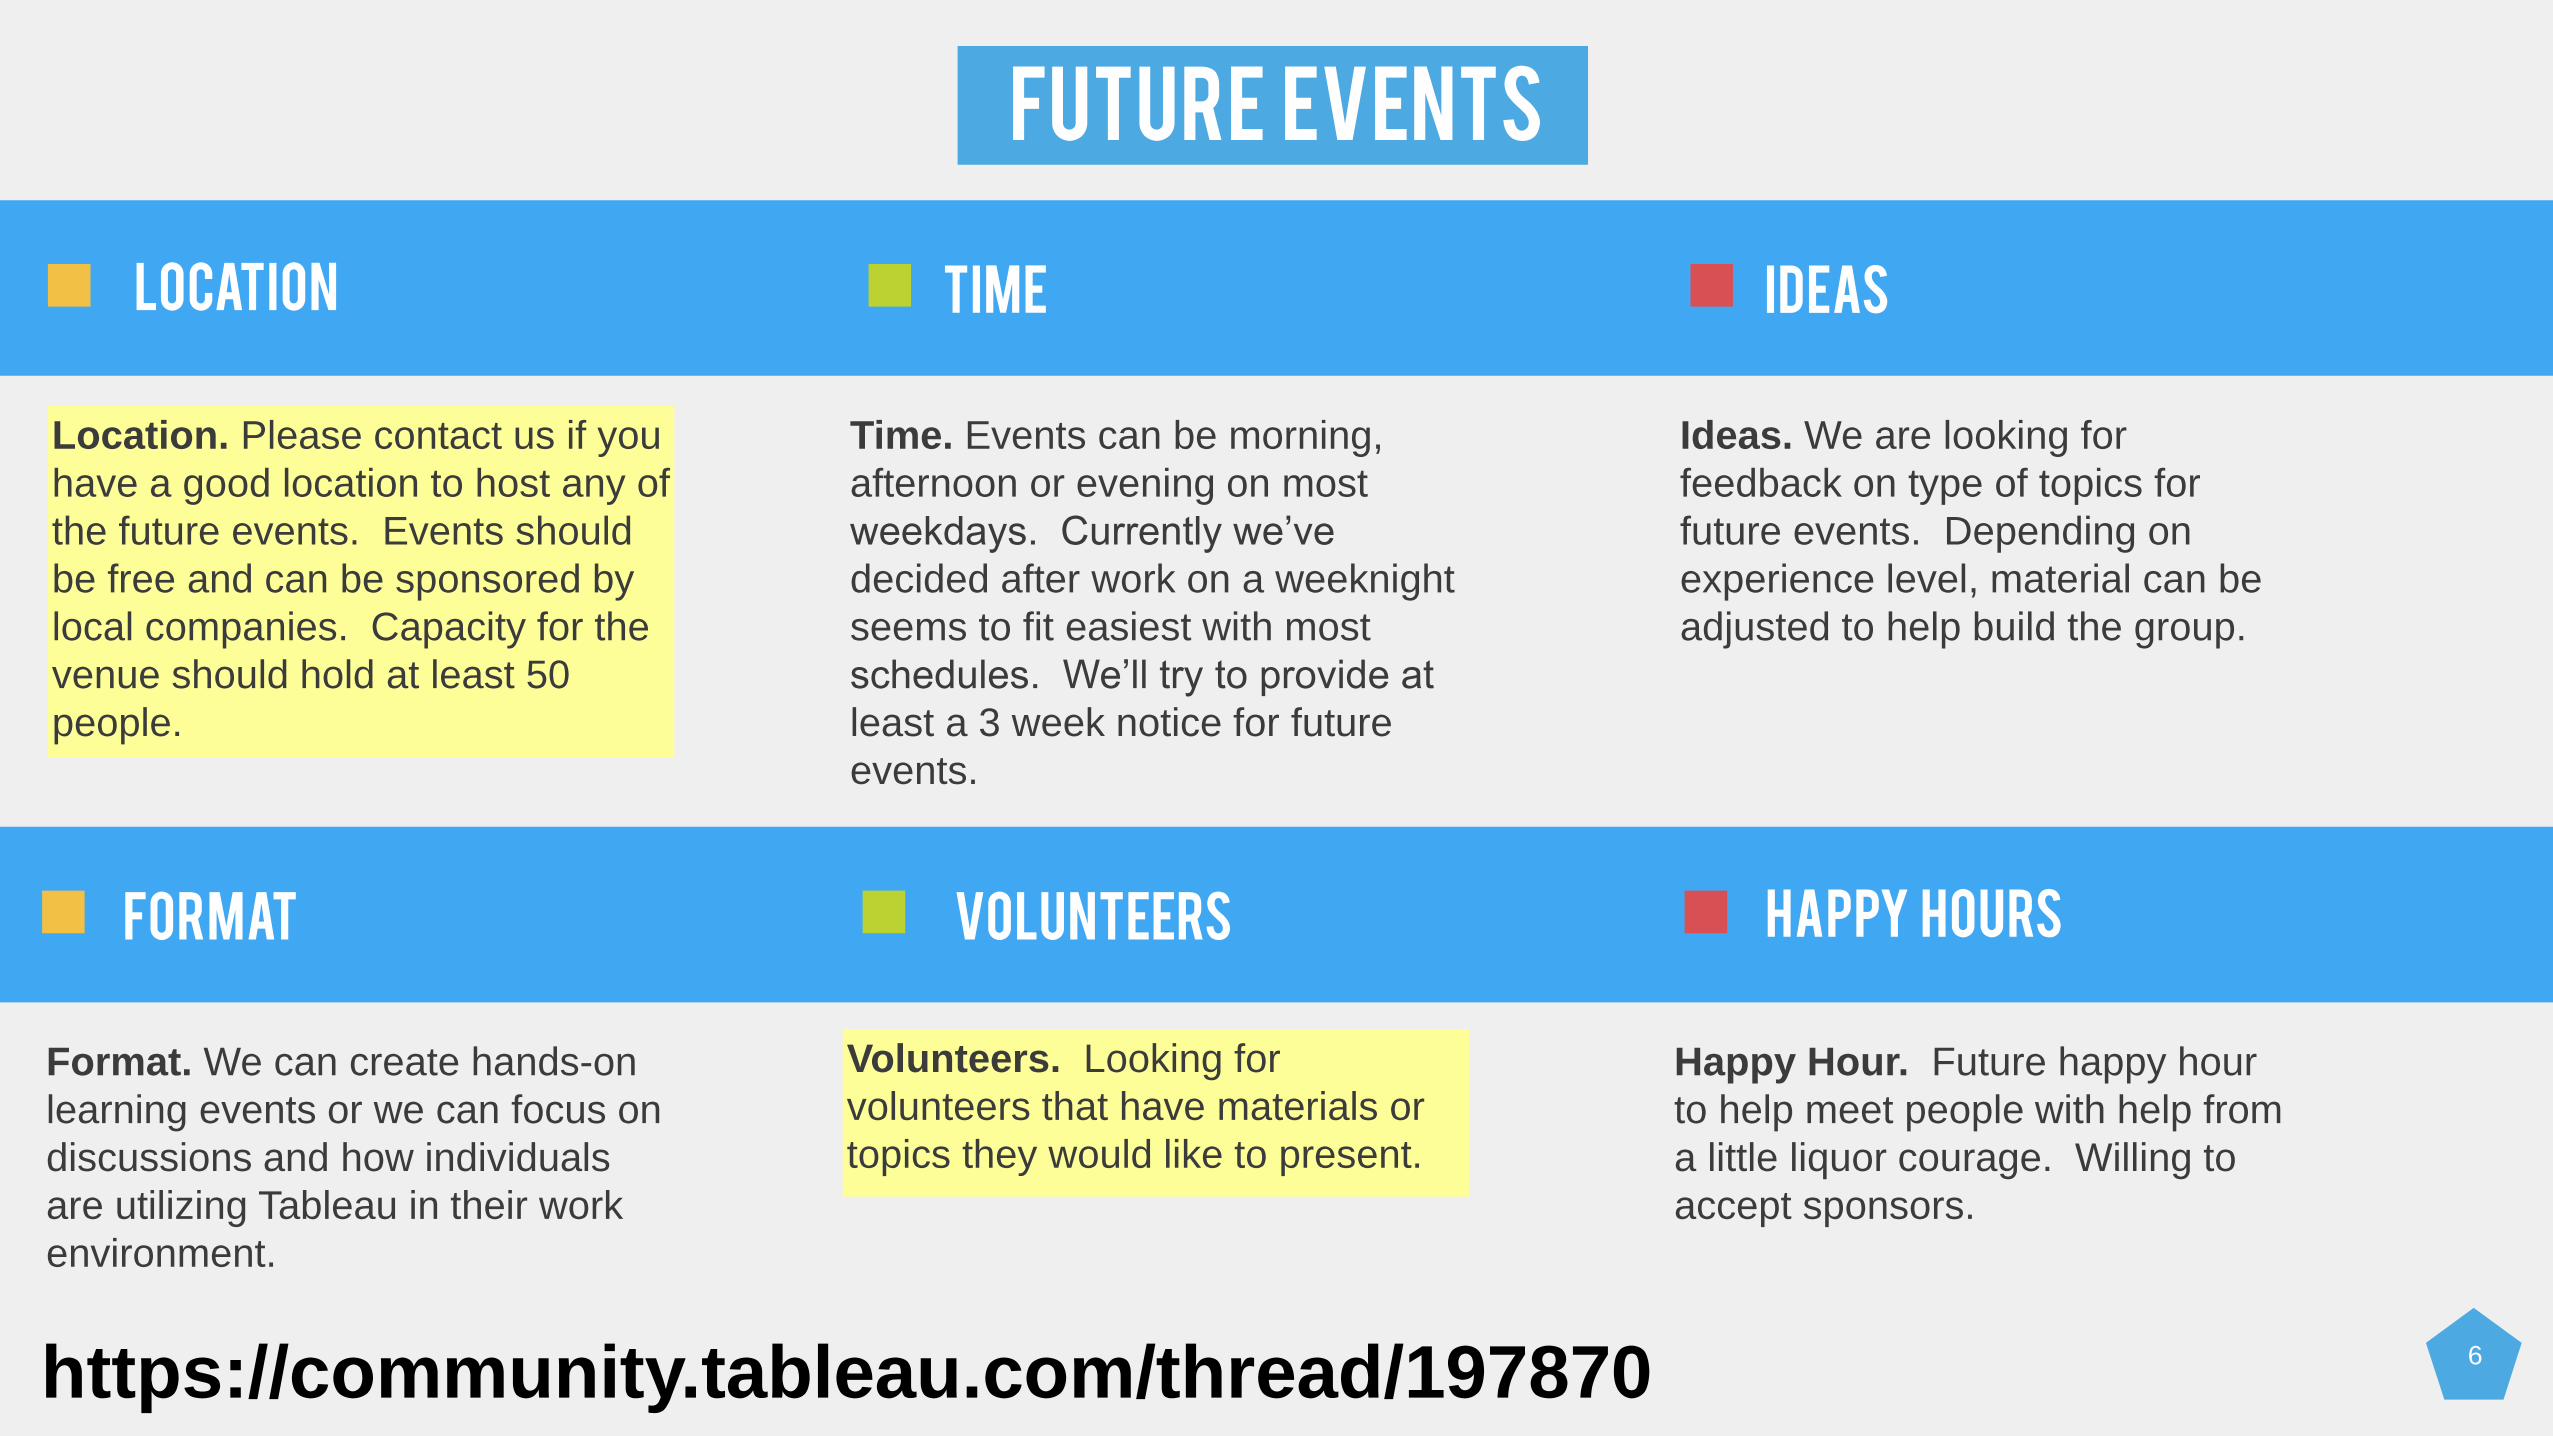
FUTURE EVENTS
Location. Please contact us if you
have a good location to host any of
the future events. Events should
be free and can be sponsored by
local companies. Capacity for the
venue should hold at least 50
people.
Time. Events can be morning,
afternoon or evening on most
weekdays. Currently we’ve
decided after work on a weeknight
seems to fit easiest with most
schedules. We’ll try to provide at
least a 3 week notice for future
events.
Ideas. We are looking for
feedback on type of topics for
future events. Depending on
experience level, material can be
adjusted to help build the group.
Location TIME IDEAS
Format. We can create hands-on
learning events or we can focus on
discussions and how individuals
are utilizing Tableau in their work
environment.
Volunteers. Looking for
volunteers that have materials or
topics they would like to present.
Happy Hour. Future happy hour
to help meet people with help from
a little liquor courage. Willing to
accept sponsors.
FORMAT VOLUNTEERS HAPPY HOURS
https://community.tableau.com/thread/197870

USER GROUP ITEMS
• Email schedule • Tableau’s official initial email (usually 3-4 days after Eventbrite page setup)
• Tableau customers within the Cincinnati area (email sent to the email on your license)
• User group email (sent to users in the group)
• Reminder email to attendees prior to the event (Eventbrite)
• Not receiving emails or would like to receive emails• Join the user group page (emails will be sent directly to user group members)
• Connect with us (admins) on LinkedIn or follow users on Twitter
• Periodically check the Cincinnati user group page.
• Forum Posts• Tableau implemented a “moderator” system for forum posts
• Posts can be delayed until verified by Tableau forum moderators, URL links will usually
trigger a post to be reviewed
• Feedback• Please send me feedback, ideas, and topics for future events
7

UPCOMING EVENTS
Local area events: http://community.tableau.com/thread/159183
Alteryx Cincinnati User Group • Wednesday, March 16th, 2016
Northern Kentucky University – University Center, Budig Theater
• https://www.eventbrite.com/e/alteryx-cincinnati-user-group-
meeting-no-3-tickets-21719125489
8

UC EVENTS
Predictive Analytics Day – Monday February 29th (next week)
• Disney: Predictive analytics usage at Disney
• SAS: Roadmap of predictive analytics from SAS
• Sports analytics: Lunch panel Cincinnati Reds, Cincinnati Bengals, and UC
Bearcats
• Afternoon solutions and tutorials from SAS, ThinkVine and FICO
Registration at http://regonline.com/predictive-analytics
Two-Day Training Courses
March 10-11 “Analytics in Excel”
April 7-8 “Introduction to R”
April 21-22 “Tableau Training” http://regonline.com/tableau3This two-day Tableau workshop will cover beginner, intermediate and advanced topics.
The course will be taught by Jeffrey Shaffer, a Tableau Zen Master
9

UC AnALYTICS SUMMIT
Analytics Summit 2016 Friday, May 20th @Sharonville Convention Center
The summit will feature two exceptional keynote speakers and all-day
industry focused analytics track sessions including Retail, Healthcare,
Supply Chain, and Finance
Thornton May, Author, Educator & Futurist
Jude Schramm, Chief Information Officer, Digital for GE Aviation
All classes and events open to the public. For more information
about the Center, classes, and events visit
business.uc.edu/analytics-center
10

11
NEXT EVENT(possible MARCH EVENT- NOT SCHEDULED YET)
Thursday April 28th
Fifth Third in Madisonville
Financial data topics!
More details will be posted to the user group website
http://community.tableau.com/groups/midwest

12MAPPING BASICS

TERMINOLOGY
• Spatial data (aka geospatial data or geographic information)
Information about the locations and shapes of geographic features and the
relationships between them, usually stored as coordinates and topology.
Any data that can be mapped.
• Cartography
The study and practice of making maps. Combining science, aesthetics,
and technique, cartography builds on the premise that reality can be
modeled in ways that communicate spatial information effectively.
13
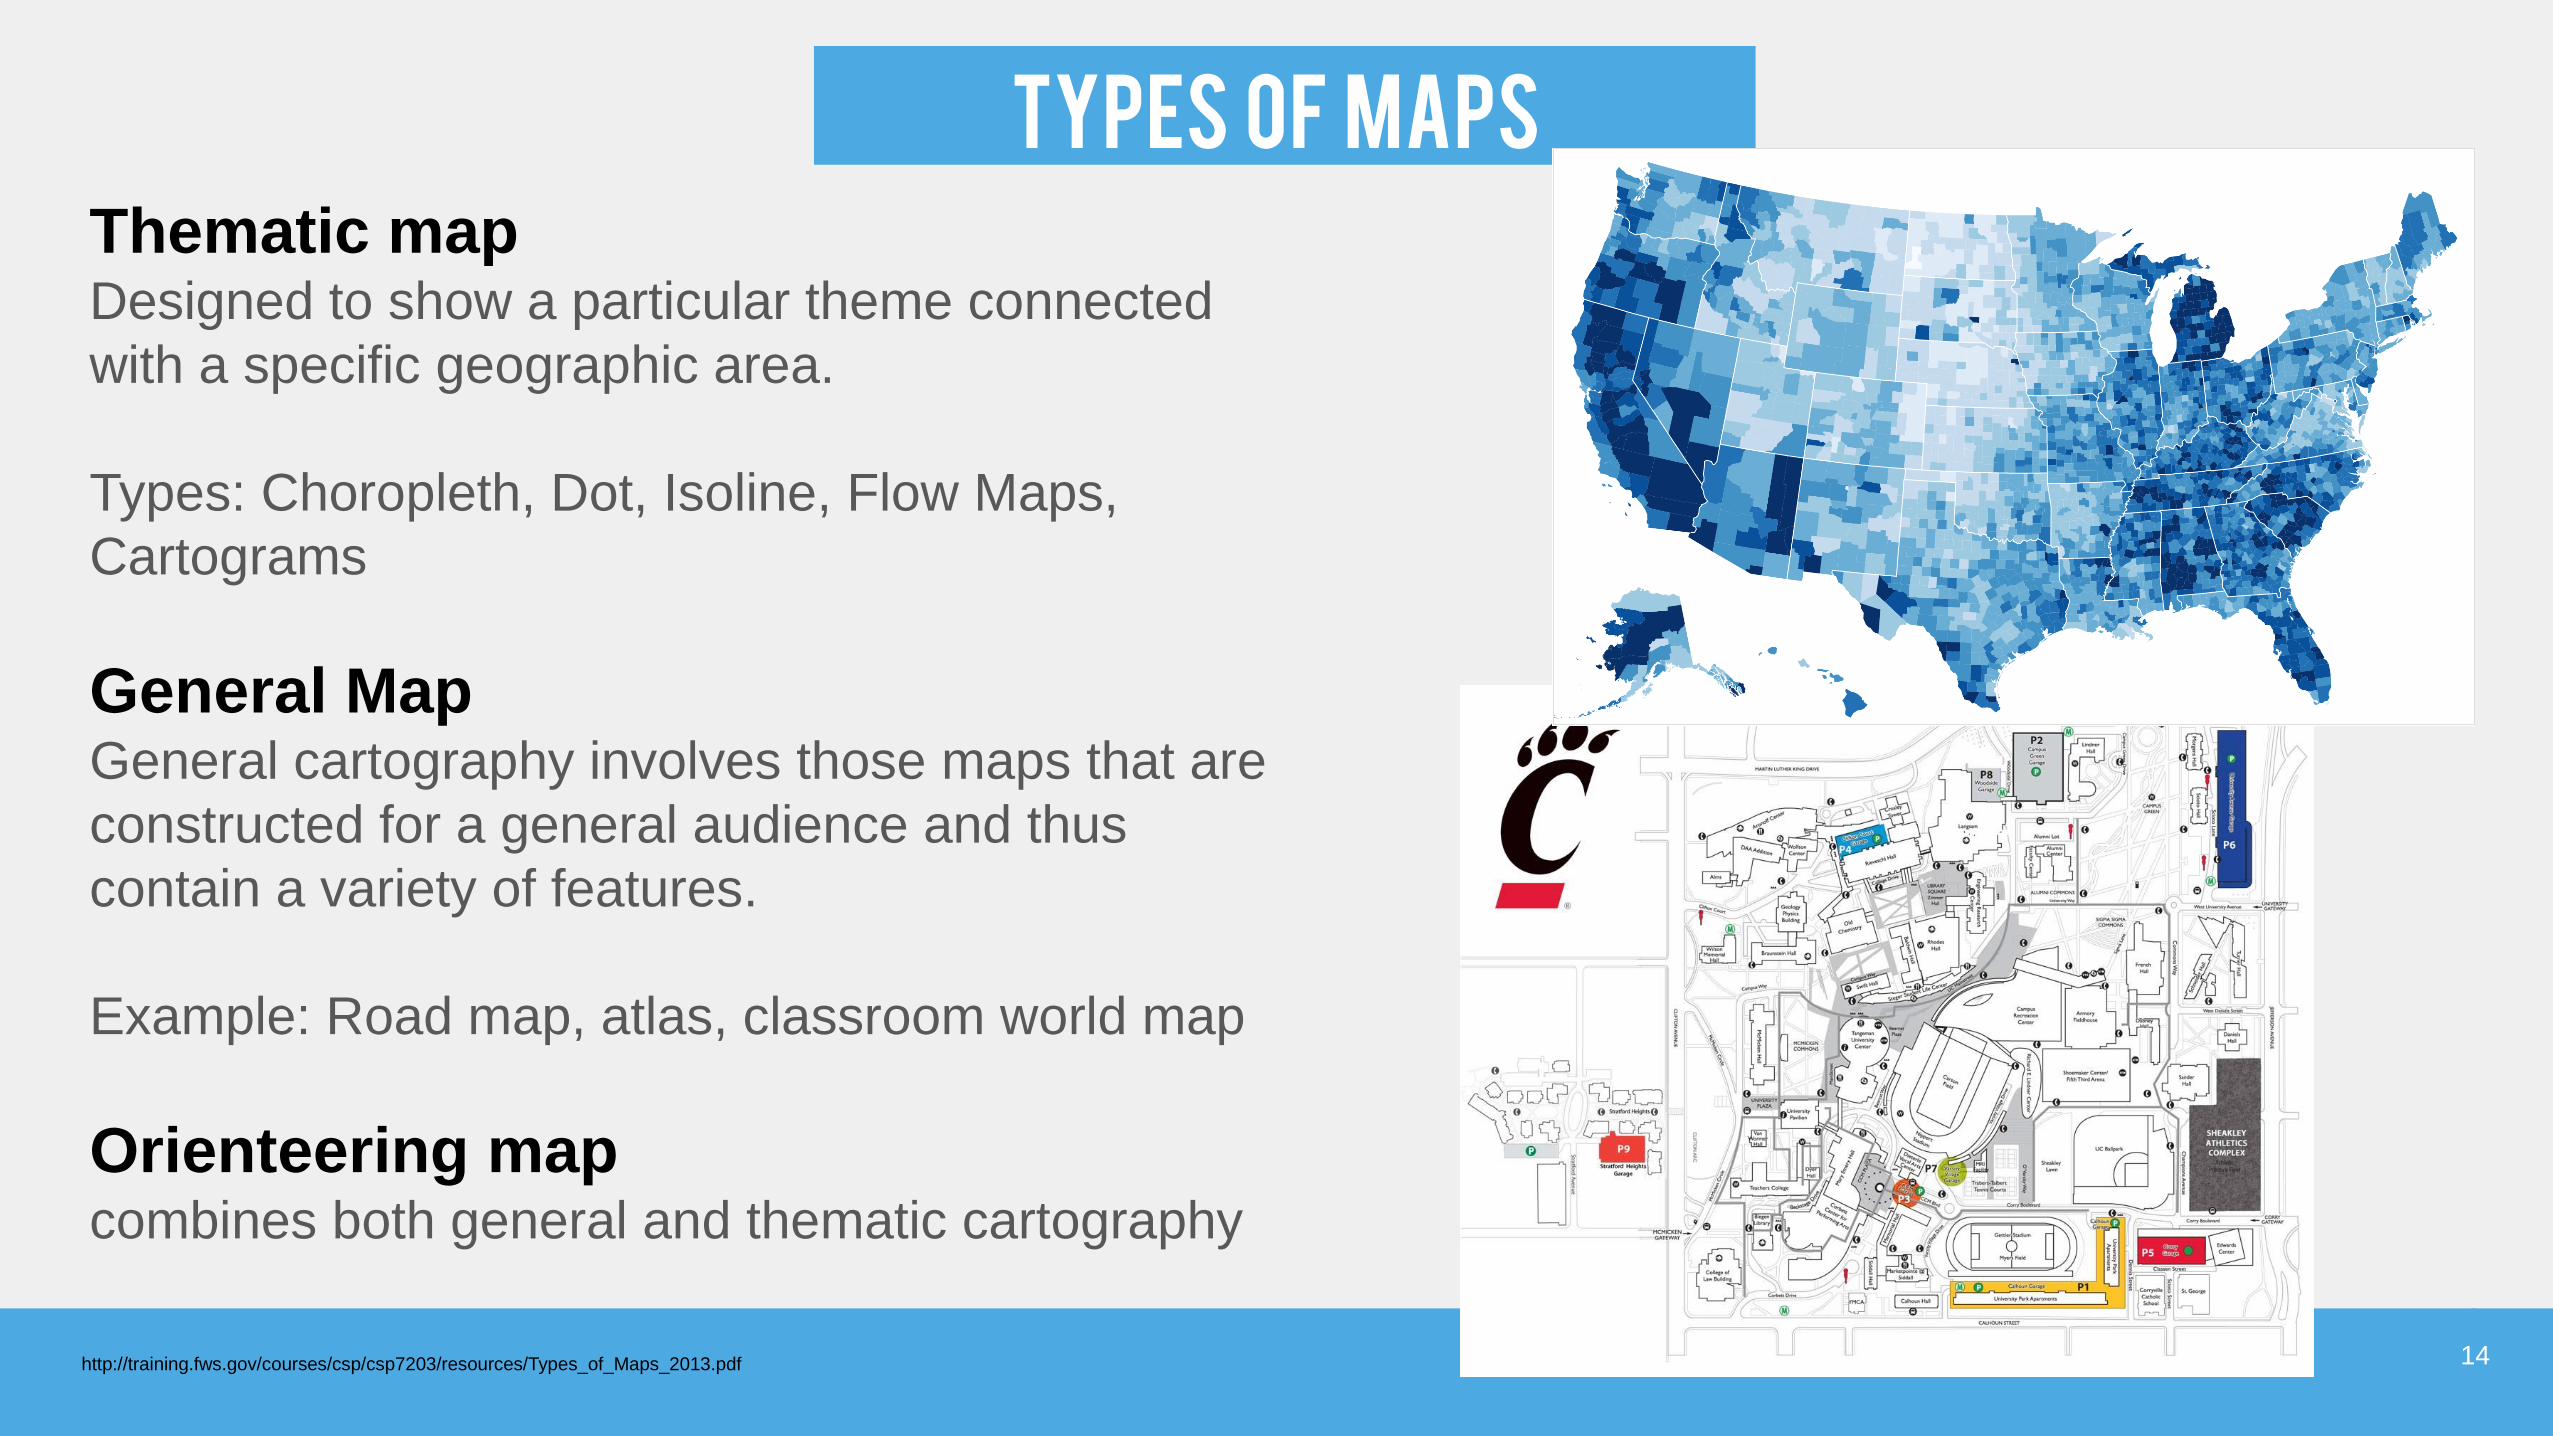
TYPES OF MAPS
14
Thematic mapDesigned to show a particular theme connected
with a specific geographic area.
Types: Choropleth, Dot, Isoline, Flow Maps,
Cartograms
General MapGeneral cartography involves those maps that are
constructed for a general audience and thus
contain a variety of features.
Example: Road map, atlas, classroom world map
Orienteering map combines both general and thematic cartography
http://training.fws.gov/courses/csp/csp7203/resources/Types_of_Maps_2013.pdf

TYPES OF MAPS
Topographic
Displays terrain: the three-dimensional quality
of the surface and the identification of
specific landforms. This is also known
as geomorphometry.
Topological map
Diagram that has been simplified so that only
vital information remains and unnecessary
detail has been removed. These maps lack
scale, and distance and direction are subject
to change and variation, but the relationship
between points is maintained.
15
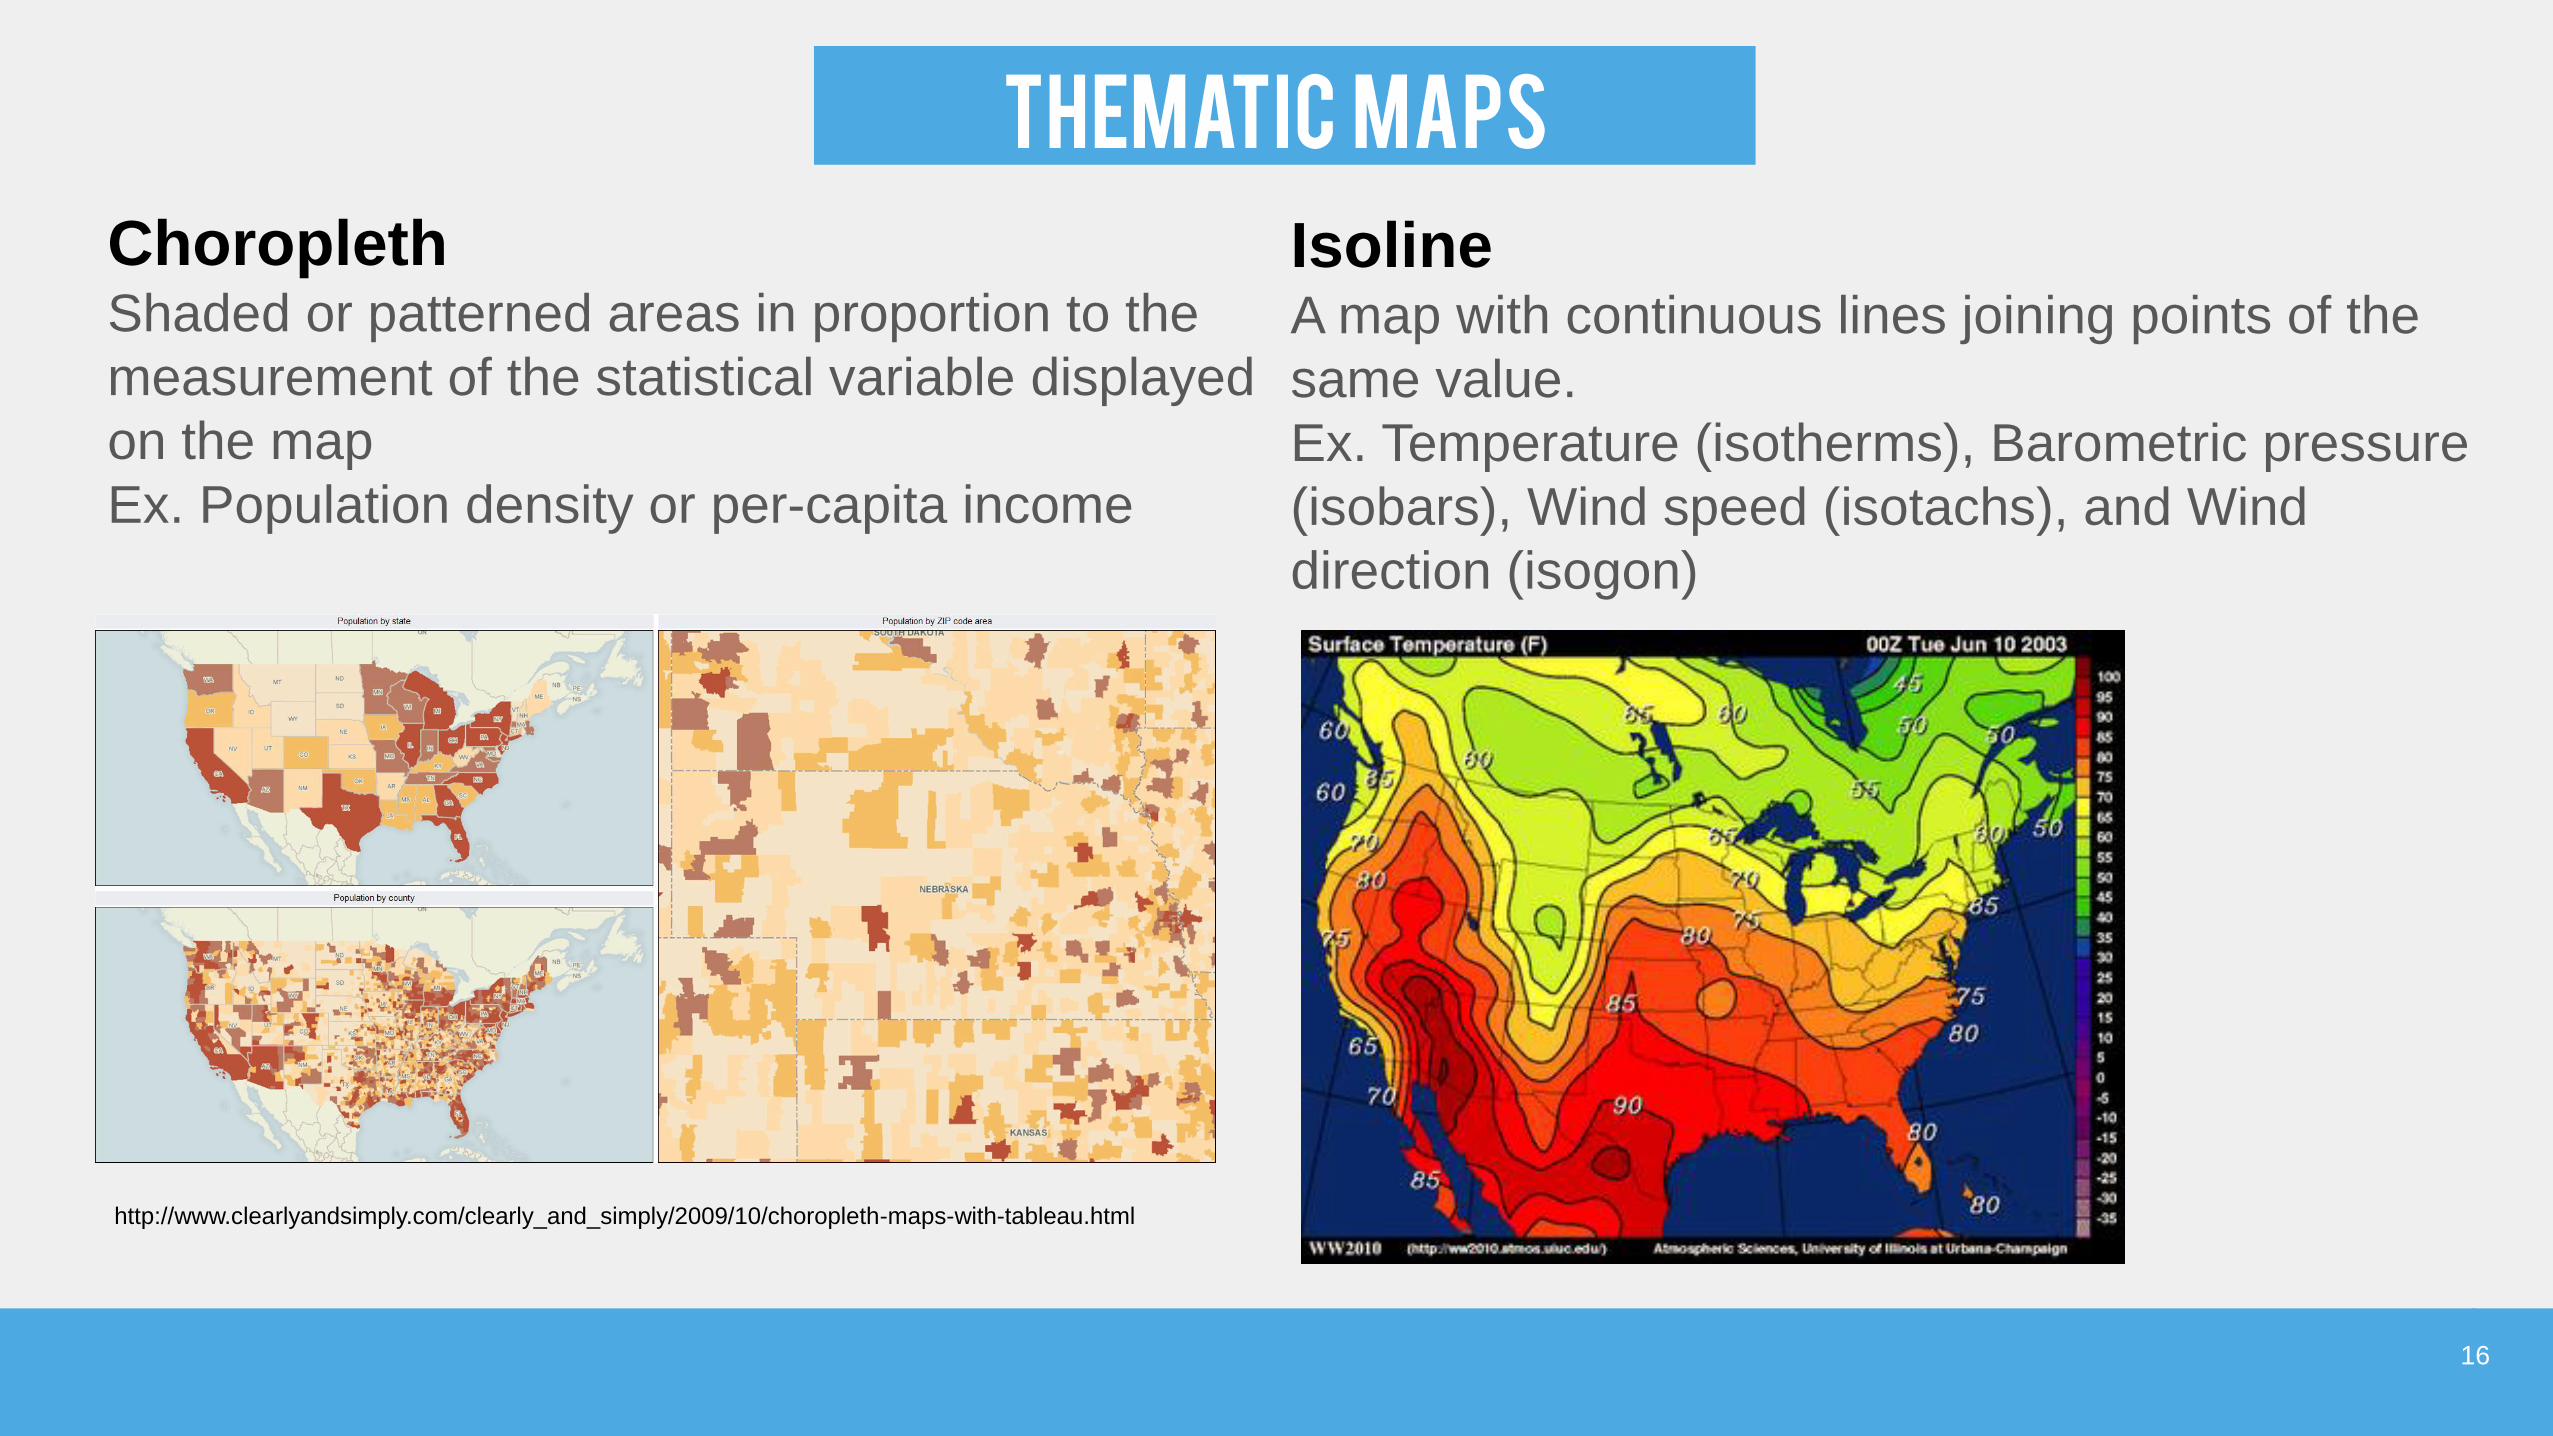
Thematic MAPS
16
Choropleth Shaded or patterned areas in proportion to the
measurement of the statistical variable displayed
on the map
Ex. Population density or per-capita income
IsolineA map with continuous lines joining points of the
same value.
Ex. Temperature (isotherms), Barometric pressure
(isobars), Wind speed (isotachs), and Wind
direction (isogon)
http://www.clearlyandsimply.com/clearly_and_simply/2009/10/choropleth-maps-with-tableau.html

TYPES OF MAPS
17
Flow mapsA mix of a map and a flow chart that "show the
movement of objects from one location to
another".
CartogramA map in which some thematic mapping
variable is substituted for land area or
distance. The geometry or space of the
map is distorted in order to convey the
information.
18TABlEAU MAPS

MAPPING IN TABLEAU
• Filled Maps & Symbol Maps (Shapes)
• Customer mapping stories & examples
http://www.tableau.com/stories/topic/maps
• Information on data that Tableau uses for
maps:
http://www.tableau.com/mapdata
• Tableau’s online help portal for mapping
http://onlinehelp.tableau.com/current/pro/online/
windows/en-us/maps.html
19
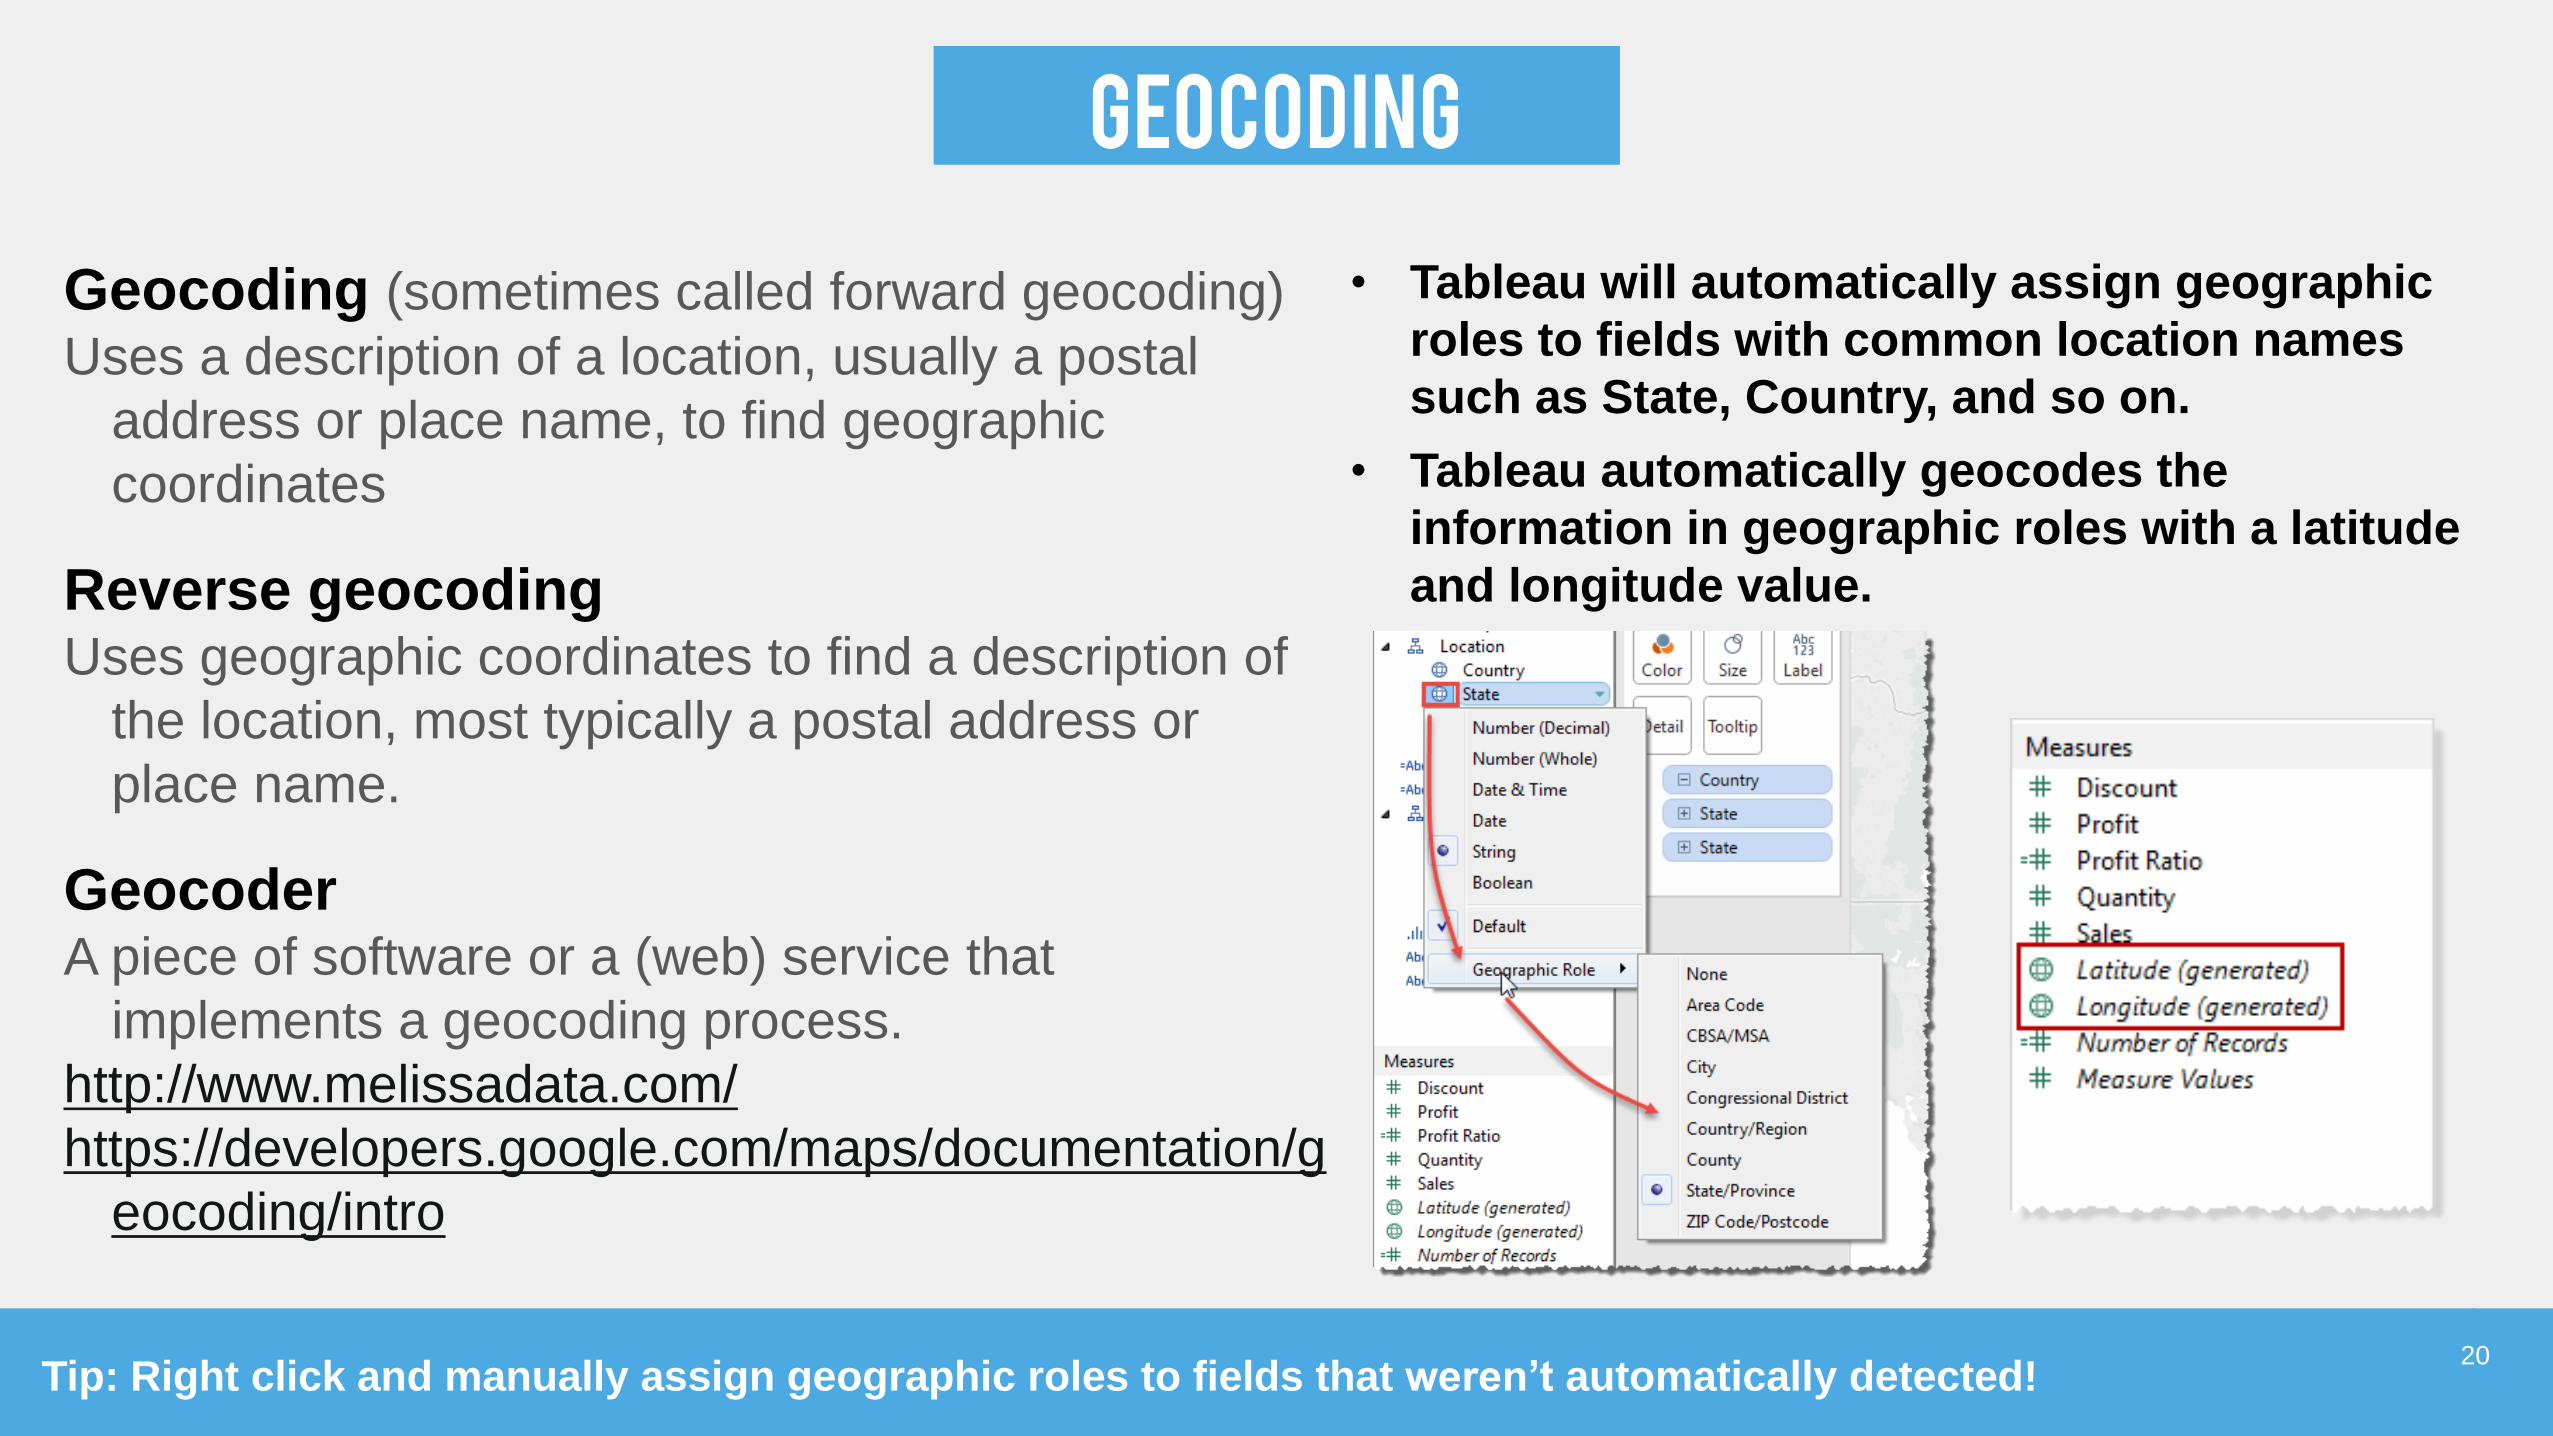
GEOCODING
Geocoding (sometimes called forward geocoding)
Uses a description of a location, usually a postal
address or place name, to find geographic
coordinates
Reverse geocodingUses geographic coordinates to find a description of
the location, most typically a postal address or
place name.
GeocoderA piece of software or a (web) service that
implements a geocoding process.
http://www.melissadata.com/
https://developers.google.com/maps/documentation/g
eocoding/intro
20
• Tableau will automatically assign geographic
roles to fields with common location names
such as State, Country, and so on.
• Tableau automatically geocodes the
information in geographic roles with a latitude
and longitude value.
Tip: Right click and manually assign geographic roles to fields that weren’t automatically detected!
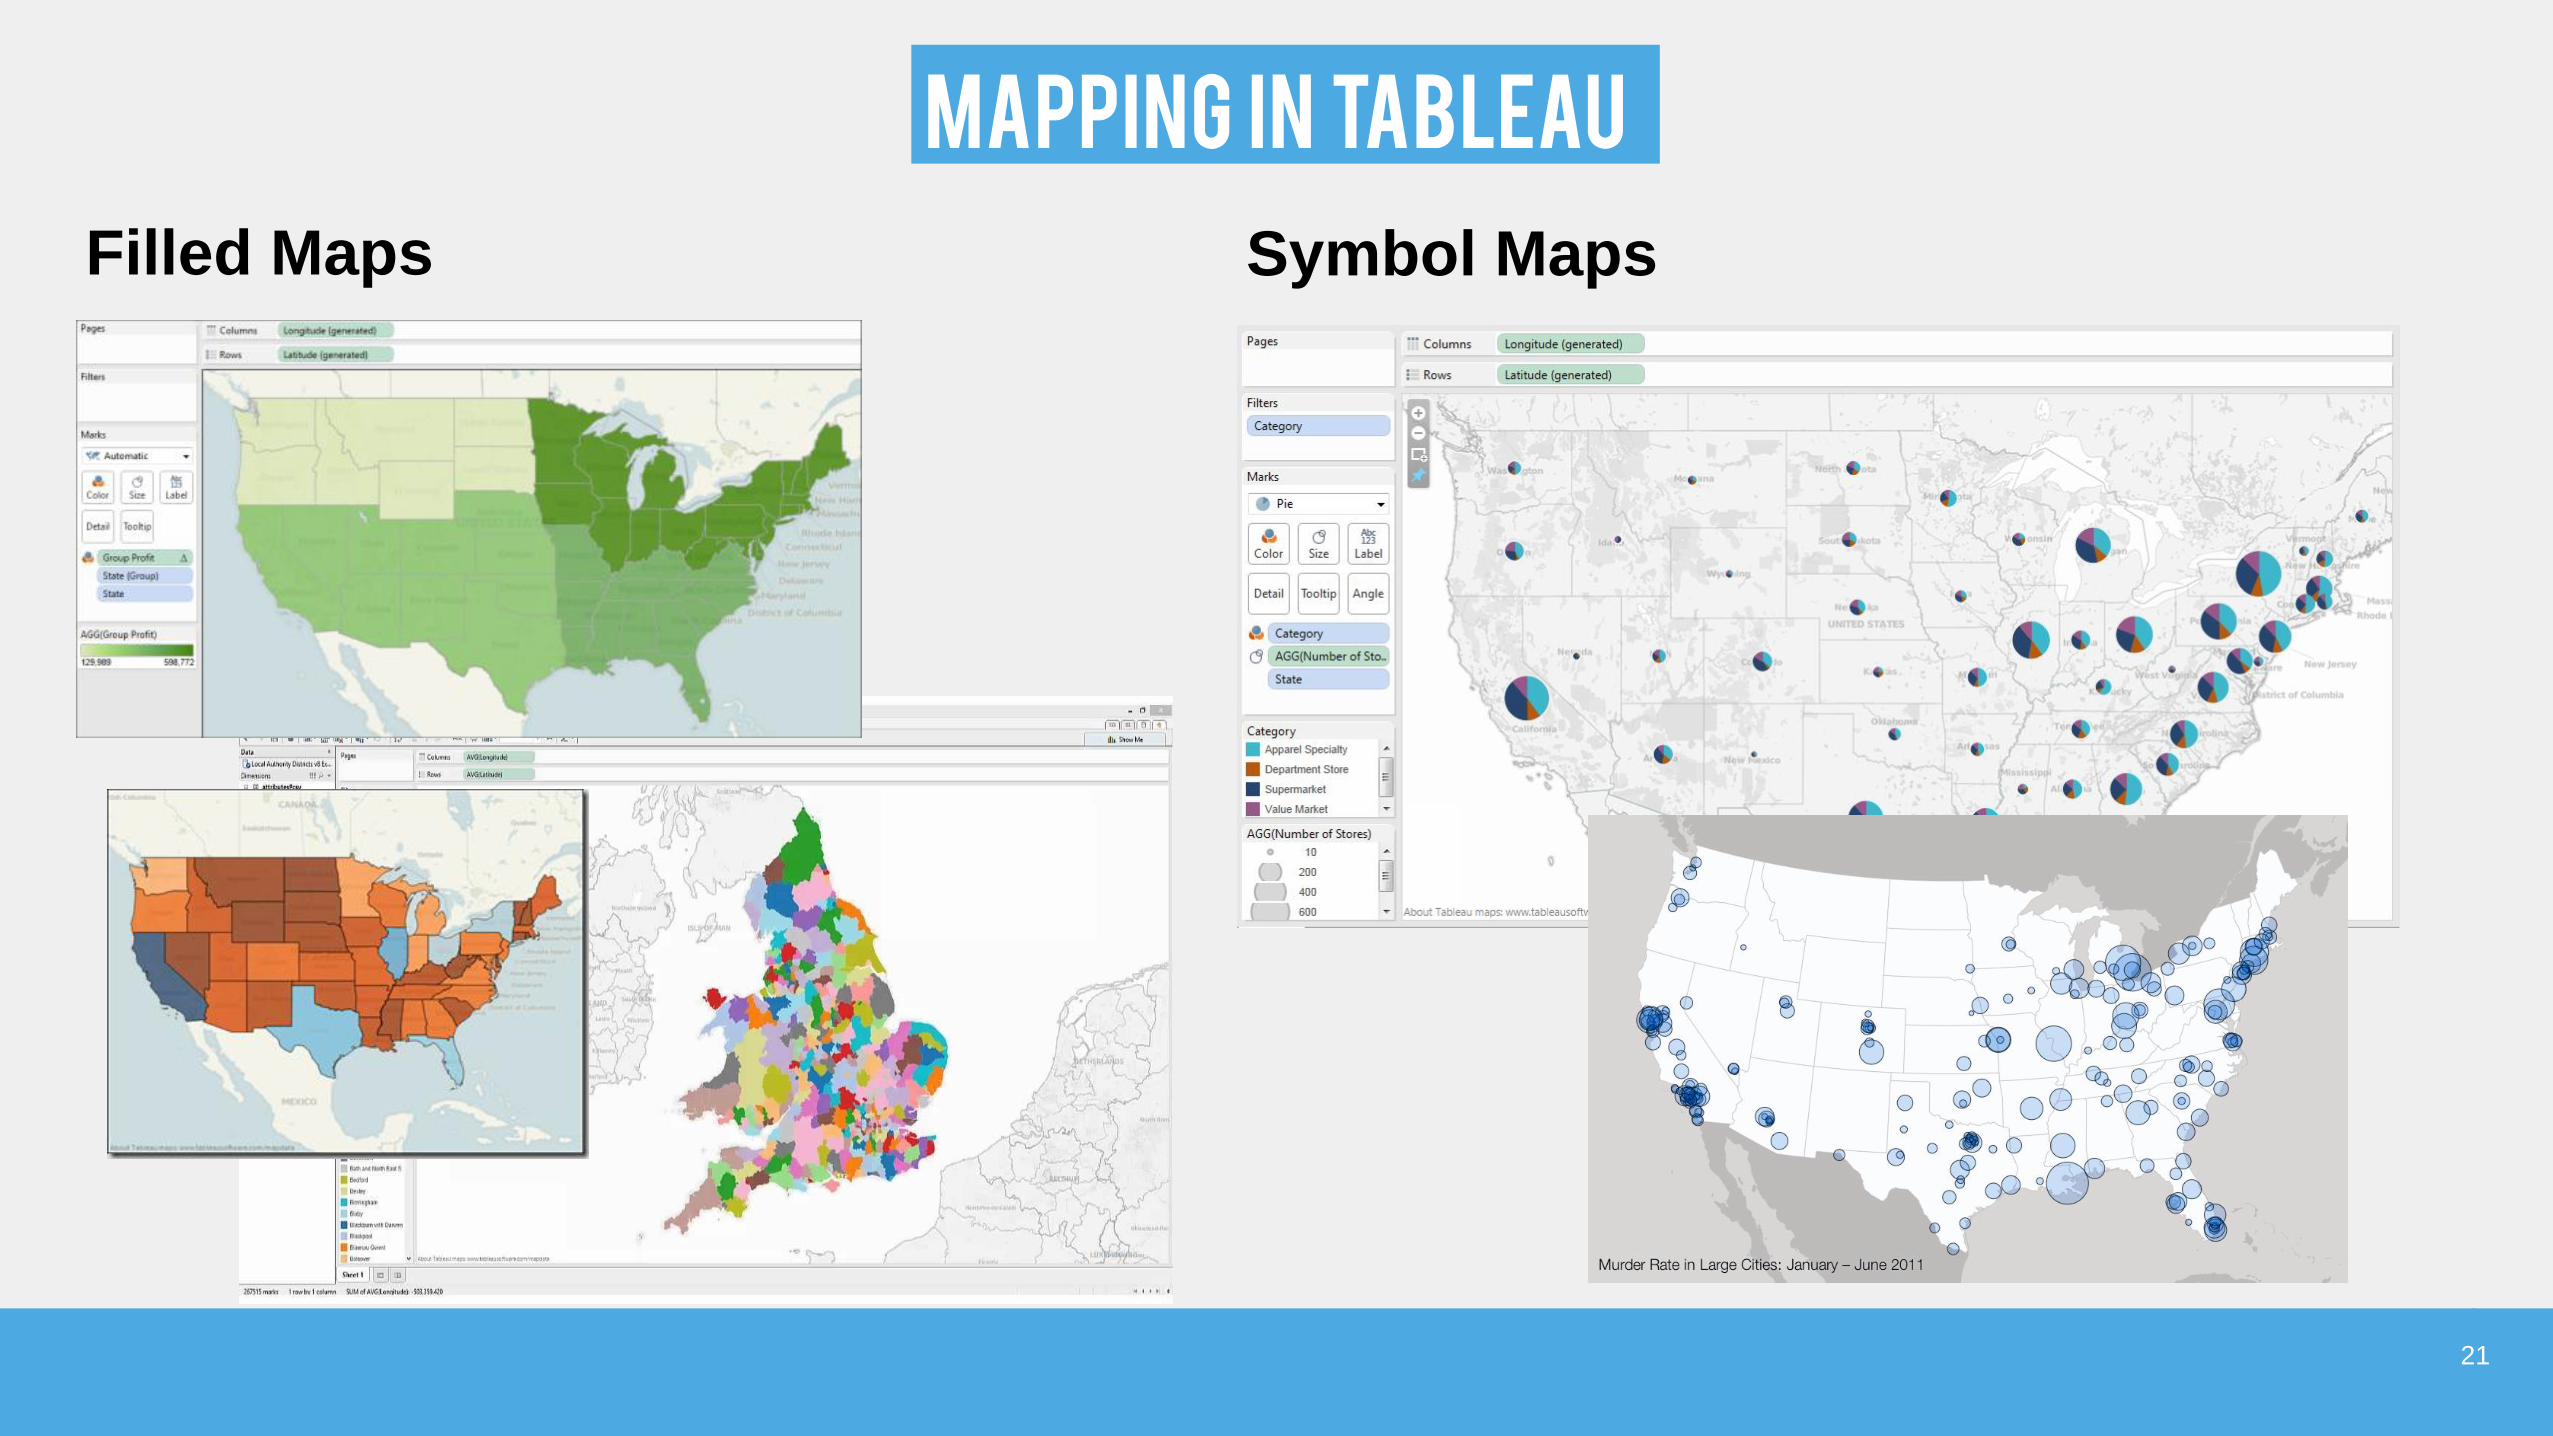
MAPPING IN TABLEAU
21
Symbol MapsFilled Maps

TABLEAU CUSTOM MAPS
22
https://public.tableau.com/s/blog/2014/10/our-
favorite-political-vizzes
http://www.evolytics.com/blog/tableau-201-
how-to-make-small-multiple-stadium-maps
http://kb.tableau.com/articles/knowledgebase/u
sing-path-shelf-pattern-analysis
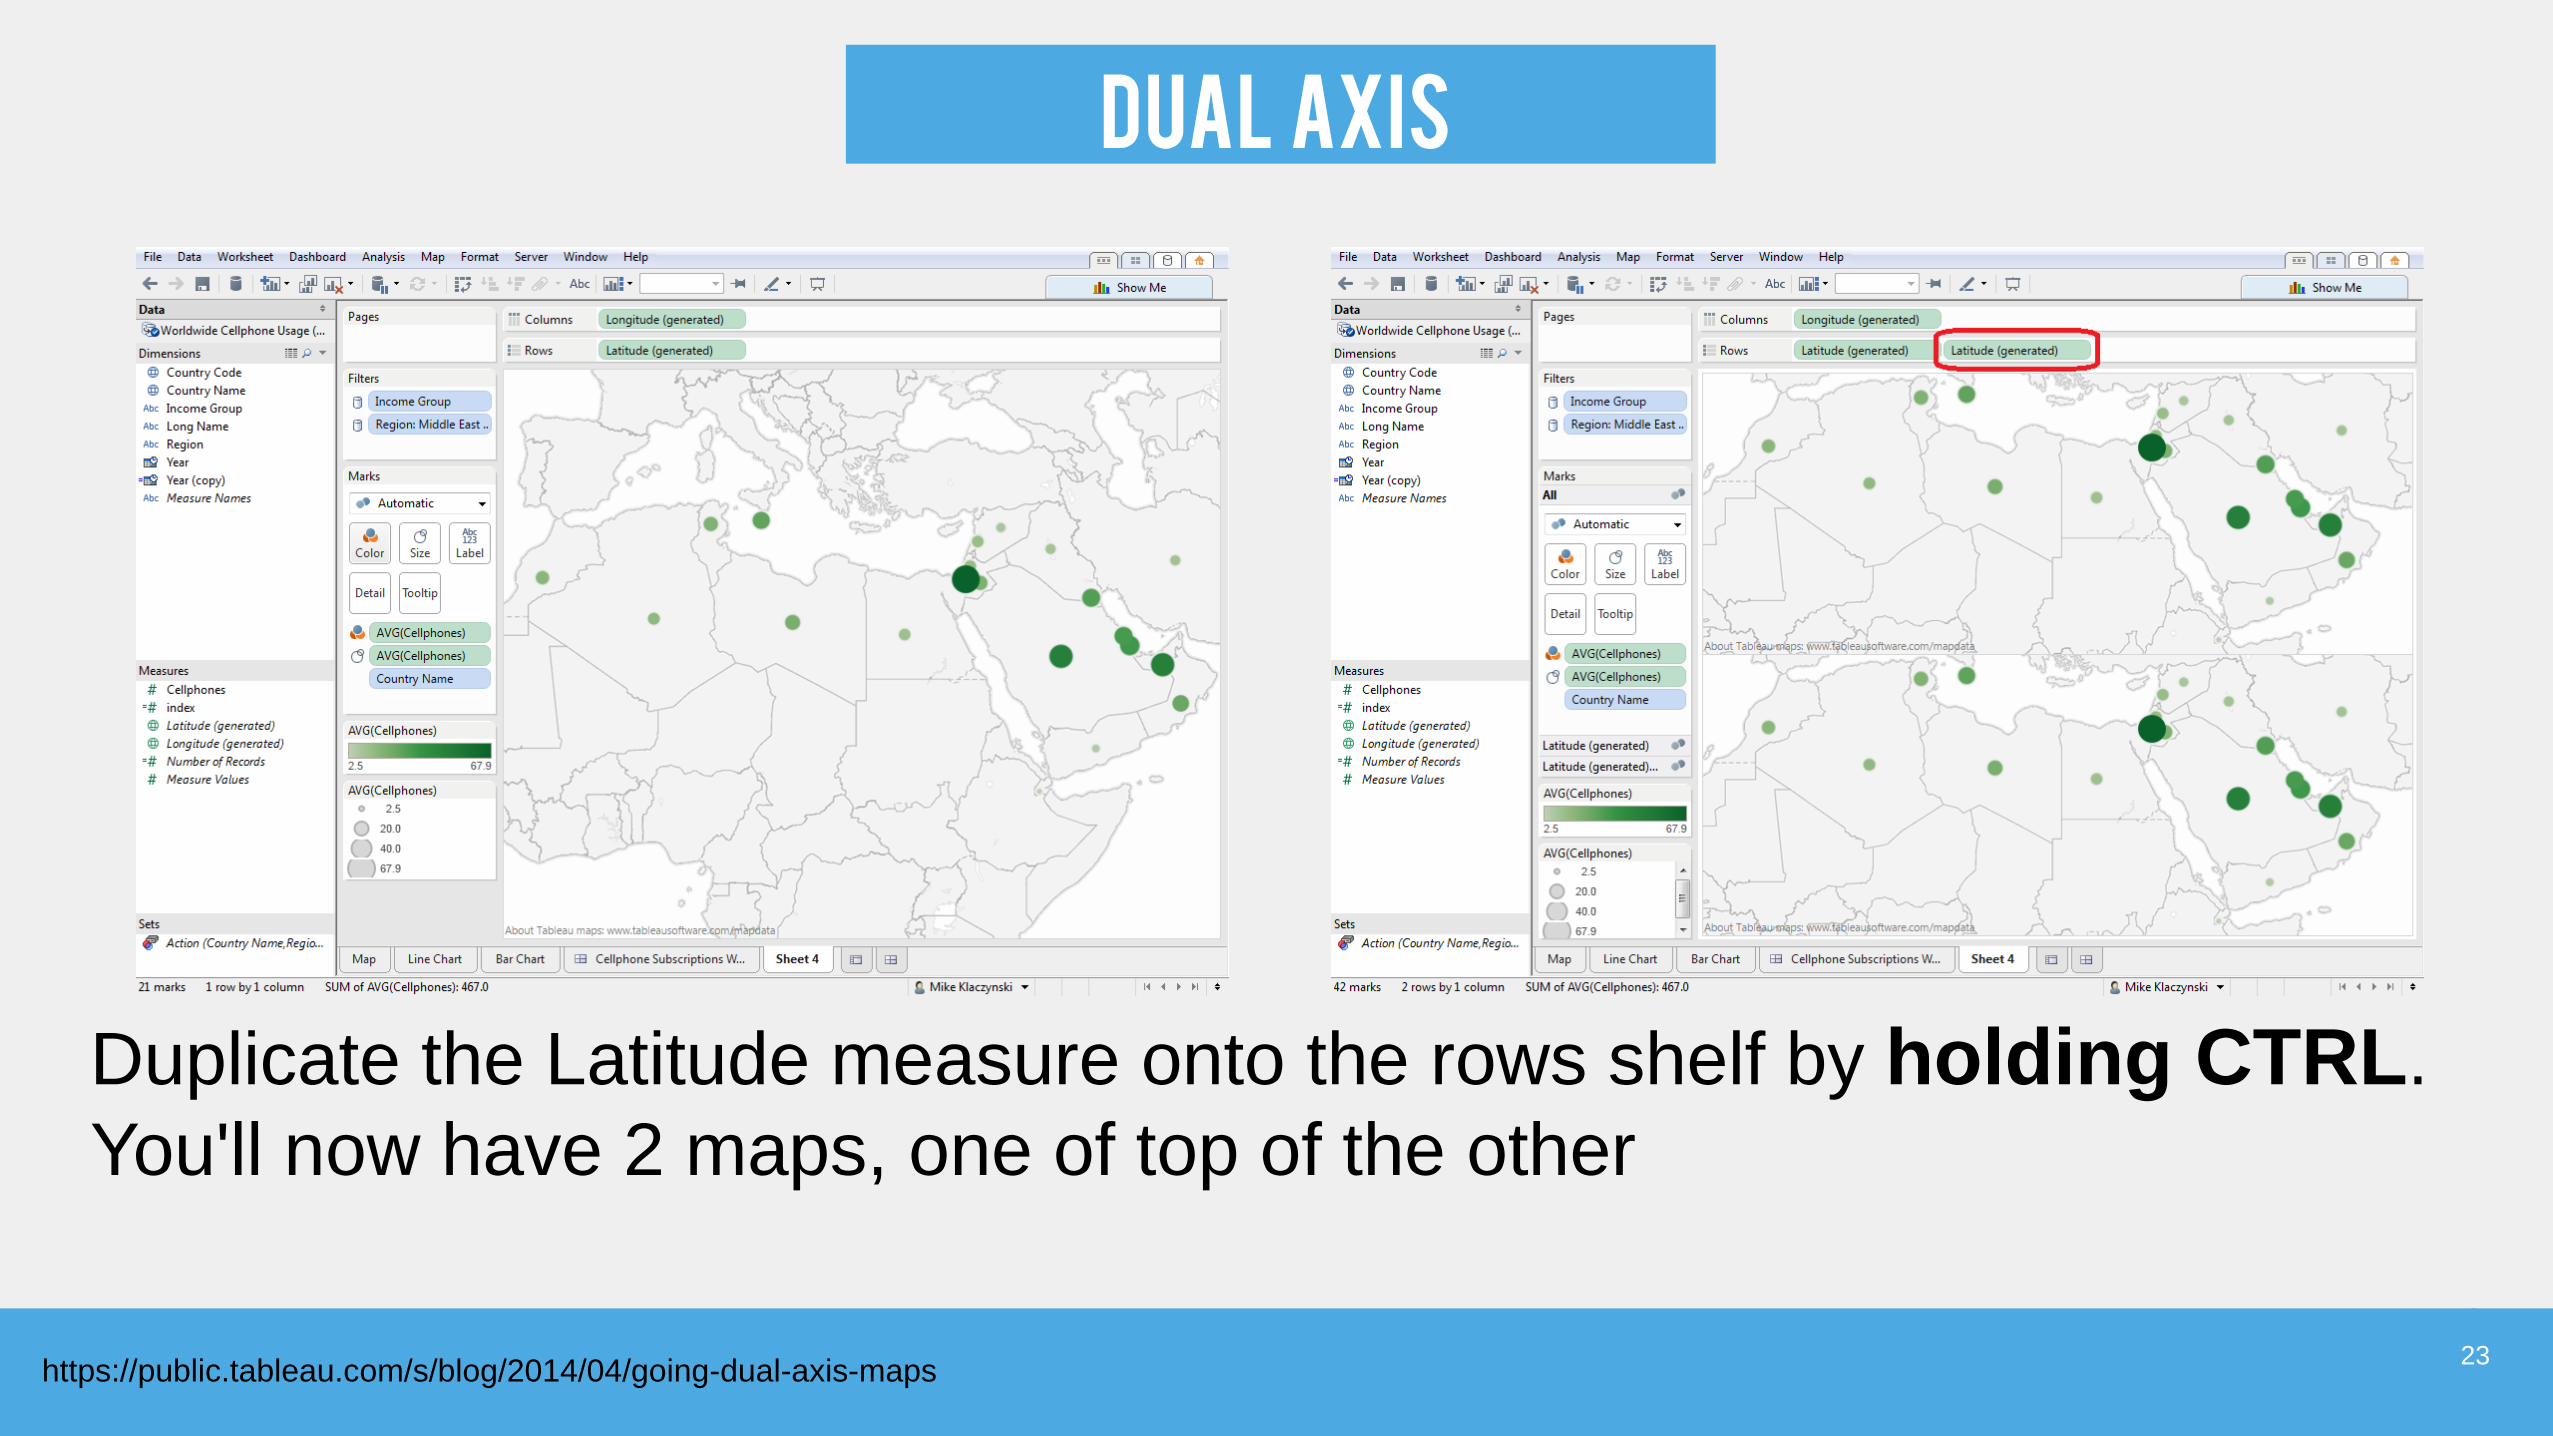
Dual AXIS
23https://public.tableau.com/s/blog/2014/04/going-dual-axis-maps
Duplicate the Latitude measure onto the rows shelf by holding CTRL.
You'll now have 2 maps, one of top of the other
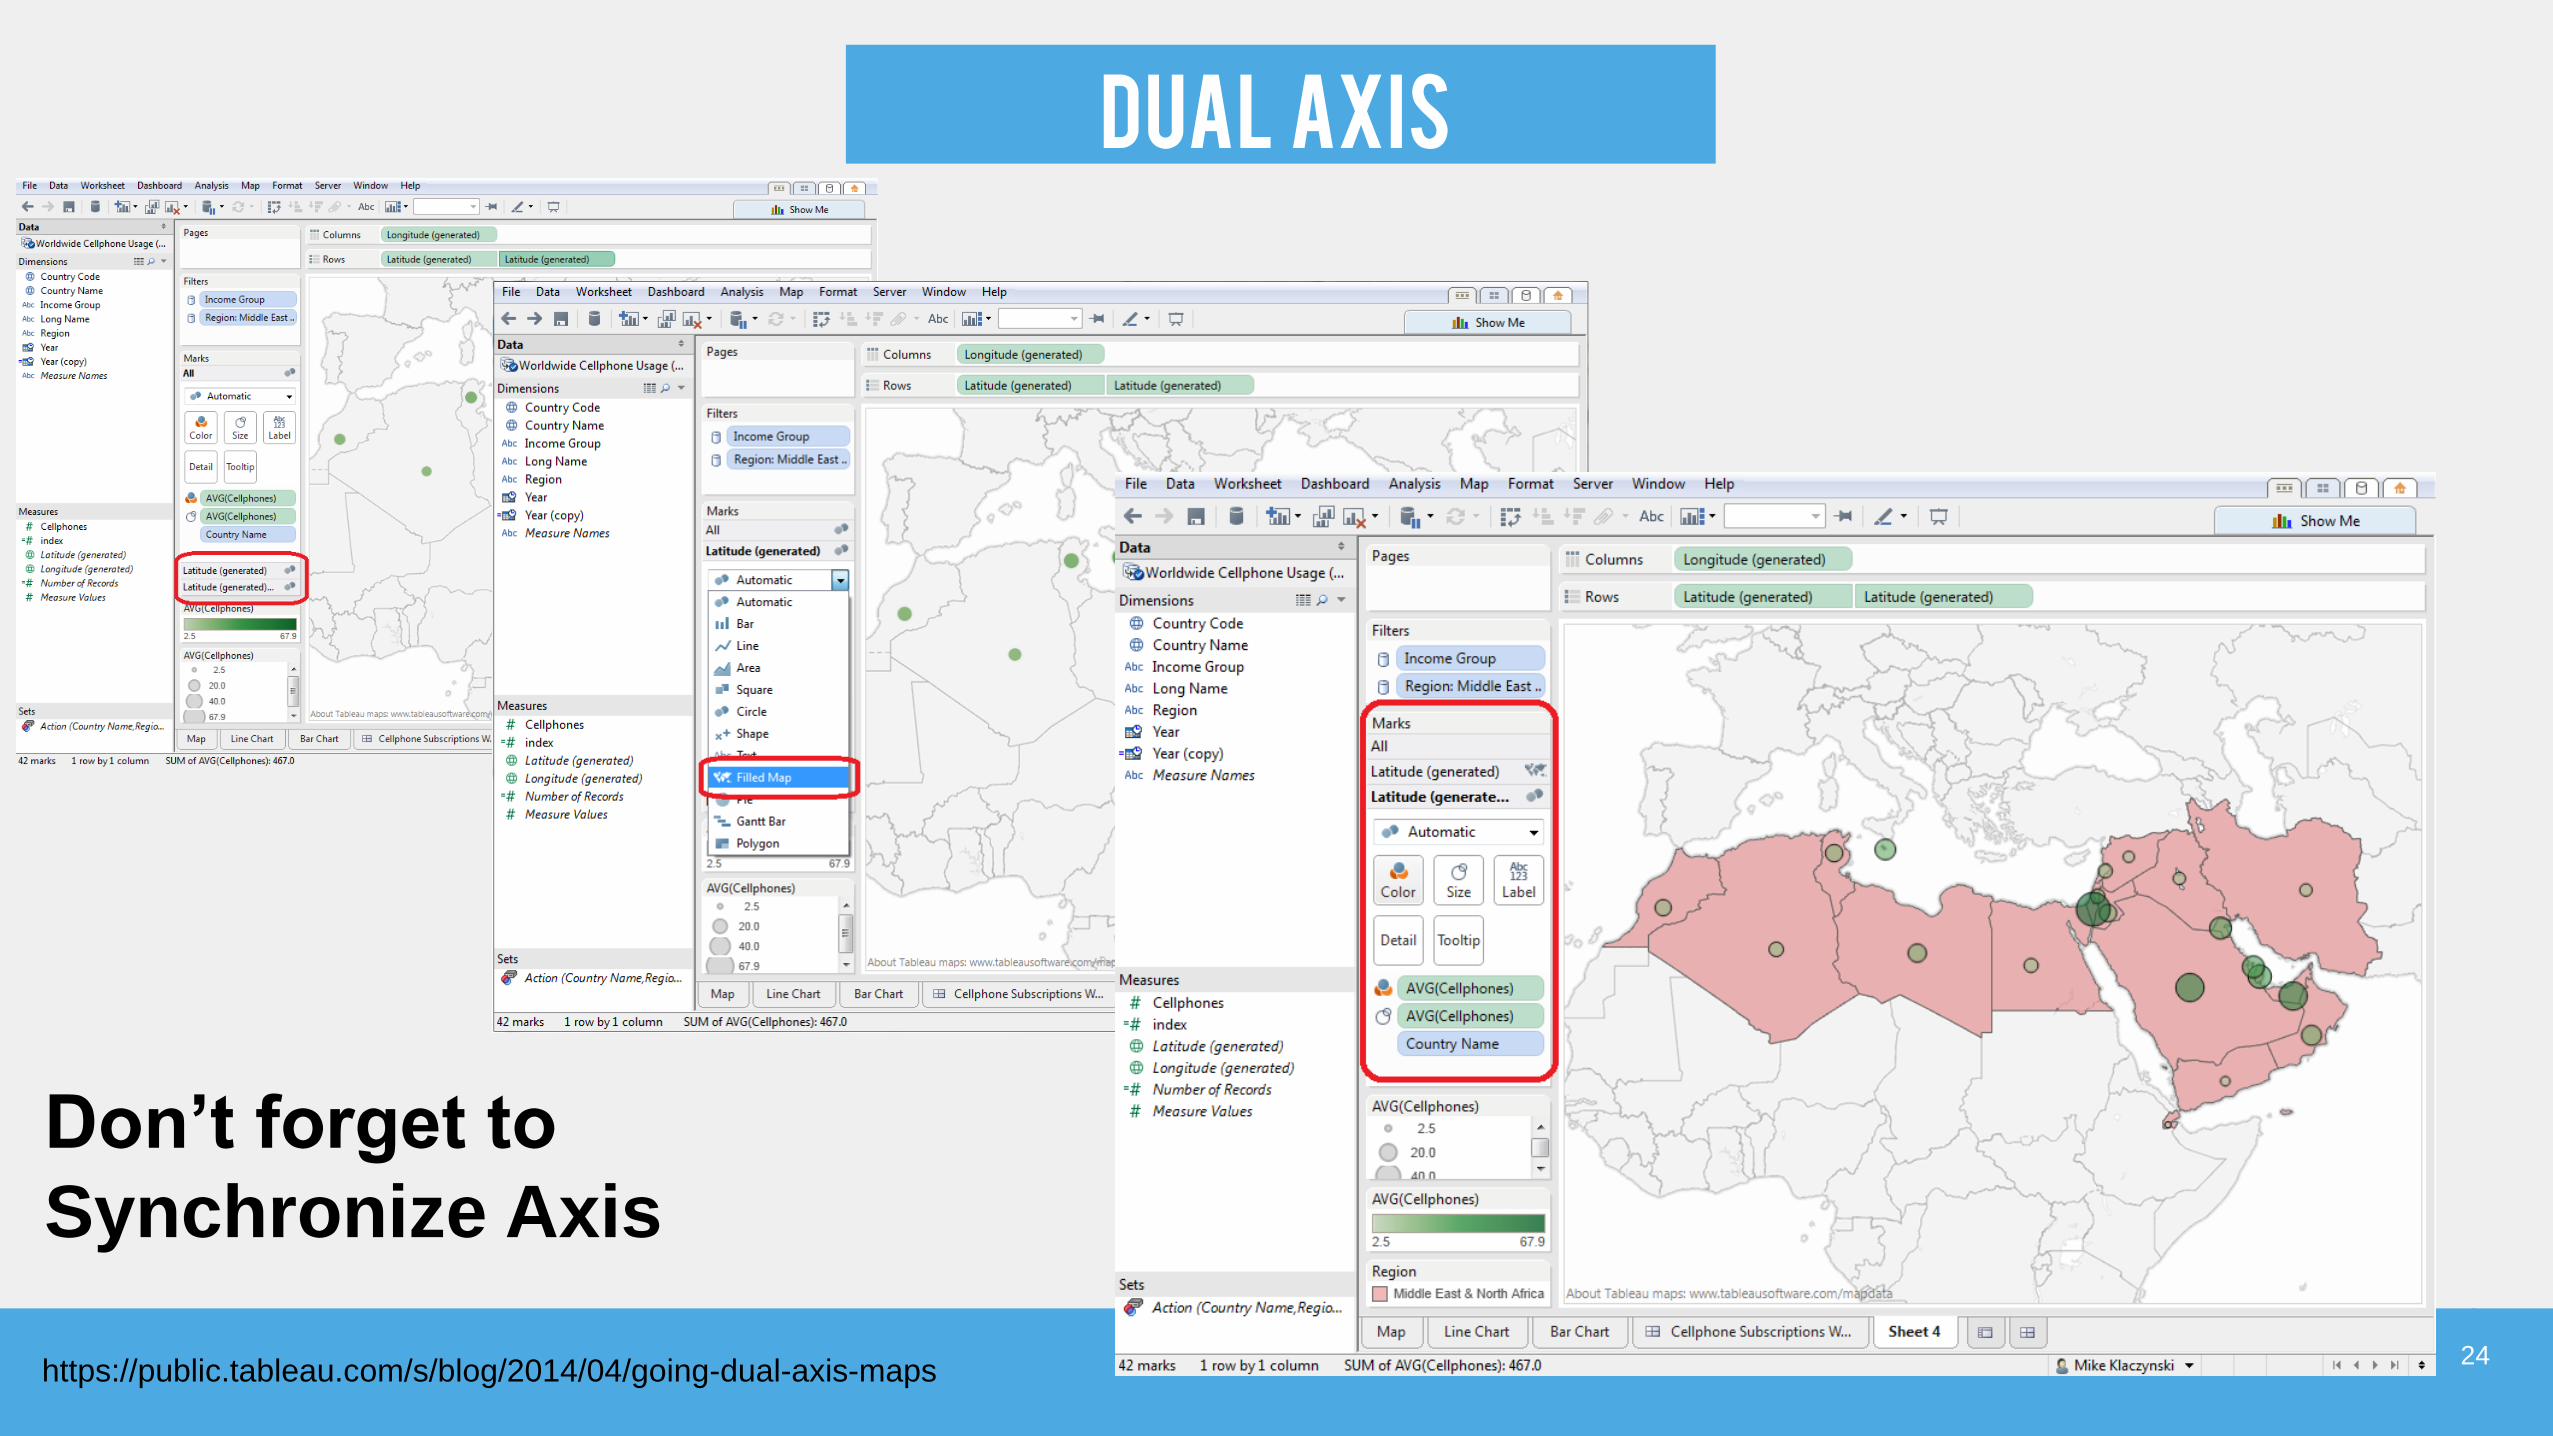
Dual AXIS
24https://public.tableau.com/s/blog/2014/04/going-dual-axis-maps
Don’t forget to
Synchronize Axis

BACKGROUND IMAGE
25http://kb.tableau.com/articles/knowledgebase/background-image-coordinates
Maps > Background Images

BACKGROUND IMAGE
26http://kb.tableau.com/articles/knowledgebase/background-image-coordinates
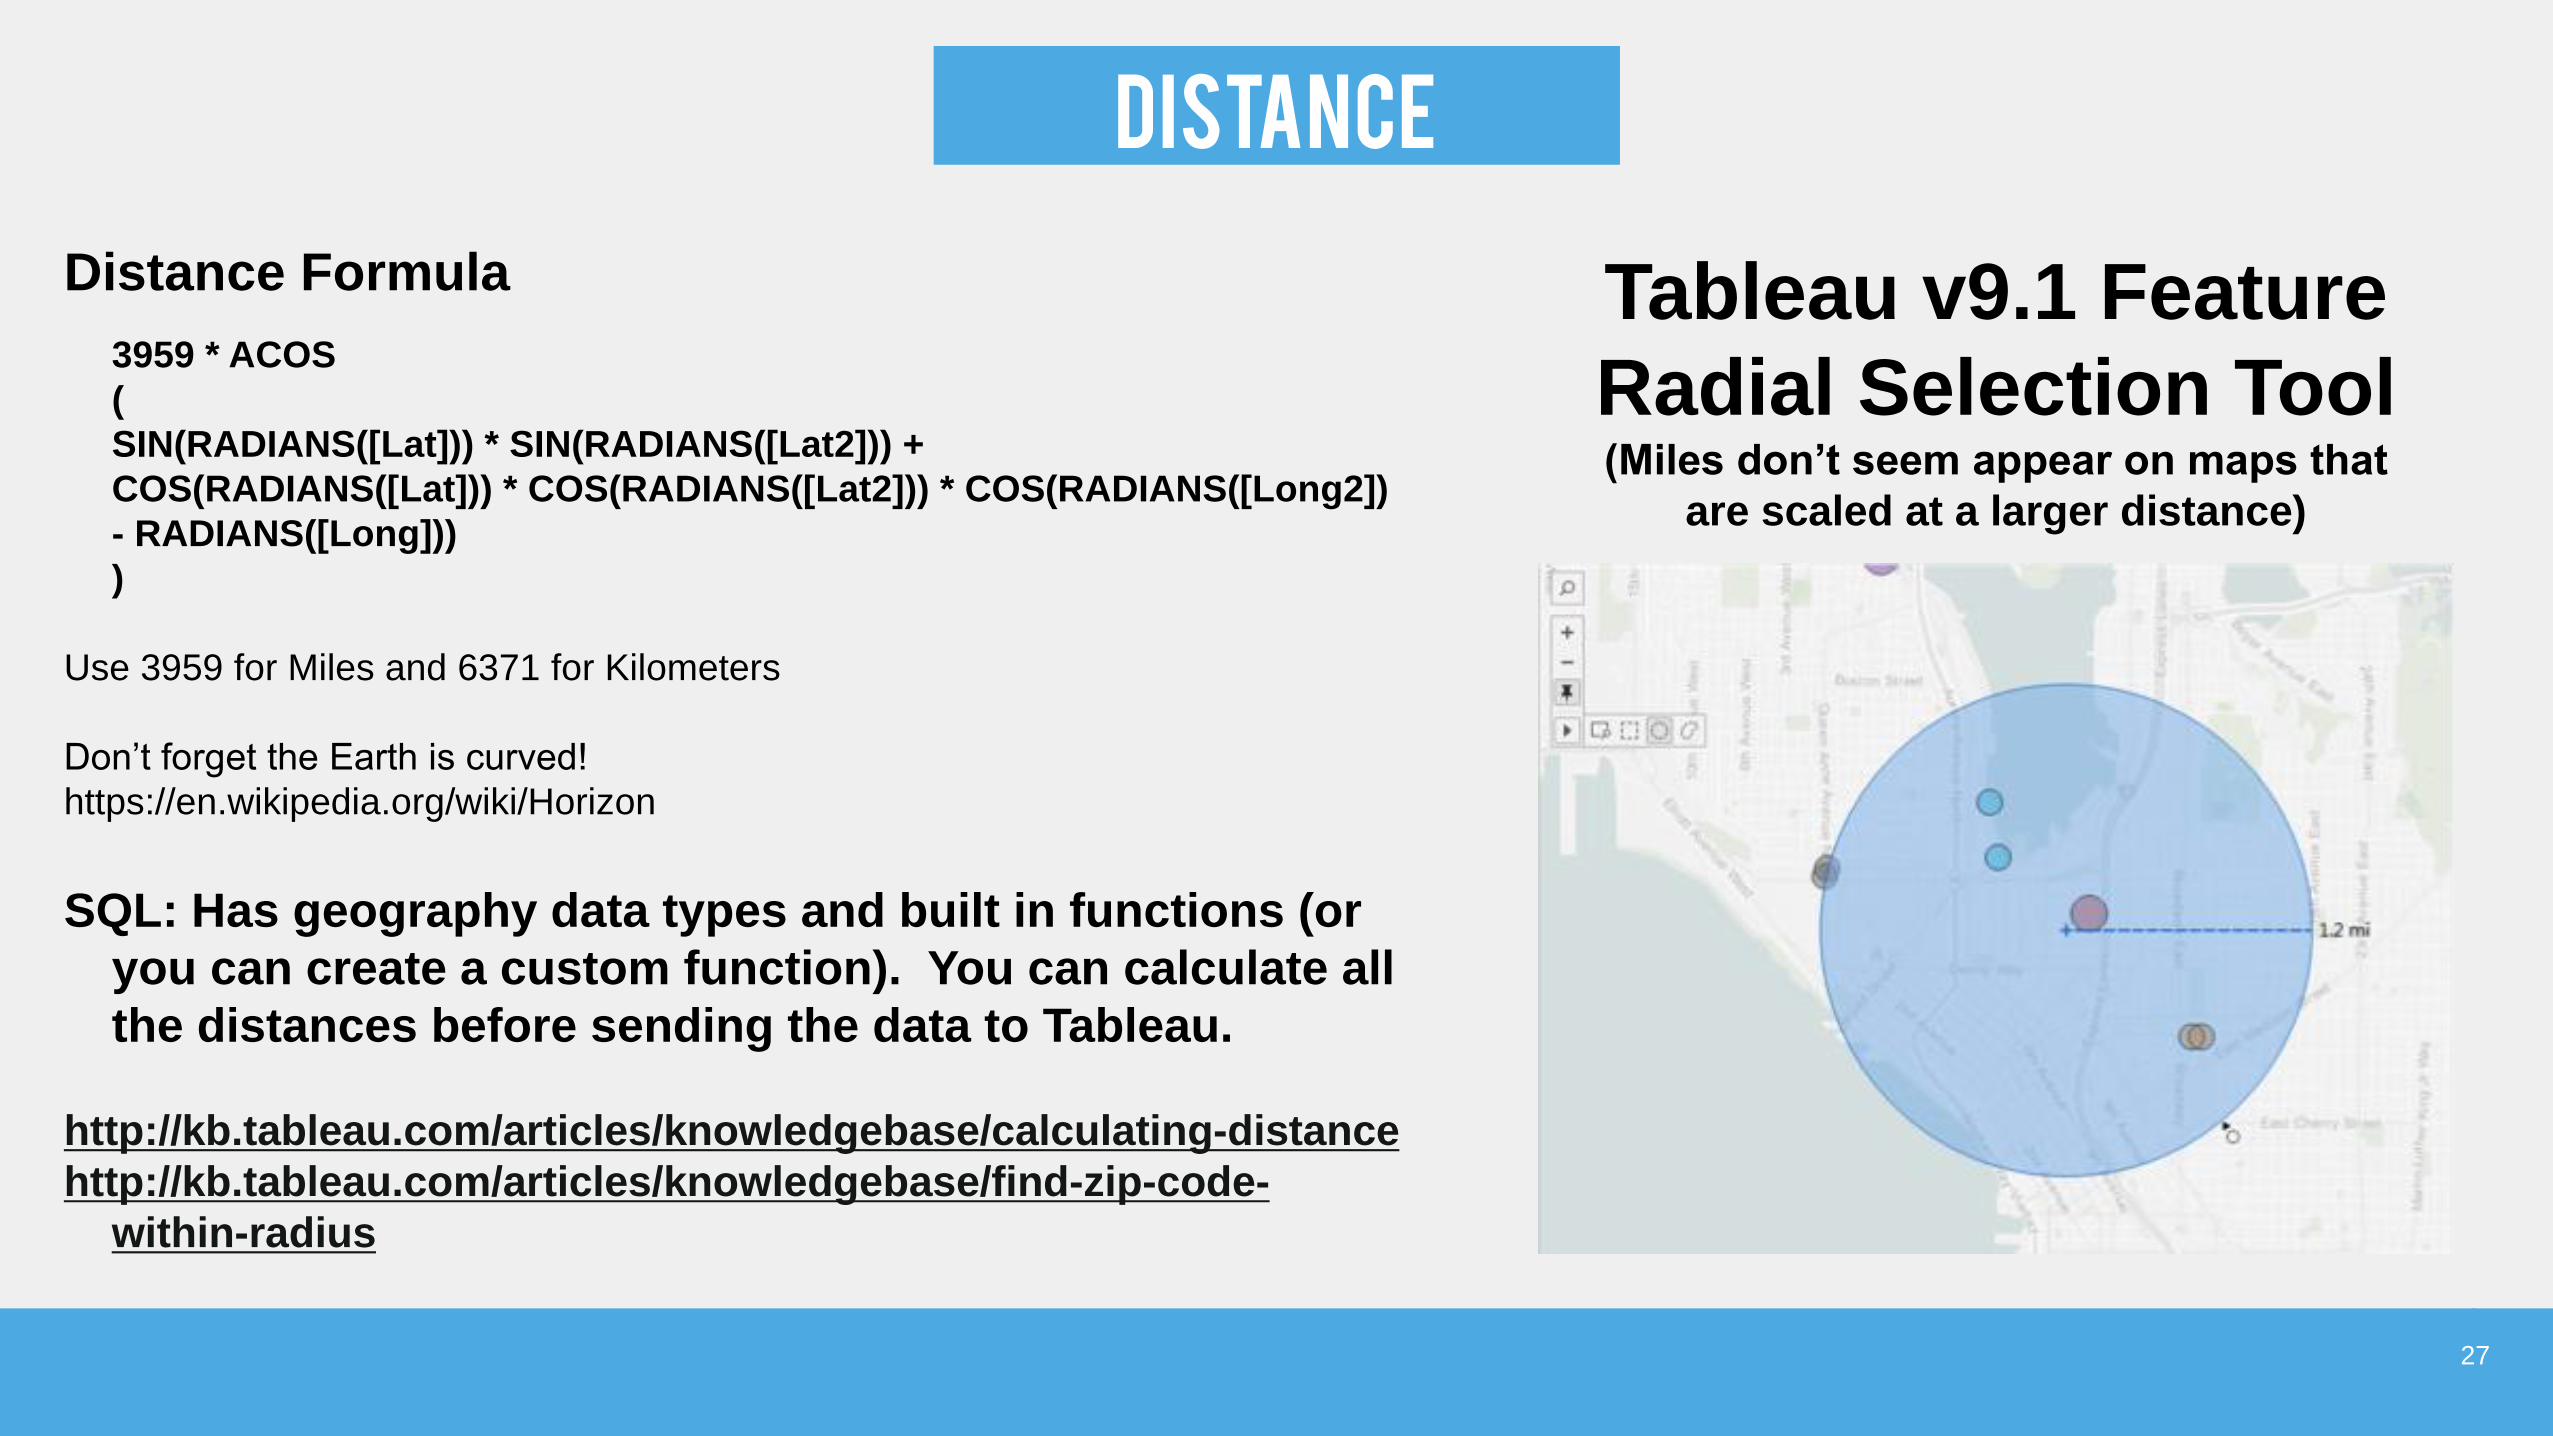
DISTANCE
Distance Formula
3959 * ACOS
(
SIN(RADIANS([Lat])) * SIN(RADIANS([Lat2])) +
COS(RADIANS([Lat])) * COS(RADIANS([Lat2])) * COS(RADIANS([Long2])
- RADIANS([Long]))
)
Use 3959 for Miles and 6371 for Kilometers
Don’t forget the Earth is curved!
https://en.wikipedia.org/wiki/Horizon
SQL: Has geography data types and built in functions (or
you can create a custom function). You can calculate all
the distances before sending the data to Tableau.
http://kb.tableau.com/articles/knowledgebase/calculating-distance
http://kb.tableau.com/articles/knowledgebase/find-zip-code-
within-radius
27
Tableau v9.1 Feature
Radial Selection Tool(Miles don’t seem appear on maps that
are scaled at a larger distance)
28DATA PREP USING R

THE DATA
The Problem• Points based within the United States
• Points are non-relatable geographical points
• Uncommon geographical roles (weather stations)
• Points for multiple years
29
The GoalAverage the points to a nearest county to
create an average result based on the
number of points within the nearest county

MY SUGGESTION
FIND NEW DATASomething with Address, ZIP code, State, County,
Census Group
30

MY SECOND SUGGESTION
• Try and connect the points to the nearest county Tableau only recognize common spatial data points
• TableauMap Layers (census data) possible custom Data Layer
Menu -> Map -> Map Layers
• Popular tools ESRI/ArcGIS $$$$ + Learning Curve
• RNeed to find the right package, some familiarity
(I do call this segment “Data Prep Using R”)
31
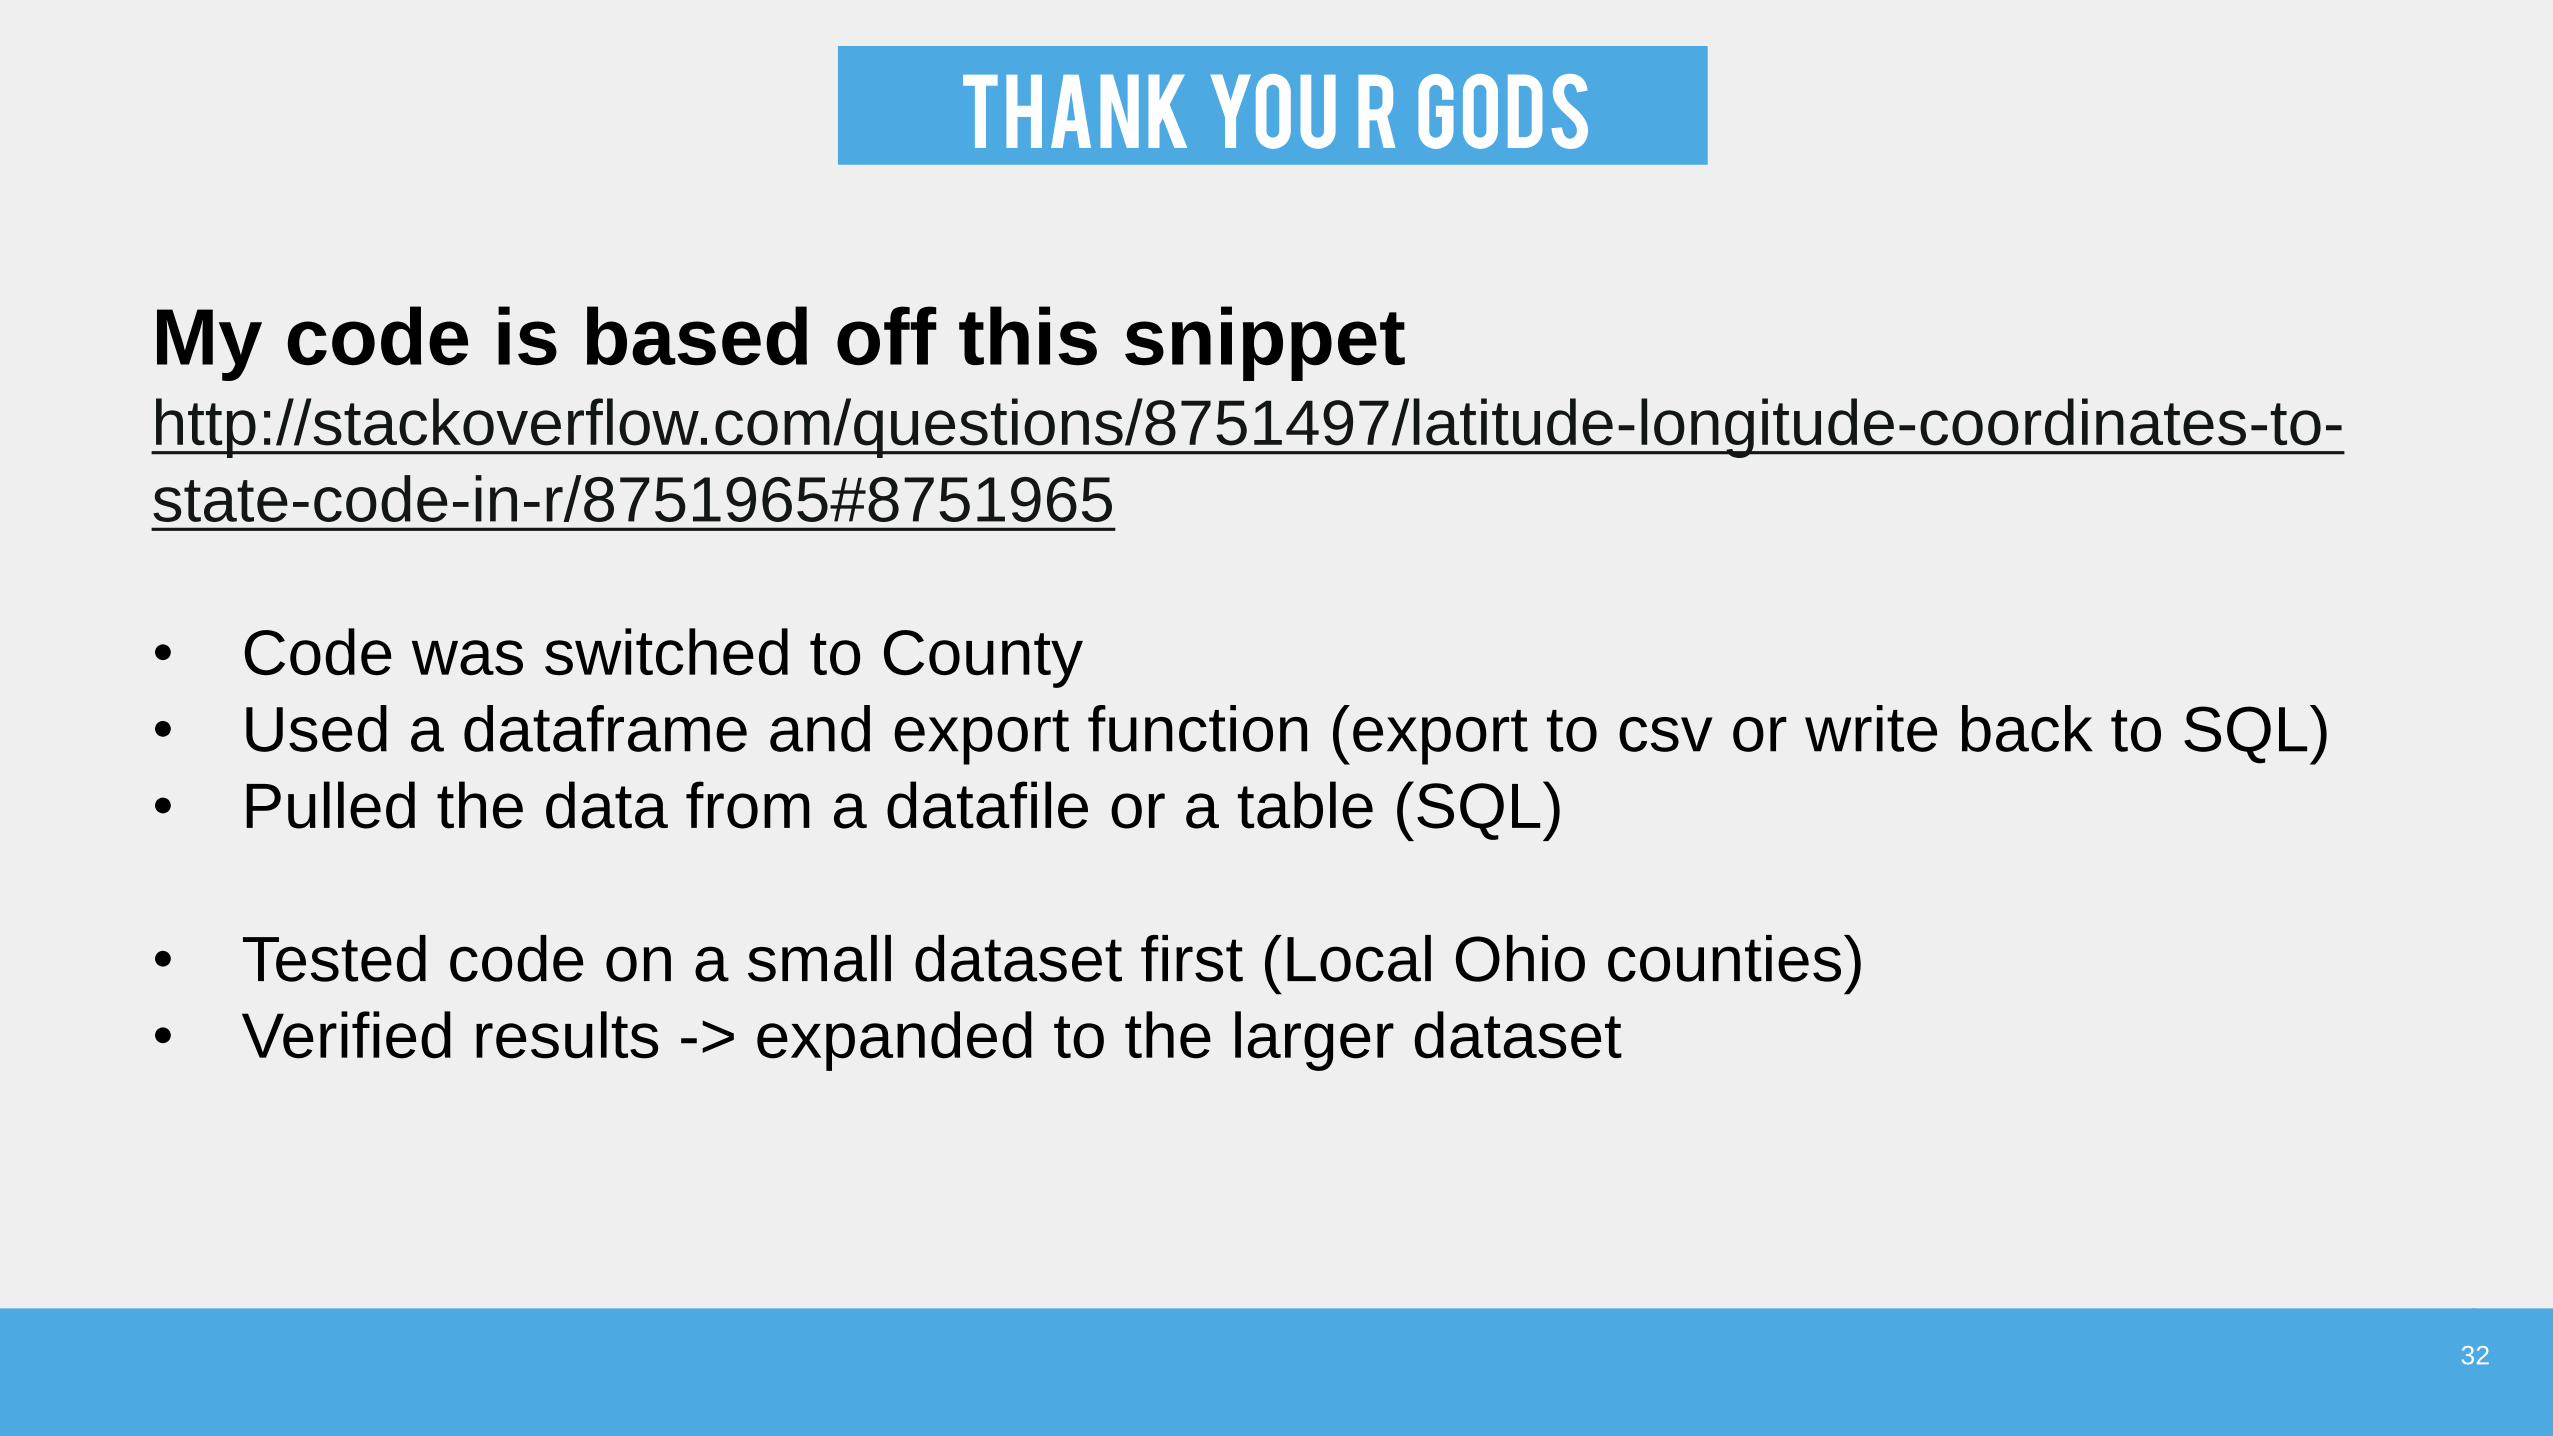
THANK YOU R GODS
My code is based off this snippethttp://stackoverflow.com/questions/8751497/latitude-longitude-coordinates-to-
state-code-in-r/8751965#8751965
• Code was switched to County
• Used a dataframe and export function (export to csv or write back to SQL)
• Pulled the data from a datafile or a table (SQL)
• Tested code on a small dataset first (Local Ohio counties)
• Verified results -> expanded to the larger dataset
32
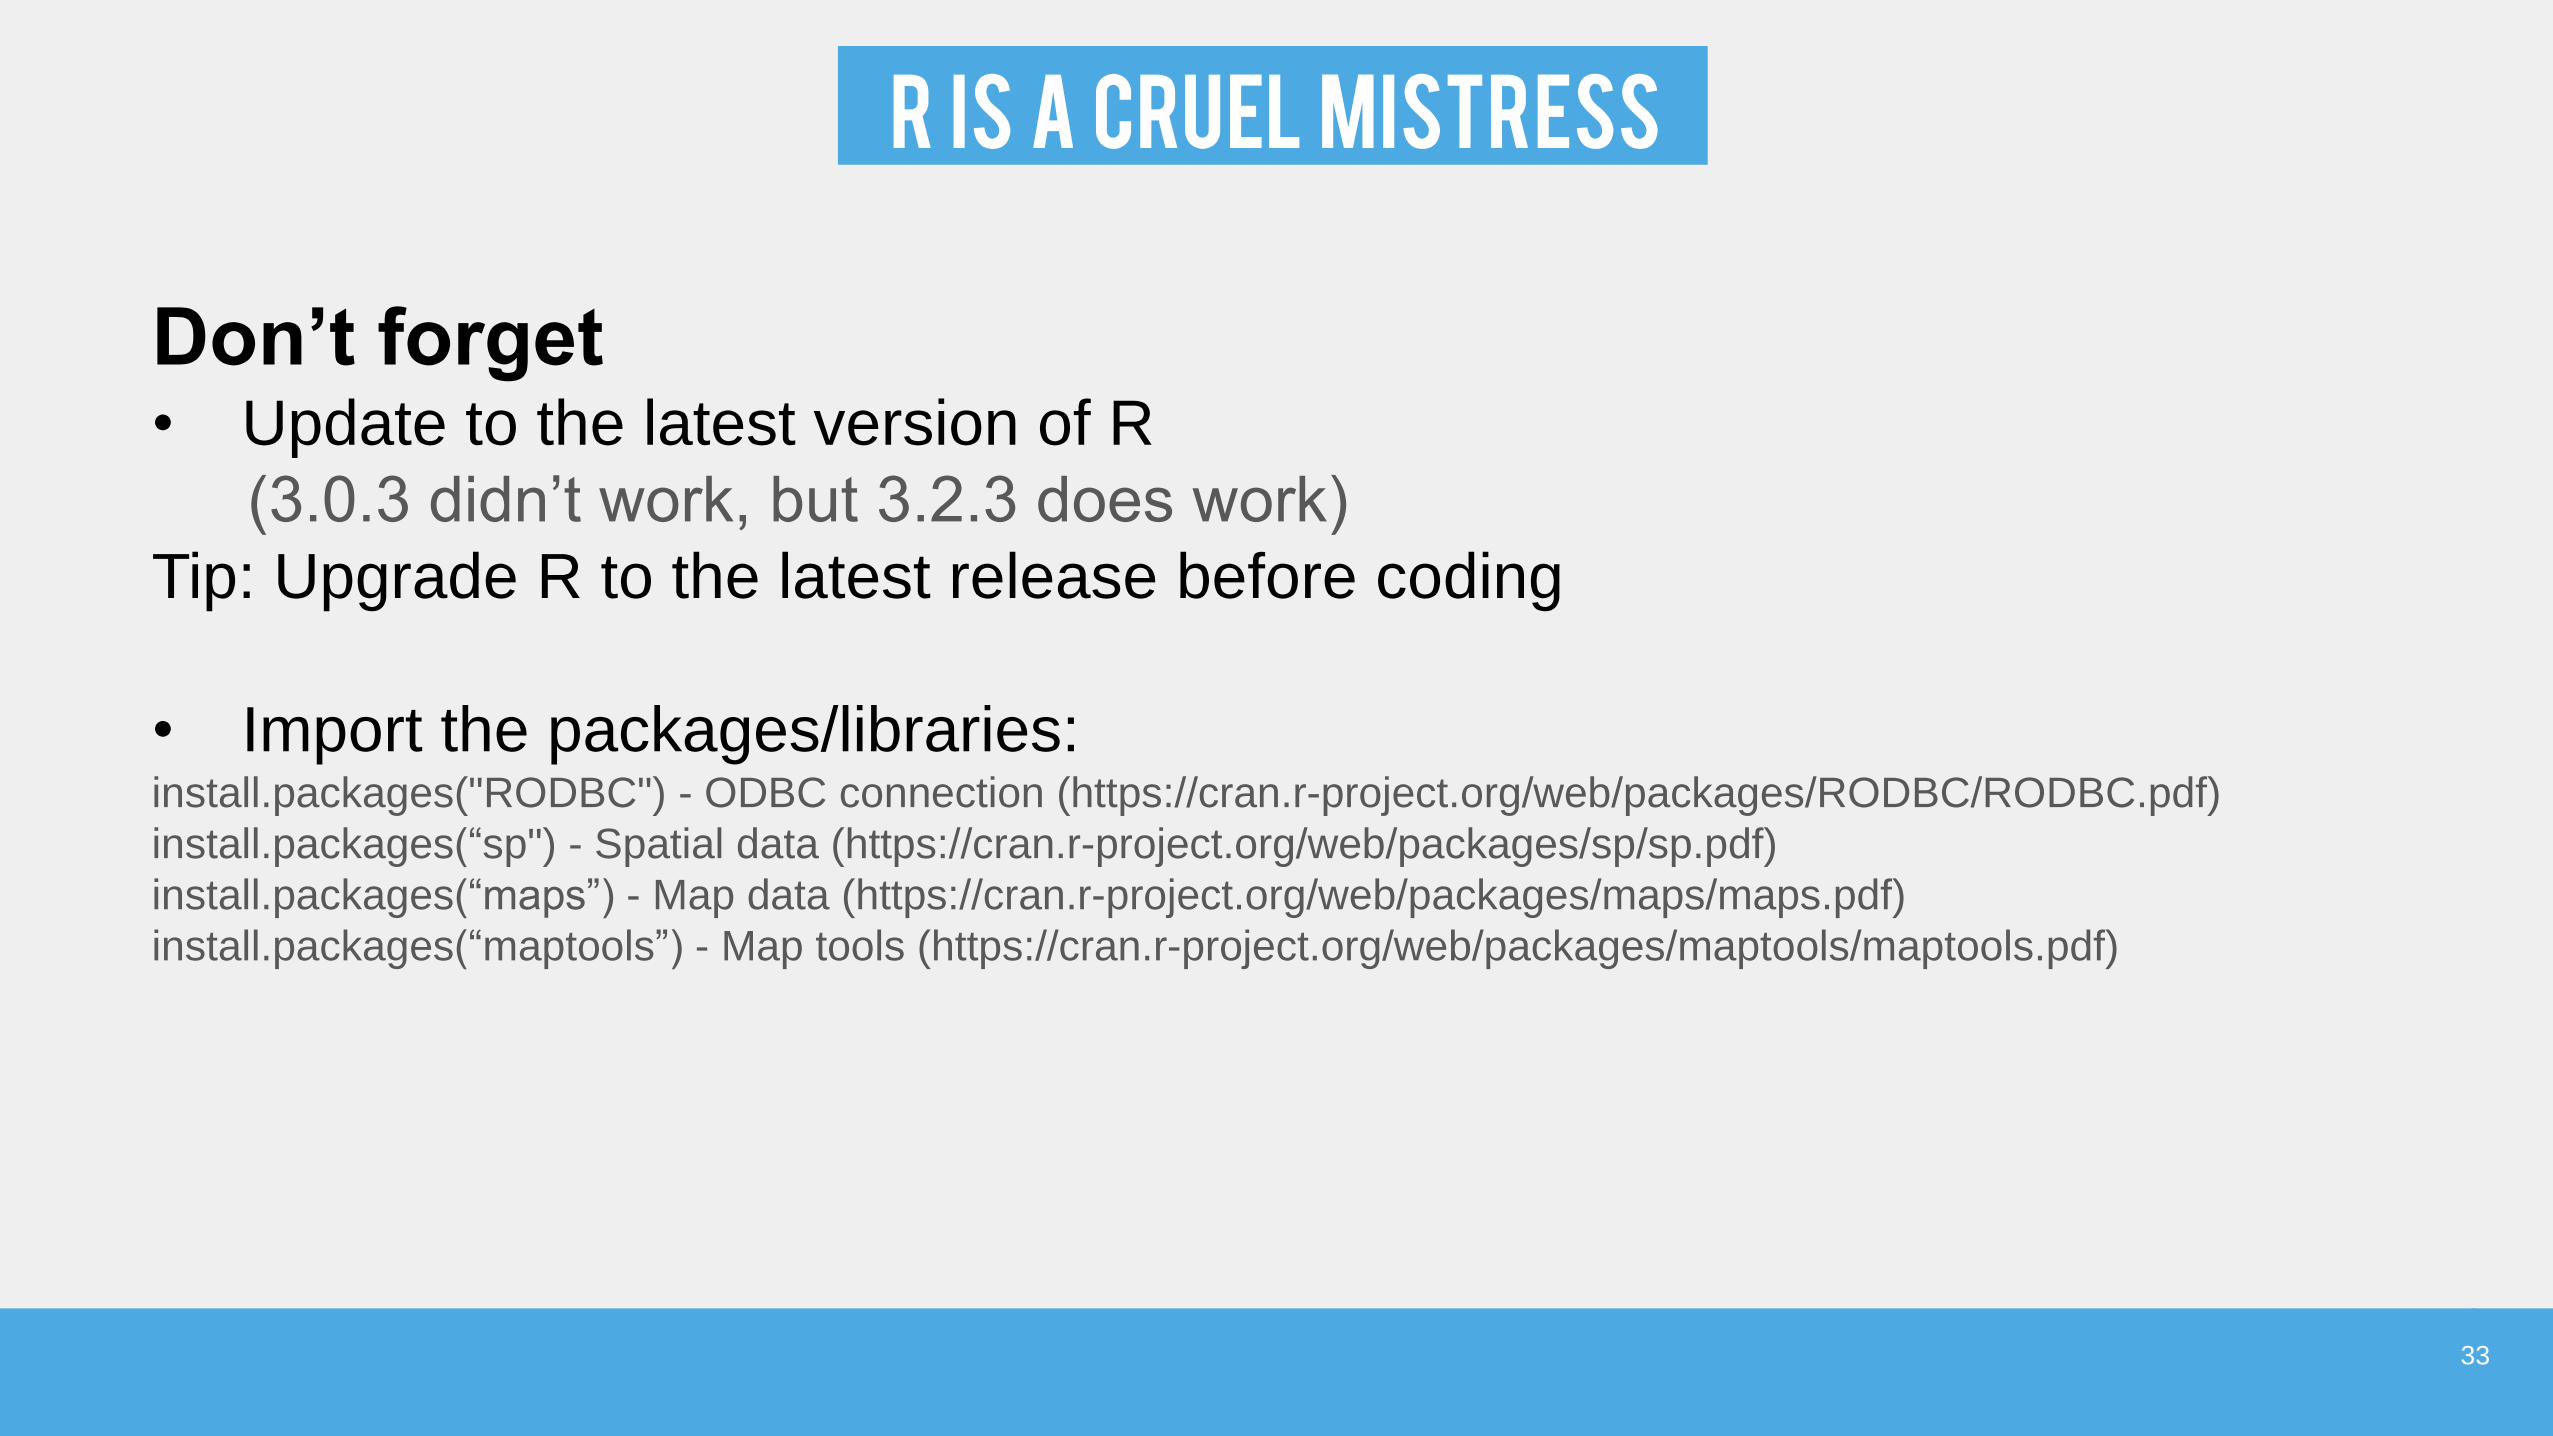
R IS A CRUEL MISTRESS
Don’t forget• Update to the latest version of R
(3.0.3 didn’t work, but 3.2.3 does work)
Tip: Upgrade R to the latest release before coding
• Import the packages/libraries: install.packages("RODBC") - ODBC connection (https://cran.r-project.org/web/packages/RODBC/RODBC.pdf)
install.packages(“sp") - Spatial data (https://cran.r-project.org/web/packages/sp/sp.pdf)
install.packages(“maps”) - Map data (https://cran.r-project.org/web/packages/maps/maps.pdf)
install.packages(“maptools”) - Map tools (https://cran.r-project.org/web/packages/maptools/maptools.pdf)
33

Calculation
• Functions for County and State
34
• Functions for County and State
9.7 Million Records < 5 Minutes
(on my laptop)
Parse data (SQL)

result
• Data on the County level over multiple years
35
GIF (http://recordit.co/T0jsIXStRY)

36
ThankSDon’t Forget to Join the
Cincinnati User Group Pagehttp://community.tableau.com/groups/midwest
Search for “Cincinnati Tableau User Group”