Cincinnati Law and Public Safety Committee Meeting Violence Update May 26, 2015 Institute of Crime...
29
Cincinnati Law and Public Safety Committee Meeting Violence Update May 26, 2015 Institute of Crime Science School of Criminal Justice University of Cincinnati
-
Upload
dorthy-richardson -
Category
Documents
-
view
217 -
download
1
Transcript of Cincinnati Law and Public Safety Committee Meeting Violence Update May 26, 2015 Institute of Crime...

Cincinnati Law and Public
Safety Committee Meeting
Violence Update
May 26, 2015Institute of Crime ScienceSchool of Criminal JusticeUniversity of Cincinnati

Year-to-Date and 6-Month
Violence Trends

2007 2008 2009 2010 2011 2012 2013 2014 20150
5
10
15
20
25
30
35
40
45
25
19
2522
30
18
27
32
24
Cincinnati Homicide TotalsJanuary 1 –May 24

2007 2008 2009 2010 2011 2012 2013 2014 20150
5
10
15
20
25
30
35
22
11
16
12
17
12
16
19
6
Cincinnati GMI Homicide TotalsJanuary 1 – May 24

06/07
07/08
08/09
09/10
10/11
11/12
12/13
13/14
14/15
0.0%
10.0
%
20.0
%
30.0
%
40.0
%
50.0
%
60.0
%
70.0
%
80.0
%
90.0
%
100.
0%
86.1%
53.8%
59.4%
59.3%
51.3%
60.9%
58.1%
64.1%
25.9%
Cincinnati Group Member Involved HomicidesNovember 25 – May 24

Cincinnati HomicideVictim Demographics 2005-2015
% Male % Black Avg. Age
2005 83.3% 85.9% 28.6
2006 82.2% 67.8% 31.3
2007 89.7% 85.3% 30.5
2008 91.8% 75.3% 32.8
2009 74.6% 90.9% 30.7
2010 87.8% 87.8% 27.3
2011 91.6% 95.5% 27.6
2012 86.8% 75.5% 30.2
2013 93.1% 91.5% 29.5
2014 87.1% 87.1% 29.9
2015 56.5% 69.6% 28.8
* 2015 does not contain full year of data

2007 2008 2009 2010 2011 2012 2013 2014 20150
50
100
150
200
250
126134
160145 148 150 156
133
162
Cincinnati Fatal and Non-Fatal Shooting VictimsJanuary 1 –May 24

06/07 07/08 08/09 09/10 10/11 11/12 12/13 13/14 14/150
50
100
150
200
250
170159
193 192 186 185 187
168
199
Cincinnati Fatal and Non-Fatal Shootings Victims
Last 6 Month Trends, November 25 – May 24

2007 2008 2009 2010 2011 2012 2013 2014 20150
50
100
150
200
250
170159
193 192186 185 187
168
199
Cincinnati Fatal and Nonfatal Shooting VictimsLast 6 Month Trends, November 25 – May 24
YTD Avg. +2 Std. Dev. -2 Std. Dev.

% Male % Black Avg. Age
2005 88.0% 84.6% 27.1
2006 87.4% 85.0% 26.8
2007 85.1% 83.5% 26.7
2008 90.4% 87.3% 26.9
2009 87.3% 92.2% 27.3
2010 90.2% 88.3% 27.6
2011 88.4% 87.0% 27.1
2012 90.1% 86.9% 27.7
2013 88.5% 92.0% 28.9
2014 87.9% 89.1 28.5
2015* 88.3% 91.4% 28.3
Cincinnati Fatal &Non-Fatal ShootingVictim Demographics 2005-2015
* 2015 does not contain full year of data

YearShooting Victims
Incidents
# of Multiple Victim
Incidents
% of Incidents with Multiple
Victims
Count of Victims from Multiple
Victim Incidents
2010 145 129 11 8.5% 27
2011 148 134 10 7.5% 24
2012 150 136 8 5.9% 22
2013 156 134 16 11.9% 38
2014 133 116 14 12.1% 31
2015 162 141 17 12.1% 39
Fatal and Non-Fatal Shootings: Multiple VictimsJanuary 1 – May 24

YearShooting Victims
Incidents
# of Multiple Victim
Incidents
% of Incidents with Multiple
Victims
Count of Victims from Multiple
Victim Incidents
2010 145 129 11 8.5% 27
2011 148 134 10 7.5% 24
2012 150 136 8 5.9% 22
2013 156 134 16 11.9% 38
2014 133 116 14 12.1% 31
2015 162 141 17 12.1% 39
2015 to 2014
+21.8%
+21.6%
2015 to 5-year average
+10.8%
+24.8%
Fatal and Non-Fatal Shootings: Multiple VictimsJanuary 1 – May 24

Neighborhood Count
Avondale 20
Westwood 13
Winton Hills 12
Walnut Hills 11
West End 11
Over-the-Rhine 10
Mount Airy 9
East Westwood 8
CUF 6
Roselawn 6
Top 10 Neighborhood Total 106
City Total 162
Fatal and Non-Fatal Shootings (Victims) in Top 10 Neighborhoods
January 1 – May 24
65.4% of all
shootings
41.4% of all
shootings

Fatal and Non-Fatal Shootings in Top 10 NeighborhoodsJanuary 1 – May 24
Neighborhood 2010 2011 2012 2013 2014 2015
Avondale 18 14 15 16 20 20
Westwood 11 6 7 4 4 13
Winton Hills 6 10 6 12 5 12
Walnut Hills 6 4 20 6 14 11
West End 11 5 7 10 12 11
Over-the-Rhine 10 30 17 16 14 10
Mount Airy 6 0 4 3 6 9
East Westwood 0 1 0 6 3 8
CUF 1 2 2 1 1 6
Roselawn 9 6 2 7 2 6
Top 10 Neighborhood Total 78 78 80 81 81 106
City Total 145 148 150 156 133 162
% of City Total 53.8% 52.7% 53.3% 51.9% 60.9% 65.4%

1/1-2/25
2/26-3/4
3/5-3/11
3/12-3/18
3/19-3/25
3/26-4/1
4/2-4/8
4/9-4/15
4/16-4/22
4/23-4/29
4/30-5/6
5/7-5/13
5/14-5/20
5/21-5/24
0
20
40
60
80
100
120
140
160
180
5257
6369
7785
9199
108114 123
133140
146
39 45 46 53
6876
8891 99
114
124
144
157162
2012-2014 Avg.
2015
Fatal and Nonfatal Shooting Cumulative CountsJanuary 1 – May 24
Call-in

1/1-
1/7
1/8-
1/14
1/15
-1/2
1
1/22
-1/2
8
1/29
-2/4
2/5-
2/11
2/12
-2/1
8
2/19
-2/2
5
2/26
-3/4
3/5-
3/11
3/12
-3/1
8
3/19
-3/2
5
3/26
-4/1
4/2-
4/8
4/9-
4/15
4/16
-4/2
2
4/23
-4/2
9
4/30
-5/6
5/7-
5/13
5/14
-5/2
0
5/21
-5/2
7
5/28
-6/3
6/4-
6/10
6/11
-6/1
7
6/18
-6/2
4
6/25
-7/1
7/2-
7/8
7/9-
7/15
7/16
-7/2
2
7/23
-7/2
9
7/30
-8/5
8/6-
8/12
8/13
-8/1
9
8/20
-8/2
6
8/27
-9/2
0
5
10
15
20
25
Fatal and Nonfatal Shootings –Weekly TrendsJanuary 1 – September 2
20152012/2013/2014 Avg
Call-In

Neighborhood ShootingVictims Population Rate per
1,000
Millvale 14 2,399 5.84
East Westwood 14 2,445 5.73
Winton Hills 21 4,787 4.39
Spring Grove Village 8 1,964 4.07
Avondale 49 12,466 3.93
Walnut Hills 25 6,495 3.85
Over-the-Rhine 22 6,064 3.63
West End 24 6,627 3.62
North Avondale 11 3,229 3.41
Fay Apartments 6 1,916 3.13
Fatal and Non-Fatal Shooting Rates in Top 10 Neighborhoods*
12 Month Trend: May 25, 2014 – May 24, 2015
*Neighborhoods with 5 or fewer shootings were excluded from this analysis

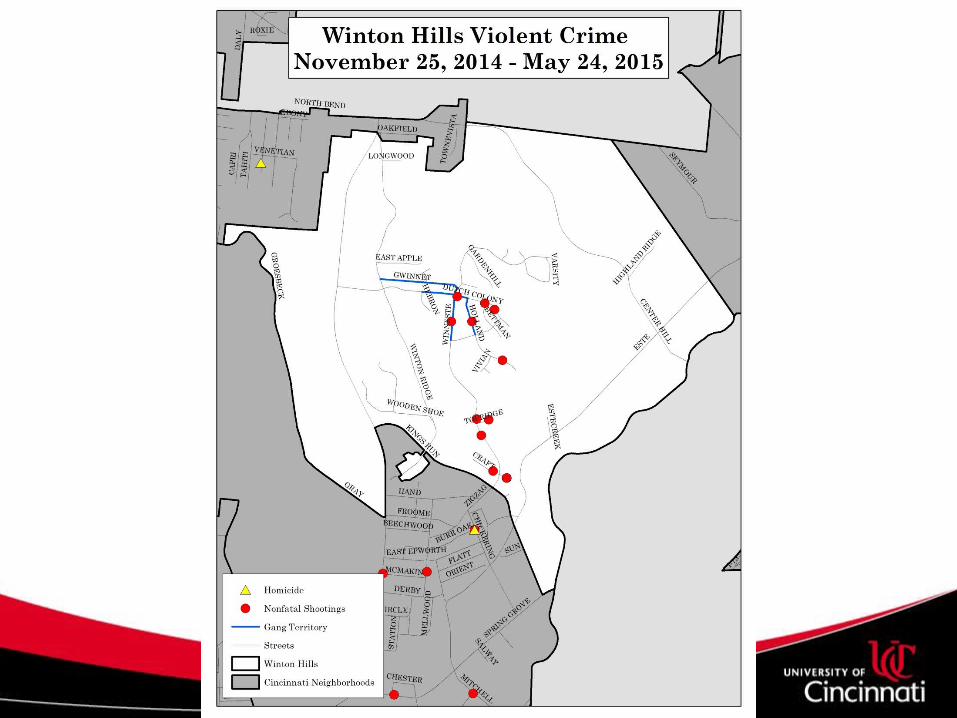
6 Month Violence Trend Maps
Top 5 Neighborhoods