CIMB ISLAMIC BALANCED FUND CONTENTS PAGE(S) · cimb islamic balanced fund contents page(s)...
59
CIMB ISLAMIC BALANCED FUND CONTENTS PAGE(S) INVESTORS' LETTER 1 MANAGER’S REPORT 2 - 9 Fund Objective and Policy Performance Data Market Review Fund Performance Portfolio Structure Market Outlook Investment Strategy Unit Holdings Statistics Soft Commissions and Rebates STATEMENT BY MANAGER 10 TRUSTEE’S REPORT 11 SHARIAH ADVISER'S REPORT 12 UNAUDITED STATEMENT OF COMPREHENSIVE INCOME 13 UNAUDITED STATEMENT OF FINANCIAL POSITION 14 UNAUDITED STATEMENT OF CHANGES IN EQUITY 15 UNAUDITED STATEMENT OF CASH FLOWS 16 NOTES TO THE FINANCIAL STATEMENTS 17 - 53 DIRECTORY 54 LIST OF CWA (an Agency force of CIMB-Principal) OFFICES 55 - 58
Transcript of CIMB ISLAMIC BALANCED FUND CONTENTS PAGE(S) · cimb islamic balanced fund contents page(s)...

CIMB ISLAMIC BALANCED FUND
CONTENTS PAGE(S) INVESTORS' LETTER 1
MANAGER’S REPORT 2 - 9
Fund Objective and Policy
Performance Data
Market Review
Fund Performance
Portfolio Structure
Market Outlook
Investment Strategy
Unit Holdings Statistics
Soft Commissions and Rebates
STATEMENT BY MANAGER 10
TRUSTEE’S REPORT 11
SHARIAH ADVISER'S REPORT 12
UNAUDITED STATEMENT OF COMPREHENSIVE INCOME 13 UNAUDITED STATEMENT OF FINANCIAL POSITION 14 UNAUDITED STATEMENT OF CHANGES IN EQUITY 15 UNAUDITED STATEMENT OF CASH FLOWS 16 NOTES TO THE FINANCIAL STATEMENTS 17 - 53 DIRECTORY 54 LIST OF CWA (an Agency force of CIMB-Principal) OFFICES 55 - 58

CIMB ISLAMIC BALANCED FUND
1
INVESTORS' LETTER Dear Valued Investors, We are very pleased to share the great news that CIMB-Principal Asset Management Berhad (“CIMB-Principal”) has just received the coveted Best Overall Group award at The Edge-Thomson Reuters Lipper Fund Awards 2016. Our funds have also been recognised for being the best in its categories for the year ended 31 December 2015 by The Edge-Thomson Reuters Lipper Fund Awards 2016 and the Morningstar Award 2016 Malaysia: The Edge-Thomson Reuters Lipper Fund Awards 2016
CIMB-Principal Asia Pacific Dynamic Income Fund
Best Equity Asia-Pacific Ex-Japan MYR (3 Years)
CIMB-Principal Global Titans Fund
Best Equity Global (3 & 5 Years)
CIMB-Principal Asian Equity Fund
Best Equity Asia-Pacific Ex-Japan (5 Years)
CIMB Islamic Asia Pacific Equity Fund
Best Equity Asia-Pacific Ex-Japan Islamic (3 Years)
Morningstar Award 2016 Malaysia
CIMB-Principal Asia Pacific Dynamic Income Fund
Best Asia-Pacific Equity Fund The awards came at the right time, proving that CIMB-Principal is a consistent performer and able to weather the headwinds despite the challenging market environment. They are also a great recognition of how our investment team implemented effective investment strategies to deliver risk-adjusted returns for our investors. These accolades reinforces our dedication in delivering the best value and demonstrates how we are moving forward to be the most preferred asset manager in the country. We would like to take this opportunity to sincerely thank you for your continuous support and confidence in our services. CIMB-Principal remains committed in helping you to grow your investment. Yours faithfully, for CIMB-Principal Asset Management Berhad
Munirah Khairuddin Chief Executive Officer/Executive Director

CIMB ISLAMIC BALANCED FUND
2
MANAGER’S REPORT FUND OBJECTIVE AND POLICY What is the investment objective of the Fund? The Fund aims to achieve medium to long-term growth in both capital and income by investing in permissible Shariah-compliant investments. Has the Fund achieved its objective? The Fund’s objective of providing capital and income over the medium to long-term is still in place. Over 3 years and 5 years, the Fund has grown by 18.91% and 27.33% respectively. What are the Fund investment policy and principal investment strategy? The Fund aims to invest in a diversified portfolio of Shariah-compliant equities and Shariah-compliant fixed income investments. In line with its objective, the investment policy and strategy is to maintain a balanced portfolio between Shariah-compliant equities and Shariah-compliant fixed income investments in the ratio of 60:40. The fixed income portion of the Fund is to provide some capital stability to the Fund whilst the equity portion will provide the added return in a rising market. The investments by the Fund in Shariah-compliant equities shall not exceed 60% of the Net Asset Value ("NAV") of the Fund and investments in Shariah-compliant fixed income securities and Shariah-compliant liquid assets shall not be less than 40% of the NAV of the Fund with a minimum credit rating of “BBB3” or “P2” by RAM Ratings ("RAM") or equivalent rating by Malaysian Rating Corporation Berhad ("MARC") or by local rating agency(ies) of the country; “BBB” by Standard & Poor's ("S&P") or equivalent rating by Moody's or Fitch. The Fund may invest up to 25% of its NAV in unrated Shariah-compliant fixed income securities. At least 2% of the Fund's NAV will be invested in Shariah-compliant liquid assets. The Fund may opt to invest in Shariah-compliant foreign equities up to a maximum of 30% of its NAV. Such foreign equities must be of equity securities of companies domiciled in, listed in, and/or have significant operations in countries in Asia Pacific ex Japan. 'Significant operations' means major businesses of the company. For example, the Fund can invest in a company with significant business and/or operations in Thailand but listed on the New York Stock Exchange (“NYSE”). The threshold for 'significant operations' would be if more than 30% of total group revenue derives from countries in Asia Pacific ex Japan. The calculation would be based on the most recent financial reports released by the companies (e.g. interim and annual reports). Fund category/type Balanced (Shariah-compliant)/Growth and Income How long should you invest for? Recommended three (3) years or more Indication of short-term risk (low, moderate, high) Moderate When was the Fund launched? 8 March 2001 What was the size of the Fund as at 31 March 2016? RM378.07 million (777.20 million units) What is the Fund’s benchmark? 30% Financial Times Stock Exchange (“FTSE”) Bursa Malaysia EMAS Shariah (“FBMS”) Index + 30% Morgan Stanley Capital International All Country (“MSCI AC”) Asia ex Japan Islamic Index + 40% CIMB Islamic 1-month General Investment Account-i (“GIA”) Note: The benchmark is customised as such to align it closer to the structure of the portfolio and the objective of the Fund. The 1-Month GIA Rate is reflective of the objective of the Fund. Thus, investors are cautioned that the risk profile of the Fund is higher than investing in Shariah-compliant deposits.

CIMB ISLAMIC BALANCED FUND
3
FUND OBJECTIVE AND POLICY (CONTINUED) What is the Fund distribution policy? The Manager has the discretion to distribute part or all of the Fund’s distributable income. The distribution (if any) may vary from period to period depending on the investment objective and the performance of the Fund. What was the net income distribution for the six months financial period ended 31 March 2016? There was no distribution made for the six months financial period ended 31 March 2016. PERFORMANCE DATA Details of portfolio composition of the Fund for the last three financial periods are as follows: 31.03.2016 31.03.2015 31.03.2014 % % % Shariah-compliant collective investment
scheme 0.57
-
- Shariah-compliant quoted securities - Basic Materials 1.52 2.89 1.92 - Construction 2.26 2.72 - - Consumer Products 8.53 8.56 8.13 - Energy 2.21 0.28 6.35 - Finance 3.60 2.01 1.40 - Health Care 0.50 3.16 0.72 - Industrials 9.57 6.71 9.49 - Infrastructure Project Companies (“IPC”) 2.05 2.45 1.74 - Plantation 2.89 1.41 1.47 - Properties - 0.05 0.26 - Technology 4.28 6.27 6.33 - Telecommunications 6.21 4.15 4.13 - Trading/Services 12.04 17.49 11.89 - Utilities 0.88 0.64 0.05 Unquoted Sukuk 36.32 31.03 33.99 Cash and other net assets 6.57 10.18 12.13
100.00 100.00 100.00
Performance details of the Fund for the last three financial periods are as follows: 31.03.2016 31.03.2015 31.03.2014 NAV (RM Million) 378.07 356.59 400.53 Units in circulation (Million) 777.20 712.26 854.42 NAV per unit (RM) 0.4864 0.5006 0.4687 01.10.2015
to 31.03.2016 01.10.2014
to 31.03.2015 01.10.2013
to 31.03.2014 Highest NAV per unit (RM) 0.5090 0.5023 0.4684 Lowest NAV per unit (RM) 0.4805 0.4540 0.4555 Total return (%) (2.45) 7.73 4.08 - Capital growth (%) (2.45) 7.73 1.73 - Income distribution (%) - - 2.29

CIMB ISLAMIC BALANCED FUND
4
PERFORMANCE DATA (CONTINUED)
01.10.2015
to 31.03.2016 01.10.2014
to 31.03.2015 01.10.2013
to 31.03.2014 Management Expense Ratio (“MER”) (%) ^ 0.89 0.84 0.85 Portfolio Turnover Ratio (“PTR”) (times) # 0.48 0.27 0.28 ^ The Fund’s MER increased from 0.84% to 0.89% mainly due to the increase in other expenses
pursuant to the implementation of Goods and Services Tax (“GST”) effective from 1 April 2015. # The Fund’s PTR increased from 0.27 times to 0.48 times due to higher trading activities on the
back of the volatile market during the financial period under review.
01.10.2015
to 31.03.2016 01.10.2014
to 31.03.2015 01.10.2013
to 31.03.2014 Date of distribution - - 22.11.2013 Gross distribution per unit (sen) - - 1.05 Net distribution per unit (sen) - - 1.04 31.03.2016 31.03.2015 31.03.2014 31.03.2013 31.03.2012 % % % % % Annual total return (0.77) 9.80 9.13 5.95 1.06 (Launch date: 8 March 2001) Past performance is not necessarily indicative of future performance and that unit prices and investment returns may go down, as well as up. All performance figures for the financial period have been extracted from Lipper.
MARKET REVIEW (1 OCTOBER 2015 TO 31 MARCH 2016) Regional Equity The financial period from October 2015 to March 2016 has been turbulent for Asian markets. During the financial period under review, the MSCI AC Asia ex Japan Islamic Index rose by 7.0%. However, in Malaysian Ringgit (“MYR”) terms, the benchmark fell 5.4% primarily due to the strengthening of the MYR versus other currencies. Asian markets started the financial period with a rally after central banks around the world cut interest rates. In particular, Chinese equities listed in Hong Kong rallied massively in April 2015 with the trigger being the announcement on 27 March 2015 to broaden access to the southbound link for China funds. Due to tight domestic liquidity conditions, the People’s Bank of China (“PBOC”) cut the Reserve Requirement Ratio (“RRR”) by a larger than expected 100 basis points (“bps”) on 19 April 2015. The Shanghai Stock Exchange Composite Index peaked at 5,166 points on 12 June 2015. It then fell 17% in June 2015 due to a combination of an over-extended market, unwinding of margin financing and liquidity being drained by large Initial Public Offering ("IPOs"). The sell-off in China spilled over to the large North Asian markets like Hong Kong, Korea and Taiwan. Asian equities fell 2% in the month of June 2015. Asian markets experienced deeper correction in the month of July 2015. The Chinese market continued to sell-off despite a frenzy of government measures. Other Asian markets also sold off in sympathy, partly due to worries over possible impact of slowing China economic growth. Asian markets continued to fall sharply in August 2015 led by faster than expected deceleration in China’s economy, which also led to 3% devaluation in the Chinese Yuan Renminbi (“CNY”). The sell-off narrowed to -4% in the month of September 2015 as investors de-risked on concerns over disinflationary pressures and a slowdown in global growth.
CIMB ISLAMIC BALANCED FUND
5
MARKET REVIEW (1 OCTOBER 2015 TO 31 MARCH 2016) (CONTINUED) Regional Equity (continued) Asian markets rallied 12% in October 2015 on the back of the US Federal Reserve (the “Fed”)’s decision to keep rates on hold and weak US payroll data during the month. The rally was also exaggerated by the overly bearish positioning of global funds after 4 straight months of decline. However, Asian markets fell 2.7% in the following month on the back of rising geopolitical tensions between Turkey and Russia, terror attacks in Paris and was flat after the Fed rate hike in December 2015. Asian markets went through a sharp correction in the month of January 2016 after the introduction of circuit breakers in China accelerated the selling from the first day of the year. This led to new fears of capital controls in China. Sentiment towards China recovered and coupled with a dovish Fed statement, Asian markets rallied 10% in March 2016. This also led to a rebound of commodity prices from their lows in January 2016 and also the strengthening Asian currencies versus the US Dollar (“USD”). Local Equity Overall, the FBMS Index rose by 5.1% to 12,498 points during the financial period under review. In October 2015, the market was lifted by the Fed’s dovish tones on rate hike, as well as the European Central Bank (“ECB”) hint that it could extend easing. China’s willingness for policy support also encouraged market stability and prompted some fund flows back into Emerging Markets (“EM”). This extended to November 2015, where news about the sale of Edra Global Energy Berhad’s power assets to the Chinese, as well as China’s commitment to buy Malaysian bonds helped support sentiment. December 2015 was a volatile month. Oil prices dipped after the Organization of the Petroleum Exporting Countries (“OPEC”) refrained from setting an official output target. Meanwhile, the much debated Fed’s liftoff finally happened as interest rates were raised by 25 bps. Equities had a rocky start in 2016. The FBMS Index ended the month of January 2016 at 12,420 points, a loss of 2.97% from the previous month. Oil prices and worries about China’s economic health were in focus at the start of the year. Oil prices dropped to the lowest level in 12 years as turmoil in China’s markets pushed crude oil closer to USD30 per barrel on concern that the economic slowdown in China is worsening. The MYR rose to a 3-month high after Prime Minister Najib Razak announced measures to shore up the economy. He maintained the fiscal deficit target in the budget revisions while lowering employee state pension contributions. 2016 growth forecasts were trimmed to between 4.0%-4.5% from 4.0%-5.0% and the assumption price of oil cut to USD30 to USD35 per barrel from USD48 per barrel. In February 2016, the FBMS Index continued its downtrend. The market continued to be roiled by fluctuating oil prices despite co-ordinated actions by Saudi Arabia, Russia, Qatar and Venezuela to hold output steady at January 2016 levels. Comments from the Fed that they would not rush to increase rates in the face of global market turmoil failed to stem a sell-off in risk assets. Malaysia’s fourth quarter of 2015 real Gross Domestic Product (“GDP”) growth slowed for the 3rd consecutive quarter to 4.5% year-on-year (“y-o-y”). Full year 2015 growth moderated to 5.0%. The FBMS Index ended the month of March 2016 at 12,498 points, a gain of 2.0% from the previous month. The market was in risk-on mode in March 2016 on the back of comments from the Fed that it would “proceed cautiously in adjusting policy”. The MYR appreciated against the USD, gaining 7.2% month-on-month (“m-o-m”) to settle at RM3.8995 against the USD.

CIMB ISLAMIC BALANCED FUND
6
MARKET REVIEW (1 OCTOBER 2015 TO 31 MARCH 2016) (CONTINUED) Local Sukuk Market players turned cautious in the fourth quarter of 2015 as the Fed signaled that it may hike its interest rate in December 2015, leading to a spike in sovereign yields. However, January 2016 saw the Government Investment Issues (“GII”) rally as investors took up positions after staying sidelined at the end of 2015. Demand for sovereign issues extended out the curve, as investors searched for relative yield pickup after Bank Negara Malaysia (“BNM”) cut the Statutory Reserve Requirement (“SRR”). This is the first time since 2009 that BNM has decided to cut the amount of cash that banks must set aside as reserves. A reduction in SRR means a certain amount of liquidity will be injected into the financial system, which is expected to be used by banks to finance more economic activities in the market. Trading volume for corporate Sukuk was robust during the financial period under review. Most of the trades were focused at Government-Guaranteed (“GG”), AAA and AA rated Sukuk. BNM reiterated that the stance of monetary policy remains accommodative and supportive of economic activity. Assessment on the global and domestic economy has turned more cautious as BNM highlighted increased downside risks to domestic growth outlook. BNM believes that recovery in the advanced economies has not been as strong as earlier expected and that growth in emerging economies has slowed. The latest statement also highlighted heightened financial market volatility poses additional downside risk to global growth. FUND PERFORMANCE
6 months to
31.03.2016 1 year to
31.03.2016 3 years to
31.03.2016 5 years to
31.03.2016
Since inception to
31.03.2016
% % % % %
Income - 2.31 7.25 19.97 106.53 Capital (2.45) (3.02) 10.88 6.15 25.37 Total Return (2.45) (0.77) 18.91 27.33 157.03
Benchmark 1.23 (1.55) 13.67 17.15 97.22
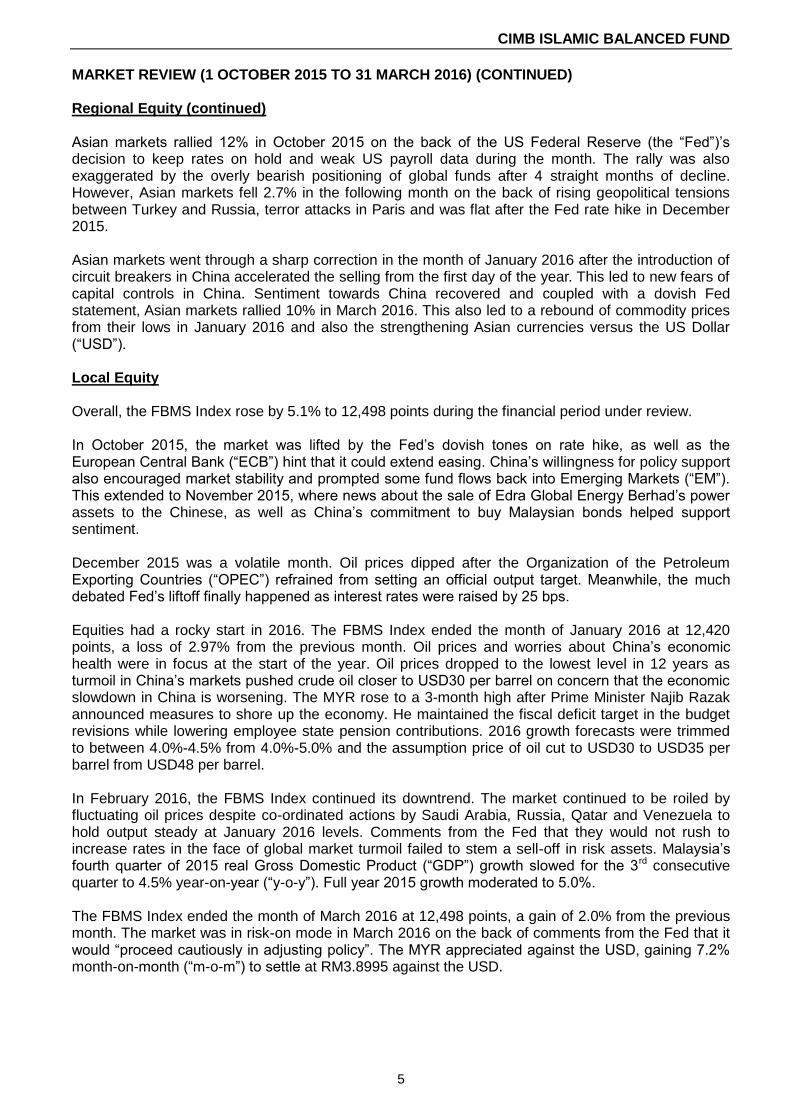
Average Total Return N/A (0.77) 5.94 4.95 6.46 For the financial period under review, the Fund fell 2.45%, while the benchmark rose 1.23%. As such, the Fund underperformed its benchmark by 3.68%. Over 3 years and 5 years, the Fund has grown by 18.91% and 27.33% respectively.

CIMB ISLAMIC BALANCED FUND
7
FUND PERFORMANCE (CONTINUED)
G
Changes in NAV
31.03.2016 31.03.2015 Changes
%
NAV (RM Million) 378.07 356.59 6.02
NAV/unit (RM) 0.4864 0.5006 (2.84) NAV per unit fell by 2.84% in the financial period under review as the Fund was weighed down by selling pressure on exporters at the start of this year on the back of the strengthening MYR. Performance data represents the combined income and capital return as a result of holding units in the Fund for the specified length of time, based on NAV to NAV price. The performance data assumes that all earnings from the Fund are reinvested and are net of management and trustee fees. Past performance is not reflective of future performance and income distributions are not guaranteed. Unit prices and income distributions, if any, may fall and rise. All performance figures for the financial period have been extracted from Lipper.
0%
20%
40%
60%
80%
100%
120%
140%
160%
180% CIMB Islamic Balanced Fund
30% FBMS Index + 30% MSCI AC Asia ex Japan Islamic Index + 40% CIMB Islamic 1-month GIA

CIMB ISLAMIC BALANCED FUND
8
PORTFOLIO STRUCTURE Asset allocation
(% of NAV) 31.03.2016 31.03.2015
Shariah-compliant collective investment scheme 0.57 -
Shariah-compliant quoted securities - local 29.34 29.23
Shariah-compliant quoted securities - foreign 27.20 29.56
Unquoted Sukuk 36.32 31.03
Cash and other net assets 6.57 10.18
TOTAL 100.00 100.00
As at 31 March 2016, local equity exposure was maintained at 29.34%, while the foreign equity exposure was reduced to 27.20% from 29.56% a year ago. On the other hand, Sukuk exposure increased to 36.32% from last year’s 31.03%, which was in line with our strategy of positioning the Fund defensively amidst the cautious view on the Asian market. MARKET OUTLOOK* Regional Equity The change in the Fed’s view towards being more dovish has brought about a halt in USD strength and triggered a ‘reversion’ rally in EM assets. We expect this risk-taking sentiment to persist for a few months, buoying Asian fixed income and normalizing returns of oversold currencies. With inflation in check, the short term investment theme will focus on the search for higher yielding assets. However, beyond the short term rally, Asia will have to demonstrate higher productivity and economic growth than that seen in developing market, in order to have a longer term return of strong capital flows into the region. We continue to view 2016 as a year of slow global growth, low inflation and elevated volatility. Local Equity
In the short term, we believe that the FBMS Index should have a positive bias based on the following: i) Capital flows will continue to seek refuge in defensive higher yielding countries like Malaysia especially in an environment where negative yields persist in the Europe and Japan; ii) Earnings momentum, although negative, is bottoming and expectations are more realistic than a year ago; and iii) Malaysia is cheap from a USD perspective based on price to book (1.7 times currently versus 2.1 times on a 5-year average). Local Sukuk There is growing scepticism about the Fed's ability to raise interest rates again this year given the mixed bag of US domestic economic figures together with lingering worries about weak global growth and the absence of a broad deal among major oil producers to control output. In addition, the recent Bank of Japan’s (“BOJ”) adoption of negative interest rate and the RRR cut by PBOC which signaled intensified policy easing added another piece of dovish news to the market. The local sovereign yields have moved lower over the last few months. In the absence of additional catalysts, we expect sovereign yields to trade range bound on the back of steady domestic institutional demand. In the primary issuance space, corporate Sukuk supply pipeline is expected to remain active. We expect the sentiment for corporate Sukuk market will continue to be well supported with investors continue to look at secondary offerings to fill up their portfolios. *This market outlook does not constitute an offer, invitation, commitment, advice or recommendation to make a purchase of any investment. The information given in this report represents the views of CIMB-Principal or based on data obtained from sources believed to be reliable by CIMB-Principal. Whilst every care has been taken in preparing this, CIMB-Principal makes no guarantee, representation or warranty and is under no circumstances liable for any loss or damage caused by reliance on, any opinion, advice or statement made in this market outlook.

CIMB ISLAMIC BALANCED FUND
9
INVESTMENT STRATEGY Regional Equity We remain neutral on Asian equities. Beyond the expected near-term increase in risk appetite, Asian equities will continue to struggle against poor corporate earnings amidst a lack of growth opportunities. Our portfolios are fully invested, with our research efforts focused on identifying companies which could benefit from the next industrial revolution, infrastructure spending, or capital expenditure (“CAPEX”) cuts. Local Equity As part of risk management, we continue to reduce our exposure to selective Exporters. We believe large caps currently offer more value than small caps. We remain neutral in Plantation, but underweight for Telecommunications sector. Construction remains a sector which we continue to overweight as we believe the government will continue to roll out more high impact infrastructure projects. Local Sukuk We continue to overweight on corporate Sukuk with focus on the primary issuances which offer better yield pickup. We will also invest in lower rated corporate Sukuk issuances for yield enhancement but remain selective as downgrades and defaults on credit market are expected to rise in the near term. UNIT HOLDINGS STATISTICS Breakdown of unit holdings by size as at 31 March 2016 are as follows:
Size of unit holdings (units) No. of unit holders No. of units held (million)
% of units held
5,000 and below 53,578 13.15 1.69
5,001-10,000 4,553 33.92 4.36
10,001-50,000 11,363 267.97 34.48
50,001-500,000 3,528 371.25 47.77
500,001 and above 65 90.91 11.70
Total 73,087 777.20 100.00
SOFT COMMISSIONS AND REBATES CIMB-Principal Asset Management Berhad (the “Manager”) and the Trustee (including their officers) will not retain any form of rebate or soft commission from, or otherwise share in any commission with, any broker in consideration for directing dealings in the investments of the Funds unless the soft commission received is retained in the form of goods and services such as financial wire services and stock quotations system incidental to investment management of the Funds. All dealings with brokers are executed on best available terms. During the financial period under review, the Manager and the Trustee did not receive any rebates from the brokers or dealers but have retained soft commission in the form of goods and services such as financial wire services and stock quotations system incidental to investment management of the Funds.

CIMB ISLAMIC BALANCED FUND
10
STATEMENT BY MANAGER TO THE UNIT HOLDERS OF CIMB ISLAMIC BALANCED FUND We, being the Directors of CIMB-Principal Asset Management Berhad (the "Manager"), do hereby state that, in the opinion of the Manager, the accompanying unaudited financial statements set out on pages 13 to 53 are drawn up in accordance with the provisions of the Deeds and give a true and fair view of the financial position of the Fund as at 31 March 2016 and of its financial performance, changes in equity and cash flows for the financial period then ended in accordance with Malaysian Financial Reporting Standards ("MFRS") 134 - Interim Financial Reporting and International Accounting Standards ("IAS") 34 - Interim Financial Reporting. For and on behalf of the Manager CIMB-Principal Asset Management Berhad (Company No.: 304078-K) MUNIRAH KHAIRUDDIN ALEJANDRO ECHEGORRI Chief Executive Officer/Executive Director Executive Director Kuala Lumpur 16 May 2016

CIMB ISLAMIC BALANCED FUND
11
TRUSTEE’S REPORT TO THE UNIT HOLDERS OF CIMB ISLAMIC BALANCED FUND We, Universal Trustee (Malaysia) Berhad, being the Trustee for CIMB Islamic Balanced Fund (the “Fund”), are of the opinion that CIMB-Principal Asset Management Berhad (the “Manager”), acting in the capacity of Manager of the Fund, have fulfilled their duties in the following manner for the six months financial period ended 31 March 2016: (a) the Fund is being managed in accordance with the limitations imposed on the investment
powers of the Manager and the Trustee under the Deeds, the Securities Commission’s Guidelines on the Unit Trust Funds, the Capital Market and Services Act 2007 and other applicable laws;
(b) valuation/pricing is carried out in accordance with the Deeds and relevant regulatory
requirements; and (c) creation and cancellation of units are carried out in accordance with the Deeds and relevant
regulatory requirements. For and on behalf of the Trustee, UNIVERSAL TRUSTEE (MALAYSIA) BERHAD ONG TEE VANN Chief Executive Officer Kuala Lumpur 16 May 2016

CIMB ISLAMIC BALANCED FUND
12
SHARIAH ADVISER’S REPORT TO THE UNIT HOLDERS OF CIMB ISLAMIC BALANCED FUND We have acted as the Shariah Adviser of CIMB Islamic Balanced Fund (the “Fund”) for the six months financial period ended 31 March 2016. Our responsibility is to ensure that the procedures and processes employed by CIMB-Principal Asset Management Berhad (the “Manager”) are in accordance with Shariah and Shariah Investment Guidelines. In our opinion, the Manager has managed and administered the Fund in accordance with the Shariah Investment Guidelines of the Fund and complied with applicable guidelines, rulings or decisions issued by the Securities Commission Malaysia pertaining to Shariah matters for the six months financial period ended 31 March 2016. In addition, we also confirm that the investment portfolio of the Fund comprises securities which have been classified as Shariah-compliant by the Shariah Advisory Council of the Securities Commission Malaysia. For investments other than the abovementioned, we have reviewed the same and are of the opinion that these investments were in accordance with the Shariah Investment Guidelines of the Fund with the exception of Jiangsu Expressway Company Ltd. However, the said security has been disposed on 1 December 2015. No excess gain derived from the disposal. This report is made solely to the unit holders of the Fund, as a body, and for no other purpose. We do not assume responsibility to any other person for the content of this report and we shall not be liable for any errors or non-disclosure on the part of the Manager. For and on behalf of Shariah Adviser CIMB Islamic Bank Berhad ABDUL GHANI ENDUT Group Head, Shariah & Governance/Designated Person Responsible for Shariah Advisory Kuala Lumpur 16 May 2016

CIMB ISLAMIC BALANCED FUND
13
UNAUDITED STATEMENT OF COMPREHENSIVE INCOME FOR THE SIX MONTHS FINANCIAL PERIOD ENDED 31 MARCH 2016
01.10.2015
to 31.03.2016 01.10.2014
to 31.03.2015 Note RM RM INVESTMENT (LOSS)/INCOME Dividend income 1,721,475 1,957,392 Profit income 4 3,084,349 2,631,845 Net (loss)/gain on financial assets at fair value through profit or loss 9 (6,533,561) 22,066,199 Net foreign exchange (loss)/gain (3,650,242) 2,657,931 Other income 8,121 -
(5,369,858) 29,313,367
EXPENSES Management fee 5 2,805,704 2,655,665 Trustee’s and custodian fees 6 213,189 262,687 Audit fee 11,635 10,305 Tax agent’s fee 25,817 22,805 Transaction costs 549,427 459,207 Other expenses 267,489 21,253
3,873,261 3,431,922
(LOSS)/PROFIT BEFORE TAXATION (9,243,119) 25,881,445 Taxation 8 (34,299) (137,488)
(LOSS)/PROFIT AFTER TAXATION AND TOTAL COMPREHENSIVE (LOSS)/INCOME FOR THE FINANCIAL PERIOD (9,277,418) 25,743,957
(Loss)/Profit after taxation is made up as follows: Realised amount 687,997 (679,837) Unrealised amount (9,965,415) 26,423,794
(9,277,418) 25,743,957
The accompanying notes to the financial statements form an integral part of the unaudited financial statements.

CIMB ISLAMIC BALANCED FUND
14
UNAUDITED STATEMENT OF FINANCIAL POSITION AS AT 31 MARCH 2016
31.03.2016 30.09.2015
Audited
Note RM RM
CURRENT ASSETS Financial assets at fair value through profit or loss
(Shariah-compliant) 9 353,282,502 279,201,816
Cash and cash equivalents (Shariah-compliant) 10 31,060,872 80,686,132
Amount due from stockbrokers 1,144,371 1,008,995
Amount due from Manager 1,240,416 1,249,420 Amount due from Manager of collective investment scheme 4,061 -
Dividends receivable 208,983 231,459
Tax recoverable 61,077 61,077
TOTAL ASSETS 387,002,282 362,438,899
CURRENT LIABILITIES
Amount due to stockbrokers 7,540,780 347,633
Amount due to Manager 758,224 254,545
Accrued management fee 478,543 439,587
Amount due to Trustee 32,094 29,306
Distribution payable - 30,010
Provision for donation to charitable bodies 7 24,866 24,866
Other payables and accruals 95,799 82,376
TOTAL LIABILITIES 8,930,306 1,208,323
NET ASSET VALUE OF THE FUND 378,071,976 361,230,576
EQUITY
Unit holders’ capital 304,593,130 278,474,312
Retained earnings 73,478,846 82,756,264
NET ASSETS ATTRIBUTABLE TO UNIT HOLDERS 378,071,976 361,230,576
NUMBER OF UNITS IN CIRCULATION (UNITS) 11 777,202,621 724,540,461
NET ASSET VALUE PER UNIT (RM) 0.4864 0.4985
The accompanying notes to the financial statements form an integral part of the unaudited financial statements.

CIMB ISLAMIC BALANCED FUND
15
UNAUDITED STATEMENT OF CHANGES IN EQUITY FOR THE SIX MONTHS FINANCIAL PERIOD ENDED 31 MARCH 2016
Unit holders’
capital Retained earnings
Total
RM RM RM
Balance as at 1 October 2015 278,474,312 82,756,264 361,230,576
Movement in unit holders’ contributions:
- Creation of units from applications 62,334,788 - 62,334,788
- Cancellation of units (36,215,970) - (36,215,970) Total comprehensive loss for the financial period - (9,277,418) (9,277,418)
Balance as at 31 March 2016 304,593,130 73,478,846 378,071,976
Balance as at 1 October 2014 299,674,280 58,460,316 358,134,596
Movement in unit holders’ contributions:
- Creation of units from applications 19,281,348 - 19,281,348
- Cancellation of units (46,570,119) - (46,570,119) Total comprehensive income for the financial period - 25,743,957 25,743,957
Balance as at 31 March 2015 272,385,509 84,204,273 356,589,782
The accompanying notes to the financial statements form an integral part of the unaudited financial statements.

CIMB ISLAMIC BALANCED FUND
16
UNAUDITED STATEMENT OF CASH FLOWS FOR THE SIX MONTHS FINANCIAL PERIOD ENDED 31 MARCH 2016
01.10.2015
to 31.03.2016 01.10.2014
to 31.03.2015
RM RM
CASH FLOWS FROM OPERATING ACTIVITIES Proceeds from disposal of Shariah-compliant quoted
securities 69,615,350 94,710,856
Proceeds from disposal of unquoted Sukuk 60,603,264 12,453,350
Purchase of Shariah-compliant collective investment scheme (2,251,776) -
Purchase of Shariah-compliant quoted securities (112,942,055) (68,946,125)
Purchase of unquoted Sukuk (104,454,683) (10,074,000)
Proceeds from redemption of unquoted Sukuk 15,040,724 8,000,000
Dividends income received 1,682,058 1,950,775 Profit income received from Shariah-compliant deposits with licensed Islamic financial institutions and Hibah 242,034 151,684
Profit income received from unquoted Sukuk 3,199,480 2,800,604
Management fee paid (2,762,687) (2,676,285)
Trustee’s and custodian fees paid (210,401) (264,062)
Payments for other fees and expenses (281,485) (87,677)
Realised foreign exchange loss (184,326) (741,642)
Tax refunded/(paid) 12,943 (139,624)
Net cash (used in)/generated from operating activities (72,691,560) 37,137,854
CASH FLOWS FROM FINANCING ACTIVITIES
Cash proceeds from units created 62,343,792 18,889,317
Payments for cancellation of units (35,712,291) (45,283,599)
Distribution paid (30,010) (39,448)
Net cash generated from/(used in) financing activities 26,601,491 (26,433,730)
Net (decrease)/increase in cash and cash equivalents (46,090,068) 10,704,124
Effects of foreign exchange differences (3,535,191) 3,329,370 Cash and cash equivalents at the beginning of the financial period 80,686,132 25,462,309
Cash and cash equivalents at the end of the financial period 31,060,872 39,495,803
The accompanying notes to the financial statements form an integral part of the unaudited financial statements.

CIMB ISLAMIC BALANCED FUND
17
NOTES TO THE FINANCIAL STATEMENTS FOR THE SIX MONTHS FINANCIAL PERIOD ENDED 31 MARCH 2016 1. THE FUND, THE MANAGER AND ITS PRINCIPAL ACTIVITY
CIMB Islamic Balanced Fund (the “Fund”) is governed by a Master Deed dated 15 May 2008, a Fourth Supplemental Master Deed dated 25 June 2008, a Sixth Supplemental Master Deed dated 14 July 2008, a Seventh Supplemental Master Deed dated 19 November 2008, a Fourteenth Supplemental Master Deed dated 26 June 2012 and a Seventeenth Supplemental Master Deed dated 25 March 2015 (collectively referred to as "the Deeds"), between, CIMB-Principal Asset Management Berhad (the “Manager”) and Universal Trustee (Malaysia) Berhad (the “Trustee”). The Fund aims to invest in a diversified portfolio of Shariah-compliant equities and Shariah-compliant fixed income investments. In line with its objective, the investment policy and strategy is to maintain a balanced portfolio between Shariah-compliant equities and Shariah-compliant fixed income investments in the ratio of 60:40. The fixed income portion of the Fund is to provide some capital stability to the Fund whilst the equity portion will provide the added return in a rising market. The investments by the Fund in Shariah-compliant equities shall not exceed 60% of the NAV of the Fund and investments in Shariah-compliant fixed income securities and Shariah-compliant liquid assets shall not be less than 40% of the NAV of the Fund with a minimum credit rating of “BBB3” or “P2” by RAM or equivalent rating by MARC or by local rating agency(ies) of the country; “BBB” by S&P or equivalent rating by Moody's or Fitch. The Fund may invest up to 25% of its NAV in unrated Shariah-compliant fixed income securities. At least 2% of the Fund's NAV will be invested in Shariah-compliant liquid assets. The Fund may opt to invest in Shariah-compliant foreign equities up to a maximum of 30% of its NAV. Such foreign equities must be of equity securities of companies domiciled in, listed in, and/or have significant operations in countries in Asia Pacific ex Japan. 'Significant operations' means major businesses of the company. For example, the Fund can invest in a company with significant business and/or operations in Thailand but listed on the NYSE. The threshold for 'significant operations' would be if more than 30% of total group revenue derives from countries in Asia Pacific ex Japan. The calculation would be based on the most recent financial reports released by the companies (e.g. interim and annual reports). All investments will be subjected to the Securities Commission Malaysia ("SC") Guidelines on Unit Trust Funds, SC requirements, the Deeds, except where exemptions or variations have been approved by the SC, internal policies and procedures and the Fund’s objective. The Manager, a company incorporated in Malaysia, is a subsidiary of CIMB Group Sdn Bhd and regards CIMB Group Holdings Berhad as its ultimate holding company. The Manager is also an associate of Principal International (Asia) Limited, which is a subsidiary of Principal Financial Group Inc. The principal activities of the Manager are the establishment and management of unit trust funds and fund management activities.
2 SUMMARY OF SIGNIFICANT ACCOUNTING POLICIES The following accounting policies have been used consistently in dealing with items which are considered material in relation to the financial statements:
(a) Basis of preparation
The financial statements have been prepared in accordance with the provisions of the
MFRS and International Financial Reporting Standards (“IFRS”). The financial statements have been prepared under the historical cost convention, as
modified by financial assets at fair value through profit or loss.

CIMB ISLAMIC BALANCED FUND
18
2. SUMMARY OF SIGNIFICANT ACCOUNTING POLICIES (CONTINUED)
(a) Basis of preparation (continued) The preparation of financial statements in conformity with MFRS and IFRS requires the use of certain critical accounting estimates and assumptions that affect the reported amounts of assets and liabilities and disclosure of contingent assets and liabilities at the date of the financial statements, and the reported amounts of revenues and expenses during the reported financial period. It also requires the Manager to exercise their judgment in the process of applying the Fund’s accounting policies. Although these estimates and judgment are based on the Manager’s best knowledge of current events and actions, actual results may differ.
The areas involving a higher degree of judgment or complexity, or areas where estimates and assumptions are significant to the financial statements are disclosed in Note 2(k). Standards, amendments to published standards and interpretations to existing standards that are effective: The Fund has applied the following amendments for the first time for the financial year beginning 1 October 2015: • Annual Improvements to MFRS 2010 – 2012 Cycle • Annual Improvements to MFRS 2011 – 2013 Cycle The adoption of these amendments did not have any impact on the current financial period or any prior period and is not likely to affect future periods. The standards, amendments to published standards and interpretations to existing standards that are applicable to the Fund but not yet effective and have not been early adopted are as follows:
(i) Financial year beginning on/after 1 October 2016
• Amendments to MFRS 101 “Presentation of financial statements - Disclosure Initiative” (effective from 1 January 2016) provide clarifications on a number of issues, including:
Materiality – an entity should not aggregate or disaggregate information in a manner that obscures useful information. Where items are material, sufficient information must be provided to explain the impact on the financial position or performance. Disaggregation and subtotals – line items specified in MFRS 101 may need to be disaggregated where this is relevant to an understanding of the entity’s financial position or performance. There is also new guidance on the use of subtotals.
Notes – confirmation that the notes do not need to be presented in a particular order. Other comprehensive income (“OCI”) arising from investments accounted for under the equity method - the share of OCI arising from equity-accounted investments is grouped based on whether the items will or will not subsequently be reclassified to profit or loss.

CIMB ISLAMIC BALANCED FUND
19
2. SUMMARY OF SIGNIFICANT ACCOUNTING POLICIES (CONTINUED)
(a) Basis of preparation (continued)
(i) Financial year beginning on/after 1 October 2016 (continued)
Each group should then be presented as a single line item in the statement of other comprehensive income.
According to the transitional provisions, the disclosures in MFRS 108 regarding the adoption of new standards/accounting policies are not required for these amendments.
• Annual Improvements to MFRS 2012 – 2014 Cycle (effective from 1 January 2016)
As these amendments merely clarify the existing requirements, they do not affect the Fund’s accounting policies or any of the disclosures.
(ii) Financial year beginning on/after 1 October 2017 MFRS 15 ‘Revenue from Contracts with Customers’ (effective from 1 January
2017) replaces MFRS 118 ‘Revenue’ and MFRS 111 ‘Construction contracts’ and related interpretations. The standard deals with revenue recognition and establishes principles for reporting useful information to users of financial statements about the nature, amount, timing and uncertainty of revenue and cash flows arising from an entity’s contracts with customers. Revenue is recognised when a customer obtains control of a good or service and thus has the ability to direct the use and obtain the benefits from the good or service. The core principle in MFRS 15 is that an entity recognises revenue to depict the transfer of promised goods or services to the customer in an amount that reflects the consideration to which the entity expects to be entitled in exchange for those goods or services. The Fund will apply this standard when effective. This standard is not expected to have a significant impact on the Fund’s financial statements.
(iii) Financial year beginning on/after 1 October 2018
MFRS 9 “Financial Instruments” (effective from 1 January 2018) will replace MFRS 139 “Financial Instruments: Recognition and Measurement”. The complete version of MFRS 9 was issued in November 2014. MFRS 9 retains but simplifies the mixed measurement model in MFRS 139 and establishes three primary measurement categories for financial assets: amortised cost, fair value through profit or loss and fair value through OCI. The basis of classification depends on the entity’s business model and the contractual cash flow characteristics of the financial asset. Investments in equity instruments¹ are always measured at fair value through profit or loss with an irrevocable option at inception to present changes in fair value in OCI (provided the instrument is not held for trading). A debt instrument² is measured at amortised cost only if the entity is holding it to collect contractual cash flows and the cash flows represent principal and interest³.
¹ For the purposes of the investments made by the Fund, equity instruments and derivatives refers to Shariah-compliant equity instruments and Shariah-compliant derivatives.
² For the purposes of the investments made by the Fund, debt instruments refers to Sukuk. ³ For the purposes of this Fund, interest refers to profits earned from Shariah-compliant investments.
CIMB ISLAMIC BALANCED FUND
20
2. SUMMARY OF SIGNIFICANT ACCOUNTING POLICIES (CONTINUED)
(a) Basis of preparation (continued)
(iii) Financial year beginning on/after 1 October 2018 (continued) For liabilities, the standard retains most of the MFRS 139 requirements. These include amortised cost accounting for most financial liabilities, with bifurcation of embedded derivatives¹. The main change is that, in cases where the fair value option is taken for financial liabilities, the part of a fair value change due to an entity’s own credit risk is recorded in OCI rather than the income statement, unless this creates an accounting mismatch. MFRS 9 introduces an expected credit loss model on impairment that replaces the incurred loss impairment model used in MFRS 139. The expected credit loss model is forward-looking and eliminates the need for a trigger event to have occurred before credit losses are recognised. The Fund will apply this standard when effective. This standard is not expected to have a significant impact on the Fund’s financial statements.
(b) Financial assets and financial liabilities Classification
The Fund designates its investments in Shariah-compliant collective investment scheme, Shariah-compliant quoted securities and unquoted Sukuk as financial assets at fair value through profit or loss at inception. Financial assets are designated at fair value through profit or loss when they are managed and their performance evaluated on a fair value basis. Financing and receivables are non-derivative financial assets with fixed or determinable payments that are not quoted in an active market and have been included in current assets. The Fund’s financing and receivables comprise cash and cash equivalents, amount due from stockbrokers, amount due from Manager and dividends receivable. Financial liabilities are classified according to the substance of the contractual arrangements entered into and the definitions of a financial liability. The Fund classifies amount due to stockbrokers, amount due to Manager, accrued management fee, amount due to Trustee, distribution payable, provision for donation to charitable bodies, and other payables and accruals as other financial liabilities.
Recognition and measurement
Regular purchases and sales of financial assets are recognised on the trade-date, the date on which the Fund commits to purchase or sell the asset. Shariah-compliant investments are initially recognised at fair value. Transaction costs are expensed in the statement of comprehensive income.
Financial liabilities, within the scope of MFRS 139, are recognised in the statement of financial position when, and only when, the Fund becomes a party to the contractual provisions of the financial instrument.
¹ For the purposes of the investments made by the Fund, equity instruments and derivatives refers to Shariah-
compliant equity instruments and Shariah-compliant derivatives. ² For the purposes of the investments made by the Fund, debt instruments refers to Sukuk. ³ For the purposes of this Fund, interest refers to profits earned from Shariah-compliant investments.

CIMB ISLAMIC BALANCED FUND
21
2. SUMMARY OF SIGNIFICANT ACCOUNTING POLICIES (CONTINUED)
(b) Financial assets and financial liabilities (continued)
Recognition and measurement (continued) Financial assets are derecognised when the rights to receive cash flows from the Shariah-compliant investments have expired or have been transferred and the Fund has transferred substantially all risks and rewards of ownership. Financial liabilities are derecognised when it is extinguished, i.e. when the obligation specified in the contract is discharged or cancelled or expired. Unrealised gains or losses arising from changes in the fair value of the financial assets at fair value through profit or loss are presented in the statement of comprehensive income with net gain or loss on financial assets at fair value through profit or loss in the financial period which they arise.
Dividend income from financial assets at fair value through profit or loss is recognised in the statement of comprehensive income as part of gross dividend income when the Fund’s right to receive payments is established.
Shariah-compliant collective investment scheme is valued based on the most recent published NAV per unit or share of such Shariah-compliant collective investment scheme or, if unavailable, the last published price of such unit or share (excluding any sales charge included in such selling price).
Shariah-compliant quoted securities in Malaysia are valued at the last done market price quoted on Bursa Malaysia Securities Berhad (“Bursa Securities”) at the date of the statement of financial position. Foreign quoted investments are valued at the last traded market price quoted on the respective foreign stock exchanges at the close of the business day of the respective foreign stock exchanges.
If a valuation based on the market price does not represent the fair value of the investments, for example during abnormal market conditions or when no market price is available, including in the event of a suspension in the quotation of the investments for a period exceeding 14 days, or such shorter period as agreed by the Trustee, then the investments are valued as determined in good faith by the Manager, based on the methods or bases approved by the Trustee after appropriate technical consultation. Unquoted Sukuk denominated in Ringgit Malaysia (“RM”) are revalued on a daily basis based on fair value prices quoted by a Bond Pricing Agency (“BPA”) registered with the SC as per the SC Guidelines on Unit Trust Funds. Refer to Note 2(k) for further explanation. Shariah-compliant deposits with licensed Islamic financial institutions are stated at cost plus accrued profit calculated on the effective profit method over the period from the date of placement to the date of maturity of the respective deposits. Financing and receivables and other financial liabilities are subsequently carried at amortised cost using the effective profit method. Impairment for assets carried at amortised costs For assets carried at amortised cost, the Fund assesses at the end of the reporting period whether there is objective evidence that a financial asset or group of financial assets is impaired.

CIMB ISLAMIC BALANCED FUND
22
2. SUMMARY OF SIGNIFICANT ACCOUNTING POLICIES (CONTINUED)
(b) Financial assets and financial liabilities (continued)
Impairment for assets carried at amortised costs (continued) A financial asset or a group of financial assets is impaired and impairment losses are incurred only if there is objective evidence of impairment as a result of one or more events that occurred after the initial recognition of the asset (a ‘loss event’) and that loss event (or events) has an impact on the estimated future cash flows of the financial asset or group of financial assets that can be reliably estimated. The amount of the loss is measured as the difference between the asset’s carrying amount and the present value of estimated future cash flows (excluding future credit losses that have not been incurred) discounted at the financial asset’s original effective profit rate. The asset’s carrying amount is reduced and the amount of the loss is recognised in statement of comprehensive income. If ‘financing and receivables’ has a variable profit rate, the discount rate for measuring any impairment loss is the current effective profit rate determined under the contract. As a practical expedient, the Fund may measure impairment on the basis of an instrument’s fair value using an observable market price.
If, in a subsequent financial period, the amount of the impairment loss decreases and the decrease can be related objectively to an event occurring after the impairment was recognised (such as an improvement in the debtor’s credit rating), the reversal of the previously recognised impairment loss is recognised in statement of comprehensive income. When an asset is uncollectible, it is written off against the related allowance account. Such assets are written off after all the necessary procedures have been completed and the amount of the loss has been determined.
(c) Income recognition
Dividend income is recognised on the ex-dividend date when the right to receive payment is established.
Profit income from Shariah-compliant deposits with licensed Islamic financial
institutions and unquoted Sukuk are recognised on a time proportionate basis using the effective profit rate method on an accrual basis.
Realised gain or loss on disposal of Shariah-compliant collective investment scheme
and Shariah-compliant quoted securities are accounted for as the difference between the net disposal proceeds and the carrying amount of Shariah-compliant quoted securities, determined on a weighted average cost basis.
Realised gain or loss on disposal of unquoted Sukuk is accounted for as the difference
between the net disposal proceeds and the carrying amount of unquoted Sukuk, determined on cost adjusted for accretion of discount or amortisation of premium.
(d) Foreign currency Functional and presentation currency Items included in the financial statements of the Fund are measured using the
currency of the primary economic environment in which the Fund operates (the “functional currency”). The financial statements are presented RM, which is the Fund’s functional and presentation currency.

CIMB ISLAMIC BALANCED FUND
23
2. SUMMARY OF SIGNIFICANT ACCOUNTING POLICIES (CONTINUED)
(d) Foreign currency (continued) Transactions and balances Foreign currency transactions are translated into the functional currency using the
exchange rates prevailing at the dates of the transactions or valuation where items are remeasured. Foreign exchange gains and losses resulting from the settlement of such transactions and from the translation at period-end exchange rates of monetary assets and liabilities denominated in foreign currencies are recognised in statement of comprehensive income, except when deferred in OCI as qualifying cash flow hedges.
(e) Cash and cash equivalents
For the purpose of statement of cash flows, cash and cash equivalents comprise bank
balances and Shariah-compliant deposits held in highly liquid investments that are readily convertible to known amounts of cash and which are subject to an insignificant risk of changes in value.
(f) Taxation Current tax expense is determined according to Malaysian tax laws at the current rate
based upon the taxable profit earned during the financial period. Tax on dividend income from foreign Shariah-compliant quoted securities is based on
the tax regime of the respective countries that the Fund invests in.
(g) Amount due from/to stockbrokers
Amounts due from and amount due to stockbrokers represent receivables for Shariah-compliant investments sold and payables for Shariah-compliant investments purchased that have been contracted for but not yet settled or delivered on the statement of financial position date respectively. These amounts are recognised initially at fair value and subsequently measured at amortised cost using the effective profit method, less provision for impairment for amounts due from stockbrokers. A provision for impairment of amounts due from stockbrokers is established when there is objective evidence that the Fund will not be able to collect all amounts due from the relevant stockbroker. Significant financial difficulties of the stockbroker, probability that the stockbroker will enter bankruptcy or financial reorganisation, and default in payments are considered indicators that the amount due from stockbrokers is impaired. Once a financial asset or a group of similar financial assets has been written down as a result of an impairment loss, profit income is recognised using the profit rate used to discount the future cash flows for the purpose of measuring the impairment loss.
(h) Transaction costs Transaction costs are costs incurred to acquire or dispose financial assets or liabilities
at fair value through profit or loss. They include fees and commissions paid to agents, advisors, brokers and dealers. Transaction costs, when incurred, are immediately recognised in the statement of comprehensive income as expenses.

CIMB ISLAMIC BALANCED FUND
24
2. SUMMARY OF SIGNIFICANT ACCOUNTING POLICIES (CONTINUED)
(i) Unit holders’ capital
The unit holders’ contributions to the Fund meet the criteria to be classified as equity
instruments under MFRS 132 “Financial Instruments: Presentation”. Those criteria include:
the units entitle the holder to a proportionate share of the Fund’s NAV;
the units are the most subordinated class and class features are identical;
there is no contractual obligations to deliver cash or another financial asset other than the obligation on the Fund to repurchase; and
the total expected cash flows from the units over its life are based substantially on the profit or loss of the Fund.
The outstanding units are carried at the redemption amount that is payable at each
financial period if unit holder exercises the right to put the unit back to the Fund.
Units are created and cancelled at prices based on the Fund’s NAV per unit at the time of creation or cancellation. The Fund’s NAV per unit is calculated by dividing the net assets attributable to unit holders with the total number of outstanding units.
(j) Segment information Operating segments are reported in a manner consistent with the internal reporting used by the chief operating decision-maker. The chief operating decision-maker is responsible for allocating resources and assessing performance of the operating segments.
(k) Critical accounting estimates and judgments in applying accounting policies
The Fund makes estimates and assumptions concerning the future. The resulting accounting estimates will, by definition, rarely equal the related actual results. To enhance the information content of the estimates, certain key variables that are anticipated to have material impact to the Funds’ results and financial position are tested for sensitivity to changes in the underlying parameters.
Estimates and judgment are continually evaluated by the Manager and are based on
historical experience and other factors, including expectations of future events that are believed to be reasonable under the circumstances.
Estimate of fair value of unquoted Sukuk
In undertaking any of the Fund’s Shariah-compliant investment, the Manager will
ensure that all assets of the Fund under management will be valued appropriately, that is at fair value and in compliance with the SC Guidelines on Unit Trust Funds.
Ringgit-denominated unquoted Sukuk are valued using fair value prices quoted by a
BPA. Where the Manager is of the view that the price quoted by BPA for a specific unquoted Sukuk differs from the market price by more than 20 bps, the Manager may use market price, provided that the Manager records its basis for using a non-BPA price, obtains necessary internal approvals to use the non-BPA price, and keeps an audit trail of all decisions and basis for adopting the use of non-BPA price.

CIMB ISLAMIC BALANCED FUND
25
3. RISK MANAGEMENT OBJECTIVES AND POLICIES
The investment objective of the Fund is to achieve medium to long-term growth in both capital and income by investing in permissible Shariah-compliant investments. The Fund is exposed to a variety of risks which include market risk (inclusive of price risk, interest rate risk and currency risk), credit risk and liquidity risk. Financial risk management is carried out through internal control process adopted by the Manager and adherence to the investment restrictions as stipulated in the Deeds and SC Guidelines on Unit Trust Funds. (a) Market risk
(i) Price risk
This is the risk that the fair value of a Shariah-compliant investment in quoted securities and unquoted Sukuk will fluctuate because of changes in market prices (other than those arising from interest rate risk and currency risk). The value of Shariah-compliant investments may fluctuate according to the activities of individual companies, sector and overall political and economic conditions. Such fluctuation may cause the Fund's NAV and prices of units to fall as well as rise, and income produced by the Fund may also fluctuate. The price risk is managed through diversification and selection of Shariah-compliant collective investment scheme, Shariah-compliant quoted securities, unquoted Sukuk and other financial instruments within specified limits according to the Deeds.
(ii) Interest rate risk In general, when interest rates rise, unquoted Sukuk prices will tend to fall and vice versa. Therefore, the NAV of the Fund may also tend to fall when interest rates rise or are expected to rise. However, investors should be aware that should the Fund holds an unquoted Sukuk till maturity, such price fluctuations would dissipate as it approaches maturity, and thus the growth of the NAV shall not be affected at maturity. In order to mitigate interest rates exposure of the Fund, the Manager will manage the duration of the portfolio via shorter or longer tenured assets depending on the view of the future interest rate trend of the Manager, which is based on its continuous fundamental research and analysis. Investors should note that the movement in prices of unquoted Sukuk and Shariah-compliant money market instruments are benchmarked against interest rates. As such, the investments are exposed to the movement of the interest rates. However, it does not in any way suggest that this Fund will invest in conventional financial instruments. All investment carried out for the Fund including placements and deposits are in accordance with Shariah. This risk is crucial since unquoted Sukuk portfolio management depends on forecasting interest rate movements. Prices of unquoted Sukuk move inversely to interest rate movements, therefore as interest rates rise, the prices of unquoted Sukuk decrease and vice versa. Furthermore, unquoted Sukuk with longer maturity and lower yield profit rates are more susceptible to interest rate movements.

CIMB ISLAMIC BALANCED FUND
26
3. RISK MANAGEMENT OBJECTIVES AND POLICIES (CONTINUED)
(a) Market risk (continued)
(ii) Interest rate risk (continued)
Such investments may be subject to unanticipated rise in interest rates which may impair the ability of the issuers to meet the obligation under the instrument, especially if the issuers are highly leveraged. An increase in interest rates may therefore increase the potential for default by an issuer.
(iii) Currency risk
Currency risk of the Fund is associated with Shariah-compliant investments that are quoted and/or priced in foreign currency denomination. Foreign currency risk is the risk that the value of financial instruments will fluctuate due to changes in foreign exchange rates. The Manager will evaluate the likely directions of a foreign currency versus RM based on considerations of economic fundamentals such as interest rate differentials, balance of payments position, debt levels, and technical chart considerations.
(b) Credit risk
Credit risk refers to the risk that a counterparty will default on its contractual obligation resulting in financial loss to the Fund. Investment in unquoted Sukuk may involve a certain degree of credit/default risk with regards to the issuers. Generally, credit risk or default risk is the risk of loss due to the issuer’s non-payment or untimely payment of the investment amount as well as the returns on investment. This will cause a decline in value of the defaulted unquoted Sukuk and subsequently depress the NAV of the Fund. Usually credit risk is more apparent for an investment with a longer tenure, i.e. the longer the duration, the higher the credit risk. Credit risk can be managed by performing continuous fundamental credit research and analysis to ascertain the creditworthiness of its issuer. In addition, the Manager imposes a minimum rating requirement as rated by either local and/or foreign rating agencies and manages the duration of the investment in accordance with the objective of the Fund. For this Fund, the Sukuk investment must satisfy a minimum rating requirement of at least “BBB3” or “P2” by RAM or equivalent rating by MARC or by local rating agency(ies) of the country; “BBB” by S&P or equivalent rating by Moody's or Fitch.
The credit risk arising from placements of Shariah-compliant deposits in licensed Islamic financial institutions is managed by ensuring that the Fund will only place Shariah-compliant deposits in reputable licensed Islamic financial institutions. The settlement terms of the proceeds from the creation of units receivable from the Manager are governed by the SC Guidelines on Unit Trust Funds. For amount due from stockbrokers, the settlement terms are governed by the relevant rules and regulations as prescribed by respective stock exchanges. The credit risk is minimal as all transactions in Shariah-compliant quoted securities are settled/paid upon delivery using approved stockbrokers.

CIMB ISLAMIC BALANCED FUND
27
3. RISK MANAGEMENT OBJECTIVES AND POLICIES (CONTINUED)
(c) Liquidity risk
Liquidity risk is the risk that the Fund will encounter difficulty in meeting its financial obligations. The Manager manages this risk by maintaining sufficient level of liquid assets to meet anticipated payments and cancellations of the units by unit holders. Liquid assets comprise bank balances and Shariah-compliant deposits with licensed Islamic financial institutions and other instruments, which are capable of being converted into cash within 7 business days. Generally, all investments are subject to a certain degree of liquidity risk depending on the nature of the investment instruments, market, sector and other factors. For the purpose of the Fund, the Manager will attempt to balance the entire portfolio by investing in a mix of assets with satisfactory trading volume and those that occasionally could encounter poor liquidity. This is expected to reduce the risks for the entire portfolio without limiting the Fund’s growth potentials.
(d) Fair value estimation Fair value is defined as the price that would be received to sell an asset or paid to transfer a liability in an orderly transaction between market participants at the measurement date (i.e. an exit price). The fair value of financial assets traded in active markets (such as trading securities) are based on quoted market prices at the close of trading on the financial period end date. The Fund utilises the last traded market price for financial assets where the last traded price falls within the bid-ask spread. In circumstances where the last traded price is not within the bid-ask spread, the Manager will determine the point within the bid-ask spread that is most representative of the fair value. An active market is a market in which transactions for the asset or liability take place with sufficient frequency and volume to provide pricing information on an ongoing basis. The fair value of financial assets that are not traded in an active market is determined by using valuation techniques. Fair value hierarchy (i) The table below analyses financial instruments carried at fair value. The
different levels have been defined as follows:
Quoted prices (unadjusted) in active market for identical assets or liabilities (Level 1)
Inputs other than quoted prices included within Level 1 that are observable for the asset or liability, either directly (that is, as prices) or indirectly (that is, derived from prices) (Level 2)
Inputs for the asset and liability that are not based on observable market data (that is, unobservable inputs) (Level 3)
The level in the fair value hierarchy within which the fair value measurement is categorised in its entirety is determined on the basis of the lowest level input that is significant to the fair value measurement in its entirety. For this purpose, the significance of an input is assessed against the fair value measurement in its entirety.

CIMB ISLAMIC BALANCED FUND
28
3. RISK MANAGEMENT OBJECTIVES AND POLICIES (CONTINUED)
(d) Fair value estimation (continued)
Fair value hierarchy (continued)
If a fair value measurement uses observable inputs that require significant adjustment based on unobservable inputs, that measurement is a Level 3 measurement. Assessing the significance of a particular input to the fair value measurement in its entirety requires judgment, considering factors specific to the asset or liability. The determination of what constitutes ‘observable’ requires significant judgment by the Fund. The Fund considers observable data to be that market data that is readily available, regularly distributed or updated, reliable and verifiable, not proprietary, and provided by independent sources that are actively involved in the relevant market. Level 1 Level 2 Level 3 Total RM RM RM RM 31.03.2016 Financial assets at fair value through profit or loss:
- Shariah-compliant collective investment scheme 2,143,706
-
-
2,143,706 - Shariah-
compliant quoted securities - local 110,976,096
-
-
110,976,096 - Shariah-
compliant quoted securities - foreign 102,828,138
-
-
102,828,138
- Unquoted Sukuk -
137,334,562
-
137,334,562
215,947,940 137,334,562 - 353,282,502

CIMB ISLAMIC BALANCED FUND
29
3. RISK MANAGEMENT OBJECTIVES AND POLICIES (CONTINUED)
(d) Fair value estimation (continued)
Fair value hierarchy (continued)
Level 1 Level 2 Level 3 Total RM RM RM RM 30.09.2015 Audited
Financial assets at fair value through profit or loss:
- Shariah-
compliant quoted securities - local 85,743,364
-
-
85,743,364 - Shariah-
compliant quoted securities - foreign 89,998,653
-
-
89,998,653
- Unquoted Sukuk -
103,459,799
-
103,459,799
175,742,017 103,459,799 - 279,201,816
Shariah-compliant investments which values are based on quoted market prices in active markets, and are therefore classified within Level 1, include Shariah-compliant collective investment scheme and Shariah-compliant quoted securities. The Fund does not adjust the quoted prices for these instruments. The Fund’s policies on valuation of these financial assets are stated in Note 2(b). Financial instruments that trade in markets that are not considered to be active but are valued based on quoted market prices, dealer quotations or alternative pricing sources supported by observable inputs are classified within Level 2. This includes unquoted Sukuk. As Level 2 instruments include positions that are not traded in active markets and/or are subject to transfer restrictions, valuations may be adjusted to reflect illiquidity and/or non-transferability, which are generally based on available market information. The Fund’s policies on valuation of these financial assets are stated in Note 2(b).
(ii) The carrying values of cash and cash equivalents, amount due from
stockbrokers, amount due from Manager, dividends receivable and all current liabilities are a reasonable approximation of their fair values due to their short term nature.
4. PROFIT INCOME
01.10.2015 to 31.03.2016
01.10.2014 to 31.03.2015
RM RM Profit income from Shariah-compliant deposits with licensed Islamic financial institutions and Hibah 242,034 151,684 Profit income from unquoted Sukuk 2,842,315 2,480,161
3,084,349 2,631,845

CIMB ISLAMIC BALANCED FUND
30
5. MANAGEMENT FEE
In accordance with the Deeds, the Manager is entitled to a maximum management fee of 1.50% per annum, calculated daily based on the NAV of the Fund. For the six months financial period ended 31 March 2016, the management fee is recognised at a rate of 1.50% per annum (31.03.2015: 1.50% per annum). There will be no further liability to the Manager in respect of management fee other than the amount recognised above.
6. TRUSTEE’S AND CUSTODIAN FEES
In accordance with the Deeds, the Trustee is entitled to a maximum fee of 0.10% per annum calculated daily based on the NAV of the Fund. The foreign custody charges (safekeeping fee and transaction fee, including out of pocket charges) are subject to a minimum of USD500 per month per fund and are charged monthly in arrears. The safekeeping fee ranges from a minimum of 0.04% p.a. to a maximum of 0.38% per annum of the market value of the respective foreign portfolio, depending on the country invested. The transaction fee is charged for every transaction and the amount is dependent on the country invested. For the six months financial period ended 31 March 2016 the Trustee’s fee is recognised at a rate of 0.10% per annum (31.03.2015: 0.10% per annum), while the foreign custodian fee is recognized at RM26,142 (31.03.2015: RM85,642). There will be no further liability to the Trustee and custodian in respect of Trustee’s and custodian fee other than the amount recognised above.
7. PROVISION FOR DONATION TO CHARITABLE BODIES
This is a provision on donation derived from net realised gain on the disposal of non Shariah- compliant securities of Starhub Ltd, which were delisted from the List of Shariah-compliant Securities by Dow Jones Islamic Market Indexes, Hutchison Telecommunications Hong Kong Holdings Ltd and Taiwan FamilyMart Co. Ltd. which were delisted from the List of Shariah-Compliant Securities upon the change of index from Dow Jones Islamic World Market Index to MSCI AC Asia Ex Japan Islamic Index, for the financial year ended 30 September 2015. The non Shariah-compliant securities had been disposed on 26 May 2014, 6 July 2015 and 3 July 2015 respectively. A gain amounting to RM24,866 arising from the disposal will be channelled to charitable bodies as approved by Shariah Adviser.

CIMB ISLAMIC BALANCED FUND
31
8. TAXATION
01.10.2015 to 31.03.2016
01.10.2014 to 31.03.2015
RM RM Tax charged for the financial period: - Current taxation - foreign 34,299 141,159 - Overprovision in prior financial period - (3,671)
34,299 137,488
A numerical reconciliation between the (loss)/profit before taxation multiplied by the Malaysian statutory income tax rate and tax expense of the Fund is as follows:
01.10.2015 to 31.03.2016
01.10.2014 to 31.03.2015
RM RM (Loss)/Profit before taxation (9,243,119) 25,881,445
Taxation at Malaysian statutory rate of 24% (31.03.2015: 25%) (2,218,349) 6,470,361 Tax effects of: Investment loss not deductible for tax purposes/(Investment income not subject to tax) 1,289,052 (7,328,342) Expenses not deductible for tax purposes 203,921 188,911 Restriction on tax deductible expenses for Unit Trust Funds 725,376 669,070 Effect of foreign tax on foreign taxable income 34,299 141,159 Overprovision in prior financial period - (3,671)
Taxation 34,299 137,488
9. FINANCIAL ASSETS AT FAIR VALUE THROUGH PROFIT OR LOSS
31.03.2016 30.09.2015 Audited
RM RM Designated at fair value through profit or loss at inception: - Shariah-compliant collective investment scheme 2,143,706 - - Shariah-compliant quoted securities - local 110,976,096 85,743,364 - Shariah-compliant quoted securities - foreign 102,828,138 89,998,653 - Unquoted Sukuk 137,334,562 103,459,799
353,282,502 279,201,816
01.10.2015 to 31.03.2016
01.10.2014 to 31.03.2015
RM RM Net (loss)/gain on financial assets at fair value through profit or loss at inception: - Realised (loss)/gain on disposals (115,035) 7,579,629 - Unrealised fair value (loss)/gain (6,418,526) 14,486,570
(6,533,561) 22,066,199

CIMB ISLAMIC BALANCED FUND
32
9. FINANCIAL ASSETS AT FAIR VALUE THROUGH PROFIT OR LOSS (CONTINUED)
Aggregate
Market
Percentage
Name of counter Quantity
cost
value
of NAV
Units
RM
RM
%
31.03.2016 SHARIAH-COMPLIANT
COLLECTIVE INVESTMENT SCHEME
PT CIMB-Principal Islamic Equity Growth Syariah 5,082,958
2,251,776
2,143,706
0.57
TOTAL SHARIAH-COMPLIANT COLLECTIVE INVESTMENT SCHEME 5,082,958
2,251,776
2,143,706
0.57
ACCUMULATED UNREALISED LOSS ON SHARIAH-COMPLIANT COLLECTIVE INVESTMENT SCHEME AT FAIR VALUE THROUGH PROFIT OR LOSS
(108,070)
TOTAL SHARIAH-COMPLIANT COLLECTIVE INVESTMENT SCHEME AT FAIR VALUE THROUGH PROFIT OR LOSS
2,143,706

CIMB ISLAMIC BALANCED FUND
33
9. FINANCIAL ASSETS AT FAIR VALUE THROUGH PROFIT OR LOSS (CONTINUED)
Aggregate
Market
Percentage
Name of counter Quantity
cost
value
of NAV
Units
RM
RM
%
31.03.2016 (CONTINUED) SHARIAH-COMPLIANT
QUOTED SECURITIES - LOCAL
Construction
Econpile Holdings Bhd 1,030,300
950,544
1,256,966
0.33
Gamuda Bhd 622,400
2,826,891
3,062,208
0.81
IJM Cororationp Bhd 930,400
3,233,646
3,284,312
0.87
Protasco Bhd 607,700
1,044,763
935,858
0.25
3,190,800
8,055,844
8,539,344
2.26
Consumer Products Bonia Corporation Bhd 898,600
909,232
579,597
0.15
Oriental Food Industries Holdings Bhd 298,800
669,887
684,252
0.18
1,197,400
1,579,119
1,263,849
0.33
Finance BIMB Holdings Bhd 139,500
498,574
537,075
0.14
Syarikat Takaful Malaysia Bhd 560,200
1,260,406
2,274,412
0.60
699,700
1,758,980
2,811,487
0.74
Industrials Cahya Mata Sarawak Bhd 835,500
2,611,991
3,968,625
1.05
Evergreen Fibreboard Bhd 2,349,300
3,184,305
2,372,793
0.63
Heveaboard Bhd 1,267,000
1,862,870
1,507,730
0.40 Hume Industries Bhd 257,800
1,038,183
837,850
0.22
Kossan Rubber Industries Bhd 501,900
2,735,671
3,036,495
0.80
Petronas Chemicals Group Bhd 343,200
2,331,561
2,302,872
0.61
Petronas Gas Bhd 210,200
4,061,565
4,624,400
1.22
SKP Resources Bhd 1,883,500
1,716,799
2,429,715
0.65
SLP Resources Bhd 781,900
1,127,124
1,720,180
0.45 Top Glove Corporation Bhd 430,000
2,481,251
2,158,600
0.58
United U-Li Corporation Bhd 236,100
876,016
1,298,550
0.34
V.S. Industry Bhd 1,955,000
3,014,494
2,346,000
0.62
V.S. Industry Bhd - Warrant 488,750
-
156,400
0.04
11,540,150
27,041,830
28,760,210
7.61

CIMB ISLAMIC BALANCED FUND
34
9. FINANCIAL ASSETS AT FAIR VALUE THROUGH PROFIT OR LOSS (CONTINUED)
Aggregate
Market
Percentage
Name of counter Quantity
cost
value
of NAV
Units
RM
RM
%
31.03.2016 (CONTINUED) SHARIAH-COMPLIANT
QUOTED SECURITIES - LOCAL (CONTINUED)
IPC
Digi.Com Bhd 941,000
4,819,424
4,648,540
1.23
TIME dotCom Bhd 427,900
1,891,728
3,115,112
0.82
1,368,900
6,711,152
7,763,652
2.05
Plantation Genting Plantations Bhd 418,100
4,501,672
4,682,720
1.24
IOI Corporation Bhd 787,100
3,872,270
3,597,047
0.95
Kuala Lumpur Kepong Bhd 110,300
2,617,905
2,647,200
0.70
1,315,500
10,991,847
10,926,967
2.89
Technology Globetronics Technology
Bhd 360,900
2,117,755
1,952,469
0.52 Inari Amertron Bhd 541,975
1,425,369
1,745,160
0.46
Malaysian Pacific Industries Bhd 225,700
1,746,131
1,681,465
0.44
1,128,575
5,289,255
5,379,094
1.42
Trading/Services Axiata Group Bhd 1,198,126
7,702,146
7,056,962
1.87
Berjaya Auto Bhd 270,120
449,121
586,160
0.16
Dialog Group Bhd 1,022,076
1,672,686
1,635,322
0.43
Malakoff Corporation Bhd 1,184,600
2,162,392
1,895,360
0.50
MISC Bhd 431,400
2,865,573
3,839,460
1.02
My EG Services Bhd 1,276,800
987,503
2,732,352
0.72
Prestariang Bhd 395,100
1,192,061
1,165,545
0.31
Sime Darby Bhd 573,833
4,875,446
4,561,972
1.21
Taliworks Corporation Bhd 635,500
904,439
832,505
0.22
Telekom Malaysia Bhd 572,341
3,602,236
3,777,451
1.00 Tenaga Nasional Bhd 865,200
9,435,963
12,060,888
3.19
UEM Edgenta Bhd 570,600
1,805,963
2,082,690
0.55
Westports Holdings Bhd 800,200
2,366,303
3,304,826
0.86
9,795,896
40,021,832
45,531,493
12.04
TOTAL SHARIAH - COMPLIANT QUOTED SECURITIES - LOCAL 30,236,921
101,449,859
110,976,096
29.34

CIMB ISLAMIC BALANCED FUND
35
9. FINANCIAL ASSETS AT FAIR VALUE THROUGH PROFIT OR LOSS (CONTINUED)
Aggregate
Market
Percentage
Name of counter Quantity
cost
value
of NAV
Units
RM
RM
%
31.03.2016 (CONTINUED) SHARIAH-COMPLIANT
QUOTED SECURITIES - FOREIGN
HONG KONG
Consumer Products MTR Corporation Ltd 211,000
3,688,679
4,071,455
1.08
Techtronic Industries Co. Ltd 337,500
4,302,915
5,198,048
1.37
548,500
7,991,594
9,269,503
2.45
Energy China Petroleum &
Chemical Corporation 502,000
1,485,171
1,283,978
0.34
CNOOC Ltd 357,000
1,830,764
1,643,235
0.43
PetroChina Co. Ltd 478,000
1,700,885
1,239,406
0.33
1,337,000
5,016,820
4,166,619
1.10
Finance China Overseas Land &
Investment Ltd 210,000
2,814,405
2,590,639
0.69
China Resources Land Ltd 202,000
2,165,335
2,019,949
0.53 Henderson Land Development Co. Ltd 50,500
1,274,341
1,209,178
0.32
Link REIT 145,420
3,401,895
3,361,383
0.89
607,920
9,655,976
9,181,149
2.43
Industrials China Merchants Holdings
(International) Co. Ltd 90,000
1,293,359
1,042,436
0.28
Sinotrans Ltd 843,000
1,889,219
1,436,029
0.38
933,000
3,182,578
2,478,465
0.66
Technology Tencent Holdings Ltd 135,900
10,725,951
10,817,097
2.86
Telecommunications China Telecom Corporation
Bhd 1,530,000
3,358,309
3,152,182
0.83 China Unicom (Hong Kong) Ltd 228,000
1,113,340
1,173,197
0.31
1,758,000
4,471,649
4,325,379
1.14

CIMB ISLAMIC BALANCED FUND
36
9. FINANCIAL ASSETS AT FAIR VALUE THROUGH PROFIT OR LOSS (CONTINUED)
Aggregate
Market
Percentage
Name of counter Quantity
cost
value
of NAV
Units
RM
RM
%
31.03.2016 (CONTINUED) SHARIAH-COMPLIANT
QUOTED SECURITIES - FOREIGN (CONTINUED)
HONG KONG (CONTINUED)
Utilities
Cheung Kong Infrastructure Holdings Ltd 56,000
1,851,267
2,134,419
0.56
TOTAL HONG KONG 5,376,320
42,895,835
42,372,631
11.20
INDIA
Consumer Products Dabur India Ltd 198,978
3,352,030
2,923,807
0.77
Maruti Suzuki India Ltd 5,119
1,146,607
1,118,596
0.30
204,097
4,498,637
4,042,403
1.07
Energy Reliance Industries Ltd 68,007
3,991,653
4,179,559
1.11
Health Care Apollo Hospitals Enterprise
Ltd 12,422
1,163,029
970,939
0.26
Dr Reddy’s Laboratories 5,167
1,103,016
922,152
0.24
17,589
2,266,045
1,893,091
0.50
Industrials Ultra Tech Cement Ltd 13,002
2,282,999
2,468,436
0.65
Telecommunications Bharti Infratel Ltd 50,085
1,294,059
1,124,842
0.30
TOTAL INDIA 352,780
14,333,393
13,708,331
3.63
INDONESIA
Consumer Products Matahari Department Store
Tbk PT 340,100
1,732,418
1,836,679
0.49
Finance Bumi Serpong Damai Tbk
PT 3,010,500
1,635,375
1,625,792
0.43

CIMB ISLAMIC BALANCED FUND
37
9. FINANCIAL ASSETS AT FAIR VALUE THROUGH PROFIT OR LOSS (CONTINUED)
Aggregate
Market
Percentage
Name of counter Quantity
cost
value
of NAV
Units
RM
RM
%
31.03.2016 (CONTINUED) SHARIAH-COMPLIANT
QUOTED SECURITIES - FOREIGN (CONTINUED)
INDONESIA (CONTINUED)
Telecommunications Telekomunikasi Indonesia
Persero Tbk PT 4,665,700
3,781,684
4,565,609
1.21
TOTAL INDONESIA 8,016,300
7,149,477
8,028,080
2.13
PHILIPPINES
Consumer Products Jollibee Foods Corporation 60,810
1,149,819
1,169,188
0.31
Universal Robina Corporation 124,520
2,132,650
2,286,556
0.60
185,330
3,282,469
3,455,744
0.91
Utilities
Metro Pacific Investments Corporation 2,466,000
1,183,841
1,226,069
0.32
TOTAL PHILIPPINES 2,651,330
4,466,310
4,681,813
1.23
SINGAPORE
Consumer Products ComfortDelGro Corporation
Ltd 376,800
2,910,745
3,182,600
0.84
Telecommunications Singapore
Telecommunications Ltd 396,500
4,456,974
4,381,220
1.16
TOTAL SINGAPORE 773,300
7,367,719
7,563,820
2.00
SOUTH KOREA
Basic Materials LG Chem Ltd 5,147
4,997,178
5,745,513
1.52
Consumer Products AmorePacific Corporation 3,553
3,659,185
4,680,670
1.24
Hanssem Co. Ltd 1,474
1,463,445
1,122,893
0.30 LG Household & Health Care Ltd 370
1,255,592
1,191,782
0.32
5,397
6,378,222
6,995,345
1.86

CIMB ISLAMIC BALANCED FUND
38
9. FINANCIAL ASSETS AT FAIR VALUE THROUGH PROFIT OR LOSS (CONTINUED)
Aggregate
Market
Percentage
Name of counter Quantity
cost
value
of NAV
Units
RM
RM
%
31.03.2016 (CONTINUED) SHARIAH-COMPLIANT
QUOTED SECURITIES - FOREIGN (CONTINUED)
SOUTH KOREA (CONTINUED)
Telecommunications
SK Telecom Co. Ltd 1,690
1,478,321
1,201,036
0.32
TOTAL SOUTH KOREA 12,234
12,853,721
13,941,894
3.70
TAIWAN
Consumer Products Eclat Textile Co. Ltd 42,965
2,509,916
2,201,678
0.58
Industrials Catcher Technology Co. Ltd 77,000
2,609,801
2,459,688
0.65
Telecommunications Chunghwa Telecom Co. Ltd 594,000
7,147,038
7,870,203
2.08
TOTAL TAIWAN 713,965
12,266,755
12,531,569
3.31
TOTAL SHARIAH-COMPLIANT QUOTED SECURITIES - FOREIGN 17,896,229
101,333,210
102,828,138
27.20
TOTAL SHARIAH-COMPLIANT QUOTED SECURITIES 48,133,150
202,783,069
213,804,234
56.54
ACCUMULATED UNREALISED GAIN ON SHARIAH-COMPLIANT QUOTED SECURITIES AT FAIR VALUE THROUGH PROFIT OR LOSS
11,021,165
TOTAL SHARIAH-COMPLIANT QUOTED SECURITIES AT FAIR VALUE THROUGH PROFIT OR LOSS
213,804,234

CIMB ISLAMIC BALANCED FUND
39
9. FINANCIAL ASSETS AT FAIR VALUE THROUGH PROFIT OR LOSS (CONTINUED)
Aggregate
Market
Percentage
Name of counter Nominal
cost
value
of NAV
value
RM
RM
%
31.03.2016 (CONTINUED) UNQUOTED SUKUK
AmIslamic Bank Bhd 4.40% 30/09/2021 (AA3) 3,000,000
3,006,720
3,006,993
0.80
AmIslamic Bank Bhd 4.35% 31/01/2022 (AA3) 5,000,000
5,047,044
5,046,791
1.33
Anih Bhd 4.60% 29/11/2016 (AA) 2,500,000
2,547,200
2,549,753
0.67
Bahrain Mumtalakat Holding Company B.S.C. 5.35% 30/04/2018 (AA3) 5,000,000
5,117,554
5,121,463
1.35
Bahrain Mumtalakat Holding Company B.S.C. 5.50% 03/10/2017 (AA3) 2,500,000
2,583,466
2,581,807
0.68
Bank Muamalat Malaysia Bhd 5.15% 15/06/2021 (A3) 7,400,000
7,522,120
7,529,698
1.99
Bumitama Agri Ltd 5.25% 18/03/2019 (AA3) 8,500,000
8,657,281
8,682,696
2.30
Encorp Systembilt Sdn Bhd 5.52% 18/05/2028 (AA2) 3,500,000
3,719,358
3,778,763
1.00
Eversendai Corporation Bhd 4.70% 09/03/2018 (A2) 4,500,000
4,449,546
4,402,188
1.16
First Resources Ltd 4.45% 31/07/2017 (AA2) 2,000,000
2,023,289
2,018,402
0.53
Gamuda Bhd 4.215% 26/10/2018 (AA3) 3,000,000
3,052,779
3,039,467
0.80
GII Murabahah 4.07% 30/09/2026 (Not Rated) 3,000,000
3,001,132
3,012,569
0.80
Golden Assets International Finance Ltd 4.35% 17/11/2017 (A1) 8,000,000
8,015,390
7,916,559
2.09
Golden Assets International Finance Ltd 4.75% 03/08/2018 (A1) 6,000,000
5,762,379
5,769,166
1.53
Jimah Energy Ventures Sdn Bhd 8.10% 12/05/2017 MN12 (AA3) 4,000,000
4,295,755
4,295,505
1.14
Jimah Energy Ventures Sdn Bhd 8.30% 11/11/2016 MN12 (AA3) 6,000,000
6,334,170
6,345,127
1.68
Jimah Energy Ventures Sdn Bhd 9.30% 12/05/2020 (AA3) 1,500,000
1,803,137
1,811,242
0.48
Johor Corporation 3.68% 14/06/2019 (Not Rated) 2,500,000
2,510,459
2,509,624
0.66
Kapar Energy Ventures Sdn Bhd 4.12% 05/07/2016 (AA+) 5,000,000
5,050,300
5,053,151
1.34
Kuala Lumpur Kepong Bhd 3.88% 10/10/2016 (AA1) 3,000,000
3,054,852
3,055,932
0.81

CIMB ISLAMIC BALANCED FUND
40
9. FINANCIAL ASSETS AT FAIR VALUE THROUGH PROFIT OR LOSS (CONTINUED)
Aggregate
Market
Percentage
Name of counter Nominal
cost
value
of NAV
value
RM
RM
%
31.03.2016 (CONTINUED) UNQUOTED SUKUK
(CONTINUED)
Kuala Lumpur Kepong Bhd 4.00% 02/09/2022 (AA1) 2,000,000
1,945,761
1,954,136
0.52
Lingkaran Trans Kota Holdings Bhd 5.30% 14/04/2017 (AA2) 4,000,000
4,148,772
4,150,651
1.10
Malakoff Power Bhd 4.50% 16/12/2016 (AA-) 8,500,000
8,624,661
8,631,906
2.28
Malakoff Power Bhd 4.90% 17/12/2018 (AA-) 5,000,000
5,101,462
5,105,201
1.35
Manjung Island Energy Bhd 4.74% 23/11/2029 (AAA) 2,500,000
2,549,058
2,559,431
0.68
Ranhill Powertron II Sdn Bhd 5.15% 16/06/2023 (AAA) 1,000,000
1,030,105
1,044,555
0.28
Sunrise Bhd 4.35% 25/07/2016 (AA-) 10,000,000
10,084,110
10,089,880
2.67
Syarikat Prasarana Negara Bhd 4.97% 26/02/2036 (Not Rated) 5,000,000
5,112,829
5,110,529
1.35
Talam Transform Bhd 0% 28/06/2019 (B-) 2,119,673
13,577
1,831,489
0.48
Tanjung Bin Power Sdn Bhd 4.54% 16/08/2019 (AA2) 1,000,000
1,015,477
1,009,087
0.27
TAQA Abu Dhabi National Energy Co PJSC 4.65% 03/03/2022 (AA1) 4,000,000
4,049,677
4,013,620
1.06
UniTapah Sdn Bhd 6.24% 12/12/2031 (AA2) 2,000,000
2,150,364
2,152,809
0.57
UniTapah Sdn Bhd 6.15% 12/12/2030 (AA2) 2,000,000
2,152,025
2,154,372
0.57
TOTAL UNQUOTED SUKUK 135,019,673
135,531,809
137,334,562
36.32
ACCUMULATED UNREALISED GAIN ON UNQUOTED SUKUK AT FAIR VALUE THROUGH PROFIT OR LOSS
1,802,753
TOTAL UNQUOTED SUKUK AT FAIR VALUE THROUGH PROFIT OR LOSS
137,334,562

CIMB ISLAMIC BALANCED FUND
41
9. FINANCIAL ASSETS AT FAIR VALUE THROUGH PROFIT OR LOSS (CONTINUED)
Aggregate
Market
Percentage
Name of counter Quantity
cost
value
of NAV
Units
RM
RM
%
30.09.2015 Audited SHARIAH-COMPLIANT
QUOTED SECURITIES - LOCAL
Construction
Econpile Holdings Bhd 1,140,500 1,052,213 1,077,773 0.30
Gamuda Bhd 521,400 2,403,181 2,288,946 0.63
IJM Corporation Bhd 1,459,000 5,070,818 4,697,980 1.30
Protasco Bhd 607,700 1,044,763 1,014,859 0.28
3,728,600 9,570,975 9,079,558 2.51
Consumer Products
Bonia Corporation Bhd 938,600 949,705 685,178 0.19
Finance
BIMB Holdings Bhd 237,100 848,964 950,771 0.26 Syarikat Takaful Malaysia Bhd 629,000 1,415,201 2,371,330 0.66
866,100 2,264,165 3,322,101 0.92
Industrials
Cahya Mata Sarawak Bhd 853,500 2,668,264 4,395,525 1.22
Evergreen Fibreboard Bhd 940,900 1,840,983 1,797,119 0.50
Hume Industries Bhd 257,800 1,038,183 863,630 0.24 Kossan Rubber Industries
Bhd 569,500 3,034,964 4,402,235 1.22
Petronas Gas Bhd 199,800 3,702,149 4,387,608 1.21
SKP Resources Bhd 1,964,700 1,790,812 2,573,757 0.71
SLP Resources Bhd 982,200 1,415,860 1,640,274 0.45
United U-Li Corporation Bhd 236,100 876,016 968,010 0.27
6,004,500 16,367,231 21,028,158 5.82
IPC
Digi.Com Bhd 585,800 2,779,180 3,251,190 0.90
TIME dotCom Bhd 427,900 1,891,728 2,824,140 0.78
1,013,700 4,670,908 6,075,330 1.68
Plantation
Genting Plantations Bhd 105,800 1,065,591 1,048,478 0.29
Kuala Lumpur Kepong Bhd 76,400 1,795,624 1,657,880 0.46
182,200 2,861,215 2,706,358 0.75

CIMB ISLAMIC BALANCED FUND
42
9. FINANCIAL ASSETS AT FAIR VALUE THROUGH PROFIT OR LOSS (CONTINUED)
Aggregate
Market
Percentage
Name of counter Quantity
cost
value
of NAV
Units
RM
RM
%
30.09.2015 (CONTINUED) Audited (Continued) SHARIAH-COMPLIANT
QUOTED SECURITIES – LOCAL (CONTINUED)
Technology Globetronics Technology
Bhd 403,800 2,369,491 2,523,750 0.70
Inari Amertron Bhd 431,300 1,386,590 1,462,107 0.40
835,100 3,756,081 3,985,857 1.10
Trading/Services
Axiata Group Bhd 904,026 5,888,990 5,243,351 1.45
Berjaya Auto Bhd 220,920 288,692 433,003 0.12
Bumi Armada Bhd 716,100 870,236 662,393 0.18
Dialog Group Bhd 1,216,776 1,991,324 1,946,842 0.54
Malakoff Corporation Bhd 1,184,600 2,162,392 1,919,052 0.53
MISC Bhd 439,700 2,799,168 3,869,360 1.07
My EG Services Bhd 918,800 1,421,237 2,581,828 0.71
Sime Darby Bhd 281,133 2,578,660 2,190,026 0.61
Taliworks Corporation Bhd 454,100 1,675,419 1,580,268 0.44
Telekom Malaysia Bhd 526,441 3,255,710 3,516,626 0.97
Tenaga Nasional Bhd 647,600 6,582,083 7,784,152 2.15
UEM Edgenta Bhd 791,400 2,504,801 2,809,470 0.78
Uzma Bhd 122,100 306,215 241,758 0.07
Westports Holdings Bhd 962,900 2,847,430 4,082,695 1.13
9,386,596 35,172,357 38,860,824 10.75
TOTAL SHARIAH - COMPLIANT QUOTED SECURITIES - LOCAL 22,955,396 75,612,637 85,743,364 23.72

CIMB ISLAMIC BALANCED FUND
43
9. FINANCIAL ASSETS AT FAIR VALUE THROUGH PROFIT OR LOSS (CONTINUED)
Aggregate
Market
Percentage
Name of counter Quantity
cost
value
of NAV
Units
RM
RM
%
30.09.2015 (CONTINUED) Audited (Continued) SHARIAH-COMPLIANT
QUOTED SECURITIES – FOREIGN
HONG KONG
Consumer Products MTR Corporation Ltd 256,000 4,475,364 4,876,247 1.35 Techtronic Industries Co.
Ltd 331,500
3,943,993 5,374,722 1.49
587,500 8,419,357 10,250,969 2.84
Energy China Petroleum &
Chemical Ltd 388,000 1,256,058 1,035,998 0.29
CNOOC Ltd 238,000 1,270,622 1,069,933 0.30
PetroChina Co. Ltd 336,000 1,375,404 1,022,869 0.28
962,000 3,902,084 3,128,800 0.87
Finance China Overseas Land &
Investment Ltd 134,000 1,778,413 1,777,572 0.49
China Resources Land Ltd 106,000 1,270,790 1,091,260 0.30 Henderson Land
Development Co. Ltd 69,500 1,753,796 1,816,319 0.50
309,500 4,802,999 4,685,151 1.29
Industrials Anhui Conch Cement Co.
Ltd 90,000 1,181,933 1,160,728 0.32 China Merchants Holdings
Co. Ltd 80,000 1,254,056 1,031,758 0.29
Sinotrans Ltd 556,000 1,327,848 1,141,011 0.32
726,000 3,763,837 3,333,497 0.93
REITs
Link REIT 115,920 2,625,588 2,792,890 0.77
Telecommunications China Telecom Corporation
Ltd 1,586,000 3,538,970 3,353,656 0.93

CIMB ISLAMIC BALANCED FUND
44
9. FINANCIAL ASSETS AT FAIR VALUE THROUGH PROFIT OR LOSS (CONTINUED)
Aggregate
Market
Percentage
Name of counter Quantity
cost
value
of NAV
Units
RM
RM
%
30.09.2015 (CONTINUED) Audited (Continued) SHARIAH-COMPLIANT
QUOTED SECURITIES – FOREIGN (CONTINUED)
HONG KONG
(CONTINUED)
Utilities Cheung Kong Infrastructure
Holdings Ltd 92,000 2,884,478 3,611,720 1.00
TOTAL HONG KONG 4,378,920 29,937,313 31,156,683 8.63
INDIA
Energy
Reliance Industries Ltd 39,575 2,261,444 2,286,410 0.63
Health Care
Dr Reddys Laboratories Ltd 9,938 2,121,496 2,771,484 0.77 Sun Pharmaceutical
Industries Ltd 38,873 2,054,522 2,261,740 0.63
48,811 4,176,018 5,033,224 1.40
Industrials
Ultra Tech Cement Ltd 18,609 3,271,238 3,333,203 0.92
Technology
HCL Technologies Ltd 70,658 3,989,177 4,649,583 1.29
Telecommunications
Bharti Infratel Ltd 64,407 1,688,155 1,532,783 0.42
TOTAL INDIA 242,060 15,386,032 16,835,203 4.66
INDONESIA
Telecommunications PT Telekomunikasi
Indonesia Tbk 4,066,000 3,213,680 3,223,145 0.89
TOTAL INDONESIA 4,066,000 3,213,680 3,223,145 0.89

CIMB ISLAMIC BALANCED FUND
45
9. FINANCIAL ASSETS AT FAIR VALUE THROUGH PROFIT OR LOSS (CONTINUED)
Aggregate
Market
Percentage
Name of counter Quantity
cost
value
of NAV
Units
RM
RM
%
30.09.2015 (CONTINUED) Audited (Continued) SHARIAH-COMPLIANT
QUOTED SECURITIES – FOREIGN (CONTINUED)
PHILIPPINES
Consumer Products Universal Robina
Corporation 64,850 1,052,981 1,167,923 0.32
TOTAL PHILIPPINES 64,850 1,052,981 1,167,923 0.32
SINGAPORE
Consumer Products ComfortDelGro Corporation
Ltd 632,100 4,875,056 5,599,484 1.55
REITs CapitaLand Commercial
Trust Management Ltd 266,700 1,164,373 1,103,083 0.31
Telecommunications Singapore
Telecommunications Ltd 361,000 4,018,035 4,011,345 1.11
TOTAL SINGAPORE 1,259,800 10,057,464 10,713,912 2.97
SOUTH KOREA
Basic Materials
LG Chem Ltd 2,047 1,585,466 2,165,271 0.60
Consumer Products
Amorepacific Corp 1,996 1,203,371 2,847,144 0.79
Hanssem Co. Ltd 2,887 2,869,027 3,053,803 0.85
4,883 4,072,398 5,900,947 1.64
Telecommunications
SK Telecom Co. Ltd 3,001 2,524,106 2,924,219 0.81
TOTAL SOUTH KOREA 9,931 8,181,970 10,990,437 3.05

CIMB ISLAMIC BALANCED FUND
46
9. FINANCIAL ASSETS AT FAIR VALUE THROUGH PROFIT OR LOSS (CONTINUED)
Aggregate
Market
Percentage
Name of counter Quantity
cost
value
of NAV
Units
RM
RM
%
30.09.2015 (CONTINUED) Audited (Continued) SHARIAH-COMPLIANT
QUOTED SECURITIES – FOREIGN (CONTINUED)
TAIWAN
Consumer Products
Eclat Textile Co. Ltd 50,000 2,960,330 3,450,200 0.96
Telecommunications
Chunghwa Telecom Co. Ltd 629,000 7,498,705 8,246,668 2.28
TOTAL TAIWAN 679,000 10,459,035 11,696,868 3.24
THAILAND
Telecommunications Advanced Info Service PCL - NVDR 154,500 4,124,219 4,214,482 1.17
TOTAL THAILAND 154,500 4,124,219 4,214,482 1.17
TOTAL SHARIAH- COMPLIANT QUOTED SECURITIES - FOREIGN 10,855,061 82,412,694 89,998,653 24.93
TOTAL SHARIAH- COMPLIANT QUOTED SECURITIES 33,810,457 158,025,331 175,742,017 48.65
ACCUMULATED UNREALISED GAIN ON SHARIAH-COMPLIANT QUOTED SECURITIES AT FAIR VALUE THROUGH PROFIT OR LOSS 17,716,686
TOTAL SHARIAH-COMPLIANT QUOTED SECURITIES AT FAIR VALUE THROUGH PROFIT OR LOSS 175,742,017

CIMB ISLAMIC BALANCED FUND
47
9. FINANCIAL ASSETS AT FAIR VALUE THROUGH PROFIT OR LOSS (CONTINUED)
Aggregate
Market
Percentage
Name of counter Nominal
cost
value
of NAV
value
RM
RM
%
30.09.2015 (CONTINUED) Audited (Continued) UNQUOTED SUKUK
Anih Bhd 4.60% 29/11/2016 (AA) 2,500,000 2,554,158 2,553,559 0.71 Bahrain Mumtalakat Holding
Company B.S.C. 5.35% 30/04/2018 (AA3) 5,000,000 5,118,660 5,091,413 1.41
Bahrain Mumtalakat Holding Company B.S.C. 5.50% 03/10/2017 (AA3) 2,500,000 2,588,164 2,571,280 0.71
Bank Muamalat Malaysia Bhd 5.15% 15/06/2021 (A3) 3,400,000 3,454,359 3,477,067 0.96
CIMB Islamic Bank Bhd 4.20% 21/04/2021 (AA+) 5,000,000 5,104,811 5,093,575 1.41 Eversendai Corporation Bhd 4.70% 09/03/2018 (AA3) 2,000,000 2,007,377 1,932,471 0.53 First Resources Ltd 4.45% 31/07/2017 (AA2) 2,000,000 2,025,961 2,020,458 0.56 Gamuda Bhd 4.215% 26/10/2018 (AA3) 10,000,000 10,174,434 10,093,456 2.79 Golden Assets International Finance Ltd 4.35% 17/11/2017 (AA3) 5,000,000 5,080,369 5,002,695 1.38 Gulf Investment Corporation 4.90% 03/08/2016 (AAA) 4,000,000 4,059,391 4,057,682 1.12 Gulf Investment Corporation 5.25% 01/03/2016 (AAA) 2,500,000 2,523,968 2,523,338 0.70 Jimah Energy Ventures Sdn
Bhd 8.10% 12/5/2017 (AA3) 4,000,000 4,369,630 4,354,182 1.21
imah Energy Ventures Sdn Bhd 8.30% 11/11/2016 (AA3) 1,000,000 1,059,459 1,075,167 0.30
Jimah Energy Ventures Sdn Bhd 9.30% 12/05/2020 (AA3) 1,500,000 1,830,128 1,814,994 0.50
Kapar Energy Ventures 4.12% 05/07/2016 (AA+) 5,000,000 5,054,740 5,048,194 1.40
Kuala Lumpur Kepong Bhd 3.88% 10/10/2016 (AA1) 3,000,000 3,055,489 3,051,199 0.84 Malakoff Power Bhd 4.30%
17/12/2015 (AA3) 5,000,000 5,062,380 5,064,738 1.40 Malakoff Power Bhd 4.50%
16/12/2016 (AA3) 2,500,000 2,534,056 2,536,221 0.70 Perbadanan Kemajuan
Negeri Selangor 4.35% 28/10/2016 (AA3) 5,000,000 5,099,276 5,088,916 1.41

CIMB ISLAMIC BALANCED FUND
48
9. FINANCIAL ASSETS AT FAIR VALUE THROUGH PROFIT OR LOSS (CONTINUED)
Aggregate
Market
Percentage
Name of counter Nominal
cost
value
of NAV
value
RM
RM
%
30.09.2015 (CONTINUED) Audited (Continued) UNQUOTED SUKUK
(CONTINUED)
Perbadanan Kemajuan Negeri Selangor 4.60% 10/08/2018 (AA3) 5,000,000 5,054,706 5,020,700 1.39
Projek Lebuhraya Usahasama Bhd 4.22% 10/01/2020 (AAA) 500,000 505,376 502,490 0.14
Ranhill Powertron II Sdn Bhd 5.15% 16/06/2023 (AAA) 1,000,000 1,030,915 1,028,225 0.28 Sarawak Energy Bhd 4.40% 23/06/2016 (AA1) 2,500,000 2,537,715 2,535,262 0.70 Sunrise Bhd 4.35% 25/07/2016 (AA-) 5,000,000 5,040,981 5,045,538 1.40 Sunrise Bhd 0% 18/02/2016
(AA3) 6,000,000 6,031,383 6,026,159 1.67 Talam Transform Bhd 0% 28/06/2019 (BB3) 2,160,398 13,718 1,799,945 0.50 Tanjung Bin Power Sdn Bhd 4.54% 16/08/2019 (AA2) 1,000,000 1,016,708 1,001,392 0.28 Teknologi Tenaga Perlis Consortium Sdn Bhd 4.15% 29/07/2016 (AA1) 4,500,000 4,537,244 4,531,452 1.25 UMW Holdings Bhd 3.78%
05/02/2016 (AAA) 2,500,000 2,514,053 2,511,813 0.70 West Coast Expressway
Sdn Bhd 5.29% 28/08/2035 (AAA) 1,000,000 1,002,503 1,006,218 0.28
TOTAL UNQUOTED SUKUK 102,060,398 102,042,112 103,459,799 28.63
ACCUMULATED UNREALISED GAIN ON UNQUOTED SUKUK AT FAIR VALUE THROUGH PROFIT OR LOSS 1,417,687
TOTAL UNQUOTED
SUKUK AT FAIR VALUE THROUGH PROFIT OR LOSS 103,459,799

CIMB ISLAMIC BALANCED FUND
49
10. CASH AND CASH EQUIVALENTS (SHARIAH-COMPLIANT)
31.03.2016 30.09.2015 Audited RM RM Shariah-compliant deposits with licensed Islamic
financial institutions 14,979,118 30,699,186
Bank balances 16,081,754 49,986,946
31,060,872 80,686,132
The weighted average effective profit rate per annum is as follows:
31.03.2016 30.09.2015
Audited % % Shariah-compliant deposits with licensed Islamic
financial institutions 3.29 3.53
Shariah-compliant deposits with licensed Islamic financial institutions of the Fund have an average maturity of 3 day (30.09.2015: 3 days).
11. NUMBER OF UNITS IN CIRCULATION (UNITS)
01.10.2015 to 31.03.2016
01.10.2014 to 30.09.2015
Audited
No of units No of units
At the beginning of the financial period/year 724,540,461 769,027,834
Add : Creation of units from applications 125,760,853 111,946,395
Add : Creation of units from distribution - 16,289,024
Less : Cancellation of units (73,098,693) (172,722,792)
At the end of the financial period/year 777,202,621 724,540,461
12. MANAGEMENT EXPENSE RATIO (“MER”)
01.10.2015 to 31.03.2015
01.10.2014 to 31.03.2015
% % MER 0.89 0.84
MER is derived from the following calculation:
MER = (A + B + C + D + E) x 100
F A = Management fee B = Trustee’s and custodian fees C = Audit fee D = Tax agent’s fee
E = Other expenses excluding GST on transaction costs F = Average NAV of the Fund calculated on a daily basis The average NAV of the Fund for the financial period calculated on a daily basis is RM373,811,697 (31.03.2015: RM354,782,330).

CIMB ISLAMIC BALANCED FUND
50
13. PORTFOLIO TURNOVER RATIO (“PTR”)
01.10.2015 to 31.03.2016
01.10.2014 to 31.03.2015
PTR (times) 0.48 0.27
PTR is derived based on the following calculation:
(Total acquisition for the financial period + total disposal for the financial period) 2 Average NAV of the Fund for the financial period calculated on a daily basis Where: total acquisition for the financial period = RM225,160,583 (31.03.2015: RM77,785,647) total disposal for the financial period = RM130,037,410 (31.03.2015: RM114,551,040)
14. UNITS HELD BY THE MANAGER AND PARTIES RELATED TO THE MANAGER, AND
SIGNIFICANT RELATED PARTY TRANSACTIONS AND BALANCES
The related parties and their relationship with the Fund are as follows: Related parties Relationship CIMB-Principal Asset Management Bhd The Manager CIMB Group Sdn Bhd Holding company of the Manager CIMB Group Holdings Bhd Ultimate holding company of the (“CIMB”) Manager CIMB Bank Bhd Fellow subsidiary of the Manager CIMB Investment Bank Bhd Fellow subsidiary of the Manager CIMB Islamic Bank Bhd Fellow subsidiary of the Manager CIMB Securities (Singapore) Pte Ltd Fellow subsidiary of the Manager Subsidiaries and associates of CIMB as Subsidiary and associated companies disclosed in its financial statements of the ultimate holding company of the Manager Units held by the Manager and parties related to the Manager
31.03.2016 30.09.2015
Audited
No. of units RM No. of units RM
Manager CIMB-Principal Asset Management Bhd 57,188 27,816 559,514 278,918
In the opinion of the Manager, the above units were transacted at the prevailing market price.
The units are held beneficially by the Manager for booking purposes. Other than the above, there were no units held by the Directors or parties related to the Manager. In addition to related party disclosures mentioned elsewhere in the financial statements, set out below are other significant related party transactions and balances.

CIMB ISLAMIC BALANCED FUND
51
14. UNITS HELD BY THE MANAGER AND PARTIES RELATED TO THE MANAGER, AND
SIGNIFICANT RELATED PARTY TRANSACTIONS AND BALANCES (CONTINUED) The Manager is of the opinion that all transactions with the related companies have been entered into in the normal course of business at agreed terms between the related parties.
01.10.2015
to 31.03.2016 01.10.2014
to 31.03.2015 RM RM
Significant related party transactions Profit income from Shariah-compliant deposits with licensed Islamic financial institutions:
- CIMB Islamic Bank Bhd 46,401 35,058
31.03.2016 30.09.2015
Audited RM RM Significant related party balances Shariah-compliant deposits with licensed Islamic financial institutions:
- CIMB Islamic Bank Bhd 3,525,927 5,000,945
Bank balances
- CIMB Islamic Bank Bhd 142,827 33,495
15. TRANSACTIONS WITH BROKERS/DEALERS/FINANCIAL INSTITUTIONS
Details of transactions with the top 10 brokers/dealers/financial institutions for the six months financial period ended 31 March 2016 are as follows:
Brokers/Dealers/ Financial Institutions
Value of trades
Percentage of total trades
Brokerage fees
Percentage of total
brokerage fees
RM % RM % Bank Islam Malaysia Bhd 214,889,440
18.80
-
-
Maybank Islamic Bhd 165,430,000 14.48 -
- Hong Leong Islamic Bank Bhd 159,161,000
13.93
-
-
CIMB Islamic Bank Bhd # 127,844,000
11.19
-
-
Public Islamic Bank Bhd 94,790,000
8.30
-
-
RHB Investment Bank Bhd 81,742,436
7.15
9,594
2.45
Hong Leong Investment Bank Bhd 78,776,164
6.89
13,982
3.57
CIMB Investment Bank Bhd # 34,091,686
2.98
77,615
19.80
Alliance Islamic Bank Malaysia Bhd 25,703,000
2.25
-
-
JP Morgan Securities Singapore Pte Ltd 21,807,641
1.91
36,848
9.40
Others # 13,847,7349 12.12 253,932 64.78
1,142,712,716 100.00 391,971 100.00

CIMB ISLAMIC BALANCED FUND
52
15. TRANSACTIONS WITH BROKERS/DEALERS/FINANCIAL INSTITUTIONS (CONTINUED)
Details of transactions with the top 10 brokers/dealers/financial institutions for the six months financial period ended 31 March 2015 are as follows:
Brokers/Dealers/ Financial Institutions
Value of trades
Percentage of total trades
Brokerage fees
Percentage of total
brokerage fees
RM % RM % Maybank Islamic Bhd 199,629,000 17.95 - - Bank Islam Malaysia
Bhd 188,053,000
16.91
-
- CIMB Islamic Bank
Bhd # 170,049,000
15.29
-
- Alliance Islamic Bank
Malaysia Bhd 145,497,000
13.08
-
- Public Islamic Bank
Bhd 135,486,000
12.18
-
- RHB Bank Islamic
Berhad 70,440,000
6.33
-
- CIMB Securities
(Singapore) Pte Ltd # 30,083,376
2.70
17,175
5.56 RHB Investment Bank
Bhd 12,881,521
1.16
5,344
1.73 UBS Securities Asia
Ltd 12,599,525
1.13
33,760
10.94 Alliance Investment
Bank Bhd 11,351,640
1.02
24,366
7.89 Others # 136,071,825 12.25 228,030 73.88
1,112,141,887 100.00 308,675 100.00
# Included in the transactions are trades conducted with CIMB Islamic Bank Bhd, CIMB
Investment Bank Bhd, CIMB Securities (Singapore) Pte Ltd, CIMB Securities (India) Pvt Ltd, CIMB Securities Ltd (Taiwan Branch), CIMB Securities Ltd (Korea Branch), fellow subsidiaries to the Manager amounting to RM127,844,000 (31.03.2015: RM170,049,000), RM34,091,686 (31.03.2015: RM9,744,508), RM5,734,036 (31.03.2015: RM30,083,376), RM3,714,172 (31.03.2015: Nil), RM1,635,103 (31.03.2015: Nil) and RM1,113,525 (31.03.2015: Nil) respectively. The Manager is of the opinion that all transactions with the related companies have been entered into in the normal course of business at agreed terms between the related parties.

CIMB ISLAMIC BALANCED FUND
53
16. SEGMENT INFORMATION The internal reporting provided to the chief operating decision-maker for the Fund’s assets,
liabilities and performance is prepared on a consistent basis with the measurement and recognition principles of MFRS and IFRS. The chief operating decision-maker is responsible for the performance of the Fund and considers the business to have a single operating segment located in Malaysia. Asset allocation decisions are based on a single, integrated investment strategy and the Fund’s performance is evaluated on an overall basis.
The investment objective of the Fund is to achieve medium to long-term growth in both capital
and income by investing in permissible Shariah-compliant investments. The reportable operating segment derives its income by seeking investments to achieve targeted returns consummate with an acceptable level of risk within the portfolio. These returns consist of profit income and dividend income earned from Shariah-compliant investments and gains on the appreciation in the value of Shariah-compliant investments, which are derived from Ringgit denominated Shariah-compliant deposits with licensed Islamic financial institutions and Shariah-compliant collective investment scheme, Shariah-compliant quoted securities listed on the Bursa Securities Malaysia, Shariah-compliant quoted securities of companies domiciled in, listed in, and/or have significant operations in countries in Asia Pacific ex Japan and unquoted Sukuk traded in Malaysia.
There were no changes in reportable operating segment during the financial period.

CIMB ISLAMIC BALANCED FUND
54
DIRECTORY Head office of the Manager CIMB-Principal Asset Management Berhad (Company No.: 304078-K) 10th Floor, Bangunan CIMB, Jalan Semantan, Damansara Heights, 50490 Kuala Lumpur, MALAYSIA. Tel: (03) 2084 8888 Postal address CIMB-Principal Asset Management Berhad (Company No.: 304078-K) P.O.Box 10571, 50718 Kuala Lumpur, MALAYSIA. Website http://www.cimb-principal.com.my E-mail address [email protected] General investment enquiries (03) 7718 3100
Trustee for the CIMB Islamic Balanced Fund Universal Trustee (Malaysia) Berhad (Company No: 17540-D) No 1, Jalan Ampang (3rd Floor), 50450 Kuala Lumpur, MALAYSIA. Tel : (03) 2070 8050 Fax: (03) 2031 8715 / 2032 3194 / 2070 1296
Shariah Adviser of the CIMB Islamic Balanced Fund CIMB Islamic Bank Berhad (Company No.: 671380-H) Level 34, Menara Bumiputra-Commerce, No 11, Jalan Raja Laut, 50350 Kuala Lumpur, MALAYSIA. Tel: (03) 2619 1188 Fax: (03) 2691 3513, (03) 2691 3657

CIMB ISLAMIC BALANCED FUND
55
LIST OF CWA (an Agency force of CIMB-Principal) OFFICES ADDRESS TELEPHONE CWA BRANCHES Central Region
46, 2nd Floor, Jalan SS 21/39 Damansara Utama, 47400, Petaling Jaya, Selangor. 03-77122888
No 13B, 2nd Floor, Jalan Mamanda 7/1, Off Jalan Ampang, 68000 Ampang, Selangor. 03-42702970
169-2, Jalan Radin Bagus, Bandar Baru Sri Petaling, 57000 Kuala Lumpur. 03-90592333 Northern Region
No 5, Jalan Todak 4, Bandar Sunway, 04-3702155 Seberang Jaya, 13700 Perai, Penang. 04-3702156
30A, First Floor, Persiaran Greentown 1, 05-2439001 Greentown Business Centre, 30450 Ipoh, Perak. 05-2439002 East Coast Region
Ground Floor, No 298-B, Jalan Tok Hakim, 09-7471172 15000 Kota Bharu, Kelantan. 09-7471190
No. 44 & 44A, Jalan Putra Square 6, Putra Square, 25000 Kuantan, Pahang. 09-5134410
Southern Region
23 & 23A Jalan Harimau Tarum, Taman Century, 80250 Johor Bahru, Johor. 07-3341748
21, Jalan Melaka Raya 24, Taman Melaka Raya, 75000 Melaka. 06-2811111
East Malaysia Region
No 1 Jalan Pasar Baru, Kampung Air, 088-239951 88000 Kota Kinabalu, Sabah. 088-239952
5B, Lot 414, Section 10, KTLD Jalan Rubber, 93400 Kuching, Sarawak. 082-259777
1st and 2nd Floor, Lot 1092, Jalan Merpati, 98000 Miri, Sarawak. 085-432525

CIMB ISLAMIC BALANCED FUND
56
LIST OF CWA (an Agency force of CIMB-Principal) OFFICES (CONTINUED) ADDRESS TELEPHONE CWA SALES OFFICES Central Region
32-3, 3rd Floor Jalan 1/27F, KL Satellite Centre (KLSC), Wangsa Maju, Section 5, 53300 Kuala Lumpur. 03-41422911
Unit B-3A-1, Setiawangsa Business Suites, Jalan Setiawangsa 11, Taman Setiawangsa, 54200, Kuala Lumpur. 03-42566277
J-06-01, Level 6, Block J, Solaris Mont Kiara, Jalan Solaris, 50480 Kuala Lumpur. 03-62040113
No 41B, 43B, Jalan Wan Kadir 2, Taman Tun Dr Ismail, 60000, Kuala Lumpur. 03-77241789
A-2-1, Block A, 8 Jalan PJU 1A/20A, Dataran Ara Damansara, 47301 Petaling Jaya, Selangor. 03-78430506
Lot C-615 & Lot C-616, Level 6, Block C, Kelana Square, 17, Jalan SS7/26, Kelana Jaya, 47301 Petaling Jaya, Selangor. 03-78806893
A-2-3, Block A, 8 Jalan PJU 1A/20A, Dataran Ara Damansara, 47301 Petaling Jaya, Selangor. 03-78430503
No 3A, Jalan Hentian 3, Pusat Hentian Kajang, 43000, Kajang, Selangor. 03-87345695
2-6A Jalan PJU 8/3A, Bandar Damansara Perdana, 47820 Petaling Jaya, Selangor. 03-77256320
The Strand, 32A-3, Jalan PJU5/20D, Kota Damansara, 47810, Petaling Jaya, Selangor. 03-61428382
Lot No 35-2, 2nd Floor, Jalan Sepah Puteri 5/1B, Pusat Dagangan Seri Utama, PJU5, Kota Damansara, 47410, Selangor. 03-61403046
1-91-2, Block I, Jalan Teknologi 3/9, Kota Damansara, 47810, Petaling Jaya, Selangor. 03-61407275
47A, Tingkat 1, Jalan Badminton 13/29, Seksyen 13, Shah Alam, 40100, Selangor. 03-55232693
98A, Jalan SS21/39, Damansara Utama, 47400, Petaling Jaya, Selangor. 03-77250825
D10-08-G & D10-08-1, Pusat Perdagangan Dana 1, Jalan PJU1A/46, 47301, Petaling Jaya, Selangor. 03-78311267

CIMB ISLAMIC BALANCED FUND
57
LIST OF CWA (an Agency force of CIMB-Principal) OFFICES (CONTINUED) ADDRESS TELEPHONE CWA SALES OFFICES (CONTINUED) Central Region (Continued)
37-2, Jalan Cecawi 6/33, PJU5, Kota Damansara, 47810, Petaling Jaya, Selangor. 03-61422970
B-1-22 & B-2-22 & B-2-21 Block B 10 Boulevard, Jalan Cempaka, Sungai Kayu Ara, 47400 Petaling Jaya, Selangor. 03-77223895
No. 6-2, Jalan Dagang 1/1A, Taman Dagang, 68000 Ampang, Selangor. 03-42511129
No 35B-2 (2nd Floor), Jalan Keluli Am7/Am, Pusat Perniagaan Bukit Raja, 40000 Seksyen 7, Shah Alam, Selangor. 03-33414978
No 65-2, Jalan Nelayan A, 19/A, Pusat Daerah Seksyen 19, 40300 Shah Alam, Selangor. 03-54800296
No B-3A-23, Merchant Square, Jalan Tropicana Selatan 1, Tropicana Golf & Country Resort, 47410 Petaling Jaya, Selangor. 03-78874408
Block E-1-03A & E-2-03A, Jalan SS6/20A, Dataran Glomac, 47301 Kelana Jaya, Selangor. 03-78807082
No 12-01 D’Bayu Business Center, Jalan Serambi U8/24, Bukit Jelutong, 40150 Shah Alam, Selangor. 03-61428382
No 41B 3B Curve Business Park, Medan Pusat Bandar 2D, Seksyen 9, 43650 Bandar Baru Bangi, Selangor. 03-89264155
19-1 Jalan Adenium 2G/9, Adenium Business Center, Bukit Beruntung, 48300 Rawang, Selangor. 03-60217385
East Coast Region
Lot 252, No 73, Tingkat 1, Jalan Besar Pusat Niaga Paka, 23100, Paka, Terengganu. 09-8278001
PT 10725, Ground Floor, Jalan Kubang Kurus, Taman Cukai Utama Fasa 4, 24000 Kemaman, Terengganu. 09-8589911
No. 50A, Tingkat 1, Malay Town, 25200 Kuantan, Pahang. 019-2366602
Southern Region
No 38-01, Jalan Serangkai 18, Taman Bukit Dahlia, 81700 Pasir Gudang, Johor. 07-2326976
24-1 Jalan Padi Emas 4/1 Pusat Bandar Tampoi, Johor Bahru, 81200 Johor. 07-2326976

CIMB ISLAMIC BALANCED FUND
58
LIST OF CWA (an Agency force of CIMB-Principal) OFFICES (CONTINUED) ADDRESS TELEPHONE CWA SALES OFFICES (CONTINUED) Southern Region (Continued)
No 55-2, 57-2, 59-2, Jalan TU 49A, Taman Tasik Utama, Ayer Keroh, 75450 Melaka. 06-2533289
No 18-1 S2 B18, Biz Avenue Seremban 2, 70300 Seremban, Negeri Sembilan. 06-6015749
16-01 Jalan Padi Emas 1/5, UDA Business Centre, 81200 Johor Bharu, Johor. 07-3009350 East Malaysia Region
15A, Jalan Ruby, 96000 Sibu, Sarawak. 084-325515
Shop Lot No.2, Block 49, of Parent Lot 2646, Park City Commerce Square, Jalan Kambar, Off Jalan Tun Ahmad Zaidi, 97000 Bintulu, Sarawak. 012-2172269