CIMB FTSE ASEAN 40 MALAYSIA UNAUDITED QUARTERLY … CIMB FTSE ASEAN 40 31032016.pdf · Malaysian...
30
CIMB FTSE ASEAN 40 MALAYSIA UNAUDITED QUARTERLY REPORT FOR THE FINANCIAL PERIOD FROM 1 JANUARY 2016 TO 31 MARCH 2016
Transcript of CIMB FTSE ASEAN 40 MALAYSIA UNAUDITED QUARTERLY … CIMB FTSE ASEAN 40 31032016.pdf · Malaysian...

CIMB FTSE ASEAN 40 MALAYSIA UNAUDITED QUARTERLY REPORT FOR THE FINANCIAL PERIOD FROM 1 JANUARY 2016 TO 31 MARCH 2016

CIMB FTSE ASEAN 40 MALAYSIA
CONTENTS PAGE(S)
INVESTORS' LETTER 1
MANAGER'S REPORT 2 - 7
Fund Objective and Policy
Performance Data
Market Review
Fund Performance
Portfolio Structure
Market Outlook
Investment Strategy
Unit Holdings Statistics
Soft Commissions and Rebates
UNAUDITED STATEMENT OF COMPREHENSIVE INCOME 8 - 9
UNAUDITED STATEMENT OF FINANCIAL POSITION 10
UNAUDITED STATEMENT OF CHANGES IN EQUITY 11
UNAUDITED STATEMENT OF CASH FLOWS 12
NOTES TO THE FINANCIAL STATEMENTS 13 - 27
DIRECTORY 28

CIMB FTSE ASEAN 40 MALAYSIA
1
INVESTORS' LETTER Dear Valued Investors, We are very pleased to share the great news that CIMB-Principal Asset Management Berhad ("CIMB-Principal") has just received the coveted Best Overall Group award at The Edge-Thomson Reuters Lipper Fund Awards 2016. Our funds have also been recognised for being the best in its categories for the year ended 31 December 2015 by The Edge-Thomson Reuters Lipper Fund Awards 2016 and the Morningstar Award 2016 Malaysia: The Edge-Thomson Reuters Lipper Fund Awards 2016
CIMB-Principal Asia Pacific Dynamic Income Fund
Best Equity Asia-Pacific Ex-Japan MYR (3 Years)
CIMB-Principal Global Titans Fund
Best Equity Global (3 & 5 Years)
CIMB-Principal Asian Equity Fund
Best Equity Asia-Pacific Ex-Japan (5 Years)
CIMB Islamic Asia Pacific Equity Fund
Best Equity Asia-Pacific Ex-Japan Islamic (3 Years)
Morningstar Award 2016 Malaysia
CIMB-Principal Asia Pacific Dynamic Income Fund
Best Asia-Pacific Equity Fund The awards came at the right time, proving that CIMB-Principal is a consistent performer and able to weather the headwinds despite the challenging market environment. They are also a great recognition of how our investment team implemented effective investment strategies to deliver risk-adjusted returns for our investors. These accolades reinforces our dedication in delivering the best value and demonstrates how we are moving forward to be the most preferred asset manager in the country. We would like to take this opportunity to sincerely thank you for your continuous support and confidence in our services. CIMB-Principal remains committed in helping you to grow your investment. Yours faithfully, for CIMB-Principal Asset Management Berhad
Munirah Khairuddin Chief Executive Officer/Executive Director

CIMB FTSE ASEAN 40 MALAYSIA
2
MANAGER’S REPORT FUND OBJECTIVE AND POLICY What is the investment objective of the Fund? The Fund aims to provide investment results that, before expenses, closely correspond to the performance of the Financial Times Stock Exchange ("FTSE")/ASEAN 40 Index (the "Underlying Index") regardless of its performance. Has the Fund achieved its objective? For the financial period under review, the Fund's total return was negative 1.84%, while the CIMB FTSE ASEAN 40 (the "Singapore Fund" or "Underlying Fund") was negative 0.95%. In the mean time, the Underlying Index's return was negative 0.90%. Nevertheless, for 1-year period, the Fund's total return outperformed the benchmark by 0.39%. Hence, the Fund's investment objective is still in place. What are the Fund investment policy and principal investment strategy? The Fund is a feeder Exchange-Traded Fund ("ETF") listed on the main market of Bursa Securities which aims to invest at least 95% of its Net Asset Value ("NAV") in the Singapore Fund. The Singapore Fund is an ETF listed on the Singapore Exchange Securities Trading Limited ("SGX-ST") which aims at providing the Singapore Fund unit holders a return that closely corresponds to the performance of the Underlying Index. Therefore, the Manager adopts a passive strategy in the management of the Fund. Fund category/ type Feeder ETF/Equity/Index Tracking How long should you invest for? Recommended three (3) to five (5) years Indication of short-term risk (low, moderate, high) High When was the Fund launched? 9 July 2010* * Listing date
What was the size of the Fund as at 31 March 2016? RM2.23 million (1.35 million units) What is the Fund’s benchmark? The benchmark index, namely the FTSE/ASEAN 40 Index is designed to represent the performance of the ASEAN region by measuring the eligible securities listed on the stock exchanges of Indonesia, Malaysia, the Philippines, Singapore and Thailand which consists of the 40 largest companies by full market value listed on the stock exchange of Indonesia, Malaysia, the Philippines, Singapore and Thailand that qualify for inclusion in the FTSE/ASEAN Index or such replacement index as may be determined by the Singapore Fund Manager and/or the Manager. What is the Fund distribution policy? Annually, subject to the discretion of the Manager. What was the net income distribution for the financial period from 1 January 2016 to 31 March 2016? There was no distribution made for the financial period from 1 January 2016 to 31 March 2016.

CIMB FTSE ASEAN 40 MALAYSIA
3
PERFORMANCE DATA
Details of portfolio composition of the Fund for the last three unaudited financial periods are as follows:
31.03.2016 31.03.2015 31.03.2014
% % %
Collective investment scheme 98.87 100.00 98.98
Cash and other net assets 1.13 - 1.02
100.00 100.00 100.00
Performance details of the Fund for the last three unaudited financial periods are as follows:
31.03.2016 31.03.2015 31.03.2014
Total asset value (RM Million) 2.25 2.55 2.29
NAV (RM Million) 2.23 2.53 2.26
Units in circulation (Million) 1.35 1.35 1.35
NAV per Unit (RM) 1.6503 1.8748 1.6758
01.01.2016 to
31.03.2016
01.01.2015 to
31.03.2015
01.01.2014 to
31.03.2014
Highest NAV per Unit (RM) 1.7124 1.8748 1.6940
Lowest NAV per Unit (RM) 1.5563 1.7633 1.5836
Market Price per Unit (RM) 1.6550 1.8800 1.7000
Highest Market Price per Unit (RM) 1.7000 1.8900 1.7000
Lowest Market Price per Unit (RM) 1.5550 1.7700 1.6400
Total return (%) ^ (1.84) 4.07 0.69
- Capital growth (%) (1.84) 4.07 0.69
- Income distribution (%) - - -
Management Expense Ratio ("MER") (%) * 0.85 0.52 0.49
Portfolio Turnover Ratio ("PTR") (times) # - - 0.02
^ based on NAV per unit
* The Fund's MER increased from 0.52% to 0.85% mainly due to the increase in other expenses
pursuant to implementation of Goods and Services Tax ("GST") effective 1 April 2015. # The Fund's PTR is zero as there was no transaction made for the financial period from 1 January
2016 to 31 March 2016.
31.03.2016
31.03.2015
31.03.2014
31.03.2013 31.03.2012
%
%
%
% %
Annual total return (8.80)
15.15
(2.45)
11.60 5.02
(Listing date : 9 July 2010)
Past performance is not necessarily indicative of future performance and that unit prices and investment returns may go down, as well as up. All performance figures for the financial period have been extracted from Lipper.

CIMB FTSE ASEAN 40 MALAYSIA
4
MARKET REVIEW (1 JANUARY 2016 TO 31 MARCH 2016) Singapore equities started 2016 on a weak note. The Straits Times Index ("STI") declined 8.80% in January 2016, ending the month at 2,629.10. Its offshore and marine engineering output was the major drag, contracting 10.70% month-on-month ("m-o-m"), after a similar decline in November 2015. The Stock Exchange of Thailand ("SET") Index see-sawed throughout the month, to close at the month high of 1,300.98. Old negative factors – China’s and the global economy slowdown, Chinese Yuan Renminbi ("CNY") devaluation and oil prices tumbling – still put downward pressure on Thailand and Asian stock markets. In Philippines, the solid fourth quarter of 2015 Gross Domestic Products ("GDP") growth of 6.30% provided a boost, as government spending showed sustained strength at 17.40% over the year. Telecommunications bucked the trend with a 6.10% gain as investors flocked to Philippines Long Distance Telephone Company ("PLDT") (+7.80% m-o-m) for dividend yield. Foreigners began the year with net selling of United States Dollar ("USD") 43 million, following USD1.20 billion net outflows in 2015. While in Indonesia, Bank Indonesia ("BI") cut policy rates by 25 basis points ("bps") in January 2016. The move was well received by markets. The Indonesia Rupiah ("IDR") appreciated 40 bps with an end of month rally. Foreign investors sold USD135 million of equities in January 2016. Consumer staples and telecom led equities; utilities and materials lagged. FTSE Bursa Malaysia ("FMB") Kuala Lumpur Composite Index (“FBMKLCI”) succumbed to initial selling pressure before rebounding post Statutory Reserve Requirement ("SRR") cut towards month-end to close 1.50% m-o-m lower. Bank Negara Malaysia ("BNM") kept its Overnight Policy Rate ("OPR") unchanged at 3.25%. In February 2016, Indonesia was the top performer. Improving government spending and monetary policy support were the key positive factors. BI cut policy rates again by 25 bps in February 2016 to 7.00%, and threw in a reserve cut. Parliament had decided to postpone the revision of the Corruption Eradication Commission ("KPK") Law and Tax Amnesty Law. Government may consequently need to revise the revenue and spending target lower. Singapore’s Straits Times Index ("STI") edged up 1.40% for the month after the weak start to the year, to close at 2,667. Telecommunications reversed its underperformance to deliver the highest returns of +6.50% over the month. Thailand’s equity market continued to be volatile, but outperformed the region for the second consecutive month. The Bank of Thailand ("BOT") held the benchmark policy rate at 1.50%, as expected. February 2016 inflation was in line with expectations, at -0.50% , with inflation at 0.70% year-to-date ("YTD"). Energy prices were the key source of disinflation. The Philippine Stock Exchange Composite Index ("PSEi") closed the month flat at 6,671. Mixed fourth quarter of 2015 earnings results were the key driver of dispersed stock performance during the month. Telecommunications underperformed, while consumer and utilities outperformed on generally strong earnings. The political race remained fluid with no clear frontrunner for the highest post in the land, keeping investors at bay. In Malaysia, companies reported weak earnings in fourth quarter of 2015. The Malaysian Ringgit ("MYR") weakened slightly from RM4.15 to RM4.20 against USD. The latest fourth quarter of 2015 Consumer Sentiment Index ("CSI") touched a new low of 63.80. In USD terms, Malaysia was the top performer in March 2016 followed by Indonesia. Foreign currency inflow and the strengthening MYR were the key positive factors. FBMKLCI rallied 3.80% to close at 1,717.58 points on the back of higher oil prices, stronger MYR and increasing investor optimism that the US Federal Reserve (the "Fed") may delay its future Fed Funds rate hike. The confluence of these positive macro factors led to an RM6.10 billion net foreign equity inflow into the Malaysian market. Indonesian equities and the IDR touched recent highs middle of March 2016, before easing after the central bank’s well anticipated third rate cut YTD. While in Singapore, STI’s gains helped to offset some of the earlier January 2016 and February 2016 losses, with the STI down 1.50% in first quarter of 2016. The Financial Year 2016 budget was presented in Parliament on 24 March 2016, with a focus on the importance of ongoing macroeconomic restructuring measures along with measures to address the cyclical weakness. Thailand shares joined the global stock market rally, driven by the Fed’s dovish stance on policy rate increases. Capital inflows helped shore up the market. Philippine equities posted its best monthly performance in March 2016 since January 2013. The outperformance was driven by the Fed's dovish outlook, steady currency, and better clarity on election race dynamics.
CIMB FTSE ASEAN 40 MALAYSIA
5
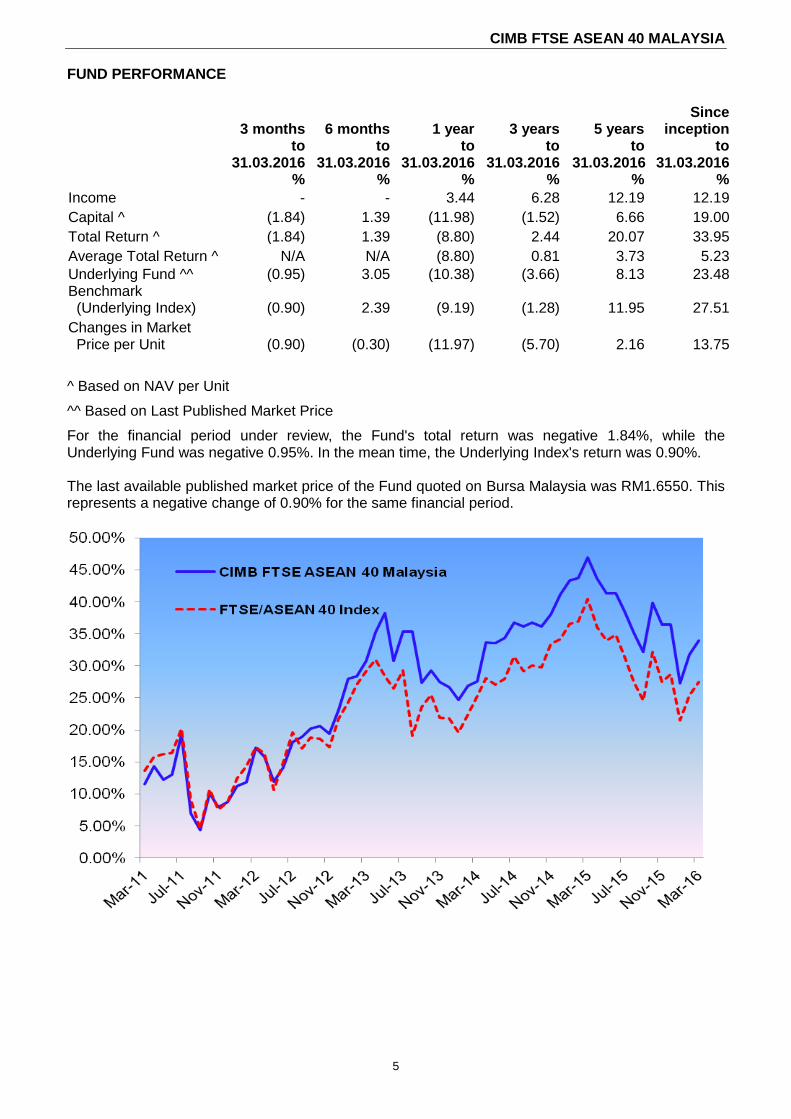
FUND PERFORMANCE
3 months to
31.03.2016 %
6 months to
31.03.2016 %
1 year to
31.03.2016 %
3 years to
31.03.2016 %
5 years to
31.03.2016 %
Since inception
to 31.03.2016
%
Income - - 3.44 6.28 12.19 12.19
Capital ^ (1.84) 1.39 (11.98) (1.52) 6.66 19.00
Total Return ^ (1.84) 1.39 (8.80) 2.44 20.07 33.95
Average Total Return ^ N/A N/A (8.80) 0.81 3.73 5.23
Underlying Fund ^^ (0.95) 3.05 (10.38) (3.66) 8.13 23.48 Benchmark
(Underlying Index) (0.90) 2.39 (9.19) (1.28) 11.95 27.51
Changes in Market Price per Unit (0.90) (0.30) (11.97) (5.70) 2.16 13.75
^ Based on NAV per Unit
^^ Based on Last Published Market Price
For the financial period under review, the Fund's total return was negative 1.84%, while the Underlying Fund was negative 0.95%. In the mean time, the Underlying Index's return was 0.90%. The last available published market price of the Fund quoted on Bursa Malaysia was RM1.6550. This represents a negative change of 0.90% for the same financial period.

CIMB FTSE ASEAN 40 MALAYSIA
6
FUND PERFORMANCE (CONTINUED)
Changes in NAV
31.03.2016
31.03.2015
Changes
%
NAV (RM Million)
2.23
2.53
(11.86)
NAV per Unit (RM)
1.6503
1.8748
(11.97) For the 1-year period, total NAV fell by 11.86%, while the NAV per unit fell by 11.97%. The fall in the total NAV and NAV per unit were due to investment performance of the combined ASEAN markets over the 1-year period. Performance data represents the combined income and capital return as a result of holding units in the Fund for the specified length of time, based on NAV to NAV price. The performance data assumes that all earnings from the Fund are reinvested and are net of management and trustee fees. Past performance is not reflective of future performance and income distributions are not guaranteed. Unit prices and income distributions, if any, may fall and rise. All performance figures for the financial period have been extracted from Lipper.
PORTFOLIO STRUCTURE
Asset allocation
(% of NAV) 31.03.2016 31.03.2015
Collective investment scheme 98.87 100.00
Cash and other net assets 1.13 -
TOTAL 100.00 100.00
The Fund remained fully invested in the Underlying Fund for the financial period under review. A minimal level of liquid assets was maintained primarily for liquidity purposes.
MARKET OUTLOOK*
The near-term outlook for the Association of Southeast Asian Nations ("ASEAN") has been bolstered by the weakening of the USD, on the back of the Fed's more dovish outlook. Domestic currencies and oil prices have also been on a recovery uptrend, supporting inflows in the bond and equity markets. The combination of expansionary fiscal and monetary policies provides upside risk to growth for Indonesia. The passing and the implementation of the tax amnesty this year would be a boost to overall growth. Thailand’s road to recovery continues but remains uneven with a slower recovery in the agricultural sector. Looking forward, we believe the incentives for the Government to stimulate the economy are even higher, given that the referendum on the draft constitution is around the corner. The Philippines’ economy is expected to expand by 6.00% in 2016, strengthening from +5.80% for 2015, on the back of further acceleration in public and private sector consumption driven by the upcoming election, while a ramp-up in infrastructure will likely be an additional catalyst. In the short term, the FBMKLCI should have a positive bias based on the following: 1) Capital flows will continue to seek refuge in defensive higher yielding countries like Malaysia, especially in an environment where negative yields persist in the Europe and Japan; 2) Earnings momentum, although negative, is bottoming and expectations are more realistic than a year ago; and 3) Malaysia is cheap from a USD perspective based on price to book. *This market outlook does not constitute an offer, invitation, commitment, advice or recommendation to make a purchase of any investment. The information given in this article represents the views of CIMB-Principal or based on data obtained from sources believed to be reliable by CIMB-Principal. Whilst every care has been taken in preparing this, CIMB-Principal makes no guarantee, representation or warranty and is under no circumstances liable for any loss or damage caused by reliance on, any opinion, advice or statement made in this market outlook.

CIMB FTSE ASEAN 40 MALAYSIA
7
INVESTMENT STRATEGY
As this is a feeder ETF, the Fund will continue to remain fully invested in the Underlying Fund with minimal cash kept for liquidity purposes. UNIT HOLDINGS STATISTICS Breakdown of unit holdings by size as at 31 March 2016 are as follows:
Size of unit holdings (units) No. of unit holders No. of units held (million)
% of units held
Less than 100 5 0.00 0.01
100 to 1,000 23 0.01 0.76
1,001 to 10,000 40 0.14 10.55
10,001 to 100,000 14 0.42 31.21
100,001 to less than 5% of approved fund size 2 0.78 57.47
5% and above the approved fund size - - -
Total 84 1.35 100.00
SOFT COMMISSIONS AND REBATES CIMB-Principal Asset Management Berhad (the “Manager”) and the Trustee (including their officers) will not retain any form of rebate or soft commission from, or otherwise share in any commission with, any broker in consideration for directing dealings in the investments of the Funds unless the soft commission received is retained in the form of goods and services such as financial wire services and stock quotations system incidental to investment management of the Funds. All dealings with brokers are executed on best available terms. During the financial period under review, the Manager and the Trustee did not receive any rebates from the brokers or dealers but have retained soft commission in the form of goods and services such as financial wire services and stock quotations system incidental to investment management of the Funds.

CIMB FTSE ASEAN 40 MALAYSIA
8
UNAUDITED STATEMENT OF COMPREHENSIVE INCOME FOR THE FINANCIAL PERIOD FROM 1 JANUARY 2016 TO 31 MARCH 2016
01.01.2016 to 31.03.2016
01.01.2015 to 31.03.2015
Note RM RM
INVESTMENT (LOSS)/INCOME
Net (loss)/gain on financial assets at fair value
through profit or loss 7 (19,836) 111,993
Net foreign exchange (loss)/gain (3,304) 86
(23,140) 112,079
EXPENSES
Trustee’s fee 5 2,984 2,959
Audit fee 6,966 6,164
Tax agent’s fee 1,144 3,228
Other expenses 7,660 543
18,754 12,894
(LOSS)/PROFIT BEFORE TAXATION (41,894) 99,185
Taxation 6 - -
(LOSS)/PROFIT AFTER TAXATION AND TOTAL COMPREHENSIVE (LOSS)/INCOME FOR THE FINANCIAL PERIOD
(41,894) 99,185
(Loss)/Profit after taxation is made up as follows:
Realised amount (22,058) (12,808)
Unrealised amount (19,836) 111,993
(41,894) 99,185
The accompanying notes to the financial statements form an integral part of the unaudited financial statements.

CIMB FTSE ASEAN 40 MALAYSIA
9
UNAUDITED STATEMENT OF COMPREHENSIVE INCOME (CONTINUED) FOR THE FINANCIAL PERIOD FROM 1 JULY 2015 TO 31 MARCH 2016
Year-to-date 31.03.2016
Year-to-date 31.03.2015
Note RM RM
INVESTMENT (LOSS)/INCOME
Net (loss)/gain on financial assets at fair value
through profit or loss 7 (89,559) 250,719
Net foreign exchange gain 8,409 1,297
(81,150) 252,016
EXPENSES
Trustee’s fee 5 9,021 9,009
Audit fee 19,542 18,766
Tax agent’s fee 3,458 4,740
Other expenses 8,891 4,218
40,912 36,733
(LOSS)/PROFIT BEFORE TAXATION (122,062) 215,283
Taxation 6 - -
(LOSS)/PROFIT AFTER TAXATION AND TOTAL COMPREHENSIVE (LOSS)/INCOME FOR THE FINANCIAL PERIOD
(122,062) 215,283
(Loss)/Profit after taxation is made up as follows:
Realised amount (32,503) (35,436)
Unrealised amount (89,559) ) 250,719
(122,062) 215,283
The accompanying notes to the financial statements form an integral part of the unaudited financial statements.

CIMB FTSE ASEAN 40 MALAYSIA
10
UNAUDITED STATEMENT OF FINANCIAL POSITION AS AT 31 MARCH 2016 31.03.2016 30.06.2015 Audited Note RM RM CURRENT ASSETS Financial assets at fair value through profit or loss 7 2,202,779 2,292,338 Cash and cash equivalents 8 49,922 89,745
TOTAL ASSETS 2,252,701 2,382,083
CURRENT LIABILITIES Amount due to Trustee 1,016 986 Other payables and accruals 9 23,802 31,152
TOTAL LIABILITIES 24,818 32,138
NET ASSET VALUE OF THE FUND 2,227,883 2,349,945
EQUITY Unit holders’ capital 1,312,065 1,312,065 Retained earnings 915,818 1,037,880
NET ASSETS ATTRIBUTABLE TO UNIT HOLDERS 2,227,883 2,349,945
NUMBER OF UNITS IN CIRCULATION (UNITS) 10 1,350,000 1,350,000
NET ASSET VALUE PER UNIT (RM) 1.6503 1.7407
The accompanying notes to the financial statements form an integral part of the unaudited financial statements.

CIMB FTSE ASEAN 40 MALAYSIA
11
UNAUDITED STATEMENT OF CHANGES IN EQUITY FOR THE FINANCIAL PERIOD FROM 1 JANUARY 2016 TO 31 MARCH 2016
Unit holders' Retained
capital earnings Total
RM RM RM
Balance as at 1 January 2016 1,312,065 957,712 2,269,777 Total comprehensive loss for the financial period
-
(41,894)
(41,894)
Balance as at 31 March 2016 1,312,065 915,818 2,227,883
Balance as at 1 January 2015 1,312,065 1,119,769 2,431,834 Total comprehensive income for the financial period
-
99,185
99,185
Balance as at 31 March 2015 1,312,065 1,218,954 2,531,019
FOR THE FINANCIAL PERIOD FROM 1 JULY 2015 TO 31 MARCH 2016
Unit holders' Retained
capital earnings Total
RM RM RM
Balance as at 1 July 2015 1,312,065 1,037,880 2,349,945 Total comprehensive loss for the financial period
-
(122,062)
(122,062)
Balance as at 31 March 2016 1,312,065 915,818 2,227,883
Balance as at 1 July 2014 1,312,065 1,003,671 2,315,736 Total comprehensive income for the financial period
-
215,283
215,283
Balance as at 31 March 2015 1,312,065 1,218,954 2,531,019
The accompanying notes to the financial statements form an integral part of the unaudited financial statements.
CIMB FTSE ASEAN 40 MALAYSIA
12
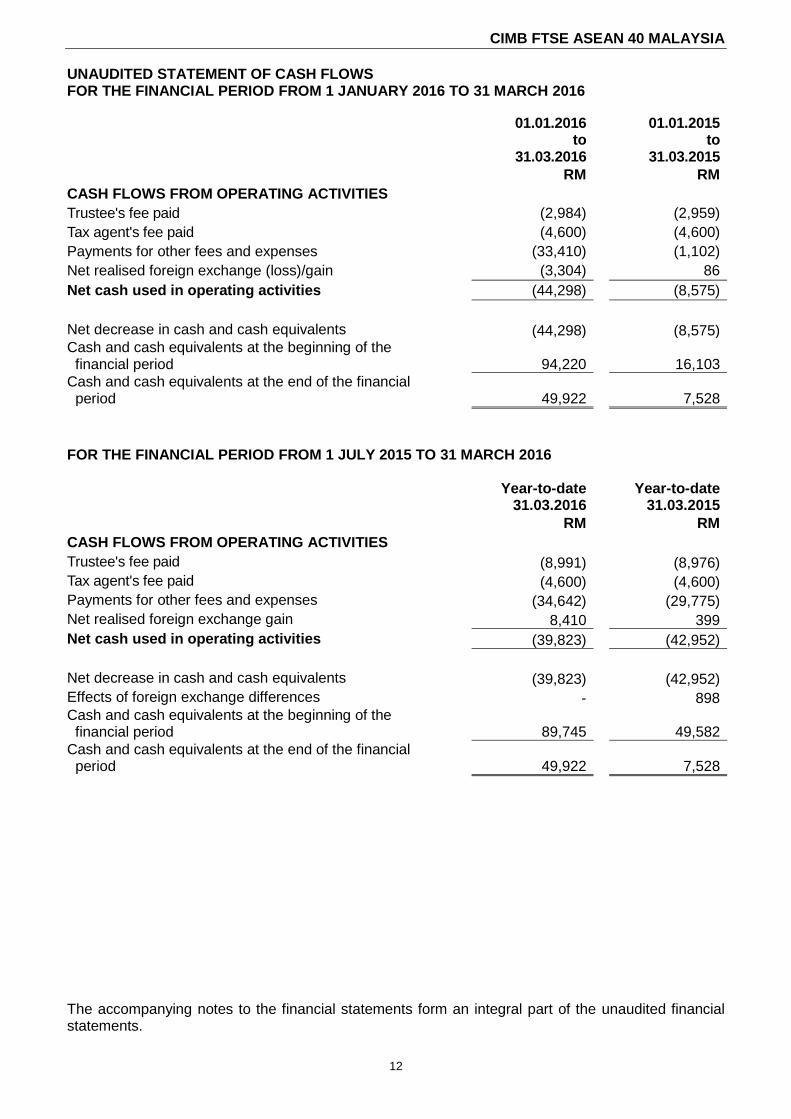
UNAUDITED STATEMENT OF CASH FLOWS FOR THE FINANCIAL PERIOD FROM 1 JANUARY 2016 TO 31 MARCH 2016
01.01.2016 to
31.03.2016
01.01.2015 to
31.03.2015
RM RM
CASH FLOWS FROM OPERATING ACTIVITIES
Trustee's fee paid (2,984) (2,959)
Tax agent's fee paid (4,600) (4,600)
Payments for other fees and expenses (33,410) (1,102)
Net realised foreign exchange (loss)/gain (3,304) 86
Net cash used in operating activities (44,298) (8,575)
Net decrease in cash and cash equivalents (44,298) (8,575) Cash and cash equivalents at the beginning of the financial period
94,220
16,103
Cash and cash equivalents at the end of the financial period
49,922
7,528
FOR THE FINANCIAL PERIOD FROM 1 JULY 2015 TO 31 MARCH 2016
Year-to-date
31.03.2016 Year-to-date
31.03.2015
RM RM
CASH FLOWS FROM OPERATING ACTIVITIES
Trustee's fee paid (8,991) (8,976)
Tax agent's fee paid (4,600) (4,600)
Payments for other fees and expenses (34,642) (29,775)
Net realised foreign exchange gain 8,410 399
Net cash used in operating activities (39,823) (42,952)
Net decrease in cash and cash equivalents (39,823) (42,952)
Effects of foreign exchange differences - 898 Cash and cash equivalents at the beginning of the financial period
89,745 49,582
Cash and cash equivalents at the end of the financial period
49,922 7,528
The accompanying notes to the financial statements form an integral part of the unaudited financial statements.

CIMB FTSE ASEAN 40 MALAYSIA
13
NOTES TO THE FINANCIAL STATEMENTS FOR THE FINANCIAL PERIOD FROM 1 JANUARY 2016 TO 31 MARCH 2016 1. THE FUND, THE MANAGER AND ITS PRINCIPAL ACTIVITY
CIMB FTSE ASEAN 40 Malaysia (the “Fund”) was constituted pursuant to the execution of a Deed dated 19 April 2010 (the “Deed”), made between CIMB-Principal Asset Management Berhad (the “Manager”) and Deutsche Trustees Malaysia Berhad (the “Trustee”). The principal activity of the Fund is to invest at least 95% of its NAV in the Singapore Fund. The Singapore Fund is an ETF listed on the SGX-ST which aims at providing the Singapore Fund unit holders a return that closely corresponds to the performance of the Underlying Index. Therefore, the Manager adopts a passive strategy in the management of the Fund.
All investments will be subjected to the Securities Commission Malaysia (“SC”) Guidelines on ETFs, SC requirements, the Deed, except where exemptions or variations have been approved by the SC, internal policies and procedures and the Fund’s objective. The Manager, a company incorporated in Malaysia, is a subsidiary of CIMB Group Sdn Bhd and regards CIMB Group Holdings Berhad as its ultimate holding company. The Manager is also an associate of Principal International (Asia) Limited, which is a subsidiary of Principal Financial Group Inc. The principal activities of the Manager are the establishment and management of unit trust funds and fund management activities.
2. SUMMARY OF SIGNIFICANT ACCOUNTING POLICIES The following accounting policies have been used consistently in dealing with items which are considered material in relation to the financial statements:
(a) Basis of preparation
The financial statements have been prepared in accordance with the provisions of the
Malaysian Financial Reporting Standards (“MFRS”) and International Financial Reporting Standards (“IFRS”).
The financial statements have been prepared under the historical cost convention, as
modified by financial assets at fair value through profit or loss.
The preparation of financial statements in conformity with MFRS and IFRS requires the use of certain critical accounting estimates and assumptions that affect the reported amounts of assets and liabilities and disclosure of contingent assets and liabilities at the date of the financial statements, and the reported amounts of revenues and expenses during the reported period.
It also requires the Manager to exercise their judgment in the process of applying the
Fund’s accounting policies. Although these estimates and judgment are based on the Manager’s best knowledge of current events and actions, actual results may differ.

CIMB FTSE ASEAN 40 MALAYSIA
14
2. SUMMARY OF SIGNIFICANT ACCOUNTING POLICIES (CONTINUED) (a) Basis of preparation (continued)
The areas involving a higher degree of judgment or complexity, or areas where assumptions and estimates are significant to the financial statements are disclosed in Note 2(j). Standards, amendments to published standards and interpretations to existing standards that are effective: The Fund has applied the following amendments for the first time for the financial year beginning 1 July 2015: • Annual Improvements to MFRS 2010 – 2012 Cycle • Annual Improvements to MFRS 2011 – 2013 Cycle The adoption of these amendments did not have any impact on the current financial period or any prior period and is not likely to affect future periods. The standards, amendments to published standards and interpretations to existing standards that are applicable to the Fund but not yet effective and have not been early adopted are as follows: (i) Financial year beginning on/after 1 July 2017
• Amendments to MFRS 101 “Presentation of financial statements -
Disclosure Initiative” (effective from 1 January 2016) provide clarifications on a number of issues, including:
Materiality – an entity should not aggregate or disaggregate information in a manner that obscures useful information. Where items are material, sufficient information must be provided to explain the impact on the financial position or performance.
Disaggregation and subtotals – line items specified in MFRS 101 may need to be disaggregated where this is relevant to an understanding of the entity’s financial position or performance. There is also new guidance on the use of subtotals.
Notes – confirmation that the notes do not need to be presented in a particular order. Other comprehensive income (“OCI”) arising from investments accounted for under the equity method – the share of OCI arising from equity-accounted investments is grouped based on whether the items will or will not subsequently be reclassified to profit or loss. Each group should then be presented as a single line item in the statement of other comprehensive income. According to the transitional provisions, the disclosures in MFRS 108 regarding the adoption of new standards/accounting policies are not required for these amendments.
CIMB FTSE ASEAN 40 MALAYSIA
15
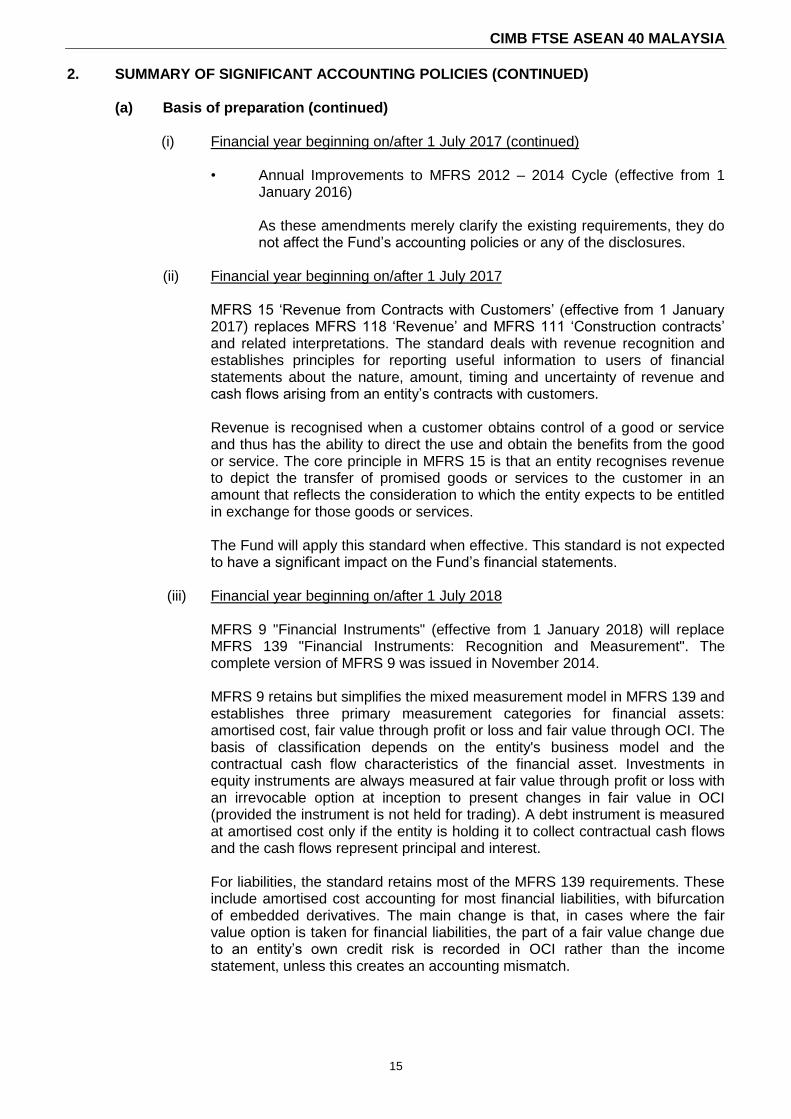
2. SUMMARY OF SIGNIFICANT ACCOUNTING POLICIES (CONTINUED)
(a) Basis of preparation (continued) (i) Financial year beginning on/after 1 July 2017 (continued)
• Annual Improvements to MFRS 2012 – 2014 Cycle (effective from 1
January 2016) As these amendments merely clarify the existing requirements, they do not affect the Fund’s accounting policies or any of the disclosures.
(ii) Financial year beginning on/after 1 July 2017 MFRS 15 ‘Revenue from Contracts with Customers’ (effective from 1 January
2017) replaces MFRS 118 ‘Revenue’ and MFRS 111 ‘Construction contracts’ and related interpretations. The standard deals with revenue recognition and establishes principles for reporting useful information to users of financial statements about the nature, amount, timing and uncertainty of revenue and cash flows arising from an entity’s contracts with customers. Revenue is recognised when a customer obtains control of a good or service and thus has the ability to direct the use and obtain the benefits from the good or service. The core principle in MFRS 15 is that an entity recognises revenue to depict the transfer of promised goods or services to the customer in an amount that reflects the consideration to which the entity expects to be entitled in exchange for those goods or services. The Fund will apply this standard when effective. This standard is not expected to have a significant impact on the Fund’s financial statements.
(iii) Financial year beginning on/after 1 July 2018
MFRS 9 "Financial Instruments" (effective from 1 January 2018) will replace MFRS 139 "Financial Instruments: Recognition and Measurement". The complete version of MFRS 9 was issued in November 2014. MFRS 9 retains but simplifies the mixed measurement model in MFRS 139 and establishes three primary measurement categories for financial assets: amortised cost, fair value through profit or loss and fair value through OCI. The basis of classification depends on the entity's business model and the contractual cash flow characteristics of the financial asset. Investments in equity instruments are always measured at fair value through profit or loss with an irrevocable option at inception to present changes in fair value in OCI (provided the instrument is not held for trading). A debt instrument is measured at amortised cost only if the entity is holding it to collect contractual cash flows and the cash flows represent principal and interest. For liabilities, the standard retains most of the MFRS 139 requirements. These include amortised cost accounting for most financial liabilities, with bifurcation of embedded derivatives. The main change is that, in cases where the fair value option is taken for financial liabilities, the part of a fair value change due to an entity’s own credit risk is recorded in OCI rather than the income statement, unless this creates an accounting mismatch.

CIMB FTSE ASEAN 40 MALAYSIA
16
2. SUMMARY OF SIGNIFICANT ACCOUNTING POLICIES (CONTINUED)
(a) Basis of preparation (continued) (iii) Financial year beginning on/after 1 July 2018 (continued)
MFRS 9 introduces an expected credit loss model on impairment that replaces the incurred loss impairment model used in MFRS 139. The expected credit loss model is forward-looking and eliminates the need for a trigger event to have occurred before credit losses are recognised.
The Fund will apply this standard when effective. This standard is not expected to have a significant impact on the Fund’s financial statements.
(b) Financial assets and financial liabilities Classification
The Fund designates its investments in collective investment scheme as financial assets at fair value through profit or loss at inception. Financial assets are designated at fair value through profit or loss when they are managed and their performance evaluated on a fair value basis. Loans and receivables are non-derivative financial assets with fixed or determinable payments that are not quoted in an active market and have been included in current assets. The Fund’s loans and receivables comprise cash and cash equivalents. Financial liabilities are classified according to the substance of the contractual arrangements entered into and the definitions of a financial liability. The Fund classifies amount due to Trustee, and other payables and accruals as other financial liabilities. Recognition and measurement Regular purchases and sales of financial assets are recognised on the trade-date, the date on which the Fund commits to purchase or sell the asset. Investments are initially recognised at fair value. Financial liabilities, within the scope of MFRS 139, are recognised in the statement of financial position when, and only when, the Fund becomes a party to the contractual provisions of the financial instrument. Financial assets are derecognised when the rights to receive cash flows from the investments have expired or have been transferred and the Fund has transferred substantially all risks and rewards of ownership. Financial liabilities are derecognised when it is extinguished, i.e. when the obligation specified in the contract is discharged or cancelled or expired. Unrealised gains or losses arising from changes in the fair value of the financial assets at fair value through profit or loss are presented in the statement of comprehensive income within net gain or loss on financial assets at fair value through profit or loss in the financial period which they arise. Collective investment scheme is valued based on the last published NAV per unit or share of such collective investment scheme or, if unavailable, on the last published price of such unit or share (excluding any sales charge included in such selling price). Loans and receivables and other financial liabilities are subsequently carried at amortised cost using the effective interest method.
CIMB FTSE ASEAN 40 MALAYSIA
17
2. SUMMARY OF SIGNIFICANT ACCOUNTING POLICIES (CONTINUED)
(b) Financial assets and financial liabilities (continued) Impairment for assets carried at amortised costs For assets carried at amortised cost, the Fund assesses at the end of the reporting period whether there is objective evidence that a financial asset or group of financial assets is impaired. A financial asset or a group of financial assets is impaired and impairment losses are incurred only if there is objective evidence of impairment as a result of one or more events that occurred after the initial recognition of the asset (a ‘loss event’) and that loss event (or events) has an impact on the estimated future cash flows of the financial asset or group of financial assets that can be reliably estimated. The amount of the loss is measured as the difference between the asset’s carrying amount and the present value of estimated future cash flows (excluding future credit losses that have not been incurred) discounted at the financial asset’s original effective interest rate. The asset’s carrying amount is reduced and the amount of the loss is recognised in statement of comprehensive income. If ‘loans and receivables’ has a variable interest rate, the discount rate for measuring any impairment loss is the current effective interest rate determined under the contract. As a practical expedient, the Fund may measure impairment on the basis of an instrument’s fair value using an observable market price. If, in a subsequent financial period, the amount of the impairment loss decreases and the decrease can be related objectively to an event occurring after the impairment was recognised (such as an improvement in the debtor’s credit rating), the reversal of the previously recognised impairment loss is recognised in statement of comprehensive income. When an asset is uncollectible, it is written off against the related allowance account. Such assets are written off after all the necessary procedures have been completed and the amount of the loss has been determined.
(c) Foreign currency Functional and presentation currency Items included in the financial statements of the Fund are measured using the
currency of the primary economic environment in which the Fund operates (the “functional currency”). The financial statements are presented in Ringgit Malaysia (“RM”), which is the Fund’s functional and presentation currency.
Transactions and balances Foreign currency transactions are translated into the functional currency using the
exchange rates prevailing at the dates of the transactions or valuation where items are remeasured. Foreign exchange gains and losses resulting from the settlement of such transactions and from the translation at period-end exchange rates of monetary assets and liabilities denominated in foreign currencies are recognised in statement of comprehensive income, except when deferred in other comprehensive income as qualifying cash flow hedges.

CIMB FTSE ASEAN 40 MALAYSIA
18
2. SUMMARY OF SIGNIFICANT ACCOUNTING POLICIES (CONTINUED) (d) Income recognition
Realised gain or loss on disposal of collective investment scheme is accounted for as the difference between the net disposal proceeds and the carrying amount of investments, determined on a weighted average cost basis.
(e) Cash and cash equivalents For the purpose of statement of cash flows, cash and cash equivalents comprise bank balances which are subject to an insignificant risk of changes in value.
(f) Taxation Current tax expense is determined according to Malaysian tax laws at the current rate
based upon the taxable profit earned during the financial period. (g) Unit holders’ capital
The unit holders’ contributions to the Fund meet the criteria to be classified as equity instruments under MFRS 132 “Financial Instruments: Presentation”. Those criteria include:
the units entitle the holder to a proportionate share of the Fund’s NAV;
the units are the most subordinated class and class features are identical;
there is no contractual obligations to deliver cash or another financial asset other than the obligation on the Fund to repurchase; and
the total expected cash flows from the units over its life are based substantially on the profit or loss of the Fund.
The outstanding units are carried at the redemption amount that is payable at each financial period if unit holder exercises the right to put the unit back to the Fund.
Units are created and cancelled at prices based on the Fund’s NAV per unit at the time of creation or cancellation. The Fund’s NAV per unit is calculated by dividing the net assets attributable to unit holders with the total number of outstanding units.
(h) Segment information Operating segments are reported in a manner consistent with the internal reporting
used by the chief operating decision-maker. The chief operating decision-maker is responsible for allocating resources and assessing performance of the operating segments.
(i) Realised and unrealised portions of net income after tax
The analysis of realised and unrealised net income after tax as presented on the statement of comprehensive income is prepared in accordance with SC Guidelines on ETFs.

CIMB FTSE ASEAN 40 MALAYSIA
19
2. SUMMARY OF SIGNIFICANT ACCOUNTING POLICIES (CONTINUED)
(j) Critical accounting estimates and judgments in applying accounting policies The Fund makes estimates and assumptions concerning the future. The resulting accounting estimates will, by definition, rarely equal the related actual results. To enhance the information content of the estimates, certain key variables that are anticipated to have material impact to the Fund’s results and financial position are tested for sensitivity to changes in the underlying parameters.
Estimates and judgment are continually evaluated by the Manager and are based on
historical experience and other factors, including expectations of future events that are believed to be reasonable under the circumstances.
In undertaking any of the Fund’s investment, the Manager will ensure that all assets of the Fund under management will be valued appropriately, that is at fair value and in compliance with the SC Guidelines on ETFs.
3. RISK MANAGEMENT OBJECTIVES AND POLICIES
The investment objective of the Fund is to provide investment results that, before expenses, closely correspond to the performance of the FTSE/ASEAN 40 Index, regardless of its performance.
The Fund is exposed to a variety of risks which include market risk (inclusive of price risk and currency risk), credit risk and liquidity risk.
Financial risk management is carried out through internal control process adopted by the Manager and adherence to the investment restrictions as stipulated in the Deed and SC Guidelines on ETFs.
(a) Market risk
(i) Price risk Price risk is the risk that the fair value of an investment in collective investment scheme will fluctuate because of changes in market prices (other than those arising from currency risk). The value of collective investment scheme may fluctuate according to the activities of individual companies, sector and overall political and economic conditions. Such fluctuation may cause the Fund’s NAV and prices of units to fall as well as rise, and income produced by the Fund may also fluctuate. The very nature of an ETF, however, helps mitigate this risk because a fund would generally hold a well-diversified portfolio of securities from different market sectors so that the collapse of any one security or any one market sector would not impact too greatly on the value of the Fund.
(ii) Currency risk Currency risk is associated with investments that are quoted and/or priced in foreign currency denomination. Foreign currency risk is the risk that the value of financial instruments will fluctuate due to changes in foreign exchange rates. The Manager will evaluate the likely directions of a foreign currency versus RM based on considerations of economic fundamentals such as interest rate differentials, balance of payments position, debt levels, and technical chart considerations.

CIMB FTSE ASEAN 40 MALAYSIA
20
3. RISK MANAGEMENT OBJECTIVES AND POLICIES (CONTINUED)
(b) Credit risk Credit risk refers to the risk that a counterparty will default on its contractual obligation resulting in financial loss to the Fund. The credit risk arising from cash and cash equivalents is managed by ensuring that the Fund will only place deposits in reputable licensed financial institutions. The settlement terms of the proceeds from the creation of units receivable from the Manager are governed by the SC Guidelines on ETFs.
(c) Liquidity risk
Liquidity risk is the risk that the Fund will encounter difficulty in meeting its financial obligations. The Manager manages this risk by maintaining sufficient level of liquid assets to meet anticipated payments and cancellations of the units by unit holders. Liquid assets comprise bank balances, which are capable of being converted into cash within 7 business days. Generally, all investments are subject to a certain degree of liquidity risk depending on the nature of the investment instruments, market, sector and other factors.
(d) Fair value estimation
Fair value is defined as the price that would be received to sell an asset or paid to transfer a liability in an orderly transaction between market participants at the measurement date (i.e. an exit price). The fair value of financial assets traded in active markets (such as trading securities) are based on quoted market prices at the close of trading on the financial period end date. The Fund utilises the last traded market price for financial assets where the last traded price falls within the bid-ask spread. In circumstances where the last traded price is not within the bid-ask spread, the Manager will determine the point within the bid-ask spread that is most representative of the fair value. An active market is a market in which transactions for the asset or liability take place with sufficient frequency and volume to provide pricing information on an ongoing basis. The fair value of financial assets that are not traded in an active market is determined by using valuation techniques. Fair value hierarchy (i) The table in the following page analyses financial instruments carried at fair
value. The different levels have been defined as follows:
Quoted prices (unadjusted) in active market for identical assets or liabilities (Level 1)
Inputs other than quoted prices included within Level 1 that are observable for the asset or liability, either directly (that is, as prices) or indirectly (that is, derived from prices) (Level 2)
Inputs for the asset and liability that are not based on observable market data (that is, unobservable inputs) (Level 3)

CIMB FTSE ASEAN 40 MALAYSIA
21
3. RISK MANAGEMENT OBJECTIVES AND POLICIES (CONTINUED)
(d) Fair value estimation (continued)
Fair value hierarchy (continued)
The level in the fair value hierarchy within which the fair value measurement is categorised in its entirety is determined on the basis of the lowest level input that is significant to the fair value measurement in its entirety. For this purpose, the significance of an input is assessed against the fair value measurement in its entirety. If a fair value measurement uses observable inputs that require significant adjustment based on unobservable inputs, that measurement is a Level 3 measurement. Assessing the significance of a particular input to the fair value measurement in its entirety requires judgment, considering factors specific to the asset or liability.
The determination of what constitutes ‘observable’ requires significant judgment by the Fund. The Fund considers observable data to be that market data that is readily available, regularly distributed or updated, reliable and verifiable, not proprietary, and provided by independent sources that are actively involved in the relevant market.
Investments whose values are based on quoted market prices in active markets, and are therefore classified within Level 1, include collective investment scheme. The Fund does not adjust the quoted prices for these instruments. The Fund’s policies on valuation of these financial assets are stated in Note 2(b).
(ii) The carrying values of cash and cash equivalents and all current liabilities are a
reasonable approximation of their fair values due to their short term nature.
Level 1 Level 2 Level 3 Total
31.03.2016 RM RM RM RM
Financial assets at fair value through profit or loss:
- Collective investment scheme 2,202,779 - - 2,202,779
Level 1 Level 2 Level 3 Total
30.06.2015 RM RM RM RM
Audited
Financial assets at fair value through profit or loss:
- Collective investment scheme 2,292,338 - - 2,292,338

CIMB FTSE ASEAN 40 MALAYSIA
22
4. MANAGEMENT FEE In accordance with the Deed, there is no management fee charged at the Fund level.
5. TRUSTEE’S FEE
In accordance with the Deed, the Trustee is entitled to a fee not exceeding a maximum of 0.20% per annum, calculated daily based on the NAV of the Fund, subject to a minimum fee of RM12,000 per annum, excluding foreign sub-custodian fees and charges.
For the financial period ended 31 March 2016, the Trustee’s fee is recognised at a rate of
0.08% per annum (31.03.2015: 0.08% per annum). There will be no further liability in respect of Trustee’s fee other than amounts recognised
above. 6. TAXATION
01.01.2016
to 31.03.2016 01.01.2015
to 31.03.2015
RM RM Tax charged for the financial period:
- Current taxation - -
A numerical reconciliation between the (loss)/profit before taxation multiplied by the Malaysian statutory income tax rate and tax expense of the Fund is as follows:
01.01.2016 to 31.03.2016
01.01.2015 to 31.03.2015
RM RM
(Loss)/Profit before taxation (41,894) 99,185
Taxation at Malaysian statutory rate of 24% (31.03.2015: 25%) (10,055) 24,796 Tax effects of: Investment loss not deductible for tax purposes/(Investment income not subject to tax) 5,554 (28,020)
Expenses not deductible for tax purposes 1,443 1,633 Restriction on tax deductible expenses for ETFs 3,058 1,591
Taxation - -
Year-to-date
31.03.2016 Year-to-date 31.03.2015
RM RM Tax charged for the financial period:
- Current taxation - -

CIMB FTSE ASEAN 40 MALAYSIA
23
6. TAXATION (CONTINUED) A numerical reconciliation between the (loss)/profit before taxation multiplied by the Malaysian statutory income tax rate and tax expense of the Fund is as follows:
Year-to-date 31.03.2016
Year-to-date 31.03.2015
RM RM
(Loss)/Profit before taxation (122,062) 215,283
Taxation at Malaysian statutory rate of 24% (31.03.2015: 25%) (29,295) 53,820 Tax effects of: Investment loss not deductible for tax purposes/(Investment income not subject to tax) 19,476 (75,443)
Expenses not deductible for tax purposes 4,690 6,176 Restriction on tax deductible expenses for ETFs 5,129 15,447
Taxation - -
7. FINANCIAL ASSETS AT FAIR VALUE THROUGH PROFIT OR LOSS
31.03.2016 30.06.2015 Audited RM RM Designated at fair value through profit or loss at inception: - Collective investment scheme 2,202,779
2,292,338
01.01.2016 to 31.03.2016
01.01.2015 to 31.03.2015
RM RM
Net (loss)/gain on financial assets at fair value through profit or loss:
- Unrealised fair value (loss)/gain (19,836) 111,993
Year-to-date
31.03.2016 Year-to-date 31.03.2015
RM RM
Net (loss)/gain on financial assets at fair value through profit or loss:
- Unrealised fair value (loss)/gain (89,559) 250,719

CIMB FTSE ASEAN 40 MALAYSIA
24
7. FINANCIAL ASSETS AT FAIR VALUE THROUGH PROFIT OR LOSS (CONTINUED)
Aggregate Market Percentage
Name of counter Quantity cost value of NAV
Units RM RM %
31.03.2016
COLLECTIVE INVESTMENT SCHEME
SINGAPORE
CIMB FTSE ASEAN 40 64,600 1,962,860 2,202,779 98.87
TOTAL COLLECTIVE INVESTMENT SCHEME 64,600 1,962,860 2,202,779 98.87
ACCUMULATED UNREALISED GAIN ON FINANCIAL ASSET AT FAIR VALUE THROUGH PROFIT OR LOSS 239,919
TOTAL FINANCIAL ASSETS AT FAIR VALUE THROUGH PROFIT OR LOSS 2,202,779
30.06.2015
Audited
COLLECTIVE INVESTMENT SCHEME
SINGAPORE
CIMB FTSE ASEAN 40 64,600 1,962,860 2,292,338 97.55
TOTAL COLLECTIVE INVESTMENT SCHEME 64,600 1,962,860 2,292,338
97.55
ACCUMULATED UNREALISED GAIN ON FINANCIAL ASSET AT FAIR VALUE THROUGH PROFIT OR LOSS 329,478
TOTAL FINANCIAL ASSETS AT FAIR VALUE THROUGH PROFIT OR LOSS 2,292,338
CIMB FTSE ASEAN 40 MALAYSIA
25
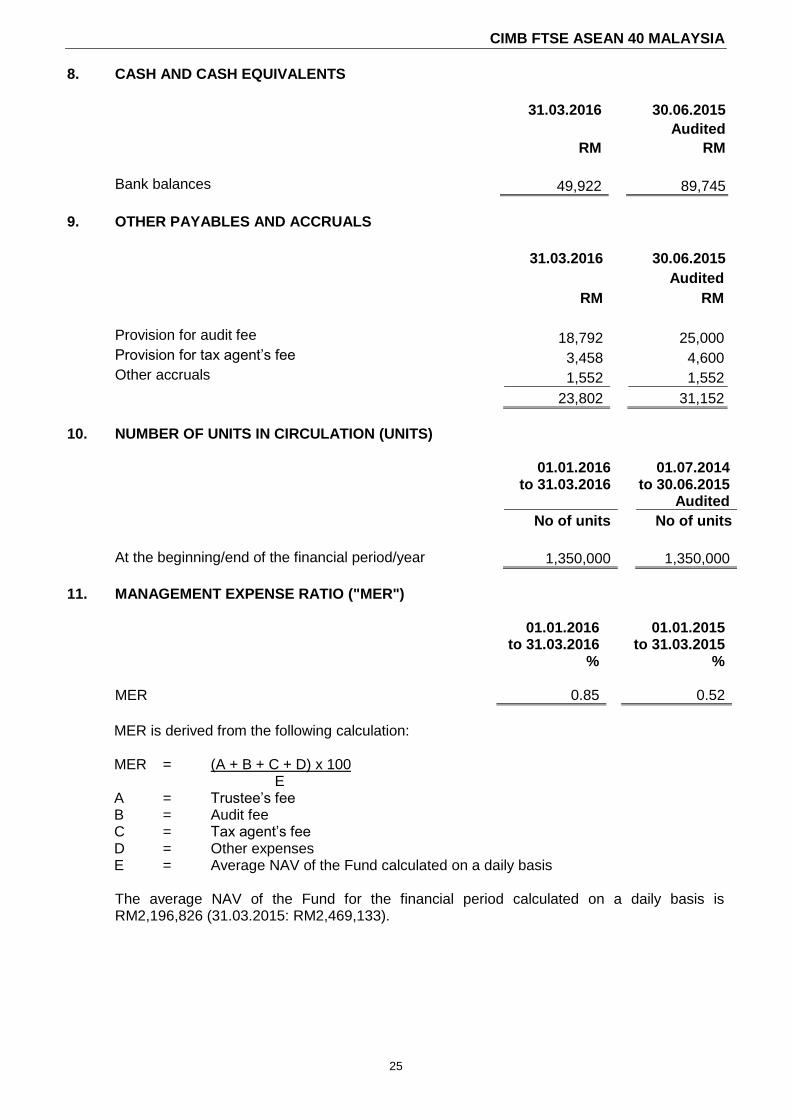
8. CASH AND CASH EQUIVALENTS
31.03.2016 30.06.2015 Audited
RM RM
Bank balances 49,922 89,745
9. OTHER PAYABLES AND ACCRUALS
31.03.2016 30.06.2015 Audited
RM RM
Provision for audit fee 18,792 25,000 Provision for tax agent’s fee 3,458 4,600 Other accruals 1,552 1,552
23,802 31,152
10. NUMBER OF UNITS IN CIRCULATION (UNITS)
01.01.2016 to 31.03.2016
01.07.2014 to 30.06.2015
Audited
No of units No of units
At the beginning/end of the financial period/year 1,350,000 1,350,000
11. MANAGEMENT EXPENSE RATIO ("MER")
01.01.2016 to 31.03.2016
01.01.2015 to 31.03.2015
% %
MER 0.85 0.52
MER is derived from the following calculation: MER = (A + B + C + D) x 100 E A = Trustee’s fee B = Audit fee C = Tax agent’s fee
D = Other expenses E = Average NAV of the Fund calculated on a daily basis
The average NAV of the Fund for the financial period calculated on a daily basis is RM2,196,826 (31.03.2015: RM2,469,133).

CIMB FTSE ASEAN 40 MALAYSIA
26
12. PORTFOLIO TURNOVER RATIO ("PTR")
01.01.2016
to 31.03.2016 01.01.2015
to 31.03.2015
PTR (times) - -
PTR is derived from the following calculation:
(Total acquisition for the financial period + total disposal for the financial period) 2. Average NAV of the Fund for the financial period calculated on a daily basis where: total acquisition for the financial period = Nil (31.03.2015: RM Nil) total disposal for the financial period = Nil (31.03.2015: RM Nil)
13. UNITS HELD BY THE MANAGER AND PARTIES RELATED TO THE MANAGER, AND
SIGNIFICANT RELATED PARTY TRANSACTIONS AND BALANCES The related parties and their relationship with the Fund are as follows: Related parties Relationship CIMB-Principal Asset Management Bhd The Manager
CIMB-Principal Asset Management (S) Pte. Ltd. Investment Adviser of the Fund
CIMB Group Sdn Bhd Holding company of the Manager
CIMB Group Holdings Bhd (“CIMB”) Ultimate holding company of the Manager
CIMB FTSE ASEAN 40 Underlying Fund
Subsidiaries and associates of CIMB as Subsidiary and associated companies of disclosed in its financial statements the ultimate holding company of the Manager Units held by the Manager and parties related to the Manager
There were no units held by the Manager, Directors and parties related to the Manager as at the end of the financial period.
Significant related party transactions
There were no other significant related party transactions during each of the financial period.
Significant related party balances 31.03.2016 30.06.2015
Audited RM RM
Investment in collective investment scheme:
- CIMB FTSE ASEAN 40 2,202,779 2,292,338

CIMB FTSE ASEAN 40 MALAYSIA
27
14. SEGMENT INFORMATION The internal reporting provided to the chief operating decision-maker for the Fund’s assets, liabilities and performance is prepared on a consistent basis with the measurement and recognition principles of MFRS and IFRS. The chief operating decision-maker is responsible for the performance of the Fund and considers the business to have a single operating segment located in Malaysia. Asset allocation decisions are based on a single, integrated investment strategy and the Fund’s performance is evaluated on an overall basis. The investment objective of the Fund is to provide investment results that, before expenses, closely correspond to the performance of the FTSE/ASEAN 40 Index, regardless of its performance. The reportable operating segment derives its income by seeking investments to achieve targeted returns consummate with an acceptable level of risk within the portfolio. These returns consist of dividend income earned from investments and gains on the appreciation in the value of investments, which is derived from an ETF listed on the SGX-ST, Singapore. There were no changes in reportable operating segment during the financial period.
15. SUPPLEMENTARY INFORMATION DISCLOSED PURSUANT TO BURSA MALAYSIA
SECURITIES BERHAD'S LISTING REQUIREMENTS The following analysis of realised and unrealised retained earnings at the legal entity level is prepared in accordance with Bursa Malaysia Securities Berhad’s Listing Requirements and the Guidance on Special Matter No.1, “Determination of Realised and Unrealised Profits or Losses in the Context of Disclosure Pursuant to Bursa Malaysia Securities Berhad Listing Requirements”, as issued by the Malaysian Institute of Accountants whilst the disclosure is based on the prescribed format by Bursa Malaysia Securities Berhad.
31.03.2016 30.06.2015
Audited
RM RM
Total accumulated retained earnings of the Fund:
- Realised 656,064 646,350
- Unrealised 259,754 391,530
915,818 1,037,880
The analysis between realised and unrealised retained earnings above is prepared on a different basis as compared to the analysis of realised and unrealised retained earnings as disclosed in the statement of comprehensive income.

CIMB FTSE ASEAN 40 MALAYSIA
28
DIRECTORY Head office of the Manager CIMB-Principal Asset Management Berhad (Company No.: 304078-K) 10th Floor, Bangunan CIMB, Jalan Semantan, Damansara Heights, 50490 Kuala Lumpur, MALAYSIA. Tel: (03) 2084 8888 Postal address CIMB-Principal Asset Management Berhad (Company No.: 304078-K) P.O.Box 10571, 50718 Kuala Lumpur, MALAYSIA. Website www.cimb-principal.com.my E-mail address [email protected] General investment enquiries (03) 7718 3100 Trustee for the CIMB FTSE ASEAN 40 MALAYSIA
Deutsche Trustees Malaysia Berhad (Co. No. 763590-H) Level 20, Menara IMC, 8, Jalan Sultan Ismail, 50250 Kuala Lumpur, MALAYSIA.
Tel: (03) 2053 7522 Participating Dealers CIMB Bank Berhad Level 13, Menara CIMB, Jalan Stesen Sentral 2, Kuala Lumpur Sentral, 50470 Kuala Lumpur, MALAYSIA. RHB Investment Bank Berhad, Level 10, Tower One, RHB Centre, Jalan Tun Razak, 50400 Kuala Lumpur, MALAYSIA.