CIMA SALARY SURVEY 2013 - Chartered Institute of ... · PDF fileCIMA SALARY SURVEY 2013 South...
14
CIMA SALARY SURVEY 2013 South Africa
Transcript of CIMA SALARY SURVEY 2013 - Chartered Institute of ... · PDF fileCIMA SALARY SURVEY 2013 South...
CIMA SALARY SURVEY 2013
South Africa
1
Foreword
Zahra CassimHead of South Africa
Our annual salary survey for 2013 shows the positive impact of professional qualifications on members’ earning potential, salary satisfaction and the ability to realise ambitions such as moving to a new organisation, or working abroad.
Respondents across the board agree that the CIMA qualification strengthens their ability to move internationally in their career at 93%, while 89% agree that the qualification creates career opportunities and 82% agree that it allows them to move across all areas of the business and outside of the finance function.
The effect of the CIMA qualification on boosting salary deals is strongest for newly qualified members and part qualified students, with 75% of both categories saying it helps to strengthen their position in salary negotiations.
CIMA members are in demand and earn on average R906 943 pa. Meanwhile, part-qualified CIMA students in South Africa are earning on average R380 761 (basic salary), plus R34 235 in bonus payments, totalling R414 996 pa.
While 75% of members are satisfied with their current salary, the figure is lower among students at 52%. This difference highlights the fact that the average total annual salary for members is more than twice that for students.
Amid a mixed backdrop of continuing concern over the fate of South Africa’s major trading partners in the Eurozone, China and – to a lesser extent - the USA, the economy is still forecast to grow by 2.8% in 2013, rising to 3.3% in 2014. In line with this, two-fifths of CIMA members and students are positive in their expectations for the profitability of the organisation in which they work, and one-third expect salary increases across the board.
Mobility of CIMA members and students in South Africa remains strong, with only 4% seeing themselves in the same role in three years’ time. Up to 71% anticipate being in a new role within the next two years and 17% plan to move abroad.
Among members and students who plan to seek employment abroad, the UK is the most frequently named destination at 58%, followed by the USA, August and Canada. Switzerland and Singapore are also other popular planned destinations. Key reasons cited for moving would be a new career opportunity and improved quality of life.
Among those already working as a management accountant, 42% expect to progress to finance manager, financial controller or finance director within the next three years. Among those currently working in assisting finance roles, 43% expect to progress to management accountant.
Managerial skills, particularly leadership and strategic planning are the skill sets students most wish to develop, while for qualified members there is a secondary focus on softer skills such as persuading and influencing, personal development and skills for developing others.
2
Salary survey results
South Africa average salary figures
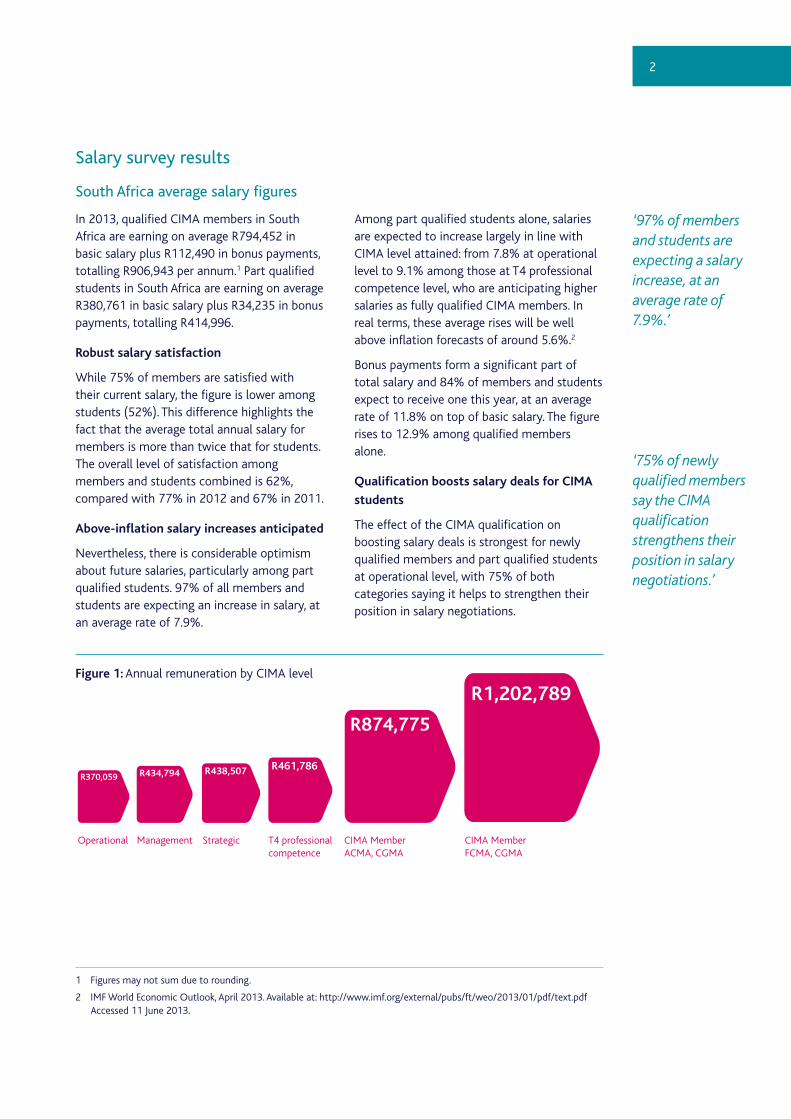
In 2013, qualified CIMA members in South Africa are earning on average R794,452 in basic salary plus R112,490 in bonus payments, totalling R906,943 per annum.1 Part qualified students in South Africa are earning on average R380,761 in basic salary plus R34,235 in bonus payments, totalling R414,996.
Robust salary satisfaction
While 75% of members are satisfied with their current salary, the figure is lower among students (52%). This difference highlights the fact that the average total annual salary for members is more than twice that for students. The overall level of satisfaction among members and students combined is 62%, compared with 77% in 2012 and 67% in 2011.
Above-inflation salary increases anticipated
Nevertheless, there is considerable optimism about future salaries, particularly among part qualified students. 97% of all members and students are expecting an increase in salary, at an average rate of 7.9%.
Among part qualified students alone, salaries are expected to increase largely in line with CIMA level attained: from 7.8% at operational level to 9.1% among those at T4 professional competence level, who are anticipating higher salaries as fully qualified CIMA members. In real terms, these average rises will be well above inflation forecasts of around 5.6%.2
Bonus payments form a significant part of total salary and 84% of members and students expect to receive one this year, at an average rate of 11.8% on top of basic salary. The figure rises to 12.9% among qualified members alone.
Qualification boosts salary deals for CIMA
students
The effect of the CIMA qualification on boosting salary deals is strongest for newly qualified members and part qualified students at operational level, with 75% of both categories saying it helps to strengthen their position in salary negotiations.
Figure 1: Annual remuneration by CIMA level
‘97% of members and students are expecting a salary increase, at an average rate of 7.9%.’
‘75% of newly qualified members say the CIMA qualification strengthens their position in salary negotiations.’
1 Figures may not sum due to rounding.
2 IMF World Economic Outlook, April 2013. Available at: http://www.imf.org/external/pubs/ft/weo/2013/01/pdf/text.pdf Accessed 11 June 2013.
R1,202,789
R874,775
R438,507R434,794R370,059R461,786
CIMA MemberFCMA, CGMA
CIMA Member ACMA, CGMA
Strategic T4 professionalcompetence
ManagementOperational
3
Salary patterns
Remuneration by job role
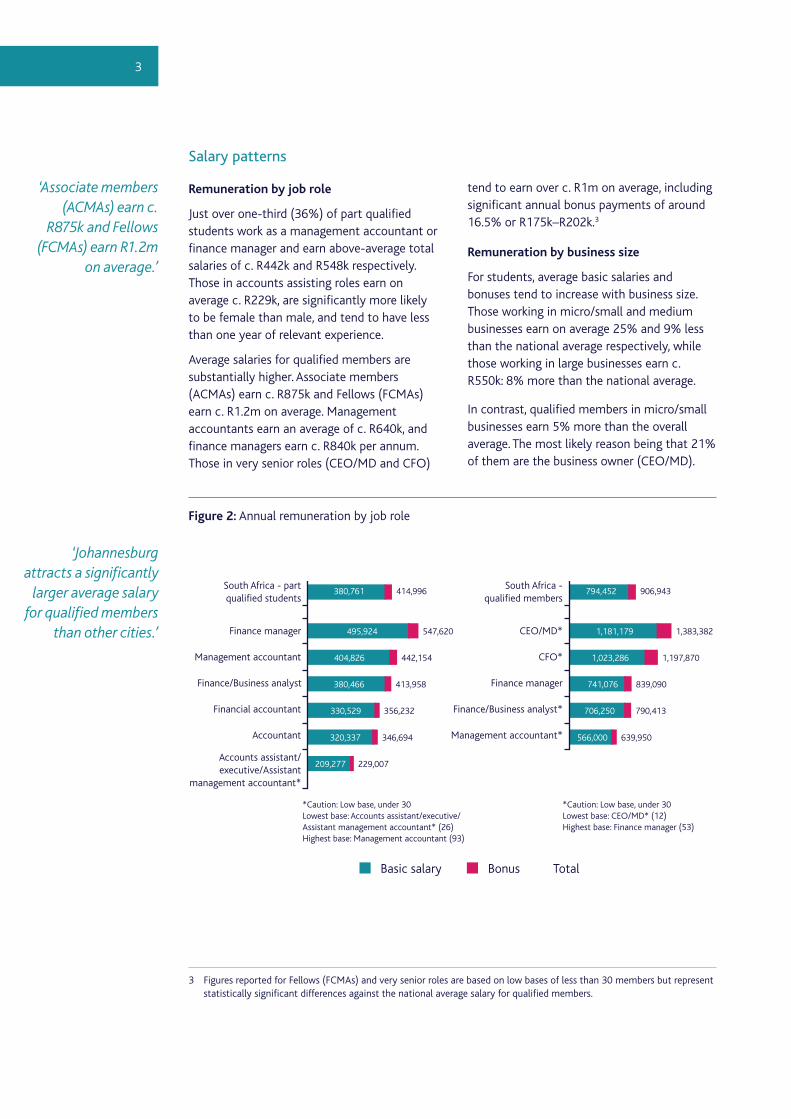
Just over one-third (36%) of part qualified students work as a management accountant or finance manager and earn above-average total salaries of c. R442k and R548k respectively. Those in accounts assisting roles earn on average c. R229k, are significantly more likely to be female than male, and tend to have less than one year of relevant experience.
Average salaries for qualified members are substantially higher. Associate members (ACMAs) earn c. R875k and Fellows (FCMAs) earn c. R1.2m on average. Management accountants earn an average of c. R640k, and finance managers earn c. R840k per annum. Those in very senior roles (CEO/MD and CFO)
tend to earn over c. R1m on average, including significant annual bonus payments of around 16.5% or R175k–R202k.3
Remuneration by business size
For students, average basic salaries and bonuses tend to increase with business size. Those working in micro/small and medium businesses earn on average 25% and 9% less than the national average respectively, while those working in large businesses earn c. R550k: 8% more than the national average.
In contrast, qualified members in micro/small businesses earn 5% more than the overall average. The most likely reason being that 21% of them are the business owner (CEO/MD).
Figure 2: Annual remuneration by job role
‘Associate members (ACMAs) earn c.
R875k and Fellows (FCMAs) earn R1.2m
on average.’
‘Johannesburg attracts a significantly
larger average salary for qualified members
than other cities.’
3 Figures reported for Fellows (FCMAs) and very senior roles are based on low bases of less than 30 members but represent statistically significant differences against the national average salary for qualified members.
547,620495,924
442,154404,826
413,958380,466
356,232330,529
346,694320,337
229,007209,277
414,996380,761South Africa - partqualified students
Finance manager
Management accountant
Finance/Business analyst
Financial accountant
Accountant
Accounts assistant/executive/Assistant
management accountant*
1,383,3821,181,179
1,197,8701,023,286
839,090741,076
790,413706,250
639,950566,000
906,943794,452South Africa -
qualified members
CEO/MD*
CFO*
Finance manager
Finance/Business analyst*
Management accountant*
*Caution: Low base, under 30Lowest base: Accounts assistant/executive/Assistant management accountant* (26)Highest base: Management accountant (93)
*Caution: Low base, under 30Lowest base: CEO/MD* (12)Highest base: Finance manager (53)
Basic salary Bonus Total
4
‘Students working in the natural resources, energy/fuel and utilities sector earn one-third (32%) more than the national average total salary for part qualified CIMA students (R414,996).’
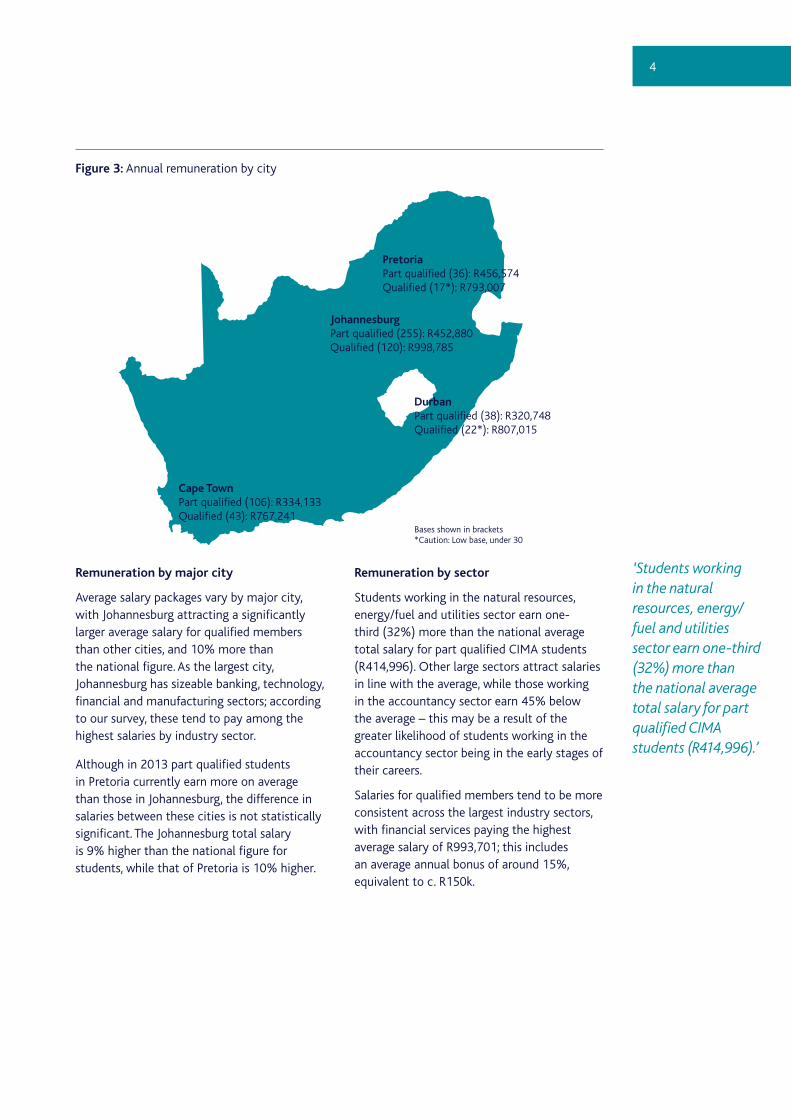
Figure 3: Annual remuneration by city
Remuneration by major city
Average salary packages vary by major city, with Johannesburg attracting a significantly larger average salary for qualified members than other cities, and 10% more than the national figure. As the largest city, Johannesburg has sizeable banking, technology, financial and manufacturing sectors; according to our survey, these tend to pay among the highest salaries by industry sector.
Although in 2013 part qualified students in Pretoria currently earn more on average than those in Johannesburg, the difference in salaries between these cities is not statistically significant. The Johannesburg total salary is 9% higher than the national figure for students, while that of Pretoria is 10% higher.
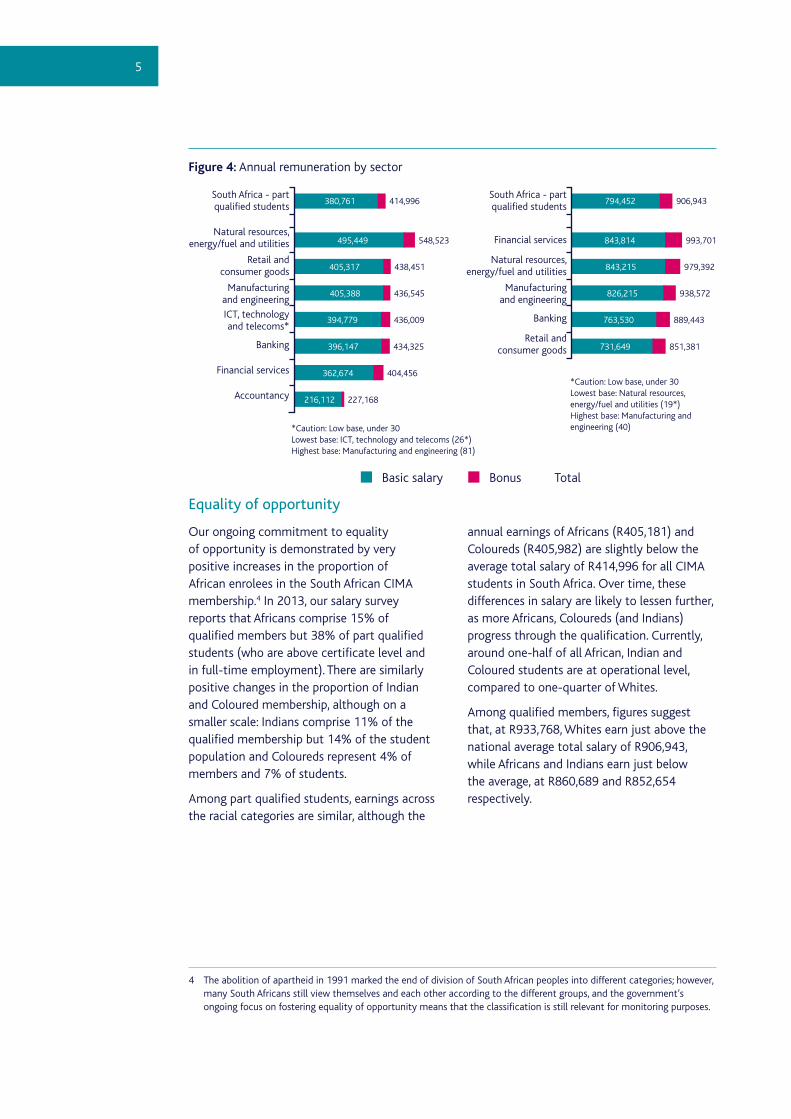
Remuneration by sector
Students working in the natural resources, energy/fuel and utilities sector earn one-third (32%) more than the national average total salary for part qualified CIMA students (R414,996). Other large sectors attract salaries in line with the average, while those working in the accountancy sector earn 45% below the average – this may be a result of the greater likelihood of students working in the accountancy sector being in the early stages of their careers.
Salaries for qualified members tend to be more consistent across the largest industry sectors, with financial services paying the highest average salary of R993,701; this includes an average annual bonus of around 15%, equivalent to c. R150k.
DurbanPart qualified (38): R320,748Qualified (22*): R807,015
JohannesburgPart qualified (255): R452,880Qualified (120): R998,785
Cape TownPart qualified (106): R334,133Qualified (43): R767,241
PretoriaPart qualified (36): R456,574Qualified (17*): R793,007
Bases shown in brackets*Caution: Low base, under 30
5
Figure 4: Annual remuneration by sector
Equality of opportunity
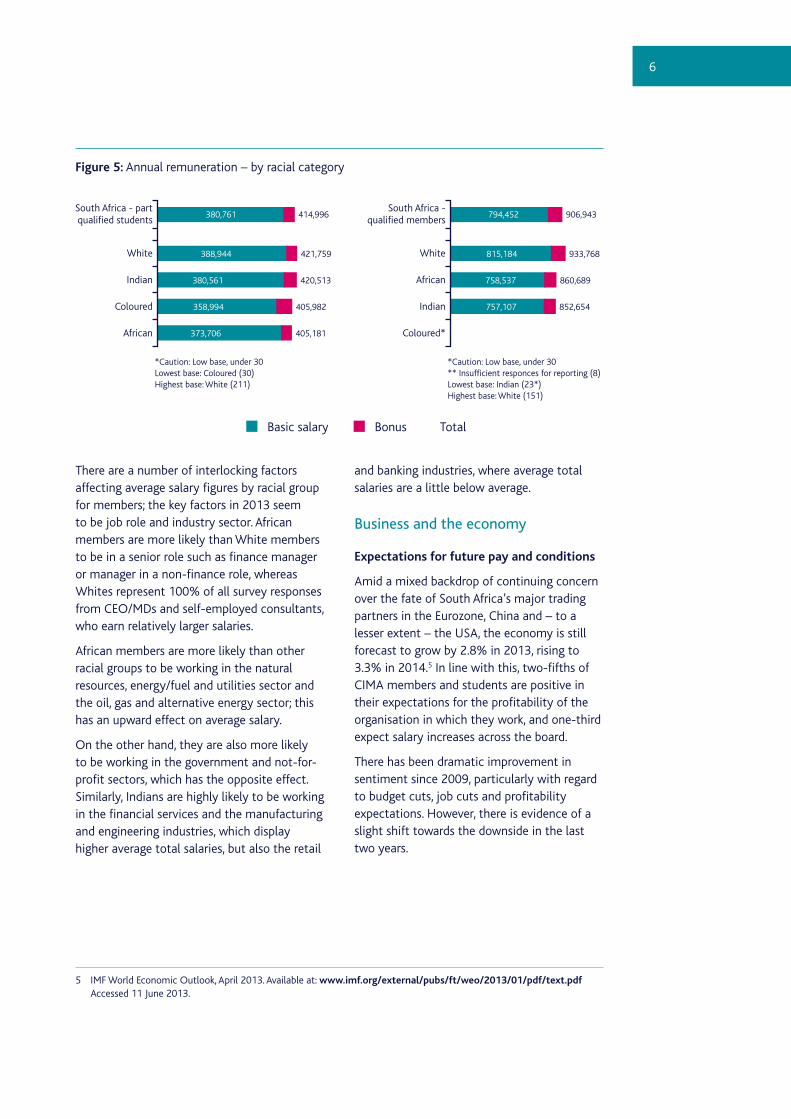
Our ongoing commitment to equality of opportunity is demonstrated by very positive increases in the proportion of African enrolees in the South African CIMA membership.4 In 2013, our salary survey reports that Africans comprise 15% of qualified members but 38% of part qualified students (who are above certificate level and in full-time employment). There are similarly positive changes in the proportion of Indian and Coloured membership, although on a smaller scale: Indians comprise 11% of the qualified membership but 14% of the student population and Coloureds represent 4% of members and 7% of students.
Among part qualified students, earnings across the racial categories are similar, although the
annual earnings of Africans (R405,181) and Coloureds (R405,982) are slightly below the average total salary of R414,996 for all CIMA students in South Africa. Over time, these differences in salary are likely to lessen further, as more Africans, Coloureds (and Indians) progress through the qualification. Currently, around one-half of all African, Indian and Coloured students are at operational level, compared to one-quarter of Whites.
Among qualified members, figures suggest that, at R933,768, Whites earn just above the national average total salary of R906,943, while Africans and Indians earn just below the average, at R860,689 and R852,654 respectively.
4 The abolition of apartheid in 1991 marked the end of division of South African peoples into different categories; however, many South Africans still view themselves and each other according to the different groups, and the government’s ongoing focus on fostering equality of opportunity means that the classification is still relevant for monitoring purposes.
548,523495,449
438,451405,317
436,545405,388
436,009394,779
434,325396,147
404,456362,674
227,168216,112
414,996380,761South Africa - partqualified students
Natural resources,energy/fuel and utilities
Retail andconsumer goods
Manufacturingand engineering
ICT, technologyand telecoms*
Banking
Financial services
Accountancy
993,701843,814
979,392843,215
938,572826,215
889,443763,530
851,381731,649
906,943794,452South Africa - partqualified students
Financial services
Natural resources,energy/fuel and utilities
Manufacturingand engineering
Banking
Retail andconsumer goods
*Caution: Low base, under 30Lowest base: ICT, technology and telecoms (26*)Highest base: Manufacturing and engineering (81)
*Caution: Low base, under 30Lowest base: Natural resources, energy/fuel and utilities (19*)Highest base: Manufacturing and engineering (40)
Basic salary Bonus Total
6
Figure 5: Annual remuneration – by racial category
There are a number of interlocking factors affecting average salary figures by racial group for members; the key factors in 2013 seem to be job role and industry sector. African members are more likely than White members to be in a senior role such as finance manager or manager in a non-finance role, whereas Whites represent 100% of all survey responses from CEO/MDs and self-employed consultants, who earn relatively larger salaries.
African members are more likely than other racial groups to be working in the natural resources, energy/fuel and utilities sector and the oil, gas and alternative energy sector; this has an upward effect on average salary.
On the other hand, they are also more likely to be working in the government and not-for-profit sectors, which has the opposite effect. Similarly, Indians are highly likely to be working in the financial services and the manufacturing and engineering industries, which display higher average total salaries, but also the retail
and banking industries, where average total salaries are a little below average.
Business and the economy
Expectations for future pay and conditions
Amid a mixed backdrop of continuing concern over the fate of South Africa’s major trading partners in the Eurozone, China and – to a lesser extent – the USA, the economy is still forecast to grow by 2.8% in 2013, rising to 3.3% in 2014.5 In line with this, two-fifths of CIMA members and students are positive in their expectations for the profitability of the organisation in which they work, and one-third expect salary increases across the board.
There has been dramatic improvement in sentiment since 2009, particularly with regard to budget cuts, job cuts and profitability expectations. However, there is evidence of a slight shift towards the downside in the last two years.
5 IMF World Economic Outlook, April 2013. Available at: www.imf.org/external/pubs/ft/weo/2013/01/pdf/text.pdf Accessed 11 June 2013.
421,759388,944
420,513380,561
405,982358,994
405,181373,706
414,996380,761South Africa - partqualified students
White
Indian
Coloured
African
*Caution: Low base, under 30Lowest base: Coloured (30)Highest base: White (211)
933,768815,184
860,689758,537
852,654757,107
906,943794,452South Africa -
qualified members
White
African
Indian
Coloured*
*Caution: Low base, under 30** Insufficient responces for reporting (8)Lowest base: Indian (23*)Highest base: White (151)
Basic salary Bonus Total
7
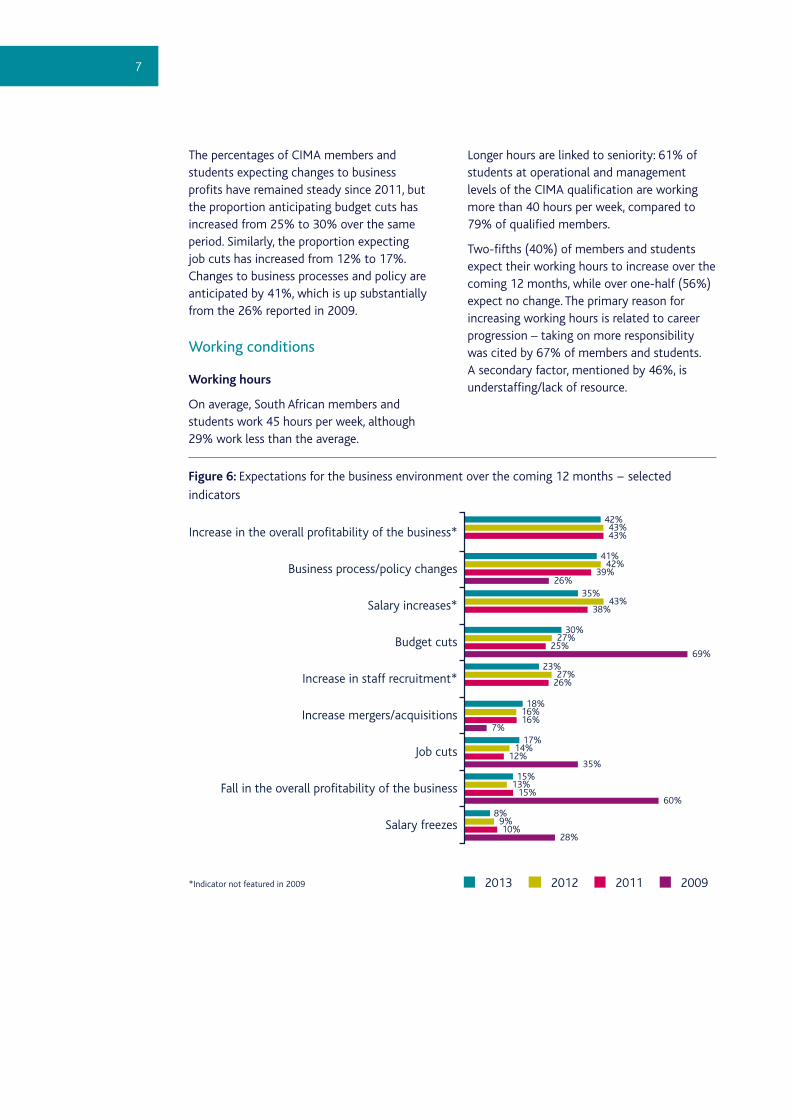
The percentages of CIMA members and students expecting changes to business profits have remained steady since 2011, but the proportion anticipating budget cuts has increased from 25% to 30% over the same period. Similarly, the proportion expecting job cuts has increased from 12% to 17%. Changes to business processes and policy are anticipated by 41%, which is up substantially from the 26% reported in 2009.
Working conditions
Working hours
On average, South African members and students work 45 hours per week, although 29% work less than the average.
Longer hours are linked to seniority: 61% of students at operational and management levels of the CIMA qualification are working more than 40 hours per week, compared to 79% of qualified members.
Two-fifths (40%) of members and students expect their working hours to increase over the coming 12 months, while over one-half (56%) expect no change. The primary reason for increasing working hours is related to career progression – taking on more responsibility was cited by 67% of members and students. A secondary factor, mentioned by 46%, is understaffing/lack of resource.
Figure 6: Expectations for the business environment over the coming 12 months − selected
indicators
42%43%43%
41%42%
39%26%
35%43%
38%
23%27%
26%
30%27%
25%69%
18%16%16%
7%17%
14%12%
35%
8%9%10%
28%
15%13%
15%60%
Increase in the overall profitability of the business*
Business process/policy changes
Salary increases*
Budget cuts
Increase in staff recruitment*
Increase mergers/acquisitions
Job cuts
Fall in the overall profitability of the business
Salary freezes
201120122013*Indicator not featured in 2009 2009
8
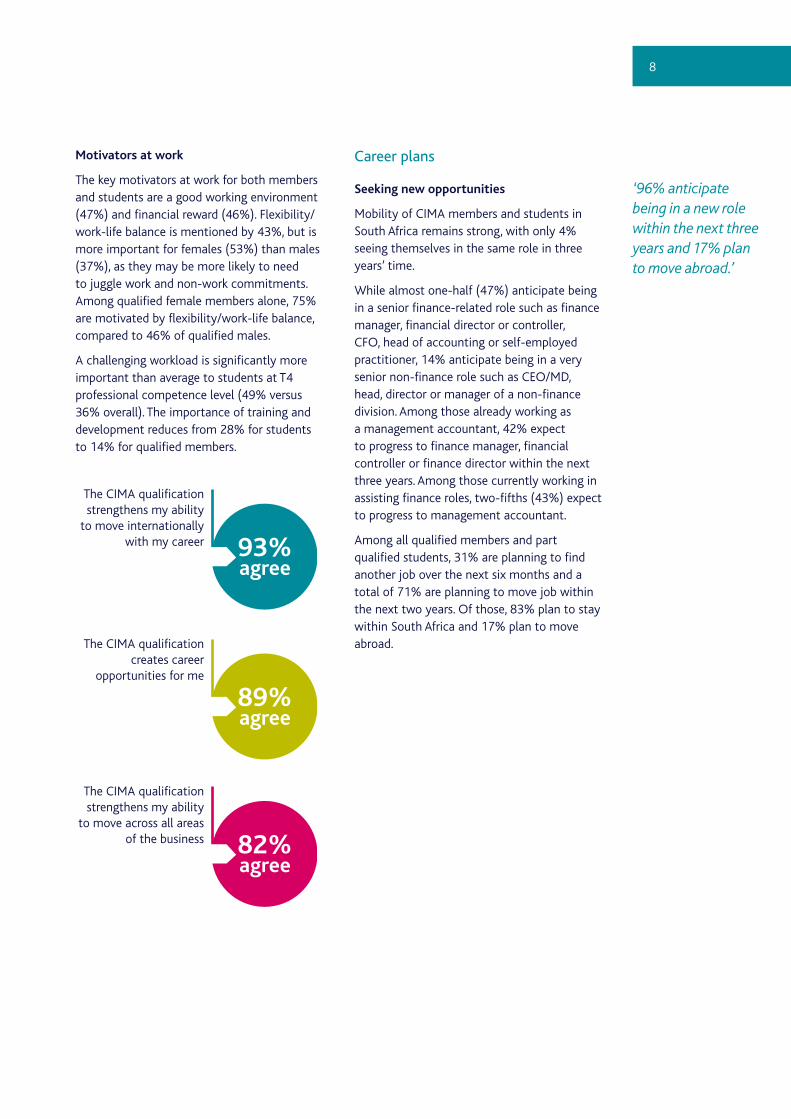
Motivators at work
The key motivators at work for both members and students are a good working environment (47%) and financial reward (46%). Flexibility/work-life balance is mentioned by 43%, but is more important for females (53%) than males (37%), as they may be more likely to need to juggle work and non-work commitments. Among qualified female members alone, 75% are motivated by flexibility/work-life balance, compared to 46% of qualified males.
A challenging workload is significantly more important than average to students at T4 professional competence level (49% versus 36% overall). The importance of training and development reduces from 28% for students to 14% for qualified members.
Career plans
Seeking new opportunities
Mobility of CIMA members and students in South Africa remains strong, with only 4% seeing themselves in the same role in three years’ time.
While almost one-half (47%) anticipate being in a senior finance-related role such as finance manager, financial director or controller, CFO, head of accounting or self-employed practitioner, 14% anticipate being in a very senior non-finance role such as CEO/MD, head, director or manager of a non-finance division. Among those already working as a management accountant, 42% expect to progress to finance manager, financial controller or finance director within the next three years. Among those currently working in assisting finance roles, two-fifths (43%) expect to progress to management accountant.
Among all qualified members and part qualified students, 31% are planning to find another job over the next six months and a total of 71% are planning to move job within the next two years. Of those, 83% plan to stay within South Africa and 17% plan to move abroad.
The CIMA qualificationstrengthens my ability
to move internationallywith my career 93%
agree
The CIMA qualificationcreates career
opportunities for me
89%agree
The CIMA qualificationstrengthens my ability
to move across all areasof the business 82%
agree
‘96% anticipate being in a new role within the next three years and 17% plan to move abroad.’
9
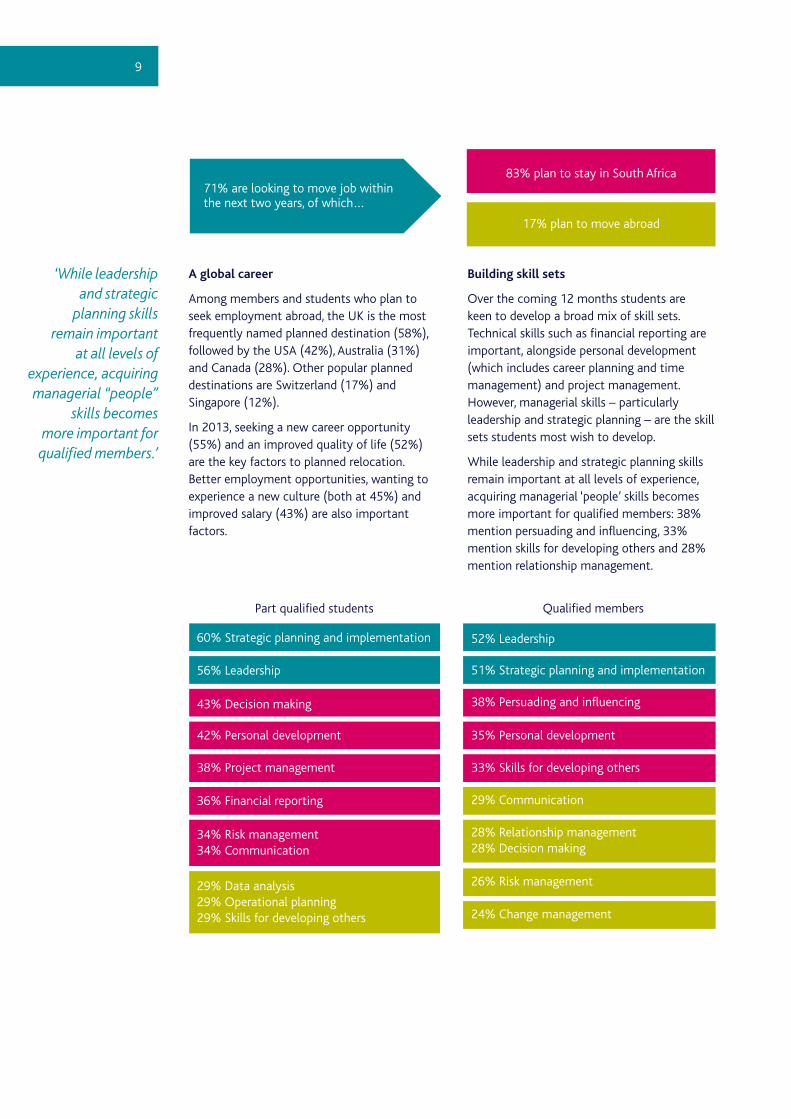
A global career
Among members and students who plan to seek employment abroad, the UK is the most frequently named planned destination (58%), followed by the USA (42%), Australia (31%) and Canada (28%). Other popular planned destinations are Switzerland (17%) and Singapore (12%).
In 2013, seeking a new career opportunity (55%) and an improved quality of life (52%) are the key factors to planned relocation. Better employment opportunities, wanting to experience a new culture (both at 45%) and improved salary (43%) are also important factors.
Building skill sets
Over the coming 12 months students are keen to develop a broad mix of skill sets. Technical skills such as financial reporting are important, alongside personal development (which includes career planning and time management) and project management. However, managerial skills – particularly leadership and strategic planning – are the skill sets students most wish to develop.
While leadership and strategic planning skills remain important at all levels of experience, acquiring managerial ‘people’ skills becomes more important for qualified members: 38% mention persuading and influencing, 33% mention skills for developing others and 28% mention relationship management.
71% are looking to move job withinthe next two years, of which…
83% plan to stay in South Africa
17% plan to move abroad
Part qualified students Qualified members
52% Leadership
56% Leadership
35% Personal development42% Personal development
29% Data analysis29% Operational planning29% Skills for developing others
38% Persuading and influencing
36% Financial reporting
51% Strategic planning and implementation
60% Strategic planning and implementation
29% Communication
26% Risk management
24% Change management
43% Decision making
33% Skills for developing others38% Project management
34% Risk management34% Communication
28% Relationship management28% Decision making
‘While leadership and strategic
planning skills remain important
at all levels of experience, acquiring managerial “people”
skills becomes more important for
qualified members.’
10
Figure 7: Top skills that students and members wish to develop
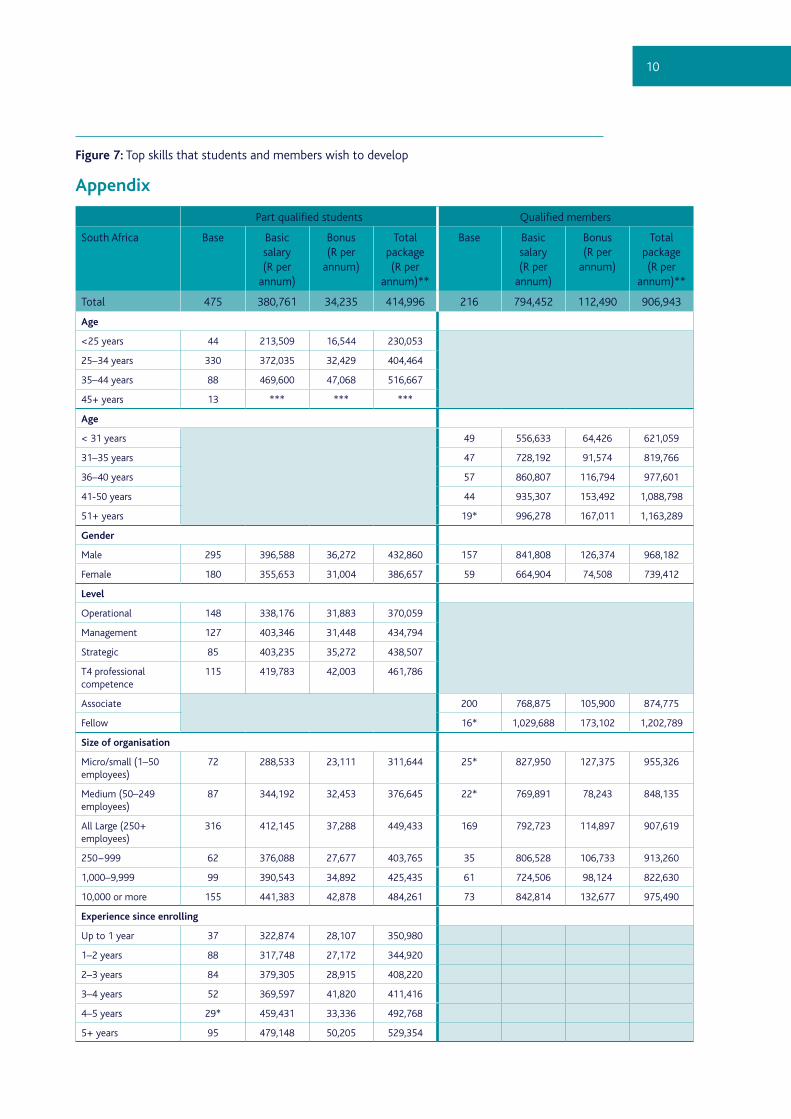
Appendix
Part qualified students Qualified members
South Africa Base Basic salary (R per
annum)
Bonus (R per
annum)
Total package (R per
annum)**
Base Basic salary (R per
annum)
Bonus (R per
annum)
Total package (R per
annum)**
Total 475 380,761 34,235 414,996 216 794,452 112,490 906,943
Age
<25 years 44 213,509 16,544 230,053
25–34 years 330 372,035 32,429 404,464
35–44 years 88 469,600 47,068 516,667
45+ years 13 *** *** ***
Age
< 31 years 49 556,633 64,426 621,059
31–35 years 47 728,192 91,574 819,766
36–40 years 57 860,807 116,794 977,601
41-50 years 44 935,307 153,492 1,088,798
51+ years 19* 996,278 167,011 1,163,289
Gender
Male 295 396,588 36,272 432,860 157 841,808 126,374 968,182
Female 180 355,653 31,004 386,657 59 664,904 74,508 739,412
Level
Operational 148 338,176 31,883 370,059
Management 127 403,346 31,448 434,794
Strategic 85 403,235 35,272 438,507
T4 professional competence
115 419,783 42,003 461,786
Associate 200 768,875 105,900 874,775
Fellow 16* 1,029,688 173,102 1,202,789
Size of organisation
Micro/small (1–50 employees)
72 288,533 23,111 311,644 25* 827,950 127,375 955,326
Medium (50–249 employees)
87 344,192 32,453 376,645 22* 769,891 78,243 848,135
All Large (250+ employees)
316 412,145 37,288 449,433 169 792,723 114,897 907,619
250−999 62 376,088 27,677 403,765 35 806,528 106,733 913,260
1,000–9,999 99 390,543 34,892 425,435 61 724,506 98,124 822,630
10,000 or more 155 441,383 42,878 484,261 73 842,814 132,677 975,490
Experience since enrolling
Up to 1 year 37 322,874 28,107 350,980
1–2 years 88 317,748 27,172 344,920
2–3 years 84 379,305 28,915 408,220
3–4 years 52 369,597 41,820 411,416
4–5 years 29* 459,431 33,336 492,768
5+ years 95 479,148 50,205 529,354
11
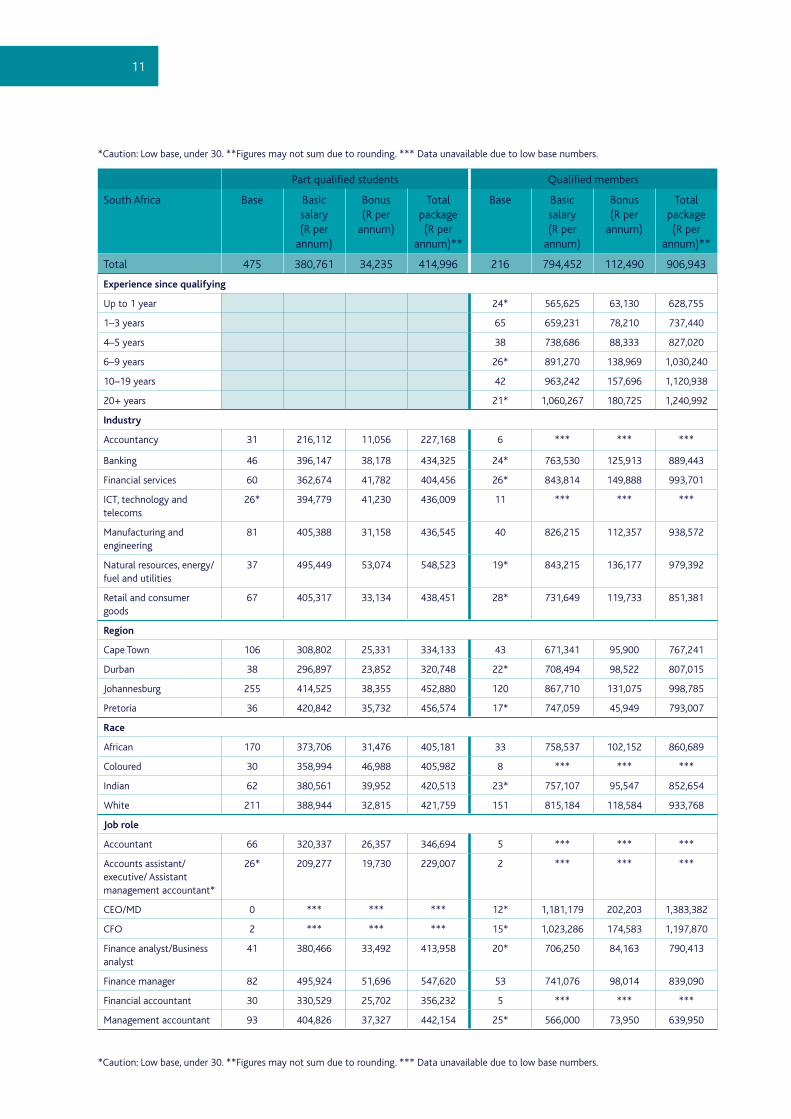
*Caution: Low base, under 30. **Figures may not sum due to rounding. *** Data unavailable due to low base numbers.
Part qualified students Qualified members
South Africa Base Basic salary (R per
annum)
Bonus (R per
annum)
Total package (R per
annum)**
Base Basic salary (R per
annum)
Bonus (R per
annum)
Total package (R per
annum)**
Total 475 380,761 34,235 414,996 216 794,452 112,490 906,943
Experience since qualifying
Up to 1 year 24* 565,625 63,130 628,755
1–3 years 65 659,231 78,210 737,440
4–5 years 38 738,686 88,333 827,020
6–9 years 26* 891,270 138,969 1,030,240
10–19 years 42 963,242 157,696 1,120,938
20+ years 21* 1,060,267 180,725 1,240,992
Industry
Accountancy 31 216,112 11,056 227,168 6 *** *** ***
Banking 46 396,147 38,178 434,325 24* 763,530 125,913 889,443
Financial services 60 362,674 41,782 404,456 26* 843,814 149,888 993,701
ICT, technology and telecoms
26* 394,779 41,230 436,009 11 *** *** ***
Manufacturing and engineering
81 405,388 31,158 436,545 40 826,215 112,357 938,572
Natural resources, energy/fuel and utilities
37 495,449 53,074 548,523 19* 843,215 136,177 979,392
Retail and consumer goods
67 405,317 33,134 438,451 28* 731,649 119,733 851,381
Region
Cape Town 106 308,802 25,331 334,133 43 671,341 95,900 767,241
Durban 38 296,897 23,852 320,748 22* 708,494 98,522 807,015
Johannesburg 255 414,525 38,355 452,880 120 867,710 131,075 998,785
Pretoria 36 420,842 35,732 456,574 17* 747,059 45,949 793,007
Race
African 170 373,706 31,476 405,181 33 758,537 102,152 860,689
Coloured 30 358,994 46,988 405,982 8 *** *** ***
Indian 62 380,561 39,952 420,513 23* 757,107 95,547 852,654
White 211 388,944 32,815 421,759 151 815,184 118,584 933,768
Job role
Accountant 66 320,337 26,357 346,694 5 *** *** ***
Accounts assistant/executive/ Assistant management accountant*
26* 209,277 19,730 229,007 2 *** *** ***
CEO/MD 0 *** *** *** 12* 1,181,179 202,203 1,383,382
CFO 2 *** *** *** 15* 1,023,286 174,583 1,197,870
Finance analyst/Business analyst
41 380,466 33,492 413,958 20* 706,250 84,163 790,413
Finance manager 82 495,924 51,696 547,620 53 741,076 98,014 839,090
Financial accountant 30 330,529 25,702 356,232 5 *** *** ***
Management accountant 93 404,826 37,327 442,154 25* 566,000 73,950 639,950
*Caution: Low base, under 30. **Figures may not sum due to rounding. *** Data unavailable due to low base numbers.
12
Technical information
Survey responses were collected by CIMA among active qualified members and part qualified students 25 April and 19 May 2013, via an online survey. The data was analysed and reported by an independent specialist consultancy.
Approximately 25,000 qualified members and just under 21,000 part qualified students were selected and invited to participate in the international study, which covers 23 markets in total. Within the study period 6,039 responded internationally, including 691 from South Africa.
The response data presented in this report has been weighted to reflect the profile of CIMA qualified members and part qualified students by market and level of study. All base numbers quoted in figures report the lowest unweighted base; i.e. the number of responses.
Further information
For further information on technical matters relating to this survey, contact [email protected]
For further country specific analysis and reports, visit CIMA MY JOBS at http://myjobs.cimaglobal.com
Acknowledgements
This research was conducted by CIMA in conjunction with Spotlight Market Research & Editing. The Chartered Institute of Management Accountants is a Market Research Society Company Partner. Both CIMA and Spotlight abide by the Market Research Society’s Code of Conduct and the Data Protection Act.

CIMA South Africa1st Floor, 198 Oxford Road,Illovo 2196T: +27 11 788 8723 E: [email protected]
© September 2013, Chartered Institute of Management Accountants