CIMA global qualified salary survey 2009 locations docs...Ireland Dublin €90,300 Malaysia Kuala...
35
CIMA global qualified salary survey 2009
Transcript of CIMA global qualified salary survey 2009 locations docs...Ireland Dublin €90,300 Malaysia Kuala...

CIMA global qualifiedsalary survey 2009
......................................................................................................................................................................................
.............................................................................................................................................................................
...............................................................................................................................................................................................................
.................................................................................................................................................................................................
.....................................................................................................................................................................................................
........................................................................................................................................................................................................
...................................................................................................................................................
..........................................................................................................................................................
..............................................................................................................................................................................
............................................................................................................................................................................................................................................
...............................................................................................................................................................
.................................................................................................................................................................................
.........................................................................................................................................................
......................................................................................................................................
....................................................................................
1244456789910111212141516181920212122232325263131
ForewordExecutive summaryMain findingsSalaries and bonusesSalariesBonusesYears’ experienceGenderSectorSize of businessJob rolesCIMA levelSatisfaction with salaryRecruitment and retentionImportance of benefitsSatisfaction with benefitsPromotion prospectsWorking hoursPrimary career motivatorsMotivator by countrySkill set requirementsGeographical mobilityExtent of movementTop destinationsEconomic futureAnticipated impactOne word to describe successCountry specific salary informationTechnical informationFurther information
CIMA salary survey 2009 – global report
41
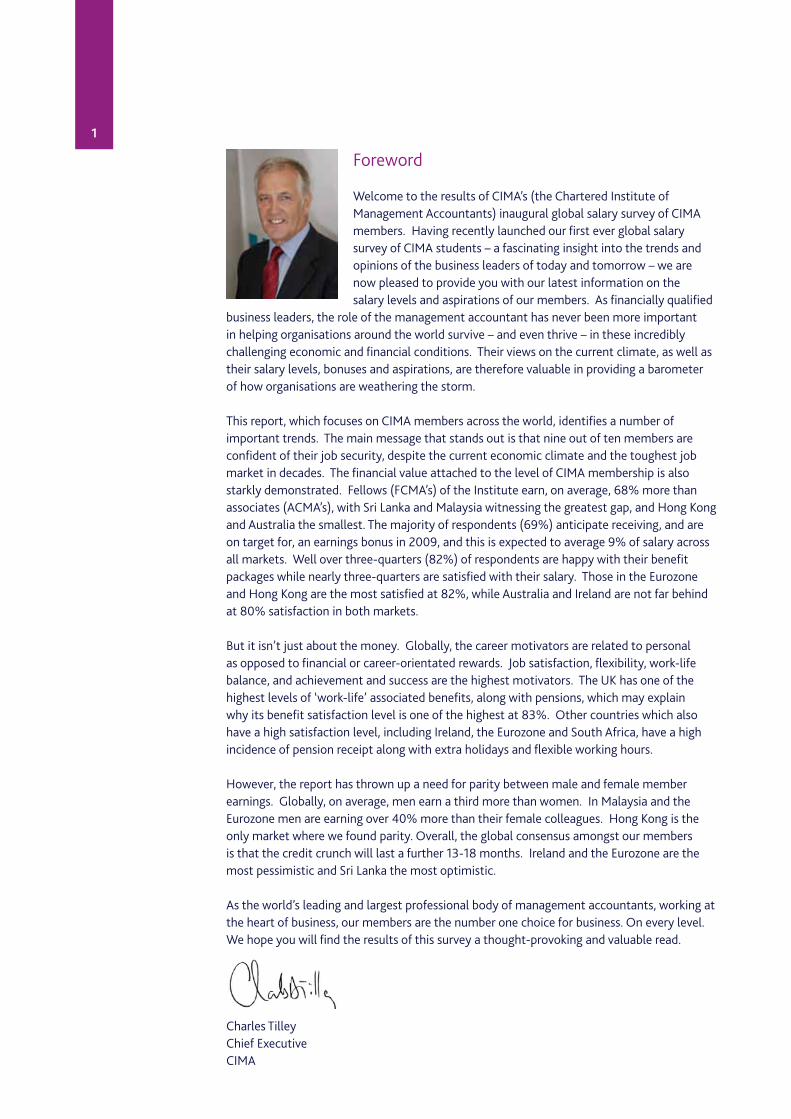
Foreword
Welcome to the results of CIMA’s (the Chartered Institute of Management Accountants) inaugural global salary survey of CIMA members. Having recently launched our first ever global salary survey of CIMA students – a fascinating insight into the trends and opinions of the business leaders of today and tomorrow – we are now pleased to provide you with our latest information on the salary levels and aspirations of our members. As financially qualified
business leaders, the role of the management accountant has never been more important in helping organisations around the world survive – and even thrive – in these incredibly challenging economic and financial conditions. Their views on the current climate, as well as their salary levels, bonuses and aspirations, are therefore valuable in providing a barometer of how organisations are weathering the storm.
This report, which focuses on CIMA members across the world, identifies a number of important trends. The main message that stands out is that nine out of ten members are confident of their job security, despite the current economic climate and the toughest job market in decades. The financial value attached to the level of CIMA membership is also starkly demonstrated. Fellows (FCMA’s) of the Institute earn, on average, 68% more than associates (ACMA’s), with Sri Lanka and Malaysia witnessing the greatest gap, and Hong Kong and Australia the smallest. The majority of respondents (69%) anticipate receiving, and are on target for, an earnings bonus in 2009, and this is expected to average 9% of salary across all markets. Well over three-quarters (82%) of respondents are happy with their benefit packages while nearly three-quarters are satisfied with their salary. Those in the Eurozone and Hong Kong are the most satisfied at 82%, while Australia and Ireland are not far behind at 80% satisfaction in both markets.
But it isn’t just about the money. Globally, the career motivators are related to personal as opposed to financial or career-orientated rewards. Job satisfaction, flexibility, work-life balance, and achievement and success are the highest motivators. The UK has one of the highest levels of ‘work-life’ associated benefits, along with pensions, which may explain why its benefit satisfaction level is one of the highest at 83%. Other countries which also have a high satisfaction level, including Ireland, the Eurozone and South Africa, have a high incidence of pension receipt along with extra holidays and flexible working hours.
However, the report has thrown up a need for parity between male and female member earnings. Globally, on average, men earn a third more than women. In Malaysia and the Eurozone men are earning over 40% more than their female colleagues. Hong Kong is the only market where we found parity. Overall, the global consensus amongst our members is that the credit crunch will last a further 13-18 months. Ireland and the Eurozone are the most pessimistic and Sri Lanka the most optimistic.
As the world’s leading and largest professional body of management accountants, working at the heart of business, our members are the number one choice for business. On every level. We hope you will find the results of this survey a thought-provoking and valuable read.
Charles TilleyChief ExecutiveCIMA
2
Executive summary
Organisations are having to ensure a delicate but crucial balance between short-term survival and their long-term future. While there is enormous pressure to cut costs, investing in the training and development of financial business leaders has never been more important. With this in mind CIMA sought to gauge its qualified members’ views in the current climate and understand their salary levels and aspirations.
In May 2009 CIMA launched its first ever global salary survey for qualified members. A total of 1,870 people contributed to the survey, establishing a reliable benchmark of current and future salary potential for CIMA members. This report looks at the salaries and bonuses paid to CIMA members in the UK, Ireland, the Eurozone, South Africa, Sri Lanka, Malaysia, Hong Kong and Australia, and how these vary according to factors such as sector and size of business. It goes on to examine recruitment and retention issues and identifies the geographical mobility of CIMA members. Finally, it touches upon views of the future economy.
Salary information was collected in May 2009 in local currency. A country by country comparison is not made for salary information as the cost of living and tax regimes vary tremendously by region.
Salaries and bonuses
• The financial value attached to the level of CIMA membership varies tremendously by country, some areas seeing no or very little difference in remuneration between Fellow and Associate membership levels (Hong Kong, Australia), while others (Sri Lanka, Malaysia) witness a greater gap.
• FCMAs earn around 68% more than ACMAs on average.
• London in the UK, Dublin in Ireland and Johannesburg in South Africa are the salary hotspots where members are most likely to be in the top salary tier.
• Globally, on average, men earn a third more than women. The greatest differences are in Malaysia and the Eurozone where men are earning over 40% more than their female colleagues. Hong Kong is the only country that sees parity.
• Those with 20 or more years’ experience earn, on average, 69% more than those who qualified between one and three years ago. FCMAs earn around 68% more than ACMAs on average.
• Technology, telecoms and utilities along with natural resources, and energy/fuel have the greatest proportion of respondents in the highest salary tier.
• 69% of respondents anticipate receiving an on target earnings bonus in 2009. Bonuses are expected to average 9% of their salary across all markets.
• Those in Sri Lanka and South Africa are expecting to receive the highest bonuses as a percentage of their salary in 2009, with bonuses equating to around 11%.
• 73% of respondents are satisfied with their salary. The highest levels of satisfaction can be found amongst CIMA members in the Eurozone, Hong Kong (82% satisfaction each), Australia and Ireland (80% satisfaction each).
• 82% of respondents are satisfied with their benefit packages.
3
Recruitment and retention• The UK has one of the highest levels of ‘work-life balance’ associated benefits, along with
pensions, which may well explain why its benefit satisfaction level is one of the highest at 83%. Other countries which also have a high satisfaction level (Ireland, the Eurozone and South Africa) have a high incidence of pension receipt along with extra holidays and flexible working hours.
• Two-thirds consider their promotion prospects with their current employer to be average, good or excellent.
• The average working week is generally shorter for countries in Europe and Australia, all of which placed a high priority on ‘work-life balance’ related benefits. Globally the average working week for CIMA members is 44.3 hours.
• A third of members are under pressure to increase their workload outside normal hours, with South Africans most likely to feel they are in this situation (46%).
• Globally, the key career motivators are related to personal situations as opposed to financial or career-orientated rewards, namely job satisfaction (16%), flexibility/work-life balance, and achievement and success (15% each).
• Malaysia has the greatest tendency to desire training. It is also the only country that doesn’t have leadership as its most desired skill set for improvement (instead stating strategic planning and implementation).
Geographical mobility• CIMA members seem to be masters of their own destiny. Although 87% are confident that
they can keep their current position during the coming 12 months if they want, close to half (46%) are considering moving.
• For the 16% of CIMA members who intend to move abroad in the next 12 months, predominately English speaking countries are the most popular choice: Australia followed by the USA, New Zealand, UAE and Canada.
Economic future• Ireland and the Eurozone anticipate the credit crunch to last the longest, while Sri Lanka is
the most optimistic. Globally, the overall consensus indicates that it will probably last a further 13 to 18 months.
4
Main findings
Salaries and bonuses
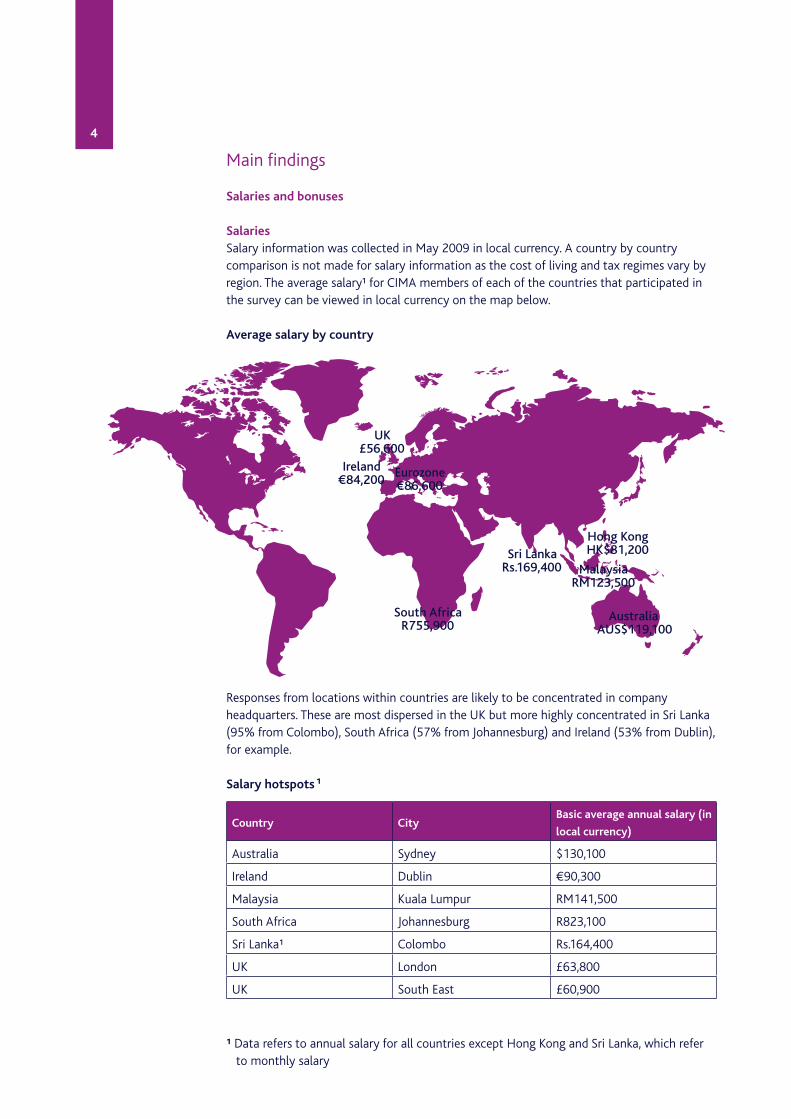
SalariesSalary information was collected in May 2009 in local currency. A country by country comparison is not made for salary information as the cost of living and tax regimes vary by region. The average salary¹ for CIMA members of each of the countries that participated in the survey can be viewed in local currency on the map below.
Average salary by country
Responses from locations within countries are likely to be concentrated in company headquarters. These are most dispersed in the UK but more highly concentrated in Sri Lanka (95% from Colombo), South Africa (57% from Johannesburg) and Ireland (53% from Dublin), for example.
Salary hotspots
¹ Data refers to annual salary for all countries except Hong Kong and Sri Lanka, which refer to monthly salary
Country CityBasic average annual salary (in
local currency)
Australia Sydney $130,100
Ireland Dublin €90,300
Malaysia Kuala Lumpur RM141,500
South Africa Johannesburg R823,100
Sri Lanka¹ Colombo Rs.164,400
UK London £63,800
UK South East £60,900
UK£56,600
Ireland€84,200
Eurozone€86,600
South AfricaR755,900
Sri LankaRs.169,400
AustraliaAUS$119,100
MalaysiaRM123,500
Hong KongHK$81,200
¹
5
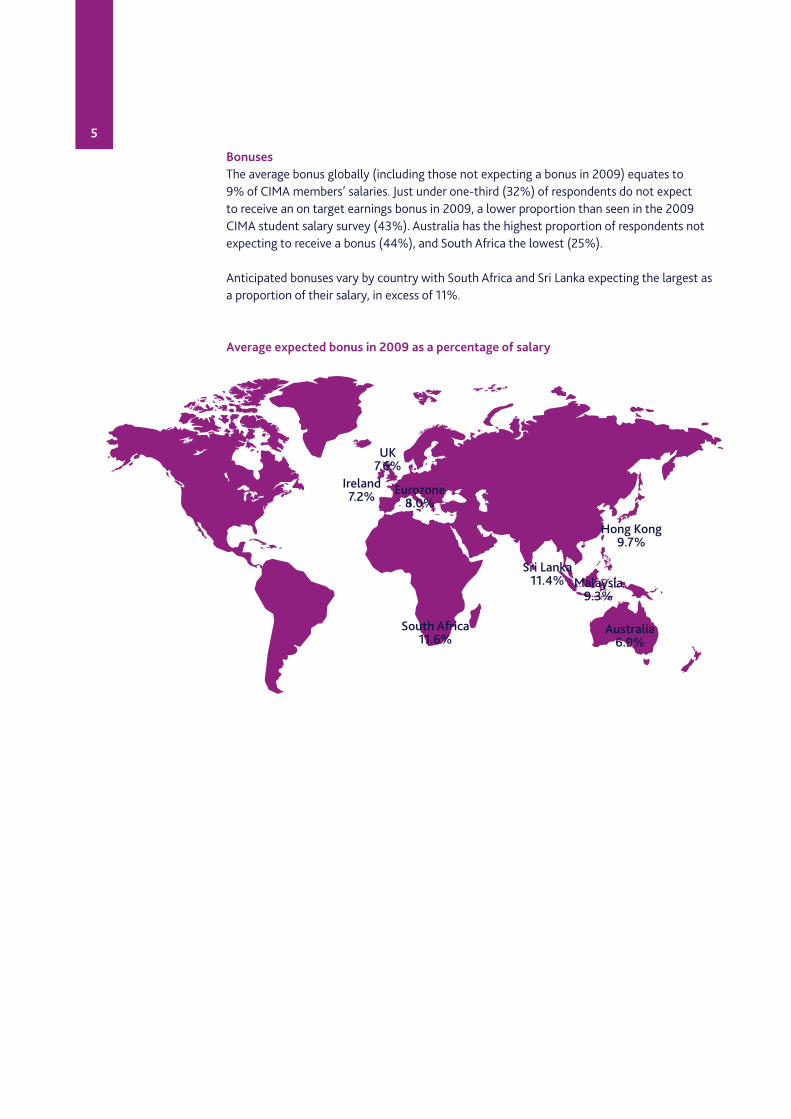
BonusesThe average bonus globally (including those not expecting a bonus in 2009) equates to 9% of CIMA members’ salaries. Just under one-third (32%) of respondents do not expect to receive an on target earnings bonus in 2009, a lower proportion than seen in the 2009 CIMA student salary survey (43%). Australia has the highest proportion of respondents not expecting to receive a bonus (44%), and South Africa the lowest (25%).
Anticipated bonuses vary by country with South Africa and Sri Lanka expecting the largest as a proportion of their salary, in excess of 11%.
Average expected bonus in 2009 as a percentage of salary
UK7.6%
Ireland7.2% Eurozone
8.0%
South Africa11.6%
Sri Lanka11.4%
Australia6.9%
Malaysia9.3%
Hong Kong9.7%
6
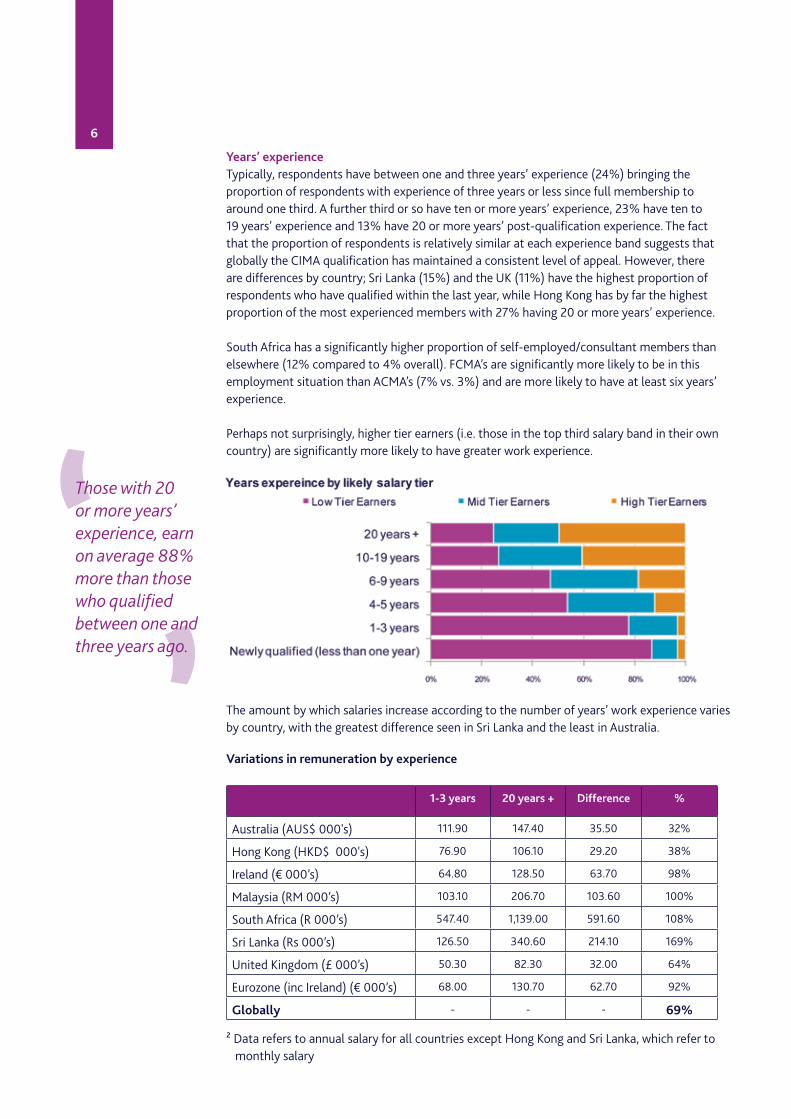
Years’ experienceTypically, respondents have between one and three years’ experience (24%) bringing the proportion of respondents with experience of three years or less since full membership to around one third. A further third or so have ten or more years’ experience, 23% have ten to 19 years’ experience and 13% have 20 or more years’ post-qualification experience. The fact that the proportion of respondents is relatively similar at each experience band suggests that globally the CIMA qualification has maintained a consistent level of appeal. However, there are differences by country; Sri Lanka (15%) and the UK (11%) have the highest proportion of respondents who have qualified within the last year, while Hong Kong has by far the highest proportion of the most experienced members with 27% having 20 or more years’ experience.
South Africa has a significantly higher proportion of self-employed/consultant members than elsewhere (12% compared to 4% overall). FCMA’s are significantly more likely to be in this employment situation than ACMA’s (7% vs. 3%) and are more likely to have at least six years’ experience.
Perhaps not surprisingly, higher tier earners (i.e. those in the top third salary band in their own country) are significantly more likely to have greater work experience.
The amount by which salaries increase according to the number of years’ work experience varies by country, with the greatest difference seen in Sri Lanka and the least in Australia.
² Data refers to annual salary for all countries except Hong Kong and Sri Lanka, which refer to monthly salary
Those with 20 or more years’ experience, earn on average 88% more than those who qualified between one and three years ago.
Variations in remuneration by experience
1-3 years 20 years + Difference %
Australia (AUS$ 000's) 111.90 147.40 35.50 32%
Hong Kong (HKD$ 000's) 76.90 106.10 29.20 38%
Ireland (€ 000’s) 64.80 128.50 63.70 98%
Malaysia (RM 000’s) 103.10 206.70 103.60 100%
South Africa (R 000’s) 547.40 1,139.00 591.60 108%
Sri Lanka (Rs 000’s) 126.50 340.60 214.10 169%
United Kingdom (£ 000’s) 50.30 82.30 32.00 64%
Eurozone (inc Ireland) (€ 000’s) 68.00 130.70 62.70 92%
Globally - - - 69%
7
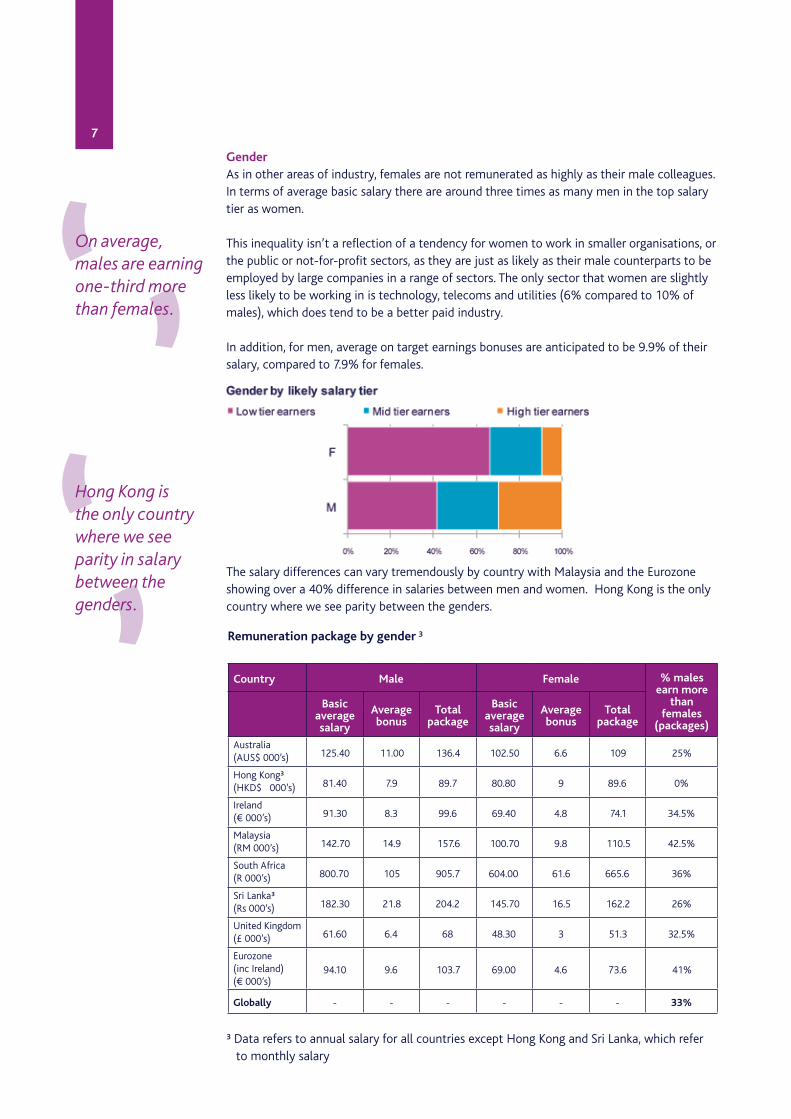
GenderAs in other areas of industry, females are not remunerated as highly as their male colleagues. In terms of average basic salary there are around three times as many men in the top salary tier as women.
This inequality isn’t a reflection of a tendency for women to work in smaller organisations, or the public or not-for-profit sectors, as they are just as likely as their male counterparts to be employed by large companies in a range of sectors. The only sector that women are slightly less likely to be working in is technology, telecoms and utilities (6% compared to 10% of males), which does tend to be a better paid industry.
In addition, for men, average on target earnings bonuses are anticipated to be 9.9% of their salary, compared to 7.9% for females.
The salary differences can vary tremendously by country with Malaysia and the Eurozone showing over a 40% difference in salaries between men and women. Hong Kong is the only country where we see parity between the genders.
³ Data refers to annual salary for all countries except Hong Kong and Sri Lanka, which refer to monthly salary
On average, males are earning one-third more than females.
Hong Kong is the only country where we see parity in salary between the genders.
Remuneration package by gender
Country Male Female % males earn more
than females
(packages)
Basic average salary
Average bonus
Total package
Basic average salary
Average bonus
Total package
Australia (AUS$ 000’s) 125.40 11.00 136.4 102.50 6.6 109 25%
Hong Kong³(HKD$ 000’s) 81.40 7.9 89.7 80.80 9 89.6 0%
Ireland (€ 000’s) 91.30 8.3 99.6 69.40 4.8 74.1 34.5%
Malaysia (RM 000’s) 142.70 14.9 157.6 100.70 9.8 110.5 42.5%
South Africa (R 000’s) 800.70 105 905.7 604.00 61.6 665.6 36%
Sri Lanka³(Rs 000’s) 182.30 21.8 204.2 145.70 16.5 162.2 26%
United Kingdom (£ 000’s) 61.60 6.4 68 48.30 3 51.3 32.5%
Eurozone (inc Ireland) (€ 000’s)
94.10 9.6 103.7 69.00 4.6 73.6 41%
Globally - - - - - - 33%
³
8
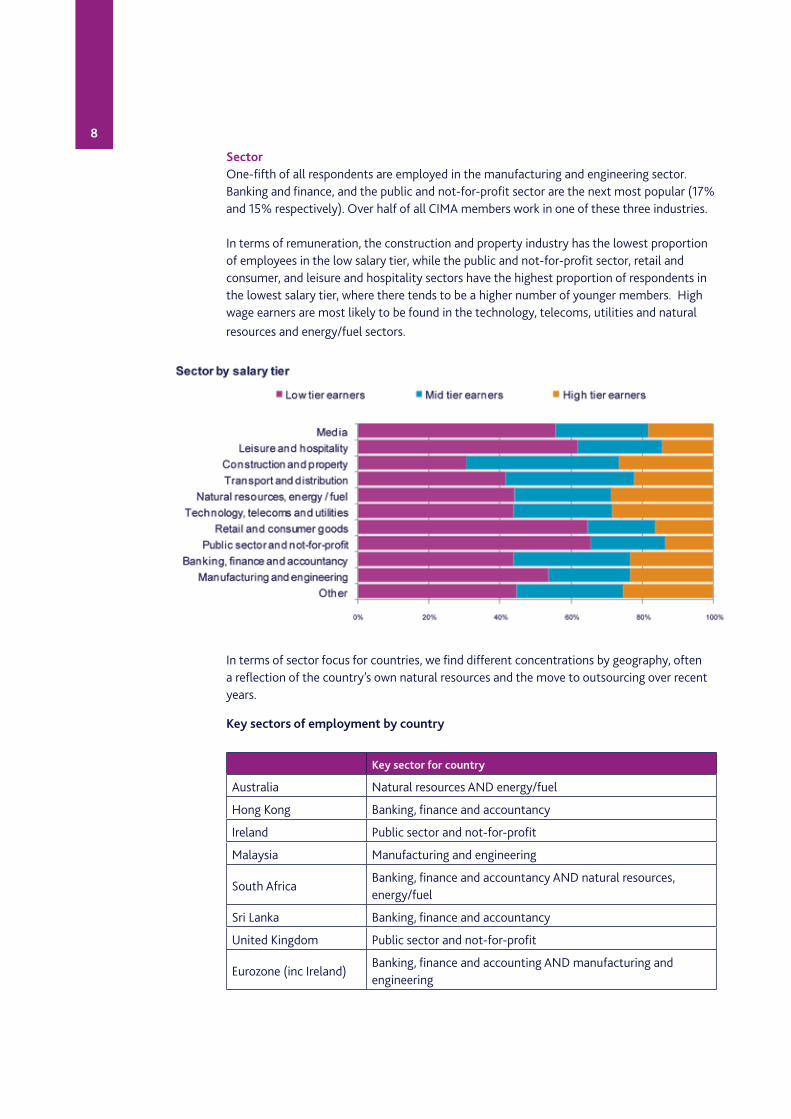
SectorOne-fifth of all respondents are employed in the manufacturing and engineering sector. Banking and finance, and the public and not-for-profit sector are the next most popular (17% and 15% respectively). Over half of all CIMA members work in one of these three industries.
In terms of remuneration, the construction and property industry has the lowest proportion of employees in the low salary tier, while the public and not-for-profit sector, retail and consumer, and leisure and hospitality sectors have the highest proportion of respondents in the lowest salary tier, where there tends to be a higher number of younger members. High wage earners are most likely to be found in the technology, telecoms, utilities and natural resources and energy/fuel sectors.
In terms of sector focus for countries, we find different concentrations by geography, often a reflection of the country’s own natural resources and the move to outsourcing over recent years.
Remuneration package by gender
Country Male Female % males earn more
than females
(packages)
Basic average salary
Average bonus
Total package
Basic average salary
Average bonus
Total package
Australia (AUS$ 000’s) 125.40 11.00 136.4 102.50 6.6 109 25%
Hong Kong3(HKD$ 000’s) 81.40 7.9 89.7 80.80 9 89.6 0%
Ireland (€ 000’s) 91.30 8.3 99.6 69.40 4.8 74.1 34.5%
Malaysia (RM 000’s) 142.70 14.9 157.6 100.70 9.8 110.5 42.5%
South Africa (R 000’s) 800.70 105 905.7 604.00 61.6 665.6 36%
Sri Lanka3(Rs 000’s) 182.30 21.8 204.2 145.70 16.5 162.2 26%
United Kingdom (£ 000’s) 61.60 6.4 68 48.30 3 51.3 32.5%
Eurozone (inc Ireland) (€ 000’s)
94.10 9.6 103.7 69.00 4.6 73.6 41%
Globally - - - - - - 33%
Key sectors of employment by country
Key sector for country
Australia Natural resources AND energy/fuel
Hong Kong Banking, finance and accountancy
Ireland Public sector and not-for-profit
Malaysia Manufacturing and engineering
South Africa Banking, finance and accountancy AND natural resources, energy/fuel
Sri Lanka Banking, finance and accountancy
United Kingdom Public sector and not-for-profit
Eurozone (inc Ireland)Banking, finance and accounting AND manufacturing and engineering
9
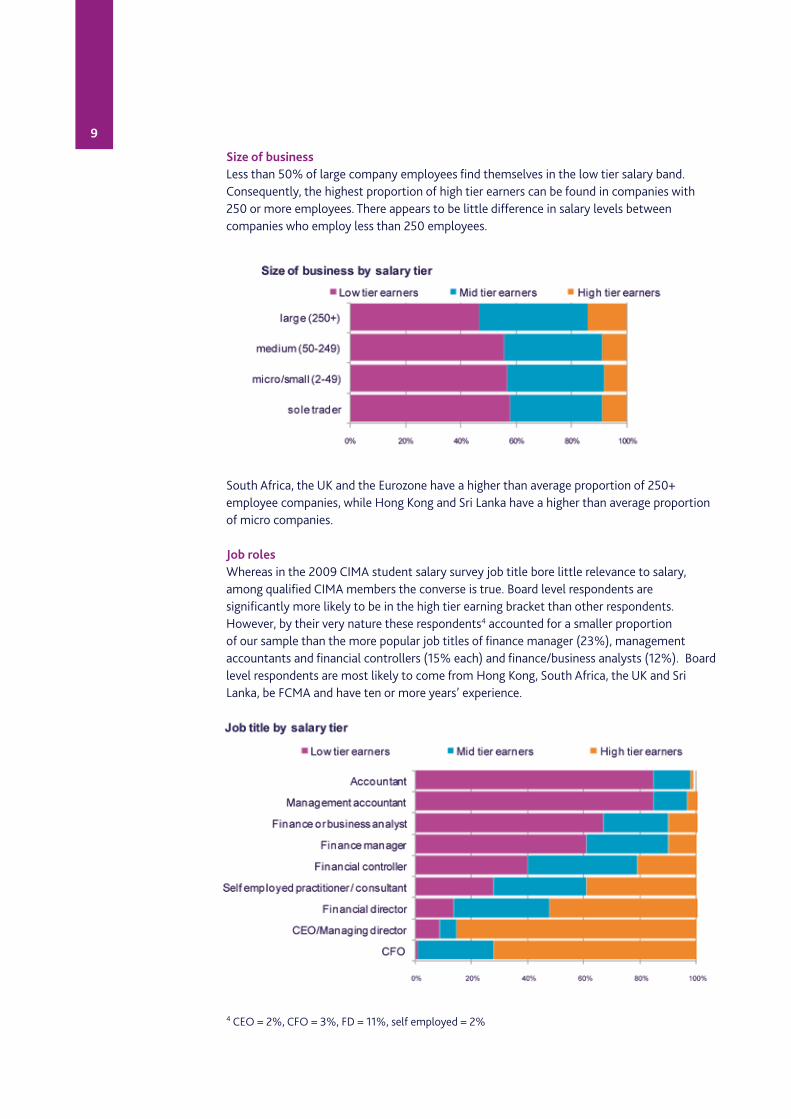
Size of businessLess than 50% of large company employees find themselves in the low tier salary band. Consequently, the highest proportion of high tier earners can be found in companies with 250 or more employees. There appears to be little difference in salary levels between companies who employ less than 250 employees.
South Africa, the UK and the Eurozone have a higher than average proportion of 250+ employee companies, while Hong Kong and Sri Lanka have a higher than average proportion of micro companies.
Job rolesWhereas in the 2009 CIMA student salary survey job title bore little relevance to salary, among qualified CIMA members the converse is true. Board level respondents are significantly more likely to be in the high tier earning bracket than other respondents. However, by their very nature these respondents4 accounted for a smaller proportion of our sample than the more popular job titles of finance manager (23%), management accountants and financial controllers (15% each) and finance/business analysts (12%). Board level respondents are most likely to come from Hong Kong, South Africa, the UK and Sri Lanka, be FCMA and have ten or more years’ experience.
4 CEO = 2%, CFO = 3%, FD = 11%, self employed = 2%
10
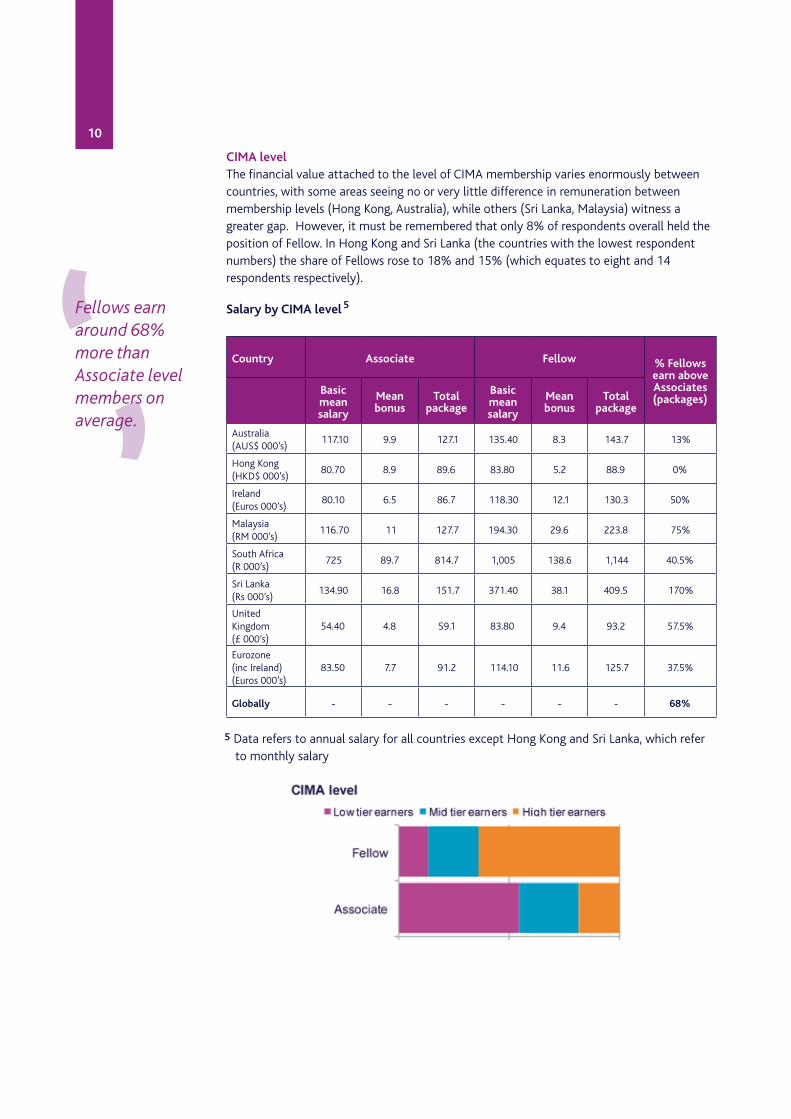
CIMA levelThe financial value attached to the level of CIMA membership varies enormously between countries, with some areas seeing no or very little difference in remuneration between membership levels (Hong Kong, Australia), while others (Sri Lanka, Malaysia) witness a greater gap. However, it must be remembered that only 8% of respondents overall held the position of Fellow. In Hong Kong and Sri Lanka (the countries with the lowest respondent numbers) the share of Fellows rose to 18% and 15% (which equates to eight and 14 respondents respectively).
Fellows earn around 68% more than Associate level members on average.
Salary by CIMA level
Country Associate Fellow % Fellows earn above Associates (packages)
Basic mean salary
Mean bonus
Total package
Basic mean salary
Mean bonus
Total package
Australia (AUS$ 000’s)
117.10 9.9 127.1 135.40 8.3 143.7 13%
Hong Kong (HKD$ 000’s)
80.70 8.9 89.6 83.80 5.2 88.9 0%
Ireland (Euros 000’s)
80.10 6.5 86.7 118.30 12.1 130.3 50%
Malaysia (RM 000’s)
116.70 11 127.7 194.30 29.6 223.8 75%
South Africa (R 000’s)
725 89.7 814.7 1,005 138.6 1,144 40.5%
Sri Lanka (Rs 000’s)
134.90 16.8 151.7 371.40 38.1 409.5 170%
United Kingdom (£ 000’s)
54.40 4.8 59.1 83.80 9.4 93.2 57.5%
Eurozone (inc Ireland) (Euros 000’s)
83.50 7.7 91.2 114.10 11.6 125.7 37.5%
Globally - - - - - - 68%
5
5 Data refers to annual salary for all countries except Hong Kong and Sri Lanka, which refer to monthly salary
11
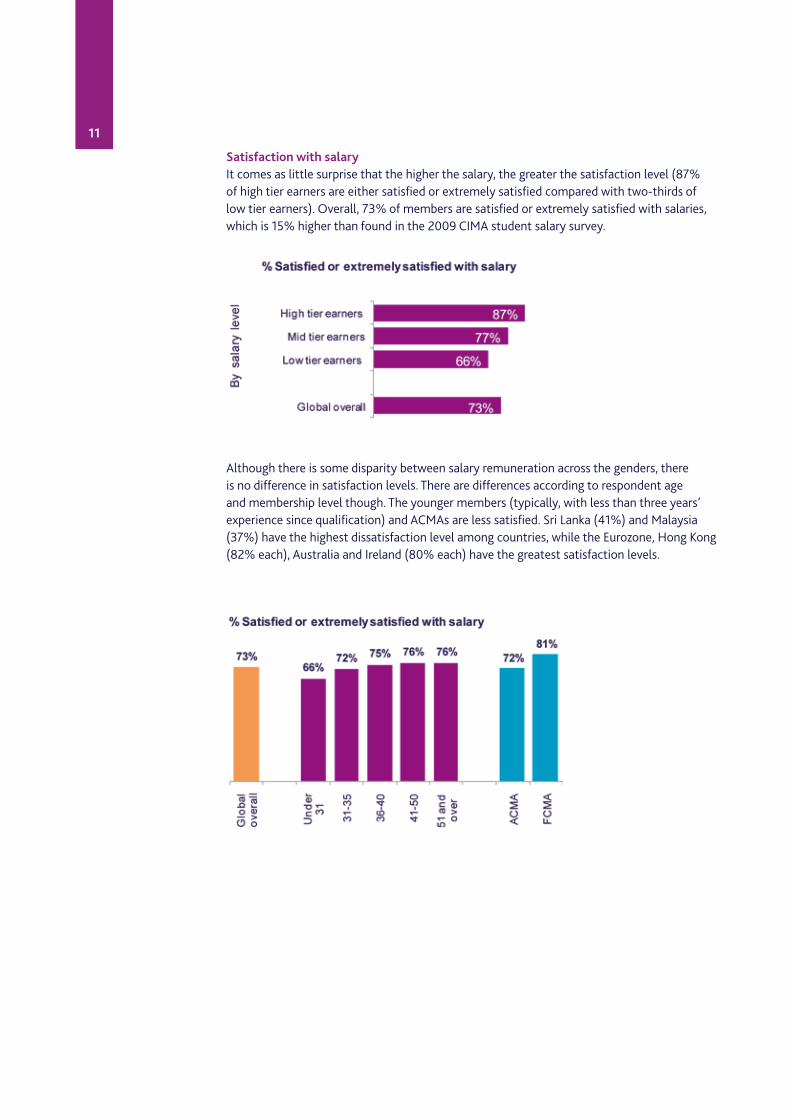
Satisfaction with salaryIt comes as little surprise that the higher the salary, the greater the satisfaction level (87% of high tier earners are either satisfied or extremely satisfied compared with two-thirds of low tier earners). Overall, 73% of members are satisfied or extremely satisfied with salaries, which is 15% higher than found in the 2009 CIMA student salary survey.
Although there is some disparity between salary remuneration across the genders, there is no difference in satisfaction levels. There are differences according to respondent age and membership level though. The younger members (typically, with less than three years’ experience since qualification) and ACMAs are less satisfied. Sri Lanka (41%) and Malaysia (37%) have the highest dissatisfaction level among countries, while the Eurozone, Hong Kong (82% each), Australia and Ireland (80% each) have the greatest satisfaction levels.
12
Recruitment and retention
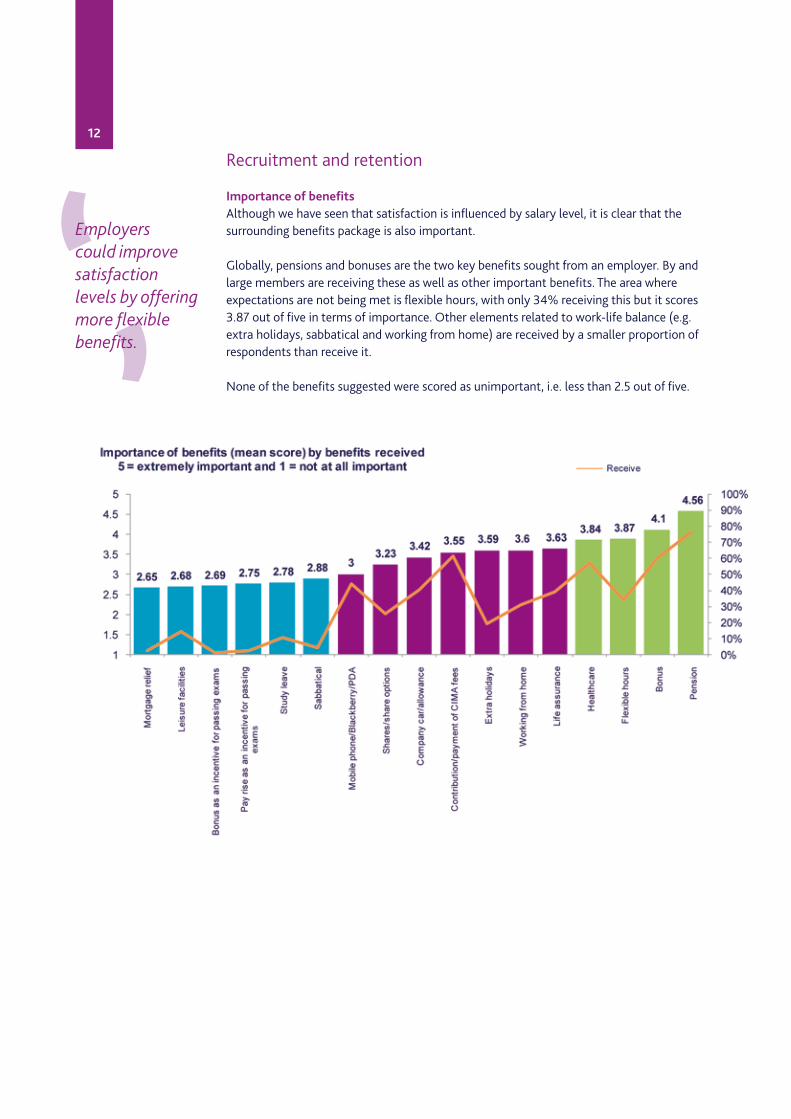
Importance of benefitsAlthough we have seen that satisfaction is influenced by salary level, it is clear that the surrounding benefits package is also important.
Globally, pensions and bonuses are the two key benefits sought from an employer. By and large members are receiving these as well as other important benefits. The area where expectations are not being met is flexible hours, with only 34% receiving this but it scores 3.87 out of five in terms of importance. Other elements related to work-life balance (e.g. extra holidays, sabbatical and working from home) are received by a smaller proportion of respondents than receive it.
None of the benefits suggested were scored as unimportant, i.e. less than 2.5 out of five.
Employerscould improvesatisfactionlevels by offeringmore flexible benefits.
13
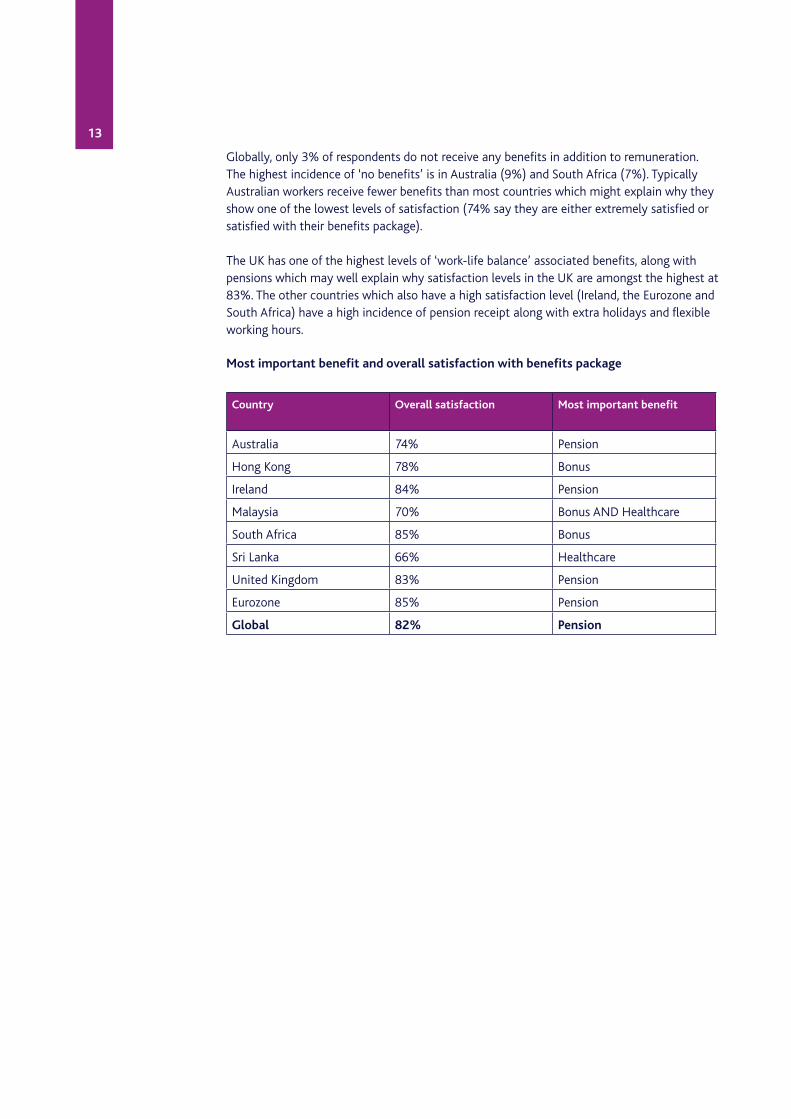
Globally, only 3% of respondents do not receive any benefits in addition to remuneration. The highest incidence of ‘no benefits’ is in Australia (9%) and South Africa (7%). Typically Australian workers receive fewer benefits than most countries which might explain why they show one of the lowest levels of satisfaction (74% say they are either extremely satisfied or satisfied with their benefits package).
The UK has one of the highest levels of ‘work-life balance’ associated benefits, along with pensions which may well explain why satisfaction levels in the UK are amongst the highest at 83%. The other countries which also have a high satisfaction level (Ireland, the Eurozone and South Africa) have a high incidence of pension receipt along with extra holidays and flexible working hours.
Most important benefit and overall satisfaction with benefits package
Country Overall satisfaction Most important benefit
Australia 74% Pension
Hong Kong 78% Bonus
Ireland 84% Pension
Malaysia 70% Bonus AND Healthcare
South Africa 85% Bonus
Sri Lanka 66% Healthcare
United Kingdom 83% Pension
Eurozone 85% Pension
Global 82% Pension
14
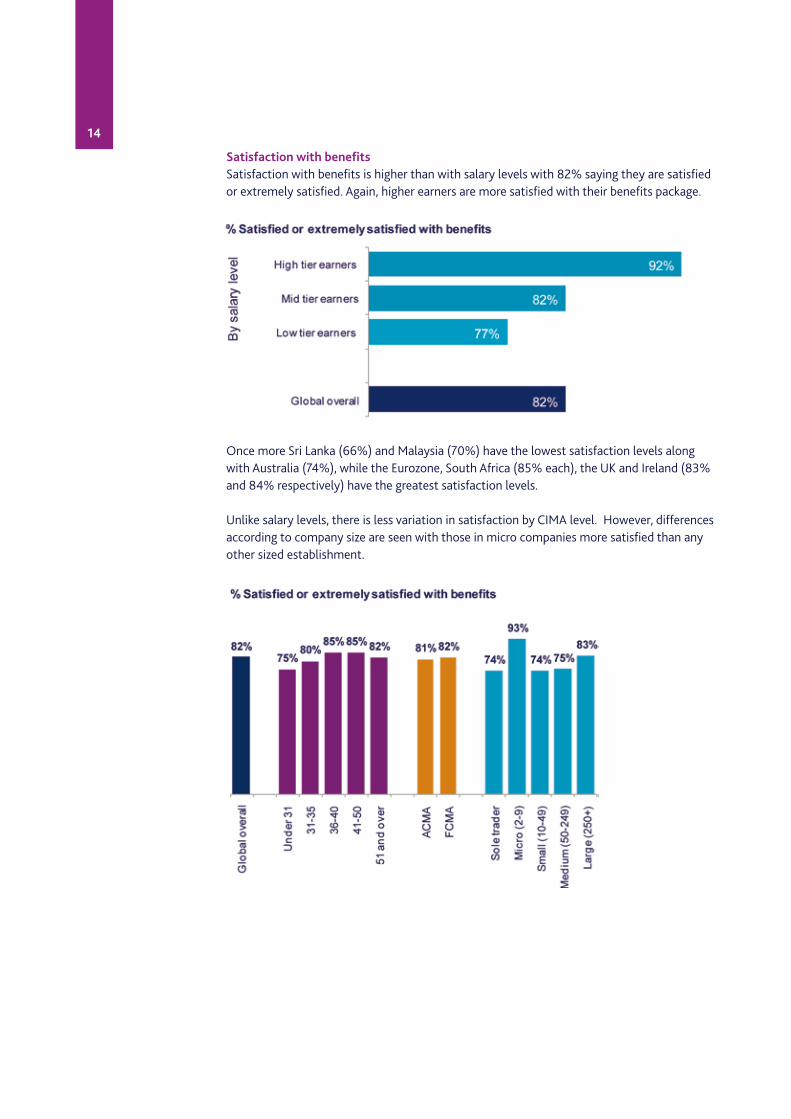
Satisfaction with benefitsSatisfaction with benefits is higher than with salary levels with 82% saying they are satisfied or extremely satisfied. Again, higher earners are more satisfied with their benefits package.
Once more Sri Lanka (66%) and Malaysia (70%) have the lowest satisfaction levels along with Australia (74%), while the Eurozone, South Africa (85% each), the UK and Ireland (83% and 84% respectively) have the greatest satisfaction levels.
Unlike salary levels, there is less variation in satisfaction by CIMA level. However, differences according to company size are seen with those in micro companies more satisfied than any other sized establishment.
15
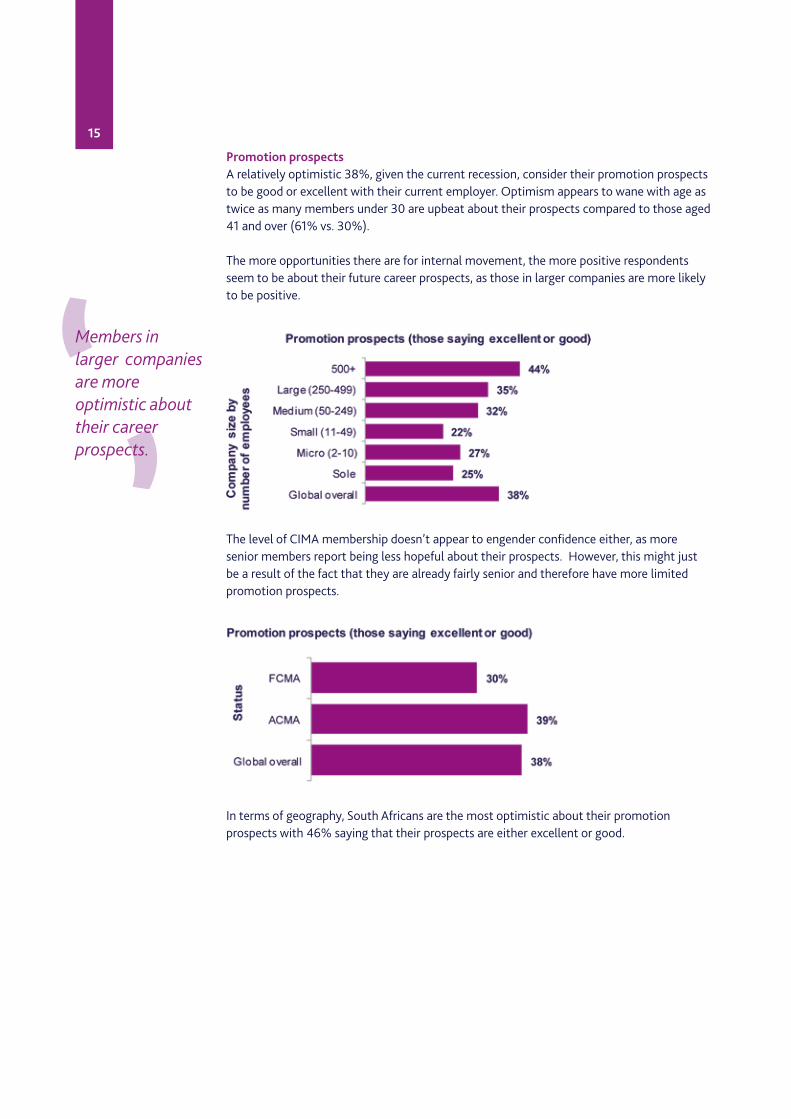
Promotion prospectsA relatively optimistic 38%, given the current recession, consider their promotion prospects to be good or excellent with their current employer. Optimism appears to wane with age as twice as many members under 30 are upbeat about their prospects compared to those aged 41 and over (61% vs. 30%).
The more opportunities there are for internal movement, the more positive respondents seem to be about their future career prospects, as those in larger companies are more likely to be positive.
The level of CIMA membership doesn’t appear to engender confidence either, as more senior members report being less hopeful about their prospects. However, this might just be a result of the fact that they are already fairly senior and therefore have more limited promotion prospects.
In terms of geography, South Africans are the most optimistic about their promotion prospects with 46% saying that their prospects are either excellent or good.
Members in larger companies are more optimistic about their career prospects.
16
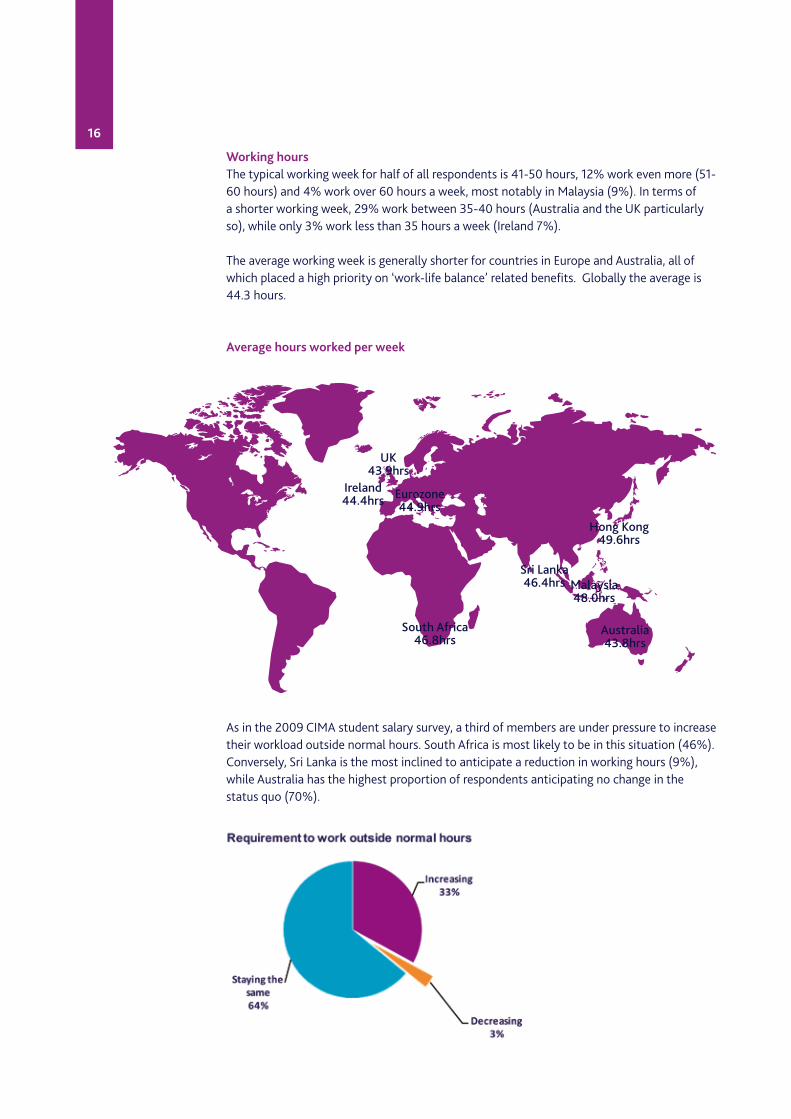
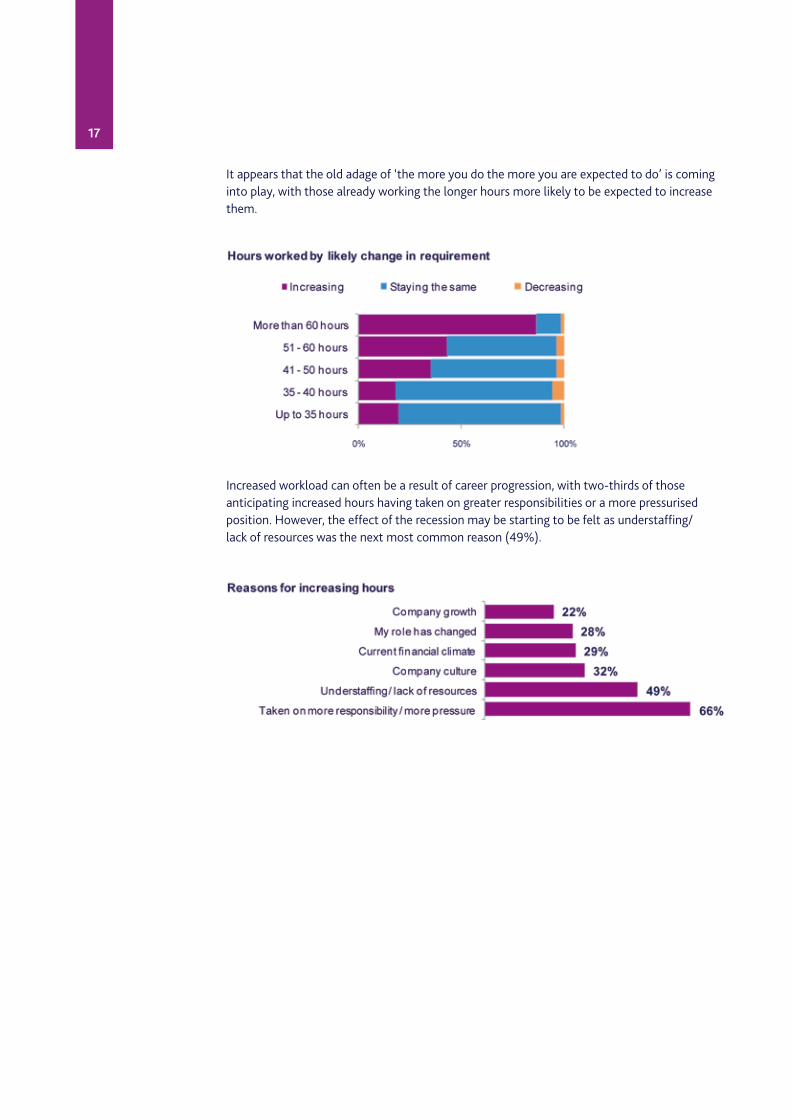
Working hoursThe typical working week for half of all respondents is 41-50 hours, 12% work even more (51-60 hours) and 4% work over 60 hours a week, most notably in Malaysia (9%). In terms of a shorter working week, 29% work between 35-40 hours (Australia and the UK particularly so), while only 3% work less than 35 hours a week (Ireland 7%).
The average working week is generally shorter for countries in Europe and Australia, all of which placed a high priority on ‘work-life balance’ related benefits. Globally the average is 44.3 hours.
Average hours worked per week
As in the 2009 CIMA student salary survey, a third of members are under pressure to increase their workload outside normal hours. South Africa is most likely to be in this situation (46%). Conversely, Sri Lanka is the most inclined to anticipate a reduction in working hours (9%), while Australia has the highest proportion of respondents anticipating no change in the status quo (70%).
UK43.9hrs
Ireland44.4hrs Eurozone
44.9hrs
South Africa46.8hrs
Sri Lanka46.4hrs
Australia43.8hrs
Malaysia48.0hrs
Hong Kong49.6hrs
17
It appears that the old adage of ‘the more you do the more you are expected to do’ is coming into play, with those already working the longer hours more likely to be expected to increase them.
Increased workload can often be a result of career progression, with two-thirds of those anticipating increased hours having taken on greater responsibilities or a more pressurised position. However, the effect of the recession may be starting to be felt as understaffing/ lack of resources was the next most common reason (49%).
18
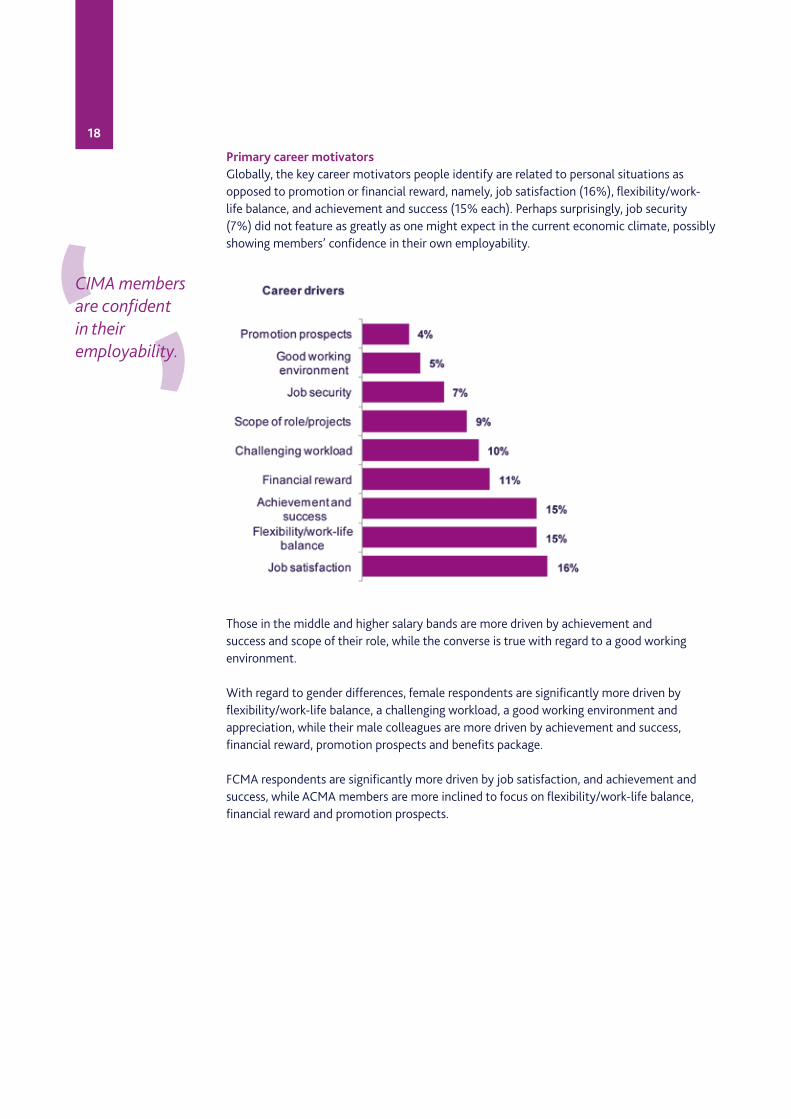
Primary career motivatorsGlobally, the key career motivators people identify are related to personal situations as opposed to promotion or financial reward, namely, job satisfaction (16%), flexibility/work-life balance, and achievement and success (15% each). Perhaps surprisingly, job security (7%) did not feature as greatly as one might expect in the current economic climate, possibly showing members’ confidence in their own employability.
Those in the middle and higher salary bands are more driven by achievement and success and scope of their role, while the converse is true with regard to a good working environment.
With regard to gender differences, female respondents are significantly more driven by flexibility/work-life balance, a challenging workload, a good working environment and appreciation, while their male colleagues are more driven by achievement and success, financial reward, promotion prospects and benefits package.
FCMA respondents are significantly more driven by job satisfaction, and achievement and success, while ACMA members are more inclined to focus on flexibility/work-life balance, financial reward and promotion prospects.
CIMA membersare confidentin theiremployability.
19
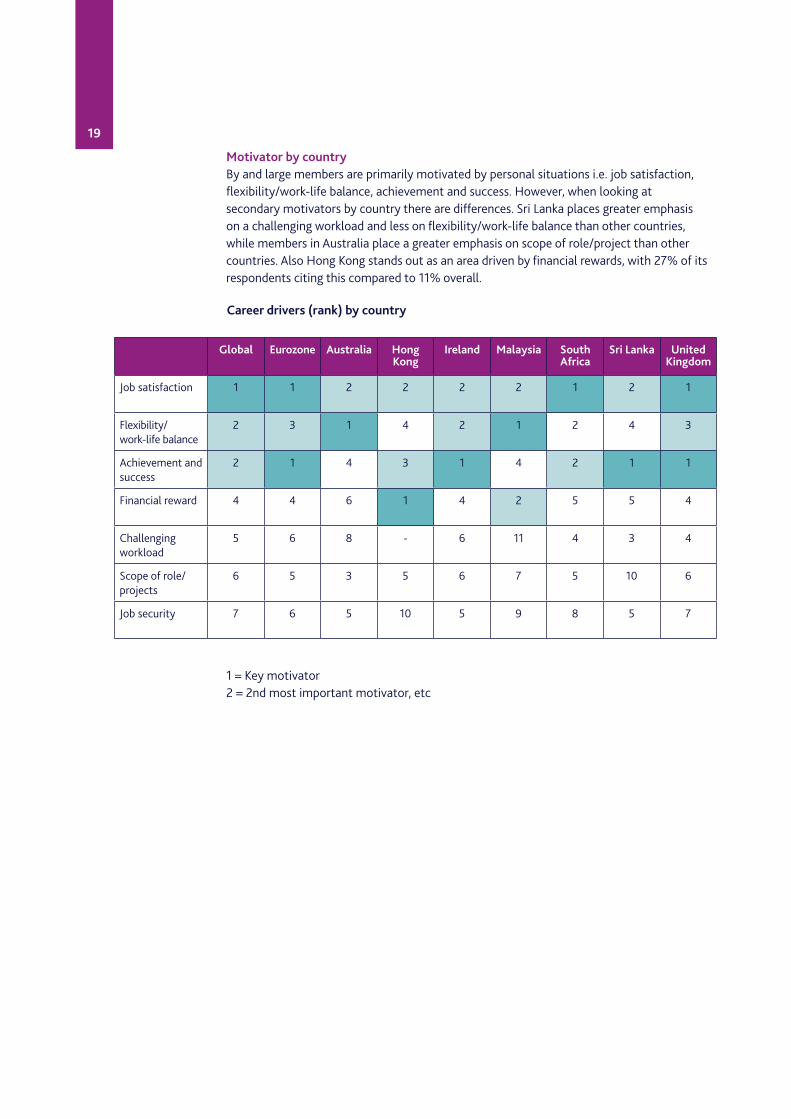
Motivator by countryBy and large members are primarily motivated by personal situations i.e. job satisfaction, flexibility/work-life balance, achievement and success. However, when looking at secondary motivators by country there are differences. Sri Lanka places greater emphasis on a challenging workload and less on flexibility/work-life balance than other countries, while members in Australia place a greater emphasis on scope of role/project than other countries. Also Hong Kong stands out as an area driven by financial rewards, with 27% of its respondents citing this compared to 11% overall.
1 = Key motivator2 = 2nd most important motivator, etc
Career drivers (rank) by country
Global Eurozone Australia Hong Kong
Ireland Malaysia South Africa
Sri Lanka United Kingdom
Job satisfaction 1 1 2 2 2 2 1 2 1
Flexibility/ work-life balance
2 3 1 4 2 1 2 4 3
Achievement and success
2 1 4 3 1 4 2 1 1
Financial reward 4 4 6 1 4 2 5 5 4
Challenging workload
5 6 8 - 6 11 4 3 4
Scope of role/ projects
6 5 3 5 6 7 5 10 6
Job security 7 6 5 10 5 9 8 5 7
20
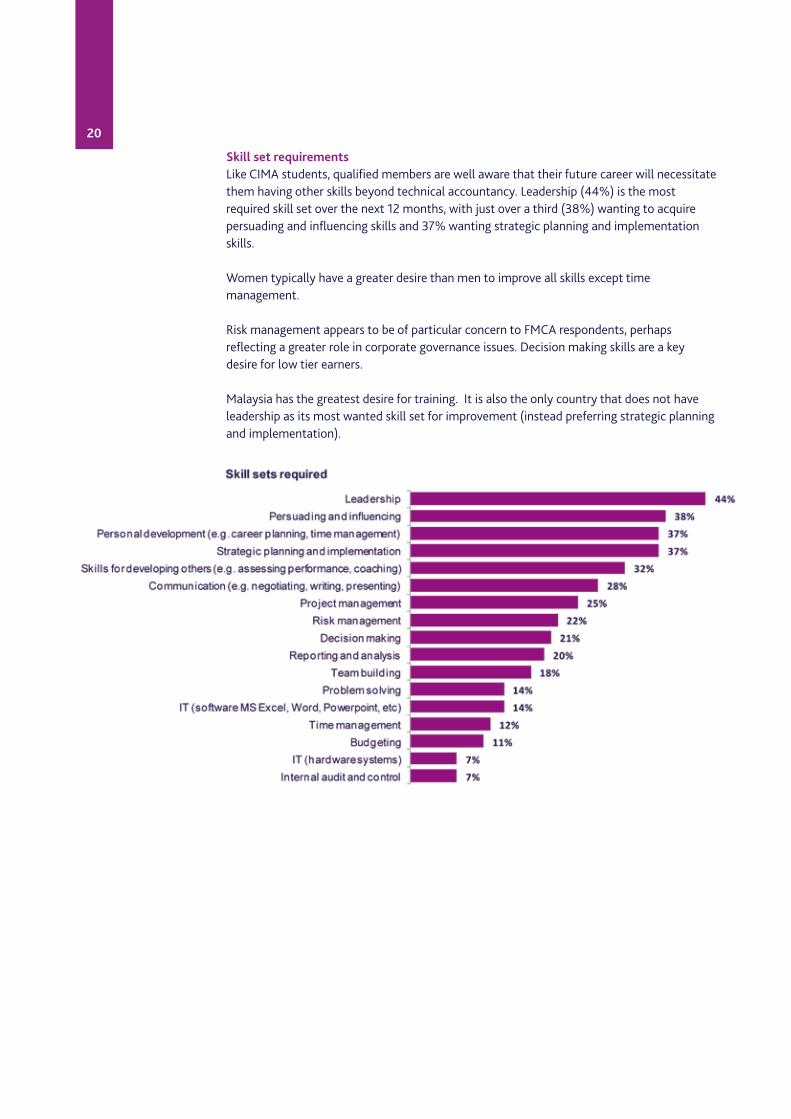
Skill set requirementsLike CIMA students, qualified members are well aware that their future career will necessitate them having other skills beyond technical accountancy. Leadership (44%) is the most required skill set over the next 12 months, with just over a third (38%) wanting to acquire persuading and influencing skills and 37% wanting strategic planning and implementation skills.
Women typically have a greater desire than men to improve all skills except time management.
Risk management appears to be of particular concern to FMCA respondents, perhaps reflecting a greater role in corporate governance issues. Decision making skills are a key desire for low tier earners.
Malaysia has the greatest desire for training. It is also the only country that does not have leadership as its most wanted skill set for improvement (instead preferring strategic planning and implementation).
21
Geographical mobility
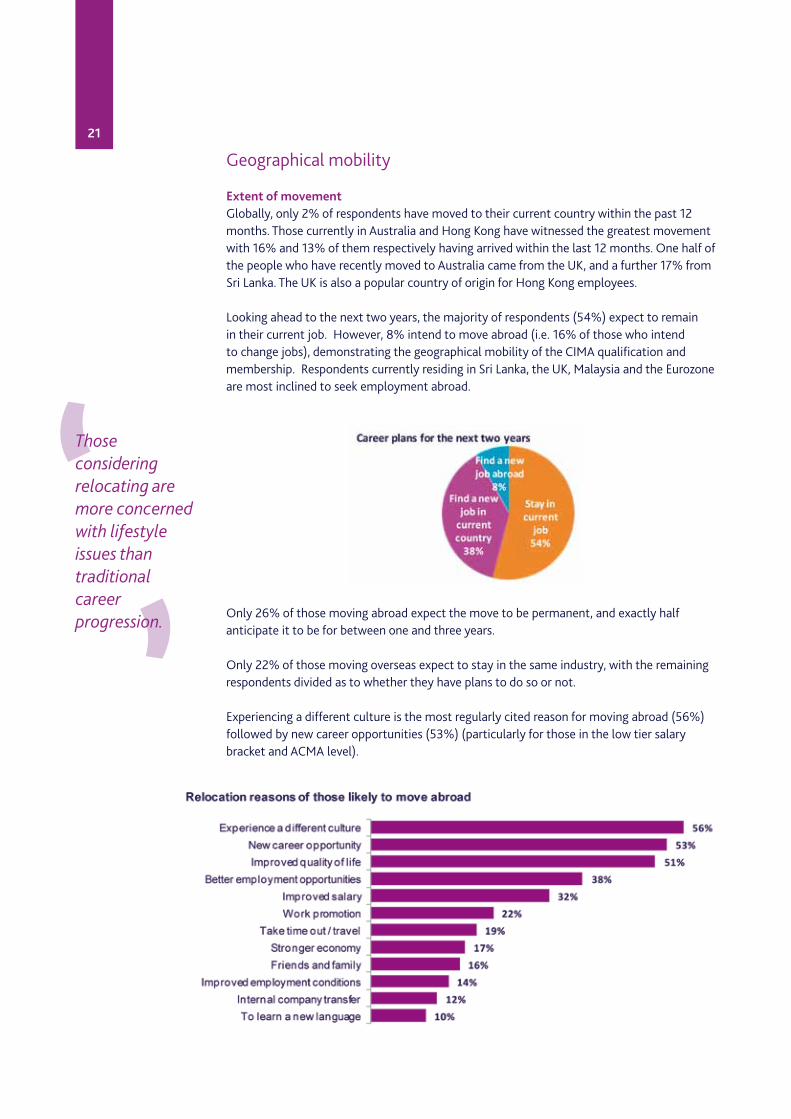
Extent of movementGlobally, only 2% of respondents have moved to their current country within the past 12 months. Those currently in Australia and Hong Kong have witnessed the greatest movement with 16% and 13% of them respectively having arrived within the last 12 months. One half of the people who have recently moved to Australia came from the UK, and a further 17% from Sri Lanka. The UK is also a popular country of origin for Hong Kong employees.
Looking ahead to the next two years, the majority of respondents (54%) expect to remain in their current job. However, 8% intend to move abroad (i.e. 16% of those who intend to change jobs), demonstrating the geographical mobility of the CIMA qualification and membership. Respondents currently residing in Sri Lanka, the UK, Malaysia and the Eurozone are most inclined to seek employment abroad.
Only 26% of those moving abroad expect the move to be permanent, and exactly half anticipate it to be for between one and three years.
Only 22% of those moving overseas expect to stay in the same industry, with the remaining respondents divided as to whether they have plans to do so or not. Experiencing a different culture is the most regularly cited reason for moving abroad (56%) followed by new career opportunities (53%) (particularly for those in the low tier salary bracket and ACMA level).
Thoseconsideringrelocating aremore concernedwith lifestyleissues thantraditionalcareerprogression.
22
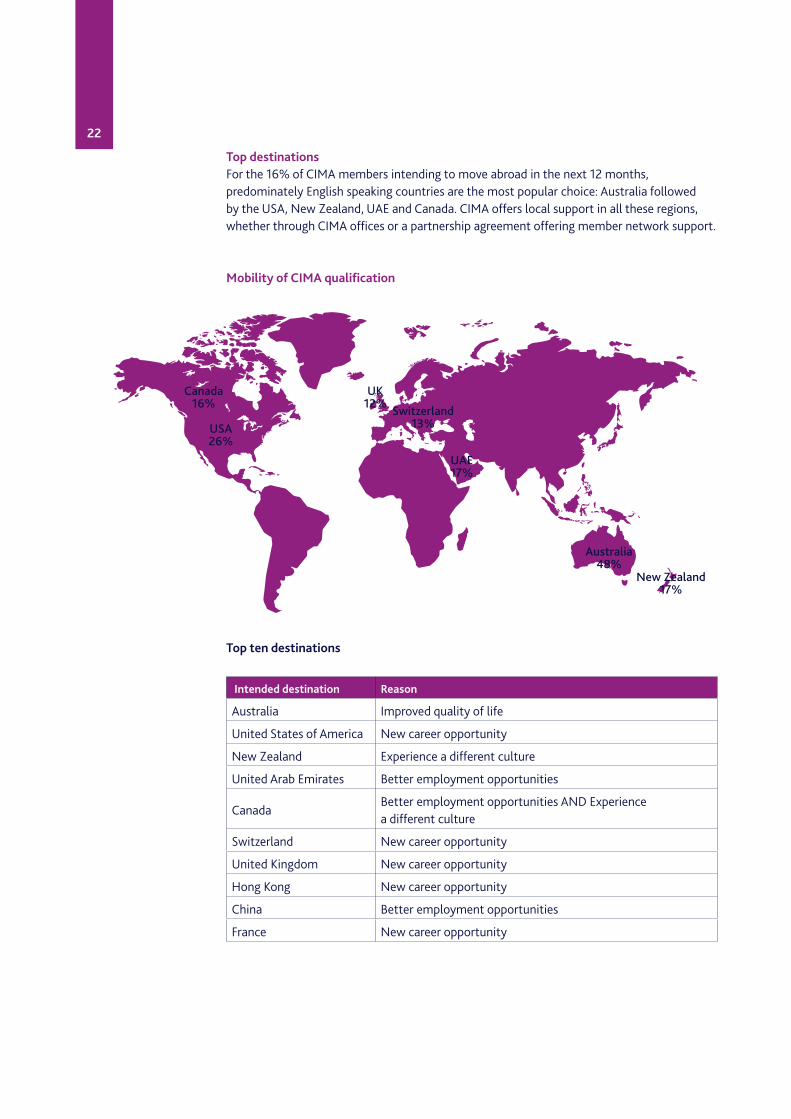
Top destinationsFor the 16% of CIMA members intending to move abroad in the next 12 months, predominately English speaking countries are the most popular choice: Australia followed by the USA, New Zealand, UAE and Canada. CIMA offers local support in all these regions, whether through CIMA offices or a partnership agreement offering member network support.
Mobility of CIMA qualification
UK12%
Canada16%
USA26%
UAE17%
Switzerland13%
New Zealand17%
Australia48%
Top ten destinations
Intended destination Reason
Australia Improved quality of life
United States of America New career opportunity
New Zealand Experience a different culture
United Arab Emirates Better employment opportunities
CanadaBetter employment opportunities AND Experience a different culture
Switzerland New career opportunity
United Kingdom New career opportunity
Hong Kong New career opportunity
China Better employment opportunities
France New career opportunity
23
Economic future
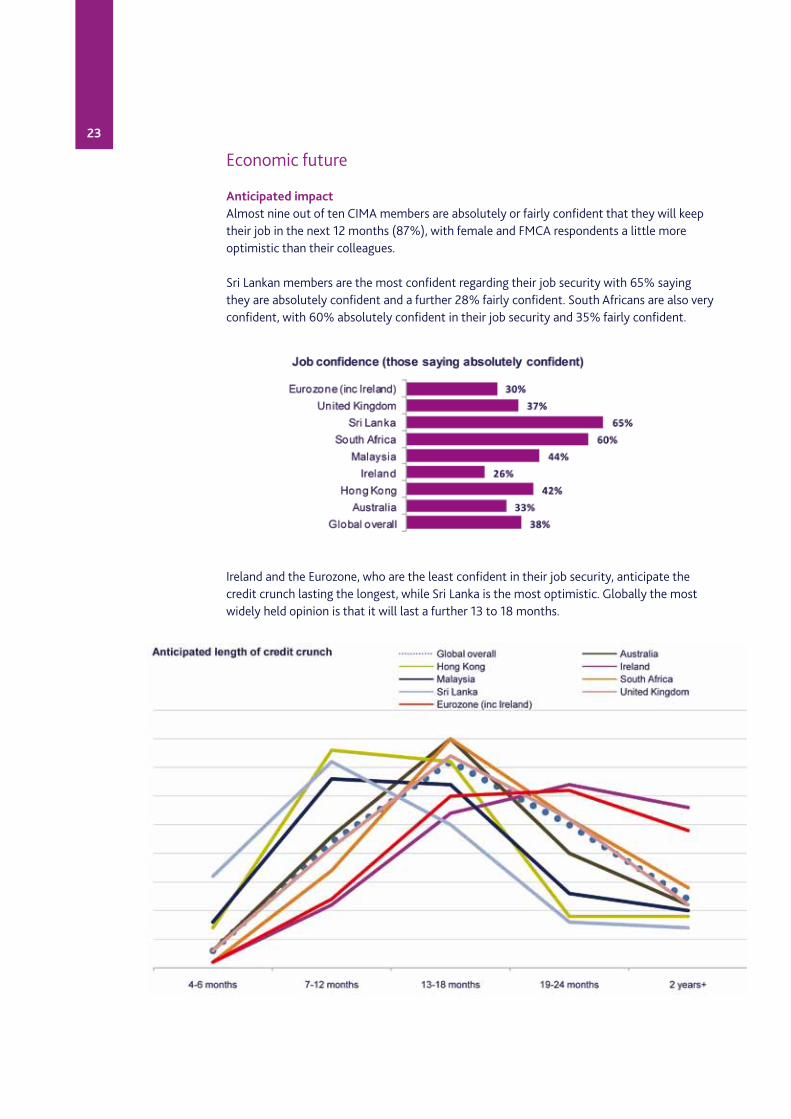
Anticipated impactAlmost nine out of ten CIMA members are absolutely or fairly confident that they will keep their job in the next 12 months (87%), with female and FMCA respondents a little more optimistic than their colleagues.
Sri Lankan members are the most confident regarding their job security with 65% saying they are absolutely confident and a further 28% fairly confident. South Africans are also very confident, with 60% absolutely confident in their job security and 35% fairly confident.
Ireland and the Eurozone, who are the least confident in their job security, anticipate the credit crunch lasting the longest, while Sri Lanka is the most optimistic. Globally the most widely held opinion is that it will last a further 13 to 18 months.
24
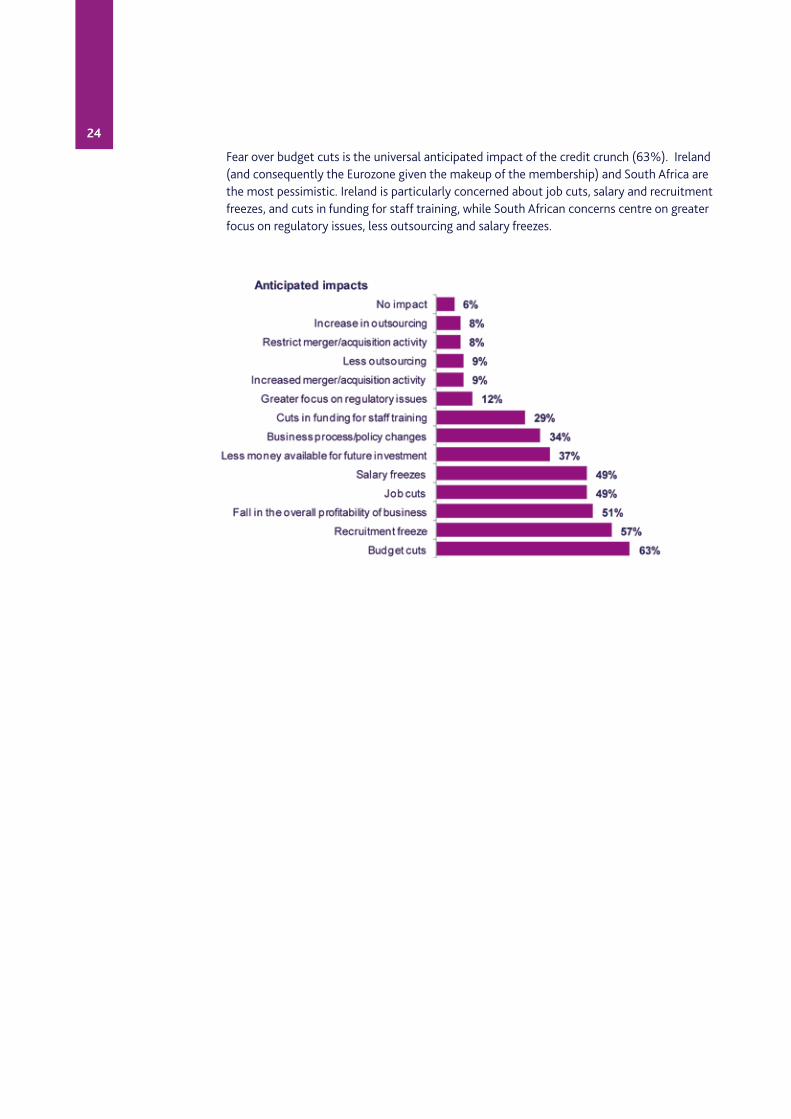
Fear over budget cuts is the universal anticipated impact of the credit crunch (63%). Ireland (and consequently the Eurozone given the makeup of the membership) and South Africa are the most pessimistic. Ireland is particularly concerned about job cuts, salary and recruitment freezes, and cuts in funding for staff training, while South African concerns centre on greater focus on regulatory issues, less outsourcing and salary freezes.
25
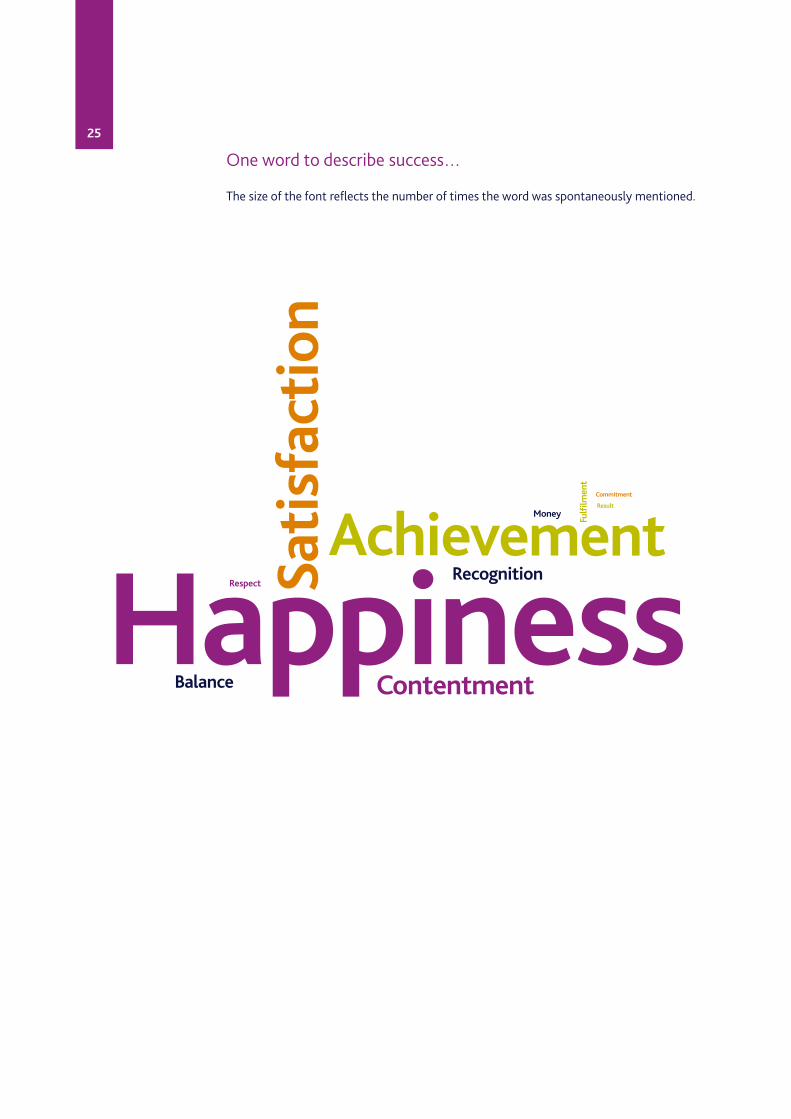
One word to describe success…
The size of the font reflects the number of times the word was spontaneously mentioned.
HappinessAchievement
Satisfaction
Recognition
Balance
Money
Fulfilm
ent
Contentment
Respect
Commitment
Result
26
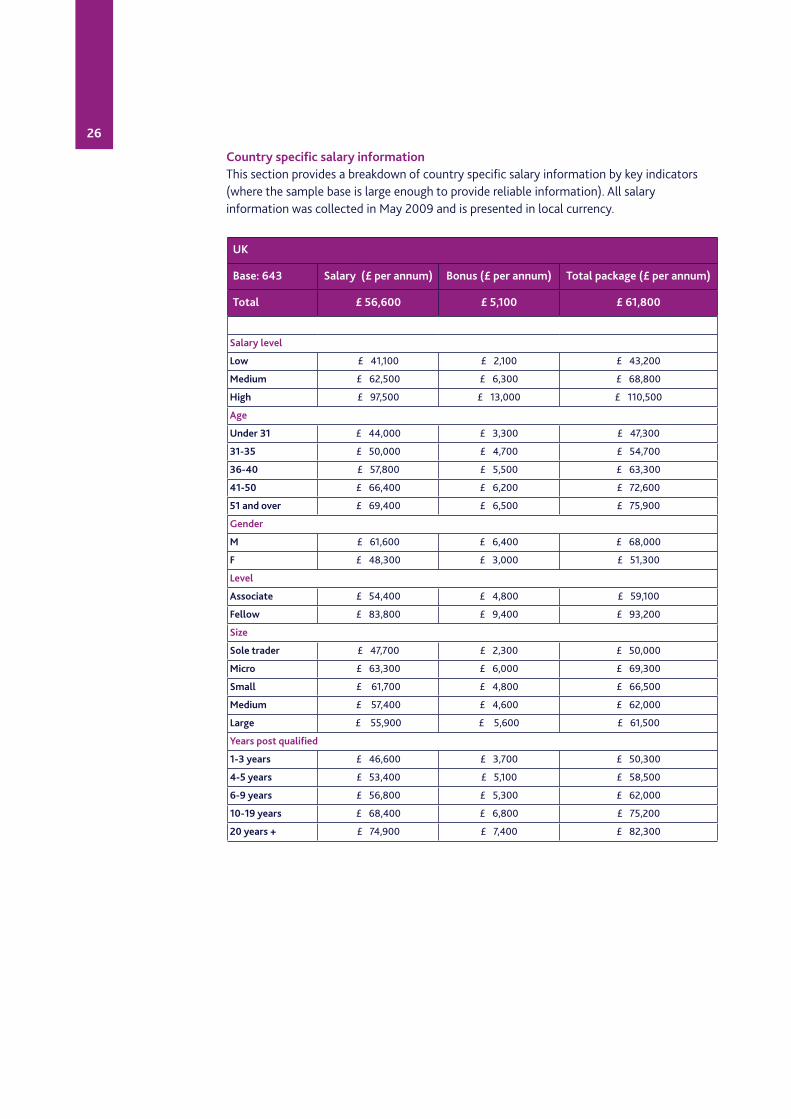
Country specific salary informationThis section provides a breakdown of country specific salary information by key indicators (where the sample base is large enough to provide reliable information). All salary information was collected in May 2009 and is presented in local currency.
UK
Base: 643 Salary (£ per annum) Bonus (£ per annum) Total package (£ per annum)
Total £ 56,600 £ 5,100 £ 61,800
Salary level
Low £ 41,100 £ 2,100 £ 43,200
Medium £ 62,500 £ 6,300 £ 68,800
High £ 97,500 £ 13,000 £ 110,500
Age
Under 31 £ 44,000 £ 3,300 £ 47,300
31-35 £ 50,000 £ 4,700 £ 54,700
36-40 £ 57,800 £ 5,500 £ 63,300
41-50 £ 66,400 £ 6,200 £ 72,600
51 and over £ 69,400 £ 6,500 £ 75,900
Gender
M £ 61,600 £ 6,400 £ 68,000
F £ 48,300 £ 3,000 £ 51,300
Level
Associate £ 54,400 £ 4,800 £ 59,100
Fellow £ 83,800 £ 9,400 £ 93,200
Size
Sole trader £ 47,700 £ 2,300 £ 50,000
Micro £ 63,300 £ 6,000 £ 69,300
Small £ 61,700 £ 4,800 £ 66,500
Medium £ 57,400 £ 4,600 £ 62,000
Large £ 55,900 £ 5,600 £ 61,500
Years post qualified
1-3 years £ 46,600 £ 3,700 £ 50,300
4-5 years £ 53,400 £ 5,100 £ 58,500
6-9 years £ 56,800 £ 5,300 £ 62,000
10-19 years £ 68,400 £ 6,800 £ 75,200
20 years + £ 74,900 £ 7,400 £ 82,300
27
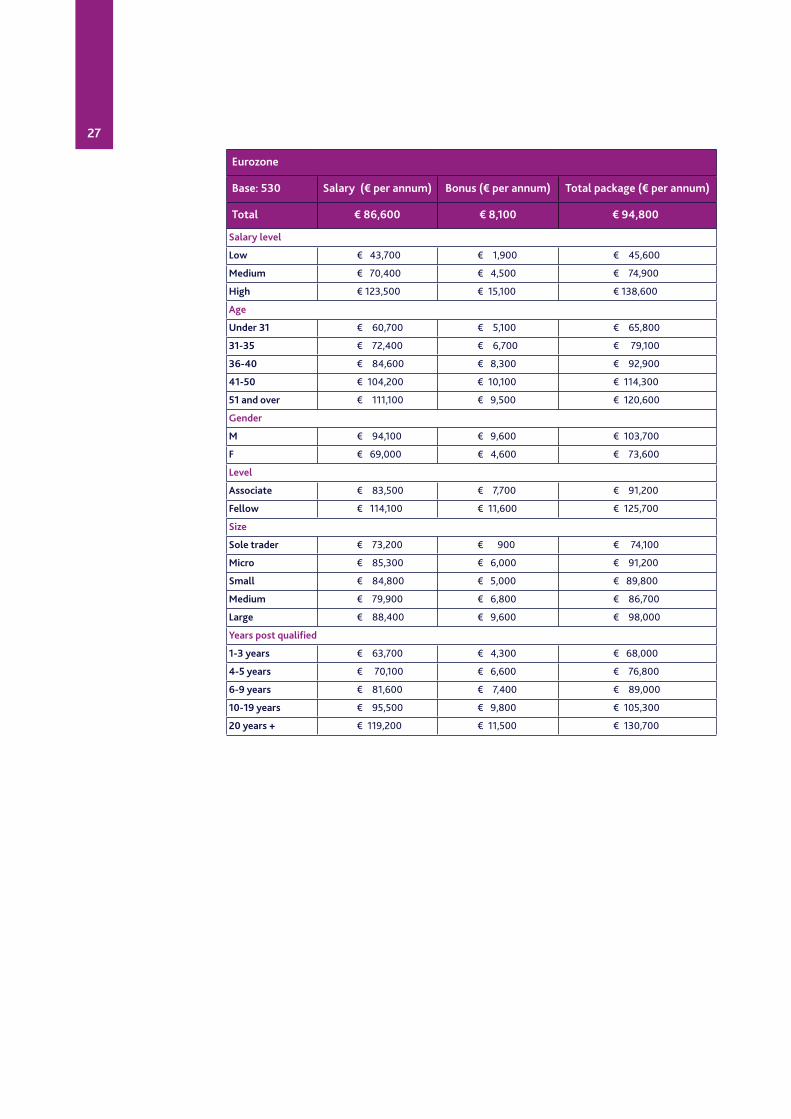
Eurozone
Base: 530 Salary (€ per annum) Bonus (€ per annum) Total package (€ per annum)
Total € 86,600 € 8,100 € 94,800
Salary level
Low € 43,700 € 1,900 € 45,600
Medium € 70,400 € 4,500 € 74,900
High € 123,500 € 15,100 € 138,600
Age
Under 31 € 60,700 € 5,100 € 65,800
31-35 € 72,400 € 6,700 € 79,100
36-40 € 84,600 € 8,300 € 92,900
41-50 € 104,200 € 10,100 € 114,300
51 and over € 111,100 € 9,500 € 120,600
Gender
M € 94,100 € 9,600 € 103,700
F € 69,000 € 4,600 € 73,600
Level
Associate € 83,500 € 7,700 € 91,200
Fellow € 114,100 € 11,600 € 125,700
Size
Sole trader € 73,200 € 900 € 74,100
Micro € 85,300 € 6,000 € 91,200
Small € 84,800 € 5,000 € 89,800
Medium € 79,900 € 6,800 € 86,700
Large € 88,400 € 9,600 € 98,000
Years post qualified
1-3 years € 63,700 € 4,300 € 68,000
4-5 years € 70,100 € 6,600 € 76,800
6-9 years € 81,600 € 7,400 € 89,000
10-19 years € 95,500 € 9,800 € 105,300
20 years + € 119,200 € 11,500 € 130,700
28
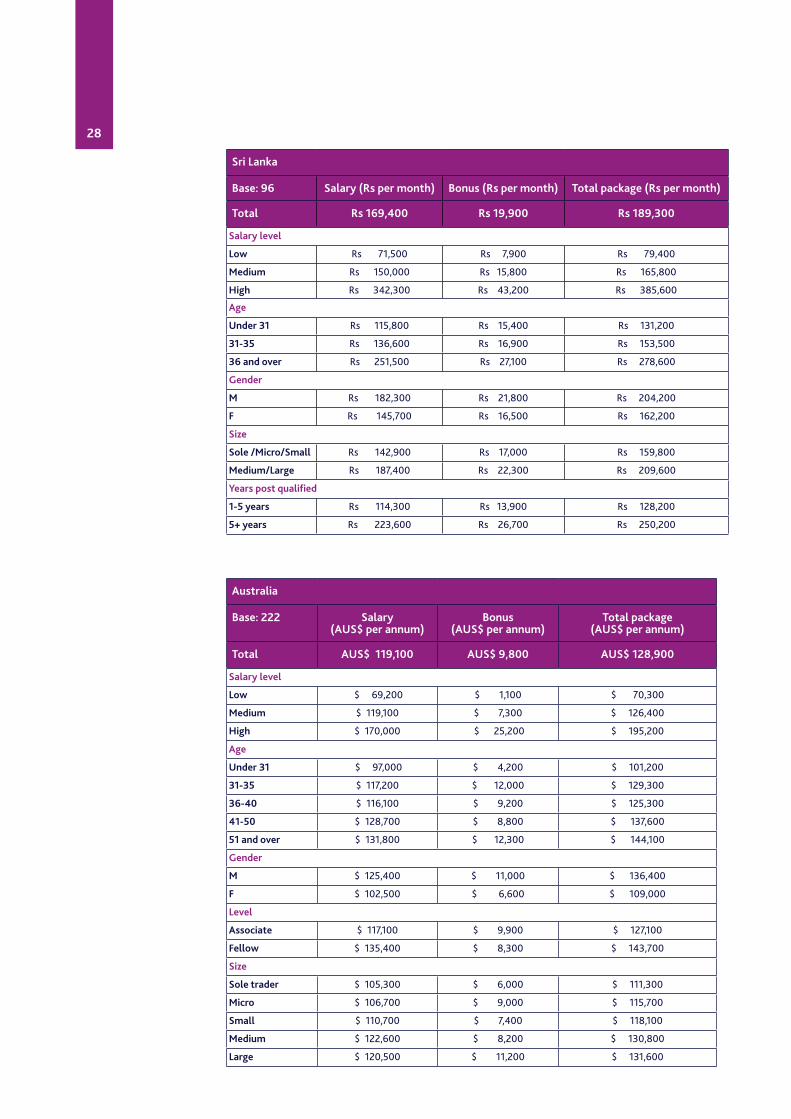
Sri Lanka
Base: 96 Salary (Rs per month) Bonus (Rs per month) Total package (Rs per month)
Total Rs 169,400 Rs 19,900 Rs 189,300
Salary level
Low Rs 71,500 Rs 7,900 Rs 79,400
Medium Rs 150,000 Rs 15,800 Rs 165,800
High Rs 342,300 Rs 43,200 Rs 385,600
Age
Under 31 Rs 115,800 Rs 15,400 Rs 131,200
31-35 Rs 136,600 Rs 16,900 Rs 153,500
36 and over Rs 251,500 Rs 27,100 Rs 278,600
Gender
M Rs 182,300 Rs 21,800 Rs 204,200
F Rs 145,700 Rs 16,500 Rs 162,200
Size
Sole /Micro/Small Rs 142,900 Rs 17,000 Rs 159,800
Medium/Large Rs 187,400 Rs 22,300 Rs 209,600
Years post qualified
1-5 years Rs 114,300 Rs 13,900 Rs 128,200
5+ years Rs 223,600 Rs 26,700 Rs 250,200
Australia
Base: 222 Salary (AUS$ per annum)
Bonus (AUS$ per annum)
Total package (AUS$ per annum)
Total AUS$ 119,100 AUS$ 9,800 AUS$ 128,900
Salary level
Low $ 69,200 $ 1,100 $ 70,300
Medium $ 119,100 $ 7,300 $ 126,400
High $ 170,000 $ 25,200 $ 195,200
Age
Under 31 $ 97,000 $ 4,200 $ 101,200
31-35 $ 117,200 $ 12,000 $ 129,300
36-40 $ 116,100 $ 9,200 $ 125,300
41-50 $ 128,700 $ 8,800 $ 137,600
51 and over $ 131,800 $ 12,300 $ 144,100
Gender
M $ 125,400 $ 11,000 $ 136,400
F $ 102,500 $ 6,600 $ 109,000
Level
Associate $ 117,100 $ 9,900 $ 127,100
Fellow $ 135,400 $ 8,300 $ 143,700
Size
Sole trader $ 105,300 $ 6,000 $ 111,300
Micro $ 106,700 $ 9,000 $ 115,700
Small $ 110,700 $ 7,400 $ 118,100
Medium $ 122,600 $ 8,200 $ 130,800
Large $ 120,500 $ 11,200 $ 131,600
29
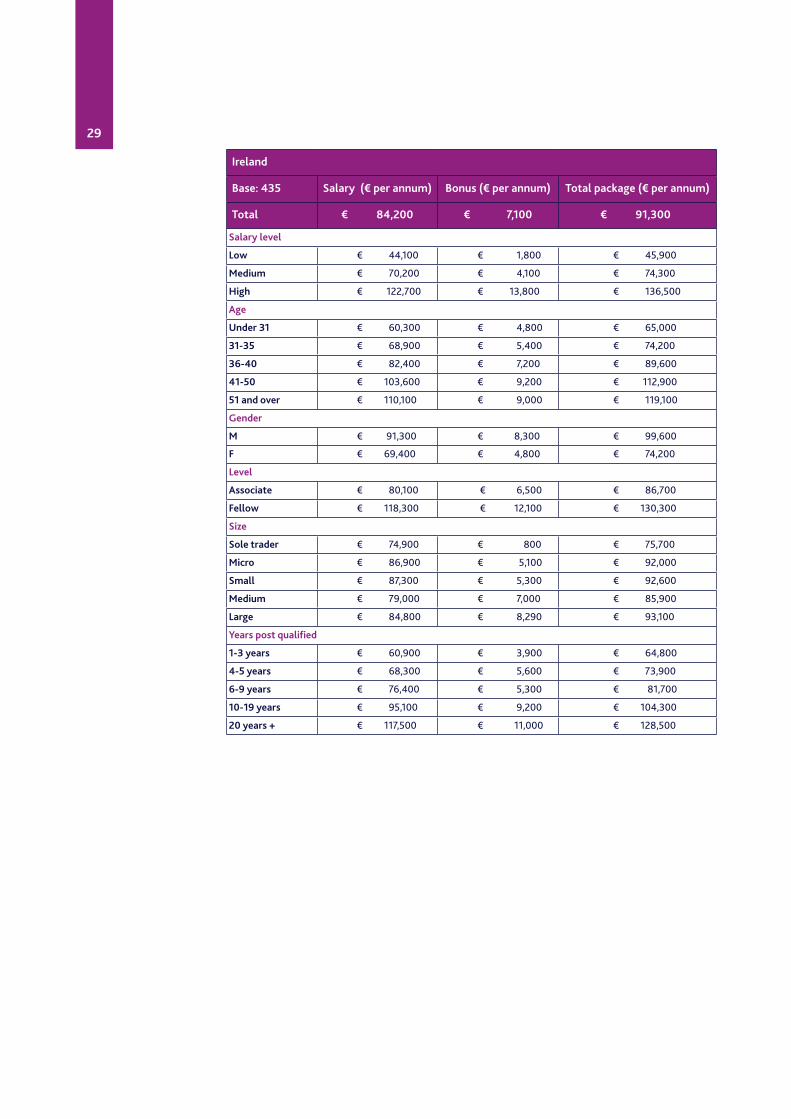
Ireland
Base: 435 Salary (€ per annum) Bonus (€ per annum) Total package (€ per annum)
Total € 84,200 € 7,100 € 91,300
Salary level
Low € 44,100 € 1,800 € 45,900
Medium € 70,200 € 4,100 € 74,300
High € 122,700 € 13,800 € 136,500
Age
Under 31 € 60,300 € 4,800 € 65,000
31-35 € 68,900 € 5,400 € 74,200
36-40 € 82,400 € 7,200 € 89,600
41-50 € 103,600 € 9,200 € 112,900
51 and over € 110,100 € 9,000 € 119,100
Gender
M € 91,300 € 8,300 € 99,600
F € 69,400 € 4,800 € 74,200
Level
Associate € 80,100 € 6,500 € 86,700
Fellow € 118,300 € 12,100 € 130,300
Size
Sole trader € 74,900 € 800 € 75,700
Micro € 86,900 € 5,100 € 92,000
Small € 87,300 € 5,300 € 92,600
Medium € 79,000 € 7,000 € 85,900
Large € 84,800 € 8,290 € 93,100
Years post qualified
1-3 years € 60,900 € 3,900 € 64,800
4-5 years € 68,300 € 5,600 € 73,900
6-9 years € 76,400 € 5,300 € 81,700
10-19 years € 95,100 € 9,200 € 104,300
20 years + € 117,500 € 11,000 € 128,500
30
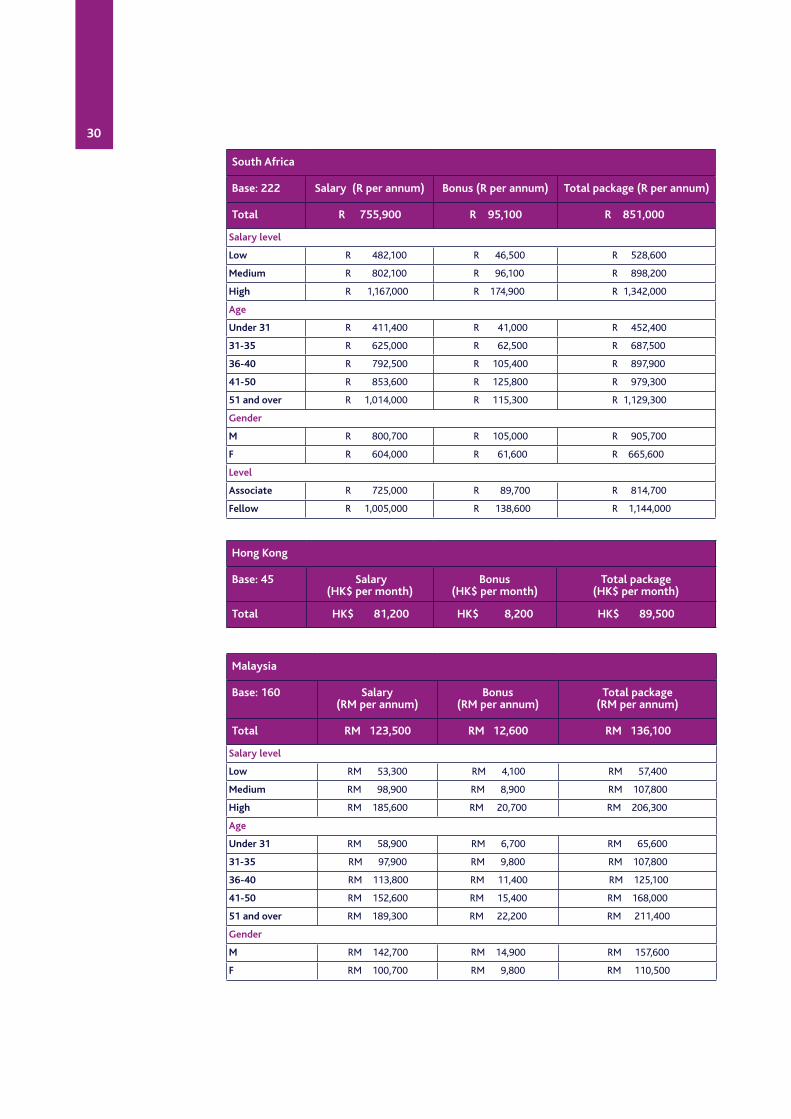
South Africa
Base: 222 Salary (R per annum) Bonus (R per annum) Total package (R per annum)
Total R 755,900 R 95,100 R 851,000
Salary level
Low R 482,100 R 46,500 R 528,600
Medium R 802,100 R 96,100 R 898,200
High R 1,167,000 R 174,900 R 1,342,000
Age
Under 31 R 411,400 R 41,000 R 452,400
31-35 R 625,000 R 62,500 R 687,500
36-40 R 792,500 R 105,400 R 897,900
41-50 R 853,600 R 125,800 R 979,300
51 and over R 1,014,000 R 115,300 R 1,129,300
Gender
M R 800,700 R 105,000 R 905,700
F R 604,000 R 61,600 R 665,600
Level
Associate R 725,000 R 89,700 R 814,700
Fellow R 1,005,000 R 138,600 R 1,144,000
Hong Kong
Base: 45 Salary (HK$ per month)
Bonus (HK$ per month)
Total package (HK$ per month)
Total HK$ 81,200 HK$ 8,200 HK$ 89,500
Malaysia
Base: 160 Salary (RM per annum)
Bonus (RM per annum)
Total package (RM per annum)
Total RM 123,500 RM 12,600 RM 136,100
Salary level
Low RM 53,300 RM 4,100 RM 57,400
Medium RM 98,900 RM 8,900 RM 107,800
High RM 185,600 RM 20,700 RM 206,300
Age
Under 31 RM 58,900 RM 6,700 RM 65,600
31-35 RM 97,900 RM 9,800 RM 107,800
36-40 RM 113,800 RM 11,400 RM 125,100
41-50 RM 152,600 RM 15,400 RM 168,000
51 and over RM 189,300 RM 22,200 RM 211,400
Gender
M RM 142,700 RM 14,900 RM 157,600
F RM 100,700 RM 9,800 RM 110,500
31
Technical information
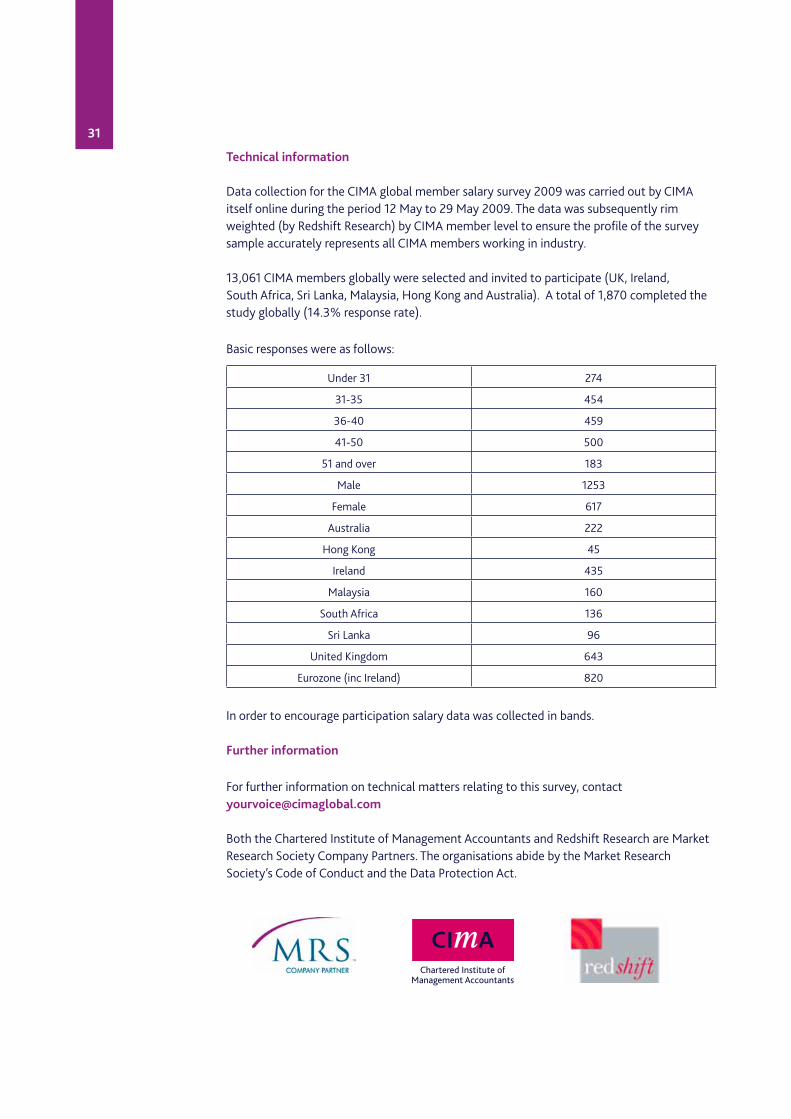
Data collection for the CIMA global member salary survey 2009 was carried out by CIMA itself online during the period 12 May to 29 May 2009. The data was subsequently rim weighted (by Redshift Research) by CIMA member level to ensure the profile of the survey sample accurately represents all CIMA members working in industry.
13,061 CIMA members globally were selected and invited to participate (UK, Ireland, South Africa, Sri Lanka, Malaysia, Hong Kong and Australia). A total of 1,870 completed the study globally (14.3% response rate).
Basic responses were as follows:
In order to encourage participation salary data was collected in bands.
Further information
For further information on technical matters relating to this survey, contact [email protected]
Both the Chartered Institute of Management Accountants and Redshift Research are Market Research Society Company Partners. The organisations abide by the Market Research Society’s Code of Conduct and the Data Protection Act.
Under 31 274
31-35 454
36-40 459
41-50 500
51 and over 183
Male 1253
Female 617
Australia 222
Hong Kong 45
Ireland 435
Malaysia 160
South Africa 136
Sri Lanka 96
United Kingdom 643
Eurozone (inc Ireland) 820
35
Global contacts
CIMA UK – Head Office26 Chapter StreetLondon SW1P 4NPUnited KingdomT. +44 (0)20 8849 2287 F. +44 (0)20 8849 2450 E. [email protected] www.cimaglobal.com
CIMA AustraliaSuite 1305109 Pitt Street, Sydney NSW 2000AustraliaT. +61 (0)2 9376 9900F. +61 (0)2 9376 9905E. [email protected]/australia
CIMA BotswanaPlot 50676, 2nd Floor, Block BBIFM Building, Fairgrounds Office ParkGaborone, BotswanaPostal Address:PO Box 403475Gaborone, BotswanaTelefax. +267 395 2362F. +267 395 2362 / 397 2982E. [email protected]/ botswana
CIMA ChinaUnit 1905 Westgate Tower1038 Nanjing Road (W)Shanghai 200041P.R.ChinaT. +86 (021) 5528 5119F. +86 (0)21 5228 5120E. [email protected]/chinawww.cncima.com
CIMA DubaiOffice 1, Block 3 Dubai Knowledge Village Dubai UAE T. +97 150 633 0799E. [email protected]
CIMA Hong KongSuites 1414 – 1415 14th Floor Jardine HouseCentral, Hong KongT. +852 2511 2003F. +852 2507 4701E. [email protected]/ hongkong
CIMA India Unit 1-A-1 3rd Floor Vibgyor Towers C-62, G Block Bandra Kurla Complex, Bandra (East) Mumbai 400 051 T. +91 224 237 0100F. +91 224 237 0109
CIMA Ireland45-47 Pembroke RoadBallsbridgeDublin 4T. +353 (0) 1 643 0400F. +353 (0) 1 643 0401E. [email protected]/ ireland
CIMA MalaysiaLots 1.03b and 1.05, Level 1KPMG TOWERFirst AvenueBandar Utama47800 Petaling JayaSalangor Darul Ehsan MalaysiaT. +60 (0)3 7723 0230F. +60 (0)3 7723 0231E. [email protected]/ malaysia
CIMA PakistanNo.201, 2nd Floor Business Arcade Plot No. 27-A Block-6, P.E.C.H.S Shahra-e-faisal Karachi Pakistan T. +92 21 432 23 87/88/89E. [email protected]/pakistan
CIMA Singapore51 Goldhill Plaza #08-02Singapore 308900T. +65 6535 6822F. +65 6534 3992E. [email protected]/ singapore
CIMA South Africa1st Floor, South West Wing 198 Oxford Road Illovo, Johannesburg South AfricaPostal Address:PO Box 745, Northlands 2116, South AfricaT. +27 (0)11 788 8723/0861F. +27 (0)11 788 8724E. [email protected]/ southernafrica
CIMA Sri Lanka356 Elvitigala MawathaColombo 5Sri LankaT. +94 (0)11 250 3880F. +94 (0)11 250 3881E. [email protected]/ srilanka
CIMA Zambia6053, Sibweni RoadNorthmead, LusakaZambiaPostal Address:P.O. Box 30640, Lusaka, ZambiaT. +260 (0)1 290 219F. +260 (0)1 290 [email protected]/ zambia
CIMA’s global offices may change during the year, so please visit the global web links for the most up-to-date contact details. For a full list of global contacts, please visit www.cimaglobal.com/ globalcontacts

36
Chartered Institute ofManagement Accountants26 Chapter StreetLondon SW1P 4NPUnited Kingdom
T. +44 (0)20 7663 5441F. +44 (0)20 7663 5442E. [email protected] CMI001V0709