CIMA BA1 2020...You must obtain a current edition of a Revision / Exam Kit - the CIMA approved...
138
Fundamentals of Business Economics BA1 Cert BA OpenTuition Free resources for accountancy students O 2020 Exams Spread the word about OpenTuition, so that all CIMA students can benefit. How to use OpenTuition: 1) Register & download the latest notes 2) Watch ALL OpenTuition free lectures 3) Attempt free tests online 4) Question practice is vital - you must obtain also Exam Kit from Kaplan or BPP
Transcript of CIMA BA1 2020...You must obtain a current edition of a Revision / Exam Kit - the CIMA approved...

Fundamentals of Business EconomicsBA1Ce
rt BA
OpenTuitionFree resources for accountancy studentsO
2020 Exams
Spread the word about OpenTuition, so that all CIMA students can benefit.
How to use OpenTuition: 1) Register & download the latest notes 2) Watch ALL OpenTuition free lectures 3) Attempt free tests online 4) Question practice is vital - you must obtain
also Exam Kit from Kaplan or BPP

The best things in life are free
To benefit from these notes you must watch the free lectures on the OpenTuition website in which we explain and expand on the topics covered.
In addition question practice is vital!!
You must obtain a current edition of a Revision / Exam Kit - the CIMA approved publisher is Kaplan. It contains a great number of exam standard questions (and answers) to practice on.
We also recommend getting extra questions from BPP - if you order on line, you can use our 20% discount code: bppcima20optu
You should also use the free “Online Multiple Choice Tests” which you can find on the OpenTuition website: http://opentuition.com/cima/
IMPORTANT!!! PLEASE READ CAREFULLY
Only on OpenTuition you can find: Free CIMA notes • Free CIMA lectures • Free CIMA tests • Free tutor support • StudyBuddies • CIMA forums
BA1 Fundamentals of Business Economics1. National income, and the effects of economic growth rates and prices on business 3
2. International trade 19
3. Economic development and globalisation 27
4. Organisations 33
5. Prices 43
6. Market failure and the regulations of markets 55
7. Data and information 61
8. Big data and data analysis 71
9. Financial markets and institutions 87
10. Financial mathematics 99
11. The effects of interest rates and exchange rates on business performance 115
Answers To Tests 121
Answers To Examples 131
2020 Examinations Watch free CIMA BA1 lectures 1

Only on OpenTuition you can find: Free CIMA notes • Free CIMA lectures • Free CIMA tests • Free tutor support • StudyBuddies • CIMA forums
2020 Examinations Watch free CIMA BA1 lectures 2
Only on OpenTuition you can find: Free CIMA notes • Free CIMA lectures • Free CIMA tests • Free tutor support • StudyBuddies • CIMA forums
CHAPTER 1NATIONAL INCOME, AND THE EFFECTS OF ECONOMIC GROWTH RATES AND PRICES ON BUSINESS
1 Introduction to macroeconomicsThe term ‘macroeconomics’ refers to the branch of economics that deals with national and international economics. ‘Microeconomics’, which will be dealt with later, deals with the study of specific markets for products and services.
Macroeconomics therefore covers topics such as:๏ How can the size of a country’s economy be measured?
๏ How could the economy be made to grow?
๏ What is the unemployment rate and what affects this?
๏ What causes inflation and how can inflation be controlled?
๏ What determines currency exchange rates?
๏ How to imports compare to exports?
2 National incomeNational income can be defined as:
the total value a country’s final output of all new goods and services produced in a year.
The word ‘final’ is important. If Company A sold goods to consumers, then the value of those sales would be part of national income. However, if Company A sold to Company B and Company B sold to the public for the same price, then the sales revenue would appear in both company’s accounts and there would be double-counting if both amounts were included in national income. To avoid this, only Company B’s sales would be included in national income.
The higher the national income, the more income is available for a country’s population
There are two main measures of national income:๏ Gross domestic product (GDP)
๏ Gross national product (GNP)
A country’s gross domestic product refers to the total value of income or production taking place in that country. It is calculated as:
GDP = Household spending +
Capitalinvestment
spending+ Government
spending +Exports of goods and
services–
Imports ofgoods and
services
2020 Examinations Watch free CIMA BA1 lectures 3

Only on OpenTuition you can find: Free CIMA notes • Free CIMA lectures • Free CIMA tests • Free tutor support • StudyBuddies • CIMA forums
A country’s gross national product takes into account income earned from abroad and also profits earned in a country being sent to foreign investors. The difference between income being earned abroad and profits being remitted to overseas investors is called the net property income from abroad. So
GNP = GDP + Net profit income from abroad
3 The circular flow of incomeIf an item is sold for €50, then that amount appears in two places:๏ The amount spent by the consumer (consumption or expenditure)
๏ The amount received by the seller (income)
The consumption (expenditure) and income must be equal.
Of course, there is another set of flows. Companies employ people and pay wages whilst employees can use their wages to buy goods from companies. Recognition of these two sets of flows (wages/labour, sales of goods/purchases of goods) gives rise to the circular flow of income.๏ Households provide: labour, land, capital (together known as factors of production)
๏ Firm provides: wages, rent, interest
๏ Firms: produce goods or provide services
๏ Households: pay for the goods and services
Goods
Households
Spending/consumption
Income Factors
Firms
As well as money, goods, services and factors of production moving between firms and households, there are injections and withdrawals (or leakages) from the system.
Injections: ๏ Government spending
๏ Exports (money comes from abroad)
๏ Investment (this is expenditure on goods in addition to household spending).
Withdrawals:๏ Taxation
๏ Savings (for example, money is earned, but simply kept and accumulated)
๏ Imports (money goes abroad)
Injections will increase the circular flow of income (for example, money flowing into the country from the sale of exports). Similarly, withdrawals will decrease the circular flow (for example, more people deciding to save).
2020 Examinations Watch free CIMA BA1 lectures 4

Only on OpenTuition you can find: Free CIMA notes • Free CIMA lectures • Free CIMA tests • Free tutor support • StudyBuddies • CIMA forums
If an economy is in equilibrium (meaning that the circular flows are constant) then injections into the economy must stimulate the economy. For example, if the government suddenly printed more money and injected it into the economy by giving each person €10 to spend, then that additional money could be spent on goods and services, increasing both consumption and the supply of goods. To supply more goods, more factors of production would be bought, increasing the population’s income until a new equilibrium point is reached.
4 Aggregate supply and demandAlthough money spend by consumers (consumption or expenditure) must equal the value of goods sold by suppliers (income) this does not mean that the demand for goods will always equate to the supply of goods. A product could be very popular but suppliers are not able to keep up with that demand. The imbalance between supply and demand can occur at the macro-economic level also:๏ Aggregate demand: the total demand in the economy for goods and services; it is the total
desired demand.
๏ Aggregate supply: the total supply of goods and services in the economy.
Aggregate demand would increase as prices decrease: lower prices stimulates demand. Aggregate supply increases as prices increase: higher prices will encourage firms to produce more.
An equilibrium (or balance) is reached when aggregate demand and aggregate supply are equal: enough is produced to exactly meet demand.
Let’s see what happens if these are not equal. Assume that because the economic situation had been a little uncertain, consumers had decided to save some of their income in case of redundancy. Then the economy picks up and consumers have more confidence to spend their savings. Suddenly aggregate demand would have increased, but the supply of goods might lag behind this sudden increase in demand. The likely effect is that there will be price rises as consumers are willing to pay more to satisfy their increased demand; production will be increased so that, once again supply will satisfy demand – but at a slightly higher price
The following graph shows what happens:
Prices
Output
Aggregate Demand 1
Aggregate Demand 2
Aggregate supply
AB
2020 Examinations Watch free CIMA BA1 lectures 5

Only on OpenTuition you can find: Free CIMA notes • Free CIMA lectures • Free CIMA tests • Free tutor support • StudyBuddies • CIMA forums
We start at point A. Aggregate supply and aggregate demand meet at this point: the quantity supplied matches the quantity of goods demanded.
When confidence in the economy rises and people are willing to spend more money, the aggregate demand shifts to the right from aggregate demand line 1 to line 2. This means that more goods are demanded at a given price.
The extra demand will stimulate producers to supply more and the equilibrium point moves from A to B. Prices are slightly higher. Of course, as production increases, employment will increase, so governments can increase employment by stimulating aggregate demand. Demand can be stimulated by measures such as:๏ Decreasing tax so that consumers are left with more to spend
๏ Increasing government expenditure (eg the government borrows and spends)
๏ Decreasing interest rates so that it is cheaper for consumers to borrow and spend
Of course, aggregate supply has limits. For example, once everyone is in employment it is difficult to satisfy further demand. Output has reached its limit
Prices
Output
Aggregate Demand 1
Aggregate Demand 2
Aggregate supply
AB
Aggregate supply, showing where full employment is reached and no more goods can be made.
If no further goods can be made, yet demand keeps increasing, there will be a strong upward inflationary pressure on the economy as output cannot adjust to meet demand. On the other hand, if demand is lower than could be met by maximum demand, there is likely to be unemployment.
2020 Examinations Watch free CIMA BA1 lectures 6

Only on OpenTuition you can find: Free CIMA notes • Free CIMA lectures • Free CIMA tests • Free tutor support • StudyBuddies • CIMA forums
Prices
Output
Aggregate Demand 1
Aggregate Demand 2
Aggregate supply
A
C
Full employment
B
At equilibrium point A, aggregate demand is equal to aggregate supply but there is spare productive capacity and there will be unemployment. The line showing aggregate Demand 1 would have to move to the right until it went through point C where full employment would be reached. The rightward move in aggregate demand needed to achieve full employment is known as the deflationary gap.
At equilibrium point B, aggregate demand is higher than the maximum supply available. Output can’t increase so prices rise steeply as a way of making demand and supply match. The line showing aggregate Demand 2 would have to move leftward to go through point C and to achieve matched demand and supply. The distance aggregate demand would have to reduce to achieve the match at point C is known as the inflationary gap.
5 Shifts in the aggregate demand curveThis section is not talking about movement along an aggregate demand curve. Such movements are caused by changes in prices that will increase or decrease demand. We are looking at what causes demand curves to shift to the right (eg Demand line 1 moving to Demand line 2) or to the left.
Shifts to the right increase aggregate demand and is equivalent to an economy growing. Similarly, shifts to the left imply the economy is contracting. Controlling economic growth or contraction will be a key concern of all governments: fast growth can lead to inflation and can suck in imports to meet demand; fast decline can lead to mass unemployment.
2020 Examinations Watch free CIMA BA1 lectures 7

Only on OpenTuition you can find: Free CIMA notes • Free CIMA lectures • Free CIMA tests • Free tutor support • StudyBuddies • CIMA forums
Rightward shifts are caused by:๏ An increase in disposable income. This can be caused by, for example, lower taxes, lower
interest rates, increased welfare payments.
๏ Consumers deciding to save less (known as a lower marginal propensity to save).
๏ Increased government spending
๏ A more relaxed monetary policy (for example, the government simply printing more money
๏ A change in net exports. When a country’s exchange rate weakens, its exports become cheaper to foreign buyers and this stimulates demand in the economy as more goods are demanded by overseas buyers.
Leftward shifts are caused by:๏ The opposite of each of the above influences
6 InflationInflation is a general increase in prices in an economy and a consequential fall in the purchasing power of money: what can be bought for $1 now cannot be purchased by $1 in one year.
Inflation (in particular high rates of inflation) are undesirable. For example:๏ It hurts people who rely on fixed incomes.
๏ It hurts savers (the purchasing power of savings declines).
๏ It is very distracting and confusing (for example, employees spend huge effort negotiating pay increases to cover inflation).
The causes of inflation are:๏ Demand pull. Aggregate demand is higher than the aggregate supply.
๏ Cost push. An example of cost push inflation is where people in the manufacturing industry, let’s say coal mining, have a large wage rise. Inevitably that wage rise is passed on and will find itself reflected in the cost, say, of electricity. The cost of electricity goes up and that’s an example of cost push inflation.
๏ Import cost inflation. A good example of that was the huge increase in the cost of oil that happened towards the end of 2008.
๏ Expectation. This is where people expect there to be inflation and because they expect inflation, they make higher wage demands and the higher wage demands inevitably push up the price of goods that are going to be sold.
๏ Increase in the money supply. An increase in the money supply will stimulate demand. More people have money to buy goods and this will cause demand pull inflation.
Governments attempt to reduce high inflation by means such as:๏ Increasing interest rates so that it is harder to borrow to buy goods. Additionally, mortgage
payers will have less disposable income after paying their monthly instalments.
๏ Legislation to limit wage rises
๏ Cutting back government expenditure to lower aggregate demand
2020 Examinations Watch free CIMA BA1 lectures 8

Only on OpenTuition you can find: Free CIMA notes • Free CIMA lectures • Free CIMA tests • Free tutor support • StudyBuddies • CIMA forums
7 Measures of inflation
7.1 IntroductionInflation is measured using indices. So, if a product cost $210 in 2017 and $231 in 2018, the inflation index over would be calculated as:
Inflation price index = Price in 2018/Price in 2017 = $231/$210 x 100 = 110.
2017 is the base year, and an index of 110 implies an inflation rate of 10%.
7.2 Compound indicesThere is no problem calculating inflation indices for individual products, but it gets more interesting when trying to work out how inflation affects consumers as they they purchase a wide range of products. The solution is to construct an index which takes into account typical patterns of consumption. For example, in the UK, the Government maintains a Consumer Price Index (CPI) based on a representative ‘basket’ of goods, including items such as food, heating, travel, clothing and entertainment.
Of course, over time, the contents of the ‘basket’ will change as spending habits change. For example, mobile phone costs will be included now whereas 30 years ago, they wouldn’t have been. Similarly, different foods will have increased and decreased in popularity and cigarettes have become less important for many populations.
So, both prices and quantities of goods and services can change and this means that there are different types of index:๏ Base year quantities or base year values (Laspayre indices)
๏ Current year quantities or current year values (Paasche indices)
Example:
Base yearBase year Current yearCurrent yearProducts Quantity Unit price $ Quantity Unit price $
A 20 2.00 30 2.50B 50 3.00 60 4.00
๏ Base-year weighted quantity index
Index =∑(Current year price x Base year quantity)
=(2.50 x 20 + 4.00 x 50)
= 1.316Index =∑(Base year price x Base year quantity)
=(2.00 x 20 + 3.00 x 50)
= 1.316
๏ Current-year weighted value index
Index =∑(Current year price x Current year quantity)
=(2.50 x 30 + 4.00 x 60)
= 1.312Index =∑(Base year price x Current year quantity)
=(2.00 x 30 + 3.00 x 60)
= 1.312
2020 Examinations Watch free CIMA BA1 lectures 9

Only on OpenTuition you can find: Free CIMA notes • Free CIMA lectures • Free CIMA tests • Free tutor support • StudyBuddies • CIMA forums
7.3 Chain indexesInstead of relating prices back to a constant base year, it is also possible to create chain indices where each index is an update on the previous year’s prices.
So:
Year 2016 2017 2018 2019
Price $ 150 164 172 195Index based on the previous year
164/150
= 1.093
172/164
= 1.049
195/172
= 1.134
Multiplying the indices together gives:
1.093 x 1.049 x 1.134 = 1.300
Which is the overall increase from 2016 to 2019: 195/150 = 1.300
7.4 Using indices to remove inflation from a seriesWhen comparing one year’s national income to another’s (or even sales made by a company to sales made by the company in a previous year) inflation can distort the true measure of growth because inflation does not represent true growth.
Indices can be used to rebase each year’s figures do remove the effect of inflation. This can be done either by converting all figures to present day amounts or by removing inflation from the later figures. For example:
2016 2017 2018Sales $m 1545 1555 1563Inflation index 100 112 119
Update to 2018 amounts
OR:
1545 x 119/100
= 1839
1555 x 119/112
= 1652
(already in 2018 amounts)
= 1563
Remove inflation to present figures in 2016 amounts
(already in 2016 amounts)
= 1545
1555 x 100/112
= 1388
1563 x 100/119
= 1313
Either method of adjustment shows that real growth in sales was illusory: after taking inflation into account, sales values have fallen markedly.
2020 Examinations Watch free CIMA BA1 lectures 10

Only on OpenTuition you can find: Free CIMA notes • Free CIMA lectures • Free CIMA tests • Free tutor support • StudyBuddies • CIMA forums
8 Trade cycles
8.1 The componentsA trade cycle is composed of periods of good trade characterised by rising prices and low unemployment percentages alternating with periods of bad trade characterised by falling prices and high unemployment percentages (Keynes).
Output
Time
TroughExpansion Recession Expansion
Peak / boomPeak / boom
Trend
Trough
During expansion, manufacturing and spending are increasing. There is a danger of high inflation as demand exceeds supply and the prices of materials and labour are bid up. Imports are likely to increase. Public finances are good because increased profits and employment yields increased tax.
During recessions, economies shrink. Businesses are likely to fail and unemployment will increase. Inflation might fall – though there is a phenomenon known as ‘stagflation’ which is characterised by high inflation together with high unemployment and stagnant demand in a country's economy. Imports are likely to fall.
In boom periods economies are likely to ‘overheat’ with asset prices (shares, property etc) becoming overvalued, only to cause large losses when a recession sets in.
2020 Examinations Watch free CIMA BA1 lectures 11

Only on OpenTuition you can find: Free CIMA notes • Free CIMA lectures • Free CIMA tests • Free tutor support • StudyBuddies • CIMA forums
8.2 Government responses to stages in the trade cycle
Expansion and boom
Attempt to prevent the economy overheating and inflation and prices roaring away. For example:๏ Increase interest rates to make borrowing (and hence the spending of borrowed money) less
attractive.
๏ Increase taxation
๏ Reduce government spending
๏ Decrease the money supply by tightening bank lending rules.
Recession
Attempt to stimulate the economy so that employment and incomes increase. For example:๏ Decrease interest rates.
๏ Decrease tax.
๏ The government can borrow money to increase its expenditure.
๏ Increase the money supply be relaxing bank lending rules.
9 Public finance
9.1 IntroductionPublic finance refers to how the government raises money and spends it.
9.2 Raising moneyGovernments can obtain money by:๏ Taxation
๏ Borrowing
๏ Selling state assets (privatisation)
๏ Printing more money/quantitative easing
9.3 TaxationTaxes can be described as:๏ Regressive.
๏ Proportional.
๏ Progressive.
A regressive tax takes a higher proportion of a poor person’s salary than it does for a rich person. A simple example is VAT. If the VAT rate is 20% it doesn’t matter whether you are rich or poor you still pay 20% on a purchase and that is proportionally more taken from a poor person’s pay than it is from a rich person’s income.
A proportional tax takes exactly the same proportion of income tax from all levels of income. So you could have a flat rate tax which taxes everyone at say 10% from the very first dollar earned, up to millions of dollars.
2020 Examinations Watch free CIMA BA1 lectures 12

Only on OpenTuition you can find: Free CIMA notes • Free CIMA lectures • Free CIMA tests • Free tutor support • StudyBuddies • CIMA forums
A progressive tax takes a higher proportion of income as income rises. So maybe for the first $1,000 of income the tax rate is zero, for the next $4,000 of income the tax rate is 20%, and anything beyond that is taxed at say 40%. A progressive tax would obviously be more effective at redistributing wealth and income than either a regressive or a proportional tax.
Taxes can also be described as direct or indirect:๏ A direct tax is paid directly by a person to the revenue authority. A good example is income
tax. A certain proportion of your income goes directly to the revenue authority.
๏ An indirect tax is collected by the revenue authority from an intermediary, normally a supplier of some sort. A good example of an indirect tax is VAT. You buy something, you pay over the total purchase price, and then the seller passes some of that on to the government.
Some taxes are charged as a fixed sum per unit sold. So if you were to buy a bottle of wine it doesn’t matter whether it costs $5, $10 or $25; a fixed sum will go to the government.
An ad valorem tax is charged as a fixed percentage of the price of the good. A good example of an ad valorem tax is VAT
9.4 BorrowingGovernments raise funds by selling government bonds and treasury bills to investors. Government has to pay interest on its borrowings and this can become a very significant expense when borrowing is high. Governments with very high borrowing can find it difficult to raise more money in this way because investors fear government default. This puts up the interest rate that must be offered.
Most borrowing is repayable after a number of years but some bonds are irredeemable.
Borrowing is used if the government feels that taxes cannot be raised. For example, the government might fear for its popularity. In addition, if the government takes money from consumers through taxes then this will reduce consumer spending. Of course, the government can spend the money raised by taxation, but the economy is unlikely to be stimulated. Borrowing allows the government to spend more while not taking more from consumers and this will stimulate the economy.
9.5 Selling state assetsOver the last several decades it has become common for many countries to privatise businesses which had been owned and run by the government (nationalised industries). The assumption is that governments are not particularly good at running businesses (perhaps because of over-bureaucratic, slow decision-making or through political interference) and that privatised undertakings will be better run and will offer consumers more choice, better service and lower prices. Governments therefore went through a phase of selling of the state gas company, electricity company, water company etc. and this raised substantial revenue. In many economies there now isn’t much left to sell off so this source of funds is negligible.
9.6 Printing moneyGovernments can, through their central banks, ‘print money’ and spend it so introducing it to the economy so that the economy is stimulated. Nowadays this process is called quantitative easing and the extra money is created electronically.
Quantitative easing is used when economies are in a poor shape and need stimulating. If an economy was doing well releasing more money through quantitative easing will cause inflation and will reduce the purchasing power of money, penalising, in particular, savers and those on fixed incomes.
2020 Examinations Watch free CIMA BA1 lectures 13

Only on OpenTuition you can find: Free CIMA notes • Free CIMA lectures • Free CIMA tests • Free tutor support • StudyBuddies • CIMA forums
10 Government approaches to controlling the economy
10.1 Fiscal policyThe word “fisc” is an old word which referred to the king’s purse. ๏ Where does the state get the money from?
๏ Where does it spend it?
If the state wants to spend money it either has to raise income through taxes or borrow money. If it wants to reduce taxes it either has to reduce expenditure or borrow money.
The three have to be in balance and how this is achieved is the government’s fiscal policy
Government spending
Taxation Borrowing
In the current recession governments are seeking to spend more money and therefore to put money into the economy to try to stimulate it. However, if they spend more by raising taxes they may actually not end up putting very much more money into the economy. They are taking with one hand and giving away with the other. So what most governments are doing is increasing government borrowing. Keep taxes the same; borrow money, spend it, once it’s spent it will be earned by people who will spend it again. And that’s the way in which governments hope the recession will be brought to an end.
10.2 Monetary policyThe second way in which governments attempt to control their economies is by their monetary policy: managing the supply of money in the economy. The more money in the economy the more economies are likely to be stimulated.
There are two main weapons.๏ Interest rates. If interest rates are very high people will tend not to want to borrow money. If
you don’t borrow money you can’t spend it, and if you can’t spend it then demand pull inflation will be relatively low. If, however, you greatly reduce the interest rates more people will be encouraged to borrow. They spend that borrowed money on televisions, cars, houses, whatever. Once it’s spent the money is in the economy, other people earn it, demand goes up, and the economy is stimulated.
๏ Credit controls. This is a control over institutions, typically banks, on how much they are allowed to lend. So, for example, if you put $1,000 into a bank and the reserve requirement was only 10%, that means that the bank could lend $900 out of the $1,000 deposited. That $900 could be deposited again and the bank could lend on $810 and so on. Therefore, the initial deposit of $1,000 can create a much higher amount of money in the economy. Say however that the reserve requirement was 50% - $1,000 in the bank; the bank only lend on $500. That $500 is put into another account, the bank can lend on only $250 and so on. You can see that at the end of the cycles a much smaller amount of money will be created in the economy.
2020 Examinations Watch free CIMA BA1 lectures 14

Only on OpenTuition you can find: Free CIMA notes • Free CIMA lectures • Free CIMA tests • Free tutor support • StudyBuddies • CIMA forums
11 The multiplierLet’s say that a government introduces $100m into the economy by employing additional doctors in a state health service. The extra doctors will receive salaries from the government and will spend some and save some of their earnings.
Let’s say they spend 75% and save 25% (25% is known as the marginal propensity to save).
So, $75m is spend by doctors and earned by other people or firms. If they also had a marginal propensity to save, they would spend 75% x $75m = $56.25, and so on. The total additional expenditure will therefore be:
Round Spent ($m)
1 100.002 75.003 56.254 42.195 31.646 23.737 etc
It can be shown that the sum of these amounts is:
Initial expenditure x 1/Marginal propensity to save = $100m/0.25 = $400m
So, the effect of the initial $100m is multiplied. This effect can make government intervention – or any other way in which the economy is stimulated - very effective. Success breeds success and once the economy starts to grow it can therefore grow rapidly until the factors of production run out.
Of course, the effect works the other way. If a government reduces expenditure, this is not just felt once by affects a whole chain of consumption, and the economy can quickly decline.
2020 Examinations Watch free CIMA BA1 lectures 15

Only on OpenTuition you can find: Free CIMA notes • Free CIMA lectures • Free CIMA tests • Free tutor support • StudyBuddies • CIMA forums
Tests
Question 1
What word should fill the blanks, below?
National income is the total value a country’s _____________ output of all new goods and services produced in a year
Question 2
Which one of the following is the correct definition for gross domestic product?
A GDP =Household spending
+ Capitalinvestment spending
+ Government spending
+ Exports of goods and
services
+ Imports ofgoods and
services
B GDP =Household spending
+ Capitalinvestment spending
+ Government spending
- Exports of goods and
services
- Imports ofgoods and
services
C GDP =Household spending
+ Capitalinvestment spending
+ Government spending
- Exports of goods and
services
+ Imports ofgoods and
services
D GDP =Household spending
+ Capitalinvestment spending
+ Government spending
+ Exports of goods and
services
- Imports ofgoods and
services
Question 3
In the circular flow of income, there are some injections and withdrawals. Label each of the following:
Injection WithdrawalTaxExportsImportsSavingsGovernment spending
Question 4
A tax which raises the same amount from each person irrespective of their income is known as a(n):
A Progressive tax
B Regressive tax
C Ad valorem tax
D Income tax
2020 Examinations Watch free CIMA BA1 lectures 16

Only on OpenTuition you can find: Free CIMA notes • Free CIMA lectures • Free CIMA tests • Free tutor support • StudyBuddies • CIMA forums
Question 5
If a population has a marginal propensity to save of 0.2 and the government injects $100m into the economy, how much additional expenditure will result?
Question 6Prices
Output
Aggregate Demand 1
Aggregate Demand 2
Aggregate supply
AB
In the above diagram, which TWO of the following would move the aggregate demand from position 1 to position 2?
A An increase in prices
B A decrease in prices
C Decreasing interest rates
D Increasing government expenditure
Question 7
When an economy is operating at its maximum output, but aggregate demand is higher, what is the main economic effect?
_______________________________
Question 8
Base yearBase year Current yearCurrent yearProducts Quantity Unit price $ Quantity Unit price $
P 30 4.00 40 5.00Q 50 3.00 60 4.00
What are the:
(a) Base-year weighted quantity index?
(b) Current-year weighted value index?
Question 9
What are the four ways in which governments can raise money?
2020 Examinations Watch free CIMA BA1 lectures 17

Only on OpenTuition you can find: Free CIMA notes • Free CIMA lectures • Free CIMA tests • Free tutor support • StudyBuddies • CIMA forums
2020 Examinations Watch free CIMA BA1 lectures 18

Only on OpenTuition you can find: Free CIMA notes • Free CIMA lectures • Free CIMA tests • Free tutor support • StudyBuddies • CIMA forums
CHAPTER 2INTERNATIONAL TRADE
1 Introduction to international tradeAlmost every country trades internationally through importing and exporting both goods and services. Other international transactions also occur, such as when a company buys or sells a foreign subsidiary or whenever profits and interest are sent to international investors or lenders.
2 The balance of paymentsThe balance of payments summarises all transactions between a country’s residents and its non-residents
Transactions include import and export of goods and services, payment of interest, payment and receipt of interest and dividends, investment and other transfers of cash and financial instruments.
The balance of payments can be thought of in terms of the following accounts:๏ Current account: mainly flows from the effects of trade and income.
๏ Capital account: flows relating to investments and proceeds from the sale of investments.
๏ Financial account: flows of cash and financial instruments.
These accounts are related as follows:
Current account + capital account = Financial account
For example, if goods are imported, the current account and financial account will be equally affected because money is either paid to or is owed to suppliers. If investments are made abroad, both the financial account and capital accounts are affected. When dividends from the foreign investment are received, the current account and financial accounts are affected.
In practice, errors in data collection mean that the equilibrium is never seen.
Even though the equation should always balance, governments worry about imbalances in each part of the equation. In particular, they worry about trade deficits. A trade deficit is where a country’s imports are consistently higher than its exports.
Does a current account deficit matter?
The USA runs a huge current account deficit; China has a huge current account surplus. The USA is a large net importer of goods whilst China is a large net exporter. These conditions have been present for many years, so do persistent deficits and surpluses matter?
2020 Examinations Watch free CIMA BA1 lectures 19

Only on OpenTuition you can find: Free CIMA notes • Free CIMA lectures • Free CIMA tests • Free tutor support • StudyBuddies • CIMA forums
If the USA is a high net importer from China, then the USA needs continuous supplies of yuan, the Chinese currency, to pay suppliers. How can it obtain these supplies, given that exports to China are negligible? There are three methods:๏ Sell assets to China. For example, companies, gold, other foreign currency holdings
๏ Borrow yuan from China eg issue government bonds to China.
๏ Sell US$ to China in exchange for yuan. However, with floating exchange rates this will have the effect of depressing the value of the dollar and increasing the value of the yuan
Countries run out of assets to sell; borrowing more will mean that there are vast interest payments and a risk of default by the country.
Control of deficits are as follows๏ Selling US$ for yuan should provide a self-regulatory mechanism to the deficit imbalance
because imports will become more expensive, but this mechanism is often not enough to control exchange rates. Exchange rates depend on other factors also such as interest rates, speculators and economic stability.
๏ Deliberate devaluation (where exchange rates are fixed).
๏ Import controls to reduce the value of goods imported
๏ Deflation – reducing domestic demand so that consumers buy less in general – including less imports.
๏ Producing goods that will successfully compete with imports and which can themselves be exported. This is known as a supply-side mechanism because the supply of goods if adjusted.
2 Reasons for international tradeInternational trade occurs for the following reasons:๏ Natural resources. If a country does not have the natural resources it requires it has to import
them. For example, many countries do not have their own supplies of oil and gas so must import these from countries that do.
๏ Access to low labour costs for production.
๏ Economies of scale. Supplying, say, 10 million phones to the world is likely to be cheaper per phone than just supplying 1m to your home consumers. Research and development costs are spread more thinly and vast factories can be used to for efficient production.
๏ Skills. Countries often develop particular skills to a very high level and this can make their products and services better than are available elsewhere. For example, the UK has high financial skills; the US and Europe have high civilian aerospace skills (Boeing and Airbus), Japan has high skills in optics (Nikon, Canon, Olympus etc).
๏ Unique products. If a pharmaceutical company in one country discovers a uniquely valuable drug, then doctors and patients in other countries will want to import it.
Many of the reasons for international trade can be explained by the theories of absolute advantage and comparative advantage.
Absolute advantage
A country has absolute advantage when it performs a task more efficiently than producers in other countries. For example, because of its climate, Spain is extremely efficiency at producing oranges, lemons, olives and tomatoes. It will always be able to produce these goods more efficiently that
2020 Examinations Watch free CIMA BA1 lectures 20

Only on OpenTuition you can find: Free CIMA notes • Free CIMA lectures • Free CIMA tests • Free tutor support • StudyBuddies • CIMA forums
they can be produced in countries such as the UK or Russia. It makes sense to import these goods from Spain rather than having to artificially heat vast greenhouses in your own country.
Comparative advantage
This is a more subtle concept. Staying with fruit growing in Spain and the UK, say that the output per hectare of ground is as follows:
Units of weight Tomatoes OrangesSpain 1200 800UK 700 10
Spain obviously has absolute advantage when growing both products. Now let’s say that in each country we look at one hectare being planted with tomatoes and another hectare planted with oranges. Assume that the two hectares in each country are the only resources available.
Total output will be:
Units of weight Tomatoes OrangesSpain 1200 800UK 700 10Total 1900 810
However, the UK is much, much, much better at producing tomatoes than oranges, so should specialise wholly in that so that both hectares are used for tomatoes, allowing 2 x 700 = 1400 units of tomatoes to be produced there. If total demand for tomatoes in both countries stays at 1,900, Spain will have to product only 500 units of tomatoes and can shift 7/12 of its tomato production to orange production. This will allow additional orange production of 7/12 x 800 = 467 units.
Total production, with the same total resources of four hectares is now
Units of weight Tomatoes OrangesSpain 500 1267UK 1400 0Total 1900 1267
So total output is much higher and the use of the land much better. Now, of course the UK can export tomatoes to Spain and Spain can export oranges to the UK.
2020 Examinations Watch free CIMA BA1 lectures 21

Only on OpenTuition you can find: Free CIMA notes • Free CIMA lectures • Free CIMA tests • Free tutor support • StudyBuddies • CIMA forums
3 Advantages and disadvantages of international trade
International trade allows:๏ Best use of resources: both absolute and comparative advantage.
๏ Development of specialisations.
๏ Economies of scale.
๏ Greater competition to drive both competitive pricing and innovation.
๏ Lower prices for consumers.
However, there can be disadvantages – certainly to individual countries:๏ Increased transport cost and carbon footprint as goods are moved.
๏ The ‘export’ of jobs. Goods made abroad and imported will reduce home jobs for that sector.
๏ Strategic weakness. For example, dependence on other countries for food or fuel can be used politically.
๏ Balance of payment difficulties: imports imply that your own currency has to be sold to pay for imports and this can affect exchange rates. (See later.)
๏ Dumping. An exporter has surplus capacity, perhaps only temporarily, and ‘dumps’ goods by exporting them, affecting local companies and local employment.
2020 Examinations Watch free CIMA BA1 lectures 22

Only on OpenTuition you can find: Free CIMA notes • Free CIMA lectures • Free CIMA tests • Free tutor support • StudyBuddies • CIMA forums
4 Control of international tradePutting up impediments to international trade is known as protectionism ie home producers are protected from overseas competition.
Protectionist methods include:๏ Quotas: maximum numbers of units of products that can be imported.
๏ Tariffs and customs duties: effectively a tax on imports making them more expensive and less attractive.
๏ Administration and legal procedures. For example, insisting on very strict inspection of imported goods which adds to cost and delay.
๏ Subsidies: these are given to exporters so that they can compete very effectively and undercut overseas manufacturers. Providing direct subsidies is often not permitted under world trade rules, but they can be provided subtly. For example, if an aircraft manufacturer makes both military and civilian aircraft, the government could pay high prices for military aircraft so that the manufacturer can use profits there to subsidise civil aircraft production.
๏ In general, economists agree that international trade bring great advantages to the world economy. Politically, however, the issues are less clear-cut. This set of notes is being written on the day on which Donald Trump is being inaugurated as the 45th President of the USA. Much of his success in the election was based on ‘bring home American jobs’ and even before inauguration his tweets seem to have altered the plans of some large US companies so that they will build their new factory in the USA rather than in Mexico. The cars built in the USA are likely to be more expensive than those built in Mexico because of higher labour costs. Overall American consumers will lose you because they will have to pay more for cars – but the new factory will provide several thousand jobs for Americans.
๏ The promise to repatriate jobs by placing impediments to importing is very powerful and seductive – particularly amongst blue-collar workers, a category which particularly suffered by off-shoring manufacturing or allowing free import of foreign goods.
2020 Examinations Watch free CIMA BA1 lectures 23
Only on OpenTuition you can find: Free CIMA notes • Free CIMA lectures • Free CIMA tests • Free tutor support • StudyBuddies • CIMA forums
5 Exchange ratesAn exchange rate shows how much one currency is in terms of another. For example:๏ GBP1/USD = 1.34 or GBP1 = USD1.34 or just £1 = $1.34
๏ Means that 1 GB Pound can be changed for 1.34 US dollars
Banks quote exchange rates showing a spread as follows:๏ GBP1 = $1.34 – $1.31
๏ One rate is for changing £ to $ and the other for changing $ to £. Banks always use the rate that leaves customers worst off, so if you went into a bank with £1,000 you would be given only $1,310 in exchange, not $1,340.
๏ Some exchange rates are fixed (or pegged) but most float so that they change constantly. Floating exchange rates present problems for importers and exporters when they are buying or selling in a foreign currency. A UK firm might have agreed to export goods to a USA customer for $10,000 when at the time of the contract the exchange rate was £1 = $1.34. The firm would therefore budget to receive $10,000/1.34 = £7,463. If, however, by the time payment was received, the US$ had weakened so that the exchange rate was £1 = $1.42, the amount received would be worth only $10,000/1.42 = £7,042. There are methods that can be used to eliminate or substantially reduce this uncertainty (covered more fully in Chapter 11).
Apart from difficulties arising from uncertainty in exchange rates, exchange rates have the following effects on businesses:๏ A strengthening home currency makes exports more expensive to foreign buyers and less
competitive. Conversely, a weakening home currency makes exports less expensive and more competitive.
๏ A strengthening home currency makes imports cheaper and these are then more competitive compared to goods domestically produced. Note that a company does not have to import or export itself to suffer from the effect of cheaper imports. Conversely, a weakening home currency makes imports more expensive.
๏ Dividends remitted from foreign subsidiaries become more valuable if the home currency weakens.
๏ Interest to be paid on foreign loans will become more expensive f the home currency weakens.
Exchange rates are affected by the following:๏ Speculation – dealers buying or selling large amount of currency (so affecting the exchange
rate) in the hope of making profits.
๏ Sentiment – a change of government often affects a currency’s value.
๏ International trade affects the supply and demand for currencies and hence their values.
๏ Inflation erodes the purchasing power of a currency. High inflation in a country weakens a currency with respect to the currency of a low-inflation country.
๏ Interest rates – raising interest rates can attract hot money into a country as higher returns can now be earned now on bank deposits. The demand for the currency can be expected to strengthen the currency.
2020 Examinations Watch free CIMA BA1 lectures 24

Only on OpenTuition you can find: Free CIMA notes • Free CIMA lectures • Free CIMA tests • Free tutor support • StudyBuddies • CIMA forums
Tests
Question 1
Fill in the blank:
It makes sense for the UK to import oranges from Spain rather than grow them in greenhouses domestically. In terms of explaining the advantages that can rise from international trade this is known as _________________ advantage.
Question 2
Fill in the blank:
The general name for trying to reduce international trade by quotas, tariffs and other means is known as _____________________________.
Question 3
Which one of the following is NOT an advantage of international trade?
A Greater opportunities for economies of scale
B Exploiting comparative advantage
C Guaranteed access to strategic resources
D Greater competition
Question 4
An exchange rate is quoted as GBP1 =€1.25 –€1.22
If you wanted to change €120,000 to GBP, how many GBP would you receive?
Question 5
If a country’s home currency strengthens, which TWO of the following effects will be experienced?
A The company’s exports will be more competitive
B The company’s exports will be less competitive
C The company might face more competition from imports
D The company might face less competition from imports
Question 6
The current exchange rate between country A$ and country B$ is A$1 = 1.5B$
If country A’s inflation rate is higher than country B’s inflation rate, will the exchange rate move towards A$1 = 1.4B$ or A$1 = 1.6B$
2020 Examinations Watch free CIMA BA1 lectures 25

Only on OpenTuition you can find: Free CIMA notes • Free CIMA lectures • Free CIMA tests • Free tutor support • StudyBuddies • CIMA forums
2020 Examinations Watch free CIMA BA1 lectures 26

Only on OpenTuition you can find: Free CIMA notes • Free CIMA lectures • Free CIMA tests • Free tutor support • StudyBuddies • CIMA forums
CHAPTER 3ECONOMIC DEVELOPMENT AND GLOBALISATION
1 Introduction to economic developmentAs explained in the previous chapter, there are powerful arguments for the advantages of international trade though there are potential political problems. Over the last few decades the progress of globalisation has been fast and many products are now produced internationally by large multi-national companies. Examples include: Apple, Unilever, Burger King, Nike.
2 GlobalisationGlobalisation can be defined as:
“The process by which the countries and businesses throughout the world are becoming increasingly interconnected because of increased trade. Globalisation has increased the production of goods and services. The biggest companies are multi-national companies with subsidiaries in many countries throughout world.”
Globalisation has been caused by:๏ Improved communication (both physical and the transfer of information, for example, over
the Internet).
๏ Political alliances (such as the European Union).
๏ The growth of global industries. Some of this is driven to achieve economies of scale and to allow increasingly complex products to be developed and sold economically.
๏ Cost differentials. For example, making use of low labour costs in some countries.
๏ Trade and political agreements allowing freer movement of goods, money and people.
2020 Examinations Watch free CIMA BA1 lectures 27

Only on OpenTuition you can find: Free CIMA notes • Free CIMA lectures • Free CIMA tests • Free tutor support • StudyBuddies • CIMA forums
3 The effects of globalisationProduction and sales occur internationally. There are various patterns:๏ Sometimes companies make in only one location and export production. For example,
Boeing assembles aircraft only in the USA.
๏ Sometimes companies manufacture almost all their products abroad and the product is then sent through the world – including back to the home country. For example, the majority of Apple iPhones are assembled by Foxconn in China. Most Nike trainers are made in Indonesia, China and Vietnam. The process of sending manufacturing abroad is known as off-shoring.
๏ Alternatively, they can set up many manufacturing operations near their markets and this can reduce transport costs and improve the speed of delivery. For example, there is little point in a company like Coca Cola having all its production in the USA and spending a fortune transferring its product, which by weight is mainly flavoured, carbonated water, across the globe. Local production makes much more sense. Even is not all of a product is made abroad components might be and only assembly is done locally.
๏ Manufacturing or sub-contacting/licensing. Setting up a factory abroad and can be risky because local laws and customs might be misunderstood. An easier way is to sub-contract production to a firm in the country that the products will be sold in. Often the manufacturer is also given marketing rights and a royalty is paid to the company owning the brand or the process. Franchising is another form of international expansion but is rather more hand-on than a simply royalty agreement. For example, many McDonalds branches are franchises where a local business is given the right to set up as a McDonalds outlet. They have to comply closely with McDonalds ways of doing business.
On the downside, many people are becoming increasingly sceptical about the benefits of globalisation as is can be seen as:๏ The export of jobs.
๏ Crushing of local industries by powerful multi-nationals.
๏ Undermining democracy as large multi-national companies are larger, richer and therefore more powerful than many national economies.
2020 Examinations Watch free CIMA BA1 lectures 28

Only on OpenTuition you can find: Free CIMA notes • Free CIMA lectures • Free CIMA tests • Free tutor support • StudyBuddies • CIMA forums
4 Trade agreementsTrade agreements are treaties between countries on their reciprocal tariffs, quotas etc. The purpose of the agreements is to reduce the barriers to trade. For example, two countries could agree to import/export cars from one another without tariffs, or with the same tariffs, so that there is a level playing field. These arrangements should simplify international trade, improve economic efficiency and provide consumers with more choice. They reduce protectionism.
Examples of trade agreements include:๏ European Union (EU) – a customs union, a single market and now with a single currency.
๏ European Free Trade Area (EFTA)
๏ North American Free Trade Agreement (NAFTA) between the USA, Canada and Mexico.
The World Trade Organisation (WTO) is the global international organisation dealing with the rules of trade between nations. The objectives of the World Trade Organisation are to:๏ Reduce the barriers to international trade
๏ Promote free and fair trade through multilateral talks and negotiations
๏ Arbitrate between countries that are in dispute.
5 PESTELPESTEL is a way of appraising the macro-environment of countries. This is important when decisions are being made about whether to invest in a country or to export to it.
PESTEL stands for:๏ Political
๏ Economic
๏ Social
๏ Technological
๏ Ecological
๏ Legal.
2020 Examinations Watch free CIMA BA1 lectures 29

Only on OpenTuition you can find: Free CIMA notes • Free CIMA lectures • Free CIMA tests • Free tutor support • StudyBuddies • CIMA forums
Examples of PESTEL factors, all of which will affect how attractive it is to trade with a country or to set up a manufacturing company there:๏ Political: elections and changes of government, war, European Union expansion, Brexit. For
example, if a country is ruled by a dictator, property rights are likely to be weak and corruption likely to be high.
๏ Economic: interest rates, tax rates, exchange rates, economic boom or recession. Countries often go through different parts of the trade cycle at different times. If a country seems to be coming out of recession and heading towards a period of growth, then that might be a good time to start exporting to there if possible. Similarly, companies can withdraw from countries which are heading for an economic trough.
๏ Social: nowadays the main social trend arises from changes in populations. In most western countries the birth rate has fallen and there is an increasing proportion of elderly people. This can affect recruitment but it can also affect the economies of companies that they have to support a larger number of retirees. It can of course affect the marketing of products. Products suited to older people may become more popular while those suited to younger people may become less popular. However, taste and culture are also important influences. For example, there is little point in trying to export pork products to Muslim countries!
๏ Technological: technological changes often come out of the blue, but once they are invented there is really no turning back. Think how the internet has profoundly affected the fortunes of organisations like travel agents. Think how banks have responded by closing branches and encouraging their clients to do more and more banking online. Some products would require a certain level of technical sophistication in user countries and Amazon has made great use of the Internet to expand internationally.
๏ Ecological: carbon emission restrictions/taxes, more stringent laws governing air and water solution, concern about the possible effects of global warming. Unfortunately, some companies are suspected of locating their manufacturing facilities in countries which have less stringent ecological rules. It is also worth noting that Facebook is currently building a server farm (a very large number of computer storage devices) in Luleå, Sweden. The sub-artic climate there allows Facebook to save large amounts of money by using the naturally cold air into the building to cool overheating servers rather than having to use energy on air-conditioning systems.
๏ Legal: health and safety legislation, equality legislation, regulation of industries, quotas, tariffs, bureaucracy.
2020 Examinations Watch free CIMA BA1 lectures 30

Only on OpenTuition you can find: Free CIMA notes • Free CIMA lectures • Free CIMA tests • Free tutor support • StudyBuddies • CIMA forums
Tests
Question 1
What is meant by the term ‘off-shoring’?
Question 2
What does the following describe?
“The process by which the countries and businesses throughout the world are becoming increasingly interconnected because of increased trade.“
Question 4
What does the ‘S’ in PESTEL stand for?
Question 4
What does the following describe?
“A global international organisation dealing with the rules of trade between nations.”
2020 Examinations Watch free CIMA BA1 lectures 31

Only on OpenTuition you can find: Free CIMA notes • Free CIMA lectures • Free CIMA tests • Free tutor support • StudyBuddies • CIMA forums
2020 Examinations Watch free CIMA BA1 lectures 32

Only on OpenTuition you can find: Free CIMA notes • Free CIMA lectures • Free CIMA tests • Free tutor support • StudyBuddies • CIMA forums
CHAPTER 4ORGANISATIONS
1 Introduction to organisationsAn organisation can be defined as:
“A social arrangement which pursues collective goals, which controls its own performance, and which has a boundary separating it from its environment.”
This is, perhaps, a deceptively simple definition. Probably the most important word is ‘social’. Organisations consist of people and we are all social animals. We have to get on with our colleagues; ideally we would like our boss, or at least respect our boss. We have to get on with customers; we have our own ambitions; we have our own motivations.
Early management theory tended to neglect the social side of organisations and management and had a rather cold, militaristic approach, issuing orders and expecting them to be obeyed without question. Modern theories have changed this considerably.
Another important aspect of the definition is that of ‘collective goal’s’. There has to be an assumption that people within an organisation are ultimately aiming at the same end results, if they are not, then chaos is likely to rule. Profit seeking organisation have profit as their goal, but state hospitals will have a goal of curing patients. One of the functions of management is to arrange the business and the people in it so that everyone is pulling in the same direction, and the collective goals are ultimately established.
Through sharing skills and pooling resources organisations can accomplish tasks that single entrepreneurs could not.
2020 Examinations Watch free CIMA BA1 lectures 33

Only on OpenTuition you can find: Free CIMA notes • Free CIMA lectures • Free CIMA tests • Free tutor support • StudyBuddies • CIMA forums
2 Types of organisationsYou need to be aware of the characteristics of several types of organisation.๏ Commercial organisations are profit-seeking. They can be sole traders, partnerships,
limited liability partnerships and limited companies. The main advantage of limited liability partnerships and limited companies is that if the organisation hits hard times and has to go to liquidation, the owners of the organisation are protected. Creditors and banks can pursue only the assets which are in the company. Sole traders and partners, on the other hand, have unlimited liability for all the business’s debts.
๏ Not-for profit organisations do no seek to make profits. An example of a not-for-profit organisation could be a charity, such as a charitable hospital where objectives such as curing patients is their aim. Instead of producing a profit and loss account, they tend to produce income and expenditure accounts. Ultimately their income has to exceed their expenditure or they will run out of money.
๏ Public sector organisations are owned by the state either at a national level or at a local level. Examples could be the defence department, many health services and educational systems. In some economies other industries or businesses are also owned by the state. For example, many national airlines are state-owned. Public sector organisations can therefore be either profit-seeking or not-for profit organisations.
๏ Non-governmental organisations tend to be not-for-profit organisations but with an international brief. They are not part of governments though can receive government funding. Many United Nations organisations will fall into this category. Other examples include groups such as those which advocate "save the whales" or organisations such as Oxfam. There is a considerable overlap between the terms ‘NGO’ and ‘Charity’. In the UK ‘charity’ is reserved for organisations which have registered as charities and which then enjoy substantial tax advantages.
๏ Co-operatives are owned by the people who work in the organisation. Some farmers, for example, set up co-operatives to market their products more effectively than they could on their own. Usually they seek some sort of profit, but the ownership is shared widely amongst the people who are working in the organisation.
2020 Examinations Watch free CIMA BA1 lectures 34

Only on OpenTuition you can find: Free CIMA notes • Free CIMA lectures • Free CIMA tests • Free tutor support • StudyBuddies • CIMA forums
3 Shareholders and companiesLimited liability companies are probably the predominant type of profit-seeking organisation.
Companies are owned by their shareholders who contribute capital and receive a share of the company profits by being paid dividends by the company. ‘Limited liability’ means that if the company goes becomes bankrupt, shareholders’ liability is limited to losing their shares: their private wealth is protected. Note that the company’s liability for its debts is unlimited.
Once a company grows, it is normal for the day-to-day management of the company to be carried on by directors and management who are can be quite separate from the shareholders. Large companies have thousands of shareholders and there is no way a large group of people like that could possibly run the company.
Directors should run the company for the benefit of shareholders (the shareholders are the owners, after all). This means running the company with the objective of maximising shareholder wealth.
Shareholder wealth has two sources:๏ Dividends paid to them out of profits
๏ The value of the shares they own.
Most companies also obtain capital by borrowing from banks and other investors. Interest has to be paid to suppliers of loan capital.
Cash earned by a company is therefore used for three purposes:๏ The payment of dividends to shareholders. As companies’ activities become riskier,
shareholders will want higher dividends to compensate for the risk.
๏ Loan interest
๏ The residual cash can be used to invest in company assets. These should produce more profits which in turn should lead to higher share prices.
The amounts of dividend and interest that has to be paid to suppliers of capital compared to the amount of capital raised is known as the cost of capital.
It can be thought of as being similar to an interest rate: capital is deposited at a bank and a return is earned. If the company is to increase in value any return it earns must exceed the cost of capital so that the company has a surplus left for investment. If the returns earned are below the cost of capital the company will not be able to pay the interest and dividends that the suppliers of capital require and the company will lose value.
In general, the riskier a company’s activities the higher the cost of capital required by suppliers of capital.
2020 Examinations Watch free CIMA BA1 lectures 35

Only on OpenTuition you can find: Free CIMA notes • Free CIMA lectures • Free CIMA tests • Free tutor support • StudyBuddies • CIMA forums
4 Measurement of company performanceTwo important measures of company performance are used by shareholders are:๏ Return on capital employed
๏ Return on equity
๏ Earnings per share
4.1 Return on capital employedThe return on capital employed is defined as:
Operating profit before tax and interest x 100
Capital employed x 100
Usually, the closing capital employed figure is used. If the average of the opening and closing capital employed is used, the ratio is known the return on average capital employed.
Capital employed = Share capital + retained profits (reserves) + long term loans.
Statement of profit and loss $000 Revenue 20,000 Cost of sales (14,000) Gross profit 6,000 Operating expenses (2,000) Operating profit 4,000 Interest (1,000)
3,000 Tax (900) Profit after tax 2,100
Statement of financial position $000 Non-current assets 20,000 Current assets 3,000
23,000
Share capital €1 shares 5,000 Retained profits 12,000 Total equity 17,000 Long-term/non-current liabilities
4,500
Current liabilities 1,50023,000
2020 Examinations Watch free CIMA BA1 lectures 36

Only on OpenTuition you can find: Free CIMA notes • Free CIMA lectures • Free CIMA tests • Free tutor support • StudyBuddies • CIMA forums
In the example,
ROCE = Operating profit before tax and interest
x 100 = 4,000
x 100ROCE = Capital employed
x 100 = 17,000 + 4,500
x 100
= 18.6%
The higher the ROCE the better the company is at using its capital to generate profits.
4.2 Return on equityThe return on equity is defined as:
Operating profit after interest and before taxx 100
Shareholders’ equityx 100
Usually the closing equity figure is used. This measure focuses more on how the company performance affects shareholders.
In the example above ROE =
3,000x 100 = 17.6%
17,000x 100 = 17.6%
4.3 Earnings per shareEPS is defined as:
Profits after interest, tax and preference shares
Number of equity shares
(Preference shares are a relatively rare type of share which give fixed dividends. Equity shareholders are regarded as the true owners of companies and it is they who benefit most from better earnings.)
So, if a company manages to earn more earnings without having to issue more share, this is good for the equity shareholders. If a company issues shares and the money raised does not begin to make decent profits, the EPS will fall.
2020 Examinations Watch free CIMA BA1 lectures 37

Only on OpenTuition you can find: Free CIMA notes • Free CIMA lectures • Free CIMA tests • Free tutor support • StudyBuddies • CIMA forums
4.4 Short-run, long-run performanceDirectors of companies, particularly of companies listed on the stock exchange, are under immense scrutiny and pressure to continually improve companies’ results. Disappointing results often lead to a drop in share price.
To avoid a fall in current profits the directors could cut back on expenditure such research and development, training, redecorating and so on. That would cause current year’s profit to increase but would, of course, cause difficulties and profit falls in future years when no new products would have been developed (you need research and development to do that), good staff leave because they are not receiving the training they want and need, and the premises look shabby and unappealing to customers.
This is an example of what can be called the short term-long term conflict: short term results are improved at the expense of long term results. It is a particular problem for listed companies where directors might be in office temporarily and want good current performance to allow them to move to a better job. It is less of a problem in private and family companies where emphasis is more likely to be for the long-term benefit of the company and for future generations.
To avoid undue pressure from short term influences, longer term measures of performance are needed. One of the most commonly used is to try to estimate all future cash inflows that the company will receive and to base share values on that. So, although research and development might hurt this year’s results, the promise of a successful new product and the additional cash flows that will arise from that will increase the value of the company, its shares and its shareholders.
Of course, receiving an inflow of cash in 10 year’s time is not as valuable as receiving it now and the technique of discounting is used to reduce the important co future inflows to their present value equivalents. The share price is supported by the present value of future inflows to the company.
5 StakeholdersThe term “stakeholder” refers to any person or institution in any way affected by organisation. Stakeholders can be broken down into three groups though this is not particularly helpful:๏ Internal stakeholders are those who are definitely inside the organisation. Examples are
employees, directors and the managers.
๏ Connected stakeholders are outside the organisation but connected by way of a contract of some sort. Good examples here will be suppliers, customers, and lenders. Shareholders are usually regarded as connected stakeholders.
๏ External stakeholders are entirely outside the organisation with no contractual relationship. The best example for this is will be the people living nearby a factory. They are obviously affected, but have very limited contractual rights over what the factory does. The government is also an external stakeholder.
Why is the study of stakeholders important? Really the reason is that usually what stakeholders want will be in conflict. Shareholders want higher profits but employees want higher wages; customers want better quality at lower prices, shareholders want better profit; customers may want the operation to run 24 hours a day, 7 days a week but employees might want to only work 5 days a week, 8 hours a day. If your organisation was an airport the local populace would want you to run fewer flights (and certainly not after about 11 o’clock at night), whereas your customers and your shareholders may want you to run services more frequently.
There is no easy way of resolving these conflicts. Basically it comes down to management trying to get stakeholders to compromise. They have to try and keep most people happy most of the time, bearing in mind, however, that some stakeholders may be able to stop co-operating altogether. For example when employees want better wages, they could go on strike and ultimately this can affect
2020 Examinations Watch free CIMA BA1 lectures 38

Only on OpenTuition you can find: Free CIMA notes • Free CIMA lectures • Free CIMA tests • Free tutor support • StudyBuddies • CIMA forums
the profits which are enjoyed by the shareholders. Management has to be aware that there are conflicts and try its best to manage these.
About the only tool or model available for the analysis of stakeholders is Mendelow’s matrix.
Level of interestLevel of interestLow High
Power
Low
Minimal effort Keep informed
Power
High
Keep satisfied Key player
It sets out on one axis the power that a stakeholder can wield. And along the other axis their interest, by which we mean how likely is it that the stakeholder will take action.
Stakeholders who have high power and high interest are known as key players. Management really needs to keep those people happy. They have the power and they have the willingness to do something about it if they are upset.
Some stakeholders have high power but they are not likely to take action even if management does something which they dislike. They may be unwilling to take action because of professional or ethical reasons. For example, medical staff in hospitals are very unlikely to take industrial action. Management doesn’t have to be quite so careful with these people. However they have to be kept satisfied, otherwise they could be provoked to take action and turn into key players.
People with low power but high interest have to be kept informed. They can’t do much about it themselves but they might be able to influence key players to take action on their behalf.
Finally we have people with low power and low interest. Management can nearly ignore these people. After all, what are they going to do if they don’t like what’s happening?
2020 Examinations Watch free CIMA BA1 lectures 39

Only on OpenTuition you can find: Free CIMA notes • Free CIMA lectures • Free CIMA tests • Free tutor support • StudyBuddies • CIMA forums
6 The principal-agent problemIn Section 3 above, we described how shareholders own companies but directors run them on a day-to-day basis on behalf of the shareholders.
Shareholders are known as the principals.
Directors are known as the agents.
It is the duty of agents to act in the best interest of their principals.
Shareholders and directors are two types of stakeholder and what they want can be in conflict. For example:๏ Shareholders want larger profits but directors want larger fees, flashy cars and first class
travel.
๏ Shareholders want a certain level of risk but the directors might want to take an unjustifiable gamble on the company’s future because if it comes off their reputation will be enhanced.
The conflict is known as the principle-agent problem and it has been very serious in some companies.
Corporate governance can be defined as “The way in which companies are directed and controlled” and this should be in ways that ensure that shareholder requirements are paramount. After a number of high profile financial scandals, many countries brought in corporate governance rules. In the UK these rules are known as the UK Corporate Governance Code and all listed companies are expected to comply with it otherwise their listing on the Stock Exchange will be jeopardised if they can’t justify why they have departed from the code.
The main provisions are:๏ The chief executive officer and the chairman have to be separate people. This splits power at
the top and should prevent a bullying CEO imposing his or her views on the board.
๏ There should be a balance of executive and non-executive directors (about 50/50). Non-executive directors play no role in day to day company management, but attend board meeting and can vote. Their purpose is to warn and advise the executive directors.
๏ A remuneration committee composed of non-executive directors decided on executive directors’ remuneration.
๏ A nomination committee (principally non-executive directors) recommends new or replacement directors.
๏ An audit committee (non-executive directors) liaises with both internal and external directors.
๏ Directors are responsible for the long-term strategy of the company
๏ Directors are responsible for designing and implementing a good system of internal control.
2020 Examinations Watch free CIMA BA1 lectures 40

Only on OpenTuition you can find: Free CIMA notes • Free CIMA lectures • Free CIMA tests • Free tutor support • StudyBuddies • CIMA forums
Tests
Question 1
Is the following statement true or false?
“Limited liability means that the company’s liability for its debts is limited”
Question 2
Is the following statement true or false?
“Publicly owned/state organisations are not-for-profit organisations”
Question 3
What are the two main types of capital that a company can raise?
Question 4
Fill in the blank:
The amounts of dividend and interest that has to be paid to suppliers of capital compared to the amount of capital raised is known as ______________________
Question 5
Allocate the following stakeholders to the correct categories
Internal External ConnectedEmployeesSuppliersCustomersGovernmentLendersDirectorsShareholders
Question 6
Match the terms “principals” and “agents” to the gaps in the following sentence:
Shareholders are the_____________, directors are the ________________
Question 7
If a listed company has 6 executive directors, approximately how many non-executive directors should it have?
2020 Examinations Watch free CIMA BA1 lectures 41

Only on OpenTuition you can find: Free CIMA notes • Free CIMA lectures • Free CIMA tests • Free tutor support • StudyBuddies • CIMA forums
Question 8
What is the return on capital employed for the company shown below?
Statement of profit and loss $000 Revenue 30,000 Cost of sales (18,000) Gross profit 12,000 Operating expenses (7,000) Operating profit 5,000 Interest (2,000)
3,000 Tax (800) Profit after tax 2,200
Statement of financial position $000 Non-current assets 30,000 Current assets 5,000
35,000
Share capital €1 shares 5,000 Retained profits 21,000 Total equity 26,000 Long-term/non-current liabilities 7,000 Current liabilities 2,000
35,000
2020 Examinations Watch free CIMA BA1 lectures 42

Only on OpenTuition you can find: Free CIMA notes • Free CIMA lectures • Free CIMA tests • Free tutor support • StudyBuddies • CIMA forums
CHAPTER 5PRICES
1 Introduction price behaviourMicroeconomics is the branch of economics that deals with the price and cost of manufacturing of goods, and with the reactions of suppliers and customers to prices.
It’s probably self-evident that as the price of a product rises, the quantity demanded is likely to fall. For example, if airfares rise, fewer people will choose to travel. Similarly, if a market trader is left at the end of the day with fruit that will soon go off, the price of fruit will be lowered to try to stimulate demand.
This chapter looks at how prices and sales quantities can depend on one another. It also examines how prices can affect supply (higher prices will encourage more production) and will how price mechanisms can ensure that demand equals supply.
2 Demand curves
2.1 The demand curve
P, price
Q, quantity
For most goods, as price increases the quantity demanded will reduce. This diagram shows a linear decrease; in practice the demand curve is likely to be curved.
Movement along the demand curve depends on the price of goods. As the price, P, increases, the quantity demanded, Q, decreases. We are moving along the demand curve
2020 Examinations Watch free CIMA BA1 lectures 43

Only on OpenTuition you can find: Free CIMA notes • Free CIMA lectures • Free CIMA tests • Free tutor support • StudyBuddies • CIMA forums
A shift in the demand curve, from the solid to the dotted line below can be caused by:๏ Consumers’ income. In general higher incomes will shift the demand curve to the right so
that at a given price, more goods are sold. There are some goods, known as inferior goods, where the demand curve would move leftwards as income increases because people change to better goods in preference. For example, you could argue that the demand for cheap brands of coffee will suffer as income rises and consumers more often pick premium brands.
P, price
Q, quantity
๏ Substitutes and complements. A substitute product is one that can be bought as an alternative. For example, olive oil and sunflower oil are substitutes for some purposes. If the price of olive oil increases, the demand to sunflower oil is likely to increase as consumers switch. Complementary products are often bought together. For example, cars and petrol. If the price of cars reduces, more are bought, but more petrol will also be bought even though its price has not changed. Petrol’s demand curve will shift to the right.
๏ Fashion and taste. A fashionable item will have high demand and consumers may be prepared to pay a high price. Advertising can increase the quantity of goods demanded at a given price and the demand line will shift rightwards.
๏ Expectation of future price changes. If consumers think the price will rise, then current demand is increased as they stock-up on the goods. The curve will shift rightwards.
2020 Examinations Watch free CIMA BA1 lectures 44

Only on OpenTuition you can find: Free CIMA notes • Free CIMA lectures • Free CIMA tests • Free tutor support • StudyBuddies • CIMA forums
3 The elasticity of demandThis determines the slope of the demand curve.
If demand is elastic, then demand for the good is price sensitive and a small change in price will cause a relatively large change in demand. That is shown by the less steep line below.
P, price
Q, quantity
Relatively inelastic (a change in price causes a small change in demand)
Relatively elastic, or price sensitive
If demand is inelastic, then demand for the good is price insensitive and a change in price will have a relatively small effect on demand.
Elasticity largely depends on whether the goods are essential or luxury. If goods are essentials (like basic food) then higher prices will not affect demand greatly. If goods are luxuries (or at least purchase of them is discretionary), then a rise in price can cause a steep fall in demand. For example, the purchase of foreign holidays is markedly affected by the price of those holidays.
The price elasticity of demand is defined as:
The proportional (or percentage) change in demand
The proportional (or percentage) change in price
Because an increase in price will normally cause a decrease in demand, technically this measure is negative, but the negative sign is usually ignored.
Price elasticity of demand >1 means that a relatively small change in price will cause a relatively large change in demand, so demand is elastic.
This has the consequent that revenue will increase if prices are reduced because the increase in demand more than compensates for the fall in price.
Price elasticity of demand 0 < 1 means that a relatively small change in price will cause a relatively small change in demand, so demand is inelastic.
This has the consequent that revenue will decrease if prices are reduced because the increase in demand will not compensate for the fall in price.
Price elasticity of demand = 1 means that revenue will be constant if the price is changed slightly.
2020 Examinations Watch free CIMA BA1 lectures 45

Only on OpenTuition you can find: Free CIMA notes • Free CIMA lectures • Free CIMA tests • Free tutor support • StudyBuddies • CIMA forums
4 Calculation of the price elasticity of demand
P, price
Q, quantity
4
8
12
2
6
10
1000 2000 3000 4000
In the above diagram, say that at a price of $8, demand is 1,200 and that at a price of 6, demand is 2,200.
There are two approaches to calculating the elasticity:
Arc elasticity uses the mid-point of the two quantities and prices as the basis point ie
1,700 = (2,200 + 1,200)/2)for quantity and 7 for price.
Proportional change in demand = (2,200 – 1,200)/1700 = 0.588 or 58.8%
Proportional change in price = (8 – 6)/7 = 0.286 or 28.6%
Price elasticity of demand = 58.8/28.6 = 2
Point elasticity uses the starting points eg start price at 8 and demand at 1,200
Proportional change in demand = (2,200 – 1,200)/1200 = 0.833 or 833%
Proportional change in price = (8 – 6)8 = 0.25% or 25%
Price elasticity of demand = 83.3/25 = 3.3
Note that elasticity of demand change constantly along a demand curve, even if the demand curve is a straight line.
2020 Examinations Watch free CIMA BA1 lectures 46

Only on OpenTuition you can find: Free CIMA notes • Free CIMA lectures • Free CIMA tests • Free tutor support • StudyBuddies • CIMA forums
For example, in the table below, demand increases by 1,000 units for each $1 decrease in price:
Price $ Demand Q12 5,00011 6,00010 7,0009 8,0008 9,0007 10,0006 11,0005 12,0004 13,0003 14,0002 15,0001 16,000
The arc price elastic of demand from $12 to $11 is:
(6,000 – 5,000) 5,500 = 0.18/0.087 = 2 (very elastic)
(12 – 11)/11.5 = 0.18/0.087 = 2 (very elastic)
The arc elasticity of demand between $3 and $2 is:
(15,000 – 14,000)/14,500 = 0.069/0.4 = 0.175 (very inelastic)
(3 – 2)/2.5 = 0.069/0.4 = 0.175 (very inelastic)
Remember:
If the price elasticity of demand is greater than 1, an increase in price will decrease the revenue because volume falls off rapidly: the product is very price sensitive
If the price elasticity of demand is less than 1, an increase in price will increase the revenue because volume is not much affected by price: the product is price insensitive
If the price elasticity of demand is 1, a change in price does not cause any change in revenue because price and quantities are move in a way that is precisely compensating.
2020 Examinations Watch free CIMA BA1 lectures 47

Only on OpenTuition you can find: Free CIMA notes • Free CIMA lectures • Free CIMA tests • Free tutor support • StudyBuddies • CIMA forums
5 The supply curve
P, price
Q, output or supply
As you would expect, the higher the price offered to suppliers, the more goods will be produced. Suppliers increase production and more suppliers enter the market because they see more profits at higher prices.
5.1 Movement along and shift of the supply curveThe price of goods. As the price, P, increases, the quantity supplied, Q, increases. Here we are moving along the supply curve.
Movement of the supply curve to the right (from the solid line to the dotted line in the diagram below) means that more units are supplied at a given price. Alternatively it means that the same quantity will be produced for a lower selling price.
P, price
Q, output or supply
2020 Examinations Watch free CIMA BA1 lectures 48

Only on OpenTuition you can find: Free CIMA notes • Free CIMA lectures • Free CIMA tests • Free tutor support • StudyBuddies • CIMA forums
A rightwards shift can be caused by:๏ Lower average costs of production. So, even if selling prices fall, because costs have fallen is
still worthwhile producing the same volume of goods.
๏ Subsidies for raw materials or labour or lower tax and duty on purchases. These effectively lower the cost of production.
๏ More efficient use of existing factors of production by, perhaps ordering materials more accurately or rearranging work rotas (again the cost of production falls)
๏ Improvements in technology, such as the introduction of more efficient processes or automation
A shift to the left in which less will be supplied at every price could be caused by:๏ Increase in average cost of production
๏ Taxation of raw materials
๏ A switch in production to more profitable products – productive capacity is simply removed.
5.2 Price elasticity of supplyThe price elasticity of supply is defined as:
The proportional (or percentage) change in quantity supplied
The proportional (or percentage) change in price
Price elasticity of supply >1 means that a relatively small change in price will cause a relatively large change in supply, so supply is elastic.
Supply could be elastic if:๏ There is spare capacity in producers’ factories.
๏ If inventory available that can be easily released and sold.
๏ If it is easy to employ more factors of production.
๏ Additional sources of the product are easy to create
Price elasticity of supply 0 < 1 means that a relatively small change in price will cause a relatively small change in supply, so supply is inelastic.
Supply could be inelastic if:๏ Suppliers are operating close to full capacity.
๏ There are low levels of stocks so that there are no surplus goods to sell.
๏ Additional sources of supply are difficult to create eg expensive, complex factories are needed.
๏ If it is difficult to employ factors of production, e.g. if highly skilled labour is needed and this is in scarce supply
๏ With agricultural products supply is inelastic in the short run because food takes time to grow. Imports would relieve shortages.
2020 Examinations Watch free CIMA BA1 lectures 49

Only on OpenTuition you can find: Free CIMA notes • Free CIMA lectures • Free CIMA tests • Free tutor support • StudyBuddies • CIMA forums
5.3 The equilibrium of supply and demandCombining the demand and supply curves produces the following diagram:
P, price
Q, quantityQ
P
DemandSupply
At a price P, the quantity supplied will exactly match the quantity demanded: quantity supplied and demanded = Q. This is the point in which the market is in equilibrium.
In the diagram below, if the market price were P1 then there would be excess demand:
P, price
Q, quantityQs
P1
DemandSupply
Qd
Qd would be demanded, but only Qs would be supplied and obviously Qd > Qs. The excess demand is Qd – Qs.
The market is now in disequilibrium and the excess demand will cause rises to rise and, in turn, cause supply to increase until equilibrium is reached again
2020 Examinations Watch free CIMA BA1 lectures 50

Only on OpenTuition you can find: Free CIMA notes • Free CIMA lectures • Free CIMA tests • Free tutor support • StudyBuddies • CIMA forums
In the diagram below, if the market price were P2 then there would be excess supply:
P, price
Q, quantityQs
P2Demand
Supply
Qd
Qs would be supplied but only Qd would be demanded and obviously Qs > Qd. The excess supply is Qs – Qd.
The market is now in disequilibrium and the excess supply will cause rises to fall and, in turn, cause demand to increase until equilibrium is reached again.
Supply and demand curves can be applied to many markets to explain the equilibrium points and also movements in prices:
๏ The price of materials
๏ The price of labour
๏ The price of air fares and hotel rooms
๏ The price of money (interest)
๏ The price of currencies (exchange rates)
2020 Examinations Watch free CIMA BA1 lectures 51

Only on OpenTuition you can find: Free CIMA notes • Free CIMA lectures • Free CIMA tests • Free tutor support • StudyBuddies • CIMA forums
Tests
Question 1
Which of lines A or B in the diagram below shows the product with the greater price elasticity of demand?
P, price
Q, quantity
B
A
Question 2
P, price
Q, quantityQs
P1
DemandSupply
Qd
P, price
Q, quantityQs
P2Demand
Supply
Qd
With respect to the diagrams above, which TWO of the following statements are correct?
A At price P2 there is excess demand
B At price P1 there is excess supply
C At price P2 there is excess supply
D At price P1 there is excess demand
Question 3
Is the following statement true or false?
When the price elasticity of demand is greater than one, an increase in price will cause an increase in revenue
2020 Examinations Watch free CIMA BA1 lectures 52

Only on OpenTuition you can find: Free CIMA notes • Free CIMA lectures • Free CIMA tests • Free tutor support • StudyBuddies • CIMA forums
Question 4
Calculate the arc elasticity of demand for the data below:
Price Quantity sold15 20,00020 16,000
Question 5
Would the following normally shift a demand curve to the left or right?
Shift to right Shift to left
Increased advertisingLower incomesAn item becoming fashionableThe price of a substitute falling
2020 Examinations Watch free CIMA BA1 lectures 53

Only on OpenTuition you can find: Free CIMA notes • Free CIMA lectures • Free CIMA tests • Free tutor support • StudyBuddies • CIMA forums
2020 Examinations Watch free CIMA BA1 lectures 54

Only on OpenTuition you can find: Free CIMA notes • Free CIMA lectures • Free CIMA tests • Free tutor support • StudyBuddies • CIMA forums
CHAPTER 6MARKET FAILURE AND THE REGULATIONS OF MARKETS
1 Introduction to problems with marketsThe previous chapter showed how demand and supply are brought into equilibrium by the operation of prices moving so that demand will become equal to supply and this will lead to the efficient allocation of resources. However, this requires markets to work well. For example, prices and output must be capable of moving and there must be a price.
Not all markets will work properly (and then consumers generally suffer) and governments will often intervene.
2 MonopoliesA monopoly occurs when there is only one supplier of a good or service.
An example could be a pharmaceutical company which has a patent on a uniquely effective drug. Other suppliers cannot start production because they have no patent rights. This allows the pharmaceutical company to charge very high prices because demand for this very desirable product will be high. The supplier can make ‘super profits’ and there will be permanent excess demand.
In a properly functioning market, more producers could have entered to increase supply and to reduce prices. More patients could benefit from the drug at lower prices and this is a much more desirable allocation of resources.
2020 Examinations Watch free CIMA BA1 lectures 55

Only on OpenTuition you can find: Free CIMA notes • Free CIMA lectures • Free CIMA tests • Free tutor support • StudyBuddies • CIMA forums
Monopolies or monopolistic behaviour can arise as follows:๏ A true monopoly as described above: only one supplier. Monopolies can be created by taking
over rivals so that only one supplier remains.
๏ A natural monopoly, a form of true monopoly but it exists because there are extremely high fixed costs. For example, electricity distribution will be unlikely to have rival networks.
๏ Restrictive trade practices. For example:
‣ Cartels: where several suppliers collude to keep prices artificially high. ‣ Predatory pricing: where a rich supplier drops the selling price to drive others from the
market.‣ Tied selling: where goods have to be bought from one supplier.
๏ Market allocation (agreements not to compete in some markets).
๏ Governments seek to regulate these types of behaviour and markets. For example, in the UK, the Competition and Markets Authority is responsible for:
‣ Investigating mergers which could restrict competition.‣ Conducting market studies and investigations in markets where there may be
competition and consumer problems.‣ Investigating where there may be breaches of UK or EU prohibitions against anti-
competitive agreements and abuses of dominant positions.‣ Bringing criminal proceedings against individuals who commit the cartel offence.‣ Enforcing consumer protection legislation to tackle practices and market conditions
that make it difficult for consumers to exercise choice.
Also in the UK, industries such as telecoms, electricity, gas, water are regulated by government agencies. For example, Ofgem is the Office of Gas and Electricity Markets and its principal objective is to protect the interests of existing and future electricity and gas consumers.
3 Public goodsA public good is a product or service that one individual can consume without reducing its supply to another individual, and from which no one is excluded.
Examples include public roads, street lighting, defence and law enforcement.
Public goods are:๏ Non-rivalrous, meaning that one person’s consumption does not affect another’s: consumers
are not rivals.
๏ Non-excludable: no consumer can be excluded from consumption – even if they have not contributed to its supply.
๏ Public goods can also be considered to be non-rejectable: even if you don’t want a nuclear deterrent you might have one.
Public goods are not supplied by markets because of the difficulty of charging inevitable consumers who might not actually want the product or service and who will benefit anyhow even with making a contribution. This is the ‘free-rider’ problem. Public goods are therefore provided by the state and are financed by tax revenues. Governments must decide on the appropriate levels of tax and service.
2020 Examinations Watch free CIMA BA1 lectures 56

Only on OpenTuition you can find: Free CIMA notes • Free CIMA lectures • Free CIMA tests • Free tutor support • StudyBuddies • CIMA forums
4 ExternalitiesAn externality is the cost or benefit that affects a party who did not choose to incur that cost or benefit.
For example:๏ People living near airports bear the cost of noise and air pollution.
๏ Airlines to not bear the full consequences of air pollution.
๏ Car manufacturers do not bear any cost of the road infrastructure.
๏ Society at large benefits from university education as a more skilled workforce should improve the economy.
Externalities interfere with the ability of market forces to optimise the allocation and use of resources. For example, let’s say that there is a strong correlation between the level of car ownership in a country and lung disease in the country. Increased lung disease will be both a personal cost through ill-health and a public cost through the supply of medical care.
If the cost of healthcare problems is not reflected in the costs of manufacturing and running cars then the cost of cars will be lower than should really be the case and demand will be higher. Car manufacturers have shifted what should be their costs to costs within the health sector. The cost of supplying health services is higher than it should be so governments might decide that they can afford to supply less.
Of course, pricing externalities is difficult but that does not mean that no attempt should be made in an effort to achieve a fairer and better allocation of costs and benefits. Governments attempt to correct for negative externalities by:๏ Taxes and subsidies to correct economic unfairness. For example, tax airports on noise
production and use the money raised to soundproof neighbouring houses.
๏ Regulation. For example, limit decibel levels and restrict flying hours.
๏ Law suits where those negatively affected claim damages from those positively affected.
๏ Negotiation between the affected parties.
If there are positive externalities, then producers might not be adequately rewarded for the side-benefits created, and consumers might not properly value what those benefits are.
Take the example of a bee-keeper. The price of honey will determine the supply and demand of honey. However, bees will be performing the vital task of pollinating the crops of nearby farmers. That is a positive externality. More bees would mean more pollination and higher crop yields but the bee-keeper would not benefit and would not be encouraged to have more bees. Government intervention could help by subsidising the price of honey or by paying bee-keepers a grant to encourage them to increase their stock.
The term ‘merit goods’ is applied to a commodity or service, such as education, that is regarded by society or government as deserving public finance because otherwise they will be under-consumed. For example, flu vaccinations. If people had to pay for a vaccination then many would decide not to have one. If they are free then there will be greater uptake and at some point there will be major positive externalities when a big enough proportion of the population is vaccinated to achieve ‘herd immunity’ that should stop an epidemic.
2020 Examinations Watch free CIMA BA1 lectures 57

Only on OpenTuition you can find: Free CIMA notes • Free CIMA lectures • Free CIMA tests • Free tutor support • StudyBuddies • CIMA forums
5 Minimum and maximum pricesFrom time to time governments experiment with setting minimum and maximum prices for products and services. Minimum prices help suppliers and maximum prices help consumers.
Minimum pricesLet’s say that a government is concerned about the future of the dairy industry and that many farmers are stopping milk production. One way to keep farmers in business is to set a minimum price per litre of milk so that farmers are more or less guaranteed goods profits. However, a minimum price for producers is also a minimum price for buyers and there is likely to be excess supply: lots of farmers will produce at the artificially high price, but many consumers will not want to buy at that high price.
The consequences are therefore:๏ Over-production
๏ Producers being attracted to a business where there is already surplus supply
๏ Waste of resources. Perhaps the land and farmers could be employed for something that consumers did want.
๏ Inefficiency on production: why be efficient if the selling price is so high and price competition is non-existent?
Maximum pricesLet’s say that a government is concerned about the high price of petrol (opinion polls might have shown that this of major concern to voters and the government wants to stay popular). So the government sets a maximum price per litre. Or the government might want to set maximum prices to try to hold down inflation.
The maximum price will increase demand, but will suppress production because profits for producers are held down. Furthermore, the development of new sources of energy for cars will be inhibited because the new technology has to compete with artificially suppressed prices.
When there are maximum prices, demand will begin to exceed supply and there is no price mechanism to correct this.
Demand and supply do have to be balances (simply a matter of physical quantities having to match) and this can only be achieved by:๏ Rationing
๏ Queuing
๏ Providing vouchers to limit supply to quotas for each person
These approaches then usually give rise to black markets for goods where some people will be willing to pay very high prices to get their hands on scarce goods. An example is seen with ticket touts for very popular shows or sports events.
2020 Examinations Watch free CIMA BA1 lectures 58
Only on OpenTuition you can find: Free CIMA notes • Free CIMA lectures • Free CIMA tests • Free tutor support • StudyBuddies • CIMA forums
Tests
Question 1
What is meant by the term ‘predatory pricing’?
Question 2
What does the following sentence describe?
“A product or service that one individual can consume without reducing its supply to another individual, and from which no one is excluded.”
A A merit good
B A public good
C An externality
D A market allocation
Question 3
Indicate whether the following effects are likely consequences from minimum or maximum prices being set
Minimum price set Maximum price setRationingOver-productionQueueingWasted resources
Question 4
What does the following sentence describe?
“A commodity or service that is regarded by society or government as deserving public finance because otherwise they will be under-consumed.”
Question 5
What does the following sentence describe?
“The cost or benefit that affects a party who did not choose to incur that cost or benefit.”
2020 Examinations Watch free CIMA BA1 lectures 59

Only on OpenTuition you can find: Free CIMA notes • Free CIMA lectures • Free CIMA tests • Free tutor support • StudyBuddies • CIMA forums
2020 Examinations Watch free CIMA BA1 lectures 60

Only on OpenTuition you can find: Free CIMA notes • Free CIMA lectures • Free CIMA tests • Free tutor support • StudyBuddies • CIMA forums
CHAPTER 7DATA AND INFORMATION
1 Data and informationThe most common definition of information is:
Information = data with meaning
Data is the raw fact and figures. But generally, of itself, data isn’t very meaningful. For example, a list of all outstanding invoices in value order is not very useful to a credit controller. That data only becomes useful if first of all it is sorted by customer, and then perhaps sorted and presented by the age of the invoice. Then it has become meaningful as the user can interpret it and do something with it.
Presenting data in the form of graphs and charts will also enhance its usefulness and the ability of people to interpret it.
2 The characteristics of good informationWhat are the characteristics of good information - and here the word “ACCURATE“ can be used as a mnemonic:๏ Accurate. High quality information should be accurate; that doesn’t necessarily mean
accurate to the very last cent. It means accurate enough for the purposes for which it is going to be used. For example, the board of directors might be perfectly happy with accounts rounded to nearest thousand or even the nearest million dollars.
๏ Complete. The information should be complete; it should include everything that needs to be included to make proper decisions.
๏ Cost-beneficial. It should be cost beneficial. There is no point in gaining information at a huge cost, if the benefits derived from that, whether financial or otherwise, are minimal. We are not in the business of information for information’s sake. We should require information either to make more profit or to run an organisation more efficiently.
๏ User-targeted. The information should be presented in a way that is useful to the user. For example, senior managers may want summaries; account staff needs much more detailed information.
๏ Relevant. It should be relevant. You shouldn’t supply people with more information than they need, or information that they can do nothing with otherwise they may be confused or overlook the important information.
๏ Authoritative. It should be authoritative. The source of the information should be one which can be relied upon. Those of you who have used the Internet should be well aware of this. You put a term into a search engine, all sorts of material comes out. Some of it is from authoritative sources, other information is from amateurs, yet other is from charlatans.
2020 Examinations Watch free CIMA BA1 lectures 61
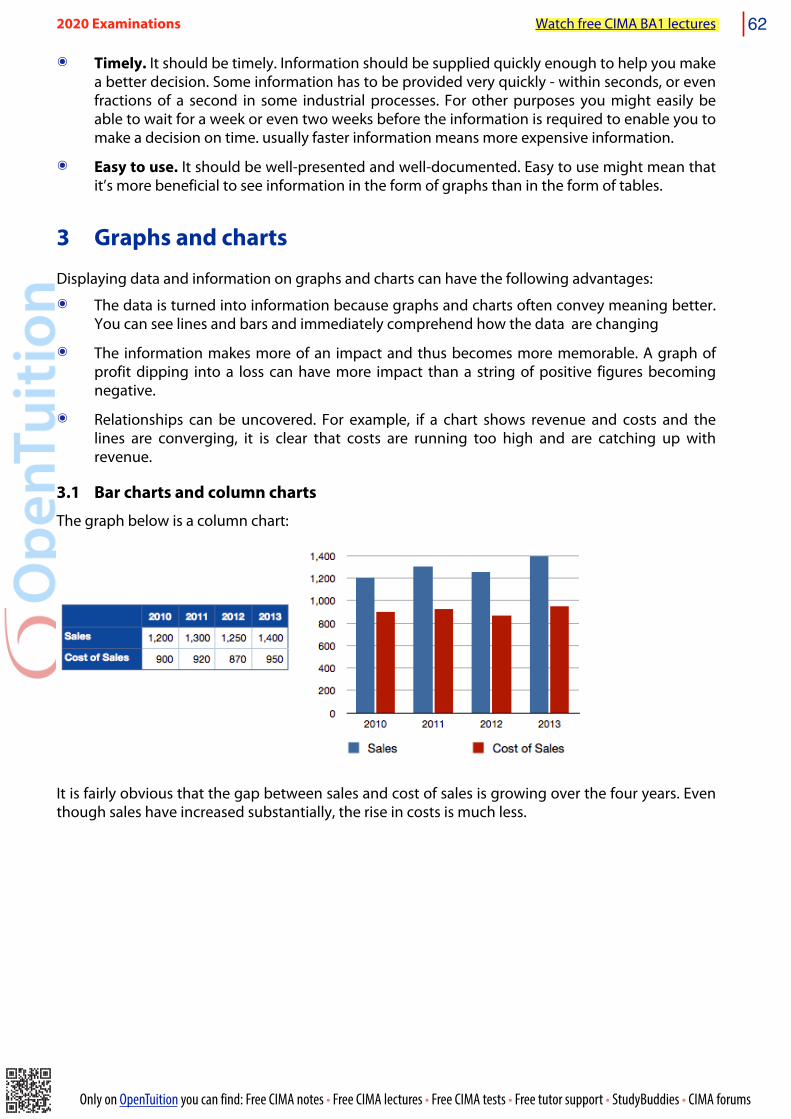
Only on OpenTuition you can find: Free CIMA notes • Free CIMA lectures • Free CIMA tests • Free tutor support • StudyBuddies • CIMA forums
๏ Timely. It should be timely. Information should be supplied quickly enough to help you make a better decision. Some information has to be provided very quickly - within seconds, or even fractions of a second in some industrial processes. For other purposes you might easily be able to wait for a week or even two weeks before the information is required to enable you to make a decision on time. usually faster information means more expensive information.
๏ Easy to use. It should be well-presented and well-documented. Easy to use might mean that it’s more beneficial to see information in the form of graphs than in the form of tables.
3 Graphs and chartsDisplaying data and information on graphs and charts can have the following advantages:๏ The data is turned into information because graphs and charts often convey meaning better.
You can see lines and bars and immediately comprehend how the data are changing
๏ The information makes more of an impact and thus becomes more memorable. A graph of profit dipping into a loss can have more impact than a string of positive figures becoming negative.
๏ Relationships can be uncovered. For example, if a chart shows revenue and costs and the lines are converging, it is clear that costs are running too high and are catching up with revenue.
3.1 Bar charts and column chartsThe graph below is a column chart:
It is fairly obvious that the gap between sales and cost of sales is growing over the four years. Even though sales have increased substantially, the rise in costs is much less.
2020 Examinations Watch free CIMA BA1 lectures 62
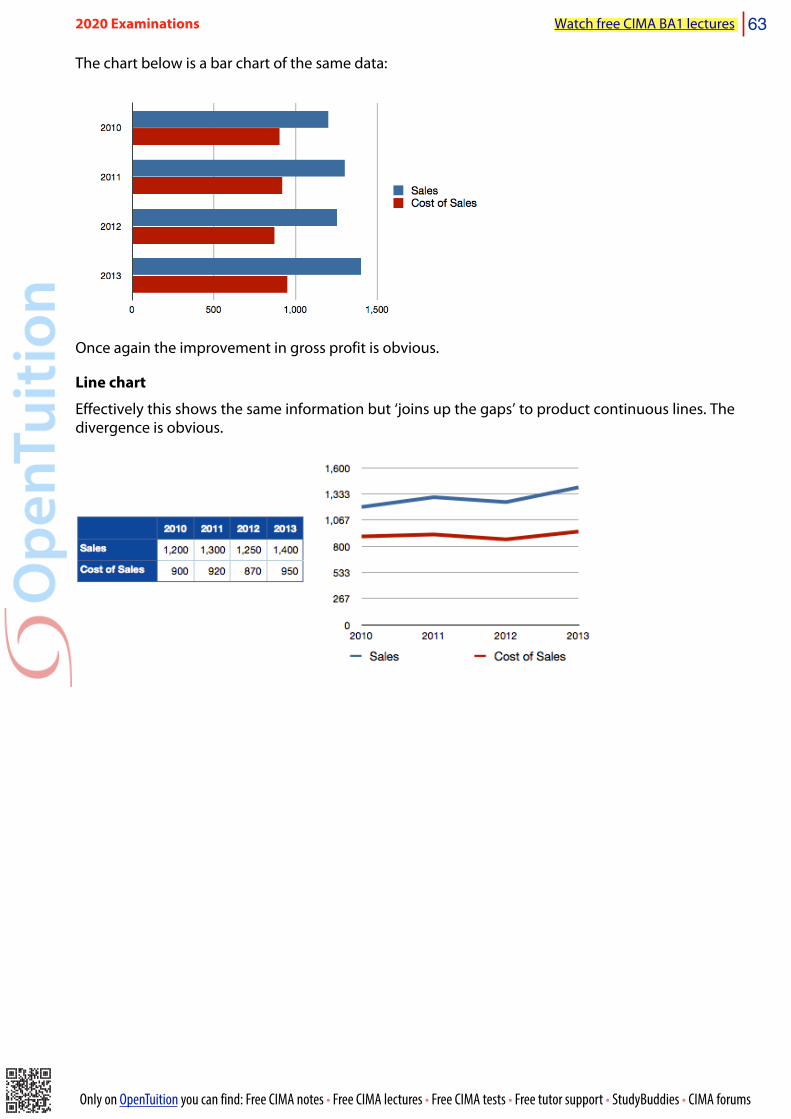
Only on OpenTuition you can find: Free CIMA notes • Free CIMA lectures • Free CIMA tests • Free tutor support • StudyBuddies • CIMA forums
The chart below is a bar chart of the same data:
Once again the improvement in gross profit is obvious.
Line chart
Effectively this shows the same information but ‘joins up the gaps’ to product continuous lines. The divergence is obvious.
2020 Examinations Watch free CIMA BA1 lectures 63

Only on OpenTuition you can find: Free CIMA notes • Free CIMA lectures • Free CIMA tests • Free tutor support • StudyBuddies • CIMA forums
Scattergraph
Although a scattergraph can be used to plot a value against time, it is more often used to show how two non-time variables relate to each other, such as sales/advertising, cost/production volume or home fuel consumption/weather temperature.
2016
Month Average temperature
KWH electricity consumed
January 6 12,000February 8 11,000March 11 10,000April 14 8,000May 18 6,000June 22 4,000July 25 3,000August 29 1,000September 26 2,500October 20 5,000November 15 9,000December 10 9,500
0
2,000
4,000
6,000
8,000
10,000
12,000
14,000
KWH
ele
ctric
ity c
onsu
med
Average temperature
In the table above, the data was presented in date order, but the graph shows how electricity consumption falls as temperatures rise.
A trend line has been drawn through the points to emphasise the relationship.
2020 Examinations Watch free CIMA BA1 lectures 64

Only on OpenTuition you can find: Free CIMA notes • Free CIMA lectures • Free CIMA tests • Free tutor support • StudyBuddies • CIMA forums
Pie chart
SalesEurope 1,200Asia 1,300N America 1,250S America 600
S America14%
N America29%
Asia30%
Europe28%
A pie chart is good for showing the proportions of the elements that make up a population. Here you can instantly see that South America is the smallest market segment.
3.2 Frequency distributionsA frequency distribution show how many times (frequency) a given quantity, or group of quantities occurs in a set of data.
For example:
If there are 100 apartments in a block and a frequency distribution could describe the number of people living in each apartment:
Frequency Number of inhabitants
14 122 230 325 48 51 6
Total 100
This is known as a discrete frequency distribution because the number of inhabitants can only be certain numbers: 0, 1, 2, 3. You can’t have 3.54 inhabitants.
2020 Examinations Watch free CIMA BA1 lectures 65

Only on OpenTuition you can find: Free CIMA notes • Free CIMA lectures • Free CIMA tests • Free tutor support • StudyBuddies • CIMA forums
Continuous frequency distributions allow any values and there, values have to be lumped together to be of any use. In the apartment block there are 294 inhabitants (= 14 x 1 + 22 x 2 + 30 x 3 + 25 x 4 + 8 x 5 + 6 x 1). If we looked at the heights of these inhabitants we could have something like this:
Frequency Height range10 0.8 - <1.0m22 1.0 - < 1.2m45 1.2- < 1.4m69 1.4 - < 1.6m73 1.6 - <1.8m67 1.8 - <2.0m8 2.0 - <2.2m
Total 294
Frequency distributions are commonly shown on two types of chart:๏ Histograms (frequency density charts)
๏ Ogives (“less then” charts)
Histograms
A histogram looks very like a column chart, but there are no gaps between the columns. A histogram of the above data would look like:
There is only one complication that you need to be aware of: the area of the columns represents the frequencies, not the height. If each range of data in the distribution is the same (above the height range ia always 0.2m), then the heights are proportional to the frequency.
However, if the data has been like this, where the 1.6 - <=2 is 4cm, not the normal 2, the height of that bar has to be ‘halved’ but its width doubled.
2020 Examinations Watch free CIMA BA1 lectures 66

Only on OpenTuition you can find: Free CIMA notes • Free CIMA lectures • Free CIMA tests • Free tutor support • StudyBuddies • CIMA forums
Frequency Height range10 0.8 - <1.0m22 1.0 - < 1.2m45 1.2- < 1.4m69 1.4 - < 1.6m
140 1.6 - <2.0m8 2.0 - <2.2m
Total 294
Ogives
Ogives, or less-than curves, plot cumulative frequencies.
Using the original height table, an extra column with cumulative numbers and also change the range to the upper end of each interval:
Frequency Cumulative frequency
Upper end of range Height range
10 10 1.0 0.8 - <1.0m
22 32 1.2 1.0 - < 1.2m
45 77 1.4 1.2- < 1.4m
69 146 1.6 1.4 - < 1.6m
73 219 1.8 1.6 - <1.8m
67 286 2.0 1.8 - <2.0m
8 294 2.2 2.0 - <2.2m
So, this table shows, for example, that 146 people are less than 1.6m tall.
2020 Examinations Watch free CIMA BA1 lectures 67

Only on OpenTuition you can find: Free CIMA notes • Free CIMA lectures • Free CIMA tests • Free tutor support • StudyBuddies • CIMA forums
Plotting the cumulative frequency (y axis) against the heights give a chart like:
These usually have this characteristic ‘swan neck’ shape.
Ogives can be used to find the median height (where 50% are taller and 50% shorter) and quartiles (25%/70% and 75%/25% splits).
2020 Examinations Watch free CIMA BA1 lectures 68

Only on OpenTuition you can find: Free CIMA notes • Free CIMA lectures • Free CIMA tests • Free tutor support • StudyBuddies • CIMA forums
Tests
Question 1
Which of the following should be more meaningful to users?
A Data
B Information
Question 2
Good information can be described by the mnemonic ‘ACCURATE’. What do the letters stand for?
Question 3
Name two charts used to display frequency distributions.
Question 4
Say whether the following are discrete of continuous data
Discrete ContinuousNumber of children under 10 in each familyWeight of individuals in a populationDistance between citiesFamily income rounded to the nearest $000
Question 5
Draw the following data on a cumulative frequency curve:
Family income Frequency0 - <2,000 52000 - <3,000 203000 - <5,000 5005000 - <10,000 10010,000 - <20,0000 4
2020 Examinations Watch free CIMA BA1 lectures 69

Only on OpenTuition you can find: Free CIMA notes • Free CIMA lectures • Free CIMA tests • Free tutor support • StudyBuddies • CIMA forums
2020 Examinations Watch free CIMA BA1 lectures 70

Only on OpenTuition you can find: Free CIMA notes • Free CIMA lectures • Free CIMA tests • Free tutor support • StudyBuddies • CIMA forums
CHAPTER 8BIG DATA AND DATA ANALYSIS
1 Big dataThe term ‘big data’ refers to extremely large collection of data that may be analysed by computer to reveal patterns, trends, and associations, especially relating to human behaviour and interactions.
Note that two processes are implied:๏ The collection of the data and its storage
๏ The analysis of the data to provide useful information
2 The characteristics of big dataIn 2001 Doug Laney, an analyst with Gartner (a large US IT consultancy company) stated that big data has the following characteristics, known as the 3Vs:๏ Volume: a very large amount of data. More than can be easily handled by a single computer,
spreadsheet or conventional database system. The commonest fourth ‘V’ that is sometimes added is veracity: Is the data true? Can its accuracy be relied upon?
๏ Variety: a disparate non-uniform data of different sizes, sources, shape, arriving irregularly, some from internal sources and some from external sources, some structured, but much of it is unstructured.
๏ Velocity: data arrives continually and often has to be processed very quickly to yield useful results
๏ Some texts add a fourth ‘V’, veracity: the data should be true.
2020 Examinations Watch free CIMA BA1 lectures 71
Only on OpenTuition you can find: Free CIMA notes • Free CIMA lectures • Free CIMA tests • Free tutor support • StudyBuddies • CIMA forums
2.1 VolumeThe volume of big data held by large companies such as Walmart (supermarkets), Apple and EBay is measured in multiple petabytes. What’s a petabyte? It’s 1015 bytes (characters) of information. A typical disc on a personal computer (PC) holds 109 bytes (a gigabyte), so the big data depositories of these companies hold at least the data that could typically be held on 1 million PCs, perhaps even 10 to 20 million PCs. These numbers probably mean little even when converted into equivalent PCs. It is more instructive to list some of the types of data that large companies will typically store:๏ Retailers. Via loyalty cards being swiped at checkouts: details of all purchases you make,
when, where, how you pay, use of coupons. Via websites: every product you have every looked at, every page you have visited, every product you have ever bought. (To paraphrase a Sting song “Every click you make I’ll be watching you”.)
๏ Social media (such as Facebook and Twitter). Friends and contacts, postings made, your location when postings are made, photographs (that can be scanned for identification), any other data you might choose to reveal to the universe.
๏ Mobile phone companies: Numbers you ring, texts you send (which can be automatically scanned for key words), every location your phone has ever been whilst switched on (to an accuracy of a few metres), your browsing habits. Voice mails. Internet providers and browser providers. Every site and every page you visit. Information about all downloads and all emails (again these are routinely scanned to provide insights into your interests). Search terms you enter.
๏ Banking systems. Every receipt, payment, credit card payment information (amount, date, retailer, location), location of ATM machines used.
2.2 VarietySome of the variety of information can be seen from the examples listed above. In particular, the following types of information are held:๏ Browsing activities: sites, pages visited, membership of sites, downloads, searches
๏ Financial transactions
๏ Interests
๏ Buying habits
๏ Reaction to ads on the internet or to advertising emails
๏ Geographical information
๏ Information about social and business contacts
๏ Text
๏ Numerical information
๏ Graphical information (such as photographs)
๏ Oral information (such as voice mails)
๏ Technical information, such as jet engine vibration and temperature analysis
๏ This data can be both structured and unstructured:
‣ Structured data: this data is stored within defined fields (numerical, text, date etc) often with defined lengths, within a defined record, in a file of similar records.
2020 Examinations Watch free CIMA BA1 lectures 72

Only on OpenTuition you can find: Free CIMA notes • Free CIMA lectures • Free CIMA tests • Free tutor support • StudyBuddies • CIMA forums
Structured data requires a model of the types and format of business data that will be recorded and how the data will be stored, processed and accessed. This is called a data model. Designing the model defines and limits the data that can be collected and stored, and the processing that can be performed on it.
An example of structured data is found in banking systems, which record the receipts and payments from your current account: date, amount, receipt/payment, short explanations such as payee or source of the money.
Structured data is easily accessible by well-established database structured query languages.
‣ Unstructured data: refers to information that does not have a pre-defined data-model. It comes in all shapes and sizes and this variety and irregularities make it difficult to store it in a way that will allow it to be analysed, searched or otherwise used. An often quoted statistic is that 80% of business data is unstructured, residing it in word processor documents, spreadsheets, PowerPoint files, audio, video, social media interactions and map data.
2.3 VelocityInformation must be provided quickly enough to be of use in decision making. For example, in the above store scenario, there would be little use in obtaining the price-comparison information and texting customers once they had left the store. If facial recognition is going to be used by shops and hotels, it has to be more-or less instant so that guests can be welcomed by name.
You will understand that the volume and variety conspire against the third, velocity. Methods have to be found to process huge quantities of non-uniform, awkward data in real-time.
2020 Examinations Watch free CIMA BA1 lectures 73

Only on OpenTuition you can find: Free CIMA notes • Free CIMA lectures • Free CIMA tests • Free tutor support • StudyBuddies • CIMA forums
3 Processing big dataThe processing of big data is generally known as big data analytics and includes:๏ Data mining: analysing data to identify patterns and establish relationships such as
associations (where several events are connected), sequences (where one event leads to another) and correlations.
๏ Predictive analytics: a type of data mining which aims to predict future events. For example, the chance of someone being persuaded to upgrade a fight.
๏ Text analytics: scanning text such as emails and word processing documents to extract useful information. It could simply be looking for key-words that indicate an interest in a product or place.
๏ Voice analytics: as above with audio.
๏ Statistical analytics: used to identify trends, correlations and changes in behaviour.
๏ Google provides web-site owners with Google Analytics that will track many features of website traffic.
The analytical findings can lead to:๏ Better marketing
๏ Better customer service and relationship management
๏ Increased customer loyalty
๏ Increased competitive strength
๏ Increased operational efficiency
๏ The discovery of new sources of revenue.
2020 Examinations Watch free CIMA BA1 lectures 74

Only on OpenTuition you can find: Free CIMA notes • Free CIMA lectures • Free CIMA tests • Free tutor support • StudyBuddies • CIMA forums
4 The relationship between data variablesIn a longitudinal study measurements are taken of the same variable at different points in time. For examples, sales each month or profit over a number of years.
In a cross-sectional study data from a number of members of a population is examined at a single point in time. For example, the gross profit percentage achieved by 12 branches of a company in 2018.
Other sorts of study measure two variables and try to see how one variable moves with the other (eg cost and production volume, or advertising expenditure and sales).
For simple patterns, linear regression and the coefficient of correlation are used to provide information about how two variables are related. More complex patterns, particularly longitudinal studies, such as sales over time are likely to require investigation using time series analysis.
5 Linear regressionLinear regression is a method of fitting the best straight line through a set of points.
In business, typically the line would connect points showing:๏ Cost and volume
๏ Selling price and sales volume
๏ Hours worked and units produced
Linear regression will give constants which fit a line of the type:
y = ax + b
where:
y is the dependent variable (cost, hours, volume sold)
x is the independent variable (units made, selling price).
The constant ‘a’, for example, could be the additional cost for each additional unit made; ‘b’ would be the cost even if no units were made (the fixed cost).
Be warned: linear regression will give the best straight line it can through any set of points. For example, if you numbered the days in the year 1 – 365 and you noted the day each person was born and the amount of money they had in their bank account, linear regression would suggest the best relationship it could between these variables. Obviously there would not actually be a good relationship.
2020 Examinations Watch free CIMA BA1 lectures 75

Only on OpenTuition you can find: Free CIMA notes • Free CIMA lectures • Free CIMA tests • Free tutor support • StudyBuddies • CIMA forums
To test the relationship you must calculate the coefficient of correlation (r), or the coefficient of determination (r2). r can vary between:๏ r = +1, meaning perfect positive correlation where all points lie on the line and as one
variable increases, so does the other.
๏ r = -1, meaning perfect negative correlation where all points lie on the line and as one variable increases, the other decreases.
๏ r = 0 means no correlation.
๏ If r = 0.7, the coefficient of determination, r2 = 0.49 or about 50%. This means that 50% of the change in one variable is explained by the change in the other.
You should be aware of the following before you rely on any prediction based on linear regression:๏ If r2 is low, then one variable is not well-associated with the other, so any predictions are liable
to be poor.
๏ The more points (readings) the better: simply more evidence for the association.
๏ Extrapolation (predicting outside the range examined) is dangerous as we have no direct evidence of what happens in other regions. For example, costs might suddenly increase.
๏ Other known influences (such as inflation) should be removed before the analysis.
๏ Even good correlation does no prove cause and effect: both variables might have moved together under the influence of another variable.
2020 Examinations Watch free CIMA BA1 lectures 76

Only on OpenTuition you can find: Free CIMA notes • Free CIMA lectures • Free CIMA tests • Free tutor support • StudyBuddies • CIMA forums
6 Example of linear regressionIf there is a reasonable degree of linear correlation between two variables, we can use regression analysis to calculate the equation of the best fit for the data. This is known as least squares linear regression.
If the equation relating two variables, × and y, is y = a + bx
then the values of a and b may be calculated using the following formulae:
b = n xy− x y∑∑∑
n x 2∑ − x∑( )2
a = y∑
n−
b x∑n
[Note that the symbol ∑ means ‘the sum of’]
Example 1
The following table shows the number of units produced each month and the total cost incurred:
Units $000January 100 40February 400 65March 200 45April 700 80May 600 70June 500 70July 300 50
Calculate the regression line, y = a + bx
2020 Examinations Watch free CIMA BA1 lectures 77

Only on OpenTuition you can find: Free CIMA notes • Free CIMA lectures • Free CIMA tests • Free tutor support • StudyBuddies • CIMA forums
7 The correlation coefficientPearson’s correlation coefficient is a measure of how linear the relationship betweenvariables is.
As mentioned above correlation coefficient of +1 indicates perfect positive linear correlation, whereas -1 indicates perfect negative linear correlation. The further away from + or – 1, the less linear correlation exists.
The correlation coefficient may be calculated using the following formula (which is given to you in the examination)
r = n xy – x y∑∑∑
n x2∑ – x∑( )2⎡⎣⎢
⎤⎦⎥
n y2∑ – y∑( )2⎡⎣⎢
⎤⎦⎥
Example 2
Using the data in the previous example calculate the correlation coefficient
2020 Examinations Watch free CIMA BA1 lectures 78

Only on OpenTuition you can find: Free CIMA notes • Free CIMA lectures • Free CIMA tests • Free tutor support • StudyBuddies • CIMA forums
8 Spearman’s rank correlation coefficientThe coefficient of correlation calculated above is known as Spearman’s correlation coefficient. Another measure of correlation (ie how well the two variables ‘line up’) is Spearman’s rank correlation coefficient. It is not much used in cases as shown above where actual values are known, such as output and costs. It is used when two variables are ranked ie placed in order.
Spearman’s rank correlation coefficient is calculated as:
r=1-
6∑d2
n n2 -1( )⎡
⎣⎢⎢
⎤
⎦⎥⎥
where n is the number of pairs of data and d is the difference between the rankings in each set of data.
r will be between -1 and +1 and it is interpreted in the same way as for Spearman’s coefficient.
Example 3
The positions of seven students in their examinations in accountancy and law are as follows
Student Accountancy position Economics positionA 1 3B 4 7C 2 1D 5 6E 3 2F 7 4G 6 5
Judge whether the position of the students in Statistics correlates with their position in Economics.
2020 Examinations Watch free CIMA BA1 lectures 79

Only on OpenTuition you can find: Free CIMA notes • Free CIMA lectures • Free CIMA tests • Free tutor support • StudyBuddies • CIMA forums
9 Time series analysisLinear regression expects that the relationship between two variables will be strictly linear – explained a straight line. Time series analysis is more adaptable and recognises that the following effects could be present:
A trend: this is an underlying smooth increase or decrease of an amount as time passes.
Seasonal variations: cycles of variation repeating in less than a year. Could be spring, summer, autumn and winter, or sales for each day of the week.
Cyclical variations: cycles of variation repeating in more than a year. Typically, the long-term trade cycle is given as an example.
Random effects: non-repetitive and non-predictable variations.
Time series analysis investigates the first two of these.
Time series analysis – graph
The figure below shows a rising trend with regular seasonal variations.
Time
Sales
“High” seasons
Trend
2020 Examinations Watch free CIMA BA1 lectures 80

Only on OpenTuition you can find: Free CIMA notes • Free CIMA lectures • Free CIMA tests • Free tutor support • StudyBuddies • CIMA forums
6 Analysis of time series
6.1. Method 1 – moving averagesLook at this data:
Year Qtr Time series Sales $0002012 1 1 989.0
2 2 990.03 3 994.04 4 1015.0
2013 1 5 1030.02 6 1042.53 7 1036.04 8 1056.5
2014 1 9 1071.02 10 1083.53 11 1079.54 12 1099.5
2015 1 13 1115.52 14 1127.53 15 1123.54 16 1135.0
2016 1 17 1140.0
You can see from the graph that there is some sort of trend (the line increases overall) and there are seasonal variations with a dip occurring at times 7, 11, 15, corresponding to the 3rd quarter each year. Quarter 2 tends to look high each year. So, if we are going to try to forecast what sales will be in the third quarter of 2010, we would first try to project the trend then superimpose the seasonal effect on that to decrease it appropriately.
Performing a time series analysis is rather tedious and it is likely that in any exam question, much of the work will have been done for you and you have to interpret and apply the results. However, for the purposes of explanation, we will carry out the full process on this data.
2020 Examinations Watch free CIMA BA1 lectures 81
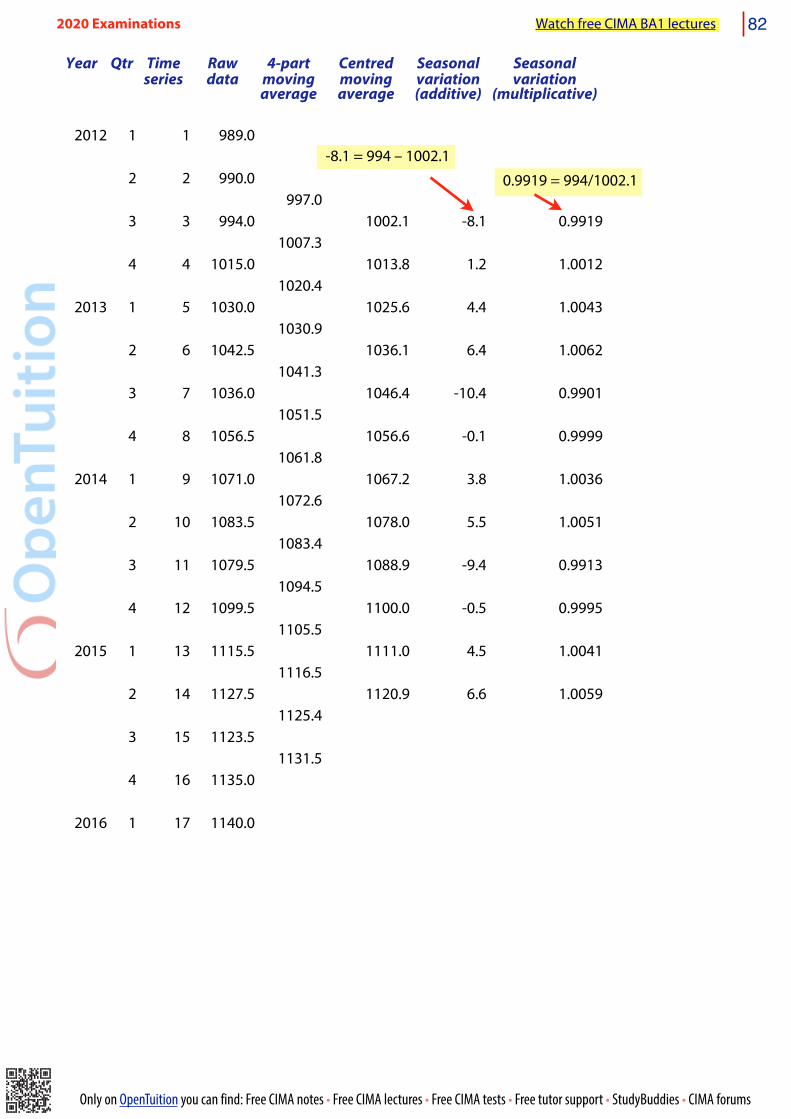
Only on OpenTuition you can find: Free CIMA notes • Free CIMA lectures • Free CIMA tests • Free tutor support • StudyBuddies • CIMA forums
Year Qtr Time series
Raw data
4-part moving average
Centred moving average
Seasonal variation (additive)
Seasonal variation
(multiplicative)
2012 1 1 989.0
2 2 990.0997.0
3 3 994.0 1002.1 -8.1 0.99191007.3
4 4 1015.0 1013.8 1.2 1.00121020.4
2013 1 5 1030.0 1025.6 4.4 1.00431030.9
2 6 1042.5 1036.1 6.4 1.00621041.3
3 7 1036.0 1046.4 -10.4 0.99011051.5
4 8 1056.5 1056.6 -0.1 0.99991061.8
2014 1 9 1071.0 1067.2 3.8 1.00361072.6
2 10 1083.5 1078.0 5.5 1.00511083.4
3 11 1079.5 1088.9 -9.4 0.99131094.5
4 12 1099.5 1100.0 -0.5 0.99951105.5
2015 1 13 1115.5 1111.0 4.5 1.00411116.5
2 14 1127.5 1120.9 6.6 1.00591125.4
3 15 1123.51131.5
4 16 1135.0
2016 1 17 1140.0
-8.1 = 994 – 1002.1 0.9919 = 994/1002.1
2020 Examinations Watch free CIMA BA1 lectures 82

Only on OpenTuition you can find: Free CIMA notes • Free CIMA lectures • Free CIMA tests • Free tutor support • StudyBuddies • CIMA forums
The first four columns are as before.
The next column is called ‘4-part moving average’. It is ‘4-part’ because we believe the data repeats over four seasons. If we though it repeated over, say, five days in the week, we would create the 5-part moving average.
The moving average is the average of the four components in the cycle. So here:
997 = (989 + 990 + 994 + 1015)/4
Then, moving down one season:
1007.3 = (990 + 994 + 1015 + 1030)/4
Progressing down the data, the four-part moving average contains one element from each season. This is really where isolating the trend happens because the high season and low season components tend to cancel out.
The trouble with four-season moving averages (or any even periodicity) is that the moving average is not really ‘opposite’ any season. To get a figure which is centred on a season, adjacent moving averages are themselves summed. This is not necessary if we start with, say, 5 seasons in the repetitive cycle).
Therefore:
1002.1 = (997.0 + 1007.3)/2
1013.8 = (1007.3 + 1020.4)/2
This data represents the trend line and if plotted on a graph would look like:
This example yields a very smooth trend; you would not always expect such a linear result.
The trend figure has gone from 1002.1 to 1120.9 in 11 seasonal increments, so the increase per season is (1120.9 – 1002.1)/11 = 1.7.
The seasonal variations are obtained by comparing the raw data for each season to the trends. The comparisons can either be done by subtraction (the additive model) or by proportions (the multiplicative model).
2020 Examinations Watch free CIMA BA1 lectures 83

Only on OpenTuition you can find: Free CIMA notes • Free CIMA lectures • Free CIMA tests • Free tutor support • StudyBuddies • CIMA forums
The variations are grouped by season and averaged out:
Additive: Multiplicative:
1 2 3 4
-8.1 1.24.4 6.4 -10.4 -0.13.8 5.5 -9.4 -0.54.5 6.6
Average 4.2 6.2 -9.3 0.2
The analysis has now been completed, and the results can be used to make forecasts. Let’s say we want to forecast season 3 for 2016. The approach is:
Project the trend
Adjust for the seasonal variation appropriate for that season.
The last trend figure we have is for season 2 of 2015 and that was 1120.9. Season 3 of 2016 is five seasons further on, so the predicted trend figure would be:
1120.9 + 5 x 1.7 = 1129.4
Season 3 has an adjustment amount of -9.3 or 0.9957. Applying these adjustments to the trend would result in predictions of:
Additive: 1129.4 – 9.3 = 1120.1
Multiplicative: 1129.4 x 0.9911 = 1119.4
This method of predicting future amounts is more sophisticated than linear regression, but neither, of course, guarantees an accurate answer. However, they are at least using historical evidence on which to base forecasts and this must surely be better than pure guesswork.
2020 Examinations Watch free CIMA BA1 lectures 84
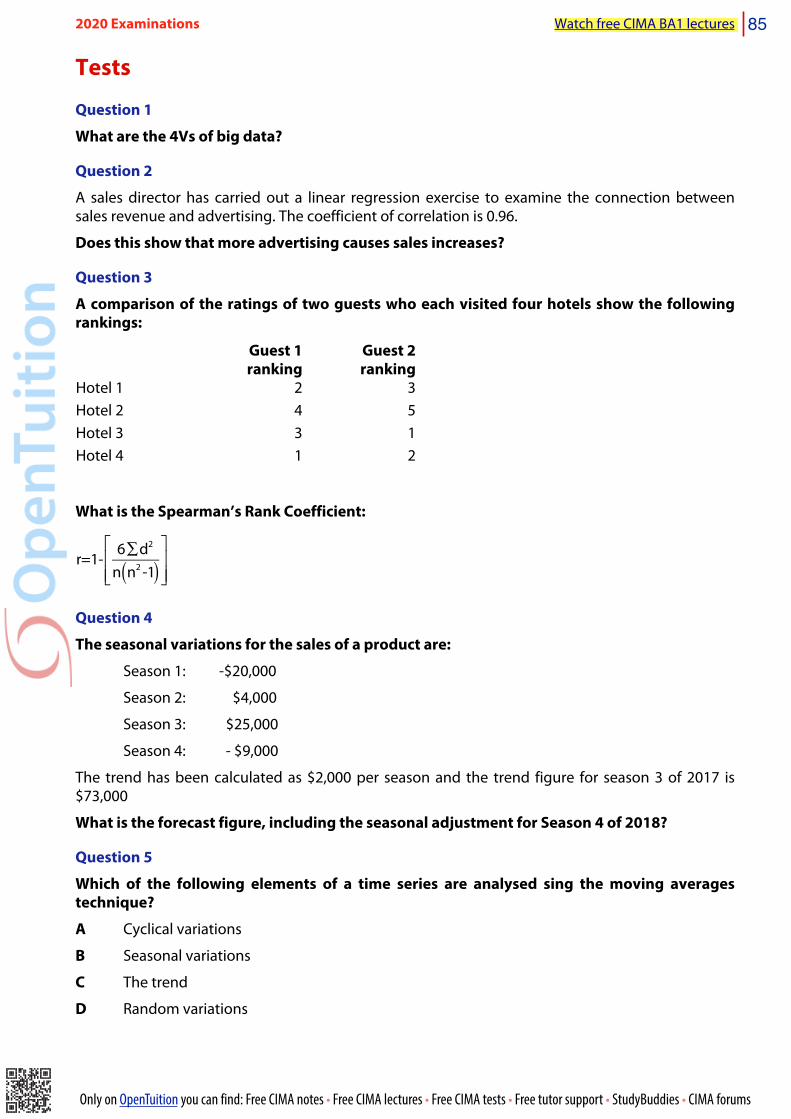
Only on OpenTuition you can find: Free CIMA notes • Free CIMA lectures • Free CIMA tests • Free tutor support • StudyBuddies • CIMA forums
Tests
Question 1
What are the 4Vs of big data?
Question 2
A sales director has carried out a linear regression exercise to examine the connection between sales revenue and advertising. The coefficient of correlation is 0.96.
Does this show that more advertising causes sales increases?
Question 3
A comparison of the ratings of two guests who each visited four hotels show the following rankings:
Guest 1ranking
Guest 2ranking
Hotel 1 2 3Hotel 2 4 5Hotel 3 3 1Hotel 4 1 2
What is the Spearman’s Rank Coefficient:
r=1-
6∑d2
n n2 -1( )⎡
⎣⎢⎢
⎤
⎦⎥⎥
Question 4
The seasonal variations for the sales of a product are:
Season 1: -$20,000
Season 2: $4,000
Season 3: $25,000
Season 4: - $9,000
The trend has been calculated as $2,000 per season and the trend figure for season 3 of 2017 is $73,000
What is the forecast figure, including the seasonal adjustment for Season 4 of 2018?
Question 5
Which of the following elements of a time series are analysed sing the moving averages technique?
A Cyclical variations
B Seasonal variations
C The trend
D Random variations
2020 Examinations Watch free CIMA BA1 lectures 85

Only on OpenTuition you can find: Free CIMA notes • Free CIMA lectures • Free CIMA tests • Free tutor support • StudyBuddies • CIMA forums
2020 Examinations Watch free CIMA BA1 lectures 86

Only on OpenTuition you can find: Free CIMA notes • Free CIMA lectures • Free CIMA tests • Free tutor support • StudyBuddies • CIMA forums
CHAPTER 9FINANCIAL MARKETS AND INSTITUTIONS
1 IntroductionFinancial markets and institutions primarily deal with money, investments and risk (insurance). They are an essential part of any modern economy – despite the excesses that led to the 2008 financial crash.
2 Financial intermediaries
2.1 The purpose of moneyMoney has a number of important functions:๏ It is a means of exchange. If there were no money then all transactions would be by bartering
ie the exchange of goods. Money immeasurably frees up the flexibility with which goods and services can be exchanged.
๏ It is a store of value. The amount of money in your current or deposit account represents value or wealth that can be spent in the future.
๏ It is a unit of account. The price of an item represents what it is valued at. The amount of an expense is a measure of the cost of the item or service. Comparisons can be made, for example, when deciding to heat you home by electricity or gas.
๏ It can act as a deferred payment. Rather than paying for something immediately you can be given credit and you can pay for the item later. The provision of credit is an important way of stimulating an economy. If everyone were given a month’s credit on all purchases, they could immediately go out and buy another month’s supply of goods, which increases suppliers’ sales and profits.
2020 Examinations Watch free CIMA BA1 lectures 87

Only on OpenTuition you can find: Free CIMA notes • Free CIMA lectures • Free CIMA tests • Free tutor support • StudyBuddies • CIMA forums
2.2 Flows of money and creditThis diagram represents the flows of money and credit in a modern, fully-functioning economy:
Businesses
Financialintermediaries
Overseas
Individuals
Government
The diagram shows that every sector has dealings with every other. For example:๏ Businesses and individuals: individuals buy from businesses; businesses employ individuals
and pay wages.
๏ Businesses and government: businesses pay tax and governments sometime sprovide grants.
๏ Businesses and overseas: imports and exports.
However, these interactions would be more difficult without financial intermediaries. For example:๏ A business could pay its employees cash (and this used to be common), but now it is more
convenient and more secure to pay wages and salaries into employees’ bank accounts.
๏ Businesses could pay their tax to government by loading cash into a wheelbarrow and delivering it to the country’s treasury, but a transfer via a bank makes more sense.
๏ When going on holiday we could take our own currency and negotiate with an individual on a street corner, but changing currency in a bank or withdrawing cash from and ATN might reduce the chance of being mugged.
2020 Examinations Watch free CIMA BA1 lectures 88

Only on OpenTuition you can find: Free CIMA notes • Free CIMA lectures • Free CIMA tests • Free tutor support • StudyBuddies • CIMA forums
2.3 Banks as financial intermediariesBanks form the most important category of financial intermediary and they perform the following functions:๏ Safe storage: banks store cash in their vaults and can impose strict security. If they didn’t
exist, cash would have to be stored locally by its owners in much less secure circumstances.
๏ Risk reduction: if a bank is lending money it has the technical and legal expertise to properly appraise the borrower for credit worthiness and to ensure that loan documentation is in order. Additionally, each bank will lend to a wide range of borrowers and any one debt going bad should not put the bank at risk.
๏ Maturity transformation: you might be saving for your holiday and will therefore want to withdraw your money in a few months. However, companies might want three or five year loans to finance their expansion. Banks can make use of lots of short-term deposits to create long-term loans.
๏ Consolidation: lots of small deposits allow several large loans.
๏ Credit creation: by issuing credit cards and organising loans and overdrafts, banks help to ‘create’ money by giving people the means to spend more.
๏ Intermediation: borrowers and lenders are matched. This is not on a one-to-one basis but surplus funds are matched with parties needing to raise loans.
๏ Transfer of money: the clearing system for cheques or internet banking allow funds to be easily transferred eg between purchaser and supplier.
2.4 Other financial intermediaries๏ Insurance companies: these have a role in spreading risk and safeguarding wealth. They can
also act as investment vehicles, taking premiums from customers and investing in shares.
๏ Investment trusts and unit trusts: investors’ money is used to buy shares and other investments. They allow investors to spread their risk. For example, a funds might specialise in European shares and investor’s cash will be used to buy shares in perhaps 20 major European companies. Alternatively, a fund might specialise in emerging markets and investments will be in a number of shares from those markets. No investment or unit trust fund will ever invest in just one share.
๏ Pension funds: allow investors’ pension contributions so be invested in a wide range of shares.
๏ Venture capitalists: specialise in placing investors’ money into young ventures and start-ups.
2020 Examinations Watch free CIMA BA1 lectures 89

Only on OpenTuition you can find: Free CIMA notes • Free CIMA lectures • Free CIMA tests • Free tutor support • StudyBuddies • CIMA forums
3 Financial markets and financial instruments
3.1 What is a financial instrument?A financial instrument are assets that can be traded and which permit efficient flows of capital between investors and those needing capital for their operations. Financial instrument are contracts that create a financial asset of one entity and a financial liability or equity instrument of an other entity.
Examples are:๏ Equity shares
๏ Preference shares
๏ Debentures and bonds
๏ Convertibles
๏ Loans and overdrafts.
๏ Lease contracts.
๏ Certificates of deposits.
๏ Government bonds.
๏ Bills of exchange.
The instruments differ in their rights and obligations and their term (ie how long they last).
3.2 Equity sharesInvestors can subscribe for new equity shares or buy equity shares that have already been issued. Shareholders are entitled to vote at company meetings and to receive dividends is the directors declare them.
Shareholders in private companies can find it difficult to sell their shares as there is no market that determines a share price nor to facilitate finding someone who wants to buy the shares. However, once a company is listed on a public stock exchange the shares will have a market price and the stock exchange allows buyers and sellers to be easily matched. Listed shares are therefore much more liquid than private shares because they can be easily sold and turned into cash.
Equity shares are long term, usually permanent, sources of finance. The market value equity shares in successful companies can rise steeply making large gains for investors. If the company does badly, equity shareholders stand to make losses on their shares or they lose their investment if the company fails.
3.3 Preference sharesRelatively uncommon. They promise a fixed dividend each year, but their value is static. Preference shareholders often have no vote at company meetings.
Preference shares are long term sources of finance but might be redeemable (repayable) at some date in the future.
2020 Examinations Watch free CIMA BA1 lectures 90

Only on OpenTuition you can find: Free CIMA notes • Free CIMA lectures • Free CIMA tests • Free tutor support • StudyBuddies • CIMA forums
3.4 Debentures and bondsDebentures, or loan certificates, or bonds are the written acknowledgement of a debt. They are issues by companies to investors and are often secured on company assets to provide more safety for lenders. They state the fixed rate of interest that will be paid and they can be irredeemable or redeemable. If the latter, they will state when the debt will be repaid.
They can be quoted on the bond market and this gives investors more liquidity.
Debentures are a relatively safe form of investment because:๏ They are usually secured on company assets
๏ The interest is fixed and must be paid before dividends
๏ If the company is wound up, debenture-holders are repaid before shareholders
However, debentures will normally not enjoy much benefit from the growth of the company.
3.4 ConvertiblesConvertibles start life as debentures but give investors the option of converting the debentures to shares. This allows investors to take a ‘wait-and-see’ approach. Invest in safe debentures, then convert to shares if the company seems to be doing well.
3.5 Loans and overdraftsThese are usually provided by banks. The loans can be short term (roughly <1 year), medium (1 – 5 years) or long term (usually >5 years).
Overdrafts are, strictly speaking, repayable on demand and are therefore not suitable for long term capital requirements. Instead, they should be used for short term liquidity problems such as having o buy inventory before a very busy sales period. The subsequent sales will allow the overdraft o be repaid.
3.6 Lease contractsLeasing finance is provided by banks and specialist finance companies. Leases effectively allows assets to be rented rather than purchased outright and they provide a very important source of liquidity, particularly for machinery.
3.7 Certificates of depositA certificate of deposit is the evidence that a deposit has been made with a bank at a fixed rate of interest and which is repayable on a set date. Depositors do not have to wait until the repayment date of the bond to get their money back because the certificates and be traded on the money market.
2020 Examinations Watch free CIMA BA1 lectures 91

Only on OpenTuition you can find: Free CIMA notes • Free CIMA lectures • Free CIMA tests • Free tutor support • StudyBuddies • CIMA forums
3.8 Government bondsGovernment bonds (or Treasury bills or ‘gilts’) are issued by governments when they need to borrow. They are for fixed rates of internet and are usually repayable by a certain date. They can be traded on the stock exchange and provide liquidity for the government and a place to invest money for the public and companies.
Consider a 5% Treasury Bond.. It will look something like:
$100 5% $100
This means that if you own this piece of paper you would receive $5 interest every year (5% x $100, the nominal value).
If the current interest rate in the economy is 5%, then the market value of this bond will be $100 so that by buying it at $100 you earn the current rate of interest. If, however, interest rates in the economy rose to 7%, then the market value of the bond would fall as it is only paying $5 per year. The market value will fall until a purchaser earns 7% per year if the bond is purchased. So:
Interest x 100 =
5 x 100 = 7 Market value x 100 = Market value x 100 = 7
Market value = 5 x 100/7 = $71.43
[Buying something for $71.43 and earning $5 pa is equivalent to a rate of interest of 5/71.43 = 7%
Similarly, in interest rates fell below 5%, the market value of the bond would increase so that investors would earn the appropriate rate of interest.
3.9 Bills of exchange
A bill of exchange is a non-interest-bearing instrument primarily in international trade that binds one party to pay a fixed sum of money to another party at a predetermined future date. They are very like cheques and are used for the transfer of funds. They are not so common now as other forms of payment (eg e-banking) have become popular.
2020 Examinations Watch free CIMA BA1 lectures 92

Only on OpenTuition you can find: Free CIMA notes • Free CIMA lectures • Free CIMA tests • Free tutor support • StudyBuddies • CIMA forums
4 Central banksA central bank is a bank that acts for the government. In the UK the central bank is the Bank of England; in the USA it is the Federal Reserve.
In general, a central bank carries out the following functions:๏ It is the Government’s banker. For example, receiving tax and the proceeds of the issue of
Treasury Bonds.
๏ Manages the national debt (Government borrowing) ensuring that repayments are made when due and finding buys for new issues of bonds.
๏ It is the central note issuing authority.
๏ Management of foreign exchange movements and balances.
๏ Setting interest rates.
๏ Controlling credit.
๏ Overseeing the financial system (since 2014 in the UK since 2014, the independent Financial Conduct Authority performs many regulatory tasks).
๏ A lender to the banking system. For example, if a bank suffers a ‘run’, meaning that many people want to withdraw their money at the same time), the bank will need to raise cash (remember that depositors’ money will have been lend on again by banks, so is not available to repay depositors). The central bank is often known as the ‘lender of the last resort’ because they will nearly always provide funds to banks. The interest rate charged influences the economy’s interest rates and this is how interest rates are controlled.
๏ Controlling inflation. In the UK it is the Bank of England’s responsibility to control the rate of inflation.
2020 Examinations Watch free CIMA BA1 lectures 93

Only on OpenTuition you can find: Free CIMA notes • Free CIMA lectures • Free CIMA tests • Free tutor support • StudyBuddies • CIMA forums
5 The structure of interest ratesA yield curve links the expected yield from bonds of a similar nature but with different maturity dates. They give clues as to how investors expect interest rates to move in the future.
If there were four bonds of similar risks, maturing in 3 months 1 year, 5 years and 20 years, how would you expect your annual returns to vary? In general you should require a higher return (yield) from the 10 year bond because you are locking your money away for 10 years and that subjects you to more risk than tying up money for just 3 months.
It can also imply that interest rates are likely to rise. So, if you are going to lock money away for ten years in a fixed interest bond, and you expect interest rates to rise over the ten years, then you would demand a higher yield to anticipate future rises in interest rates.
The normal yield curve should therefore look something like:
Return (or yield)
Time to maturity
Sometime yield curves invert and can look something like:
Return (or yield)
Time to maturity
This implied that interest rates are expected to fall, so it might be worthwhile locking into a long-term bond at a lower interest rate because the actual interest rate might be even lower in the future.
2020 Examinations Watch free CIMA BA1 lectures 94

Only on OpenTuition you can find: Free CIMA notes • Free CIMA lectures • Free CIMA tests • Free tutor support • StudyBuddies • CIMA forums
6 Credit creation by banksWhen you deposit money in a bank, the bank lends that money on to customers, who in turn will place that money in their accounts. The reserve ratio describes the proportion of each deposit that has to be kept as cash by the bank. So if there was a reserve ratio of 25%, the depositing and lending cycles would look like:
Deposit Bank keeps Bank lends1ST customer deposits 1000.00 250.00 2nd customer borrows 750.002nd customer deposits 750.00 187.50 3rd customer borrows 562.503rd customer deposits 562.50 140.63 4th customer borrows 421.884th customer deposits 421.88 105.47 5th customer borrows 316.415th customer deposits 316.41 79.10 6th customer borrows 237.306th customer deposits 237.30 59.33 7th customer borrows 177.98And so on……
So the original $1000 that the first customer had has provided funds of 750.00 + 562.50 + 421.88 +…… etc. It can be shown that if the reserve ratio is r%, then the total amount of credit created is:
Original deposit x 1/r.
In the example above this would be 1000 x 1/0.25 = 4,000.
By altering the reserve ratio that banks must use the central banks can allow credit and the money supply in the economy to either expand or shrink and this is an important method of monetary control.
Higher reserve ratios also keep banks more stable because they retain a higher proportion of cash.
7 Foreign exchange marketsChapter 11 will explain the risks that can arise from foreign exchange transactions. Here we explain a little about how foreign exchange rates and currencies are managed.
7.1 Fixed and floating exchange ratesA government can attempt to fix (peg) its currency’s exchange rate with respect to another currency or group of currencies. This provides certainty for importers and exporters because they know exactly how much imports and exports represent in their own currency.
So that the fixed exchange rate is maintained the government must purchase or sell its currency to achieve a perfect match of supply and demand for its currency – otherwise market forces will inevitably move the exchange rate. If the prevailing sentiment of the market is that a currency is overvalued, holders of the currency will want to sell it before it falls in value. To maintain its price the government will have to buy it up and to do this will have to use its reserves (eg gold or another currency) to pay for the purchases. If investors panic there will be a run on the currency and it becomes very expensive, or impossible, for the government to prevent a devaluation.
Fixed exchange rates do not respond to the health of an economy. For example, if an economy is not producing goods that are popular abroad, the exchange rate and the price of any exported goods will be fixed. However, it might be better to allow the currency to devalue so that exports become cheaper to foreign consumers. This will stimulate the economy (and tax receipted by the government) because more goods can be made and successfully exported.
2020 Examinations Watch free CIMA BA1 lectures 95

Only on OpenTuition you can find: Free CIMA notes • Free CIMA lectures • Free CIMA tests • Free tutor support • StudyBuddies • CIMA forums
With floating exchange rates, the rates are allowed to change constantly in response to market forces. This introduces uncertainty for importers and exporters but governments never have to spend reserves to support their currency. In addition, exchange rates vary in response to an economy’s health and this provides a self-correcting mechanism.
In fact, no currency is wholly fixed or floating. In a fixed exchange rate regime, market pressures can affect the exchange rate and a "black market" can develop which better reflects supply and demand for the currency. The central bank might then then be forced to revalue or devalue the official rate so that the rate is in line with the unofficial one. In a floating exchange rate regime, the central bank may also intervene to ensure to dampen exchange rate volatility
There are some variants on the pure fixed and floating approaches such as margins around an adjustable peg. In this system the exchange rate is allowed to vary freely within a range around a peg, but if there were a fundamental imbalance the peg would be moved (ie a devaluation or revaluation).
7.2 Single currency zonesOn January 1, 2002, countries officially introduced the Euro banknotes and coins to replace their national currencies. There are now 19 countries whose currency is the Euro.
Claimed advantages of the Euro single currency zone:๏ The Euro would have the enhanced credibility because it is the currency of a large geographic
area and would have more stability against speculation than individual currencies would be.
๏ Greater stability should lower risk and reduce interest rates
๏ Greater convenience for individuals travelling within the zone because money does not have to be changed.
๏ Greater convenience and certainty for importers and exporters within the zone. This should stimulate trade and job creation.
Claimed disadvantages of the Euro single currency zone:๏ Inability to respond to individual countries’ economic needs. For example, all countries in the
zone must have the same interest rates, but some might want lower rates to stimulate their economies.
๏ Different countries will be at different stages of their economic cycles.
๏ Loss of national sovereignty eg different views on tax, government spending and inflation. In fact, much of the Euro’s troubles stem from there being a single currency but very diverse economic policies in each country.
2020 Examinations Watch free CIMA BA1 lectures 96
Only on OpenTuition you can find: Free CIMA notes • Free CIMA lectures • Free CIMA tests • Free tutor support • StudyBuddies • CIMA forums
7.3 Foreign currency reservesForeign currency reserves represents the amount of foreign currency and gold held by a central bank. The reserves can be used to buy buy and sell a country’s own currency to maintain an exchange rate and to guarantee the country’s external debt. It’s rather like you telling someone to whom you owe money, ”Don’t worry, because I have assets which I can give you or sell to generate funds that I can pay you with”.
The most important foreign currency used as a reserve currency is the US$.
Typical 2016 amounts, measured in US$, of foreign currency reserves held were:๏ China: 3,000B
๏ Japan: 1,200B
๏ Germany: 200B
๏ UK: 160B
From time-to-time governments and central banks impose exchange controls and intervene, not only to maintain a rate of exchange which is quite different from what would have prevailed without such control, but also to require the buyers and sellers of foreign currencies to dispose of their foreign funds in particular ways.
For example, if savers thought that their currency was going to devalue they could opt to change it into US$. That will, of course, cause the currency to weaken and the government could simply ban all currency exchange of, say, more than say $100.
In the UK in the 1960s when the economy was very weak, the government laid down a maximum amount of £50 that citizens could change to a foreign currency when visiting abroad.
2020 Examinations Watch free CIMA BA1 lectures 97

Only on OpenTuition you can find: Free CIMA notes • Free CIMA lectures • Free CIMA tests • Free tutor support • StudyBuddies • CIMA forums
Tests
Question 1
What is meant by the phrase ‘maturity transformation’?
A The provision of pension funds
B Allowing short term deposits to become long term loans
C Changing debentures into shares
D Creating credit by lending out deposits
Question 2
An investor owns par value $12,000, 6% government bonds.
What will the market value of these be if the interest rate in the economy is 4%?
Question 3
Does an inverted yield curve mean that investors expect interest rates to rise or fall?
Question 4
Would you expect the rate of interest charged on a convertible to be higher or lower than charged on a straight debenture?
Question 5
If a country wants to fix its exchange rate, but there is downward pressure on it, does the country have to spend its reserves to buy its currency or sell its currency and earn reserves?
2020 Examinations Watch free CIMA BA1 lectures 98

Only on OpenTuition you can find: Free CIMA notes • Free CIMA lectures • Free CIMA tests • Free tutor support • StudyBuddies • CIMA forums
CHAPTER 10FINANCIAL MATHEMATICS
1 IntroductionThis chapter looks at the calculation of interest on investments and also at the techniques of present values and internal rates of return.
2 Interest
2.1 Simple interestA sum of money invested or borrowed is known as the principal.
When money is invested it earns interest; similarly when money is borrowed, interest is payable. Note that interest is not permitted in Islamic finance.
With simple interest, the interest is receivable or payable each year, but is not added to the principal for the calculation of future interest.
Example 1
A man invests $200 on 1 January each year, starting 2018. On 31 December each year simple interest is credited at 10% but this interest is put in a separate account and does not itself earn interest.
Find the total amount standing to his credit on 31 December following his third payment of $200.
2.2 Compound interestWith compound interest the interest is added each year to the principal and in the following year the interest is calculated on the total.
Example 2
A man invests $500 now for 3 years with interest at 10% p.a.
How much will be in his account after 3 years?
Example 3
A man invests $800 at 6%p.a. for 5 years.
How much will be in his account at the end of 5 years?
2020 Examinations Watch free CIMA BA1 lectures 99

Only on OpenTuition you can find: Free CIMA notes • Free CIMA lectures • Free CIMA tests • Free tutor support • StudyBuddies • CIMA forums
3 Effective Rate and APR/AER ratesFor simplicity, the previous compound interest examples have assumed that interest is calculated only once a year. However, in practice interest may be calculated on a monthly (or even daily) basis. This is straightforward if the interest rate is also quoted per quarter, as the following example shows.
Suppose that you save $1000 in an account that pays 2% interest every quarter. How much do you have in one year, if the interest is paid in the same account?
To solve this we can use the formula for compound interest used above which says that a principal P accumulates to
P (1 + r)n over a period n, if the rate is r.
The rate r = 0.02 is measured in quarters, so we also have to measure the period n in quarters. One year is four quarters, so the capital accumulates to:
1,000 x (1 +0.02)4 = $1082.43 pounds.
You can see that over the year interest totalling $82.43 has been added to the principal of $1,000 and this represents an effective interest rate of 8.243% pa. The effective interest rate can also be called the annual equivalent rate (AER) or annual percentage rate (APR).
Example 4
A credit card company charges a nominal rate of 2% per month.
If a customer has purchased $100 worth of goods on his credit, calculate the amount she will owe after one year, and also the annual percentage rate (APR)
2020 Examinations Watch free CIMA BA1 lectures 100

Only on OpenTuition you can find: Free CIMA notes • Free CIMA lectures • Free CIMA tests • Free tutor support • StudyBuddies • CIMA forums
However, interest rates are usually not quoted per quarter even if interest is paid quarterly. The rate is usually quoted per annum (p.a.).
It may seem logical to quote the rate as 8.243%. After all, we computed that $1000 accumulates to $1082.43 in a year. However, it would be common to quote 2% per quarter as being 8% per year. 8% is the nominal rate, but that is, of course, not really the interest rate that is actually charged.
To compute the effective interest rate from the nominal interest rate first divide the nominal rate by the number of periods in the year then use that rate to work out the compound interest.
Example 5
Suppose that an account offers a nominal interest rate of 8% p.a. payable quarterly.
(a) What is the AER?(b) What if the nominal rate is the same, but interest is payable: (i) monthly (ii) weekly (iii) daily?
4 DiscountingHere is a simple choice. Would you rather have:
1. $1,000 now, or
2. $1,000 in one year’s time?
Most people would prefer option 1 because it is:๏ Safer
๏ Gives immediate enjoyment
๏ Even if you do not need it now, you can invest it for a year.
The value of investment can be evaluated by looking at interest rates. If the money could be placed on deposit at 6% for a year, then the two options really are:
1. $1,000 x 1.06 = $1,060 in 1 year, or
2. $1,000 in one year.
So earlier flows are worth more than later ones.
Instead of projecting amounts into the future (which calculates the terminal values), it is more normal to bring all amounts back to the present. So, for option 2, we want to find out how much would need to be received now to become (be identical to) $1,000 in one year.
So, if p is received now and invested at 6% to become $1,000, the following must be true:
p x 1.06 = 1,000
p = 1,000/1.06 = 943.40.
$943.40 is known as the present value of receiving $1,000 in 1 year at a discount rate of 6%.
This means $943.40 is equivalent to receiving $1,000 in 1 year if interest rates are 6%. [Check $943.30 invested at 6% becomes $943.40 x 1.06 = $1,000]
So the two original options can be rephrased as:
2020 Examinations Watch free CIMA BA1 lectures 101

Only on OpenTuition you can find: Free CIMA notes • Free CIMA lectures • Free CIMA tests • Free tutor support • StudyBuddies • CIMA forums
Would you rather have:
1. $1,000 now, or
2. $943.30 now?
Obviously, option 1 is preferable.
Example 6
(a) By working out the present values of the options, indicate which of the following options is preferable:
$3,000 received now or
$4,000 received in 4 years
Interest rate = 7%
(b) By working out the present values of the options, indicate which of the following options is preferable|:
$3,000 received in 2 years or
$3,800 received in 5 years
Interest rate = 10%
5 Discounted cash flow tablesThe above examples should help you to realise that:
Present value = Cash flow ×1
(1+r)n or [or Cash flow x (1 + r)-n
where:
r = discount rate as a decimal
and
n = number of years in the future the flow occurs.
You can see this in previous example 1 where the present value of $4,000 received in 4 years at an interest rate (discount rate) of 7% is:
PV = 4,000×1
(1+0.07)4 = 4,000×0.736=3,052
0.763 is known as the discount factor for 4 years at 7%.
Instead of having to work this out manually, discount tables are routinely provided. They are at the start of this set of notes, but here is an excerpt:
2020 Examinations Watch free CIMA BA1 lectures 102

Only on OpenTuition you can find: Free CIMA notes • Free CIMA lectures • Free CIMA tests • Free tutor support • StudyBuddies • CIMA forums
You will see that with a discount rate of 7% and a period of 4 years, the discount factor is as was previously calculated, 0.763.
It is common in investment appraisal to have a number of years with equal flows: this would be termed an ‘annuity’. For example, the same rent might have to be paid for several years.
So, if a payment of $1,500 had to be made after one, two, and three years, with a discount rate of 9%, the calculation could be set out as:
Time Cash flow $ Discount factor(see table above)
Discounted cash flow $
1 1,500 0.917 1,375.502 1,500 0.842 1,263.003 1,500 0.772 1,158.00
Total 3,796.50
2020 Examinations Watch free CIMA BA1 lectures 103

Only on OpenTuition you can find: Free CIMA notes • Free CIMA lectures • Free CIMA tests • Free tutor support • StudyBuddies • CIMA forums
However, a faster way of working this out would be to add up the discount factors and multiply their total by $1,500:
Time Cash flow $ Discount factor(see table above)
Discounted cash flow $
1 1,500 0.9172 1,500 0.8423 1,500 0.772
1,500 2.531 3,796.50
This would normally be written out as:
Time Cash flow $ Discount factor(see table above)
Discounted cash flow $
1 - 3 1,500 2.531 3,796.50
Once again, this type of calculation is made easier by the use of tables known as Annuity Tables or Cumulative Discount Tables. Here’s an excerpt:
You will see that at a discount rate of 9% and for three periods (n = 3), the annuity discount factor from this table is 2.531, as was calculated above.
It is important to realise that if you are using discount factors straight from annuity tables, then the cash flows must start after 1 year and occur every year up to the stated number off periods.
Therefore, if any other pattern of flows occurs the discount factor will have to be adjusted.
So, if $200 is to be received in years 4 – 10 with a 5% discount rate, the required calculation would be:
Cumulative discount factor years 1 – 10 7.722
less: cumulative discount factor years 1 – 3 2.723
Cumulative discount factor years 4 – 10 4.999
Therefore, the present value of the cash received is $200 x 4.999 = $999.8
2020 Examinations Watch free CIMA BA1 lectures 104
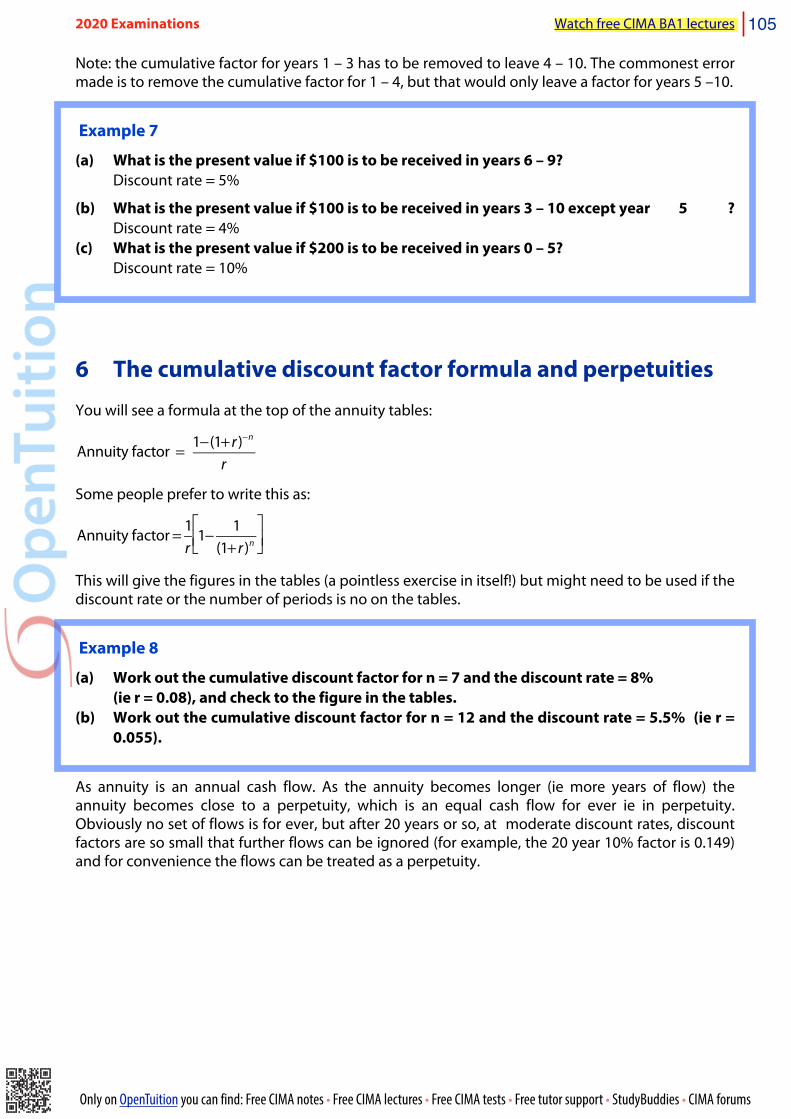
Only on OpenTuition you can find: Free CIMA notes • Free CIMA lectures • Free CIMA tests • Free tutor support • StudyBuddies • CIMA forums
Note: the cumulative factor for years 1 – 3 has to be removed to leave 4 – 10. The commonest error made is to remove the cumulative factor for 1 – 4, but that would only leave a factor for years 5 –10.
Example 7
(a) What is the present value if $100 is to be received in years 6 – 9? Discount rate = 5%
(b) What is the present value if $100 is to be received in years 3 – 10 except year 5 ? Discount rate = 4%(c) What is the present value if $200 is to be received in years 0 – 5? Discount rate = 10%
6 The cumulative discount factor formula and perpetuitiesYou will see a formula at the top of the annuity tables:
Annuity factor = 1−(1+ r )−n
r
Some people prefer to write this as:
Annuity factor = 1
r1− 1
(1+ r )n
⎡⎣⎢
⎤⎦⎥
This will give the figures in the tables (a pointless exercise in itself!) but might need to be used if the discount rate or the number of periods is no on the tables.
Example 8
(a) Work out the cumulative discount factor for n = 7 and the discount rate = 8% (ie r = 0.08), and check to the figure in the tables.(b) Work out the cumulative discount factor for n = 12 and the discount rate = 5.5% (ie r =
0.055).
As annuity is an annual cash flow. As the annuity becomes longer (ie more years of flow) the annuity becomes close to a perpetuity, which is an equal cash flow for ever ie in perpetuity. Obviously no set of flows is for ever, but after 20 years or so, at moderate discount rates, discount factors are so small that further flows can be ignored (for example, the 20 year 10% factor is 0.149) and for convenience the flows can be treated as a perpetuity.
2020 Examinations Watch free CIMA BA1 lectures 105

Only on OpenTuition you can find: Free CIMA notes • Free CIMA lectures • Free CIMA tests • Free tutor support • StudyBuddies • CIMA forums
Notice what happens the annuity factor formula as n, the number of years of flow, becomes very large
Annuity factor = 1
r1− 1
(1+ r)n
⎡
⎣⎢
⎤
⎦⎥
An n becomes large this term becomes very small and the formula can be simplified to
Perpetuity factor = 1Perpetuity factor = rSo, the present value of receiving $1,000 from time 1 to infinity at a discount rate of 10% is:
PV = 1,000 =$10,000PV = 0.1 =$10,000
Note that as with annuities, perpetuities start at time 1 and occur every year. So, if the pattern is something else, the perpetuity factor will have to be adjusted.
7 Using present values in investment appraisal – net present value approach.
It was shown above that flows of cash occurring at different times cannot be directly compared. For comparison all flows are discounted to their present values.
For investment appraisal the cash outflows (usually the initial investment) and inflows (usually the future income and sale of the non-current asset at the end of its life) are all discounted to their present values. Outflows are negative, inflows are positive and when added up the net total is known as the net present value (NPV).
If the NPV > 0 the present value of the inflows exceeds the present value of the outflows, so the business would be richer. The investment would be worthwhile and should be accepted.
If the NPV< 0 the present value of the outflows exceeds the present value of the inflows and this means that the business would be poorer if it invested. The investment should be rejected
2020 Examinations Watch free CIMA BA1 lectures 106
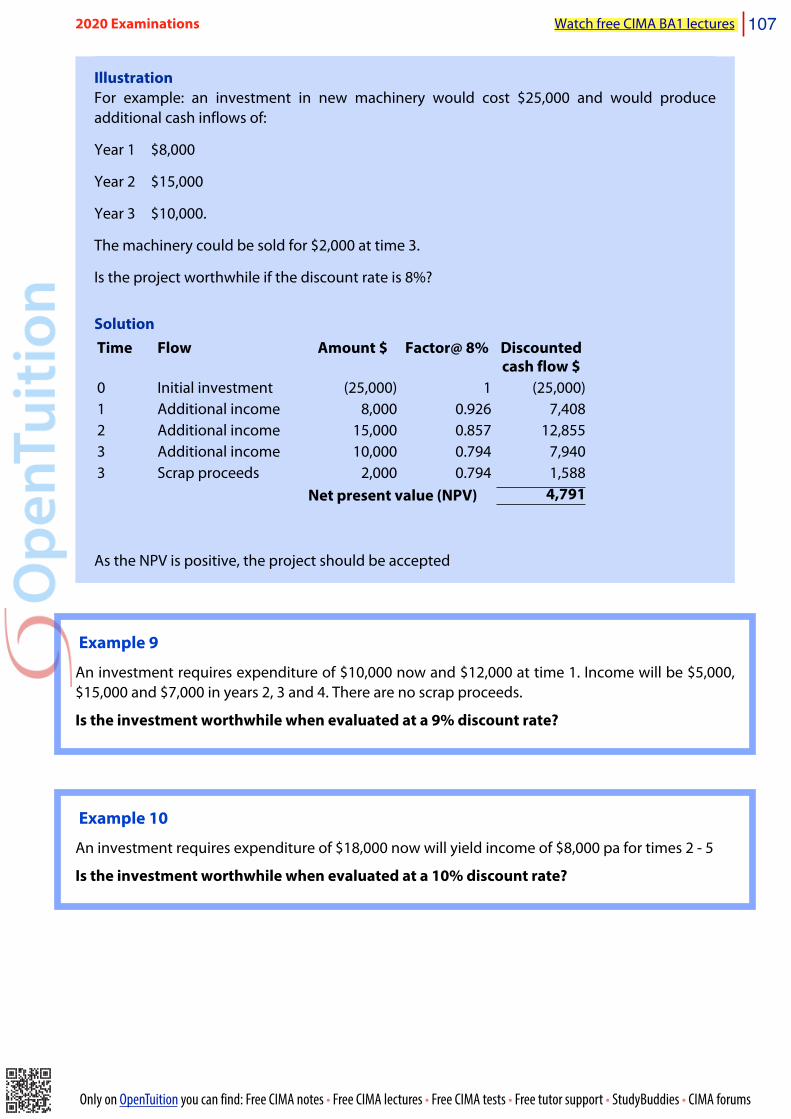
Only on OpenTuition you can find: Free CIMA notes • Free CIMA lectures • Free CIMA tests • Free tutor support • StudyBuddies • CIMA forums
IllustrationFor example: an investment in new machinery would cost $25,000 and would produce additional cash inflows of:
Year 1 $8,000
Year 2 $15,000
Year 3 $10,000.
The machinery could be sold for $2,000 at time 3.
Is the project worthwhile if the discount rate is 8%?
SolutionTime Flow Amount $ Factor@ 8% Discounted
cash flow $0 Initial investment (25,000) 1 (25,000)1 Additional income 8,000 0.926 7,4082 Additional income 15,000 0.857 12,8553 Additional income 10,000 0.794 7,9403 Scrap proceeds 2,000 0.794 1,588
Net present value (NPV)Net present value (NPV) 4,791
As the NPV is positive, the project should be accepted
Example 9
An investment requires expenditure of $10,000 now and $12,000 at time 1. Income will be $5,000, $15,000 and $7,000 in years 2, 3 and 4. There are no scrap proceeds.
Is the investment worthwhile when evaluated at a 9% discount rate?
Example 10
An investment requires expenditure of $18,000 now will yield income of $8,000 pa for times 2 - 5
Is the investment worthwhile when evaluated at a 10% discount rate?
2020 Examinations Watch free CIMA BA1 lectures 107

Only on OpenTuition you can find: Free CIMA notes • Free CIMA lectures • Free CIMA tests • Free tutor support • StudyBuddies • CIMA forums
8 Net present value approach – care neededTo carry out NPV you have to identify relevant cash flows. The rules are similar to what you met earlier with relevant costing. Look for cash flows that are future incremental costs or income caused by the investment decision.
In particular:๏ Cash flows are what you need, so look at income before depreciation.
๏ Reapportionment of existing fixed costs is irrelevant.
๏ Sunk or past costs are irrelevant.
๏ Opportunity costs are relevant ie cash flows forgone because of a decision
๏ Ignore all interest and other finance flows. These are taken account of by discounting.
Example 11
An investment requires expenditure of $15,000 now will yield income of $5,000 pa after depreciation for times 1 – 3 then $4,000 after depreciation of year 4. The machine can be sold for $3,000 in year 4. Research expenditure of $5,000 has been incurred on the new product that would be made by the machine.
Is the investment worthwhile when evaluated at a 6% discount rate?
9 Discounted cash flow – internal rate of return (IRR)The internal rate of return (IRR) is defined as:
IRR = discount rate where NPV = 0
It is sometimes referred to as a breakeven discount rate.
If the discount rate to be used is greater than the IRR, then the project is not worthwhile. That would be like borrowing at 10% and investing in a project which generated 5%: obviously you would lose out.
If the discount rate to be used is less than the IRR, then the project is worthwhile. That would be like borrowing at 5% and investing in a project which generated 10%: obviously you would make money.
The IRR will tell you nothing about accepting/rejecting a project that the NPV has not already told you.
Estimating the IRR requires you to work out the NPV of the project at two discount rates. There is nothing special about the two rates chosen, but many people try 10% and 15%, or 5% and 15% or 10% and 20%.
For example:
NPV at 5% = $1,000
NPV at 15% = -$1.300
2020 Examinations Watch free CIMA BA1 lectures 108

Only on OpenTuition you can find: Free CIMA notes • Free CIMA lectures • Free CIMA tests • Free tutor support • StudyBuddies • CIMA forums
These results can be shown on a graph:
At a low discount rate the future positive cash flows stay relatively large after discounting so the NPV is likely to be positive.
At a high discount rate the future positive cash flows are considerably reduced after discounting so the NPV is likely to be negative
The IRR must be between 5% and 15% and this has to be estimated. However, the line joining the two discount rates and NPVs is usually curved and this makes estimation more difficult. To simplify matters it is assumed that the line is straight and this will result in an estimation of the IRR rather than a precise figure.
Simplifying, and drawing some triangles:
2020 Examinations Watch free CIMA BA1 lectures 109

Only on OpenTuition you can find: Free CIMA notes • Free CIMA lectures • Free CIMA tests • Free tutor support • StudyBuddies • CIMA forums
Our aim is to work out the distance BF as the IRR will then be estimated as 5+BF
The triangles ABF and ACD are similar, meaning that they have the same proportions. Therefore, for each, the base/height must be equal:
BF/AB = CD/AC
BF = AB x CD/AC
= 1000 x (15 – 5) /(1,000 + 1,300) = 4.3
Therefore, point F must be 5 + 4.3 = 9.4%, and this is the estimate of the IRR.
Note that if someone had calculated the IRR using the NPVs at, say, 4% and 16%, the IRR estimate would be slightly different.
Some people are happy sketching diagrams such as those above. Others prefer to use a formula (not given in the exam):
IRR = A%+ NA
(NA −NB )(B%−A%)
Where
A% = lower discount rate tried
B% = higher discount rate tried
NA = NPV at A%
NB = NPV at B%
So, in the above example
A% = 5, B% = 15, NA = 1,000, NB = -1,300
IRR =5%+ 1,000
(1,000−(1,300))(15−5)=5+ 1,000
2,300×10=9.4%
Note the bottom line carefully: NA – NB;
NA = 1,000 and NB = –1,300.
So, NA – NB = (1,000 – (- 1,300)) = 2,300 [the two negative signs make a plus]
2020 Examinations Watch free CIMA BA1 lectures 110

Only on OpenTuition you can find: Free CIMA notes • Free CIMA lectures • Free CIMA tests • Free tutor support • StudyBuddies • CIMA forums
2020 Examinations Watch free CIMA BA1 lectures 111

Only on OpenTuition you can find: Free CIMA notes • Free CIMA lectures • Free CIMA tests • Free tutor support • StudyBuddies • CIMA forums
Tests
Question 1
A business has five annual cash inflows of $1,500 pa starting at time 3.
What is the present value of these flows at a discount rate of 7%?
A 6,245B 5,372C 4,148D 5,021
Question 2
A business has cash inflows of $400 pa for times 0 – 8, except time 5.
What is the present value of these flows at a discount rate of 10%?
A 2,534B 1,018C 1,886D 2,286
Question 3
A business will receive rent of $10,000 pa on a 500 year lease.
What is the present value of the rental receipts if the discount rate is 5%?
A $200,000B $100 millionC $1 millionD $5 million
Question 4
A business will receive rent of $10,000 pa on a 999 year lease, starting at year 3.
What is the present value of the rental receipts if the discount rate is 5%?
A $200,000B $172,770C $185,900D $181,410
Question 5
A business will receive rent of $10,000 pa on a 999 year lease, starting at year 0. At time 2 the business will also receive $1,000 to cover the legal fees involved in setting up the lease.
What is the present value of the receipts if the discount rate is 7%?
A $153,730B $152,857C $143,730D $142,857
2020 Examinations Watch free CIMA BA1 lectures 112

Only on OpenTuition you can find: Free CIMA notes • Free CIMA lectures • Free CIMA tests • Free tutor support • StudyBuddies • CIMA forums
Question 6
A business is considering implementing solar heating throughout its factories. This will cost $900,000 after one year and the savings are estimated to be $400,000 two years from now and $600,000 three years from now.
Discount rate = 10%
What is the NPV of the project?
A 111,710B 37,100C +37,100D –37,510
Question 7
A business owns some land that could be sold for $1 million and which cost $800,000 two years ago. Alternatively, the land could have apartments build on it for a present cost of $5 million. The apartments would bring in rent of $1,050,000 pa in perpetuity from time 1 onwards.
Discount rate = 10%
What is the NPV of the project?
A 4,700,000 B 5,500,000 C 4,500,000D 6,500,000
Question 8
At 10% NPV = $1,200At 20% NPV = $-500
What is the estimated IRR?
A 17%B 27%C 19%D 20%
Question 9
At 8% NPV = $1,200At 12% NPV = $500
What is the estimated IRR?
A 18.9%B 10.8%C 14.9%D 17.3%
2020 Examinations Watch free CIMA BA1 lectures 113

Only on OpenTuition you can find: Free CIMA notes • Free CIMA lectures • Free CIMA tests • Free tutor support • StudyBuddies • CIMA forums
Question 10
A project with conventional cash flows (cash out now, received in the future) has an IRR of 12%. The discount rate is 9%.
This means that;
A The NPV will be positive, but the project should be rejectedB The NPV will be negative, but the project should be acceptedC The NPV will be negative and the project should be acceptedD The NPV will be positive and the project should be accepted.
2020 Examinations Watch free CIMA BA1 lectures 114
Only on OpenTuition you can find: Free CIMA notes • Free CIMA lectures • Free CIMA tests • Free tutor support • StudyBuddies • CIMA forums
CHAPTER 11THE EFFECTS OF INTEREST RATES AND EXCHANGE RATES ON BUSINESS PERFORMANCE
1 IntroductionThis chapter looks at how changing interest rates and interest rates can affect the performance of a business. It also looks at how businesses can protect themselves against unfavourable exchange rate and interest rate movements.
2 Exchange rate risk
2.1 Types of riskA company can be affected by variable exchange rates in the following ways:
Economic risk
This describes how a company’s competitiveness can be affected by exchange rates. For example, if a UK company is exporting to the USA and the current exchange rate is £1 = US$1.3, then an item selling for $1,000 in the UK will sell for $1,300 in the USA.
If the exchange rate moved to £1 = US$1.5 (ie the £ strengthens against the $ so that it buys more $), the price in the USA would become $1,500. The price increase in the USA, from $1,300 to $1,500, means that the product is less attractive and competitive there and sales will probably fall.
If the exchange rate had moved the other way then goods exported would be more competitive in the foreign market.
There is a similar effect on imports. If a company in the USA were exporting to the UK when the exchange rate was £1 = US$1.3, then a product costing $5,200 in the US would cost $5,200/1.3 = £4,000 in the UK. IF the exchange rate now moved to £1 = US$1.5, the item would cost only $5,200/1.5 = £3,467 so it has become more attractive to UK purchasers.
Note that the above example shows that UK companies can suffer because of exchange rate movements even if they neither import nor export: imports have simply become cheaper and provide stronger competition for local goods.
Translation risk
Imagine a UK company has a subsidiary in Europe. The group accounts of the UK company will be in £. To prepare the subsidiary’s € statement of financial position will have to be translated into £ at the year-end rate.
Although this does not cause adverse cash flows, as the exchange rate moves up and down so too will the value of translated assets and liabilities. This can have a distorting effect on the groups accounts and of the group’s performance.
2020 Examinations Watch free CIMA BA1 lectures 115

Only on OpenTuition you can find: Free CIMA notes • Free CIMA lectures • Free CIMA tests • Free tutor support • StudyBuddies • CIMA forums
Transaction risk
Transaction risk arises from currency movements affecting the amounts received and paid for exports and imports.
For example, a UK company contracted to sell a product for $39,000 to a USA customer when the exchange rate was £1 = US$1.3. When the payment is received (and this could be several months after the contract was agreed) the exchange rate has moved to £1 = $1.50 so instead of ending up with 39,000/1.3 = £30,000, the company will receive only 39,000/1.5 = £26,000. The £4,000 difference is a shortfall in the company’s cash flow and could have serious consequences.
Similar cash flow uncertainty and problems arise on buying goods from a foreign supplier. If a UK company agrees to pay a German supplier €100,000 for a piece of equipment when the exchange rate is £1 = €1.4 and the £ has weakened to £1 = €1.2 when payment is made, instead of the goods costing 100,000/1.4 = £71,429, the company will have to pay 100,000/1.2 = £83,333 to obtain €100,000. Around an extra £12,000.
3 Combatting exchange rate transaction riskObviously, a simple way to eliminate exchange rate risk is to have every contract denominated in your own currency – but that is a matter of negotiation with the other party. If that’s not possible, then there are several other approaches:๏ Forward contracts
๏ Currency futures
๏ Currency options
3.1 Forward contractsA forward contract is a contract to exchange an agreed amount of currency at an agreed date in the future and an agreed exchange rate. In essence you are quoted a rate which will be used in the future irrespective of what the real exchange rate does and this brings certainty to the cash flows.
Forward contracts are binding and the agreed amounts of currency must be bought or sold on the agreed day. This can mean that a company could have done better making use of a favourable exchange rate movement when it comes to change the money, but it has to stick with the binding contract.
The aim of forward contracts is to bring certainty to cash flows and to remove risk. Their aim is not to give participants the best possible exchange rate.
Forward contracts are arranged on an individual basis with financial institutions and are known as ‘over the counter’ products.
3.2 Currency futuresCurrency futures are derivatives, which means that their value depends on (derives from) something else – here exchange rates. Futures can be bought and sold on futures markets such as the London International Financial Futures and Options Exchange (LIFFE, pronounced 'life'). The value of futures goes up and down with exchange rates.
So, imagine you an exporter in the USA and you were going to receive £1m in three months from a UK customer. Currently the exchange rate is £1 = US1.4, so the exporter is hoping for 1m x1.4 = $1.4m. If the exchange rate went down to 1.3 then fewer US$ would be received: 1m x 1.3 = $1.3m).
Remember, futures prices move with the exchange rate so to compensate for the exchange rate loss, the company could sell futures now (at around 1.4) then buy them later (at around 1.3) to
2020 Examinations Watch free CIMA BA1 lectures 116
Only on OpenTuition you can find: Free CIMA notes • Free CIMA lectures • Free CIMA tests • Free tutor support • StudyBuddies • CIMA forums
‘close out’ the transaction. The profit on the futures will largely compensate for the loss made on the exchange of the money.
3.3 Currency optionsCurrency options give their owner the right, but not the obligation, to buy or sell an asset at an agreed price.
The agreed price is known as the exercise price or the strike price.
An option to sell is a put option (think: put something up for sale); an option to buy is a call option.
Options can be exercised ie the option owner can insist on buying or selling currency at the exercise price or can be allowed to lapse.
For example, the US exporter above takes out an option to sell £ (a put option) at an exercise price of 1.43. What will be done if the exchange rate available when £1m is received is:
(i) 1.50
(ii) 1.38?
(i) The exporter can either get 1m x 1.5 = $1.5m or 1m x 1.43 = $1.43m by exercising the option. So, in this case the exporter would allow the option to lapse.
(ii) The exporter can either get 1m x 1.38 = $1.38m or 1m x 1.43 = $1.43m by exercising the option. So, in this case the exporter would exercise the option.
Options are rather like insurance policies: they protect you from losses but you don’t have to make a claim on them. However, like insurance policies, to acquire this protection an up-front non-returnable premium has to be paid.
2020 Examinations Watch free CIMA BA1 lectures 117

Only on OpenTuition you can find: Free CIMA notes • Free CIMA lectures • Free CIMA tests • Free tutor support • StudyBuddies • CIMA forums
4 Interest rate riskVariable rate loans and deposits are also sources of risk because it is not known with certainty what interest will have to be paid or will be earned.
Fixed rate loans and deposits will remove all risk, but then there is no chance of benefitting from favourable movements and businesses could get locked into unfavourable interest rates for many years.
There are three main methods to reduce risk arising from variable rate interest.๏ Forward rate agreements
๏ Interest rate futures
๏ Interest rate options
4.1 Forward rate agreementsForward rate agreements (FRA) are like forward rate currency contracts: they allow a borrower or depositor to fix a n interest rate for a period in the future eg starting in 6 months and ending after 12 months. They are over the counter, individually agreed arrangements.
4.2 Interest rate futuresThese are derivatives whose value depends on the interest rate. By arranging to buy or sell future contracts, profits can be made on the contracts that will largely compensate for any losses made on interest rate movements. The value of interest rate futures will be approximately 100 – interest rate. So if the interest rate in the economy is 4%, interest rate futures will be quoted at 96.
4.3 Interest rate optionsThese are options to buy or sell interest rate futures and allow borrowers or depositors to enjoy favourable interest rate movements whilst protecting themselves against adverse movements. Up-front non-returnable premiums have to be paid to acquire the options that provide this protection.
2020 Examinations Watch free CIMA BA1 lectures 118

Only on OpenTuition you can find: Free CIMA notes • Free CIMA lectures • Free CIMA tests • Free tutor support • StudyBuddies • CIMA forums
Tests
Question 1
A company in the US is quoted an exchange rate as 1US$ = 0.9332 – 0.9245 €
The company is going to receive €1m from the sale of machinery.
How many US$ will this produce?
Question 2
What are the three types of currency risk that a business can experiences?
Question 3
What does the following describe: a right but not an obligation to buy or sell a certain amount of currency on a certain date.
Question 4
What does ‘FRA’ mean and what are FRAs for?
Question 5
A company is planning to change $ to £ in three months and has taken out a currency option at £1 = US$1.25.
In three months the rate of exchange is £1 = $1.30.
Will the company exercise its option or allow it to lapse?
2020 Examinations Watch free CIMA BA1 lectures 119

Only on OpenTuition you can find: Free CIMA notes • Free CIMA lectures • Free CIMA tests • Free tutor support • StudyBuddies • CIMA forums
2020 Examinations Watch free CIMA BA1 lectures 120

Only on OpenTuition you can find: Free CIMA notes • Free CIMA lectures • Free CIMA tests • Free tutor support • StudyBuddies • CIMA forums
ANSWERS TO TESTS
Chapter 1
Question 1
Final
Question 2
D
Question 3
Injection WithdrawalTax XExports XImports XSavings XGovernment spending X
Question 4
B
Question5
$100m/0.2 =$500m. This is the multiplier effect.
Question 6
C and D. A and B move along the demand curve but they do not change its position.
Question 7
Inflation. The excess demand pushed prices up. It can also suck in imports.
Question 8
a) Base-year weighted quantity index
Index = ∑(Current year price x Base year quantity)/∑(Base year price x Base year quantity)
= (5.00 x 30 + 4.00 x 50)/(4.00 x 30 + 3.00 x 50) = 1.296
b) Current-year weighted value index
Index = ∑(Current year price x Current year quantity)/∑(Base year price x Current year quantity)
= (5.00 x 40 + 4.00 x 60)/(4.00 x 40 + 3.00 x 60) = 1.294
2020 Examinations Watch free CIMA BA1 lectures 121

Only on OpenTuition you can find: Free CIMA notes • Free CIMA lectures • Free CIMA tests • Free tutor support • StudyBuddies • CIMA forums
Question 9๏ Taxation
๏ Borrowing
๏ Selling state assets
๏ Printing money/quantitative easing
Chapter 2
Question 1
This is an example of absolute advantage
Question 2
Protectionism
Question 3
C
Having to import strategic resources does no give assured supplies.
Question 4
120,000/1.25 = £96,000
Question 5
B, C
Question 6
The higher inflation rate in country A means that its currency is losing value faster than country B’s. Therefore, A$1 must buy fewer B$ in the future than it does now. Therefore the exchange rate will move towards A$1 = 1.4B$.
2020 Examinations Watch free CIMA BA1 lectures 122

Only on OpenTuition you can find: Free CIMA notes • Free CIMA lectures • Free CIMA tests • Free tutor support • StudyBuddies • CIMA forums
Chapter 3
Question 1
It is when company moves some of its operations abroad – usually to exploit lower manufacturing costs.
Question 2
Globalisation.
Question 3
Social changes and social forces
Question 4
This describes the World Trade Organisation.
Chapter 4
Question 1
False. Shareholders’ liability is limited but the company is liable for all its debts.
Question 2
False. Many state owned organisations are not-for-profit, but not all are. For example, a state owned airline can be expected to produce a profit.
Question 3
Share capital and loan capital.
Question 4
Cost of capital
Question 5
Internal External ConnectedEmployees XSuppliers XCustomers XGovernment XLenders XDirectors XShareholders X
Question 6
Shareholders are the principals, directors are the agents
2020 Examinations Watch free CIMA BA1 lectures 123

Only on OpenTuition you can find: Free CIMA notes • Free CIMA lectures • Free CIMA tests • Free tutor support • StudyBuddies • CIMA forums
Question 7
There should be a balance of executive and non-executive directors, meaning a 50/50 split, so there should be at least 6.
Question 8
The return on capital employed is defined as:
Operating profit before tax and interestx 100 =
100 x 5,000 = 15.2%
Capital employedx 100 =
(26,000 + 7,000) = 15.2%
Chapter 5
Question 1
B
High price elasticity of demand implies high price sensitivity. For a given change in price product B’s demand changes more than product A’s
Question 2
C, D
Question 3
False.
Elasticity>1 means the item is price sensitive. A small change in price will lead to a relatively large fall in quantity so that revenue falls.
Question 4
Price Quantity sold15 20,00020 16,000
Mid-point of price range = 17.5; mid-point of quantity range = 18,000
Elasticity = [4,000/18,000]/[5/17.5] = 0.78
Question 5
Shift to right Shift to leftIncreased advertising XLower incomes XAn item becoming fashionable XThe price of a substitute falling X
2020 Examinations Watch free CIMA BA1 lectures 124
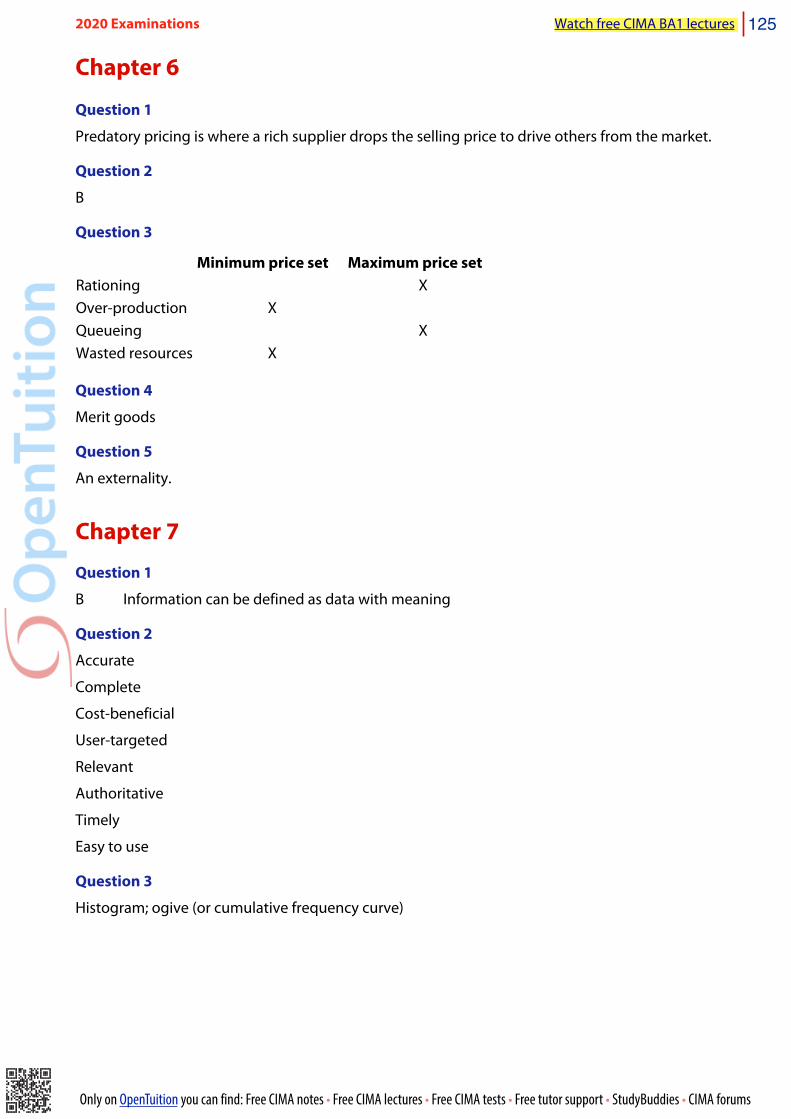
Only on OpenTuition you can find: Free CIMA notes • Free CIMA lectures • Free CIMA tests • Free tutor support • StudyBuddies • CIMA forums
Chapter 6
Question 1
Predatory pricing is where a rich supplier drops the selling price to drive others from the market.
Question 2
B
Question 3
Minimum price set Maximum price setRationing XOver-production XQueueing XWasted resources X
Question 4
Merit goods
Question 5
An externality.
Chapter 7Question 1
B Information can be defined as data with meaning
Question 2
Accurate
Complete
Cost-beneficial
User-targeted
Relevant
Authoritative
Timely
Easy to use
Question 3
Histogram; ogive (or cumulative frequency curve)
2020 Examinations Watch free CIMA BA1 lectures 125

Only on OpenTuition you can find: Free CIMA notes • Free CIMA lectures • Free CIMA tests • Free tutor support • StudyBuddies • CIMA forums
Question 4
Discrete ContinuousNumber of children under 10 in each family XWeight of individuals in a population XDistance between cities XFamily income rounded to the nearest $000 X
Question 5
Family income Frequency Cumulative frequency
0 - <2,000 5 5
2000 - <3,000 20 25
3000 - <5,000 500 525
5000 - <10,000 100 625
10,000 - <20,0000 10 635
2020 Examinations Watch free CIMA BA1 lectures 126

Only on OpenTuition you can find: Free CIMA notes • Free CIMA lectures • Free CIMA tests • Free tutor support • StudyBuddies • CIMA forums
Chapter 8
Question 1
Velocity, volume, variety, veracity
Question 2
No. Even a very high coefficient of correlation does not prove cause and effect. The results are consistent with a causal relationship but do not prove it. For example, the increase in advertising might have coincided with an improvement in the economy and that sales might have increased because of that.
Question 3
Guest 1ranking
Guest 2ranking d d2
Hotel 1 2 3 -1 1
Hotel 2 4 4 0 0
Hotel 3 3 1 2 4
Hotel 4 1 2 -1 1
∑d2∑d2 6
What is the Spearman’s Rank Coefficient:
r=1-
6∑d2
n n2 -1( )⎡
⎣⎢⎢
⎤
⎦⎥⎥
n = 4 n2 = 16
r=1–
6× 64×15
⎡⎣⎢
⎤⎦⎥
= 0.4 (low correlation)
Question 4
From season 3 2017 to season 4 2018 is 5 increments of season. The projected trend is therefore $73,000 + 5 x 2,000 = 83,000
The appropriate seasonal adjustment is -$9,000, so the seasonally adjusted projection is $74,000.
Question 5
B, C
2020 Examinations Watch free CIMA BA1 lectures 127

Only on OpenTuition you can find: Free CIMA notes • Free CIMA lectures • Free CIMA tests • Free tutor support • StudyBuddies • CIMA forums
Chapter 9
Question 1
B
Question 2
Annual interest = 6% x 12,000 = $720. This must be equivalent to 4% on the amount invested:
720/Market value = 4%
Market value must be 720/4% = $18,000
Question 3
Interest rates are expected to fall.
Question 4
It should be lower because the convertible holder enjoys a ‘wait and see’ approach to deciding whether to convert the securities into shares. This benefit means that less interest should be required.
Question 5
It must sell its reserves in exchange for its currency
Chapter 10
Question 1
B We need the 3 – 7 for the five flows. 1 – 7: annuity factor = 5.389; 1 – 2: annuity factor = 1.808. Factor for 3 – 7 = 5.389 – 1.808 = 3.581. PV = 3.581 x $1,500 = 5,372
Question 2
D 1 – 8 except time 5 = 5.335 – 0.621 = 4.714
0 – 8 = 1 + 4.714 = 5.714
PV = $400 x 5.714 = 2,286
Question 3
A 10,000/0.05 = 200,000
Question 4
D 1 – infinity: 1/0.05 = 20
1 – 2 5% factor = 1.859
3– infinity = 18.141
PV = 18.141 x 10,000 = $181,410
2020 Examinations Watch free CIMA BA1 lectures 128

Only on OpenTuition you can find: Free CIMA notes • Free CIMA lectures • Free CIMA tests • Free tutor support • StudyBuddies • CIMA forums
Question 5
D Rent PV factor (time 0 – infinity) = 1/.07 +1 [for time 0] = 15.2857
Rent PV = 15.2857 x 10,000 = 152,857.
Other time 2 receipt = 1,000 x 0.873 = $873
Total PV = $873 + $152,857 = $153,730.
Question 6
B NPV = - 900,000 x 0.909 + 400,000 x 0.826 + 600,000 x 0.751 = -37,100
Question 7
C The cost of the land is irrelevant as that is a sunk (past) cost. However, the land could now be sold for $1m and this is an opportunity cost of building on it as that cash inflow is then not be received.
Cost of building = $5 million; opportunity cost of land = $1 million;
PV of rental income = $1,050,000/0.1 = $10,500,000.
NPV = 10,500,000 - 6,000,000 = $4,500,000
Question 8
A IRR = 10 + 1,200 x (20 – 10)/(1,200 + 500) = 17%
Question 9
C IRR = 8 + 1,200 x (12 – 8)/(1,200 - 500) =14.9%
Question 10
D If IRR > D/c rate, NPV will be positive and the project should be accepted.
2020 Examinations Watch free CIMA BA1 lectures 129
Only on OpenTuition you can find: Free CIMA notes • Free CIMA lectures • Free CIMA tests • Free tutor support • StudyBuddies • CIMA forums
Chapter 11
Question 1
If the company goes to its bank with $10,000, the bank will give it only €9,245 (worse than €9332, and the bank always wins). So, 0.9245 is the rate for changing $ to €. Therefore 0.9332 must be the rate for changing € to £
Therefore, €1m will yield €1m/0.9332 = $1.0716m.
Question 2
Transaction, translation and economic risk.
Question 3
This is a currency option.
Question 4
FRA = forward rate agreement. They allow organisations to fix future interest rates.
Question 5
If changing $ to £ 1.3 is a less favourable rate than 1.25, so the company will exercise its option and change $ to £ at 1.25.
2020 Examinations Watch free CIMA BA1 lectures 130

Only on OpenTuition you can find: Free CIMA notes • Free CIMA lectures • Free CIMA tests • Free tutor support • StudyBuddies • CIMA forums
ANSWERS TO EXAMPLES
Chapter 8
Example 1
Note: x should be the independent variable, units; y is the dependent variable, cost, because cost depends on units.
x (000) y (000) xy x2 y2January 1 40 40 1 1,600February 4 54 216 16 2,916March 2 45 90 4 2,025April 7 80 560 49 6,400May 6 70 420 36 4,900June 5 70 350 25 4,900July 3 50 150 9 2,500∑ 28 409 1,826 140 25,241
∑ ∑∑∑ ∑
∑ ∑( )
=−
−= × − ×
× − ×= =
= − = − × =
bn xy x y
n x x
ay
nb xn
(7 1,826) (28 409)(7 140) (28 28)
1,330196
6.7857
4097
6.7857 287
31.2858
2 2
y = 31.2858 + 6.7857x
Where y is $‘000 and x is hundreds
$31,286 represents the fixed costs per month because $31,286 will be incurred even if nothing is produced (ie x = 0)
Each 100 units made then causes costs to increase by $6,786. $67.86 is the variable cost per unit.
2020 Examinations Watch free CIMA BA1 lectures 131

Only on OpenTuition you can find: Free CIMA notes • Free CIMA lectures • Free CIMA tests • Free tutor support • StudyBuddies • CIMA forums
Example 2
n xy x y
n x x n y yr =
7 1,826 – 28 409
7 140 (28) 7 25,241 409
1,330196 9, 406
0.98
2 2 2 2
2 2
∑∑∑∑ ∑ ∑ ∑( )( )
( )
( ) ( )
( ) ( )
( )
−
− −
= × ×
× − × −
=×
=
Note that the coefficient of determination, r2 = 0.982 = 0.96
This implies that 96% of the variation in cost can be explained by the variation in output.
Using the results of the linear regression exercise
Usually the results of a linear regression exercise are used to predict future amounts.
For example, let’s say that the company planned to make 475 units in March of the following year. Then using the equation we have derived, the predicted cost would be:
y= 32,857 + 67.9x = 32,857 + 67.9 x 475 = $65,110
Example 3
Using Spearman's coefficient:
r=1-
6∑d2
n n2 -1( )⎡
⎣⎢⎢
⎤
⎦⎥⎥
where d is the difference between the rank in Accountancy and the rank in Economics for each student.
Rank RankStudent Accountancy Law d d 2
A 1 3 –2 4B 4 7 –3 9C 2 1 1 1D 5 5 –1 1E 3 2 1 1F 7 4 3 9G 6 5 1 1
∑d = 0 ∑d2 = 26
r =1− 6×26
7 49−1( )⎡
⎣⎢
⎤
⎦⎥ =1− 156
336= +0.536
The correlation is positive 0.536, meaning that as performance in one paper increases so does performance in the other, but the correlation is not particularly strong.
2020 Examinations Watch free CIMA BA1 lectures 132

Only on OpenTuition you can find: Free CIMA notes • Free CIMA lectures • Free CIMA tests • Free tutor support • StudyBuddies • CIMA forums
Chapter 10
Example 1
$ Principal Interest forthe year @10%
1/1/2018 200
31/12/2018 200 20
1/1/2019 200
31/12/2019 400 40
1/1/2020 200
31/12/2020 600 60
Total interest 120
$ Principal Interest forthe year @10%
1/1/2018 20031/12/2018 200 201/1/2019 20031/12/2019 400 401/1/2020 20031/12/2020 600 60
Total interest 120
There will be $720 in total to the investor’s credit.
Example 2
$Now payment 500.00Year 1 interest 50
550Year 2 interest 55
605.00Year 3 interest 60.50
$665.50
The amount (A) at the end of the n’th year at a rate r of interest (expressed as a decimal) is given by:
A = P(1+r)n
So, in the above example $665.50 = $500 × (1.1)3
This is also known as the future value (or terminal value)
2020 Examinations Watch free CIMA BA1 lectures 133

Only on OpenTuition you can find: Free CIMA notes • Free CIMA lectures • Free CIMA tests • Free tutor support • StudyBuddies • CIMA forums
Example 3
A = $1,070.58 = $800 × (1.06)5
Example 4
Amount owed after 12 months = P (1 + r)n
= 100 (1.02)12
= $126.82
APR = actual interest over the year = (126.82 – 100)/100 × 100 = 26.82%
Example 5
For interest payable quarterly, the year is divided into four periods so:
(a) 1 + APR = (1 + 08/4)4 = 1:08243;
so the APR (or AER) is 8.243%.
This is the example we considered above.
(b) (i) If interest is paid monthly, there are 12 periods so:
1 + APR = (1 + 08/12)12 = 1.08300
APR = 8.3%
(ii) If interest is paid weekly, there are 52 periods so:
1 + APR = (1 + 08/52)52 = 1:08322
APR = 8.322%
(iii) If interest is paid daily, there are 365 periods so:
1 + APR = (1 + 08/365)365 = 1.08328
APR = 8.328%
Example 6
Option 1: Present value = $3,000Option 2: Present value = 4,000 x 0.763 = $3,052
Option 2 is therefore preferable.
Option 1: Present value = 3,000 x 0.826 = $2,478Option 2: Present value = 3,800 x 0.621 = $2,360
Option 1 is therefore preferable
2020 Examinations Watch free CIMA BA1 lectures 134

Only on OpenTuition you can find: Free CIMA notes • Free CIMA lectures • Free CIMA tests • Free tutor support • StudyBuddies • CIMA forums
Example 7
1 – 9 5% annuity factor = 7.108
1 – 5 5% annuity factor = (4.329)
6 – 9 5% annuity factor 2.779
PV = $100 x 2.779 = $278
1 – 10 4% annuity factor 8.111
1 – 2 4% annuity factor (1.886)
year 5 4% annuity factor (0.822)5.403
PV = $100 x 5.403 = $540
1 – 5 10% annuity factor 3.791
0 10% annuity factor 1.000
0 – 5 4.791
PV = $200 x 4.791 = $958
Example 8
Annuity factor = 1r
1− 1(1+ r )n
⎡⎣⎢
⎤⎦⎥= 1
0.081− 1
(1.08)7⎡⎣⎢
⎤⎦⎥= 5.206
Annuity factor = 1r
1− 1(1+ r )n
⎡⎣⎢
⎤⎦⎥= 1
0.0551− 1
(1.055)12⎡⎣⎢
⎤⎦⎥= 8.619
Example 9
Time Flow $ Factor Discounted cash flow
0 Investment (10,000) 1.000 (10,000)1 Investment (12,000) 0.917 (11,004)2 Income 5,000 0.842 4,2103 Income 15,000 0.772 11,5804 Income 7,000 0.708 4,956
Net present valueNet present value -258
So, marginally, the investment is not worthwhile.
2020 Examinations Watch free CIMA BA1 lectures 135

Only on OpenTuition you can find: Free CIMA notes • Free CIMA lectures • Free CIMA tests • Free tutor support • StudyBuddies • CIMA forums
Example 10
Required discount factor = 3.791 – 0.909 = 2.882PV of inflows = 2.882 x 8,000 = $23,056PV of outflow = $18,000NPV = $5,056
So, project is worthwhile.
Example 11
Depreciation charged = (15,000 – 3,000)/4 = 3,000
Time Flow $ 6% Factor Discounted cash flow
1 Investment (15,000) 1.000 (15,000)2 investment 5,000 + 3,000 = 8,000 2.673 21,3844 Income before depreciation 4,000 + 3,000 = 7,000 0.792 5,5444 Scrap 3,000 0.792 2,367
Net present valueNet present value 14,295
Therefore the project is worthwhile.
2020 Examinations Watch free CIMA BA1 lectures 136