CIMA Australia members salary survey 2010myemail.cimaglobal.com/images/directemail/20101102/Members...
34
CIMA Australia members salary survey 2010
Transcript of CIMA Australia members salary survey 2010myemail.cimaglobal.com/images/directemail/20101102/Members...

CIMA Australia memberssalary survey 2010

CIMA members salary survey 2010 – Australia Foreword…………………………………………… 2 Executive summary………………………………. 3 Main findings………………………………………. 5 Salaries and bonuses…………………………..….. 5 Experience .…………………………………………. 7 Sector ……………………………………………….. 9 Size of business…………………..………………… 11 Regional location…………………………………… 13 Gender………………………………………………. 14 Age……………………….………………………….. 15 Recruitment and retention………………………. 17 Satisfaction with salary and benefits…………….. 17 Importance of benefits.……………….…………… 19 Working hours……………………………………… 21 Skill set requirements…..………………………….. 23 Geographical mobility………………….…….….. 25 Extent of movement……………………………… 25 Top destinations………………………….………… 26 Future…..……………………………………….…… 27 One word to describe CIMA difference………. 28 Australian salary information………….……….. 29 Technical information……………………………. 30 Further information………………………………. 31 Global contacts……………………………………. 32

Foreword Despite the difficult economic conditions we have been experiencing, prospects for CIMA members appear to be extremely favourable. Prudent businesses are increasingly turning to our members to help drive them through the downturn and on to sustainable success in the long term. This demand for management accounting expertise is reflected in the results of our second global members’ salary survey. Clearly, CIMA members are highly valued, especially during a period when businesses are looking for skilled financial managers to put them on a firm footing. Our global survey of
CIMA members shows that Chartered Management Accountants earn significantly higher salaries than the national average in every nation featured in our research. In developed economies, members’ salaries are usually between two and three times the national average. However in developing economies such as Malaysia and Sri Lanka we found CIMA members earning up to ten times the average - with the service industries offering particularly favourable wages. Bonuses are also featuring as a significant proportion of member remuneration. By country, this accounts for between 8% and 20% of their salary with the highest rewards being offered in the USA and Hong Kong.
However our members in Australia appear to have come through the global economic downturn relatively unscathed. Our survey show that Australian and Malaysian members received the most significant increases in average remuneration since our last survey in 2009. But countries such as Sri Lanka and the UK have experienced only modest growth. A cause for some concern is the earnings disparity between genders. Across the world, male CIMA members appear to be earning significantly more on average than their female counterparts. This is most evident in Malaysia, Sri Lanka and South Africa. Part of this disparity could be explained by the fact that there are a greater number of more experienced male CIMA members in our global community. CIMA has recently completed a report which identifies the main barriers to women achieving positions of leadership and outlines four strategies for success. We very much hope that this analysis will help highlight the value that women can add to the workplace – and the boardroom in particular. We are also launching a women’s network on our online community forum, CIMAsphere. The new network will provide our female members with a place to share advice and experiences. In Australia, the average annual salary for a CIMA member is AUS$129,077 and the average bonus is AUS$14,009. This is an increase in total remuneration of 10.3% on the 2009 survey. Almost three-quarters (74%) are either satisfied or extremely satisfied with their salary and a slightly higher percentage (78%) are happy with their benefits package. Pensions and bonuses are the key benefits sought from an employer and a significant proportion also feel that flexible hours are important. On average, male CIMA members in Australia are earning a package which is worth 18% more than their female colleagues. This gap is at the smaller end of the spectrum compared with other countries.
1

When it comes to job security, Australian members are showing a strong degree of confidence. A total of 80% do not anticipate changes to their working conditions and around half (54%) intend to change jobs in the next two years. Clearly, CIMA members in Australia are demonstrating resilience to the global downturn and their unique financial toolkit will place them in a prime position to help organisations build firm foundations for future success.
Charles Tilley Chief Executive CIMA
2
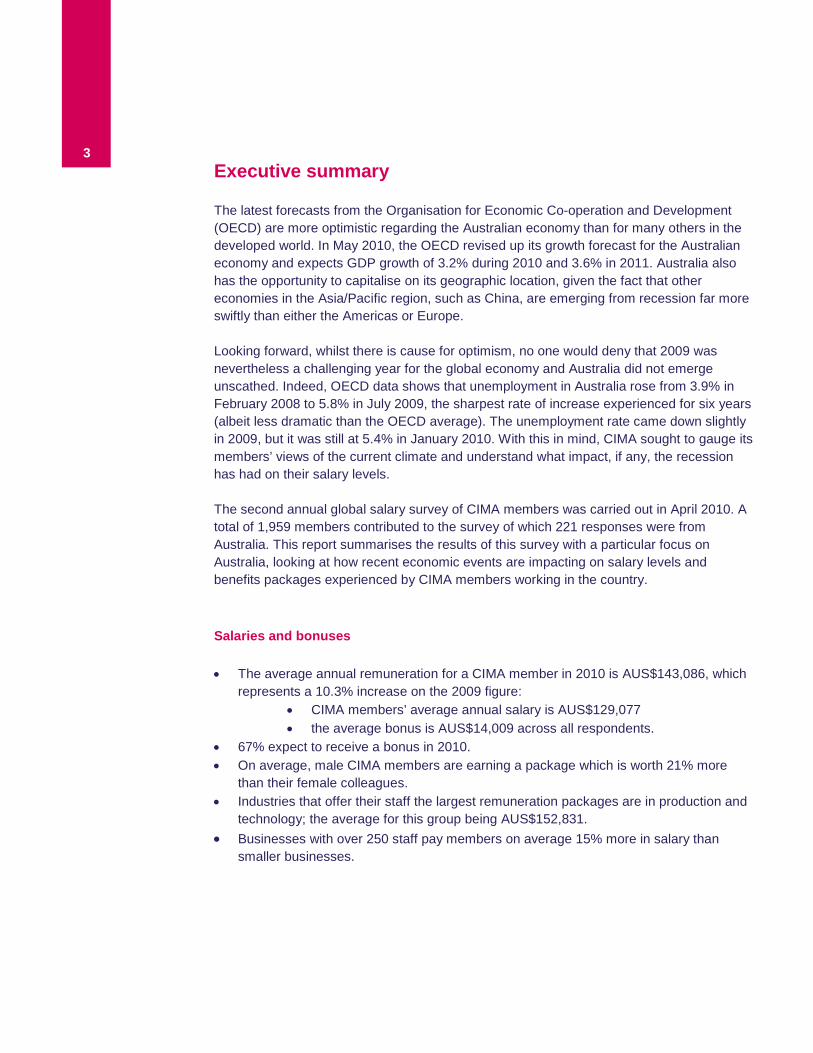
Executive summary The latest forecasts from the Organisation for Economic Co-operation and Development (OECD) are more optimistic regarding the Australian economy than for many others in the developed world. In May 2010, the OECD revised up its growth forecast for the Australian economy and expects GDP growth of 3.2% during 2010 and 3.6% in 2011. Australia also has the opportunity to capitalise on its geographic location, given the fact that other economies in the Asia/Pacific region, such as China, are emerging from recession far more swiftly than either the Americas or Europe. Looking forward, whilst there is cause for optimism, no one would deny that 2009 was nevertheless a challenging year for the global economy and Australia did not emerge unscathed. Indeed, OECD data shows that unemployment in Australia rose from 3.9% in February 2008 to 5.8% in July 2009, the sharpest rate of increase experienced for six years (albeit less dramatic than the OECD average). The unemployment rate came down slightly in 2009, but it was still at 5.4% in January 2010. With this in mind, CIMA sought to gauge its members’ views of the current climate and understand what impact, if any, the recession has had on their salary levels. The second annual global salary survey of CIMA members was carried out in April 2010. A total of 1,959 members contributed to the survey of which 221 responses were from Australia. This report summarises the results of this survey with a particular focus on Australia, looking at how recent economic events are impacting on salary levels and benefits packages experienced by CIMA members working in the country. Salaries and bonuses • The average annual remuneration for a CIMA member in 2010 is AUS$143,086, which
represents a 10.3% increase on the 2009 figure: • CIMA members’ average annual salary is AUS$129,077 • the average bonus is AUS$14,009 across all respondents.
• 67% expect to receive a bonus in 2010. • On average, male CIMA members are earning a package which is worth 21% more
than their female colleagues. • Industries that offer their staff the largest remuneration packages are in production and
technology; the average for this group being AUS$152,831. • Businesses with over 250 staff pay members on average 15% more in salary than
smaller businesses.
3
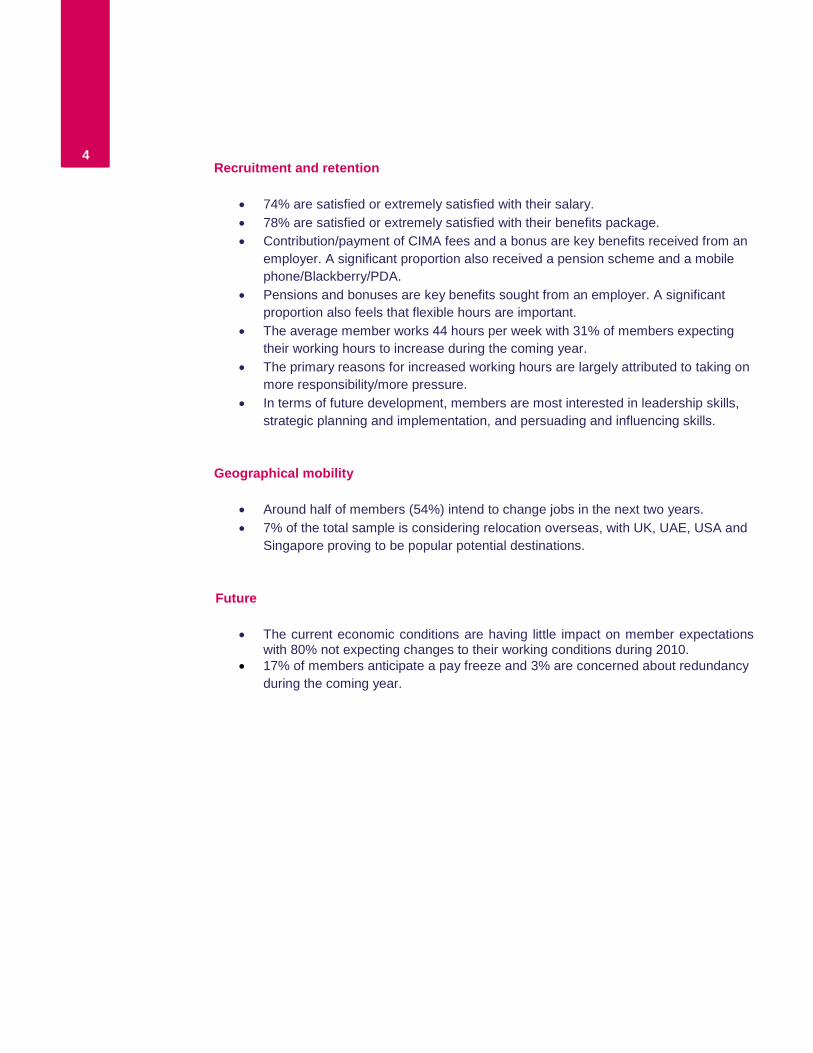
Recruitment and retention
• 74% are satisfied or extremely satisfied with their salary. • 78% are satisfied or extremely satisfied with their benefits package. • Contribution/payment of CIMA fees and a bonus are key benefits received from an
employer. A significant proportion also received a pension scheme and a mobile phone/Blackberry/PDA.
• Pensions and bonuses are key benefits sought from an employer. A significant proportion also feels that flexible hours are important.
• The average member works 44 hours per week with 31% of members expecting their working hours to increase during the coming year.
• The primary reasons for increased working hours are largely attributed to taking on more responsibility/more pressure.
• In terms of future development, members are most interested in leadership skills, strategic planning and implementation, and persuading and influencing skills.
Geographical mobility
• Around half of members (54%) intend to change jobs in the next two years. • 7% of the total sample is considering relocation overseas, with UK, UAE, USA and
Singapore proving to be popular potential destinations. Future
• The current economic conditions are having little impact on member expectations
with 80% not expecting changes to their working conditions during 2010. • 17% of members anticipate a pay freeze and 3% are concerned about redundancy
during the coming year.
4
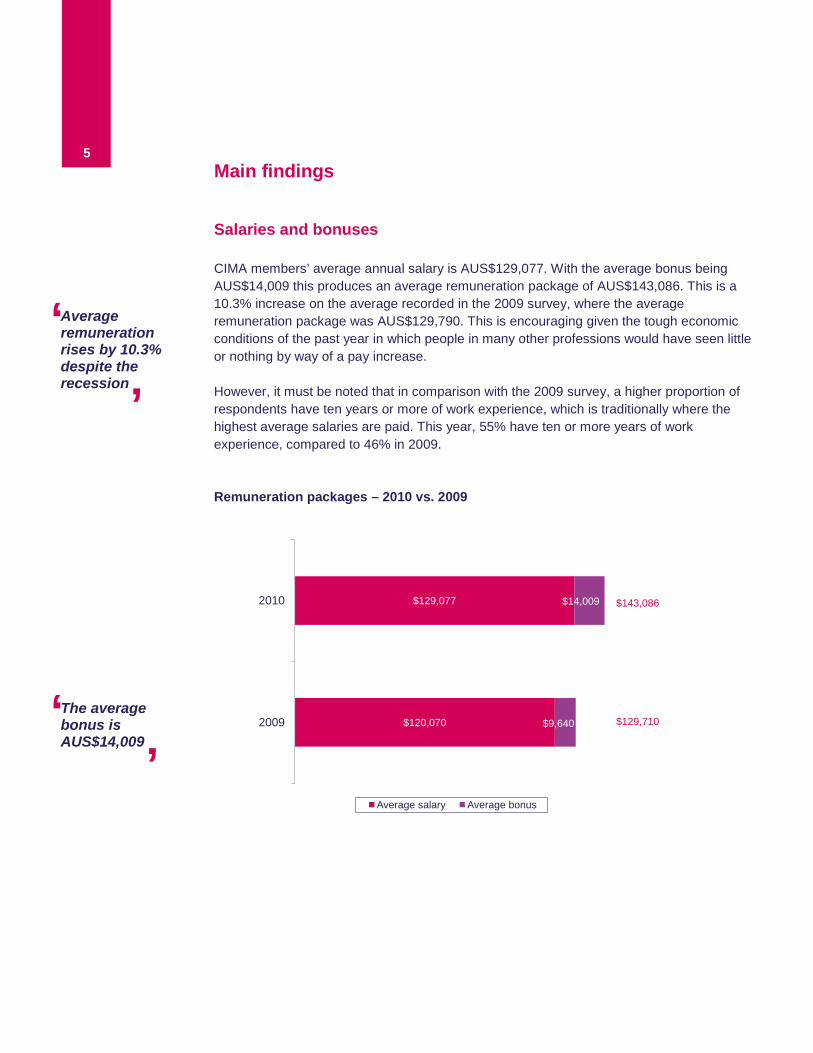
Main findings Salaries and bonuses CIMA members’ average annual salary is AUS$129,077. With the average bonus being AUS$14,009 this produces an average remuneration package of AUS$143,086. This is a 10.3% increase on the average recorded in the 2009 survey, where the average remuneration package was AUS$129,790. This is encouraging given the tough economic conditions of the past year in which people in many other professions would have seen little or nothing by way of a pay increase. However, it must be noted that in comparison with the 2009 survey, a higher proportion of respondents have ten years or more of work experience, which is traditionally where the highest average salaries are paid. This year, 55% have ten or more years of work experience, compared to 46% in 2009. Remuneration packages – 2010 vs. 2009
$120,070
$129,077
$9,640
$14,009
2009
2010
Average salary Average bonus
$143,086
$129,710
5
The average bonus is AUS$14,009 ‘
Average remuneration rises by 10.3% despite the recession
‘
’
’
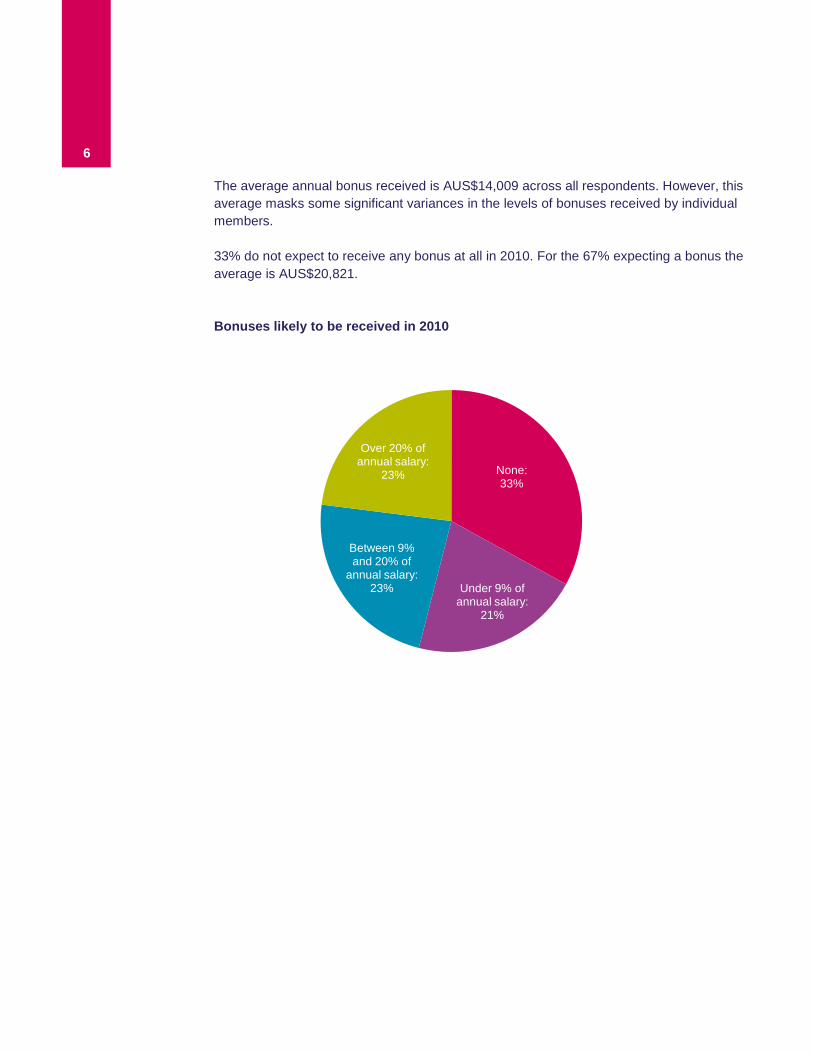
The average annual bonus received is AUS$14,009 across all respondents. However, this average masks some significant variances in the levels of bonuses received by individual members. 33% do not expect to receive any bonus at all in 2010. For the 67% expecting a bonus the average is AUS$20,821. Bonuses likely to be received in 2010
None: 33%
Under 9% of annual salary:
21%
Between 9% and 20% of
annual salary: 23%
Over 20% of annual salary:
23%
6
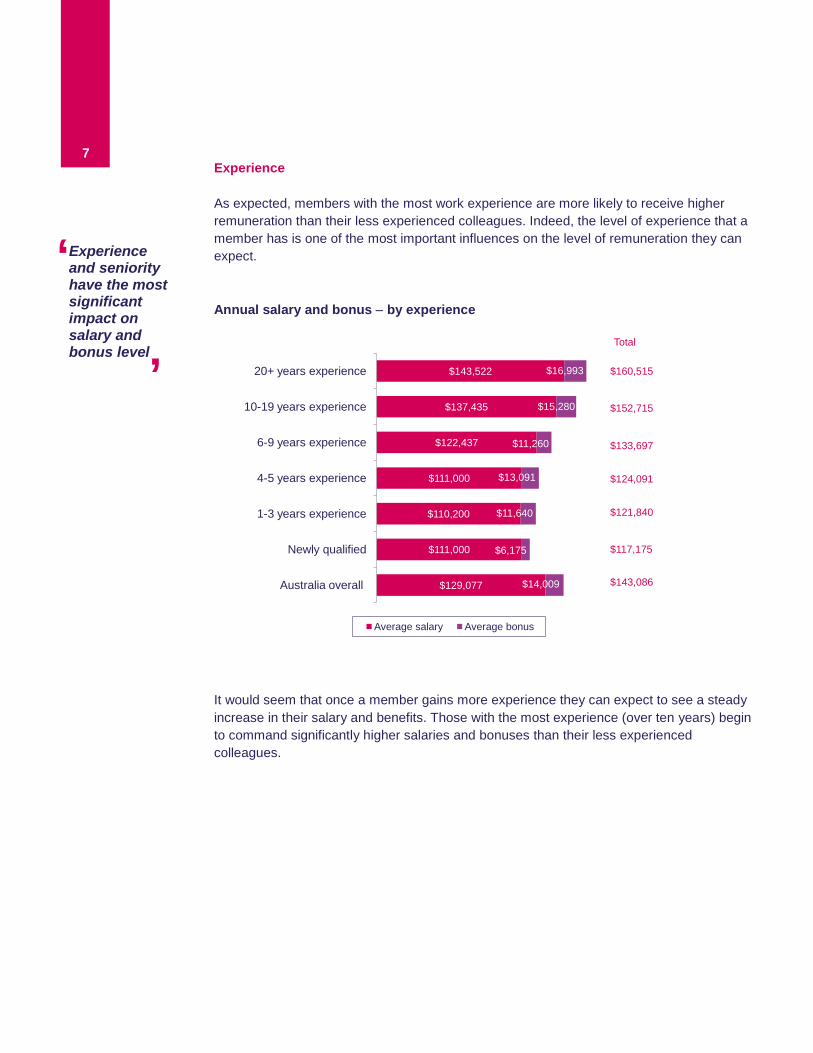
Experience As expected, members with the most work experience are more likely to receive higher remuneration than their less experienced colleagues. Indeed, the level of experience that a member has is one of the most important influences on the level of remuneration they can expect. Annual salary and bonus − by experience
$129,077
$111,000
$110,200
$111,000
$122,437
$137,435
$143,522
$14,009
$6,175
$11,640
$13,091
$11,260
$15,280
$16,993
Australia overall
Newly qualified
1-3 years experience
4-5 years experience
6-9 years experience
10-19 years experience
20+ years experience
Average salary Average bonus
Total
$117,175
$121,840
$133,697
$124,091
$152,715
$160,515
$143,086
It would seem that once a member gains more experience they can expect to see a steady increase in their salary and benefits. Those with the most experience (over ten years) begin to command significantly higher salaries and bonuses than their less experienced colleagues.
7
Experience and seniority have the most significant impact on salary and bonus level
‘
’

Members are more likely to receive a bonus once they have at least a full year of work experience after qualification, but the levels receiving a bonus fluctuate, peaking at four to five years experience, when 77% are likely to receive a bonus. Members likely to receive a bonus − by experience
67%60%
68%
77%70%
63%67%
Australia overall
Newly qualified members
1-3 years experience
4-5 years experience
6-9 years experience
10-19 years experience
20+ years experience
8

Sector Whereas in many other countries − such as the UK − those employed in the banking sector receive the highest level of pay on average, it is those employed in the production and technology industries that earn the most in Australia. On average, they receive a basic salary which is 5% higher and a bonus which is 23% higher than the respective global average. Annual salary and bonus − by sector
$129,077
$127,043
$126,810
$135,629
$14,009
$11,818
$14,525
$17,202
Australia overall
Others
Service industries
Production and technology
Average salary Average bonus
Total
$138,861
$152,831
$141,335
$143,086
9
The highest paying sector is production and technology
‘
’

Those members working in the production and technology and service industries are the most likely to receive bonuses in comparison to those working in other industries. Members likely to receive a bonus − by sector
67%
56%
76%
76%
Australia overall
Others
Service industries
Production and technology
10
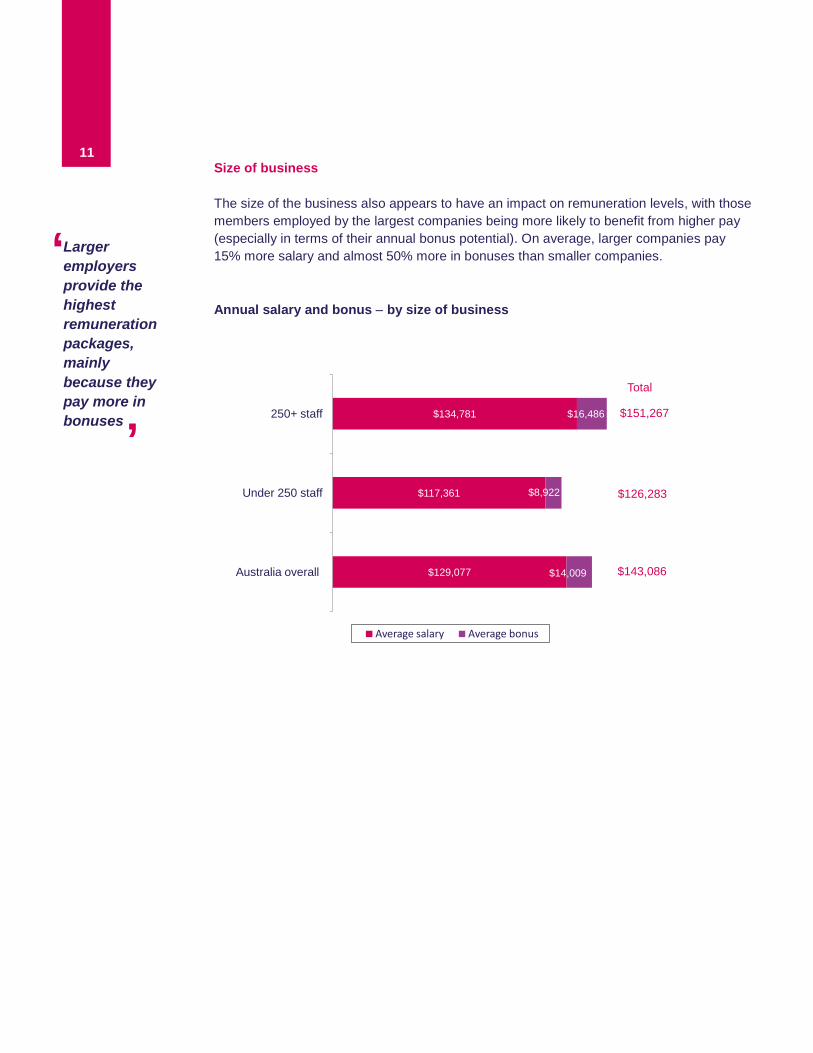
Size of business The size of the business also appears to have an impact on remuneration levels, with those members employed by the largest companies being more likely to benefit from higher pay (especially in terms of their annual bonus potential). On average, larger companies pay 15% more salary and almost 50% more in bonuses than smaller companies. Annual salary and bonus − by size of business
$129,077
$117,361
$134,781
$14,009
$8,922
$16,486
Australia overall
Under 250 staff
250+ staff
Average salary Average bonus
$126,283
Total
$143,086
$151,267
11
Larger employers provide the highest remuneration packages, mainly because they pay more in bonuses
‘
’

It is clear that the size and the availability of bonuses increase in the larger businesses to the extent that three out of four members in the larger companies would receive a bonus, compared to only one in two of the members working in the smaller companies. Members likely to receive a bonus − by size of business
67%
48%
77%
Australia overall Under 250 staff 250+ staff
12

Regional location At 5% above the national average, the highest average salary can be found in Sydney, closely followed by Brisbane, Those working in Melbourne tend to be on lower salaries; earning around 7% less than the Australian average. Average salary and bonus − by region
Differences by the size of business
Perth Salary AUS$131,624 Bonus AUS$10,300 Total AUS$141,924
Brisbane Salary AUS$133,781 Bonus AUS$18,173 Total AUS$151,954
Sydney Salary AUS$135,543 Bonus AUS$17,680 Total AUS$153,223 Melbourne
Salary AUS$120,127 Bonus AUS$10,956 Total AUS$131,083
13

Gender The survey shows that the total average remuneration package received by male CIMA members exceeds that received by women to a significant degree. The average salary is AUS$134,263 for male CIMA members, supplemented by a typical bonus of AUS$15,579, providing a total package worth AUS$149,842 on average. For female members, the average salary is AUS$114,151 and the average bonus is AUS$9,492, providing a total annual package of AUS$123,643. More notably, bonuses are 64% higher for males than females, on average. The proportion of men whose salaries are AUS$150,000 or more per annum is significantly higher than that of women (39% vs. 15%). Similarly, at the other end of the scale the proportion of women earning less than AUS$90,000 is significantly greater (28%) than that of men (14%). Average salary and bonus − by gender
2% 2%
12%26%
17%
18%
30%
39%
39%
15%
Male Female
$150,000 +$110,000 - $149,999$90,000 - $109,999$60,000 - $89,999Less than AUS$60,000
The question arises as to what factors differentiate male and female CIMA members that might account for these differences. Key factors that appear to contribute to this differentiation are:
• Male CIMA members tend to have more experience, usually a key factor in determining remuneration. 60% of men became fully qualified CIMA members more than ten years ago, (the level at which the average salary rises dramatically),
14
Men are paid 21% more than women on average
‘ ’
compared to just 44% of women. Indeed, 23% of men have more than 20 years experience compared with only 16% of women.
• A slightly higher proportion of women hold the less senior job roles (21% are finance or business analysts vs.10% of men; and 11% are accountants vs. 4% men).
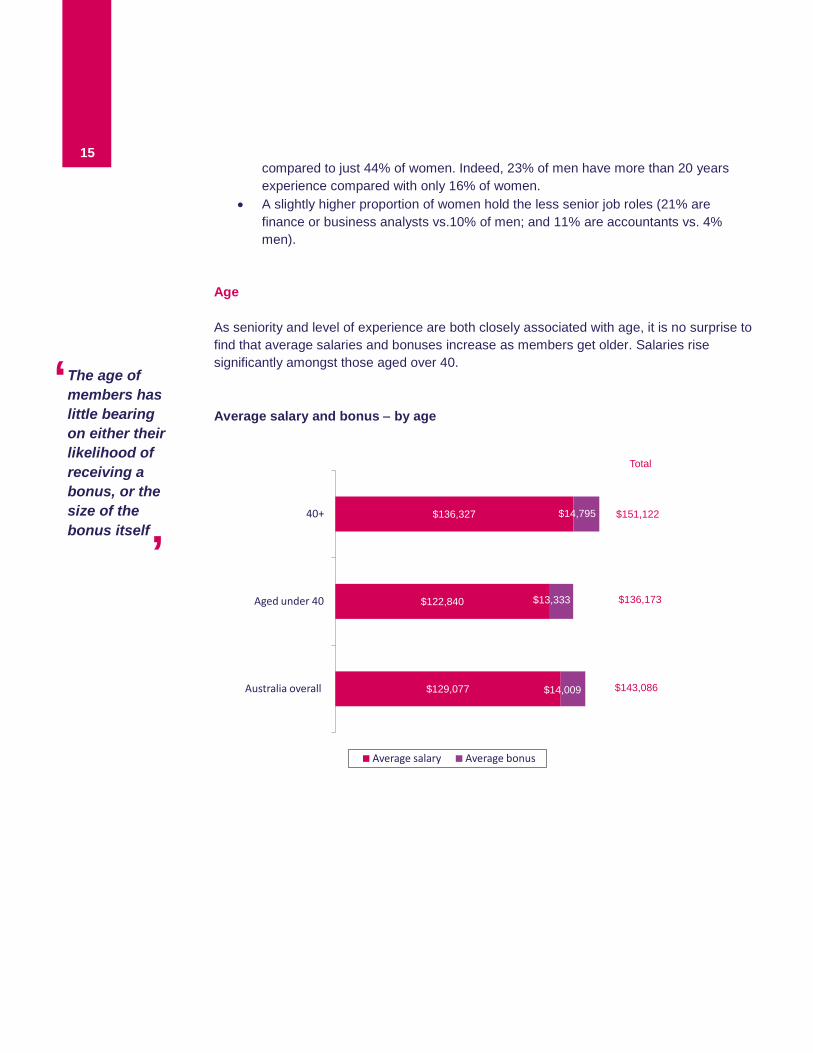
Age As seniority and level of experience are both closely associated with age, it is no surprise to find that average salaries and bonuses increase as members get older. Salaries rise significantly amongst those aged over 40. Average salary and bonus − by age
$129,077
$122,840
$136,327
$14,009
$13,333
$14,795
Australia overall
Aged under 40
40+
Average salary Average bonus
Total
$136,173
$143,086
$151,122
The age of members has little bearing on either their likelihood of receiving a bonus, or the size of the bonus itself
‘
15
’
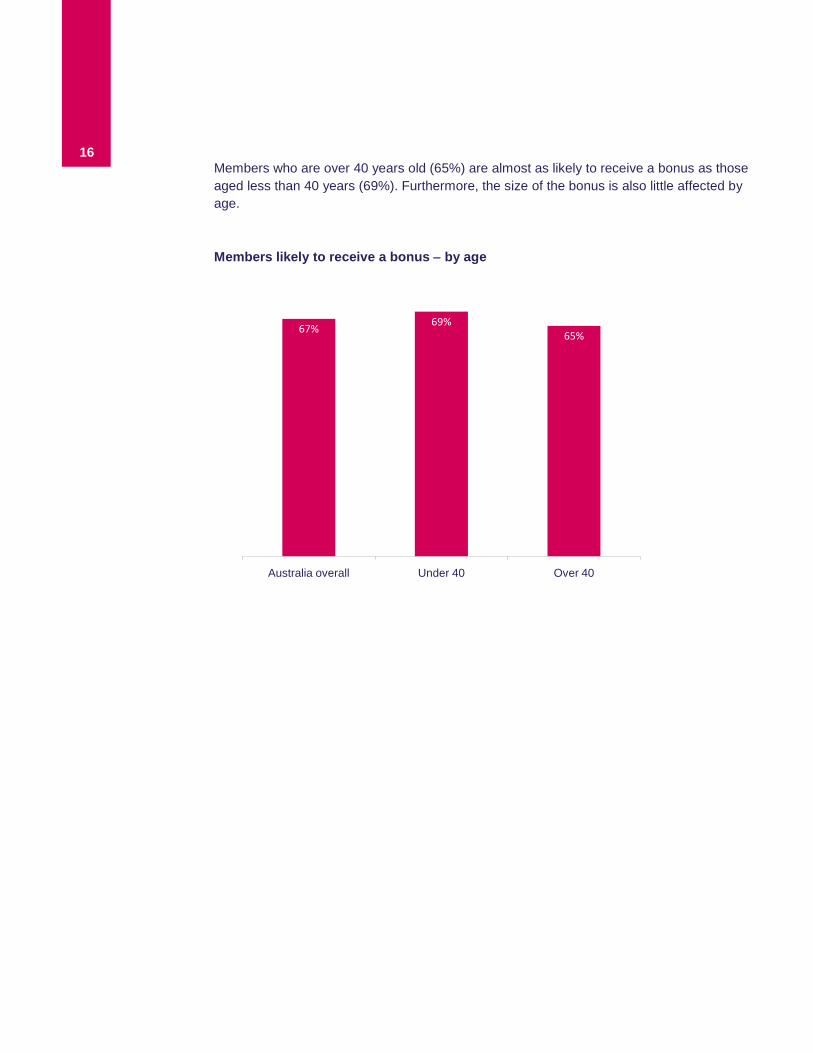
Members who are over 40 years old (65%) are almost as likely to receive a bonus as those aged less than 40 years (69%). Furthermore, the size of the bonus is also little affected by age. Members likely to receive a bonus − by age
67%69%
65%
Australia overall Under 40 Over 40
16

Recruitment and retention Satisfaction with salary and benefits Despite the fact that average salaries and bonuses have risen over the past year, the level of overall satisfaction has fallen slightly. In 2010, overall satisfaction was 74% compared to 80% satisfaction in 2009. Satisfaction with current salary package
2% 3%
18%23%
77% 66%
3% 8%
2009 2010
Extremely satisfiedSatisfiedDissatisfiedVery dissatisfied
17

Satisfaction with benefits has fallen by a small proportion year on year, with 78% satisfied overall in 2010 compared to 82% in 2009. Satisfaction with current benefits
1% 2%
17% 20%
73%71%
9% 7%
2009 2010
Extremely satisfiedSatisfiedDissatisfiedVery dissatisfied
18
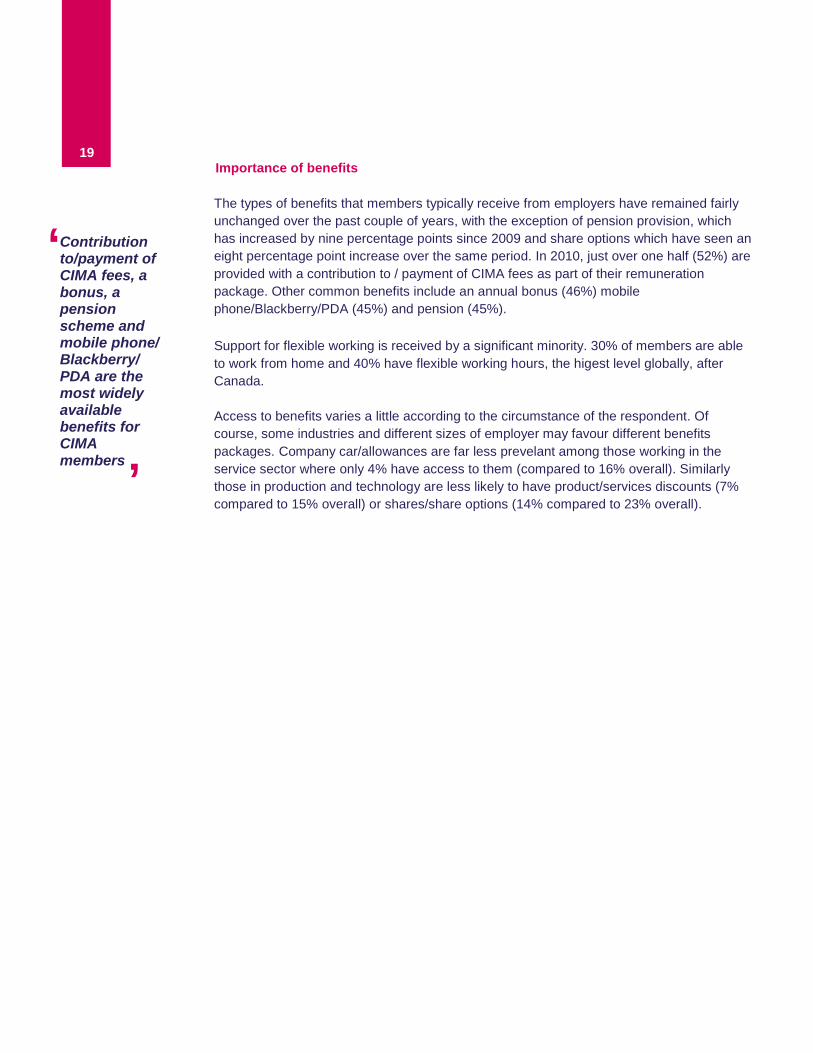
Importance of benefits The types of benefits that members typically receive from employers have remained fairly unchanged over the past couple of years, with the exception of pension provision, which has increased by nine percentage points since 2009 and share options which have seen an eight percentage point increase over the same period. In 2010, just over one half (52%) are provided with a contribution to / payment of CIMA fees as part of their remuneration package. Other common benefits include an annual bonus (46%) mobile phone/Blackberry/PDA (45%) and pension (45%). Support for flexible working is received by a significant minority. 30% of members are able to work from home and 40% have flexible working hours, the higest level globally, after Canada. Access to benefits varies a little according to the circumstance of the respondent. Of course, some industries and different sizes of employer may favour different benefits packages. Company car/allowances are far less prevelant among those working in the service sector where only 4% have access to them (compared to 16% overall). Similarly those in production and technology are less likely to have product/services discounts (7% compared to 15% overall) or shares/share options (14% compared to 23% overall).
Contribution to/payment of CIMA fees, a bonus, a pension scheme and mobile phone/ Blackberry/ PDA are the most widely available benefits for CIMA members
19
‘
’
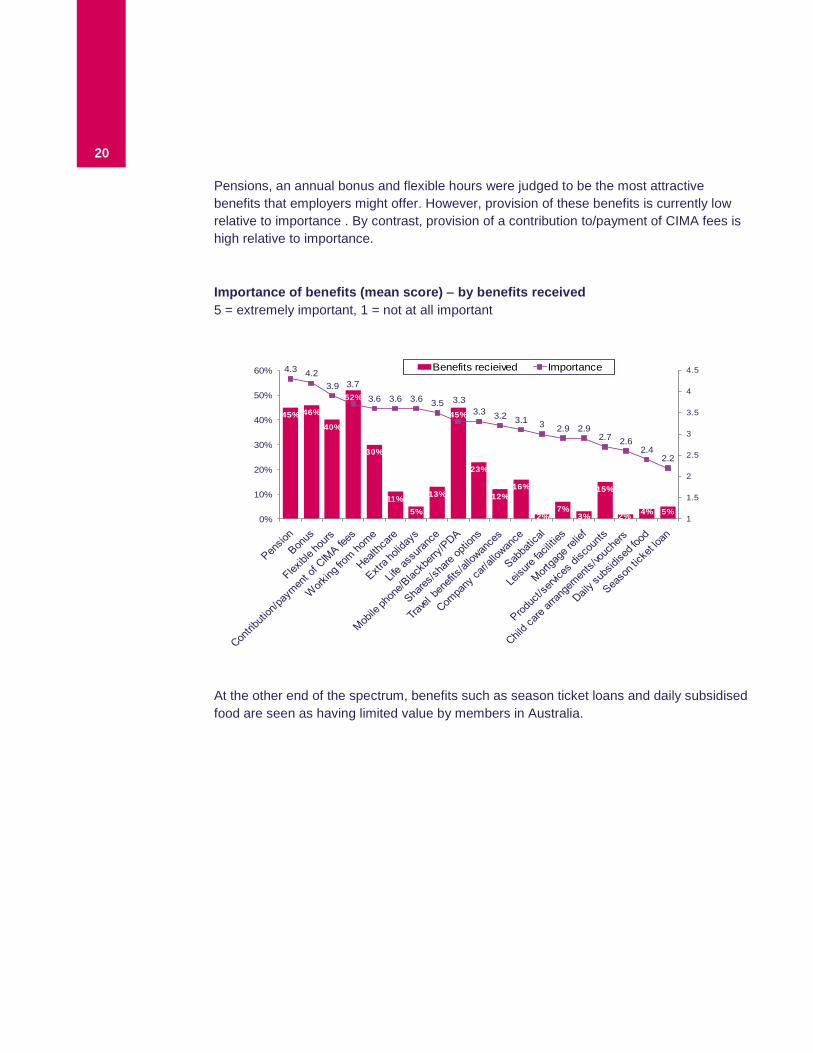
Pensions, an annual bonus and flexible hours were judged to be the most attractive benefits that employers might offer. However, provision of these benefits is currently low relative to importance . By contrast, provision of a contribution to/payment of CIMA fees is high relative to importance. Importance of benefits (mean score) − by benefits received 5 = extremely important, 1 = not at all important
45% 46%
40%
52%
30%
11%5%
13%
45%
23%
12%16%
2%7%
3%
15%
2% 4% 5%
4.3 4.23.9 3.7
3.6 3.6 3.6 3.5 3.33.3 3.2 3.1 3 2.9 2.9
2.7 2.62.4
2.2
1
1.5
2
2.5
3
3.5
4
4.5
0%
10%
20%
30%
40%
50%
60% Benefits recieived Importance
At the other end of the spectrum, benefits such as season ticket loans and daily subsidised food are seen as having limited value by members in Australia.
20

Working hours The typical Australian member works a 45 hour week, which is no different from the average recorded in 2009. 53% of members work between 41 and 50 hours a week, and a significant minority (16%) work longer hours than this (although only 1% work more than 60 hours in a typical week). 26% are working between 35 and 40 hours a week, which leaves only a small minority working less than 35 hours on average (5%). Typical working hours for Australian members
Under 35 hours, 5%
35-40 hours, 26%
41-50 hours, 53%
51-60 hours, 15%
More than 60 hours, 1%
Most members (63%) do not believe that their working hours are likely to change significantly over the coming year. Only 7% believe their hours are likely to decrease at all, which leaves 31% who feel their hours will probably increase.
21
CIMA members work an average of 45 hours per week
‘ ’

A pattern can be seen when considering the relationship between hours worked and the salary earned. Those working between 40 to 50 hours per week earn an average base salary of AUS$130,910 per annum, whereas those working between 51 to 60 hours earn an average base salary of AUS$154,930 per annum. It would seem, that increased working hours are most closely associated with a combination of increased responsibilities on the one hand and understaffing on the other. Reasons for increasing working hours
65%
46%
39%
23%19%
16%
Taken on more responsibility/more
pressure
Understaffing/lack of resource
Company growth Company culture My role has changed
Current financial climate
22
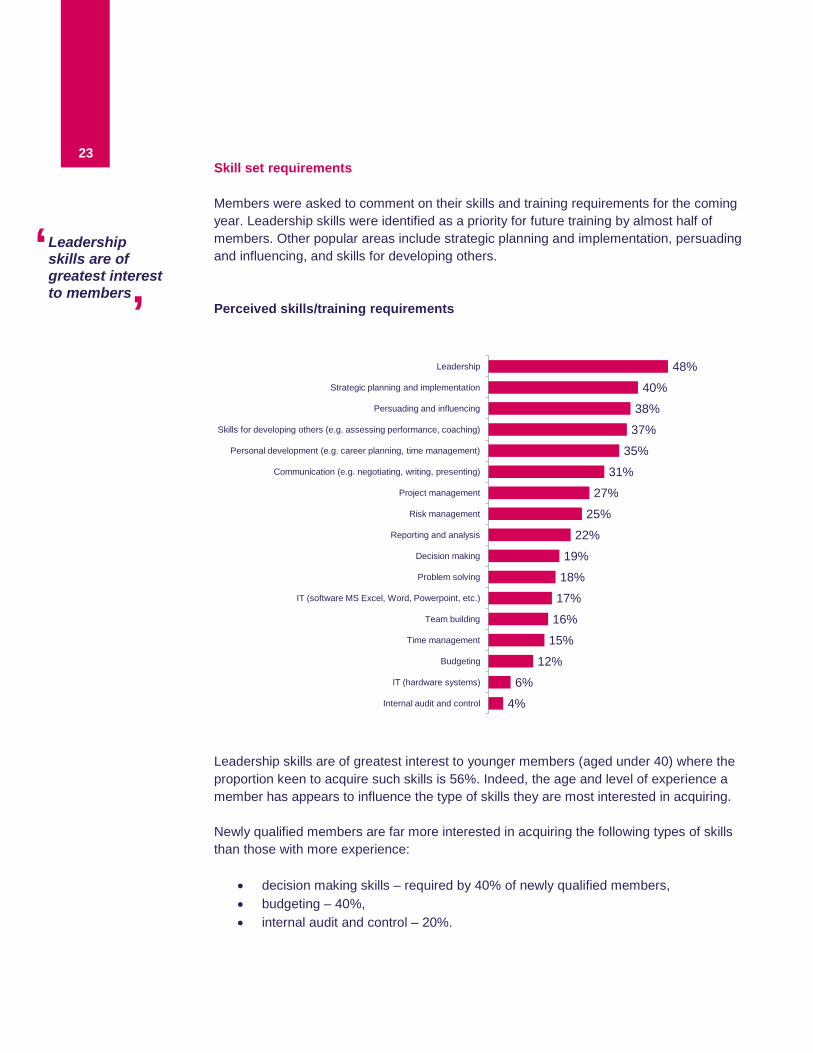
Skill set requirements Members were asked to comment on their skills and training requirements for the coming year. Leadership skills were identified as a priority for future training by almost half of members. Other popular areas include strategic planning and implementation, persuading and influencing, and skills for developing others. Perceived skills/training requirements
4%
6%
12%
15%
16%
17%
18%
19%
22%
25%
27%
31%
35%
37%
38%
40%
48%
Internal audit and control
IT (hardware systems)
Budgeting
Time management
Team building
IT (software MS Excel, Word, Powerpoint, etc.)
Problem solving
Decision making
Reporting and analysis
Risk management
Project management
Communication (e.g. negotiating, writing, presenting)
Personal development (e.g. career planning, time management)
Skills for developing others (e.g. assessing performance, coaching)
Persuading and influencing
Strategic planning and implementation
Leadership
Leadership skills are of greatest interest to younger members (aged under 40) where the proportion keen to acquire such skills is 56%. Indeed, the age and level of experience a member has appears to influence the type of skills they are most interested in acquiring. Newly qualified members are far more interested in acquiring the following types of skills than those with more experience:
• decision making skills – required by 40% of newly qualified members, • budgeting – 40%, • internal audit and control – 20%.
Leadership skills are of greatest interest to members
23
‘ ’
In general, members with considerable work experience are much less likely than those with less experience to feel that they need anywhere near as much skills training. However, a small number of specific skills remain attractive to members with more experience, these are:
• Persuading and influencing – still remains of interest to 39% of members with more than 20 years experience, making it the most attractive area of training for members in this group.
• Leadership – of interest to 33% of members with more than 20 years experience, making it the second most attractive area of training for members in this group.
• Skills for developing others (e.g. assessing performance, coaching) − of interest to 30% of members with more than 20 years experience, making it the third most attractive area of training for members in this group.
It is also worth noting that training in strategic planning and implementation remains equally high across all ages/levels of experience and the highest level of interest is among members with 4-5 years and 10-19 years of experience. In addition, organisation size can occasionally have an influence on the types of skills people feel they require. Members working in smaller companies (of less than 250 staff) feel that certain skills would benefit them, in contrast to their peers working in larger businesses:
• 32% of members in smaller companies are interested in reporting and analysis skills, compared to just 17% in large companies.
• 37% of members in companies with less than 250 staff are interested in project management, compared to 23% of members in larger businesses.
• 36% of members in companies with less than 250 staff are interested in risk management, compared to 20% of members in larger businesses.
• 28% of members in smaller companies are interested in IT skills (MS Excel, Word, Powerpoint, etc.), compared to just 12% in large companies.
24
Persuading and influencing skills are of greatest interest to more experienced members
‘
’

Geographical mobility Extent of movement There has been a limited change since 2009 in the proportion of people who are planning to look for a new job. 54% are thinking about a move, similar to last year. However, there is some evidence to suggest that a higher proportion is now more serious about moving. The 2009 survey showed that 17%, at that time, were looking to move within six months and this proportion has increased to 24% in 2010. 64% of younger members (aged under 40) are likely to be considering changing jobs. Plans to move job – 2010 vs. 2009
48% 46%
35%30%
17%24%
2009 2010
Within six monthsWithin seven months - two yearsNo plans
There are a number of reasons why members may have become slightly more likely to look to change jobs in the short term:
• The tough economic conditions have increased the risk of redundancy in certain areas. This would no doubt play a role in prompting people to consider looking for alternative employment.
• 17% anticipate a pay freeze over the coming year, again possibly prompting a desired move.
25
54% of CIMA members are considering changing jobs
‘ ’
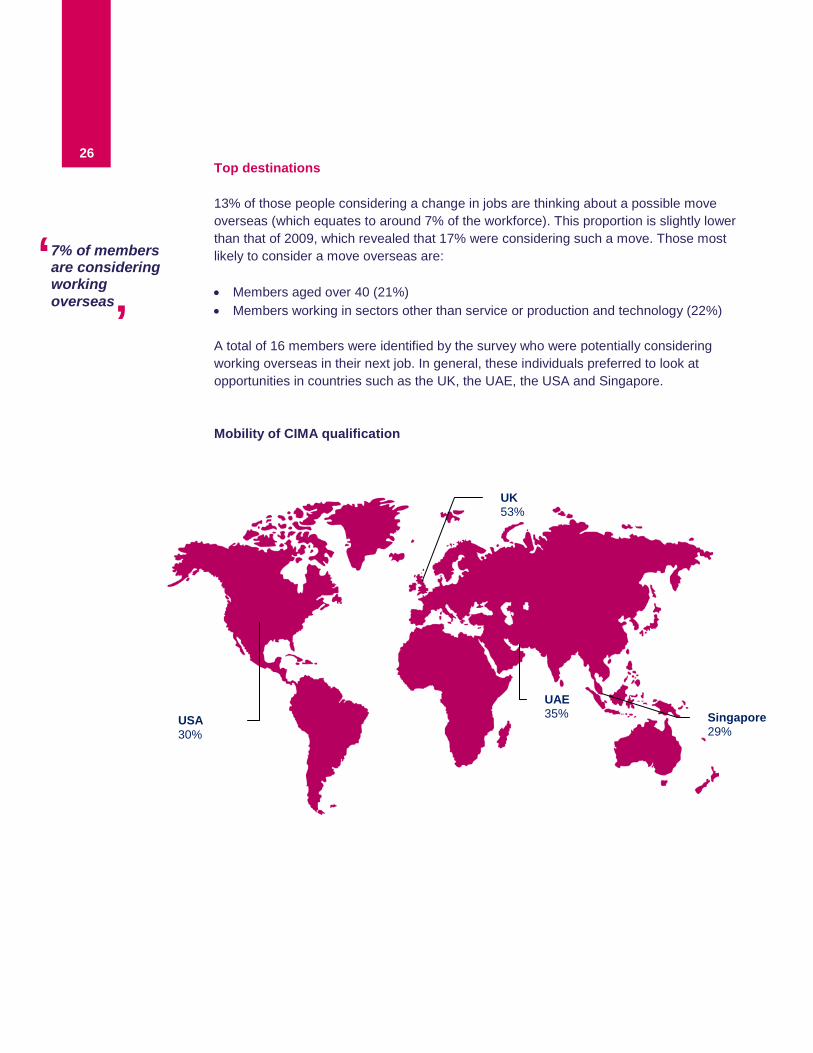
Top destinations 13% of those people considering a change in jobs are thinking about a possible move overseas (which equates to around 7% of the workforce). This proportion is slightly lower than that of 2009, which revealed that 17% were considering such a move. Those most likely to consider a move overseas are: • Members aged over 40 (21%) • Members working in sectors other than service or production and technology (22%) A total of 16 members were identified by the survey who were potentially considering working overseas in their next job. In general, these individuals preferred to look at opportunities in countries such as the UK, the UAE, the USA and Singapore. Mobility of CIMA qualification
7% of members are considering working overseas
UK 53%
USA 30%
UAE 35%
Singapore 29%
26
‘ ’

Those members considering working overseas were asked to say why they wanted to relocate. The most popular reason was friends and family followed by improved salary, a new career opportunity and experiencing different cultures. Motives for wishing to work overseas
12%
6%
6%
6%
18%
18%
23%
35%
35%
35%
41%
Other, please specify below
Work promotion
Take time out/travel
Improved employment conditions
Better employment opportunities
Improved quality of life
Internal company transfer
Experience a different culture
New career opportunity
Improved salary
Friends and family
Future The tough economic conditions appear to be manifesting most strongly in terms of pay freezes. As much as 17% of members felt that they might experience a pay freeze during the coming year and members who are not in the finance function are the most likely to be concerned.
More positively, only 3% of members are worried that they might face redundancy during the coming year.
27
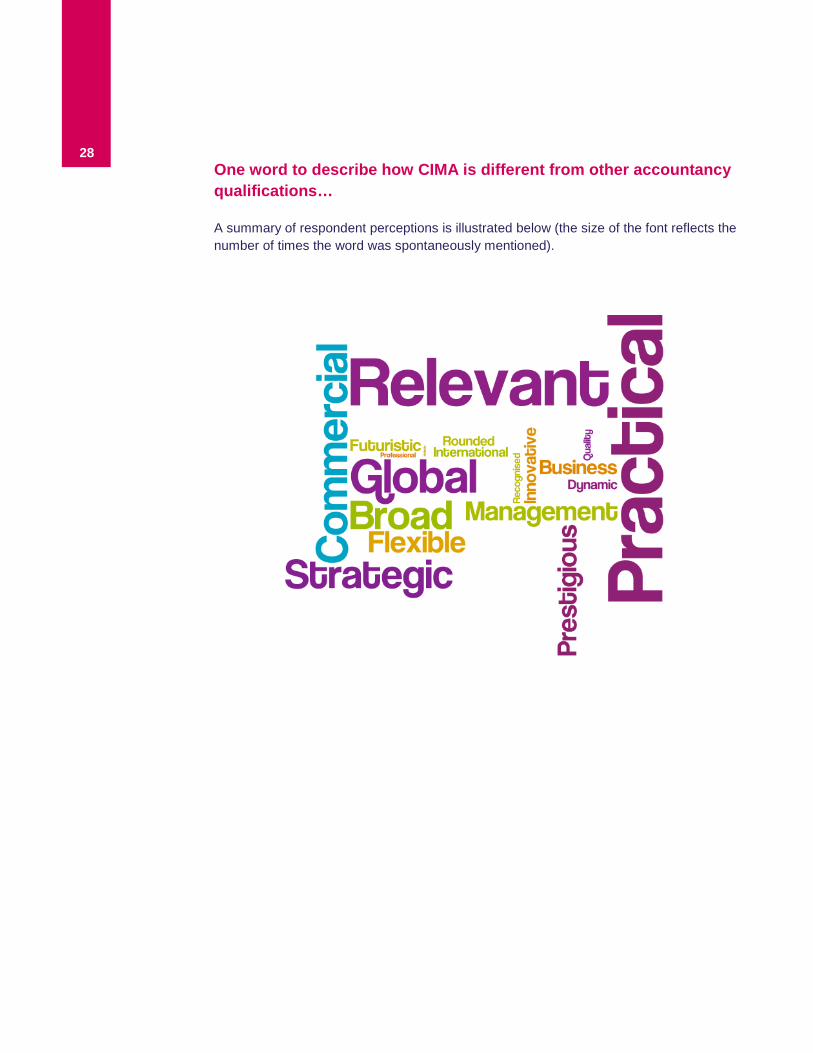
One word to describe how CIMA is different from other accountancy qualifications… A summary of respondent perceptions is illustrated below (the size of the font reflects the number of times the word was spontaneously mentioned).
28

Australian salary information This section provides a breakdown of Australian specific salary information by key indicators (where the sample base is large enough to provide reliable information). All salary information was collected in April 2010 and is presented in local currency.
Australia
Base:221 Salary ($ per annum)
Bonus ($ per annum)
Total package ($ per annum)
Total AUS$129,077 AUS$14,009 AUS$143,086 Experience 20 years + 143,522 16,993 160,515 10-19 years 137,435 15,280 152,715 6-9 years 122,437 11,260 133,697 4-5 years 111,000 13,091 124,091 1-3 years 110,200 11,640 121,840 Newly qualified 111,000 6,175 117,175 Age Over 40 136,327 14,795 151,122 Under 40 122,840 13,333 136,173 Size 250+ staff 134,781 16,486 151,267 Under 250 staff 117,361 8,922 126,283 Sector Production and technology 135,629 17,202 152,831 Service 126,810 14,525 141,335 Other industries 127,043 11,818 138,861 Region Melbourne 120,127 10,956 131,083 Perth 131,624 10,300 141,924 Sidney 135,543 17,680 153,223 Brisbane 133,781 18,173 151,954
29

Technical information Data collection for the CIMA Australia members’ salary survey 2010 was carried out online by CIMA during the period 19 March to 19 April 2010. The data was subsequently rim weighted (by Redshift Research) by CIMA member level to ensure the profile of the survey accurately represents all CIMA members working in business. 17,489 CIMA members globally (excluding retired members) were selected and invited to participate (UK, Ireland, Australia, Malaysia, Sri Lanka, South Africa, USA, Canada, Singapore, New Zealand, UAE, China, India and Hong Kong) – a total of 1,959 completed the study globally (11% response rate), with 221 respondents from Australia. Basic responses from Australia were as follows:
Respondent type Proportion of Sample
Aged under 31 7%
31-35 27%
36-40 20%
41-50 31%
51 and over 15%
Male 74%
Female 26%
30
Further information
For further information on technical matters relating to this survey, contact [email protected] For further country specific analysis and reports, visit CIMA MY JOBS at http://myjobs.cimaglobal.com Both the Chartered Institute of Management Accountants and Redshift Research are Market Research Society Company Partners. The organisations abide by the Market Research Society’s Code of Conduct and the Data Protection Act.
31

Global contacts
CIMA UK – Head Office 26 Chapter Street London SW1P 4NP United Kingdom T. +44 (0)20 8849 2287 F. +44 (0)20 8849 2450 E. [email protected] www.cimaglobal.com CIMA Australia Suite 1305 109 Pitt Street Sydney NSW 2000 Australia T. +61 (0)2 9376 9900 F. +61 (0)2 9376 9905 E. [email protected] www.cimaglobal.com/australia CIMA Botswana Plot 50374, Block 3, 1st Floor Southern Wing Fairgrounds Financial Centre Gaborone, Botswana Postal address: PO Box 403475 Gaborone, Botswana Telefax. +267 395 2362 F. +267 395 2362/397 2982 E. [email protected] www.cimaglobal.com/botswana CIMA China Unit 1508A AZIA Center, 15th floor 1233 Lujiazui Ring Road Pudong Shanghai 200120 P.R.China T. +86 400 820 4080 +86 (0)21 5528 5119 F. +86 (0)21 5228 5120 E. [email protected] www.cimaglobal.com/china www.cncima.com CIMA Hong Kong Suites 1414 – 1415 14th Floor Jardine House Central, Hong Kong T. +852 2511 2003 F. +852 2507 4701 E. [email protected] www.cimahongkong.com
CIMA India Unit 1-A-1, 3rd Floor Vibgyor Towers C-62, G Block, Bandra Kurla Complex, Bandra (East), Mumbai - 400 051 T. +91 (0)22 4237 0100 F. +91 (0)22 4237 0109 E. [email protected] www.cimaglobal.com/india CIMA Ireland 45-47 Pembroke Road Ballsbridge, Dublin 4 T. +353 (0)1 643 0400 F. +353 (0)1 643 0401 E. [email protected] www.cima.ie CIMA Malaysia Lots 1.03b and 1.05, Level 1 KPMG TOWER 8 First Avenue, Bandar Utama 47800 Petaling Jaya Selangor Darul Ehsan Malaysia T. +60 (0)3 7723 0230 F. +60 (0)3 7723 0231 E. [email protected] www.cimaglobal.com/malaysia CIMA Middle East Office E01, 1st Foor, Block 3 PO Box 502221 Dubai Knowledge Village Al Sofouh Road Dubai, UAE T. +971 4434 7370 F. +971 4434 1998 E. [email protected] www.cimaglobal.com/middleeast CIMA Pakistan No. 201, 2nd floor Business Arcade Plot No. 27 A, Block 6, P.E.C.H.S. Shahra-e-Faisal Karachi, Pakistan T. +92 21 3432 2387/88/89 F. +92 21 3432 2390 E. [email protected] www.cimaglobal.com/pakistan
CIMA Singapore 51 Goldhill Plaza, #08-02 Singapore 308900 T. +65 6535 6822 F. +65 6534 3992 E. [email protected] www.cimaglobal.com/singapore CIMA South Africa 1st Floor, 198 Oxford Road Illovo, Johannesburg South Africa Postal address: PO Box 745, Northlands 2116, South Africa T. +27 (0)11 788 8723/0861 CIMA SA F. +27 (0)11 788 8724 E. [email protected] www.cimaglobal.com/southafrica CIMA Sri Lanka 356 Elvitigala Mawatha Colombo 5 Sri Lanka T. +94 (0)11 250 3880 F. +94 (0)11 250 3881 E. [email protected] www.cimaglobal.com/srilanka CIMA Zambia 6053, Sibweni Road Northmead, Lusaka Zambia Postal address: PO Box 30640, Lusaka, Zambia T. +260 21 1 290 219/291 708 F. +260 21 1 290 548 E. [email protected] www.cimaglobal.com/zambia CIMA Zimbabwe 6th Floor, Michael House 62 Nelson Mandela Avenue, Harare Zimbabwe Postal address: PO Box 3831, Harare, Zimbabwe Telefax. +263 (0) 4 708600/702617 F. +263 (0) 4 708600/702617 E. [email protected] www.cimaglobal.com/zimbabwe CIMA’s global offices may change during the year, so please visit the global web links for the most up-to-date contact details. For a full list of global contacts, please visit www.cimaglobal.com/globalcontacts
32